Embed Size (px)
Citation preview
Search Analysis for the Location of the AF447 Underwater Wreckage
Report to
Bureau d’Enquêtes et d’Analyses pour la sécurité de l’aviation civile
by
Lawrence D. Stone Colleen Keller
Thomas L. Kratzke. Johan Strumpfer
20 January 2011
1818 Library Street, Suite 600 Reston, Virginia 20190 703 787 8700 www.metsci.com
Mathematics Physics Computer Science

Table of Contents GLOSSARY ................................................................................................................................................. 1 1 INTRODUCTION ................................................................................................................................ 2 2 APPROACH ......................................................................................................................................... 3 3 PRIOR PROBABILITY DISTRIBUTION FOR IMPACT LOCATION....................................... 5
3.1 FLIGHT DYNAMICS PRIOR .............................................................................................................. 5 3.2 REVERSE DRIFT PRIOR ................................................................................................................... 6 3.3 PRIOR PROBABILITY DISTRIBUTION BEFORE SURFACE SEARCH ................................................... 9
4 POSTERIOR DISTRIBUTION GIVEN UNSUCCESSFUL SEARCH ........................................ 11 4.1 ACCOUNTING FOR UNSUCCESSFUL SEARCH ................................................................................ 11 4.2 AIRCRAFT, SHIP, AND SATELLITE SURFACE SEARCHES .............................................................. 12 4.3 PHASE I SEARCHES ....................................................................................................................... 18 4.4 PHASE II SEARCHES ..................................................................................................................... 24 4.5 PHASE III SEARCHES .................................................................................................................... 27 4.6 POSTERIOR ASSUMING THE PINGERS FAILED .............................................................................. 34
5 CONCLUSIONS AND RECOMMENDATIONS ........................................................................... 36 6 ACKNOWLEDGEMENTS ............................................................................................................... 36 7 APPENDIX A: CRASH DISTANCES ............................................................................................. 37 8 APPENDIX B: ULB DATA ............................................................................................................... 39 9 REFERENCES ................................................................................................................................... 40
1
GLOSSARY
ACARS Aircraft Communications Addressing and Reporting System AUV Autonomous Underwater Vehicle BEA Bureau d'Enquêtes et d'Analyses pour la sécurité de l'aviation civile CDP Cumulative Detection Probability CVR Cockpit Voice Recorder CWL Crosswind component of Leeway DWL Downwind component of Leeway FD Flight Dynamics FDR Flight Data Recorder GPS Global Positioning System IFREMER Institut français de recherche pour l'exploitation de la mer INS Inertial Navigation System LKP Last Known Position NM Nautical Mile PDF Probability Distribution Function PIW Person floating in the Water POD Probability of Detection PQP Pourquoi Pas? Oceanographic Research Vessel RD Reverse Drift ROV Remotely Operated Vehicule SAROPS Search and Rescue Optimal Planning System SAR Search and Rescue
Sonar Acoustique Remorqué (IFREMER SSS) Synthetic Aperture Rescue
SFTP Secured File Transfer Protocol SLDMB Self Locating Data Marker Buoy SSS Side Scan Sonar TPL Towed Pinger Locator ULB Underwater Locator Beacon USCG United States Coast Guard USN Unites States Navy WHOI Woods Hole Oceanographic Institution WID Waitt Institute for Discovery
2
1 INTRODUCTION
Air France Flight 447, an Airbus 330-200 with 228 passengers and crew, disappeared over the South Atlantic during a night flight from Rio de Janeiro Brazil to Paris France on 1 June 2009. An international air and surface search effort recovered the first wreckage on June 6th five and one half days after the accident. More than 1000 pieces of the aircraft and 50 bodies were recovered and their positions logged. A French submarine as well as French and American research teams searched acoustically for the Underwater Locator Beacons (ULBs, or “pingers”) on each of the two flight recorder’s “black boxes” for 30 days from 10 June to 10 July 2009 with no results.
In early July of 2009 the French Bureau d’Enquêtes et d’Analyses pour la sécurité de l’aviation civile, abbreviated as BEA, contacted Metron for assistance in the preparation of Phase II of the search, utilizing side-looking sonar to scan the ocean bottom for the wreckage field. Metron’s previous work in search applications, detailed in references [1,2,3], included the search for the U.S. nuclear submarine Scorpion, the SS Central America, and the overland search for Steve Fossett’s crash site. In addition, Metron played a key role in the development of the US Coast Guard’s SAROPS software, which has been successfully employed to plan and execute searches for ships and personnel lost at sea [4].
The Phase II side looking sonar search performed by the Pourquoi Pas? from 27 July to 17 August 2009 proved unsuccessful. The Phase III search, which took place from 2 April to 24 May 2010, consisted of additional side looking sonar searches using REMUS AUVs operated by the Woods Hole Oceanographic Institute (WHOI) and using the ORION towed side-looking sonar operated by the US Navy1. The search also used a Triton ROV2. It was also unsuccessful.
In July of 2010, Metron was tasked by the BEA to review the search and to produce an updated probability map for the location of the underwater wreckage.
To accomplish this Metron reviewed and modified the previous prior distribution developed in 2009. The new prior is based on studies by the BEA and the Russian Interstate Aviation Group (MAK) and a new reverse drift simulation using updated current estimates from the Drift Committee.
Metron analyzed the effectiveness of Phase III side looking sonar searches performed by the WHOI REMUS and the US Navy ORION sensors and computed an updated posterior probability distribution for the location of the wreckage using the new prior distribution and incorporating the unsuccessful phase I and II searches performed during 2009, as well as the unsuccessful searches performed by REMUS and ORION in 2010 and including the photo and ROV searches. Metron also accounted for the unsuccessful aerial and ship searches performed between 1 June and 6 June 2009.
This report describes the results of this analysis. This work was performed under Service Contract for Assistance in the Search for Wreckage in a Marine Environment between Metron and the BEA, 9 July 2010.
1 The US Navy worked with Phoenix International to perform the search. 2 The Triton ROV was provided by Seabed AS (Norway).
3
2 APPROACH
Metron’s approach to this search planning problem is rooted in classical Bayesian inference, which allows organization of available data with associated uncertainties and computation of the Probability Distribution Function (PDF) for target location given these data. In following this approach, the first step was to gather the available information about the location of the impact site of the aircraft. This information was sometimes contradictory and filled with ambiguities and uncertainties. Using a Bayesian approach we organized this material into consistent scenarios, quantified the uncertainties with probability distributions, weighted the relative likelihood of each scenario, and performed a simulation to produce a prior PDF for the location of the wreck.
Next we estimated the effect of the past unsuccessful search efforts. These efforts included air and surface searches for floating debris and underwater searches in Phases I, II, and III. The goal of the Phase I search was to detect signals from the flight recorders’ ULBs. The Phase II and III searches involved the use of side-looking sonar and cameras to try to detect the underwater debris field of the wreck of the AF 447 flight. For each search, we enlisted sensor experts and knowledge of the sea state, visibility, underwater geography, and water column conditions to estimate sensor performance. The results of the search assessment, combined mathematically with the prior PDF of the impact site, yielded the posterior PDF for the impact location given the unsuccessful search efforts. Posterior PDFs after each phase of the search are presented in Section 4 along with the estimated effectiveness of the search in terms of Cumulative Detection Probability (CDP).
The steps followed in this analysis provide a systematic approach to estimating the location of the impact, planning the search, and estimating its effectiveness. The posterior distribution given in Section 4 provides guidance for the location and amount of additional search effort. Estimating the effectiveness of the search in terms of CDP reveals how thorough the search has been to date and provides an indication of the amount of additional effort that may be required to complete the search.
Section 3 of this report describes the method for producing the prior (to the surface search) PDF for impact location. This distribution is composed of two components. The first component, called the Flight Dynamics (FD) prior, is based on flight dynamics considerations and information from past crashes. The second component of this prior is derived from the information provided by the detection and recovery of floating debris from the wreckage of the aircraft on 6 June – 10 June. This information was used to produce a Reverse Drift (RD) prior. The FD and RD priors were blended to produce a surface search prior. In section 4, the effect of the unsuccessful surface searches during 1 June – 6 June 2009 conducted by aircraft and ships was used to compute the surface search posterior. This posterior became the prior for the acoustic/side-scan sonar searches in Phases I, II, and III. The remainder of section 4 computes the posterior PDF and estimates CDP at the conclusion of each underwater search phase.
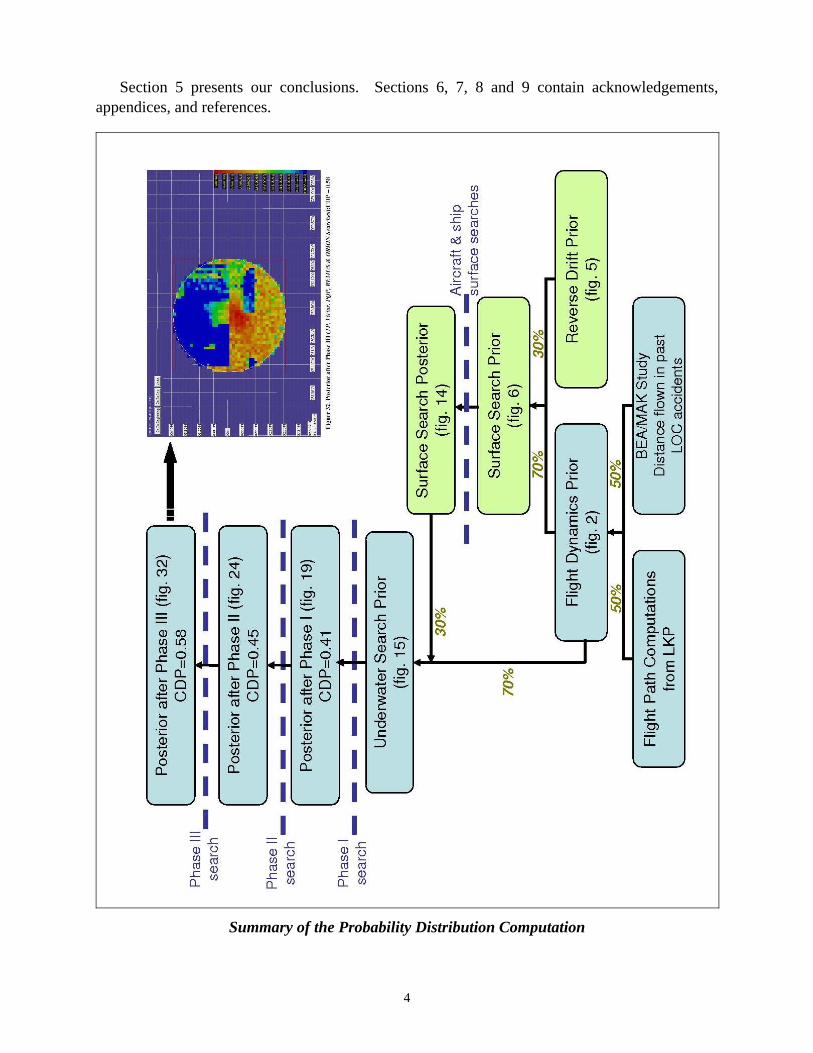
The following chart summarizes the various steps of this approach and also references the other figures that are used throughout this report. The green blocks on the right hand side are related to the SAROPS environmental module that simulates winds and currents in the search zone. The other blocks stem from flight dynamics computations and a study undertaken on a sample of loss of control accidents during the cruise phase of flight.
As an excursion, we compute the posterior PDF assuming the ULB “pingers” were both damaged or destroyed on impact and therefore not functioning during the Phase I search.
4
Section 5 presents our conclusions. Sections 6, 7, 8 and 9 contain acknowledgements, appendices, and references.
Summary of the Probability Distribution Computation
5
3 PRIOR PROBABILITY DISTRIBUTION FOR IMPACT LOCATION
In this section we compute the prior (before surface search) Probability Distribution Function (PDF) for impact location. This PDF has two components, a flight dynamics and a reverse drift component.
3.1 FLIGHT DYNAMICS PRIOR
This prior is the mixture of two distributions. The first is based on purely flight dynamics considerations about the maximum distance the aircraft could have feasibly traveled from the time of its last reported position (last known position (LKP)) to the time when a scheduled response from the Aircraft Communications Addressing and Reporting System (ACARS) was not received. ACARS is a maintenance and logistics reporting system that sends out position reports based on GPS roughly every 10 minutes. The impact time was estimated based on the time of the last ACARS message received and the expectation (unfulfilled) of a subsequent message in the next 60 seconds. The end of the flight occurred between 2 h 14 min 26 sec and 2 h 15 min 14 sec - see page 39 of [14]. An analysis was performed by the BEA and reported in reference [6] which produced a uniform distribution over the disk of radius 40 NM centered at the LKP. This is the first distribution.
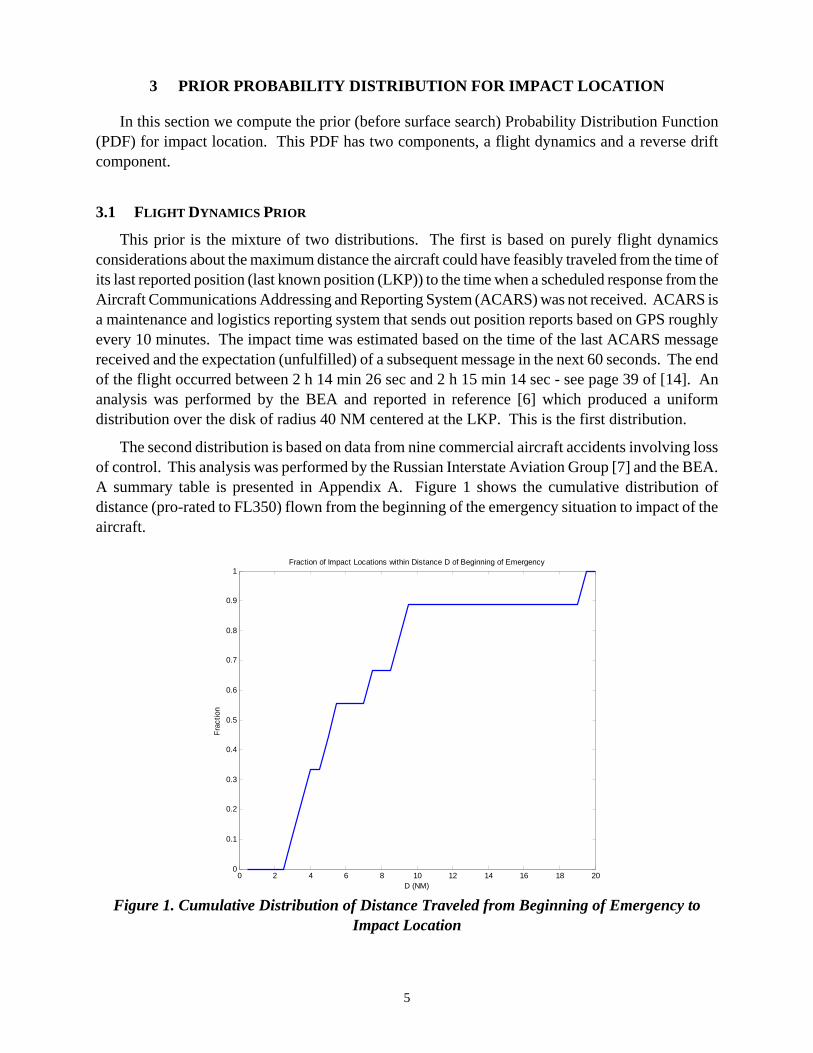
The second distribution is based on data from nine commercial aircraft accidents involving loss of control. This analysis was performed by the Russian Interstate Aviation Group [7] and the BEA. A summary table is presented in Appendix A. Figure 1 shows the cumulative distribution of distance (pro-rated to FL350) flown from the beginning of the emergency situation to impact of the aircraft.
0 2 4 6 8 10 12 14 16 18 200
0.1
0.2
0.3
0.4
0.5
0.6
0.7
0.8
0.9
1
D (NM)
Frac
tion
Fraction of Impact Locations within Distance D of Beginning of Emergency
Figure 1. Cumulative Distribution of Distance Traveled from Beginning of Emergency to
Impact Location
6
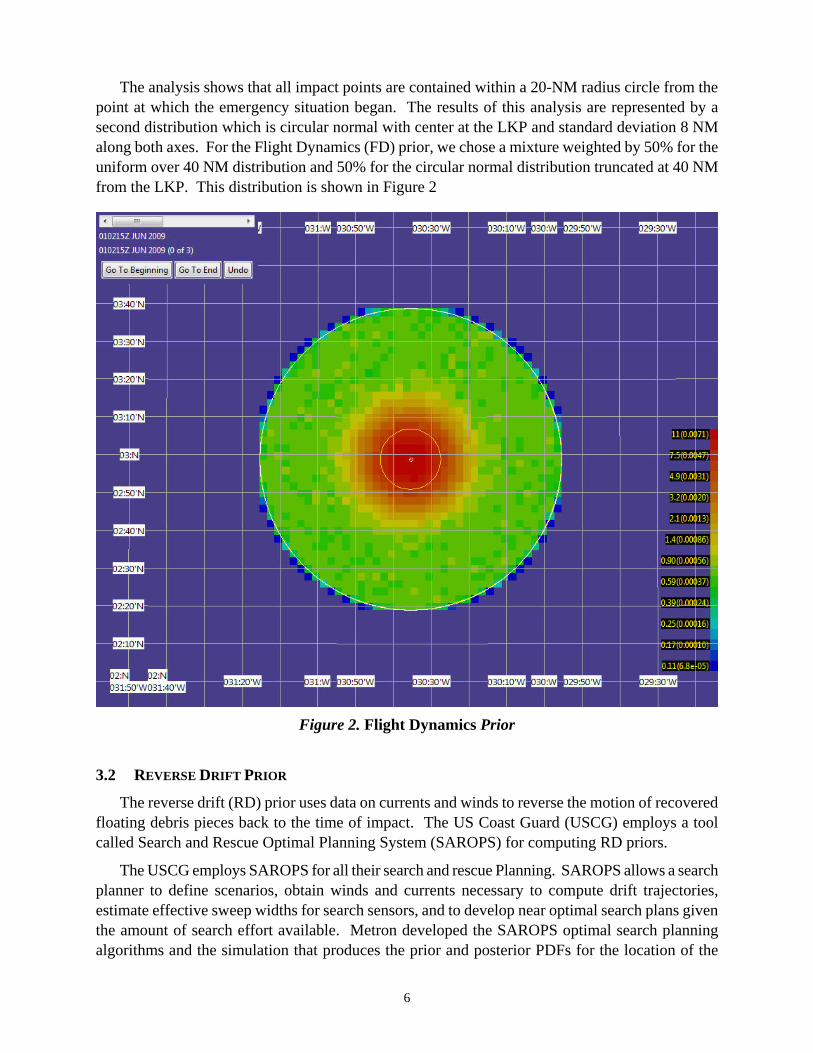
The analysis shows that all impact points are contained within a 20-NM radius circle from the point at which the emergency situation began. The results of this analysis are represented by a second distribution which is circular normal with center at the LKP and standard deviation 8 NM along both axes. For the Flight Dynamics (FD) prior, we chose a mixture weighted by 50% for the uniform over 40 NM distribution and 50% for the circular normal distribution truncated at 40 NM from the LKP. This distribution is shown in Figure 2
Figure 2. Flight Dynamics Prior
3.2 REVERSE DRIFT PRIOR
The reverse drift (RD) prior uses data on currents and winds to reverse the motion of recovered floating debris pieces back to the time of impact. The US Coast Guard (USCG) employs a tool called Search and Rescue Optimal Planning System (SAROPS) for computing RD priors.
The USCG employs SAROPS for all their search and rescue Planning. SAROPS allows a search planner to define scenarios, obtain winds and currents necessary to compute drift trajectories, estimate effective sweep widths for search sensors, and to develop near optimal search plans given the amount of search effort available. Metron developed the SAROPS optimal search planning algorithms and the simulation that produces the prior and posterior PDFs for the location of the
7
search object. When SAROPS is used, the search objects are usually moving, e.g., drifting, which complicates the search planning and computation of the posterior PDFs.
In order to compute an RD scenario, one must have an estimate of the surface currents in the area of the crash during 1 – 10 June 2009, when debris was drifting. The BEA commissioned a group of oceanographic experts to review the data available for estimating the currents that were present during this time in the vicinity of the crash. The results of this effort are reported in the Drift Group Report [8]. Because the area is near the equator and in the middle of the Atlantic, the currents are complex and difficult to estimate. In addition the remote nature of the crash site means that there were few meteorological measurements to provide a basis for current estimates. Because of the complexity of the currents and the lack of data, there is substantial uncertainty to these estimates. In order to incorporate the reverse drift information into the probability distribution for the wreckage, Metron used the ANALYSE_75KM_LPO current estimates to compute a reverse drift prior. These current estimates were produced as a result of the work of the Drift Group. However, we have given the results based on these estimates a low weight in producing the prior and posterior distributions reported here because of the great uncertainty associated with the estimates.
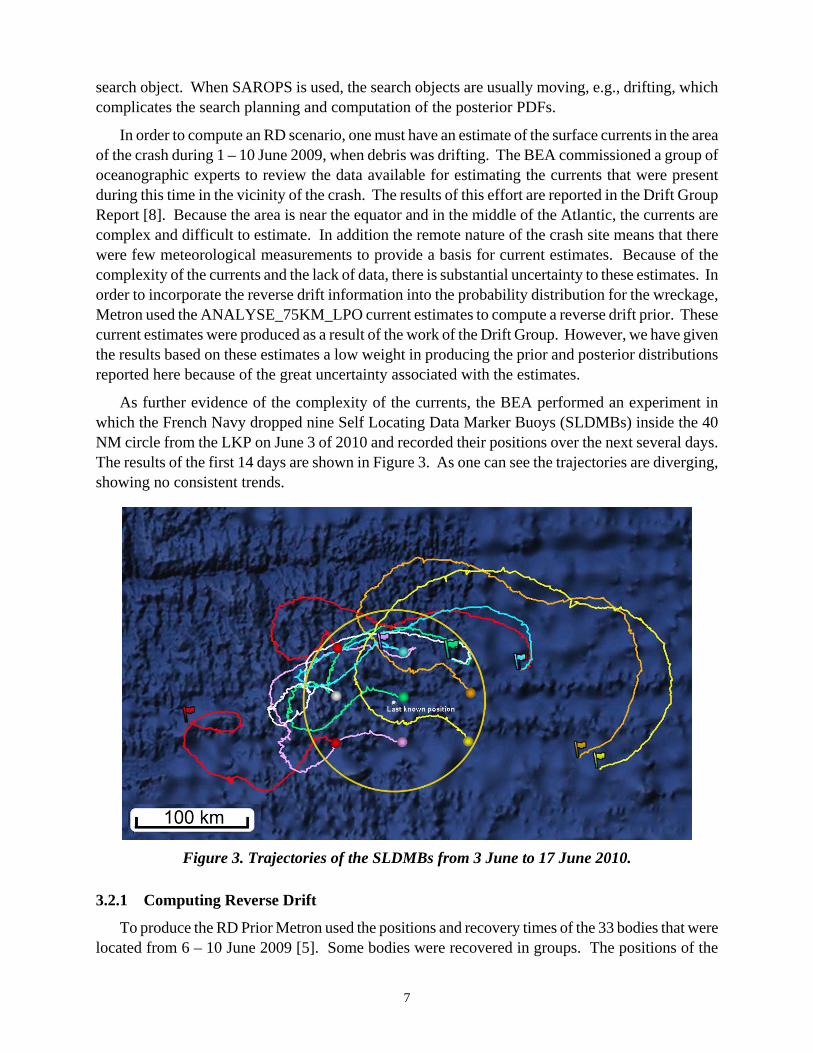
As further evidence of the complexity of the currents, the BEA performed an experiment in which the French Navy dropped nine Self Locating Data Marker Buoys (SLDMBs) inside the 40 NM circle from the LKP on June 3 of 2010 and recorded their positions over the next several days. The results of the first 14 days are shown in Figure 3. As one can see the trajectories are diverging, showing no consistent trends.
Figure 3. Trajectories of the SLDMBs from 3 June to 17 June 2010.
3.2.1 Computing Reverse Drift
To produce the RD Prior Metron used the positions and recovery times of the 33 bodies that were located from 6 – 10 June 2009 [5]. Some bodies were recovered in groups. The positions of the
8
bodies or groups of bodies were drifted back in time using the ANALYSE_75KM_LPO current estimates. We did not apply reverse drift to pieces of debris that were recovered during this time because we do not have good models for the effect of leeway on this type of debris.
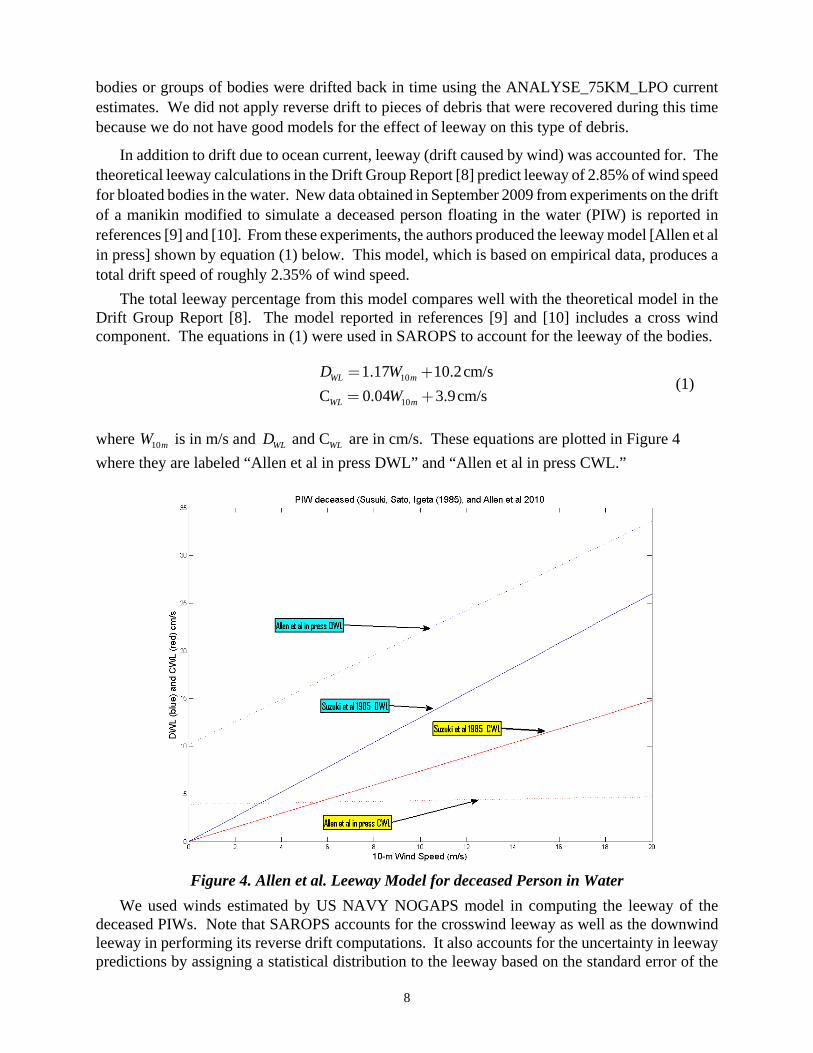
In addition to drift due to ocean current, leeway (drift caused by wind) was accounted for. The theoretical leeway calculations in the Drift Group Report [8] predict leeway of 2.85% of wind speed for bloated bodies in the water. New data obtained in September 2009 from experiments on the drift of a manikin modified to simulate a deceased person floating in the water (PIW) is reported in references [9] and [10]. From these experiments, the authors produced the leeway model [Allen et al in press] shown by equation (1) below. This model, which is based on empirical data, produces a total drift speed of roughly 2.35% of wind speed.
The total leeway percentage from this model compares well with the theoretical model in the Drift Group Report [8]. The model reported in references [9] and [10] includes a cross wind component. The equations in (1) were used in SAROPS to account for the leeway of the bodies.
10
10
1.17 10.2cm/sC 0.04 3.9cm/s
WL m
WL m
D WW
= +
= + (1)
where 10mW is in m/s and and CWL WLD are in cm/s. These equations are plotted in Figure 4 where they are labeled “Allen et al in press DWL” and “Allen et al in press CWL.”
Figure 4. Allen et al. Leeway Model for deceased Person in Water
We used winds estimated by US NAVY NOGAPS model in computing the leeway of the deceased PIWs. Note that SAROPS accounts for the crosswind leeway as well as the downwind leeway in performing its reverse drift computations. It also accounts for the uncertainty in leeway predictions by assigning a statistical distribution to the leeway based on the standard error of the
9
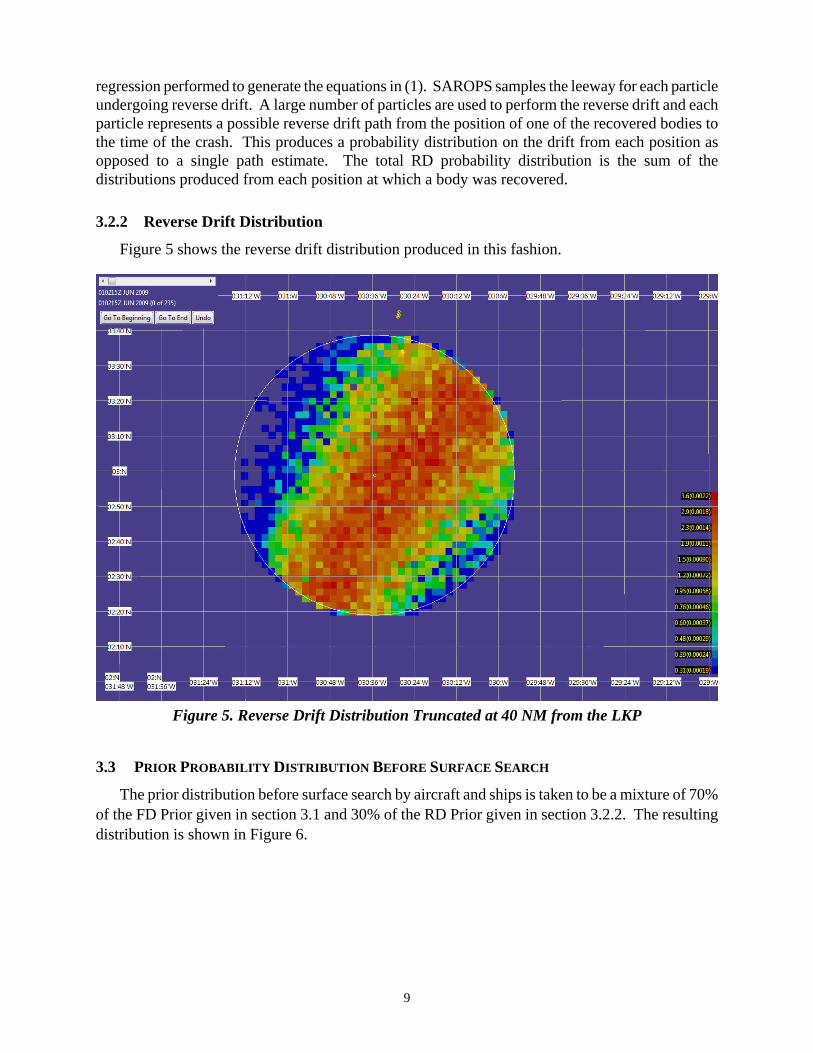
regression performed to generate the equations in (1). SAROPS samples the leeway for each particle undergoing reverse drift. A large number of particles are used to perform the reverse drift and each particle represents a possible reverse drift path from the position of one of the recovered bodies to the time of the crash. This produces a probability distribution on the drift from each position as opposed to a single path estimate. The total RD probability distribution is the sum of the distributions produced from each position at which a body was recovered.
3.2.2 Reverse Drift Distribution
Figure 5 shows the reverse drift distribution produced in this fashion.
Figure 5. Reverse Drift Distribution Truncated at 40 NM from the LKP
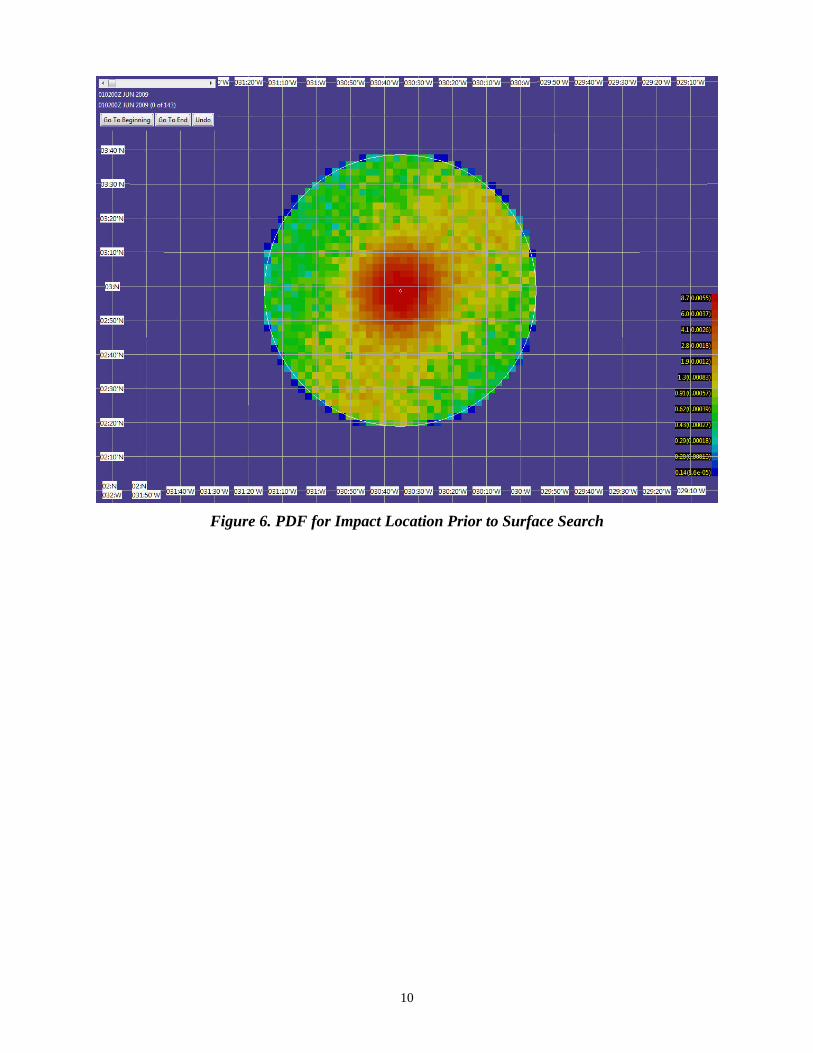
3.3 PRIOR PROBABILITY DISTRIBUTION BEFORE SURFACE SEARCH
The prior distribution before surface search by aircraft and ships is taken to be a mixture of 70% of the FD Prior given in section 3.1 and 30% of the RD Prior given in section 3.2.2. The resulting distribution is shown in Figure 6.
10
Figure 6. PDF for Impact Location Prior to Surface Search
11
4 POSTERIOR DISTRIBUTION GIVEN UNSUCCESSFUL SEARCH
Effort that fails to find the search object provides (negative) information about the object’s location. This information is incorporated into the posterior distribution on impact location through the use of Bayes’ rule in the fashion described in Section 4.1 below. In this section we estimate the effectiveness of the surface search effort and the search efforts in Phases I – III, and combine them to compute the posterior PDF on impact location given failure of these efforts.
The unsuccessful searches considered in this analysis include the ones listed below.
Unsuccessful Surface Searches: 1 June to 6 June 2009. • The air and ship search efforts failed to positively identify and recover floating debris or
bodies during the period from 1 June to 5 June. The first piece of debris was recovered and identified on June 6th.
Phase I: 10 June to 10 July 2009 • Passive acoustic searches for the “black box” Underwater Locator Beacons (ULBs) by the
US Navy Towed Pinger Locators (TPLs). • Search by the IFREMER Victor Remotely Operated Vehicle (ROV)
Phase II: 27 July to 17August 2009 • Side looking sonar search by the IFREMER deep sonar towed by the Pourquoi Pas?
Phase III: 2 April – 24 May 2010 • Side-scan sonar search by three REMUS Autonomous Underwater Vehicles (AUVs) and
visual/sonar search by the Triton ROV. • Search by the USN Orion towed side-scan sonar system.
4.1 ACCOUNTING FOR UNSUCCESSFUL SEARCH
The SAROPS program uses a large number N of simulated points or particles to represent the probability distribution on the path or location of a search object. The thn particle has weight nw for
1, ,n N= … . Initially all weights are set equal so that 1/nw N= for all n . The weight is the probability that the particle represents the search object’s location or path. The SAROPS PDF in Figure 6 was produced by adding the weights (probabilities) of the particles in each cell to obtain the probability that the impact point is in that cell. These probabilities are represented by the color code shown on the right of that figure. The cells used by SAROPS are smaller than the search cells used for the AF 447 search. The particles form the actual distribution computed by SAROPS. The cells are used simply as method of display. Any size cells may used in the display.
If an unsuccessful search takes place, we compute the probability 1 ( )dp n that the search would have detected the search object if it were located where particle n is for 1, ,n N= … . From this we compute the posterior distribution on object location using Bayes’ rule as follows.
( )
( )
11
11
1 ( )
1 ( )d n
n Nd nn
p n ww
p n w ′′=
−=
′−∑ for 1, ,n N= … (2)
12
where 1nw is the posterior probability that particle n represents the object’s location. We can see
from (2) that if 1 ( )dp n is close to 1, the posterior probability on particle n will tend to be low. Correspondingly those particles with low values of 1 ( )dp n will tend to have high posterior probabilities. If a second search takes place and is unsuccessful, then we calculate the detection probability 2 ( )dp n for this search for each particle. From this we can compute the posterior distribution resulting from the failure of both searches as follows.
( )
( )
2 12
2 11
1 ( )
1 ( )d n
n Nd nn
p n ww
p n w ′′=
−=
′−∑ (3)
If there are more unsuccessful searches, we apply this same procedure for each of them in turn to get the posterior PDF resulting from all unsuccessful searches.
If the particles are moving and the search sensor is moving, SAROPS accounts for both of these motions in calculating ( )dp n for each particle. The Bayesian update equation (2) is applied as before to get the posterior PDF.
4.2 AIRCRAFT, SHIP, AND SATELLITE SURFACE SEARCHES
Searches for debris by Brazilian and French aircraft were conducted from June 1st to June 26th 2009. (Other countries such as the United States participated in the aerial search by sending a P-3 ORION) These searches were unsuccessful until June 6 when debris and bodies from the aircraft were first recovered. Analysis of the unsuccessful air searches and ship searches prior to 6 June provides negative search information that we use to decrease the probability on some particles and to increase it on others according to Bayes rule for computing posterior probability distributions.
Satellite search: The BEA and the French Ministry of Defense, also analyzed satellite data from military and civilian sources. Between June 1st and June 5th, and for the area located between the latitudes 2°N and 4°N and longitudes 29°W and 31.50°W, the BEA checked from commercial sources the following satellites: EnviSAT (Europe), Radarsat 1 and 2 (Canada), TerraSAR-X (Germany) and COSMO SkyMed (Italy). These satellites use Synthetic Aperture Radar (SAR) sensors to image the Earth. Unlike electro-optical satellites that sense reflected sunlight, SAR systems transmit microwave energy toward the surface and record the reflections. Thus, they can image the Earth, day, night or with cloud cover. However, rainy conditions, that were likely prevailing during the first days of June 2009, could alter the quality of these images.
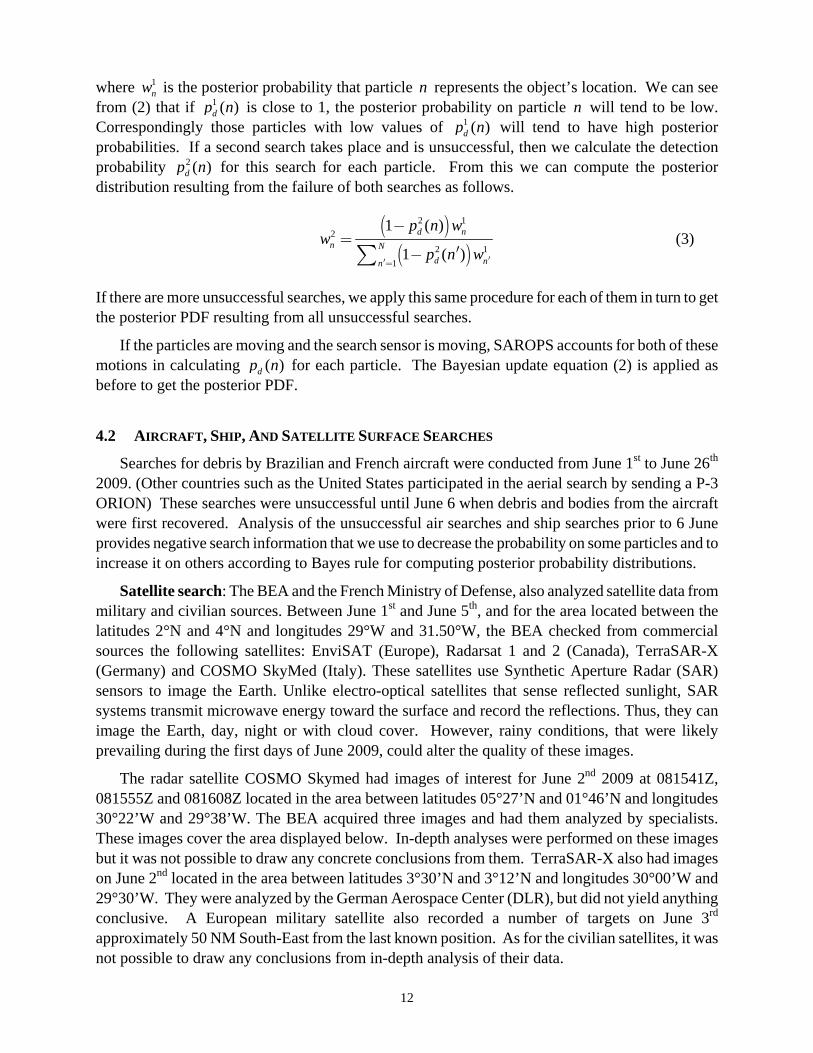
The radar satellite COSMO Skymed had images of interest for June 2nd 2009 at 081541Z, 081555Z and 081608Z located in the area between latitudes 05°27’N and 01°46’N and longitudes 30°22’W and 29°38’W. The BEA acquired three images and had them analyzed by specialists. These images cover the area displayed below. In-depth analyses were performed on these images but it was not possible to draw any concrete conclusions from them. TerraSAR-X also had images on June 2nd located in the area between latitudes 3°30’N and 3°12’N and longitudes 30°00’W and 29°30’W. They were analyzed by the German Aerospace Center (DLR), but did not yield anything conclusive. A European military satellite also recorded a number of targets on June 3rd approximately 50 NM South-East from the last known position. As for the civilian satellites, it was not possible to draw any conclusions from in-depth analysis of their data.
13
XCosmo-Skymed08h15m41sZ
XCosmo-Skymed08h15m55sZ
XCosmo-Skymed08h16m08sZ
Figure 7. Regions Imaged by the COSMO Skymed Satellite on June 2nd 2009 at 081541Z, 081555Z, and 081608Z
The SAROPS search planning software was employed to recreate the unsuccessful aircraft and ship searches and to estimate a probability of detection (POD) in the areas searched.
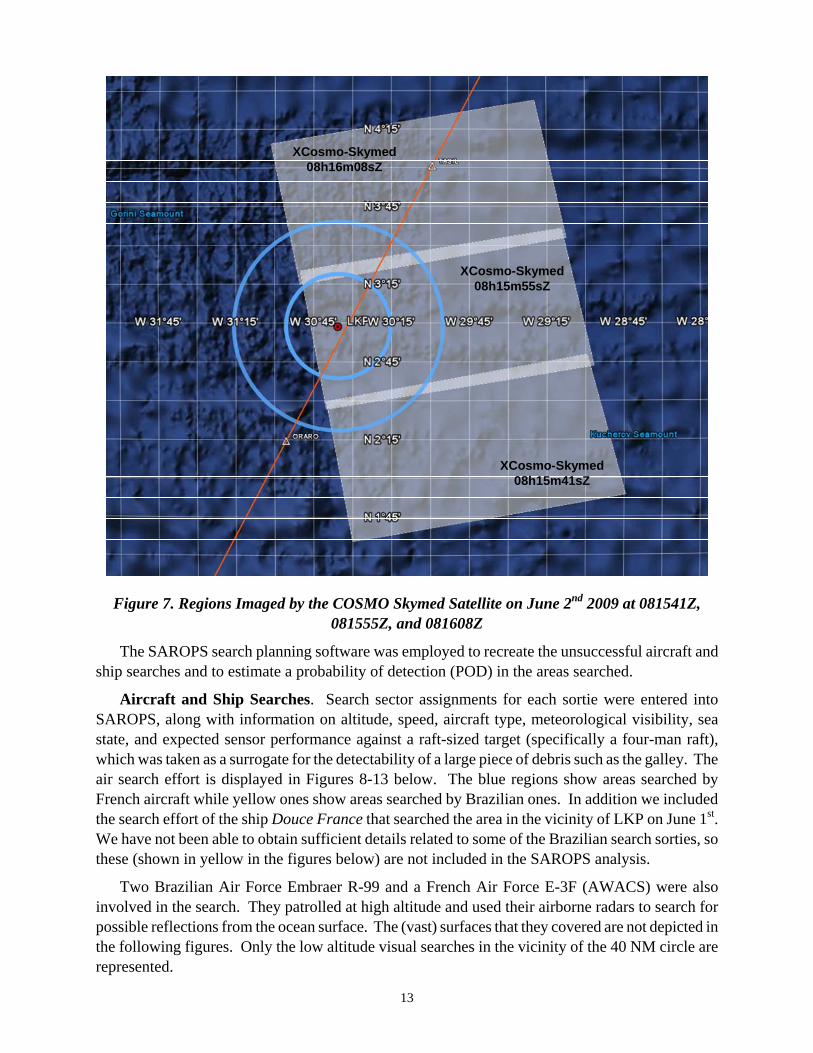
Aircraft and Ship Searches. Search sector assignments for each sortie were entered into SAROPS, along with information on altitude, speed, aircraft type, meteorological visibility, sea state, and expected sensor performance against a raft-sized target (specifically a four-man raft), which was taken as a surrogate for the detectability of a large piece of debris such as the galley. The air search effort is displayed in Figures 8-13 below. The blue regions show areas searched by French aircraft while yellow ones show areas searched by Brazilian ones. In addition we included the search effort of the ship Douce France that searched the area in the vicinity of LKP on June 1st. We have not been able to obtain sufficient details related to some of the Brazilian search sorties, so these (shown in yellow in the figures below) are not included in the SAROPS analysis.
Two Brazilian Air Force Embraer R-99 and a French Air Force E-3F (AWACS) were also involved in the search. They patrolled at high altitude and used their airborne radars to search for possible reflections from the ocean surface. The (vast) surfaces that they covered are not depicted in the following figures. Only the low altitude visual searches in the vicinity of the 40 NM circle are represented.
14
Fr1
Br1
Figure 8. Air Search Efforts, 1 June
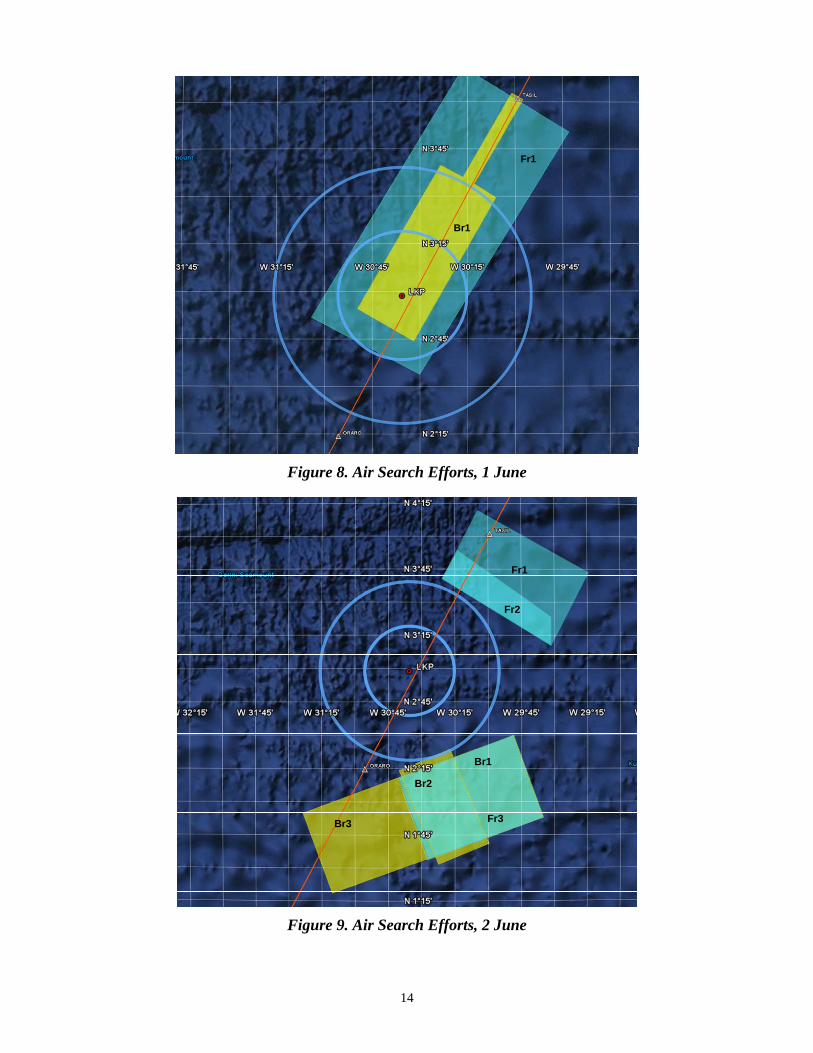
Fr1
Br1
Br3
Fr2
Br2
Fr3
Figure 9. Air Search Efforts, 2 June
15
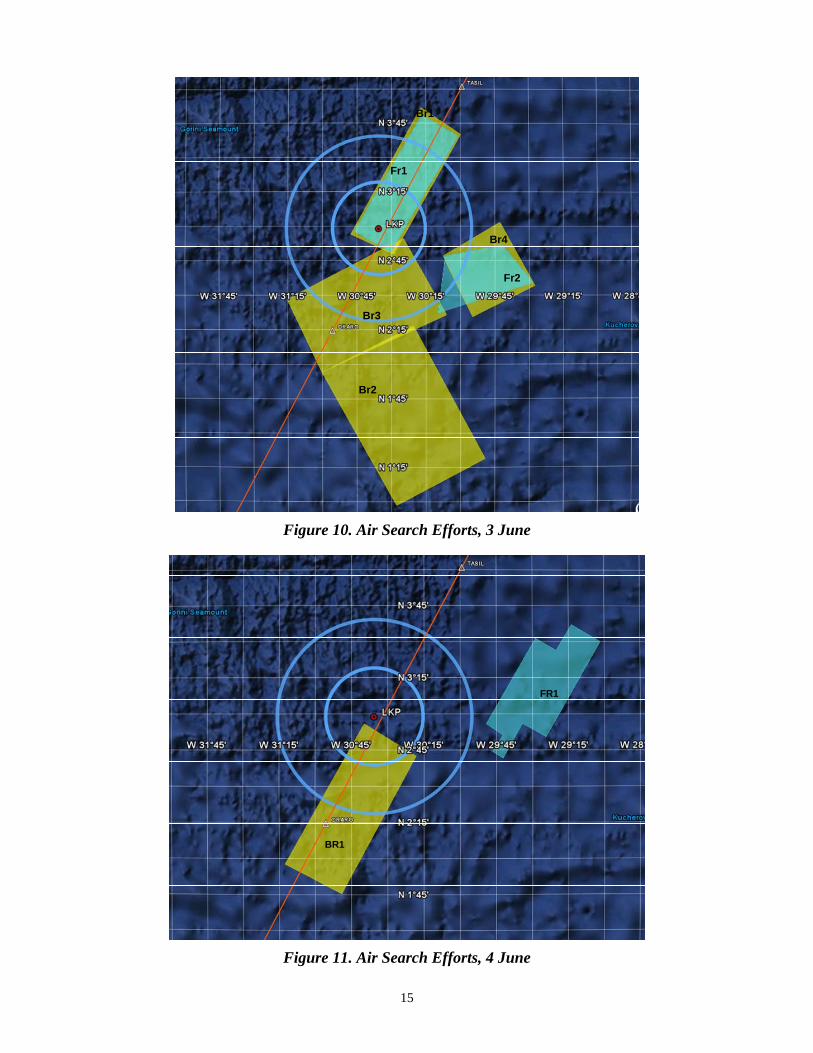
Fr1
Fr2
Br1
Br3
Br4
Br2
Figure 10. Air Search Efforts, 3 June
BR1
FR1
Figure 11. Air Search Efforts, 4 June
16
Fr1
Br1
Br2
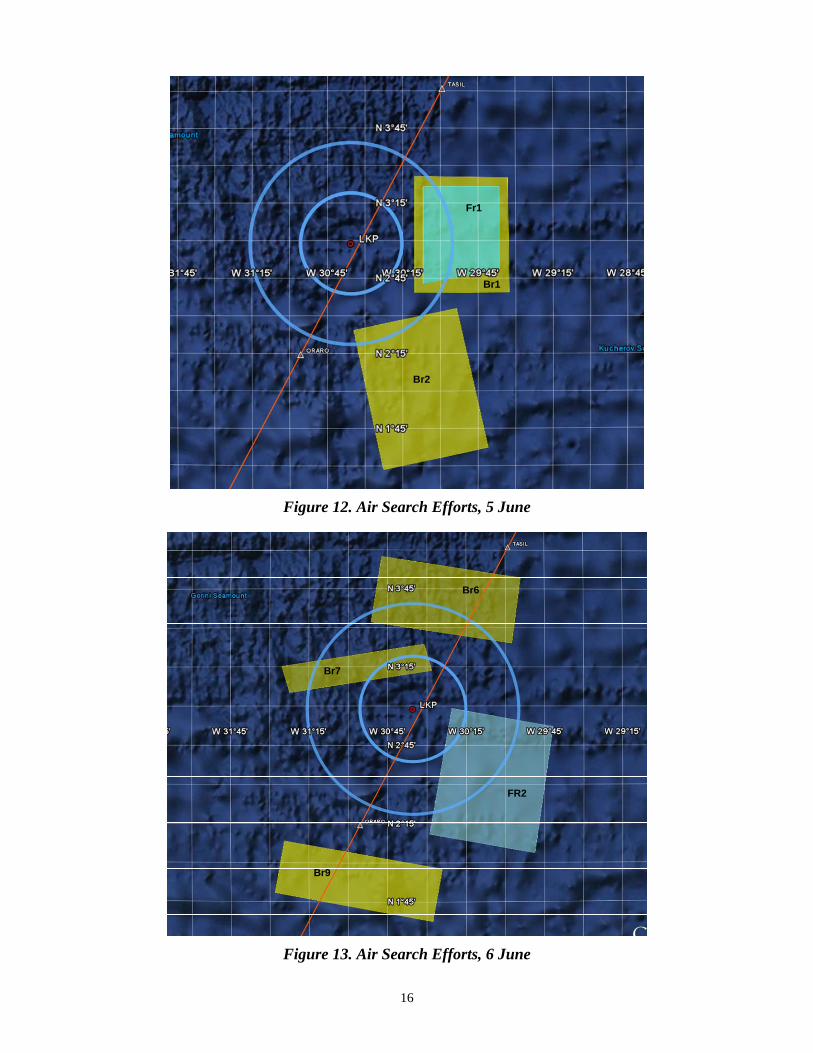
Figure 12. Air Search Efforts, 5 June
FR2
Br9
Br7
Br6
Figure 13. Air Search Efforts, 6 June
17
Note that the western part of the 40 NM circle was not covered by either satellites or search aircraft during the first five days of the search. This will be reflected later in the surface search posterior probability distribution functions.
To evaluate the effect of the unsuccessful air search effort, we started with the surface search prior distribution given in Figure 6. We allocated simulation particles in accordance with the probability density in each cell. We then used SAROPS to “drift” these particles forward in time from the time of impact though 6 June. In the process of doing this we accounted for the unsuccessful aircraft search and the search by the ship Douce France during that time. The search object was assumed to have the drift and detection characteristics of a four-person life raft. If the particles were predicted to pass through an area searched by aircraft or the Douce France, their weight was appropriately reduced according to the estimated dp for that platform sortie as described in section 4.1. The result is a set of particles whose weights (probabilities) have been updated to incorporate the unsuccessful air and ship search effort during those days.
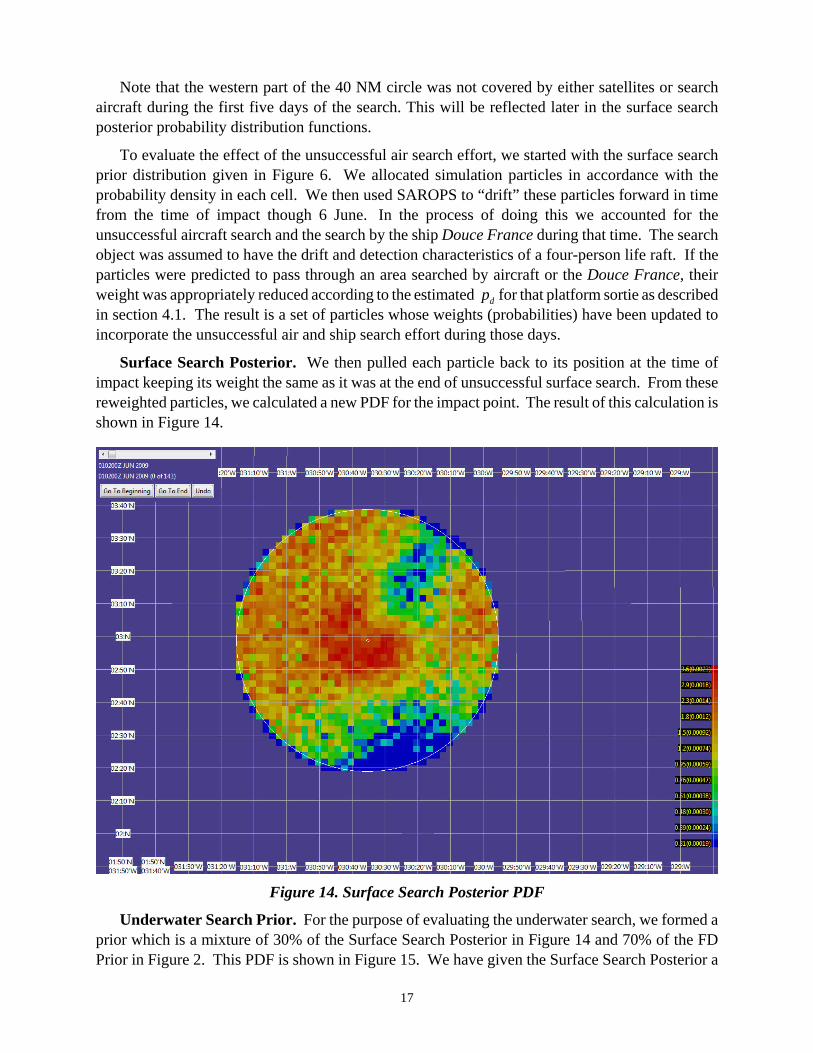
Surface Search Posterior. We then pulled each particle back to its position at the time of impact keeping its weight the same as it was at the end of unsuccessful surface search. From these reweighted particles, we calculated a new PDF for the impact point. The result of this calculation is shown in Figure 14.
Figure 14. Surface Search Posterior PDF
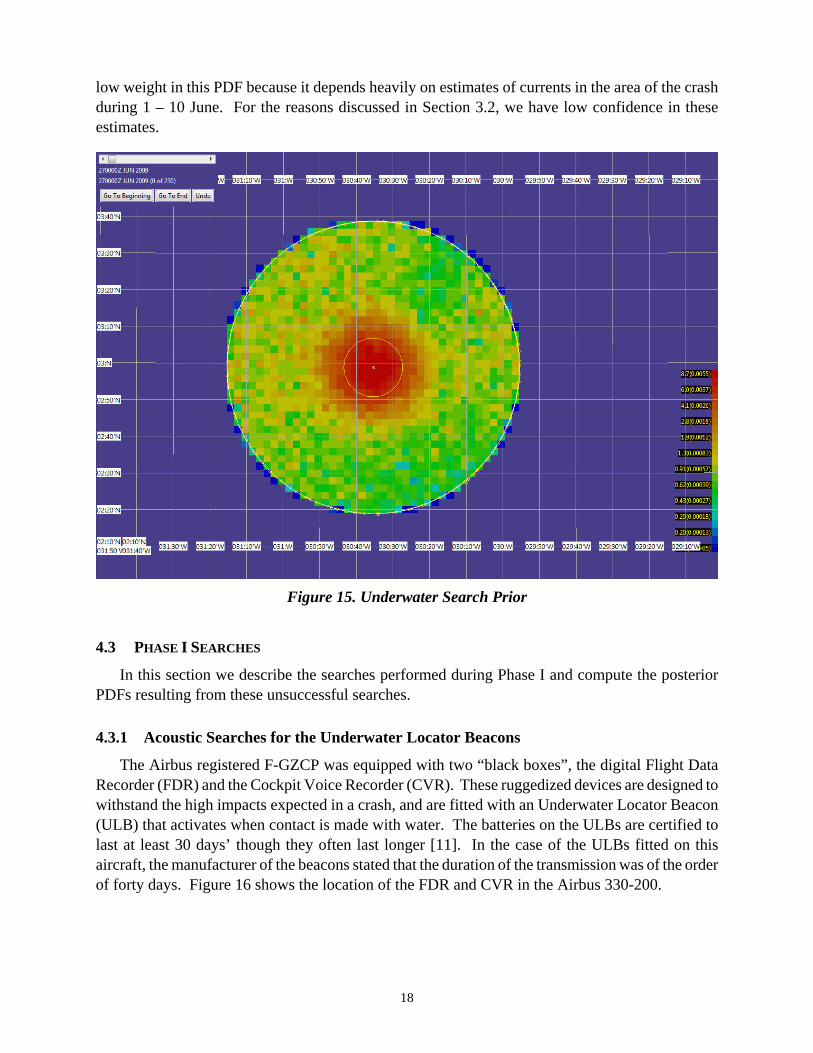
Underwater Search Prior. For the purpose of evaluating the underwater search, we formed a prior which is a mixture of 30% of the Surface Search Posterior in Figure 14 and 70% of the FD Prior in Figure 2. This PDF is shown in Figure 15. We have given the Surface Search Posterior a
18
low weight in this PDF because it depends heavily on estimates of currents in the area of the crash during 1 – 10 June. For the reasons discussed in Section 3.2, we have low confidence in these estimates.
Figure 15. Underwater Search Prior
4.3 PHASE I SEARCHES
In this section we describe the searches performed during Phase I and compute the posterior PDFs resulting from these unsuccessful searches.
4.3.1 Acoustic Searches for the Underwater Locator Beacons
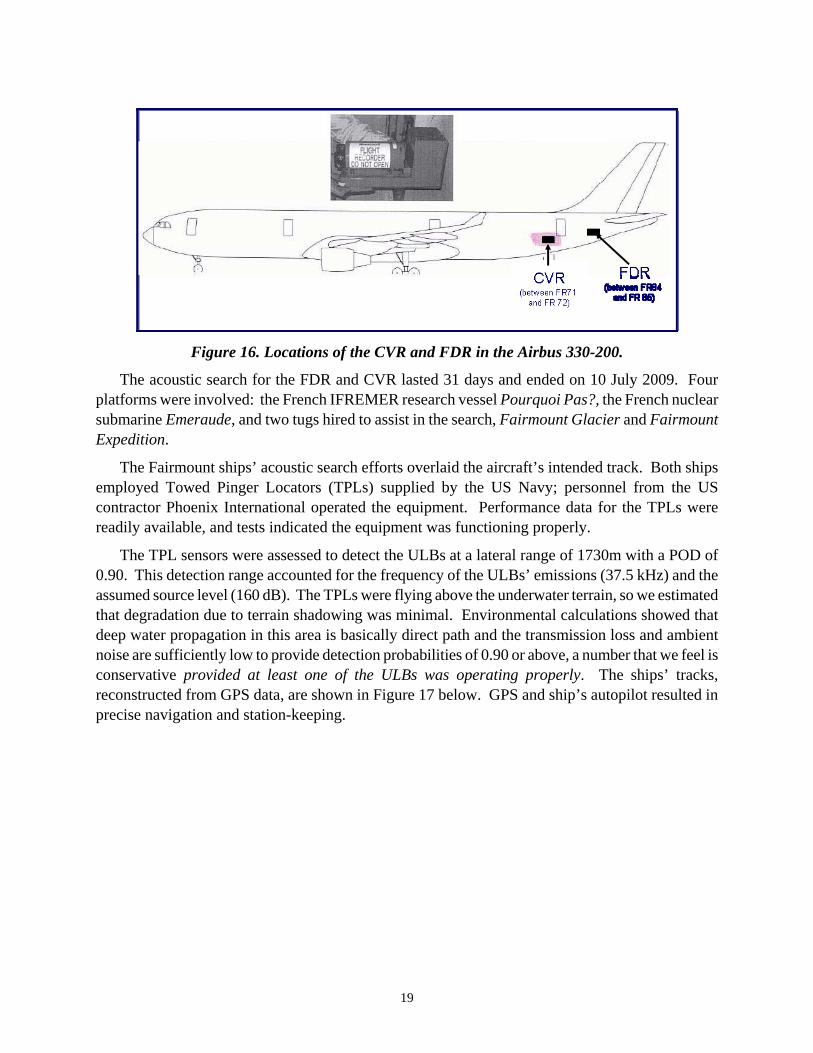
The Airbus registered F-GZCP was equipped with two “black boxes”, the digital Flight Data Recorder (FDR) and the Cockpit Voice Recorder (CVR). These ruggedized devices are designed to withstand the high impacts expected in a crash, and are fitted with an Underwater Locator Beacon (ULB) that activates when contact is made with water. The batteries on the ULBs are certified to last at least 30 days’ though they often last longer [11]. In the case of the ULBs fitted on this aircraft, the manufacturer of the beacons stated that the duration of the transmission was of the order of forty days. Figure 16 shows the location of the FDR and CVR in the Airbus 330-200.
19
Figure 16. Locations of the CVR and FDR in the Airbus 330-200.
The acoustic search for the FDR and CVR lasted 31 days and ended on 10 July 2009. Four platforms were involved: the French IFREMER research vessel Pourquoi Pas?, the French nuclear submarine Emeraude, and two tugs hired to assist in the search, Fairmount Glacier and Fairmount Expedition.
The Fairmount ships’ acoustic search efforts overlaid the aircraft’s intended track. Both ships employed Towed Pinger Locators (TPLs) supplied by the US Navy; personnel from the US contractor Phoenix International operated the equipment. Performance data for the TPLs were readily available, and tests indicated the equipment was functioning properly.
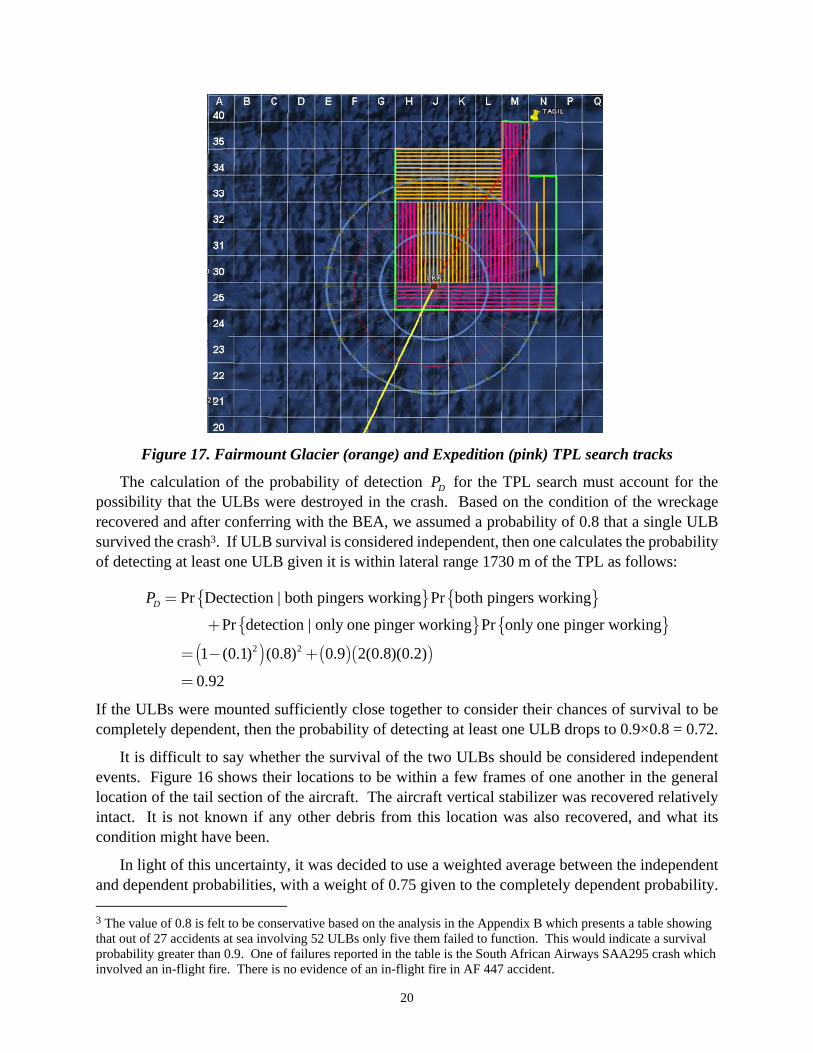
The TPL sensors were assessed to detect the ULBs at a lateral range of 1730m with a POD of 0.90. This detection range accounted for the frequency of the ULBs’ emissions (37.5 kHz) and the assumed source level (160 dB). The TPLs were flying above the underwater terrain, so we estimated that degradation due to terrain shadowing was minimal. Environmental calculations showed that deep water propagation in this area is basically direct path and the transmission loss and ambient noise are sufficiently low to provide detection probabilities of 0.90 or above, a number that we feel is conservative provided at least one of the ULBs was operating properly. The ships’ tracks, reconstructed from GPS data, are shown in Figure 17 below. GPS and ship’s autopilot resulted in precise navigation and station-keeping.
20
Figure 17. Fairmount Glacier (orange) and Expedition (pink) TPL search tracks
The calculation of the probability of detection DP for the TPL search must account for the possibility that the ULBs were destroyed in the crash. Based on the condition of the wreckage recovered and after conferring with the BEA, we assumed a probability of 0.8 that a single ULB survived the crash3. If ULB survival is considered independent, then one calculates the probability of detecting at least one ULB given it is within lateral range 1730 m of the TPL as follows:
{ } { }{ } { }
( ) ( )( )2 2
Pr Dectection | both pingers working Pr both pingers working
Pr detection | only one pinger working Pr only one pinger working
1 (0.1) (0.8) 0.9 2(0.8)(0.2)
0.92
DP =
+
= − +
=
If the ULBs were mounted sufficiently close together to consider their chances of survival to be completely dependent, then the probability of detecting at least one ULB drops to 0.9×0.8 = 0.72.
It is difficult to say whether the survival of the two ULBs should be considered independent events. Figure 16 shows their locations to be within a few frames of one another in the general location of the tail section of the aircraft. The aircraft vertical stabilizer was recovered relatively intact. It is not known if any other debris from this location was also recovered, and what its condition might have been.
In light of this uncertainty, it was decided to use a weighted average between the independent and dependent probabilities, with a weight of 0.75 given to the completely dependent probability. 3 The value of 0.8 is felt to be conservative based on the analysis in the Appendix B which presents a table showing that out of 27 accidents at sea involving 52 ULBs only five them failed to function. This would indicate a survival probability greater than 0.9. One of failures reported in the table is the South African Airways SAA295 crash which involved an in-flight fire. There is no evidence of an in-flight fire in AF 447 accident.
21
Accounting for this likelihood of the presence of at least one ULB signal, we computed a detection probability of DP = 0.77 given a ULB is within lateral range 1730 m of a TPL search during the 30 day period from June 1 – June 30 , 2009 which corresponds to the pingers rated 30 day lifetime. During the additional 10 days that the pingers were likely to be working according to the manufacturer, we discounted the TPL DP by 50% and used a value of 0.385.
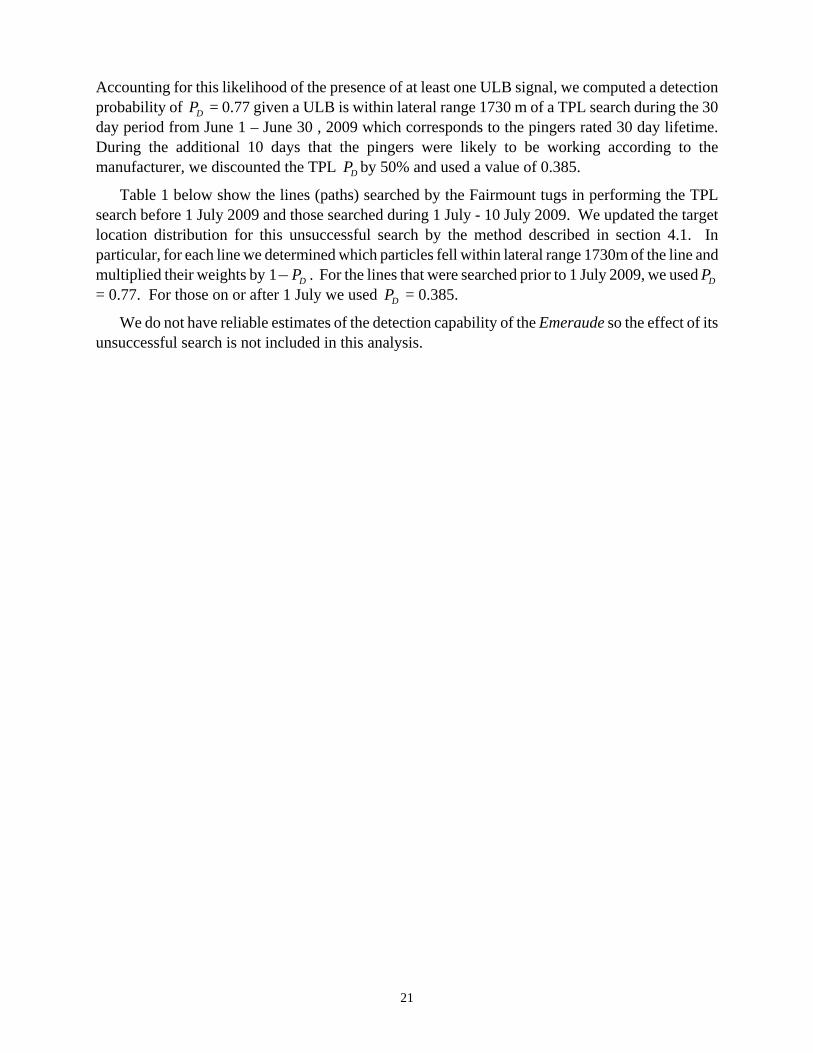
Table 1 below show the lines (paths) searched by the Fairmount tugs in performing the TPL search before 1 July 2009 and those searched during 1 July - 10 July 2009. We updated the target location distribution for this unsuccessful search by the method described in section 4.1. In particular, for each line we determined which particles fell within lateral range 1730m of the line and multiplied their weights by 1 DP− . For the lines that were searched prior to 1 July 2009, we used DP = 0.77. For those on or after 1 July we used DP = 0.385.
We do not have reliable estimates of the detection capability of the Emeraude so the effect of its unsuccessful search is not included in this analysis.
22
Lat lon desc equipment Lat lon desc equipment 3°30'00.00"N 30°41'21.58"W H7 Fairmont Glacier N03 39.95379 W030 49.99613 33A TPL40 3° 0'0.00"N 30°41'21.58"W H7 Fairmont Glacier N03 39.95379 W030 10.00387 33A TPL40 3°30'00.00"N 30°39'55.00"W J1 Fairmont Glacier N03 38.51862 W030 49.99560 33B TPL40 3° 0'0.00"N 30°39'55.00"W J1 Fairmont Glacier N03 38.51862 W030 10.0044 33B TPL40 3°30'00.00"N 30°38'31.76"W J2 Fairmont Glacier N03 37.08344 W030 49.99507 33C TPL40 3° 0'0.00"N 30°38'31.76"W J2 Fairmont Glacier N03 37.08344 W030 10.00493 33C TPL40 3°30'00.00"N 30°37'9.91"W J3 Fairmont Glacier N03 35.64826 W030 49.99454 33D TPL40 3° 0'0.00"N 30°37'9.91"W J3 Fairmont Glacier N03 35.64826 W030 10.00546 33D TPL40 3°30'00.00"N 30°35'42.45"W J4 Fairmont Glacier N03 34.21308 W030 49.99401 33E TPL40 3° 0'0.00"N 30°35'42.45"W J4 Fairmont Glacier N03 34.21308 W030 10.00599 33E TPL40 3°30'00.00"N 30°34'17.32"W J5 Fairmont Glacier N03 32.77791 W030 49.99348 33F TPL40 3° 0'0.00"N 30°34'17.32"W J5 Fairmont Glacier N03 32.77791 W030 10.00652 33F TPL40 3°30'00.00"N 30°32'51.35"W J6 Fairmont Glacier N03 31.34273 W030 49.99294 33G TPL40 3° 0'0.00"N 30°32'51.35"W J6 Fairmont Glacier N03 31.34273 W030 10.00706 33G TPL40 3°30'00.00"N 30°31'24.95"W J7 Fairmont Glacier N03 48.56483 W030 49.99944 34B TPL40 3° 0'0.00"N 30°31'21.86"W J7 Fairmont Glacier N03 48.56483 W030 10.00056 34B TPL40 3°30'00.00"N 30°30'0.00"W K1 Fairmont Glacier N03 45.69449 W030 49.99833 34D TPL40 3° 0'0.00"N 30°30'0.00"W K1 Fairmont Glacier N03 45.69449 W030 10.00167 34D TPL40 3°30'00.00"N 30°28'34.45"W K2 Fairmont Glacier N03 30.00000 W029 57.14000 N1 TPL40 3° 0'0.00"N 30°28'34.45"W K2 Fairmont Glacier N03 00.00000 W029 57.14000 N1 TPL40 3°30'00.00"N 30°27'8.66"W k3 Fairmont Glacier N03 40.04739 W029 54.27652 N2 TPL40 3° 0'0.00"N 30°27'8.66"W K3 Fairmont Glacier N03 00.00000 W029 54.28000 N2 TPL40 3°30'00.00"N 30°25'42.51"W K4 Fairmont Glacier N02 58.61118 W030 50.00000 25B TPL20 3° 0'0.00"N 30°25'42.51"W K4 Fairmont Glacier N02 58.61118 W029 50.00000 25B TPL20 3°30'00.00"N 30°24'17.00"W K5 Fairmont Glacier N02 57.17599 W030 50.00000 25C TPL20 3° 0'0.00"N 30°24'17.00"W K5 Fairmont Glacier N02 57.17599 W029 50.00000 25C TPL20 3°30'00.00"N 30°22'51.49"W K6 Fairmont Glacier N02 55.74079 W030 50.00000 25D TPL20 3° 0'0.00"N 30°22'51.49"W K6 Fairmont Glacier N02 55.74079 W029 50.00000 25D TPL20 3°41'22.34"N 30°49'59.08"W 34G Fairmont Glacier N02 54.30559 W030 50.00154 25E TPL20 3°41'22.34"N 30° 9'59.80"W 34G Fairmont Glacier N02 54.30559 W029 50.00000 25E TPL20 3°42'49.31"N 30°49'59.08"W 34F Fairmont Glacier N02 52.87040 W030 30.00103 25F TPL20 3°42'49.31"N 30° 9'59.80"W 34F Fairmont Glacier N02 52.87040 W029 50.00000 25F TPL20 3°44'18.25"N 30°49'59.08"W 34E Fairmont Glacier N02 51.43520 W030 50.00051 25G TPL20 3°44'18.25"N 30° 9'59.80"W 34E Fairmont Glacier N02 51.43520 W029 50.00000 25G TPL20 3°47'8.53"N 30°49'59.08"W 34C Fairmont Glacier N02 50.00000 W030 30.00000 25H TPL20 3°47'8.53"N 30° 9'59.80"W 34C Fairmont Glacier N02 50.00000 W029 50.00000 25H TPL20 3°49'59.95"N 30°49'59.08"W 34A Fairmont Glacier N04 00.00000 W030 08.57119 M2 TPL20 3°49'59.95"N 30° 9'59.80"W 34A Fairmont Glacier N03 00.00000 W030 08.57189 M2 TPL20 3°30'00.00"N 30°21'26.30"W K7 Fairmont Expedition N04 00.00000 W030 05.71356 M4 TPL20 3° 0'0.00"N 30°21'26.30"W K7 Fairmont Expedition N03 00.00000 W030 05.71567 M4 TPL20 3°30'00.00"N 30°50'0.20"W H1 Fairmont Expedition N04 00.00000 W030 02.85594 M6 TPL20 3° 0'0.00"N 30°50'0.20"W H1 Fairmont Expedition N03 00.00000 W030 02.85945 M6 TPL20 3°30'00.00"N 30°48'33.17"W H2 Fairmont Expedition N04 00.00000 W030 00.00000 M8 TPL20 3° 0'0.00"N 30°48'33.17"W H2 Fairmont Expedition N03 00.00000 W030 00.00000 M8 TPL20 3°30'00.00"N 30°47'7.33"W H3 Fairmont Expedition 3° 0'0.00"N 30°47'7.33"W H3 Fairmont Expedition 3°30'00.00"N 30°45'43.73"W H4 Fairmont Expedition 3° 0'0.00"N 30°45'43.73"W H4 Fairmont Expedition 3°30'00.00"N 30°44'16.09"W H5 Fairmont Expedition 3° 0'0.00"N 30°44'16.09"W H5 Fairmont Expedition 3°30'00.00"N 30°42'51.15"W H6 Fairmont Expedition 3° 0'0.00"N 30°42'51.15"W H6 Fairmont Expedition 3°30'00.00"N 30°11'25.56"W L7 Fairmont Expedition 3° 0'0.00"N 30°11'25.56"W L7 Fairmont Expedition 3°30'00.00"N 30°12'50.95"W L6 Fairmont Expedition 3° 0'0.00"N 30°12'50.95"W L6 Fairmont Expedition 3°30'00.00"N 30°14'17.03"W L5 Fairmont Expedition 3° 0'0.00"N 30°14'17.03"W L5 Fairmont Expedition 3°30'00.00"N 30°15'42.25"W L4 Fairmont Expedition 3° 0'0.00"N 30°15'42.25"W L4 Fairmont Expedition 3°30'00.00"N 30°17'8.33"W L3 Fairmont Expedition 3° 0'0.00"N 30°17'8.33"W L3 Fairmont Expedition 3°30'00.00"N 30°18'33.76"W L2 Fairmont Expedition 3° 0'0.00"N 30°18'33.76"W L2 Fairmont Expedition 3°30'00.00"N 30°20'0.15"W L1 Fairmont Expedition 3° 0'0.00"N 30°20'0.15"W L1 Fairmont Expedition 4° 0'0.00"N 30° 0'0.00"W M8 Fairmont Expedition 3° 0'0.00"N 30° 0'0.00"W M8 Fairmont Expedition 4° 0'0.00"N 30° 1'25.65"W M7 Fairmont Expedition 3° 0'0.00"N 30° 1'25.65"W M7 Fairmont Expedition 4° 0'0.00"N 30° 4'23.66"W M5 Fairmont Expedition 3° 0'0.00"N 30° 4'23.66"W M5 Fairmont Expedition 4° 0'0.00"N 30° 7'8.04"W M3 Fairmont Expedition 3° 0'0.00"N 30° 7'8.04"W M3 Fairmont Expedition 4° 0'0.00"N 30° 9'59.75"W M1 Fairmont Expedition 3° 0'0.00"N 30° 9'59.75"W M1 Fairmont Expedition
Lines Searched before 1 July 2009 Lines Searched from 1 July 2009 to 10 July 2009
Table 1. Lines Searched by Fairmont Tugs before and after 1 July 2009.
23
4.3.2 Victor ROV
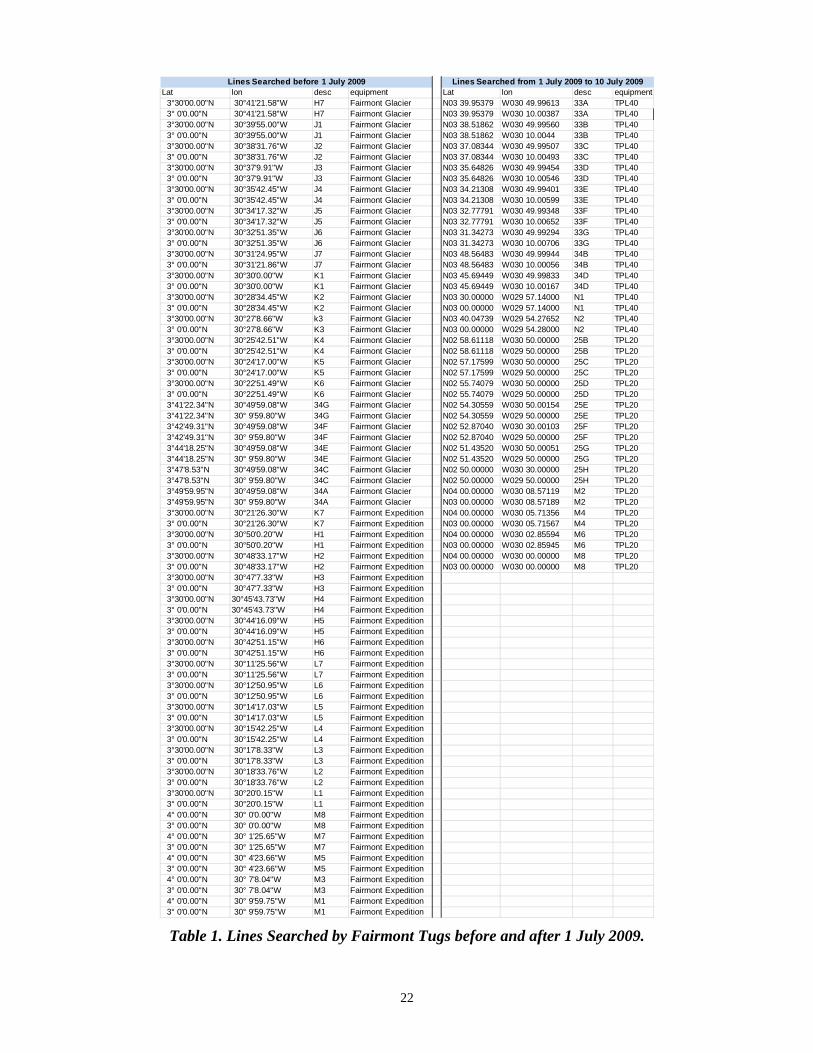
The ROV Victor performed sonar search during phase I. Its search path is shown in green in Figure 18. The detection capability of Victor was modeled by giving it a 0.90 detection probability out to range of 150 m.
Figure 18. Search Path of ROV Victor
4.3.3 Posterior PDF after Phase I Search
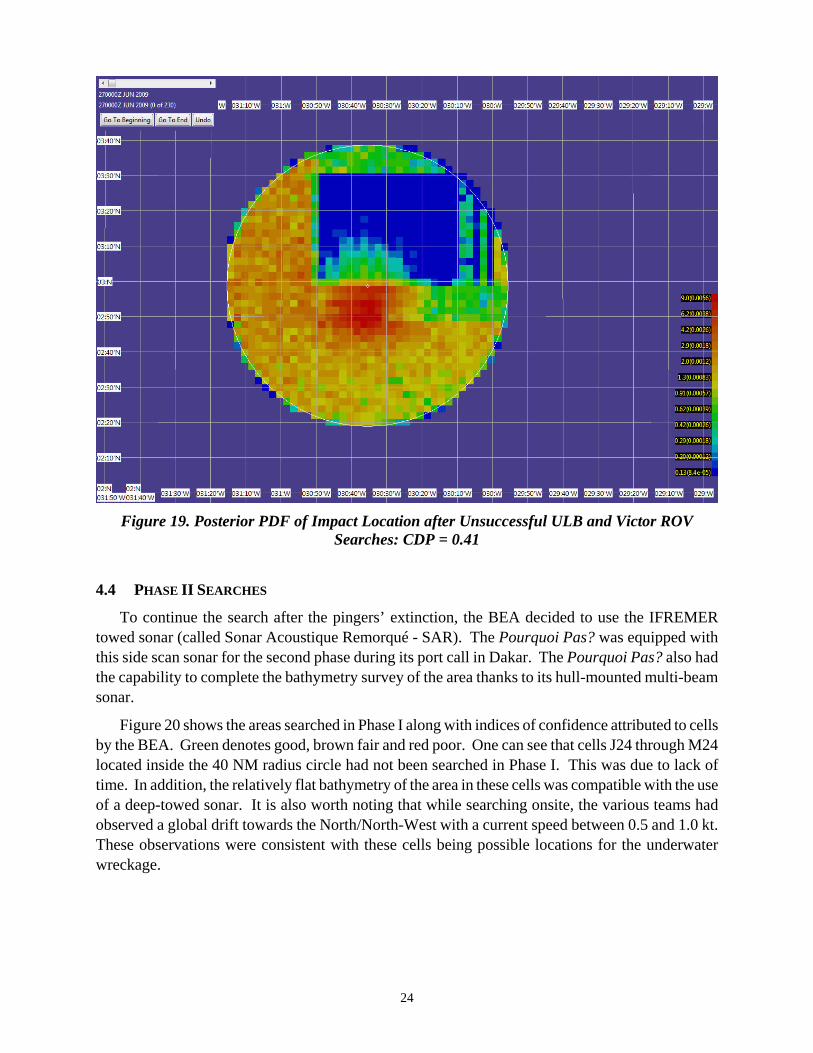
The posterior distribution after unsuccessful ULB searches by the Fairmount TPLs and the Victor ROV is shown in Figure 19 below. This is the posterior for location of the underwater wreckage after the Phase I searches. The Cumulative Detection Probability for the TPL and Victor searches is 0.41.
24
Figure 19. Posterior PDF of Impact Location after Unsuccessful ULB and Victor ROV
Searches: CDP = 0.41
4.4 PHASE II SEARCHES
To continue the search after the pingers’ extinction, the BEA decided to use the IFREMER towed sonar (called Sonar Acoustique Remorqué - SAR). The Pourquoi Pas? was equipped with this side scan sonar for the second phase during its port call in Dakar. The Pourquoi Pas? also had the capability to complete the bathymetry survey of the area thanks to its hull-mounted multi-beam sonar.
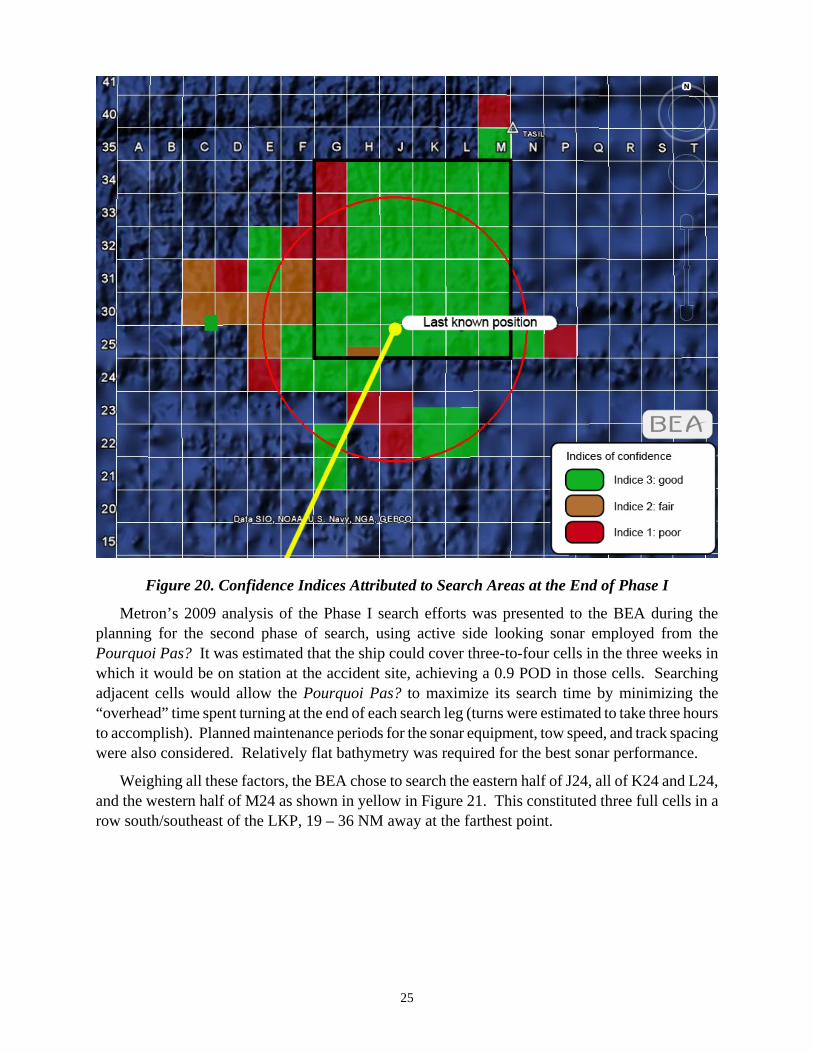
Figure 20 shows the areas searched in Phase I along with indices of confidence attributed to cells by the BEA. Green denotes good, brown fair and red poor. One can see that cells J24 through M24 located inside the 40 NM radius circle had not been searched in Phase I. This was due to lack of time. In addition, the relatively flat bathymetry of the area in these cells was compatible with the use of a deep-towed sonar. It is also worth noting that while searching onsite, the various teams had observed a global drift towards the North/North-West with a current speed between 0.5 and 1.0 kt. These observations were consistent with these cells being possible locations for the underwater wreckage.
25
Figure 20. Confidence Indices Attributed to Search Areas at the End of Phase I
Metron’s 2009 analysis of the Phase I search efforts was presented to the BEA during the planning for the second phase of search, using active side looking sonar employed from the Pourquoi Pas? It was estimated that the ship could cover three-to-four cells in the three weeks in which it would be on station at the accident site, achieving a 0.9 POD in those cells. Searching adjacent cells would allow the Pourquoi Pas? to maximize its search time by minimizing the “overhead” time spent turning at the end of each search leg (turns were estimated to take three hours to accomplish). Planned maintenance periods for the sonar equipment, tow speed, and track spacing were also considered. Relatively flat bathymetry was required for the best sonar performance.
Weighing all these factors, the BEA chose to search the eastern half of J24, all of K24 and L24, and the western half of M24 as shown in yellow in Figure 21. This constituted three full cells in a row south/southeast of the LKP, 19 – 36 NM away at the farthest point.
26
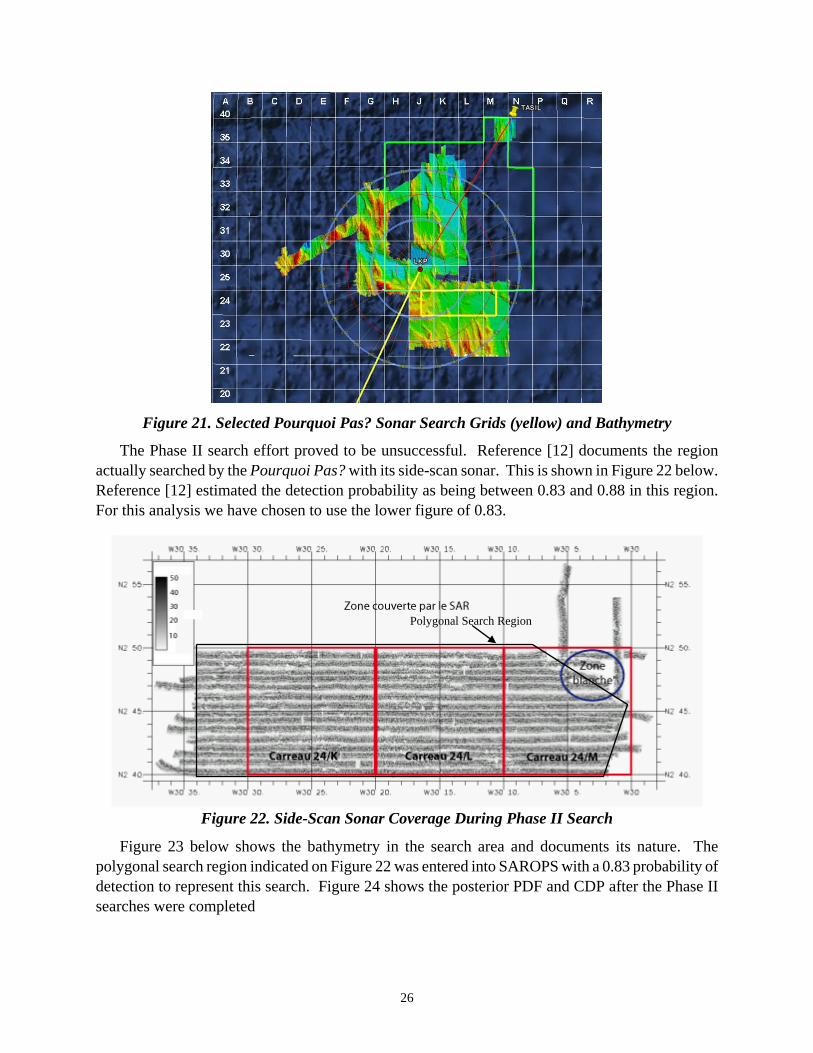
Figure 21. Selected Pourquoi Pas? Sonar Search Grids (yellow) and Bathymetry
The Phase II search effort proved to be unsuccessful. Reference [12] documents the region actually searched by the Pourquoi Pas? with its side-scan sonar. This is shown in Figure 22 below. Reference [12] estimated the detection probability as being between 0.83 and 0.88 in this region. For this analysis we have chosen to use the lower figure of 0.83.
Figure 22. Side-Scan Sonar Coverage During Phase II Search
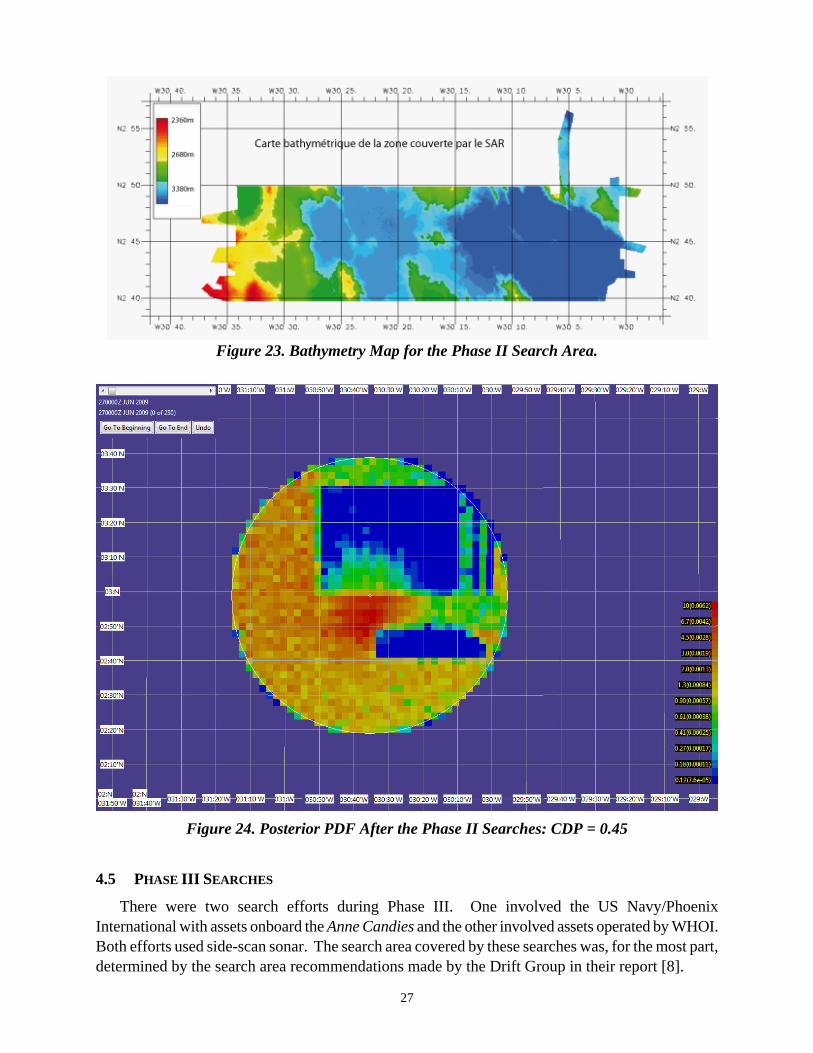
Figure 23 below shows the bathymetry in the search area and documents its nature. The polygonal search region indicated on Figure 22 was entered into SAROPS with a 0.83 probability of detection to represent this search. Figure 24 shows the posterior PDF and CDP after the Phase II searches were completed
Polygonal Search Region
27
Figure 23. Bathymetry Map for the Phase II Search Area.
Figure 24. Posterior PDF After the Phase II Searches: CDP = 0.45
4.5 PHASE III SEARCHES
There were two search efforts during Phase III. One involved the US Navy/Phoenix International with assets onboard the Anne Candies and the other involved assets operated by WHOI. Both efforts used side-scan sonar. The search area covered by these searches was, for the most part, determined by the search area recommendations made by the Drift Group in their report [8].
28
4.5.1 US Navy/Phoenix International4
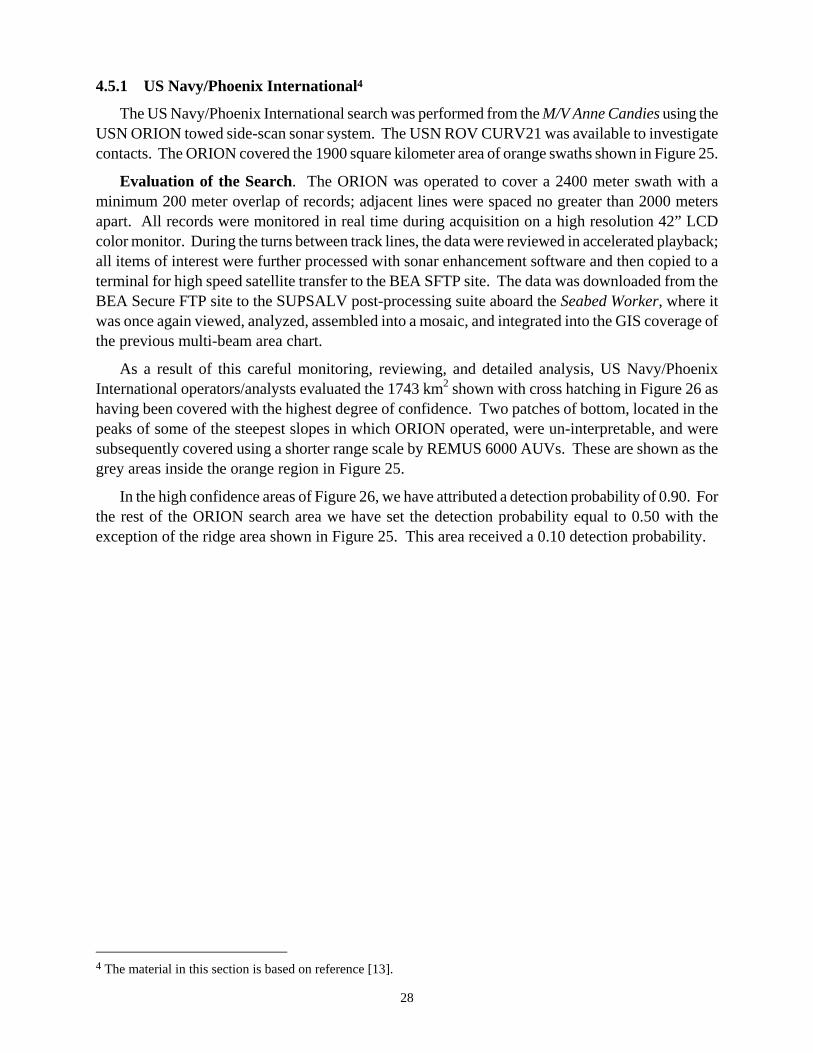
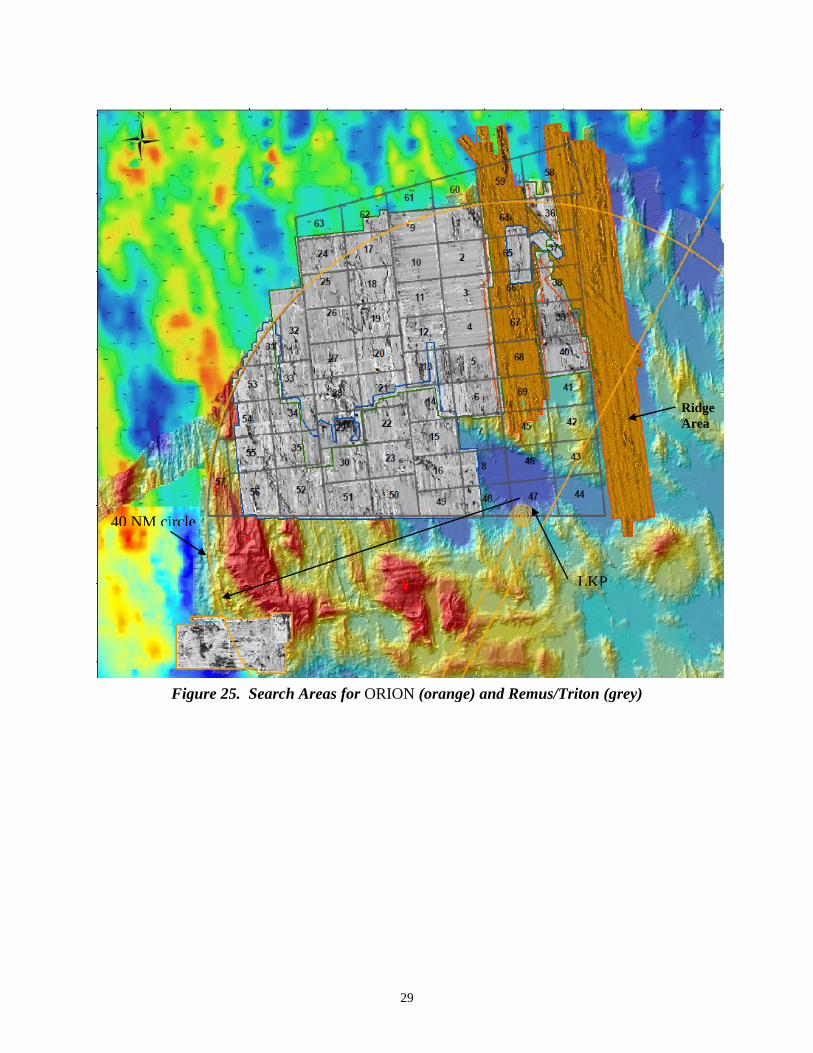
The US Navy/Phoenix International search was performed from the M/V Anne Candies using the USN ORION towed side-scan sonar system. The USN ROV CURV21 was available to investigate contacts. The ORION covered the 1900 square kilometer area of orange swaths shown in Figure 25.
Evaluation of the Search. The ORION was operated to cover a 2400 meter swath with a minimum 200 meter overlap of records; adjacent lines were spaced no greater than 2000 meters apart. All records were monitored in real time during acquisition on a high resolution 42” LCD color monitor. During the turns between track lines, the data were reviewed in accelerated playback; all items of interest were further processed with sonar enhancement software and then copied to a terminal for high speed satellite transfer to the BEA SFTP site. The data was downloaded from the BEA Secure FTP site to the SUPSALV post-processing suite aboard the Seabed Worker, where it was once again viewed, analyzed, assembled into a mosaic, and integrated into the GIS coverage of the previous multi-beam area chart.
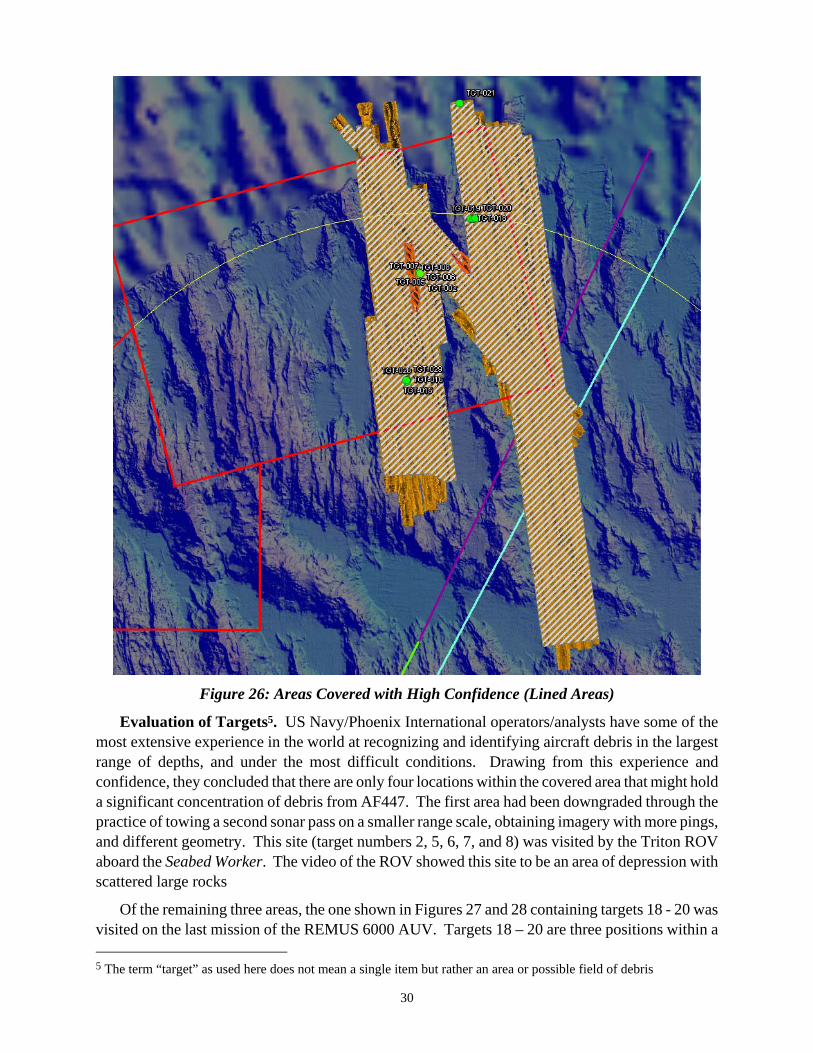
As a result of this careful monitoring, reviewing, and detailed analysis, US Navy/Phoenix International operators/analysts evaluated the 1743 km2 shown with cross hatching in Figure 26 as having been covered with the highest degree of confidence. Two patches of bottom, located in the peaks of some of the steepest slopes in which ORION operated, were un-interpretable, and were subsequently covered using a shorter range scale by REMUS 6000 AUVs. These are shown as the grey areas inside the orange region in Figure 25.
In the high confidence areas of Figure 26, we have attributed a detection probability of 0.90. For the rest of the ORION search area we have set the detection probability equal to 0.50 with the exception of the ridge area shown in Figure 25. This area received a 0.10 detection probability.
4 The material in this section is based on reference [13].
29
Figure 25. Search Areas for ORION (orange) and Remus/Triton (grey)
LKP
40 NM circle
Ridge Area
30
Figure 26: Areas Covered with High Confidence (Lined Areas)
Evaluation of Targets5. US Navy/Phoenix International operators/analysts have some of the most extensive experience in the world at recognizing and identifying aircraft debris in the largest range of depths, and under the most difficult conditions. Drawing from this experience and confidence, they concluded that there are only four locations within the covered area that might hold a significant concentration of debris from AF447. The first area had been downgraded through the practice of towing a second sonar pass on a smaller range scale, obtaining imagery with more pings, and different geometry. This site (target numbers 2, 5, 6, 7, and 8) was visited by the Triton ROV aboard the Seabed Worker. The video of the ROV showed this site to be an area of depression with scattered large rocks
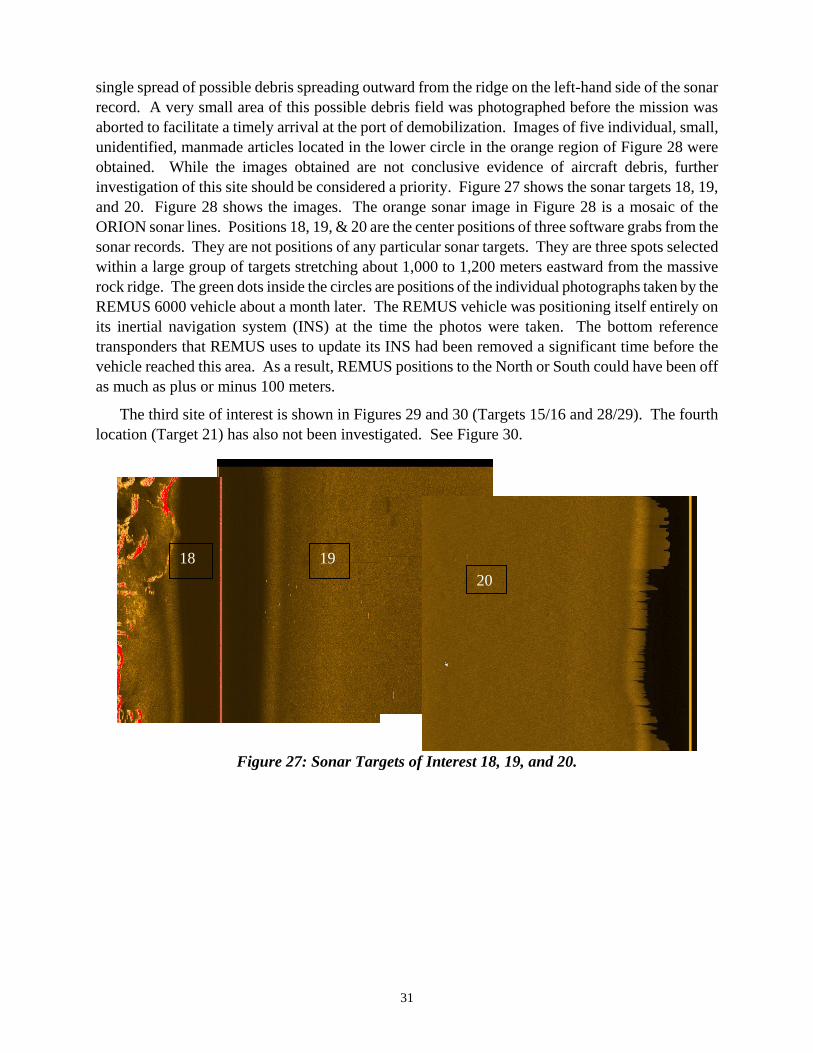
Of the remaining three areas, the one shown in Figures 27 and 28 containing targets 18 - 20 was visited on the last mission of the REMUS 6000 AUV. Targets 18 – 20 are three positions within a 5 The term “target” as used here does not mean a single item but rather an area or possible field of debris
31
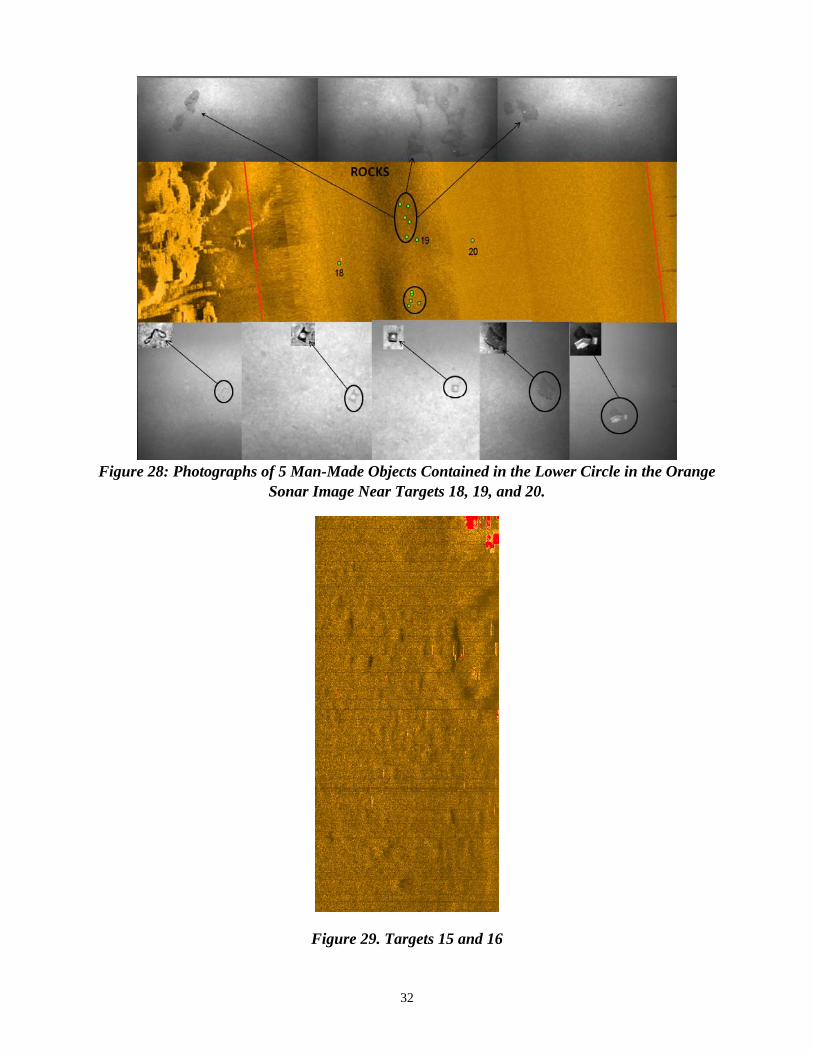
single spread of possible debris spreading outward from the ridge on the left-hand side of the sonar record. A very small area of this possible debris field was photographed before the mission was aborted to facilitate a timely arrival at the port of demobilization. Images of five individual, small, unidentified, manmade articles located in the lower circle in the orange region of Figure 28 were obtained. While the images obtained are not conclusive evidence of aircraft debris, further investigation of this site should be considered a priority. Figure 27 shows the sonar targets 18, 19, and 20. Figure 28 shows the images. The orange sonar image in Figure 28 is a mosaic of the ORION sonar lines. Positions 18, 19, & 20 are the center positions of three software grabs from the sonar records. They are not positions of any particular sonar targets. They are three spots selected within a large group of targets stretching about 1,000 to 1,200 meters eastward from the massive rock ridge. The green dots inside the circles are positions of the individual photographs taken by the REMUS 6000 vehicle about a month later. The REMUS vehicle was positioning itself entirely on its inertial navigation system (INS) at the time the photos were taken. The bottom reference transponders that REMUS uses to update its INS had been removed a significant time before the vehicle reached this area. As a result, REMUS positions to the North or South could have been off as much as plus or minus 100 meters.
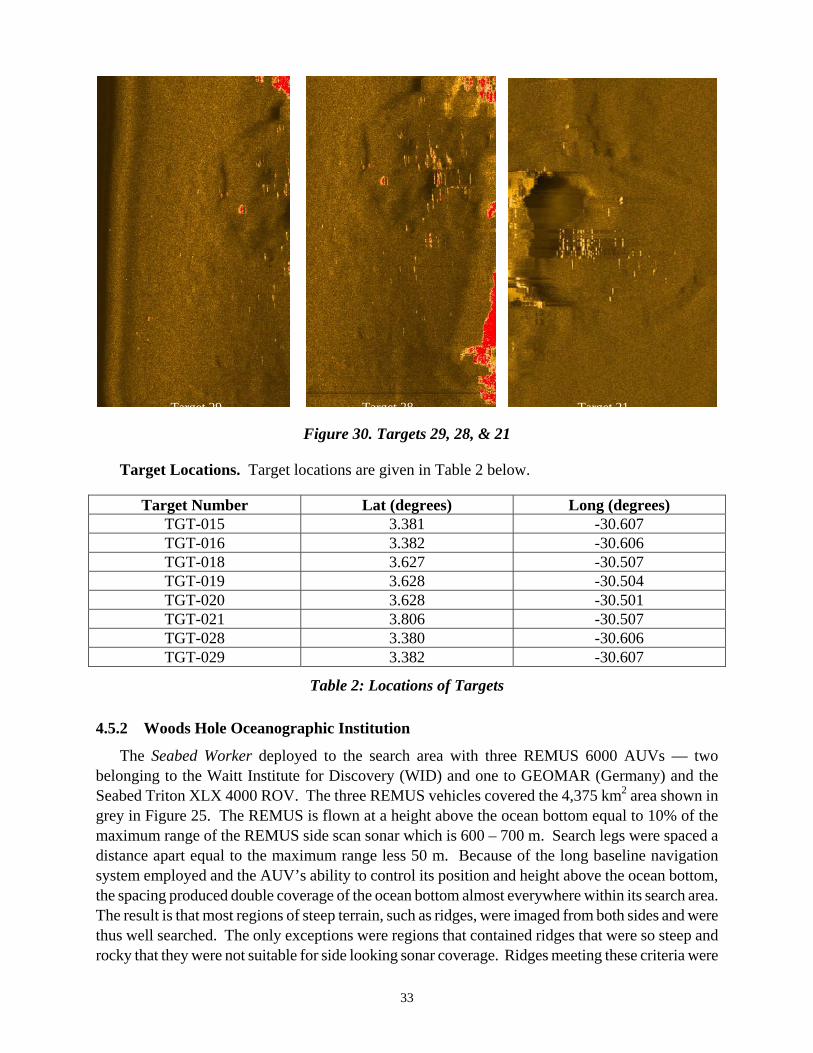
The third site of interest is shown in Figures 29 and 30 (Targets 15/16 and 28/29). The fourth location (Target 21) has also not been investigated. See Figure 30.
Figure 27: Sonar Targets of Interest 18, 19, and 20.
18 19 20
32
Figure 28: Photographs of 5 Man-Made Objects Contained in the Lower Circle in the Orange
Sonar Image Near Targets 18, 19, and 20.
Figure 29. Targets 15 and 16
33
Figure 30. Targets 29, 28, & 21
Target Locations. Target locations are given in Table 2 below.
Target Number Lat (degrees) Long (degrees) TGT-015 3.381 -30.607 TGT-016 3.382 -30.606 TGT-018 3.627 -30.507 TGT-019 3.628 -30.504 TGT-020 3.628 -30.501 TGT-021 3.806 -30.507 TGT-028 3.380 -30.606 TGT-029 3.382 -30.607
Table 2: Locations of Targets
4.5.2 Woods Hole Oceanographic Institution
The Seabed Worker deployed to the search area with three REMUS 6000 AUVs — two belonging to the Waitt Institute for Discovery (WID) and one to GEOMAR (Germany) and the Seabed Triton XLX 4000 ROV. The three REMUS vehicles covered the 4,375 km2 area shown in grey in Figure 25. The REMUS is flown at a height above the ocean bottom equal to 10% of the maximum range of the REMUS side scan sonar which is 600 – 700 m. Search legs were spaced a distance apart equal to the maximum range less 50 m. Because of the long baseline navigation system employed and the AUV’s ability to control its position and height above the ocean bottom, the spacing produced double coverage of the ocean bottom almost everywhere within its search area. The result is that most regions of steep terrain, such as ridges, were imaged from both sides and were thus well searched. The only exceptions were regions that contained ridges that were so steep and rocky that they were not suitable for side looking sonar coverage. Ridges meeting these criteria were
Target 28 Target 29 Target 21
34
located in cells 1, 19, 28, 29, and 36 shown in Figure 25. A small area in cell 20 was also not well covered. The Triton ROV was deployed in cells 21, 29, and 33. The deployments into cells 21 and 29 were made because of rough terrain. The deployment into cell 33 was made to investigate a target that turned out to be rocks.
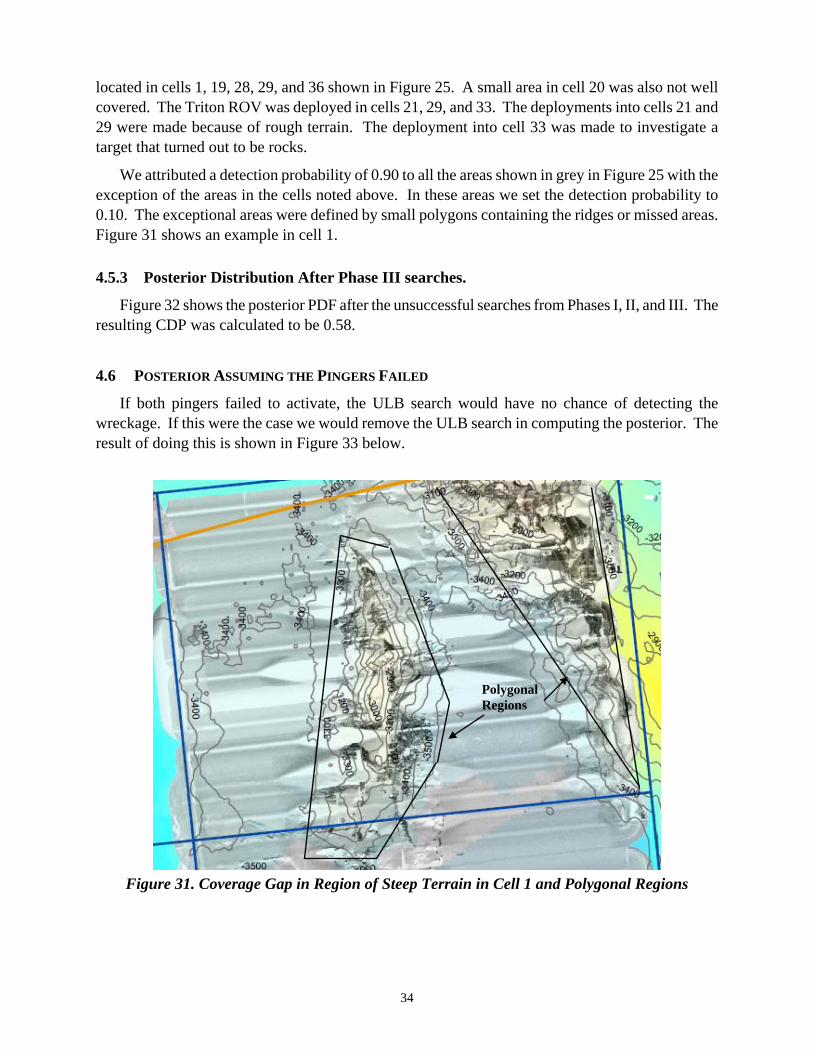
We attributed a detection probability of 0.90 to all the areas shown in grey in Figure 25 with the exception of the areas in the cells noted above. In these areas we set the detection probability to 0.10. The exceptional areas were defined by small polygons containing the ridges or missed areas. Figure 31 shows an example in cell 1.
4.5.3 Posterior Distribution After Phase III searches.
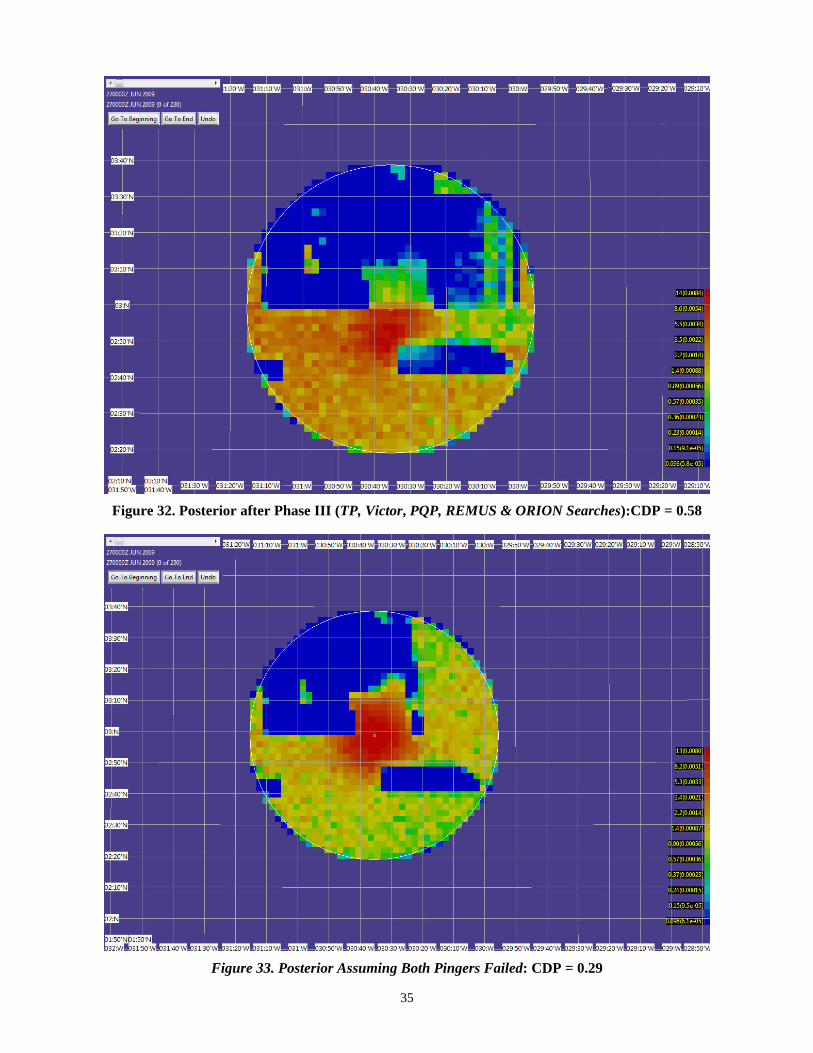
Figure 32 shows the posterior PDF after the unsuccessful searches from Phases I, II, and III. The resulting CDP was calculated to be 0.58.
4.6 POSTERIOR ASSUMING THE PINGERS FAILED
If both pingers failed to activate, the ULB search would have no chance of detecting the wreckage. If this were the case we would remove the ULB search in computing the posterior. The result of doing this is shown in Figure 33 below.
Figure 31. Coverage Gap in Region of Steep Terrain in Cell 1 and Polygonal Regions
Polygonal Regions
35
Figure 32. Posterior after Phase III (TP, Victor, PQP, REMUS & ORION Searches):CDP = 0.58
Figure 33. Posterior Assuming Both Pingers Failed: CDP = 0.29
36
5 CONCLUSIONS AND RECOMMENDATIONS
Our approach used careful and methodical consideration of all data available, with associated uncertainties, to form an analytic assessment of the highest likelihood areas for future search efforts. Our weighted scenario approach allowed inconsistent information (RD predictions and FD considerations) to be combined with subjective weights that capture the confidence (or lack thereof) in each piece of data. The careful analysis of the detection effectiveness of each component of the search and the resulting accounting for this search by calculating the Bayesian posterior distribution on the impact location shown in Figure 32 forms a solid basis for planning the next increment of search.
In spite the substantial search efforts employed in phases I – III, the large uncertainty in the location of crash and the difficulties of performing underwater search in a remote area have combined to produce an overall effort that has effectively searched only 58% of the prior. This means substantial additional effort will be required to insure a high probability of success.
Caveat: We note that Figure 32 and the resulting CDP of 0.58 assume the ULBs were working during the Fairmount TPL searches. If the ULBs were indeed damaged in the impact and not functioning, the TPL search would have yielded no new information. This would substantially change the resulting posterior and the ensuing recommendations. The resulting posterior would become the one shown in Figure 33 and the CDP for the total search effort would drop to 0.29.
Recommendations. There were targets identified by US Navy/Phoenix International personnel that were suggestive of debris but were not investigated. In particular the targets listed in Table 2 should be investigated at the next increment of search effort to remove any doubts as to their nature.
One the major causes of uncertainty in the location of the wreck is the lack of good ocean current data in the vicinity of crash for the days 1 – 10 June 2009. Bodies and debris were recovered from June 6 -10. Detailed and accurate knowledge of currents would have us allowed to perform a reverse drift analysis that might have substantially reduced the uncertainty in the wreck location. Because of the large uncertainties in our knowledge of the currents, our reverse drift analysis was not able to provide the localization information that it often can. This leads to our recommendation that in future maritime searches, SLDMBs be deployed in a timely fashion and in sufficient numbers to provide good surface current estimates, particularly in remote locations. This is the practice of the US Coast Guard.
6 ACKNOWLEDGEMENTS
The authors would like to gratefully acknowledge John R. Frost and Arthur A. Allen of the US Coast Guard for their critical (volunteer) support and the operational and technical knowledge they contributed to this analysis.
37
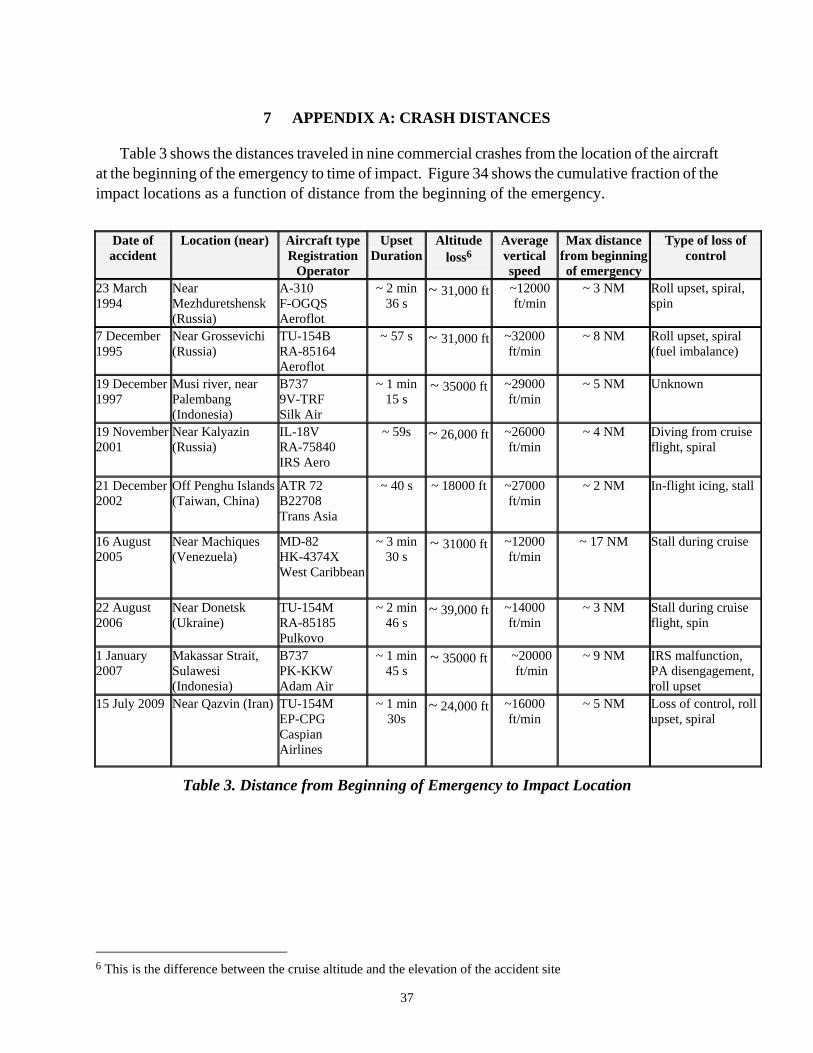
7 APPENDIX A: CRASH DISTANCES
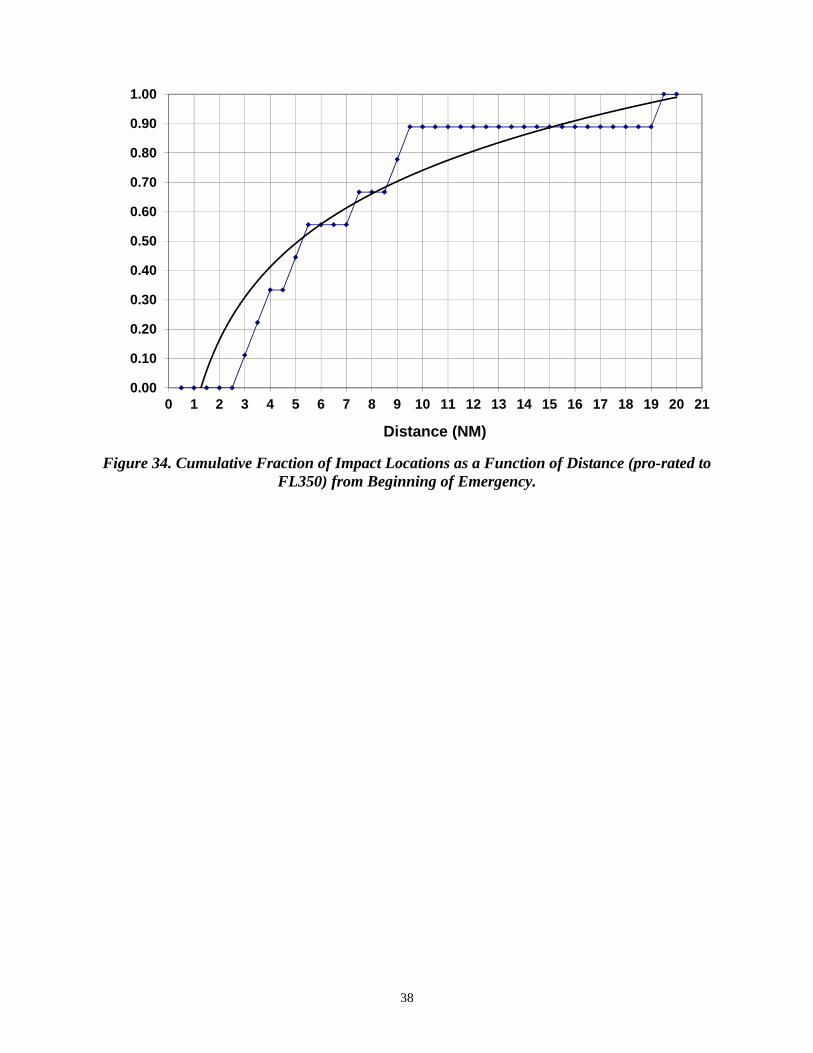
Table 3 shows the distances traveled in nine commercial crashes from the location of the aircraft at the beginning of the emergency to time of impact. Figure 34 shows the cumulative fraction of the impact locations as a function of distance from the beginning of the emergency.
Date of accident
Location (near) Aircraft type Registration
Operator
Upset Duration
Altitude loss6
Average vertical speed
Max distance from beginning of emergency
Type of loss of control
23 March 1994
Near Mezhduretshensk (Russia)
A-310 F-OGQS Aeroflot
~ 2 min 36 s
~ 31,000 ft ~12000 ft/min
~ 3 NM Roll upset, spiral, spin
7 December 1995
Near Grossevichi (Russia)
TU-154B RA-85164 Aeroflot
~ 57 s ~ 31,000 ft ~32000 ft/min
~ 8 NM Roll upset, spiral (fuel imbalance)
19 December 1997
Musi river, near Palembang (Indonesia)
B737 9V-TRF Silk Air
~ 1 min 15 s
~ 35000 ft ~29000 ft/min
~ 5 NM Unknown
19 November 2001
Near Kalyazin (Russia)
IL-18V RA-75840 IRS Aero
~ 59s ~ 26,000 ft ~26000 ft/min
~ 4 NM Diving from cruise flight, spiral
21 December 2002
Off Penghu Islands (Taiwan, China)
ATR 72 B22708 Trans Asia
~ 40 s ~ 18000 ft ~27000 ft/min
~ 2 NM In-flight icing, stall
16 August 2005
Near Machiques (Venezuela)
MD-82 HK-4374X West Caribbean
~ 3 min 30 s
~ 31000 ft ~12000 ft/min
~ 17 NM Stall during cruise
22 August 2006
Near Donetsk (Ukraine)
TU-154M RA-85185 Pulkovo
~ 2 min 46 s
~ 39,000 ft ~14000 ft/min
~ 3 NM Stall during cruise flight, spin
1 January 2007
Makassar Strait, Sulawesi (Indonesia)
B737 PK-KKW Adam Air
~ 1 min 45 s
~ 35000 ft ~20000ft/min
~ 9 NM IRS malfunction, PA disengagement, roll upset
15 July 2009 Near Qazvin (Iran) TU-154M EP-CPG Caspian Airlines
~ 1 min 30s
~ 24,000 ft ~16000 ft/min
~ 5 NM Loss of control, roll upset, spiral
Table 3. Distance from Beginning of Emergency to Impact Location
6 This is the difference between the cruise altitude and the elevation of the accident site
38
0.00
0.10
0.20
0.30
0.40
0.50
0.60
0.70
0.80
0.90
1.00
0 1 2 3 4 5 6 7 8 9 10 11 12 13 14 15 16 17 18 19 20 21
Distance (NM) Figure 34. Cumulative Fraction of Impact Locations as a Function of Distance (pro-rated to
FL350) from Beginning of Emergency.
39
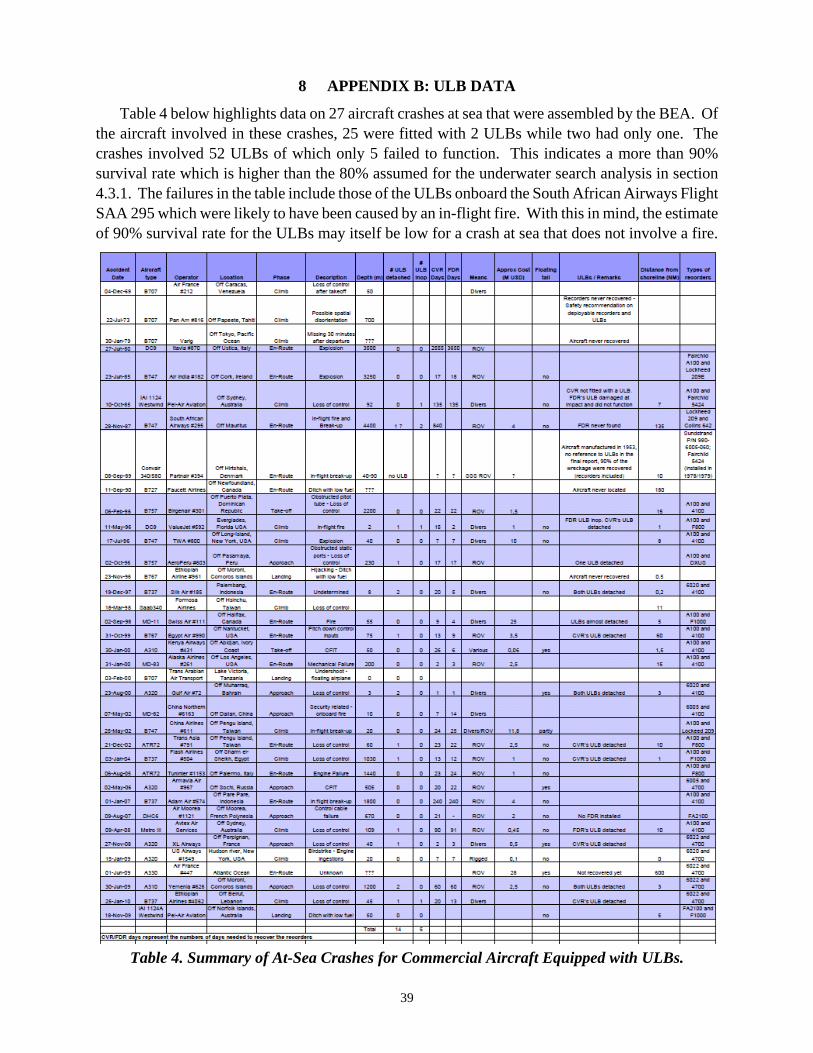
8 APPENDIX B: ULB DATA
Table 4 below highlights data on 27 aircraft crashes at sea that were assembled by the BEA. Of the aircraft involved in these crashes, 25 were fitted with 2 ULBs while two had only one. The crashes involved 52 ULBs of which only 5 failed to function. This indicates a more than 90% survival rate which is higher than the 80% assumed for the underwater search analysis in section 4.3.1. The failures in the table include those of the ULBs onboard the South African Airways Flight SAA 295 which were likely to have been caused by an in-flight fire. With this in mind, the estimate of 90% survival rate for the ULBs may itself be low for a crash at sea that does not involve a fire.
Table 4. Summary of At-Sea Crashes for Commercial Aircraft Equipped with ULBs.
40
9 REFERENCES
[1] Henry R. Richardson and Lawrence D. Stone, Daniel H. Wagner Associates, “Operations Analysis During the Underwater Search for Scorpion,” Naval Research Logistics Quarterly Vol 18 No 2 June 1971.
[2] Lawrence D. Stone, Metron Inc. “Search for the SS Central America: Mathematical Treasure Hunting,” Interfaces 22: January – February 1992.
[3] Colleen M. Keller, Mark A. Anderson, Metron Inc, Applying Optimal Search Theory to Inland SAR: Steve Fossett Case Study, October 2008.
[4] User manual for USCG SAROPS (2006) (1.0.0 ed.): Northrop Grumman Mission Systems
[5] Interim Report n°1 on the accident on 1st June 2009 to the Airbus A330-203 registered F-GZCP operated by Air France, flight AF 447 Rio de Janeiro – Paris by Bureau d’Enquêtes et d’Analyses, 2 July 2009 (available at http://www.bea.aero/en/enquetes/flight.af.447/flight.af.447.php).
[6] AF447 Flight Path Analysis, BEA briefing, July 27, 2010.
[7] Presentation MAK AF447 Briefing, Russian Interstate Aviation Group, 16 October 2009.
[8] Estimating the Wreckage Location of the Rio-Paris AF447, Report from the Drift Group to BEA, June 30, 2010.
[9] “Field Determination of the Leeway of WWII L-Mk2 Mine, 14-foot open skiff, a Sunfish sailboat, a 20-foot full sized shipping container, and PIW in the deceased position”. Fedje and Andfjord, Norway, September 2009 by: Arthur Allen (US Coast Guard), Jens-Christian Roth (Royal Norwegian Navy), Christophe Maisondieu (IFREMER), Øyvind Breivik (Norwegian Met. Office), and Bertrand Forest (IFREMER)
[10] Allen, A. and J-C Roth, C. Maisondieu, Ø. Breivik, and B. Forest, "Field Determination of the Leeway of WWII L-Mk2 Mine, 14-foot open skiff, a Sunfish sailboat, a 20-foot full sized shipping container, and PIW in the deceased position,” Fedje and Andfjord, Norway, September 2009" Norwegian Meteorological Institute (In preparation.)
[11] FAA Advisory Circular 21.10A, Flight Recorder and Cockpit Voice Recorder Underwater Locating Devices, 19 April 1993.
[12] “Estimation of the Index of Confidence for the Zone Covered by the SAR Towed Side-Scan Sonar” IFREMER July 2010.
[13] “Confidence Level for the Area Covered by ORION during Phase III of the Search for Air France AF447.” Phoenix International, July 2010.
[14] Interim Report n°2 on the accident on 1st June 2009 to Airbus A330-203 registered F-GZCP operated by Air France, flight AF 447 Rio de Janeiro – Paris by Bureau d’Enquêtes et d’Analyses, , 17 December 2009 (available at http://www.bea.aero/en/enquetes/flight.af.447/flight.af.447.php).