Embed Size (px)
Citation preview
Search for Gravitational Waves fromInspiraling Compact Binaries : Data analysis
Hirotaka Takahashi(Osaka University /YITP /Niigata University)
and the TAMA Collaboration
Contents
1. Introduction2. Search methods
Matched Filtering
3. Search resultsCompare DT6 results and DT8 results
statisticsUpper limit to the events rate
4. Summary
2χ̂
2ˆ/ρ χ
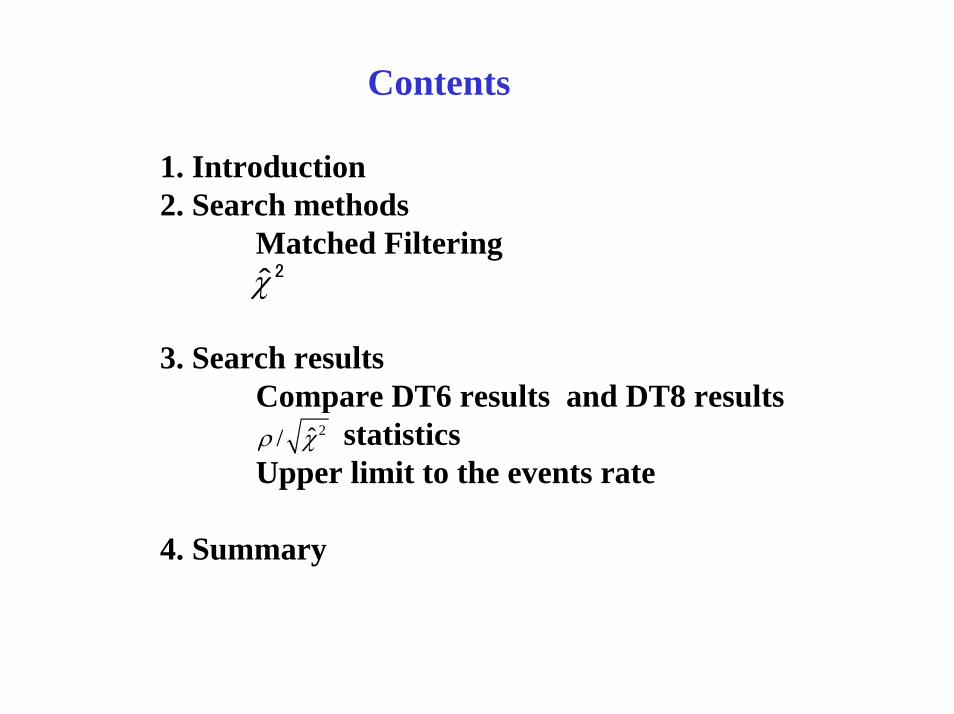
Introduction
Gravitational waves(Coalescences of compact binaries, Stellar core collapses)
Change in distance between free masses(Strain about 10-18)
Detection method
Gravitational WavesPrecise measurement by a laser interferometer
(Mirrors behave as free masses)
Michelson interferometer
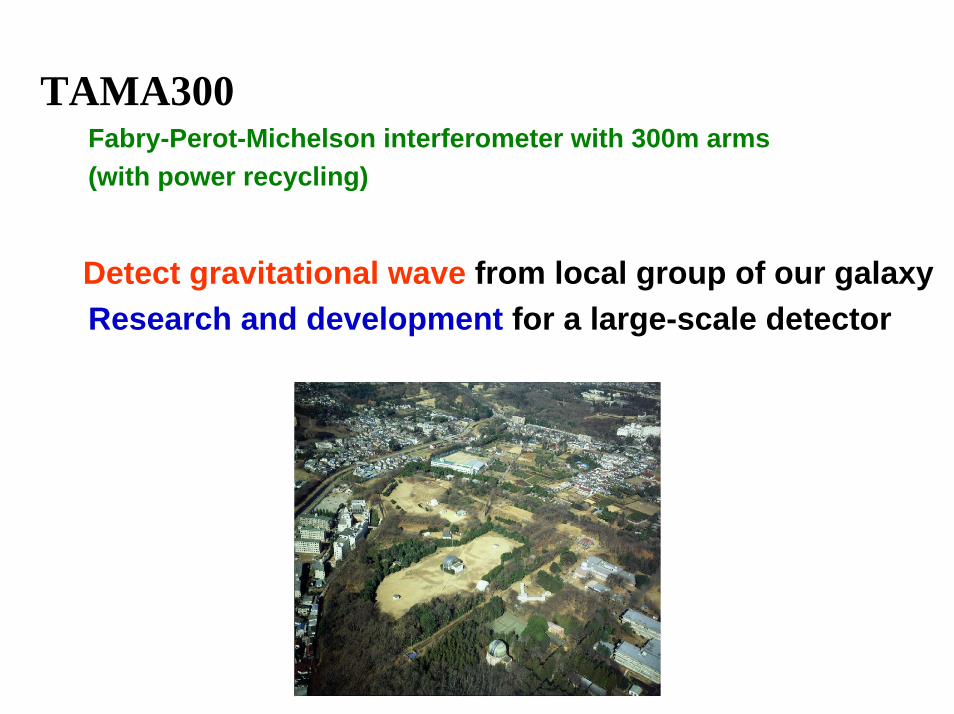
TAMA300Fabry-Perot-Michelson interferometer with 300m arms(with power recycling)
Detect gravitational wave from local group of our galaxyResearch and development for a large-scale detector
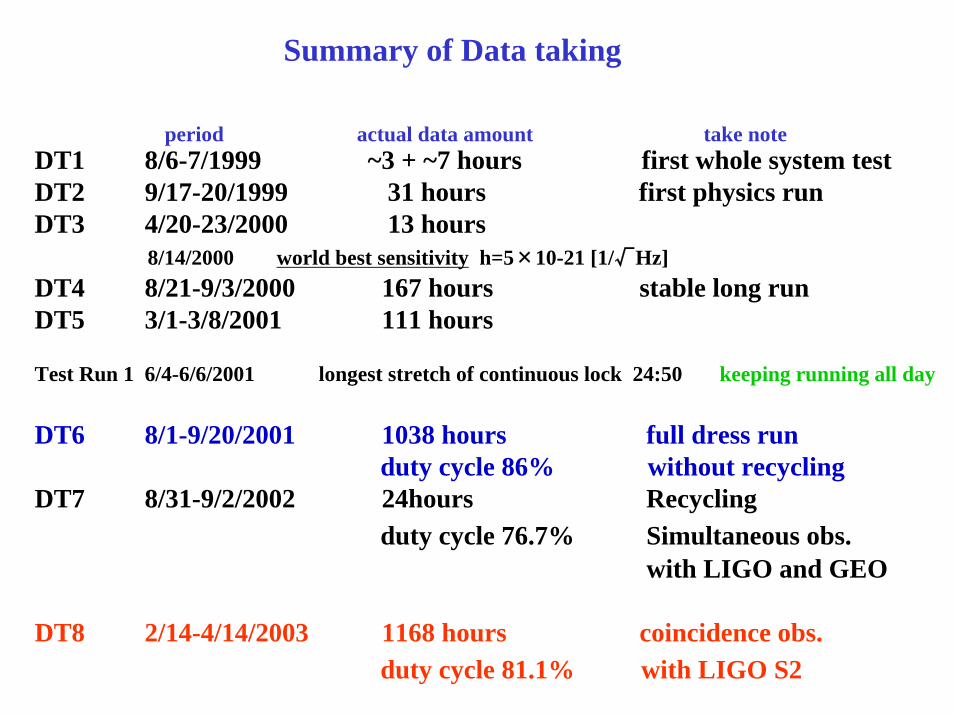
Summary of Data taking
DT1 8/6-7/1999 ~3 + ~7 hours first whole system testDT2 9/17-20/1999 31 hours first physics runDT3 4/20-23/2000 13 hours
8/14/2000 world best sensitivity h=5×10-21 [1/√Hz]DT4 8/21-9/3/2000 167 hours stable long runDT5 3/1-3/8/2001 111 hours
Test Run 1 6/4-6/6/2001 longest stretch of continuous lock 24:50 keeping running all day
DT6 8/1-9/20/2001 1038 hours full dress runduty cycle 86% without recycling
DT7 8/31-9/2/2002 24hours Recyclingduty cycle 76.7% Simultaneous obs.
with LIGO and GEO
DT8 2/14-4/14/2003 1168 hours coincidence obs.duty cycle 81.1% with LIGO S2
period actual data amount take note
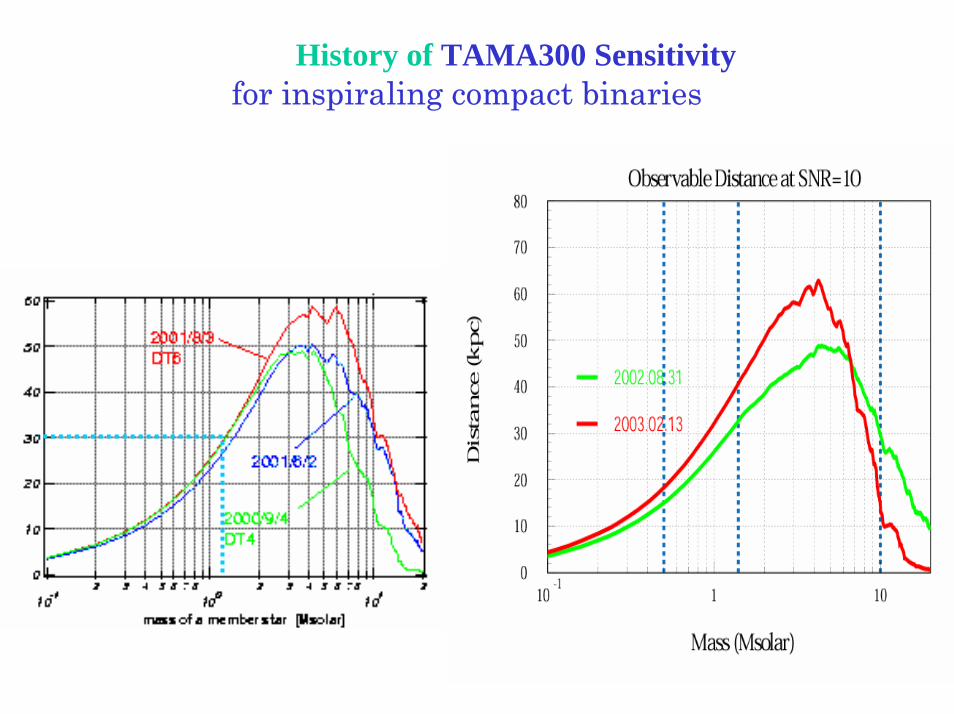
History of TAMA300 Sensitivityfor inspiraling compact binaries
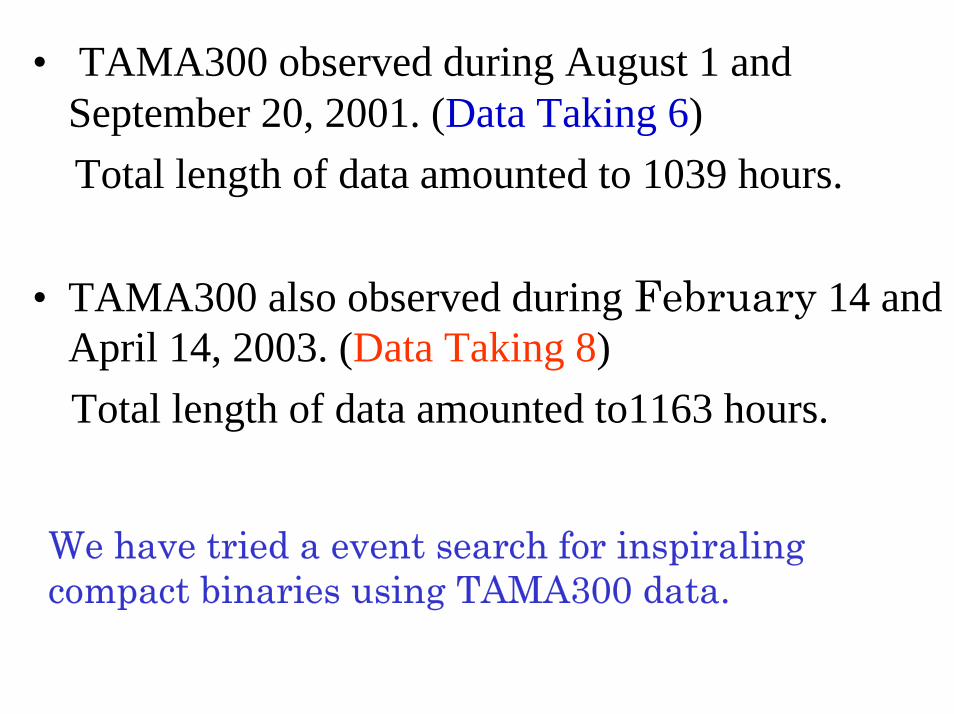
• TAMA300 observed during August 1 and September 20, 2001. (Data Taking 6) Total length of data amounted to 1039 hours.
• TAMA300 also observed during February 14 and April 14, 2003. (Data Taking 8) Total length of data amounted to1163 hours.
We have tried a event search for inspiraling compact binaries using TAMA300 data.
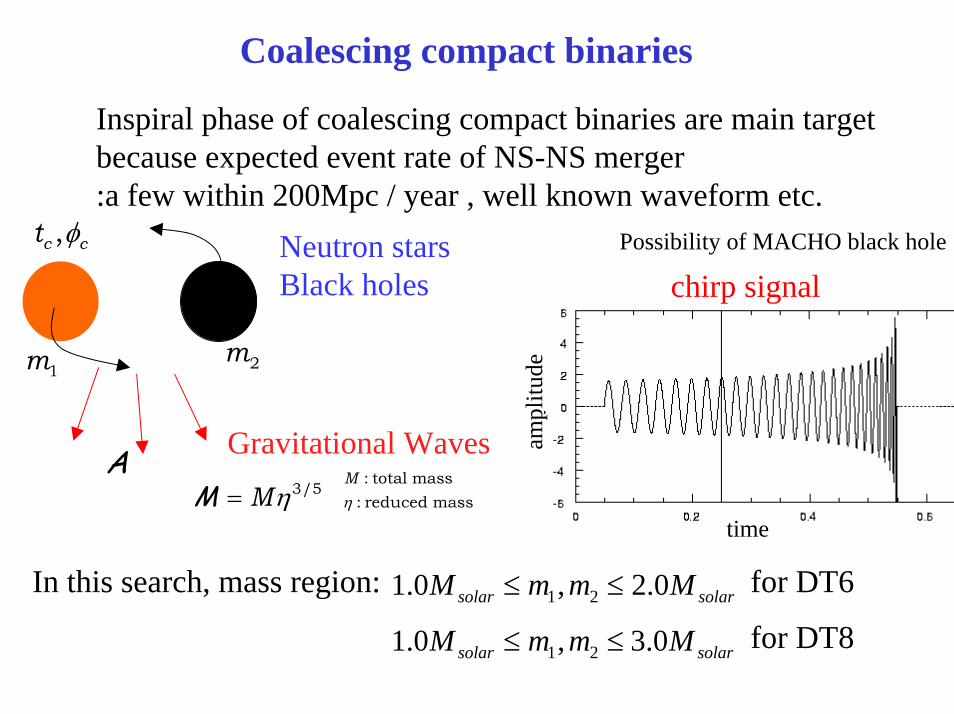
Coalescing compact binaries
Gravitational Waves
Neutron starsBlack holes
Inspiral phase of coalescing compact binaries are main target because expected event rate of NS-NS merger :a few within 200Mpc / year , well known waveform etc.
Possibility of MACHO black hole
chirp signal
ampl
itude
time
1m 2m
,c ct φ
A3/5Mη=M
: total mass: reduced mass
Mη
In this search, mass region: 1 21.0 , 2.0≤ ≤solar solarM m m M for DT6
1 21.0 , 3.0≤ ≤solar solarM m m M for DT8
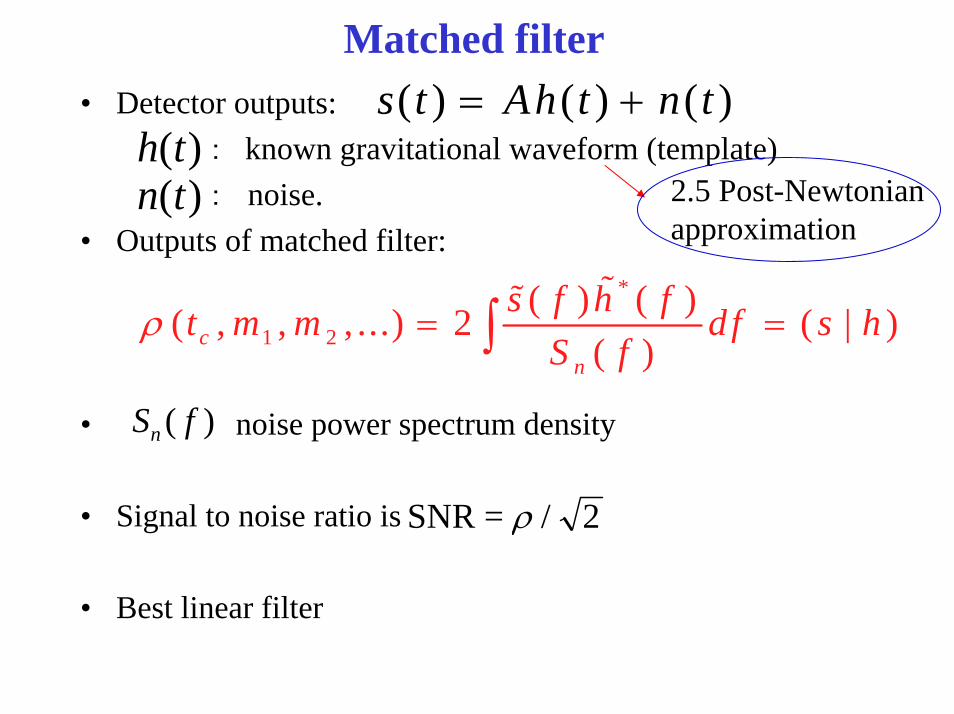
Matched filter• Detector outputs:
: known gravitational waveform (template): noise.
• Outputs of matched filter:
• noise power spectrum density
• Signal to noise ratio is
• Best linear filter
s t Ah t n t( ) ( ) ( )= +h t( )n t( )
*
1 2( ) ( )( , , , ...) 2 ( | )
( )ρ = =∫
%%c
n
s f h ft m m df s hS f
SNR = /ρ 2
2.5 Post-Newtonian approximation
( )nS f
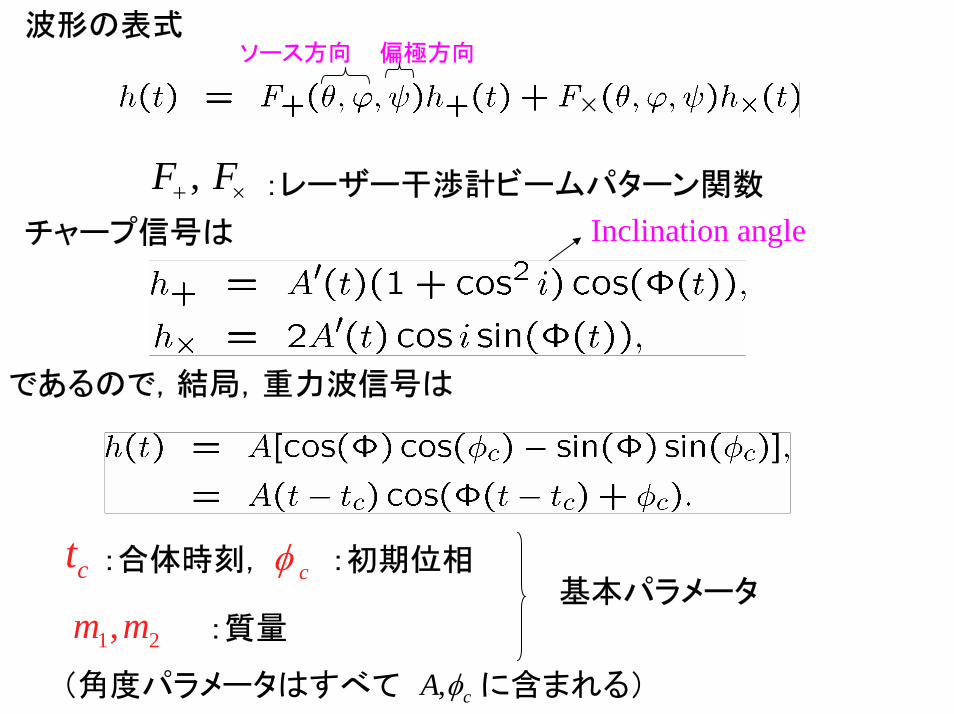
波形の表式ソース方向 偏極方向
,F F+ × :レーザー干渉計ビームパターン関数
Inclination angleチャープ信号は
であるので,結局,重力波信号は
ct :合体時刻, :初期位相cφ
1 2,m m :質量基本パラメータ
(角度パラメータはすべて に含まれる), cA φ
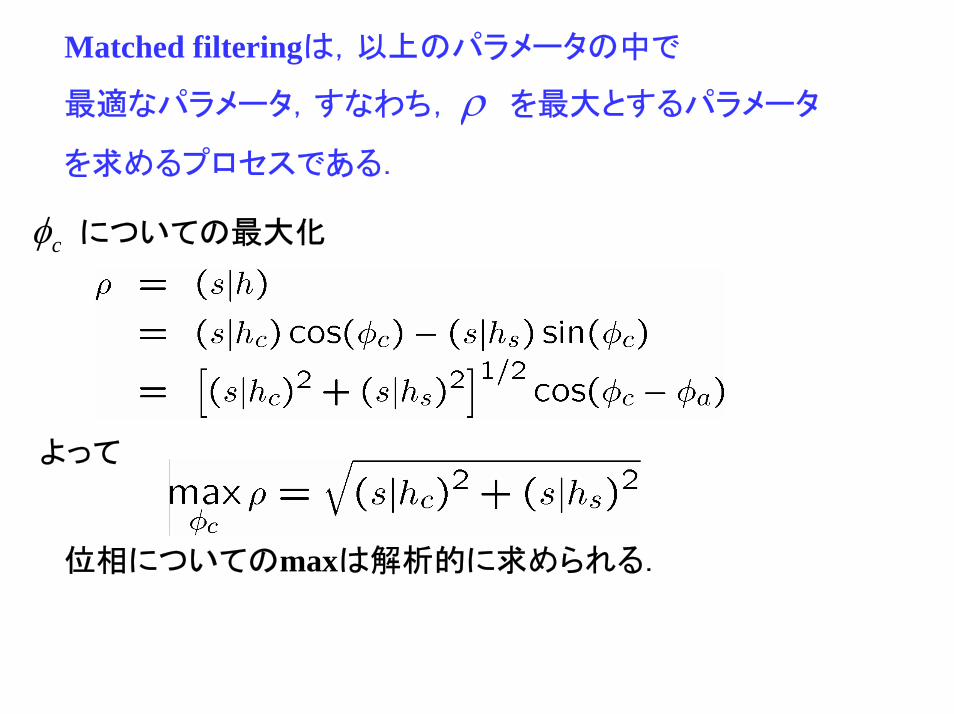
Matched filteringは,以上のパラメータの中で
最適なパラメータ,すなわち, を最大とするパラメータ
を求めるプロセスである.
ρ
cφ についての最大化
よって
位相についてのmaxは解析的に求められる.
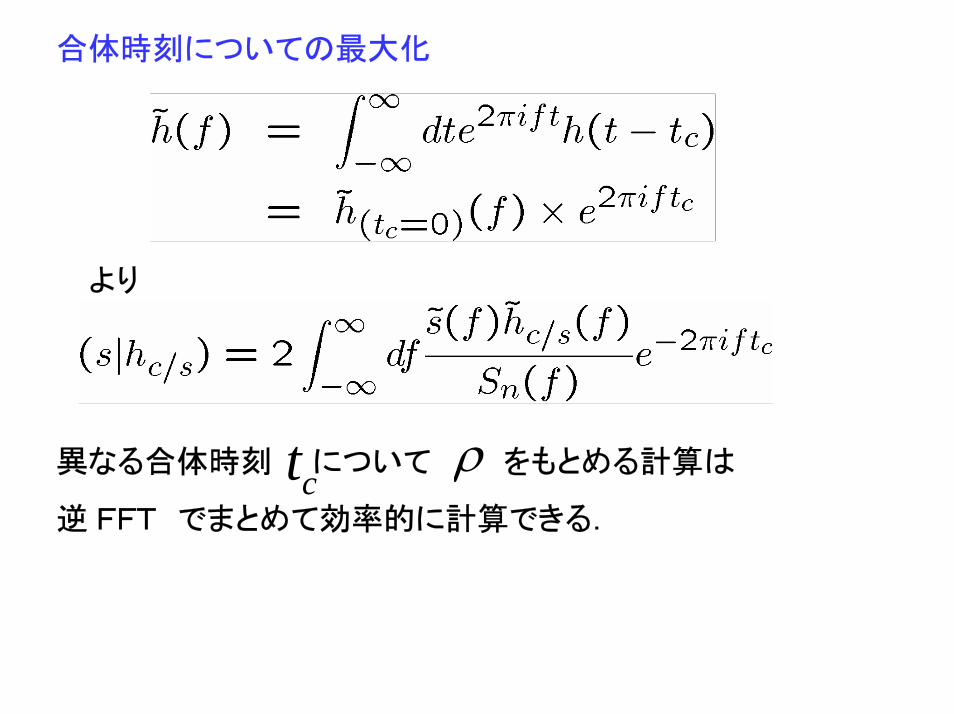
合体時刻についての最大化
より
異なる合体時刻 について をもとめる計算は
逆 FFT でまとめて効率的に計算できる.
ρct
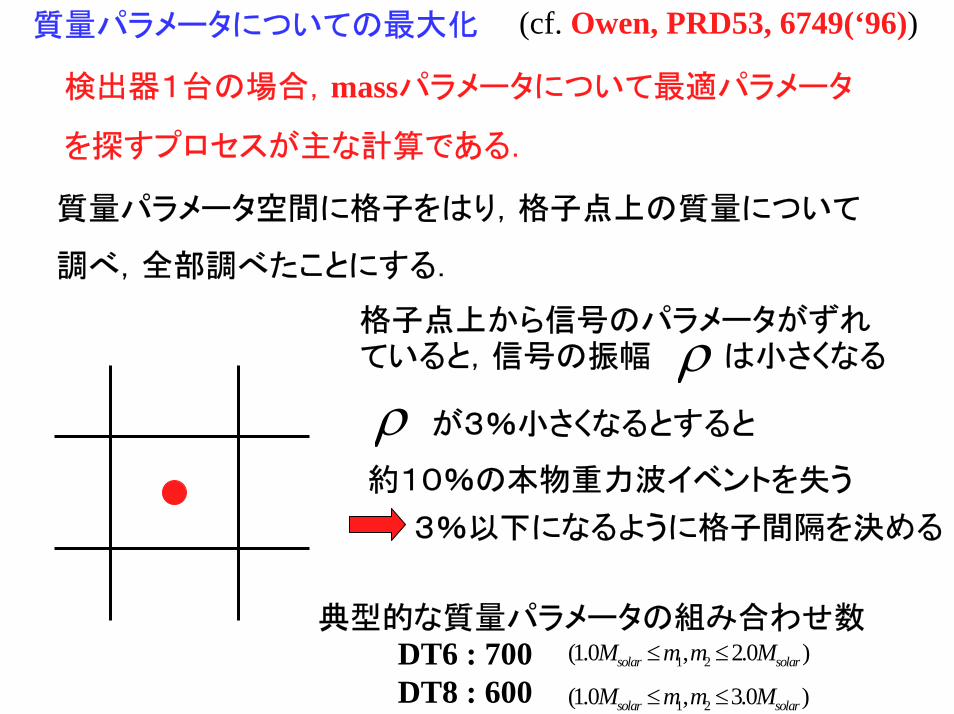
(cf. Owen, PRD53, 6749(‘96))質量パラメータについての最大化
検出器1台の場合,massパラメータについて最適パラメータ
を探すプロセスが主な計算である.
質量パラメータ空間に格子をはり,格子点上の質量について
調べ,全部調べたことにする.
格子点上から信号のパラメータがずれていると,信号の振幅 は小さくなるρρ が3%小さくなるとすると
約10%の本物重力波イベントを失う
3%以下になるように格子間隔を決める
典型的な質量パラメータの組み合わせ数DT6 : 700 DT8 : 600
1 2(1.0 , 2.0 )≤ ≤solar solarM m m M
1 2(1.0 , 3.0 )≤ ≤solar solarM m m M
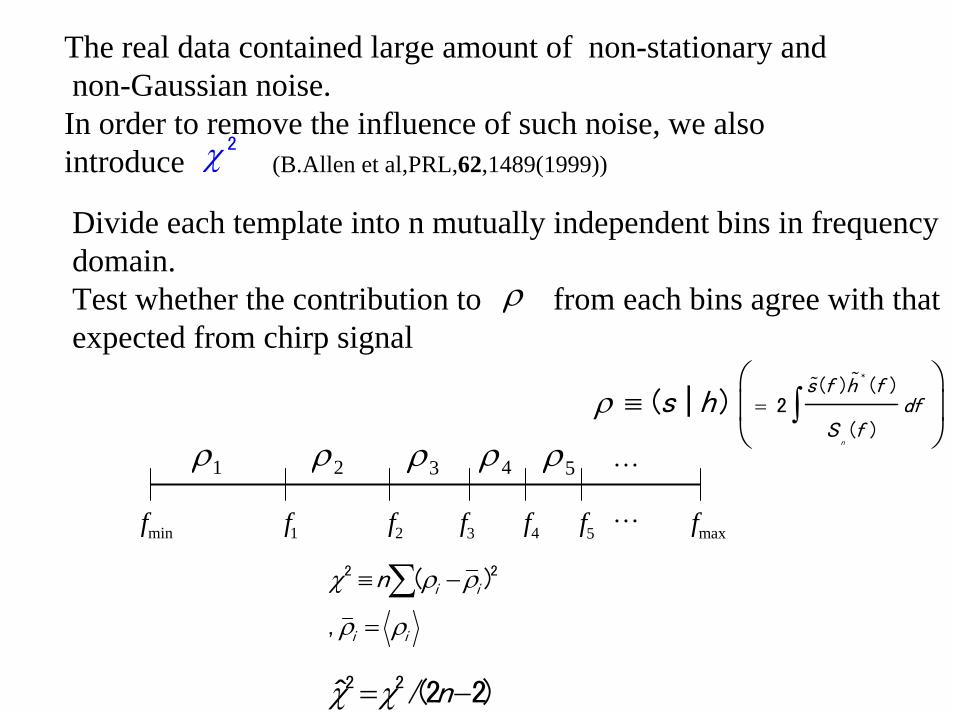
The real data contained large amount of non-stationary andnon-Gaussian noise.In order to remove the influence of such noise, we also introduce (B.Allen et al,PRL,62,1489(1999))
2χ
Divide each template into n mutually independent bins in frequency domain.Test whether the contribution to from each bins agree with that expected from chirp signal
ρ1 ρ2 ρ3 ρ4 ρ5 L
ρ
*
( ) ( )2
( )( | )
n
s f h fdf
S fs hρ =
⎛ ⎞≡ ⎜ ⎟
⎝ ⎠∫
%%
f3 f5 fmaxfmin f1 f2 f4 L
2 2( )
,
i i
i i
nχ ρ ρ
ρ ρ
≡ −
=
∑
2 2/(2 2)ˆ nχ χ= −
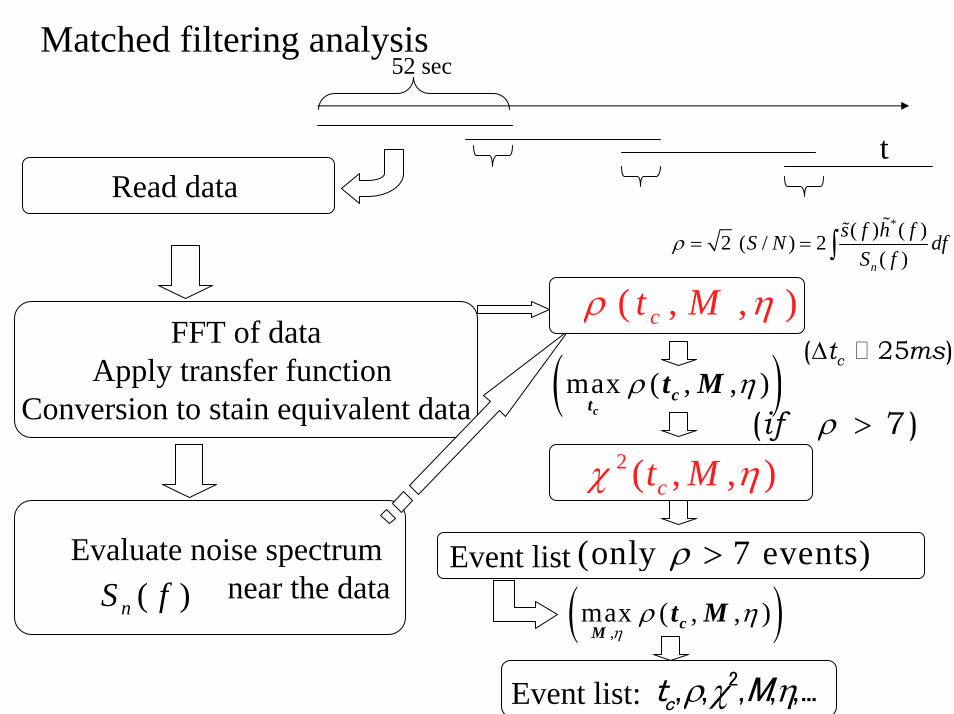
Matched filtering analysis
tRead data
FFT of dataApply transfer function
Conversion to stain equivalent data
Evaluate noise spectrum near the data( )nS f
( , , )ct Mρ η
( )max ( , , )ρ ηc
ctt M
∆( 25 )ct ms
52 sec
Event list (only 7 events)ρ >
2 ( , , )ct Mχ ηρ >( 7)if
( ),max ( , , )
ηρ ηcM
t M
*( ) ( )2 ( / ) 2( )
ρ = = ∫%%
n
s f h fS N dfS f
2, , , , ,...ct Mρ χ ηEvent list:
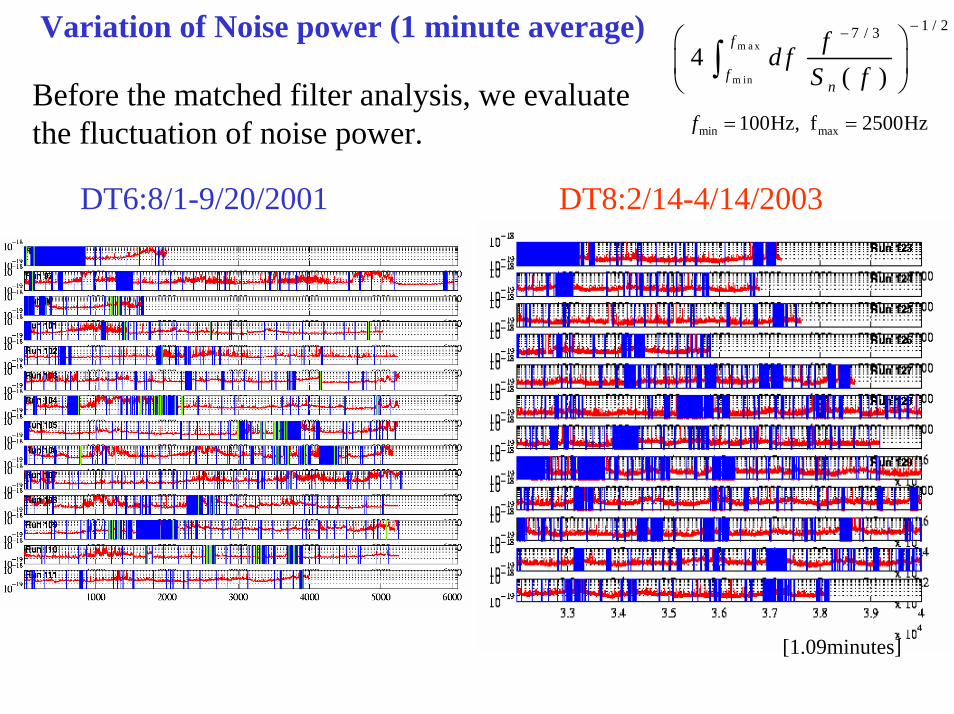
Variation of Noise power (1 minute average)m a x
m in
1 / 27 / 3
4( )
f
fn
fd fS f
−−⎛ ⎞⎜ ⎟⎝ ⎠∫
Before the matched filter analysis, we evaluate the fluctuation of noise power. min max100Hz, f 2500Hzf = =
DT6:8/1-9/20/2001 DT8:2/14-4/14/2003
[1.09minutes]
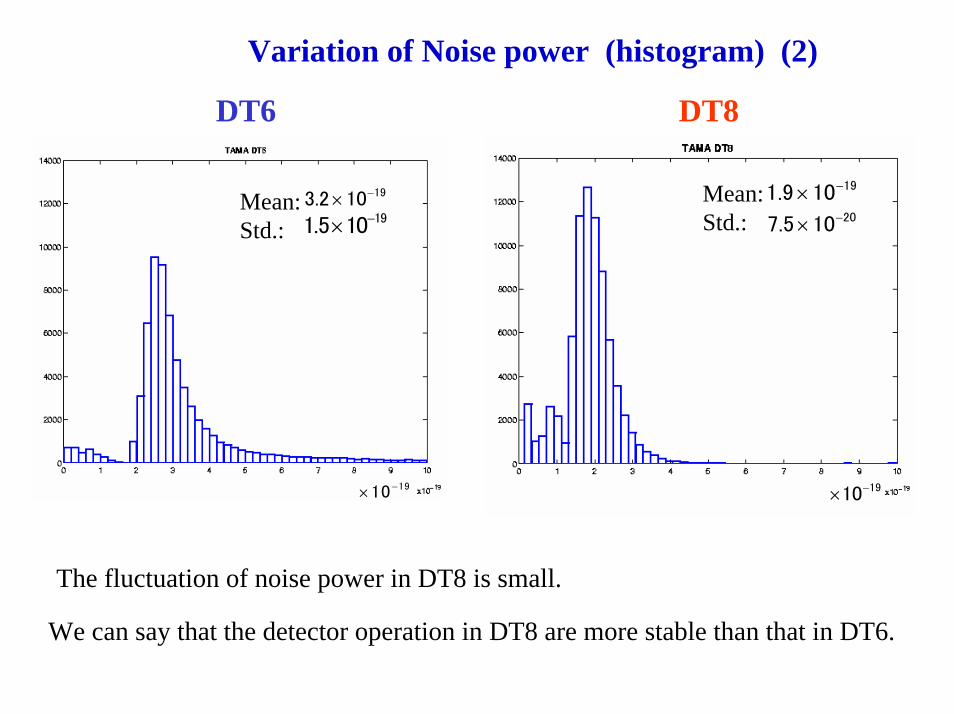
Variation of Noise power (histogram) (2)
DT6 DT8
Mean: Std.:
1910−×
191.9 10−×207.5 10−×
193.2 10−×191.5 10−×
Mean: Std.:
1910 −×
The fluctuation of noise power in DT8 is small.
We can say that the detector operation in DT8 are more stable than that in DT6.
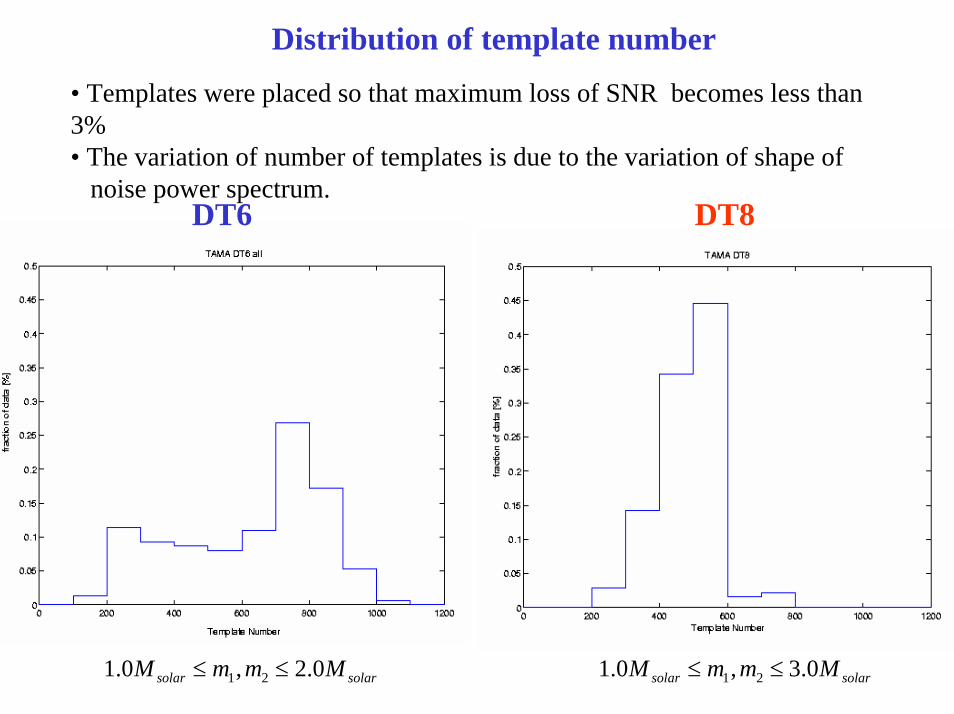
Distribution of template number
1 21.0 , 3.0≤ ≤solar solarM m m M1 21.0 , 2.0≤ ≤solar solarM m m M
DT6 DT8
• Templates were placed so that maximum loss of SNR becomes less than 3%• The variation of number of templates is due to the variation of shape of
noise power spectrum.
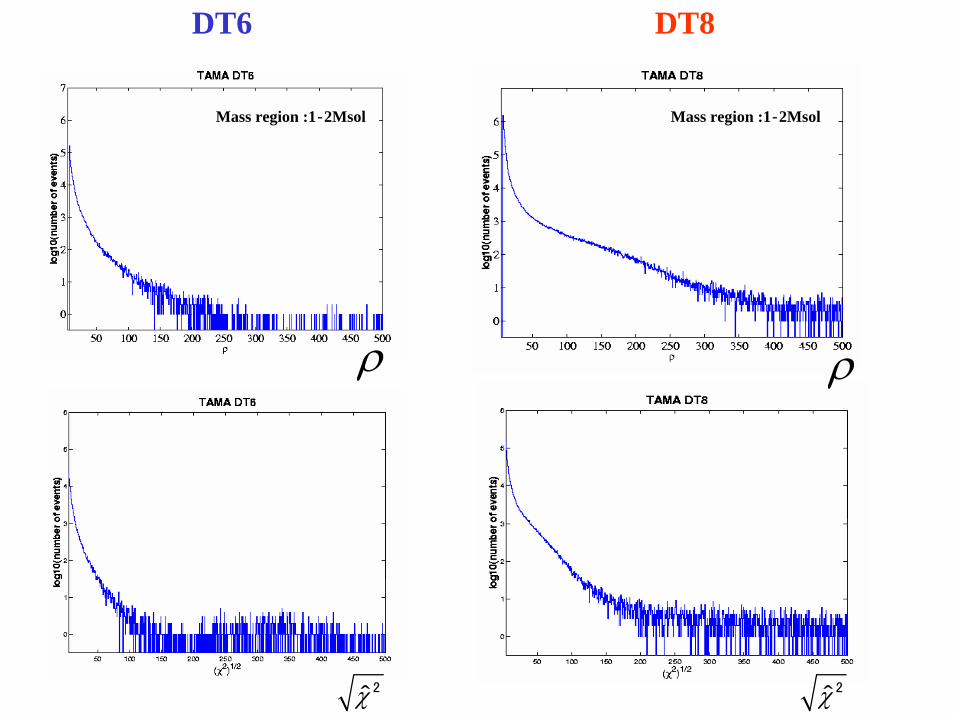
DT6 DT8
ρ
Mass region :1‐2Msol Mass region :1‐2Msol
ρ
2χ̂ 2χ̂
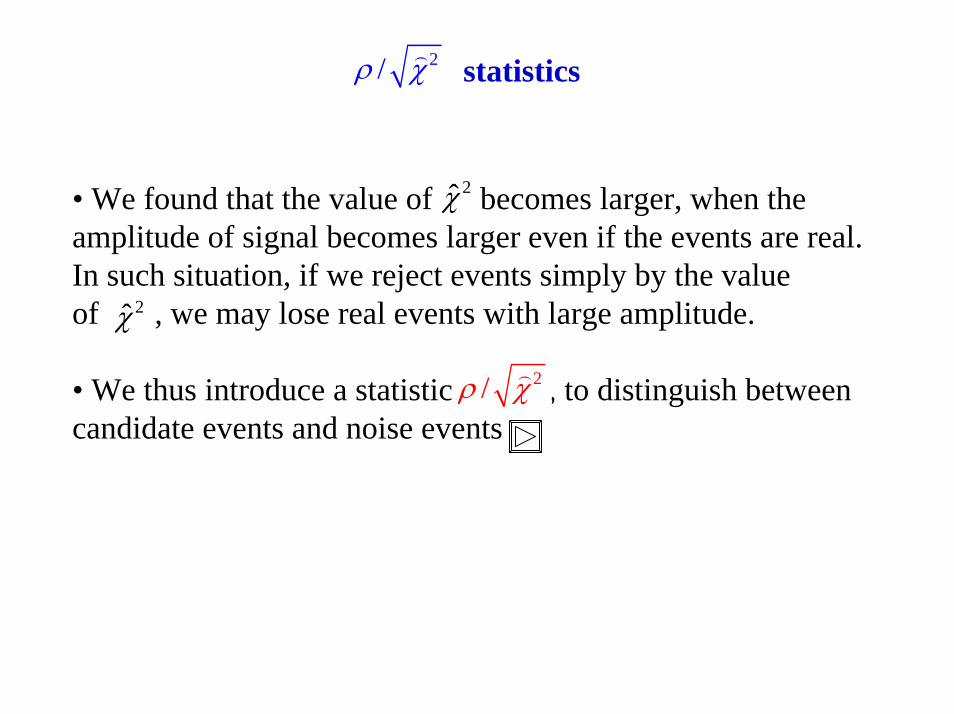
2/ρ χ) statistics
• We found that the value of becomes larger, when the amplitude of signal becomes larger even if the events are real.In such situation, if we reject events simply by the value of , we may lose real events with large amplitude.
• We thus introduce a statistic , to distinguish between candidate events and noise events
2/ρ χ)
2χ̂
2χ̂
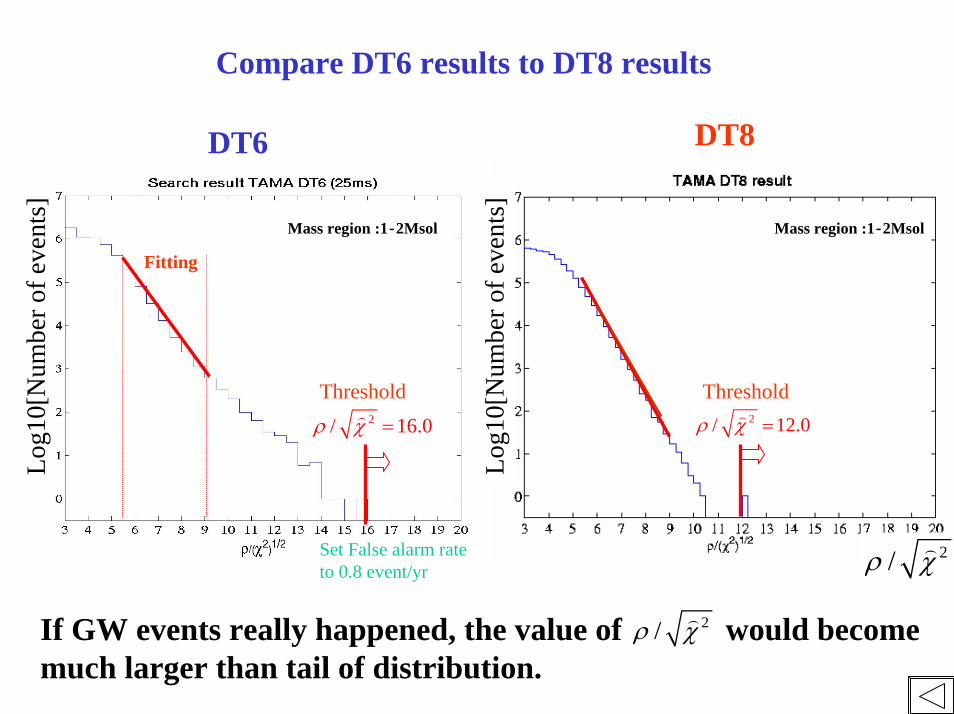
Compare DT6 results to DT8 results
DT8DT6
Log1
0[N
umbe
r of e
vent
s]
Log1
0[N
umbe
r of e
vent
s]
2/ρ χ)
Mass region :1‐2MsolMass region :1‐2Msol
2/ 16.0ρ χ =) 2/ 12.0ρ χ =)Threshold Threshold
Fitting
Set False alarm rate to 0.8 event/yr
If GW events really happened, the value of would becomemuch larger than tail of distribution.
2/ρ χ)
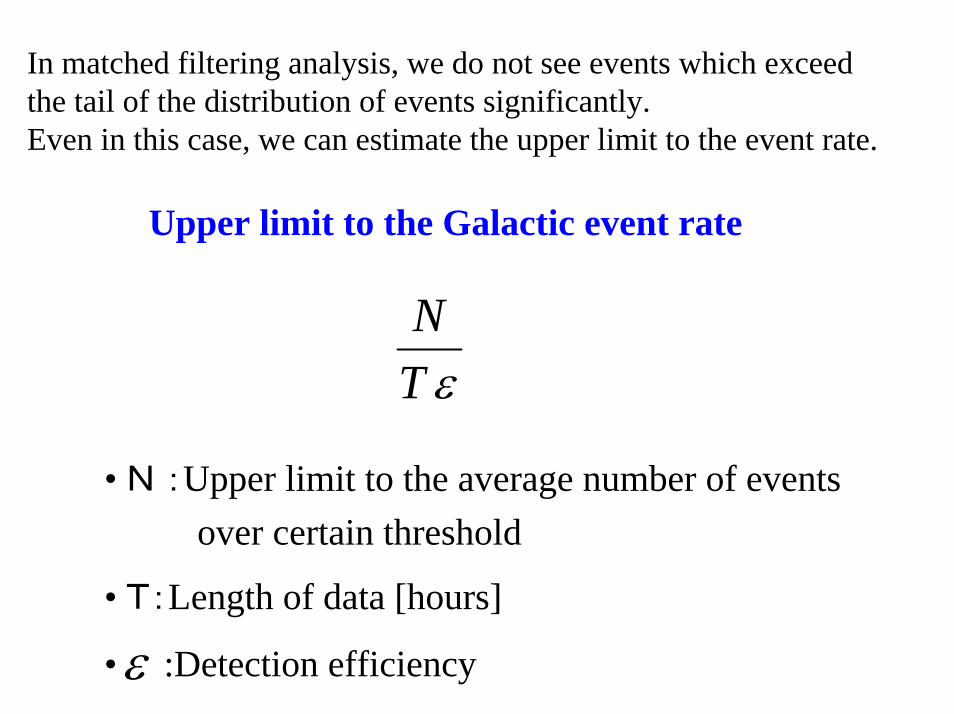
In matched filtering analysis, we do not see events which exceedthe tail of the distribution of events significantly. Even in this case, we can estimate the upper limit to the event rate.
Upper limit to the Galactic event rate
NT ε
• N :Upper limit to the average number of eventsover certain threshold
• T:Length of data [hours]
• :Detection efficiencyε
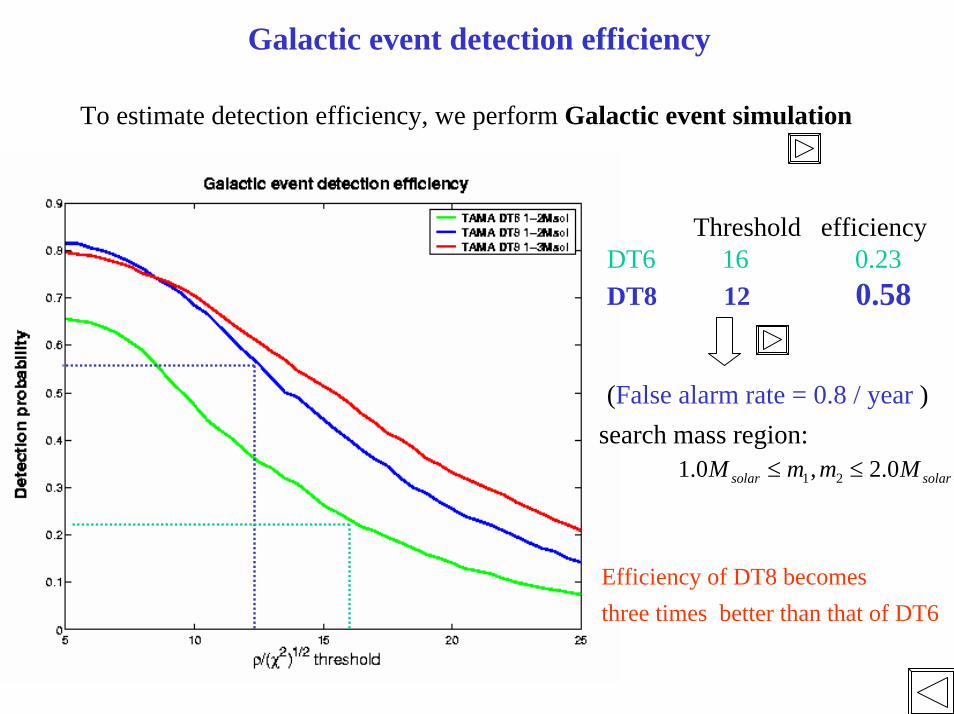
Galactic event detection efficiency
To estimate detection efficiency, we perform Galactic event simulation
Threshold efficiencyDT6 16 0.23DT8 12 0.58
1 21.0 , 2.0≤ ≤solar solarM m m Msearch mass region: (False alarm rate = 0.8 / year )
Efficiency of DT8 becomes three times better than that of DT6
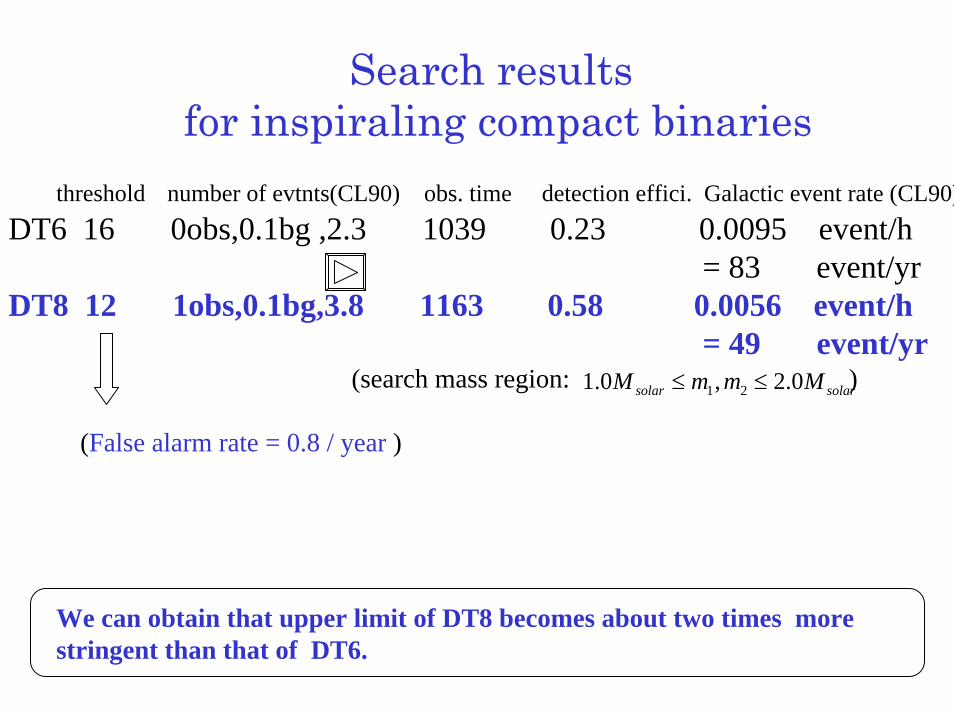
Search results for inspiraling compact binaries
threshold number of evtnts(CL90) obs. time detection effici. Galactic event rate (CL90)DT6 16 0obs,0.1bg ,2.3 1039 0.23 0.0095 event/h
= 83 event/yrDT8 12 1obs,0.1bg,3.8 1163 0.58 0.0056 event/h
= 49 event/yr(search mass region: )1 21.0 , 2.0≤ ≤solar solarM m m M
(False alarm rate = 0.8 / year )
We can obtain that upper limit of DT8 becomes about two times more stringent than that of DT6.
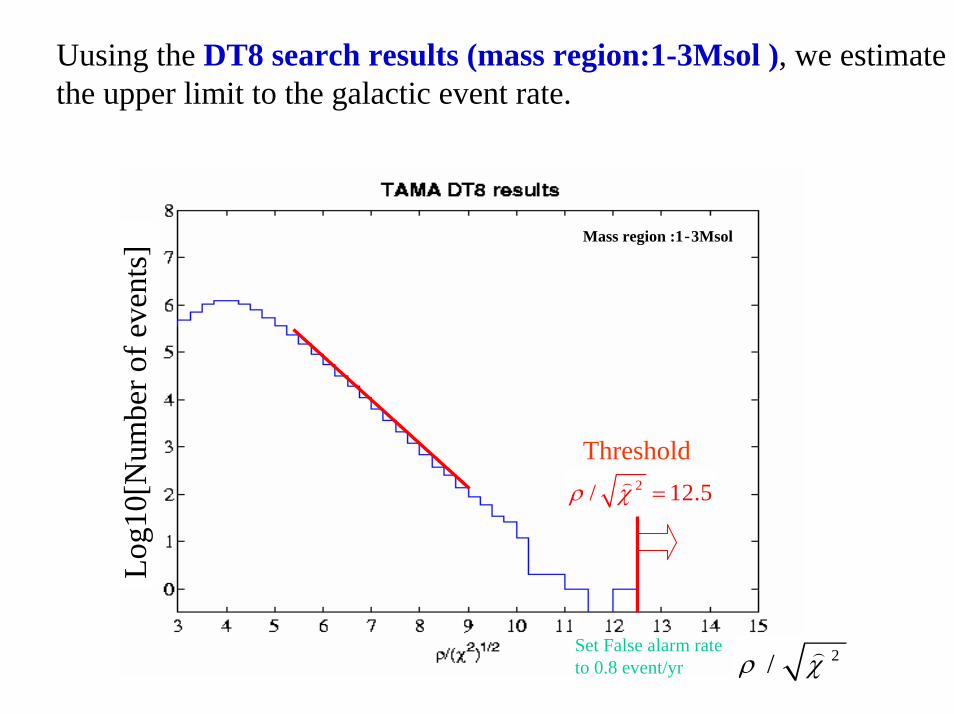
Uusing the DT8 search results (mass region:1-3Msol ), we estimate the upper limit to the galactic event rate.
2/ρ χ)
Log1
0[N
umbe
r of e
vent
s]
Mass region :1‐3Msol
2/ 12.5ρ χ =)Threshold
Set False alarm rate to 0.8 event/yr
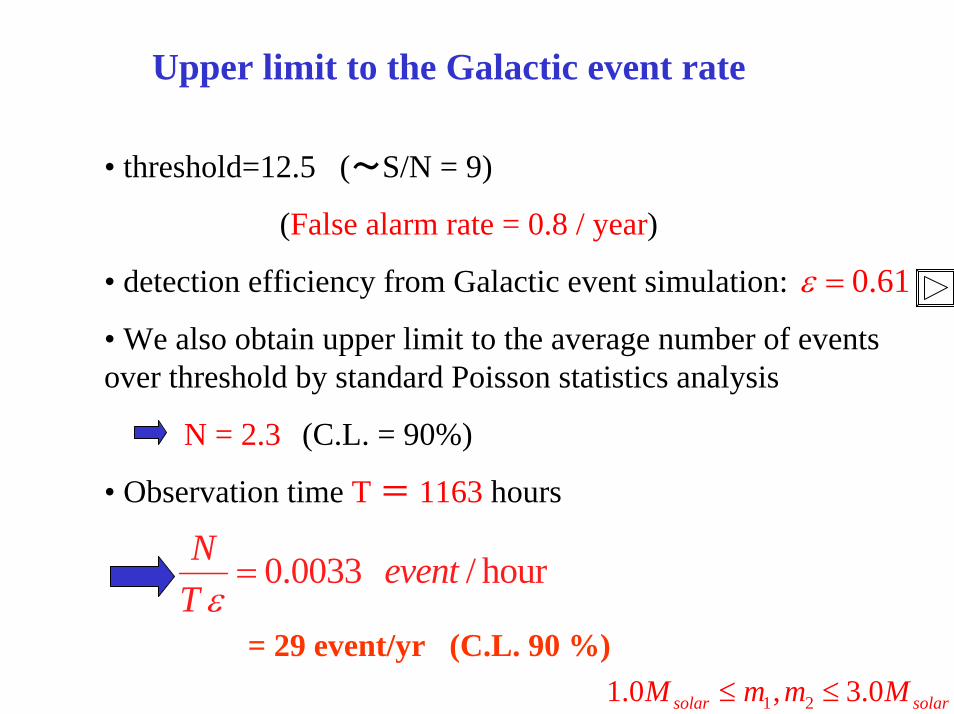
Upper limit to the Galactic event rate
• threshold=12.5 (~S/N = 9)
(False alarm rate = 0.8 / year)
• detection efficiency from Galactic event simulation:
• We also obtain upper limit to the average number of events over threshold by standard Poisson statistics analysis
N = 2.3 (C.L. = 90%)
• Observation time T = 1163 hours
0.61ε =
0.0033 / hourε=
N eventT
1 21.0 , 3.0≤ ≤solar solarM m m M= 29 event/yr (C.L. 90 %)
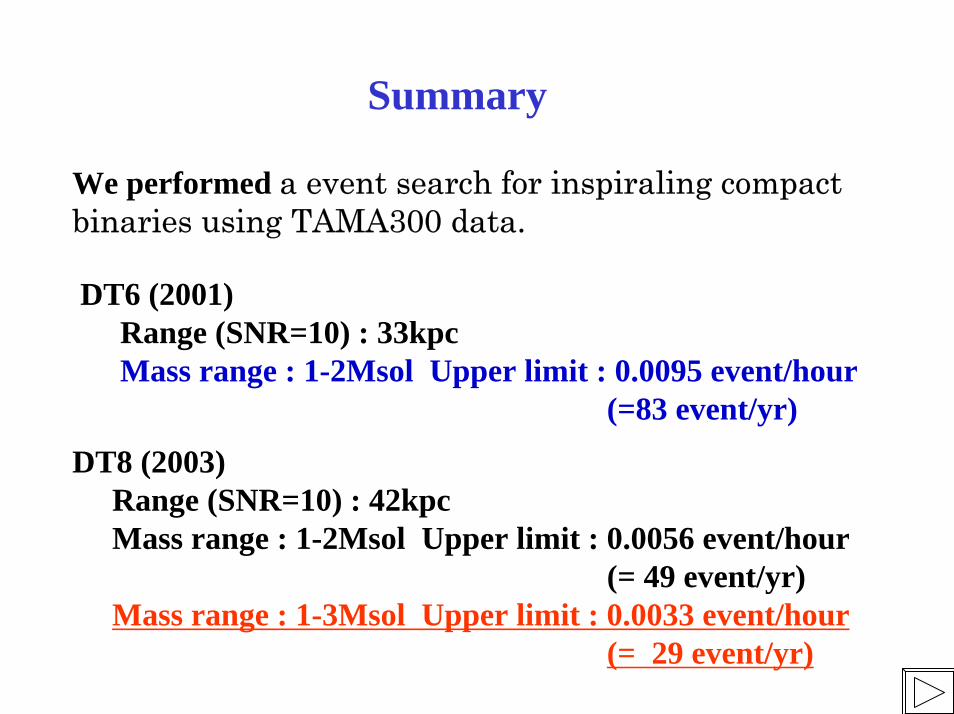
Summary
We performed a event search for inspiraling compact binaries using TAMA300 data.
DT6 (2001)Range (SNR=10) : 33kpcMass range : 1-2Msol Upper limit : 0.0095 event/hour
(=83 event/yr)
DT8 (2003)Range (SNR=10) : 42kpcMass range : 1-2Msol Upper limit : 0.0056 event/hour
(= 49 event/yr) Mass range : 1-3Msol Upper limit : 0.0033 event/hour
(= 29 event/yr)