Embed Size (px)
Citation preview

Circuits and Systems, 2016, 7, 3320-3328 Published Online August 2016 in SciRes. http://www.scirp.org/journal/cs http://dx.doi.org/10.4236/cs.2016.710283
How to cite this paper: Usha, T.M. and Balamurugan, S.A.A. (2016) Seasonal Based Electricity Demand Forecasting Using Time Series Analysis. Circuits and Systems, 7, 3320-3328. http://dx.doi.org/10.4236/cs.2016.710283
Seasonal Based Electricity Demand Forecasting Using Time Series Analysis T. M. Usha, S. Appavu Alias Balamurugan Department of IT, K.L.N College of Information Technology, Sivagangai, India
Received 12 April 2016; accepted 2 May 2016; published 25 August 2016
Copyright © 2016 by authors and Scientific Research Publishing Inc. This work is licensed under the Creative Commons Attribution International License (CC BY). http://creativecommons.org/licenses/by/4.0/
Abstract Consumption of the electric power highly depends on the Season under consideration. The various means of power generation methods using renewable resources such as sunlight, wind, rain, tides, and waves are season dependent. This paves the way for analyzing the demand for electric power based on various Seasons. Many traditional methods are utilized previously for the seasonal based electricity demand forecasting. With the development of the advanced tools, these methods are replaced by efficient forecasting techniques. In this paper, a WEKA time series forecasting is being done for the electric power demand for the three seasons such as summer, winter and rainy sea-sons. The monthly electric consumption data of domestic category is collected from Tamil Nadu Electricity Board (TNEB). Data collected has been pruned based on the three seasons. The WEKA learning algorithms such as Multilayer Perceptron, Support Vector Machine, Linear Regression, and Gaussian Process are used for implementation. The Mean Absolute Error (MAE) and Direction Accuracy (DA) are calculated for the WEKA learning algorithms and they are compared to find the best learning algorithm. The Support Vector Machine algorithm exhibits low Mean Absolute Error and high Direction Accuracy than other WEKA learning algorithms. Hence, the Support Vector Machine learning algorithm is proven to be the WEKA learning algorithm for seasonal based elec-tricity demand forecasting. The need of the hour is to predict and act in the deficit power. This paper is a prelude for such activity and an eye opener in this field.
Keywords WEKA Time Series Forecasting, SMO Regression, Linear Regression, Gaussian Regression, Multilayer Perceptron
1. Introduction Throughout the world, all industries, hospitals, and educational institutions utilize electric power. Typically,
T. M. Usha, S. A. A. Balamurugan
3321
electric power is their primary power source. If there is a shortage in this primary power, all of these entities would collapse. This situation must be avoided, and this problem can be solved by electric energy demand fore-casting. Power plants are the major source of this primary power generation. Different energy sources, including thermal, nuclear, wind, and hydrological are installed to meet the energy demand required in the future. But the successful installation of power plants is a long-term process, and after installation the capacity of the power plant cannot be increased. This leads to the necessity of forecasting as the initial process in power system engi-neering. Demand forecasting plays a vital role in electricity generation. In recent years, the state of Tamil nadu in India is facing irregular power supply to all its districts due to a shortage of power. This problem is the con-sequence of a lack of forecasting methodologies. Therefore, this research may be helpful to avoid this critical situation. Power distribution is a cumbersome task due to the increase in the consumption of electric power by the increase in the usage of electronic equipment and by the modernizations and the new entry of industries. These changes induced the need to find the way of improvising the power distribution through forecasting the power need and looking for the ways to acquire them. For forecasting the power need, it is not eventually dis-tributed throughout the period, but it varies seasonally. Season have a higher impact in the electric power con-sumption in the domestic market. The domestic sector electricity consumption varies with respect to rural and urban segments and climatic seasonal variations.
In this paper, seasonal electricity demand forecasting is developed to predict the electricity demand by inte-grating with the WEKA time series forecasting. Demand forecasting is the process of predicting the needed electric energy in advance. Many prediction and forecasting methodologies were developed in the electricity domain. The main intention of this work is to forecast the electricity demand by using with seasonal data ap-proach. At first, the electric energy monthly consumption data is collected from TNEB office. Time series fore-casting is done with Seasonal data of the seasons such as Summer, Winter and Rainy with the WEKA Learning Algorithms. The accuracy parameters are used to measure the performance of the learning algorithms. The learning algorithm Support vector machine is shows the better accuracy compared with other learning algo-rithms. Finally, the future electricity demand is forecasted for the years from 2016 to 2018 with the help of sup-port vector machine learning algorithm.
The rest of the paper is organized as follows: Section 2 illustrates some of the existing works related to elec-tricity demand forecasting. Section 3 gives the detailed description of the overall flow of the proposed electricity demand forecasting model. Section 4 presents the results evaluation and comparison results of the proposed sys-tem. Finally, this paper is concluded and the future work to be carried out is stated in Section 5.
2. Related Works Bresfelean, V.P. [1] uses WEKA environment to predict the student’s behavior using Decision tree algorithm. Zhifei Chen [2] developed on new approach in time series analysis to find the pattern sequences. They used k-means clustering techniques to grouping and labeling the samples from a data set the clustering the dataset. Mean Error Relative (MER) and Mean Absolute Error (MAE) is analyzed for several energy time series. The univariate time series analysis [3] [4] is commonly used to forecasting monthly electric energy consumption in Eastern Saudi Arabia and Lebanon.
Hong [5] developed on forecasting model which includes support vector regression (SVR) model, chaotic immune algorithm and seasonal adjustment mechanism to forecast monthly electric loads. Ghosh [6] analyzed on Multivariate Time-Series Analysis to forecasting for traffic flow. Existing methods for short-term load fore-casting include general regression analysis and time series methods [7]-[9]. Saigal S and Mehrotra D [10] com-pare the performance of four Models namely Multiple Regression in Excel, Multiple Linear Regression of Ded-icated Time Series Analysis in WEKA, Vector Autoregressive Model in R and Neural Network Model using Neural Works Predict. All the models are compared on the basis of the forecasting errors generated by them. Suchao Jake Parkpoom [11] suggested regression analysis on Residential and Commercial consumption that predict that how the changes of climate will affect Thailand’s short-term and long-term electricity demand and to capture the influence of temperature on daily and seasonal demand.
3. Overall Flow of the Seasonal Based Electricity Demand Forecasting Model Season based electricity demand forecasting model is designed to forecast the seasonal based electricity power consumption. Figure 1 shows the overall flow of the proposed electricity demand forecasting model. Initially

T. M. Usha, S. A. A. Balamurugan
3322
Figure 1. Overall flow of the proposed electricity demand forecasting model.
the Monthly Electric Consumption Data of Domestic Category is collected from TNEB. The power consumption by the Domestic category is highly influenced by the seasons. So here prediction is highly recommended for the Seasonal forecasting. This data is split into three dataset based on the seasons. Here the three seasons such as Summer, Winter and Rainy are considered for the forecasting. This model is implemented with WEKA Time series forecasting. In WEKA packet manager, Time Series Forecasting package is available. The WEKA learn-ing algorithms such as Multilayer Perceptron, Support Vector Machine, Linear Regression, and Gaussian Pro- cess are capable of predicting the numeric quantity. They are used for this comparative study for forecasting electricity consumption based on seasonal data.
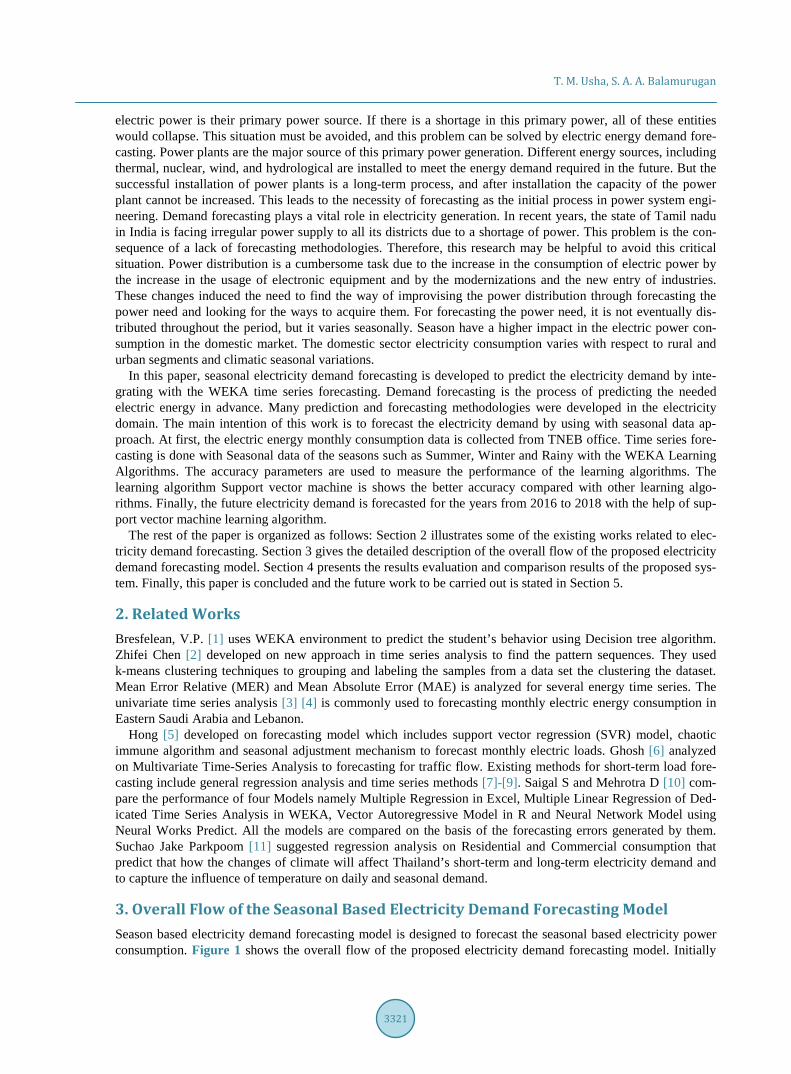
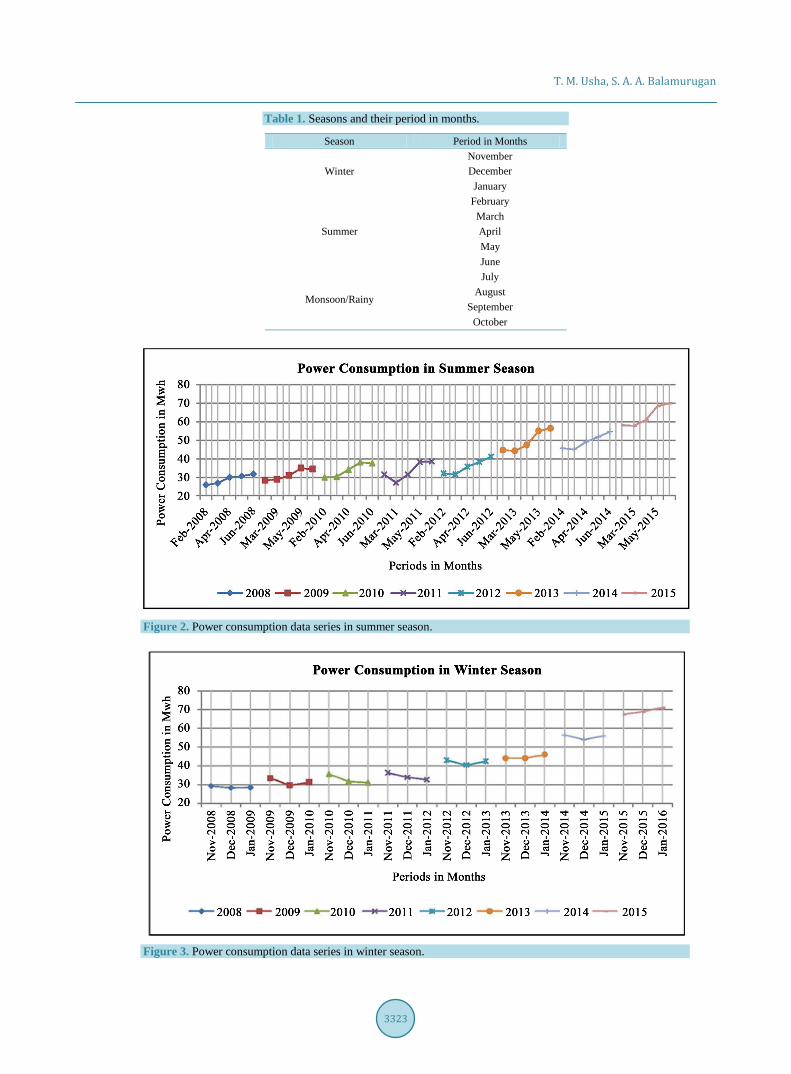
3.1. Dataset The monthly electric power consumption of the domestic category of Madurai District Data is used as the sam-ple to deploy the forecasting. This Dataset is collected from Tamil Nadu Electricity Board (TNEB) [12] for the period from 2008 to 2016. A season is a division of the year marked by changes in weather, ecology and hours of daylight. Since Tamilnadu is a hot region, it has three seasons; the monsoon season, the summer season, and winter season. The collected data was pruned into three datasets based on seasons. The seasons are identified by the months are tabulated in the Table 1. The months such as November, December and January are decidedly Winter season, the months such as February, March, April, May and June are decidedly Summer season and the months such as July, August, September, October are decidedly Rainy season. Figures 2-4 shows the data series of power consumption of the three seasons. In these figures, the X axis represents periods of months and Y axis represents power consumption is measured in Megawatt per Hour. It is shortly denoted as Mwh.
3.2. Data Preprocessing This research used data set [14] about electric power consumption in one household that has a sampling rate in one minute over a long period of time from the years 2006 to 2010. We used R and Rstudio for building the model. The first step is to read the text file (as show in Figure 2) with the following R commands:
T. M. Usha, S. A. A. Balamurugan
3323
Table 1. Seasons and their period in months.
Season Period in Months
Winter November December January
Summer
February March April May June
Monsoon/Rainy
July August
September October
Figure 2. Power consumption data series in summer season.
Figure 3. Power consumption data series in winter season.

T. M. Usha, S. A. A. Balamurugan
3324
Figure 4. Power consumption data series in monsoon season.
The missing value may reduce the accuracy of forecast. So the missing value is filled with the methods such
as mean, median or previous value. In this dataset, the missing value is filled with the previous value in the time series.
Waikato Environment for Knowledge Analysis-version 3.7.6 (Weka 3.7.6) tool [13] has used for Time series forecasting. A package called “Time series forecasting environment” is used are performing the predication process. It has the both the command-line and GUI user interfaces. From the menu bar, the Tool menu has the Packet Manager. It has the Time series forecasting package. Select Time series forecasting package and install it.
There are two configurations in WEKA Forecasting. They are named “Basic configuration” and “Advanced configuration”. In Basic configuration, the important parameters such as timestamp, periodicity and number of units to be forecasted are available. A timestamp is a sequence of information which identifies an event, and usually it is represented as date and time of day, sometimes accurate to a small fraction of a second. Since the used datasets are seasonal data, the time stamp is set as “Use Artificial Time Index”. This is used only when we are adjusting for trends via a real or artificial time stamp. That means that it will increment the artificial time value with time stamp. In Advanced configuration, the Base learner is available; it has configured parameters specific to the learning algorithm selected. Here the WEKA learning algorithms such as Multilayer Perceptron [14], Support Vector Machine [15], Linear Regression [16], and Gaussian Process [17] are used for implementa-tion. These algorithms are capable of predicting the numeric quantity. The input data set is available in Attri- bute-Relation File Format (ARFF).
The following shows the structure of ARFF file. @relation 'Time Series Data' @attribute Period date 'MMM-yyyy' @attribute Electricity_Consumption numeric @data Feb-2008 25796987 Mar-2008 26796987 Apr-2008 29946353
4. Result and Discussion This section explains about the results and discussions, including the comparative analysis of the accuracy pa-rameters such as Mean absolute error, Root mean squared error, and Direction accuracy of the WEKA learning

T. M. Usha, S. A. A. Balamurugan
3325
algorithms available. WEKA learning algorithms identify the patterns of the each seasonal data. Once these pat-terns are identified, then we can carry over forecasting. Finally, the forecasted power consumption is computed with the help of WEKA learning algorithms. The accuracy parameters such as Mean absolute error, Root mean squared error, and Direction accuracy are calculated. These comparison results shows that support vector ma-chine algorithm gives less error with more direction accuracy compared to other WEKA learning algorithm.
4.1. Accuracy Parameters 4.1.1. Mean Absolute Error Figure 5 shows the comparison graph of the Mean Absolute Error of each WEKA learning algorithm. Mean Absolute Error is a basic accuracy parameter which calculates the average magnitude of the errors of the fore-casting results. It gives the number differences between the actual and the forecasted values. In statistics, the mean absolute error (MAE) is a quantity used to measure how close forecasts are to the eventual outcomes. The mean absolute error is given by
1 1
1 1n ni i ii i
i i i
MAE f y en n
e f y
= == − =
= −
∑ ∑ (1)
where if is the prediction and iy the true value.
4.1.2. Root Mean Squared Error (RMSE) Figure 6 shows the comparison graph of the Root Mean Squared Error (RMSE) of each WEKA learning algo-rithm. The RMSE is the difference between forecast and corresponding observed values are each squared and then averaged over the sample. Finally, the square root of the average is taken. The mean absolute error is given by
In the case of a set of n values { }1 2, , , ,nx x x⋅ ⋅ ⋅ the RMS
( )2 2 21 2
1 . . . .rms nx x x xn
= + + + (2)
4.1.3. Direction Accuracy (DA) Figure 7 shows the comparison graph of the Direction Accuracy (DA) of each WEKA learning algorithm. DA is a measure of predictive accuracy of a forecasting method in statistics. It compares the forecast direction (up-ward or downward) to the actual realized direction. It is defined by the following formula
( ) ( )1 11 1
t t t ts A A sigit
Fgn n FN − − == − −∑ (3)
where At, At is the actual value at time t and Ft is the forecast value at time t. Variable N represents number of forecasting points. The function sign is sign function.
Figure 5. Comparison of mean absolute error between WEKA learning algorithms.

T. M. Usha, S. A. A. Balamurugan
3326
Figure 6. Comparison of root mean squared error between WEKA learning algorithms.
Figure 7. Comparison of direction accuracy between WEKA learning algorithms.
4.2. Future Prediction for Power Consumption Using Seasonal Data The main aim of forecasting is to predict the future value of some time series. Seasonal based electricity demand forecasting is important for managing activities of consumers. Generally, seasonal based demand forecasting is based on the regularities in time series related to the changes in seasons. In this work, we use a real time monthly electric power consumption of the domestic category of Madurai District Data is used as the sample to deploy the forecasting. This Dataset is collected from Tamil Nadu Electricity Board (TNEB) [12] for the period from 2008 to 2016 to develop the forecast system by using the WEKA. Typically, the electricity demands are lump-filled and vary greatly with the seasons. Here, the demand model is integrated with the month and their corresponding power consumption.
From the analysis of the seasonal dataset, the result shows that, the support vector machine learning algorithm produces low Mean Absolute Error with increased Direction Accuracy. Thus the upcoming power consumption of three seasons is forecasted are as shown in the Figures 8-10.
5. Conclusion The purpose of this research was to find a suitable model to forecast the seasonal based electric power consump-tion in a domestic category. Power layoff is the important problem faced by the government, industries, business people and the residents during very peak summer, winter and in monsoon season. This shortage is because of the failure in the needed power forecasting. Using the WEKA Time series forecasting package, the Learning Algorithms such as Multilayer Perceptron, Support Vector Machine, Linear Regression, and Gaussian Process are applied to the electric power consumption from December 2006 to November 2010. The time series fore-casting is used to identify the patterns hidden in the data set. Once these patterns are identified using WEKA learning algorithms, and then we can carry over forecasting. The accuracy parameters such as Mean Absolute Error and Direction Accuracy of the learning algorithms are calculated. The best forecasting method is chosen

T. M. Usha, S. A. A. Balamurugan
3327
Figure 8. Future predictions of power consumption in summer season.
Figure 9. Future predictions of power consumption in winter season.
Figure 10. Future predictions of power consumption in monsoon season.
by considering the low Mean Absolute Error and high Direction accuracy. Hence, the Support Vector Machine is found to be the best technique for the electricity demand prediction for seasonal based dataset. The upcoming
T. M. Usha, S. A. A. Balamurugan
3328
power consumption of three seasons is forecasted for three years using support vector machine learning algo-rithm. These seasonal forecasts provide information about how the electric energy demand is likely to be for three years into the future. These forecasts will provide alerts to government and will helpful in making deci-sions for generating power through seasonal based power plants.
References [1] Bresfelean, V.P. (2007) Analysis and Predictions on Students’ Behavior Using Decision Trees in Weka Environment.
International Conference on Information Technology Interfaces, 51-56. [2] Chen, Z.F., Aghakhani, S., Man, J. and Dick, S. (2011) Energy Time Series Forecasting Based on Pattern Sequence
Similarity. IEEE Transactions on Knowledge and Data Engineering, 23. [3] Abdel-Aal, R.E. and Al-Garni, A.Z. (1997) Forecasting Monthly Electric Energy Consumption in Eastern Saudi Arabia
Using Univariate Time-Series Analysis. Energy, 22, 1059-1069. http://dx.doi.org/10.1016/S0360-5442(97)00032-7 [4] Saab, S., Badr, E. and Nasr, G. (2001) Univariatemodeling and Forecasting of Energy Consumption: The Case of Elec-
tricity in Lebanon. Energy, 26, 1-14. http://dx.doi.org/10.1016/S0360-5442(00)00049-9 [5] Hong, W.C., Dong, Y., Lai, C.-Y., Chen, L.-Y. and Wei, S.-Y. (2011) SVR with Hybrid Chaotic Immune Algorithm
for Seasonal Load Demand Forecasting. Energies, 4, 960-977. http://dx.doi.org/10.3390/en4060960 [6] Ghosh, B., Basu, B. and O’Mahony, M. (2009) Multivariate Short-Term Traffic Flow Forecasting Using Time-Series
Analysis. IEEE Transactions on Intelligent Transportation Systems, 10. [7] Kim, D.-Y., Lee, C.-J., Jeong, Y.-W., Park, J.-B. and Shin, J.-R. (2005) Development of System Marginal Price Fore-
casting Method Using SARIMA Model. Proceeding of Conference KIEE, 148-150. [8] Christiaanse, W.R. (1971) Short Term Load Forecasting Using Genera Exponential Smoothing. IEEE Transactions on
Power Apparatus and Systems, PAS-90, 900-910. http://dx.doi.org/10.1109/TPAS.1971.293123 [9] Juberias, G., Yunta, R., Garcia, J. and Moreno, C. (1999) Mendivil, a New ARIMA Model for Hourly Load Forecast-
ing. IEEE Transmission and Distribution Conference, 11-16 April 1999, 314-319. [10] Saigal, S. and Mehrotra, D. (2012) Performance Comparison of Time Series Data Using Predictive Data Mining Tech-
niques. Advances in Information Mining, 4, 57-66. [11] Parkpoom, S.J. (2007) The Impact of Climate Change on Electricity Demand in Thailand. Thesis, The University of
Edinburgh. [12] Tamil Nadu Generation and Distribution Corporation Ltd. http://tneb.tnebnet.org/newlt/menu3.html [13] Hall, M. Time Series Analysis and Forecasting with Weka-Pentaho Data Mining.
http://wiki.pentaho.com/display/DATAMINING/Time+Series+Analysis+and+Forecasting+with+Weka [14] Ware, M. “MultilayerPerceptron.”.
http://weka.sourceforge.net/doc/weka/classifiers/functions/MultilayerPerceptron.html [15] Frank, E., Shane, L. and Inglis, S. “SMO.” http://weka.sourceforge.net/doc/weka/classifiers/functions/SMO.html [16] Frank, E. and Trigg, L. “LinearRegression.”.
http://weka.sourceforge.net/doc/weka/classifiers/functions/LinearRegression.html [17] Driessens, K. “GaussianProcesses.”.
http://weka.sourceforge.net/doc.dev/index.html?weka/classifiers/functions/GaussianProcesses.html

Submit or recommend next manuscript to SCIRP and we will provide best service for you: Accepting pre-submission inquiries through Email, Facebook, LinkedIn, Twitter, etc. A wide selection of journals (inclusive of 9 subjects, more than 200 journals) Providing 24-hour high-quality service User-friendly online submission system Fair and swift peer-review system Efficient typesetting and proofreading procedure Display of the result of downloads and visits, as well as the number of cited articles Maximum dissemination of your research work
Submit your manuscript at: http://papersubmission.scirp.org/