Embed Size (px)
Citation preview
Biogeosciences, 3, 635–650, 2006www.biogeosciences.net/3/635/2006/© Author(s) 2006. This work is licensedunder a Creative Commons License.
Biogeosciences
Seasonal dynamics ofPseudocalanus minutus elongatusand Acartiaspp. in the southern Baltic Sea (Gdansk Deep) – numericalsimulations
L. Dzierzbicka-Głowacka1, L. Bielecka2, and S. Mudrak2
1Institute of Oceanology, Polish Academy of Sciences Powstancow Warszawy 55, 81-712 Sopot, Poland2Institute of Oceanography, University of Gdansk Al. Marsz. J. Piłsudskiego 46, 81-378 Gdynia, Poland
Received: 30 May 2006 – Published in Biogeosciences Discuss.: 31 July 2006Revised: 17 October 2006 – Accepted: 5 December 2006 – Published: 18 December 2006
Abstract. A population dynamics model for copepods is pre-sented, describing the seasonal dynamics ofPseudocalanusminutus elongatusandAcartiaspp. in the southern Baltic Sea(Gdansk Deep). The copepod model was coupled with a one-dimensional physical and biological upper layer model fornutrients (total inorganic nitrogen, phosphate), phytoplank-ton, microzooplankton, and an early juvenile of herring as apredator. In this model, mesozooplankton (herbivorous cope-pods) has been introduced as an animal having definite pat-terns of growth in successive stages, reproduction and mor-tality. The populations are represented by 6 cohorts in dif-ferent developmental stages, thus assuming that recruitmentof the next generation occurs after a fixed period of adultlife. The copepod model links trophic processes and popu-lation dynamics, and simulates individual growth within co-horts and the changes in biomass between cohorts.
The simulations of annual cycles of copepods contain onecomplete generation ofPseudocalanusand two generationsof Acartia in the whole column water, and indicate the im-portance of growth in the older stages of 6 cohorts of eachspecies, to arrive at a total population biomass. The peaks ofcopepods’ biomass are larger at the turn of June and July forPseudocalanusand smaller in July forAcartia, lagging thatof phytoplankton by ca. two mouths, due to the growth ofcohorts in successive stages and egg production by females.
The numerical results show that the investigated speciescould not be the main factor limiting the spring phytoplank-ton bloom in the Gdansk Deep, because the initial develop-ment was slow forAcartiaand faster forPseudocalanus, butthe main development formed after the bloom, in both cases.The phytoplankton bloom is very important in the diet of theadults of the copepods, but it is not particularly important forthe youngest part of new generation (early nauplii). How-ever, the simulated microzooplankton biomass was enough
Correspondence to:L. Dzierzbicka-Głowacka([email protected])
high to conclude, in our opinion, that, in this case, it wasa major cause in limiting phytoplankton bloom. The modelpresented here is a next step in understanding how the popu-lation dynamics of a dominant species in the southern BalticSea interact with the environment.
1 Introduction
In the past, where zooplankton has been introduced into amodel, factors such as filtering, respiration, and excretionrather often have been taken as fixed productions of the hy-pothetical biomass rather than being related to more detailedinformation on behaviour and metabolism. In the literaturethere are now considerable experimental data on these as-pects for several species of zooplankton. This informationcan be used to provide some idea of the functional relationswhich could be used in a simulation of zooplankton responseto variations in its environment. The development of suchtheoretical descriptions is critical to the inclusion of this an-imal, in more general simulations of ecosystems. Most ofthe models take into account only nutrient and phytoplank-ton (Fransz et al., 1991), probably because of the difficulty inrepresenting the complex behaviour that exists among zoo-plankton species and also among the different zooplanktondevelopmental stages. Models having one compartment forthe whole zooplankton community are useful only for sim-ulating ecosystem dynamics over the course of a few days(Wroblewski and Richman, 1987) or for a stable environ-ment, but become meaningless for long periods if the envi-ronment fluctuates. Although field workers consider popula-tion dynamics to be the minimum level of study, zooplanktonpopulation models are rarely included in ecosystem models.
The considerations of herbivores as biomass show thatuseful deductions can be made. In particular, in studies ofphytoplankton populations, it may be sufficient to use a sin-gle parameter for presenting the general concepts from this
Published by Copernicus GmbH on behalf of the European Geosciences Union.
636 L. Dzierzbicka-Głowacka et al.: Seasonal dynamics of copepods in the southern Baltic Sea
Phytoplankton
Solar radiation
TemperatureTurbulent diffusivity Coefficient
Light
Wind
grazing
uptake release
mortality
excretion
sedimentation
mortality
fecal pelletproduction
NutrientsNO +NO +NH
PO3 2 4
4
benthicregeneration
pelagicregeneration
Benthicdetritus
Microzooplankton
Mesozooplankton
Eggs
Naup.
C1
C2
C3
C4
C5
Ad.
predation
Fish
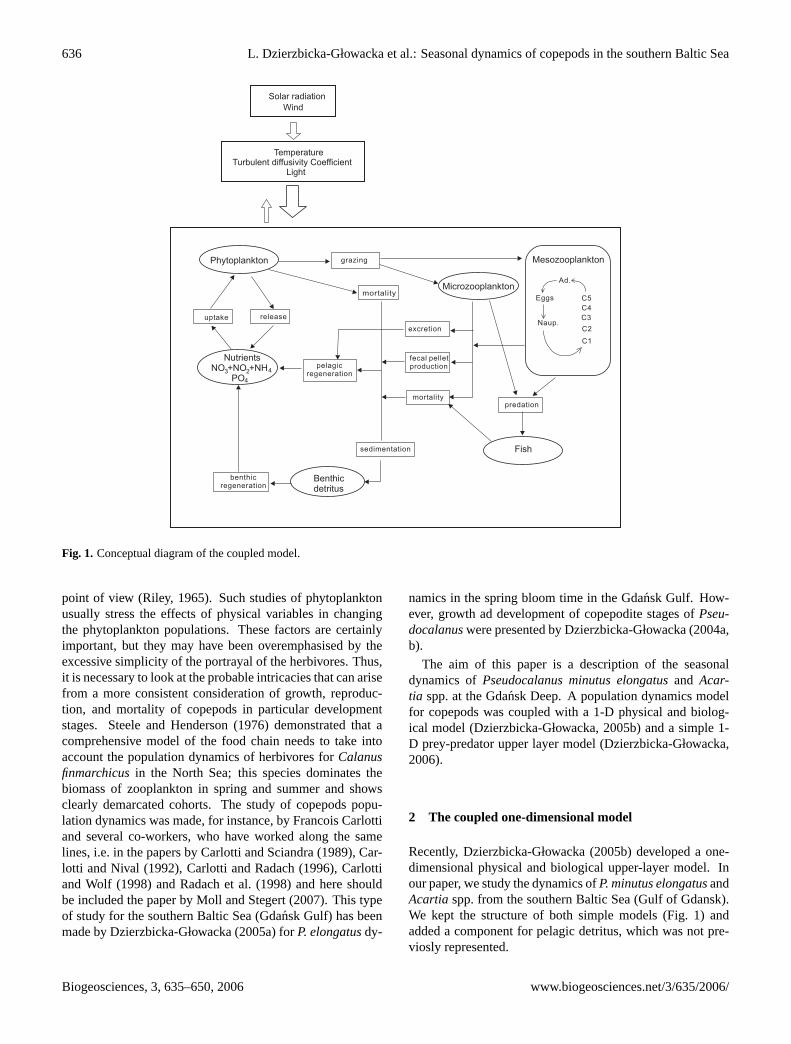
Fig. 1. Conceptual diagram of the coupled model.
point of view (Riley, 1965). Such studies of phytoplanktonusually stress the effects of physical variables in changingthe phytoplankton populations. These factors are certainlyimportant, but they may have been overemphasised by theexcessive simplicity of the portrayal of the herbivores. Thus,it is necessary to look at the probable intricacies that can arisefrom a more consistent consideration of growth, reproduc-tion, and mortality of copepods in particular developmentstages. Steele and Henderson (1976) demonstrated that acomprehensive model of the food chain needs to take intoaccount the population dynamics of herbivores forCalanusfinmarchicusin the North Sea; this species dominates thebiomass of zooplankton in spring and summer and showsclearly demarcated cohorts. The study of copepods popu-lation dynamics was made, for instance, by Francois Carlottiand several co-workers, who have worked along the samelines, i.e. in the papers by Carlotti and Sciandra (1989), Car-lotti and Nival (1992), Carlotti and Radach (1996), Carlottiand Wolf (1998) and Radach et al. (1998) and here shouldbe included the paper by Moll and Stegert (2007). This typeof study for the southern Baltic Sea (Gdansk Gulf) has beenmade by Dzierzbicka-Głowacka (2005a) forP. elongatusdy-
namics in the spring bloom time in the Gdansk Gulf. How-ever, growth ad development of copepodite stages ofPseu-docalanuswere presented by Dzierzbicka-Głowacka (2004a,b).
The aim of this paper is a description of the seasonaldynamics ofPseudocalanus minutus elongatusand Acar-tia spp. at the Gdansk Deep. A population dynamics modelfor copepods was coupled with a 1-D physical and biolog-ical model (Dzierzbicka-Głowacka, 2005b) and a simple 1-D prey-predator upper layer model (Dzierzbicka-Głowacka,2006).
2 The coupled one-dimensional model
Recently, Dzierzbicka-Głowacka (2005b) developed a one-dimensional physical and biological upper-layer model. Inour paper, we study the dynamics ofP. minutus elongatusandAcartia spp. from the southern Baltic Sea (Gulf of Gdansk).We kept the structure of both simple models (Fig. 1) andadded a component for pelagic detritus, which was not pre-viosly represented.
Biogeosciences, 3, 635–650, 2006 www.biogeosciences.net/3/635/2006/
L. Dzierzbicka-Głowacka et al.: Seasonal dynamics of copepods in the southern Baltic Sea 637
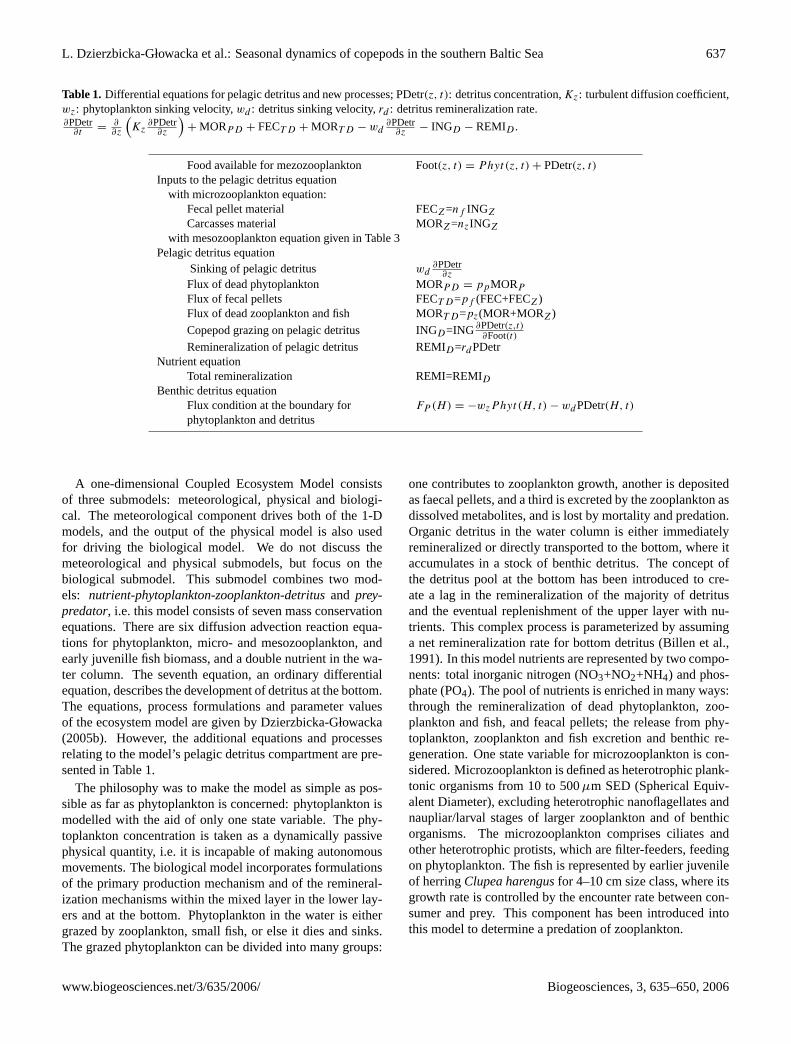
Table 1. Differential equations for pelagic detritus and new processes; PDetr(z, t): detritus concentration,Kz: turbulent diffusion coefficient,wz: phytoplankton sinking velocity,wd : detritus sinking velocity,rd : detritus remineralization rate.∂PDetr
∂t=
∂∂z
(Kz
∂PDetr∂z
)+ MORPD + FECT D + MORT D − wd
∂PDetr∂z
− INGD − REMID .
Food available for mezozooplankton Foot(z, t) = Phyt (z, t) + PDetr(z, t)Inputs to the pelagic detritus equation
with microzooplankton equation:Fecal pellet material FECZ=nf INGZ
Carcasses material MORZ=nzINGZ
with mesozooplankton equation given in Table 3Pelagic detritus equation
Sinking of pelagic detritus wd∂PDetr
∂zFlux of dead phytoplankton MORPD = ppMORP
Flux of fecal pellets FECT D=pf (FEC+FECZ)Flux of dead zooplankton and fish MORT D=pz(MOR+MORZ)
Copepod grazing on pelagic detritus INGD=ING∂PDetr(z,t)∂Foot(t)
Remineralization of pelagic detritus REMID=rdPDetrNutrient equation
Total remineralization REMI=REMIDBenthic detritus equation
Flux condition at the boundary for FP (H) = −wzPhyt (H, t) − wdPDetr(H, t)
phytoplankton and detritus
A one-dimensional Coupled Ecosystem Model consistsof three submodels: meteorological, physical and biologi-cal. The meteorological component drives both of the 1-Dmodels, and the output of the physical model is also usedfor driving the biological model. We do not discuss themeteorological and physical submodels, but focus on thebiological submodel. This submodel combines two mod-els: nutrient-phytoplankton-zooplankton-detritusand prey-predator, i.e. this model consists of seven mass conservationequations. There are six diffusion advection reaction equa-tions for phytoplankton, micro- and mesozooplankton, andearly juvenille fish biomass, and a double nutrient in the wa-ter column. The seventh equation, an ordinary differentialequation, describes the development of detritus at the bottom.The equations, process formulations and parameter valuesof the ecosystem model are given by Dzierzbicka-Głowacka(2005b). However, the additional equations and processesrelating to the model’s pelagic detritus compartment are pre-sented in Table 1.
The philosophy was to make the model as simple as pos-sible as far as phytoplankton is concerned: phytoplankton ismodelled with the aid of only one state variable. The phy-toplankton concentration is taken as a dynamically passivephysical quantity, i.e. it is incapable of making autonomousmovements. The biological model incorporates formulationsof the primary production mechanism and of the remineral-ization mechanisms within the mixed layer in the lower lay-ers and at the bottom. Phytoplankton in the water is eithergrazed by zooplankton, small fish, or else it dies and sinks.The grazed phytoplankton can be divided into many groups:
one contributes to zooplankton growth, another is depositedas faecal pellets, and a third is excreted by the zooplankton asdissolved metabolites, and is lost by mortality and predation.Organic detritus in the water column is either immediatelyremineralized or directly transported to the bottom, where itaccumulates in a stock of benthic detritus. The concept ofthe detritus pool at the bottom has been introduced to cre-ate a lag in the remineralization of the majority of detritusand the eventual replenishment of the upper layer with nu-trients. This complex process is parameterized by assuminga net remineralization rate for bottom detritus (Billen et al.,1991). In this model nutrients are represented by two compo-nents: total inorganic nitrogen (NO3+NO2+NH4) and phos-phate (PO4). The pool of nutrients is enriched in many ways:through the remineralization of dead phytoplankton, zoo-plankton and fish, and feacal pellets; the release from phy-toplankton, zooplankton and fish excretion and benthic re-generation. One state variable for microzooplankton is con-sidered. Microzooplankton is defined as heterotrophic plank-tonic organisms from 10 to 500µm SED (Spherical Equiv-alent Diameter), excluding heterotrophic nanoflagellates andnaupliar/larval stages of larger zooplankton and of benthicorganisms. The microzooplankton comprises ciliates andother heterotrophic protists, which are filter-feeders, feedingon phytoplankton. The fish is represented by earlier juvenileof herringClupea harengusfor 4–10 cm size class, where itsgrowth rate is controlled by the encounter rate between con-sumer and prey. This component has been introduced intothis model to determine a predation of zooplankton.
www.biogeosciences.net/3/635/2006/ Biogeosciences, 3, 635–650, 2006
638 L. Dzierzbicka-Głowacka et al.: Seasonal dynamics of copepods in the southern Baltic Sea
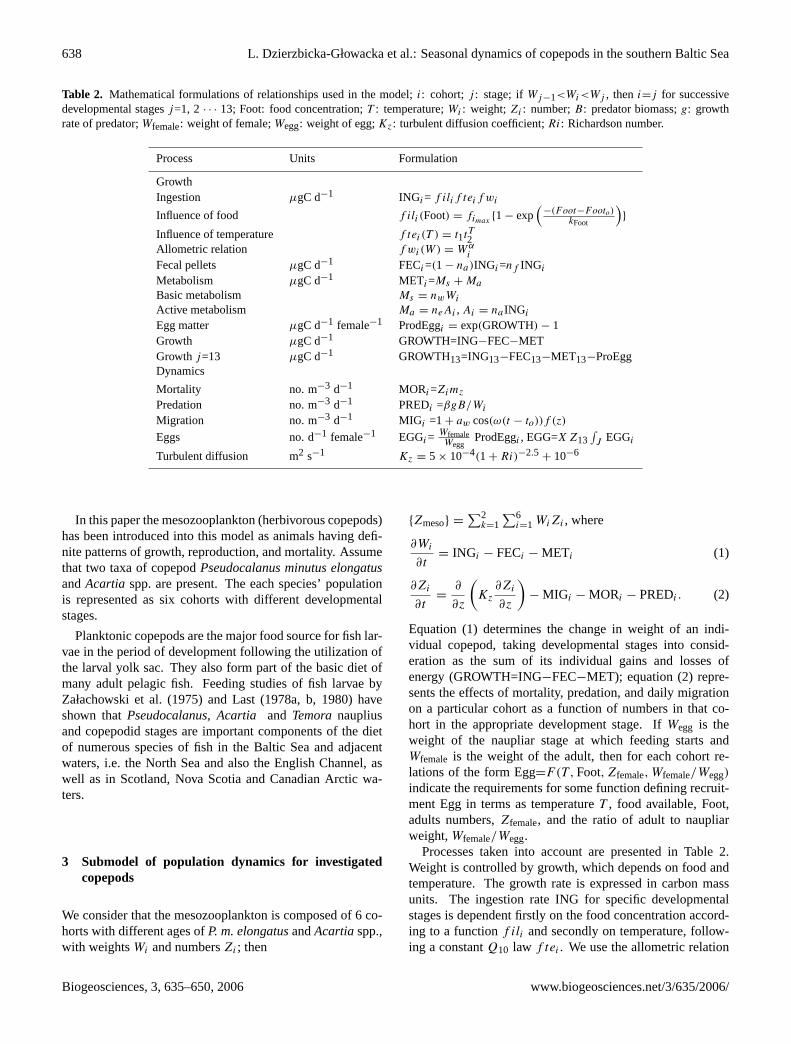
Table 2. Mathematical formulations of relationships used in the model;i: cohort; j : stage; ifWj−1<Wi<Wj , theni=j for successivedevelopmental stagesj=1, 2 · · · 13; Foot: food concentration;T : temperature;Wi : weight;Zi : number;B: predator biomass;g: growthrate of predator;Wfemale: weight of female;Wegg: weight of egg;Kz: turbulent diffusion coefficient;Ri: Richardson number.
Process Units Formulation
GrowthIngestion µgC d−1 INGi= f ilif teif wi
Influence of food f ili(Foot) = fimax{1 − exp
(−(Foot−Footo)
kFoot
)}
Influence of temperature f tei(T ) = t1tT2Allometric relation f wi(W) = Wα
i
Fecal pellets µgC d−1 FECi=(1 − na)INGi=nf INGi
Metabolism µgC d−1 METi=Ms + Ma
Basic metabolism Ms = nwWi
Active metabolism Ma = neAi , Ai = na INGi
Egg matter µgC d−1 female−1 ProdEggi = exp(GROWTH) − 1Growth µgC d−1 GROWTH=ING−FEC−METGrowthj=13 µgC d−1 GROWTH13=ING13−FEC13−MET13−ProEggDynamics
Mortality no. m−3 d−1 MORi=Zimz
Predation no. m−3 d−1 PREDi =βgB/Wi
Migration no. m−3 d−1 MIGi =1+ aw cos(ω(t − to))f (z)
Eggs no. d−1 female−1 EGGi=WfemaleWegg
ProdEggi , EGG=X Z13∫J EGGi
Turbulent diffusion m2 s−1 Kz = 5 × 10⁻⁴(1 + Ri)−2.5+ 10−6
In this paper the mesozooplankton (herbivorous copepods)has been introduced into this model as animals having defi-nite patterns of growth, reproduction, and mortality. Assumethat two taxa of copepodPseudocalanus minutus elongatusandAcartia spp. are present. The each species’ populationis represented as six cohorts with different developmentalstages.
Planktonic copepods are the major food source for fish lar-vae in the period of development following the utilization ofthe larval yolk sac. They also form part of the basic diet ofmany adult pelagic fish. Feeding studies of fish larvae byZałachowski et al. (1975) and Last (1978a, b, 1980) haveshown thatPseudocalanus, Acartia and Temoranaupliusand copepodid stages are important components of the dietof numerous species of fish in the Baltic Sea and adjacentwaters, i.e. the North Sea and also the English Channel, aswell as in Scotland, Nova Scotia and Canadian Arctic wa-ters.
3 Submodel of population dynamics for investigatedcopepods
We consider that the mesozooplankton is composed of 6 co-horts with different ages ofP. m. elongatusandAcartiaspp.,with weightsWi and numbersZi ; then
{Zmeso} =∑2
k=1∑6
i=1 WiZi , where
∂Wi
∂t= INGi − FECi − METi (1)
∂Zi
∂t=
∂
∂z
(Kz
∂Zi
∂z
)− MIGi − MORi − PREDi . (2)
Equation (1) determines the change in weight of an indi-vidual copepod, taking developmental stages into consid-eration as the sum of its individual gains and losses ofenergy (GROWTH=ING−FEC−MET); equation (2) repre-sents the effects of mortality, predation, and daily migrationon a particular cohort as a function of numbers in that co-hort in the appropriate development stage. IfWegg is theweight of the naupliar stage at which feeding starts andWfemale is the weight of the adult, then for each cohort re-lations of the form Egg=F(T , Foot, Zfemale, Wfemale/Wegg)
indicate the requirements for some function defining recruit-ment Egg in terms as temperatureT , food available, Foot,adults numbers,Zfemale, and the ratio of adult to naupliarweight,Wfemale/Wegg.
Processes taken into account are presented in Table 2.Weight is controlled by growth, which depends on food andtemperature. The growth rate is expressed in carbon massunits. The ingestion rate ING for specific developmentalstages is dependent firstly on the food concentration accord-ing to a functionf ili and secondly on temperature, follow-ing a constantQ10 law f tei . We use the allometric relation
Biogeosciences, 3, 635–650, 2006 www.biogeosciences.net/3/635/2006/
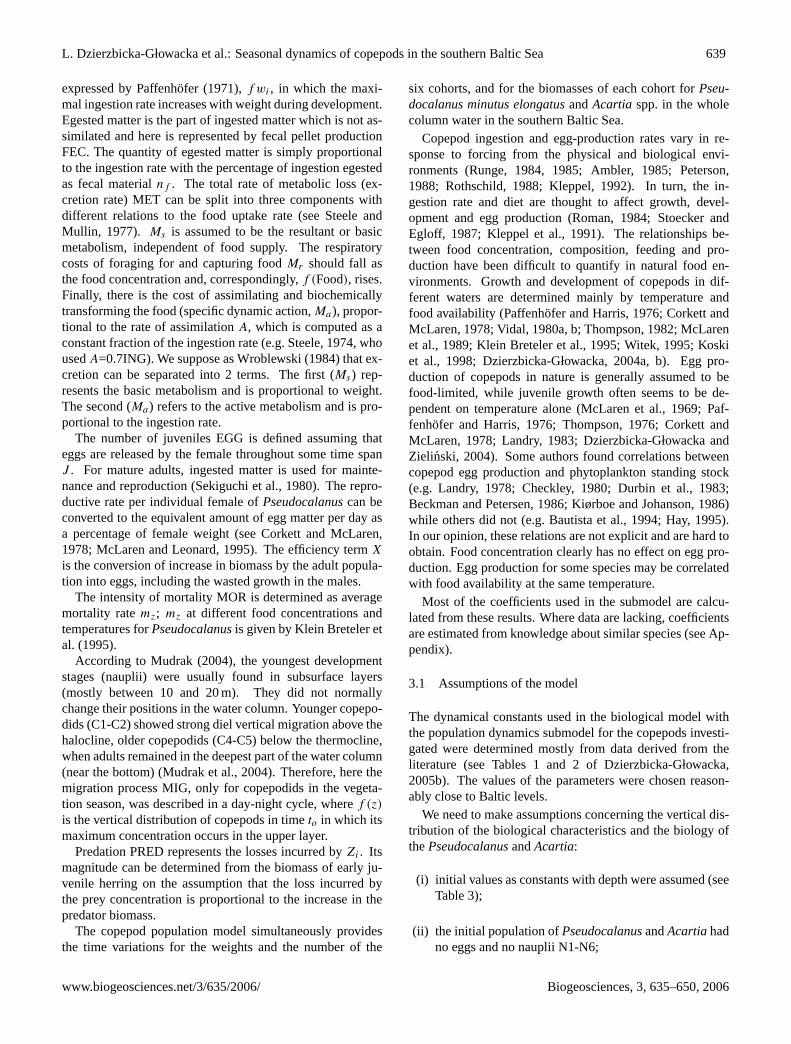
L. Dzierzbicka-Głowacka et al.: Seasonal dynamics of copepods in the southern Baltic Sea 639
expressed by Paffenhofer (1971),f wi , in which the maxi-mal ingestion rate increases with weight during development.Egested matter is the part of ingested matter which is not as-similated and here is represented by fecal pellet productionFEC. The quantity of egested matter is simply proportionalto the ingestion rate with the percentage of ingestion egestedas fecal materialnf . The total rate of metabolic loss (ex-cretion rate) MET can be split into three components withdifferent relations to the food uptake rate (see Steele andMullin, 1977). Ms is assumed to be the resultant or basicmetabolism, independent of food supply. The respiratorycosts of foraging for and capturing foodMr should fall asthe food concentration and, correspondingly,f (Food), rises.Finally, there is the cost of assimilating and biochemicallytransforming the food (specific dynamic action,Ma), propor-tional to the rate of assimilationA, which is computed as aconstant fraction of the ingestion rate (e.g. Steele, 1974, whousedA=0.7ING). We suppose as Wroblewski (1984) that ex-cretion can be separated into 2 terms. The first (Ms) rep-resents the basic metabolism and is proportional to weight.The second (Ma) refers to the active metabolism and is pro-portional to the ingestion rate.
The number of juveniles EGG is defined assuming thateggs are released by the female throughout some time spanJ . For mature adults, ingested matter is used for mainte-nance and reproduction (Sekiguchi et al., 1980). The repro-ductive rate per individual female ofPseudocalanuscan beconverted to the equivalent amount of egg matter per day asa percentage of female weight (see Corkett and McLaren,1978; McLaren and Leonard, 1995). The efficiency termX
is the conversion of increase in biomass by the adult popula-tion into eggs, including the wasted growth in the males.
The intensity of mortality MOR is determined as averagemortality ratemz; mz at different food concentrations andtemperatures forPseudocalanusis given by Klein Breteler etal. (1995).
According to Mudrak (2004), the youngest developmentstages (nauplii) were usually found in subsurface layers(mostly between 10 and 20 m). They did not normallychange their positions in the water column. Younger copepo-dids (C1-C2) showed strong diel vertical migration above thehalocline, older copepodids (C4-C5) below the thermocline,when adults remained in the deepest part of the water column(near the bottom) (Mudrak et al., 2004). Therefore, here themigration process MIG, only for copepodids in the vegeta-tion season, was described in a day-night cycle, wheref (z)
is the vertical distribution of copepods in timeto in which itsmaximum concentration occurs in the upper layer.
Predation PRED represents the losses incurred byZi . Itsmagnitude can be determined from the biomass of early ju-venile herring on the assumption that the loss incurred bythe prey concentration is proportional to the increase in thepredator biomass.
The copepod population model simultaneously providesthe time variations for the weights and the number of the
six cohorts, and for the biomasses of each cohort forPseu-docalanus minutus elongatusandAcartia spp. in the wholecolumn water in the southern Baltic Sea.
Copepod ingestion and egg-production rates vary in re-sponse to forcing from the physical and biological envi-ronments (Runge, 1984, 1985; Ambler, 1985; Peterson,1988; Rothschild, 1988; Kleppel, 1992). In turn, the in-gestion rate and diet are thought to affect growth, devel-opment and egg production (Roman, 1984; Stoecker andEgloff, 1987; Kleppel et al., 1991). The relationships be-tween food concentration, composition, feeding and pro-duction have been difficult to quantify in natural food en-vironments. Growth and development of copepods in dif-ferent waters are determined mainly by temperature andfood availability (Paffenhofer and Harris, 1976; Corkett andMcLaren, 1978; Vidal, 1980a, b; Thompson, 1982; McLarenet al., 1989; Klein Breteler et al., 1995; Witek, 1995; Koskiet al., 1998; Dzierzbicka-Głowacka, 2004a, b). Egg pro-duction of copepods in nature is generally assumed to befood-limited, while juvenile growth often seems to be de-pendent on temperature alone (McLaren et al., 1969; Paf-fenhofer and Harris, 1976; Thompson, 1976; Corkett andMcLaren, 1978; Landry, 1983; Dzierzbicka-Głowacka andZielinski, 2004). Some authors found correlations betweencopepod egg production and phytoplankton standing stock(e.g. Landry, 1978; Checkley, 1980; Durbin et al., 1983;Beckman and Petersen, 1986; Kiørboe and Johanson, 1986)while others did not (e.g. Bautista et al., 1994; Hay, 1995).In our opinion, these relations are not explicit and are hard toobtain. Food concentration clearly has no effect on egg pro-duction. Egg production for some species may be correlatedwith food availability at the same temperature.
Most of the coefficients used in the submodel are calcu-lated from these results. Where data are lacking, coefficientsare estimated from knowledge about similar species (see Ap-pendix).
3.1 Assumptions of the model
The dynamical constants used in the biological model withthe population dynamics submodel for the copepods investi-gated were determined mostly from data derived from theliterature (see Tables 1 and 2 of Dzierzbicka-Głowacka,2005b). The values of the parameters were chosen reason-ably close to Baltic levels.
We need to make assumptions concerning the vertical dis-tribution of the biological characteristics and the biology ofthePseudocalanusandAcartia:
(i) initial values as constants with depth were assumed (seeTable 3);
(ii) the initial population ofPseudocalanusandAcartiahadno eggs and no nauplii N1-N6;
www.biogeosciences.net/3/635/2006/ Biogeosciences, 3, 635–650, 2006
640 L. Dzierzbicka-Głowacka et al.: Seasonal dynamics of copepods in the southern Baltic Sea
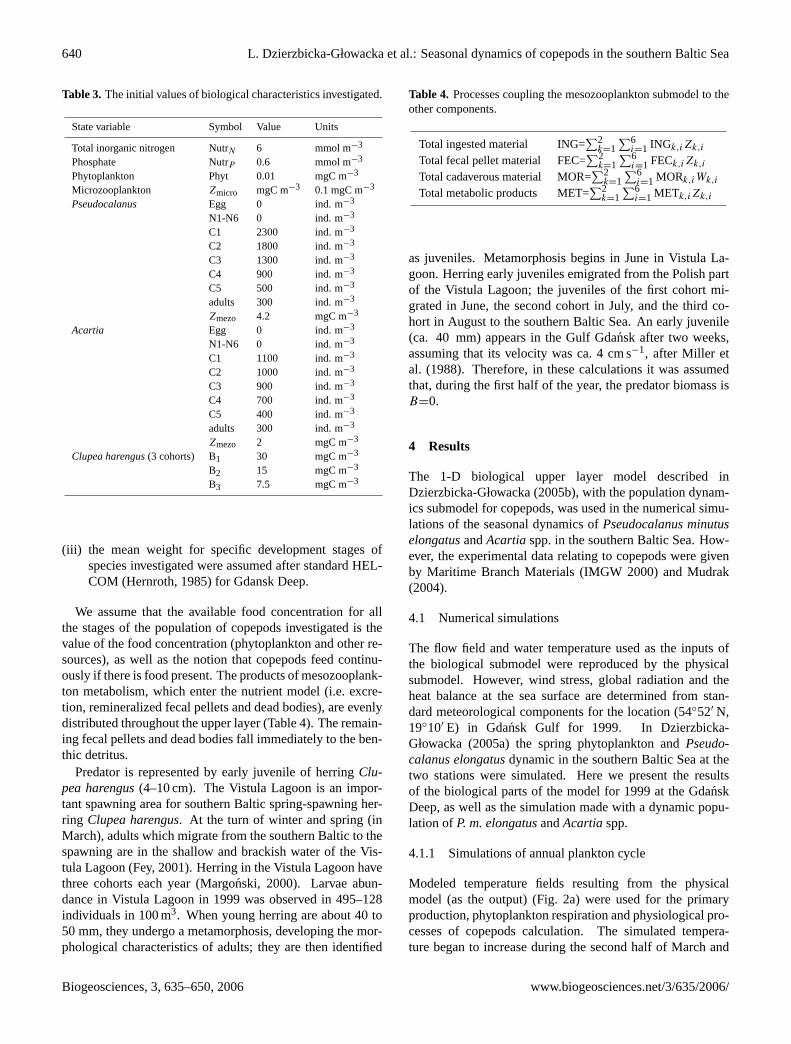
Table 3. The initial values of biological characteristics investigated.
State variable Symbol Value Units
Total inorganic nitrogen NutrN 6 mmol m−3
Phosphate NutrP 0.6 mmol m−3
Phytoplankton Phyt 0.01 mgC m−3
Microzooplankton Zmicro mgC m−3 0.1 mgC m−3
Pseudocalanus Egg 0 ind. m−3
N1-N6 0 ind. m−3
C1 2300 ind. m−3
C2 1800 ind. m−3
C3 1300 ind. m−3
C4 900 ind. m−3
C5 500 ind. m−3
adults 300 ind. m−3
Zmezo 4.2 mgC m−3
Acartia Egg 0 ind. m−3
N1-N6 0 ind. m−3
C1 1100 ind. m−3
C2 1000 ind. m−3
C3 900 ind. m−3
C4 700 ind. m−3
C5 400 ind. m−3
adults 300 ind. m−3
Zmezo 2 mgC m−3
Clupea harengus(3 cohorts) B1 30 mgC m−3
B2 15 mgC m−3
B3 7.5 mgC m−3
(iii) the mean weight for specific development stages ofspecies investigated were assumed after standard HEL-COM (Hernroth, 1985) for Gdansk Deep.
We assume that the available food concentration for allthe stages of the population of copepods investigated is thevalue of the food concentration (phytoplankton and other re-sources), as well as the notion that copepods feed continu-ously if there is food present. The products of mesozooplank-ton metabolism, which enter the nutrient model (i.e. excre-tion, remineralized fecal pellets and dead bodies), are evenlydistributed throughout the upper layer (Table 4). The remain-ing fecal pellets and dead bodies fall immediately to the ben-thic detritus.
Predator is represented by early juvenile of herringClu-pea harengus(4–10 cm). The Vistula Lagoon is an impor-tant spawning area for southern Baltic spring-spawning her-ring Clupea harengus. At the turn of winter and spring (inMarch), adults which migrate from the southern Baltic to thespawning are in the shallow and brackish water of the Vis-tula Lagoon (Fey, 2001). Herring in the Vistula Lagoon havethree cohorts each year (Margonski, 2000). Larvae abun-dance in Vistula Lagoon in 1999 was observed in 495–128individuals in 100 m3. When young herring are about 40 to50 mm, they undergo a metamorphosis, developing the mor-phological characteristics of adults; they are then identified
Table 4. Processes coupling the mesozooplankton submodel to theother components.
Total ingested material ING=∑2
k=1∑6
i=1 INGk,iZk,i
Total fecal pellet material FEC=∑2
k=1∑6
i=1 FECk,iZk,i
Total cadaverous material MOR=∑2
k=1∑6
i=1 MORk,iWk,i
Total metabolic products MET=∑2
k=1∑6
i=1 METk,iZk,i
as juveniles. Metamorphosis begins in June in Vistula La-goon. Herring early juveniles emigrated from the Polish partof the Vistula Lagoon; the juveniles of the first cohort mi-grated in June, the second cohort in July, and the third co-hort in August to the southern Baltic Sea. An early juvenile(ca. 40 mm) appears in the Gulf Gdansk after two weeks,assuming that its velocity was ca. 4 cm s−1, after Miller etal. (1988). Therefore, in these calculations it was assumedthat, during the first half of the year, the predator biomass isB=0.
4 Results
The 1-D biological upper layer model described inDzierzbicka-Głowacka (2005b), with the population dynam-ics submodel for copepods, was used in the numerical simu-lations of the seasonal dynamics ofPseudocalanus minutuselongatusandAcartia spp. in the southern Baltic Sea. How-ever, the experimental data relating to copepods were givenby Maritime Branch Materials (IMGW 2000) and Mudrak(2004).
4.1 Numerical simulations
The flow field and water temperature used as the inputs ofthe biological submodel were reproduced by the physicalsubmodel. However, wind stress, global radiation and theheat balance at the sea surface are determined from stan-dard meteorological components for the location (54◦52′ N,19◦10′ E) in Gdansk Gulf for 1999. In Dzierzbicka-Głowacka (2005a) the spring phytoplankton andPseudo-calanus elongatusdynamic in the southern Baltic Sea at thetwo stations were simulated. Here we present the resultsof the biological parts of the model for 1999 at the GdanskDeep, as well as the simulation made with a dynamic popu-lation ofP. m. elongatusandAcartiaspp.
4.1.1 Simulations of annual plankton cycle
Modeled temperature fields resulting from the physicalmodel (as the output) (Fig. 2a) were used for the primaryproduction, phytoplankton respiration and physiological pro-cesses of copepods calculation. The simulated tempera-ture began to increase during the second half of March and
Biogeosciences, 3, 635–650, 2006 www.biogeosciences.net/3/635/2006/

L. Dzierzbicka-Głowacka et al.: Seasonal dynamics of copepods in the southern Baltic Sea 641
(a) Temperature (◦C)
dep
th[m
]
10
20
30
40
50
0
60
70
Jan Feb Mar Apr May Jun AugJul Sep Oct Nov Dec
> 6
>12
> 2
>14
>4
>10
>8
>4
>16>18
>20
(b) Primary production (mgC m−3)
> 1
> 10
> 25
> 50
> 50
> 50
> 25
> 100
> 200400
> 200
> 300
dep
th[m
]
Jan
10
20
30
40
50
0
60
70
Feb Mar Apr May Jun AugJul Sep Oct Nov Dec
(c) Phosphate (mmol m−3)
dep
th[m
]
10
20
30
40
50
0
60
70
Jan Feb Mar Apr May Jun AugJul Sep Oct Nov Dec
mean observed values
< 0.1
0.6
0.2
0.2
X
X X
X X X
X
< 0.2
< 0.5
< 0.3
<0. 6
< 0.7
< 0.4
< 0.05
0.0
0.4 XX
X
X
X
X
0.0
0.0
0.4
0.0
0.20.4
0.4
0.50.4
< 0.8
< 0.9
< 1
X X
X
X X X
X
X X
X
X
X X X X X X X
0.5
0. 6
0. 6
1.2
0.0
0.5
0.5
0.5
1.1
0.1
0.2
1.1 1.3 1.2 1.5 1.2
X
X 1.2
0.5
Fig. 2. Annual simulation. Simulated profiles of temperature(a),primary production(b), nutrients – total inorganic nitrogen(c) andphosphate(d), phytoplankton(e), microzooplankton(f), small de-tritus (g), mesozooplankton –Pseudocalanus minutus elongatusandAcartia spp.(h) and early juvenile of herring(i) at the GdanskDeep in 1999.
reached ca. 21◦C in August. The destruction of the thermo-cline starts in the late fall. Probably, the spring bloom in thisyear was triggered in the first half of March. The bloom isinitiated by the heating event and the extremely low winds.The end of permanent overturning of the water column inmid-March in the main event allows the phytoplankton tostart growing (Fig. 2b). The depths of the upper layer, whichare determined by the mixing intensity in the water column,show that strong gradients in the nutrient concentration de-velop (Figs. 2c and d). The phytoplankton biomass (Fig. 2e)reflects the nutrient availability, showing a strong nutrient –
(d) Total inorganic nitrogen (mmol m−3)
dep
th[m
]
Jan
10
20
30
40
50
0
60
70
Feb Mar Apr May Jun AugJul Sep Oct Nov Dec
mean observed values
< 1
4 4 3
3
31 1
11
X
X X
X X
XX
< 2
< 4
< 5
< 8< 7
< 6
< 0.5
4
X
X
X
X
XX
X
X
0 0
0 0
0
0
6
34< 3
< 9
< 10
X
X
X
X
X
X X X
4 X X
X X
X X X
XXX
5
10 10
4 4
4
9 9 8 8 810
(e)Phytoplankton (mgC m−3)
dep
th[m
]
Jan
10
20
30
40
50
0
60
70
Feb Mar Apr May Jun AugJul Sep Oct Nov Dec
> 200
> 300
> 100
> 50
400
> 25
> 1
> 5
> 10
(f) Microzooplankton (mgC m−3)
dep
th[m
]
Jan
10
20
30
40
50
0
60
70
Feb Mar Apr May Jun AugJul Sep Oct Nov Dec
> 2
>25
> 5
> 10
> 15
> 20
>30>10
> 1
Fig. 2. Continued.
depleting spring bloom. The phytoplankton biomass reachedthe mean maximum values ca. 400 mgC m−3 in the upper10-m layer in the spring bloom. The highest value occurredin the second half of April and equaled ca. 530 mgC m−3
on the surface sea (Fig. 2e). This situation is caused by thehigh nutrient concentrations and daily global radiation in thelast decade, focusing on March and April. The phytoplank-ton biomass was low in summer, from June till August, mostlikely as a result of a faster depletion of nutrients and the phy-toplankton grazing by micro- and mesozooplankton. The de-velopment of microzooplankton was exactly correlated withthe development of phytoplankton (Fig. 2f). Generally, thegreatest amounts of microzooplankton occurred in the up-per layer, in the periods of large biomass of algae. Biomassof microzooplankton was characterized by the occurrence of
www.biogeosciences.net/3/635/2006/ Biogeosciences, 3, 635–650, 2006
642 L. Dzierzbicka-Głowacka et al.: Seasonal dynamics of copepods in the southern Baltic Sea
(g) Small detritus (mgC m−3)
dep
th[m
]
Jan
10
20
30
40
50
0
60
70
Feb Mar Apr May Jun AugJul Sep Oct Nov Dec
150
100
> 50
200
> 25
> 75
> 25
> 25
> 1
> 1
> 0.5 > 0.5
> 5
> 5
> 10
> 10
(h) Mesozooplankton (mgC m−3)
dep
th[m
]
Jan
10
20
30
40
50
0
60
70
Feb Mar Apr May Jun AugJul Sep Oct Nov Dec
> 0.1
> 0.1> 0.08
> 0.25
> 0.5
> 0.5
> 0.09
> 3
> 4
> 5
> 1
> 3>1.5>1.5
>0
.25
>8 >
6
>6
>3
(i) Predator (mgC m−3)
dep
th[m
]
10
20
30
40
50
0
60
70
AugJul Sep Oct Nov Dec
> 50
> 50>70
>70
> 60
> 60
> 40
> 80
> 80
> 30
> 100
> 90 > 90
< 105
Fig. 2. Continued.
two biomass peaks in a year; at the turn of summer and au-tumn. A considerable increase inZmicro took place in April,shortly after the beginning of the spring bloom. The micro-zooplankton biomass was ca. 30 mgC m−3 in the springtime;however, in the summertime, it fell below 10 mgC m−3, withsimultaneous decreasing phytoplankton biomass, and reap-peared in early autumn with higher biomass. Small pelagicdetritus (Fig. 2g) was abundant mainly when the phytoplank-ton concentration exceeded 200 mgC m−3, and its maximumconcentration was deeper than the 20 m layer.
The biomass of mesozooplankton, represent byPseudo-calanus andAcartia, increased in the first half of the year,reaching maximum values from ca. 8 mgC m−3 at the turnof June and July (Fig. 2h). This increase was mainly fromgrowth in successive stages and egg production. In autumn a
Jan Feb Mar Apr May Jun Jul Aug Sep Oct Nov Dec0.0
0.5
1.0
1.5
2.0
2.5
3.0
3.5
4.0
Wei
ghtW
i[gC
]
123456
1 st generation
2 nd generation
3 rd generation
6 cohorts of P. minutus elongatusA
Jan Feb Mar Apr May Jun Jul Aug Sep Oct Nov Dec10
102
103
104
105
106
Num
bers
Zi[N
o.m
-2]
123456
1 st generation
2 nd generation
3 rd generation
6 cohorts of P. minutus elongatusB
Jan Feb Mar Apr May Jun Jul Aug Sep Oct Nov Dec0
50
100
150
200
250
300
350
400
Bio
mas
s[m
gCm
-2]
123456
C 6 cohorts of P. minutus elongatus
i6
Ci
mean observed values
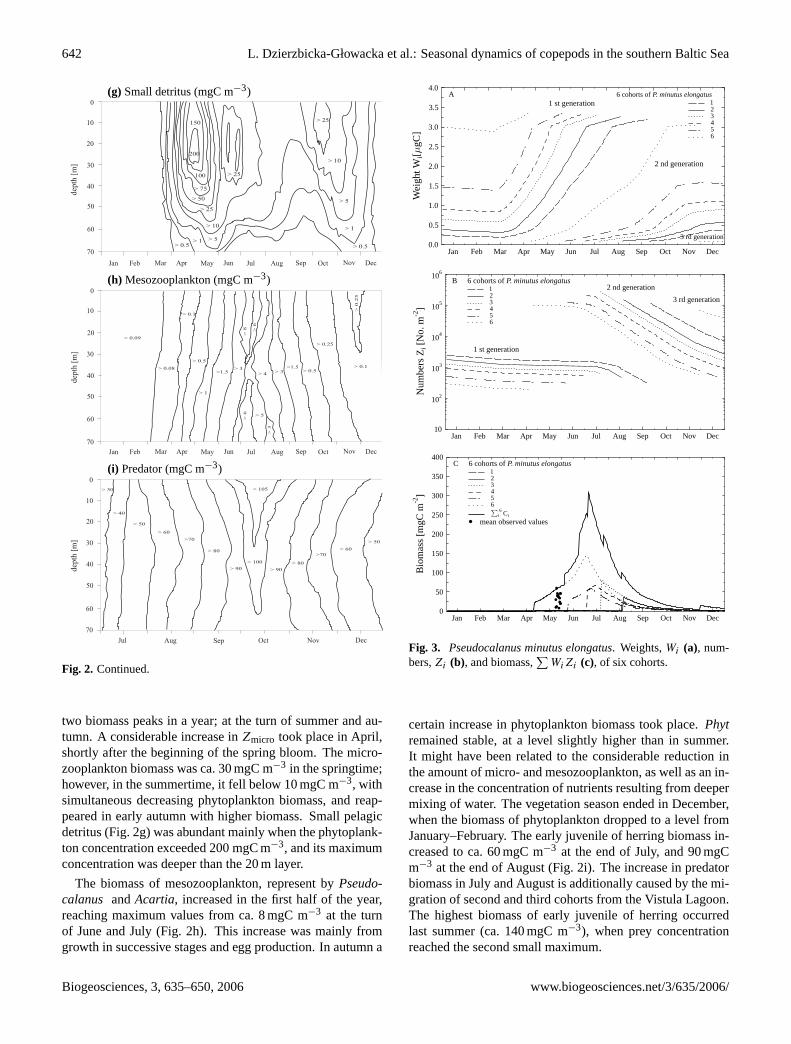
Fig. 3. Pseudocalanus minutus elongatus. Weights,Wi (a), num-bers,Zi (b), and biomass,
∑WiZi (c), of six cohorts.
certain increase in phytoplankton biomass took place.Phytremained stable, at a level slightly higher than in summer.It might have been related to the considerable reduction inthe amount of micro- and mesozooplankton, as well as an in-crease in the concentration of nutrients resulting from deepermixing of water. The vegetation season ended in December,when the biomass of phytoplankton dropped to a level fromJanuary–February. The early juvenile of herring biomass in-creased to ca. 60 mgC m−3 at the end of July, and 90 mgCm−3 at the end of August (Fig. 2i). The increase in predatorbiomass in July and August is additionally caused by the mi-gration of second and third cohorts from the Vistula Lagoon.The highest biomass of early juvenile of herring occurredlast summer (ca. 140 mgC m−3), when prey concentrationreached the second small maximum.
Biogeosciences, 3, 635–650, 2006 www.biogeosciences.net/3/635/2006/
L. Dzierzbicka-Głowacka et al.: Seasonal dynamics of copepods in the southern Baltic Sea 643
4.1.2 Pseudocalanus minutus elongatus
The distributions shown in Fig. 3 present the changes in val-ues of weightsWi (Fig. 3a) and numbersZi (Fig. 3b), and thebiomasses of six cohortsWiZi (Fig. 3c) ofPseudocalanus.
One complete distinct generation (6th cohort of 2nd gen-eration) developed throughout the seven mouths, beginningin mid-April and ending in mid-November.
The peaks of the biomass (see Fig. 3c) were due to eggproduction, in mid-April – of 6th cohort of the 1st generation,at the turn of May and June – of 5th cohort, as well as toa high degree of 6th cohort biomass, in mid-June – of 4thcohort, as well as to a high degree of 6th cohort biomass andto a lower degree of 5th, at the turn June and July – of 3rdcohort, as well as to a high degree of 6th cohort biomass andto a lower degree of 4th and 5th, in mid-July – of 2nd cohort,as well as to a high degree of 6th cohort biomass and to alower degree of 3rd, 4th and 5th cohorts biomass and at thefirst half of August – of 1st cohort, as well as 2nd, 3rd, 4th,5th and 6th cohorts biomass of the 1st generation.
The phytoplankton peak in September permitted a newgrowth period for the second generation copepodite stages(visible mainly in the weight curves); and females of the 6thcohort produced a relatively small number of eggs to yield athird generation in November.
The total depth integrated biomass ofPseudocalanusischaracterized by one peak biomass. The maximum totalbiomass (ca. 330 mgC m−2) was at the turn of June and July(see Fig. 3c). Figure 3 clearly illustrates the overlap be-tween the first and second generations. The second gener-ation, present the first spawning, seemed to develop slowlyand with a higher mortality.
During winter, the total biomass ofPseudocalanusslightlydecrease, invisible at Fig. 3c, because of a weights decreaseof individuals subject to lack of food (see Fig. 3a), as wellas of a numbers decrease, because the weights and numbersof individuals decreased slightly owing to the lack of foodand the low mortality. The biomass then increased as a resultof a considerable increase in the individuals weight for thecopepodite stages. In spring, the individuals became activeand they grew by feeding on the phytoplankton bloom, andthe adult females produced eggs. By combining the informa-tion on growth with the dynamics of individuals, we can af-firm that most individuals had a lower growth rate during thenaupliar and copepodite phases, with a low phytoplanktonbiomass in summer; subsequently, the copepodite stages re-sumed exponential growth with the rise of phytoplankton inSeptember (Fig. 3a). Individuals of the 3rd generation wereproduced in November by the females of the 6th cohort of the2nd generation, but they developed no farther than stage N3,due to a lack of food and the severe decrease in temperature.Growth curves stopped because of the death of individualsand which of the weights and numbers decreased. Any de-crease in numbers was caused by mortality and at the secondhalf of year, also by predation. The rate of mortality was high
Jan Feb Mar Apr May Jun Jul Aug Sep Oct Nov Dec10
2
2
5
103
2
5
104
2
5
105
2
5
106
Num
bers
Zi[N
o.m
-2]
123456
1 st generation
2 nd generation
3 rd generation
4 th generation
6 cohorts of Acartia spp.B
Jan Feb Mar Apr May Jun Jul Aug Sep Oct Nov Dec0.0
0.2
0.4
0.6
0.8
1.0
1.2
1.4
1.6
1.8
2.0
Wei
ghtW
i[
gC]
123456
1 st generation 2 nd generation
3 rd generation
4 th generation
6 cohorts of Acartia spp.A
Jan Feb Mar Apr May Jun Jul Aug Sep Oct Nov Dec0
20
40
60
80
100
120
140
160
Bio
mas
s[m
gCm
-2]
123456
i6
Ci
C 6 cohorts of Acartia spp.
mean observed values
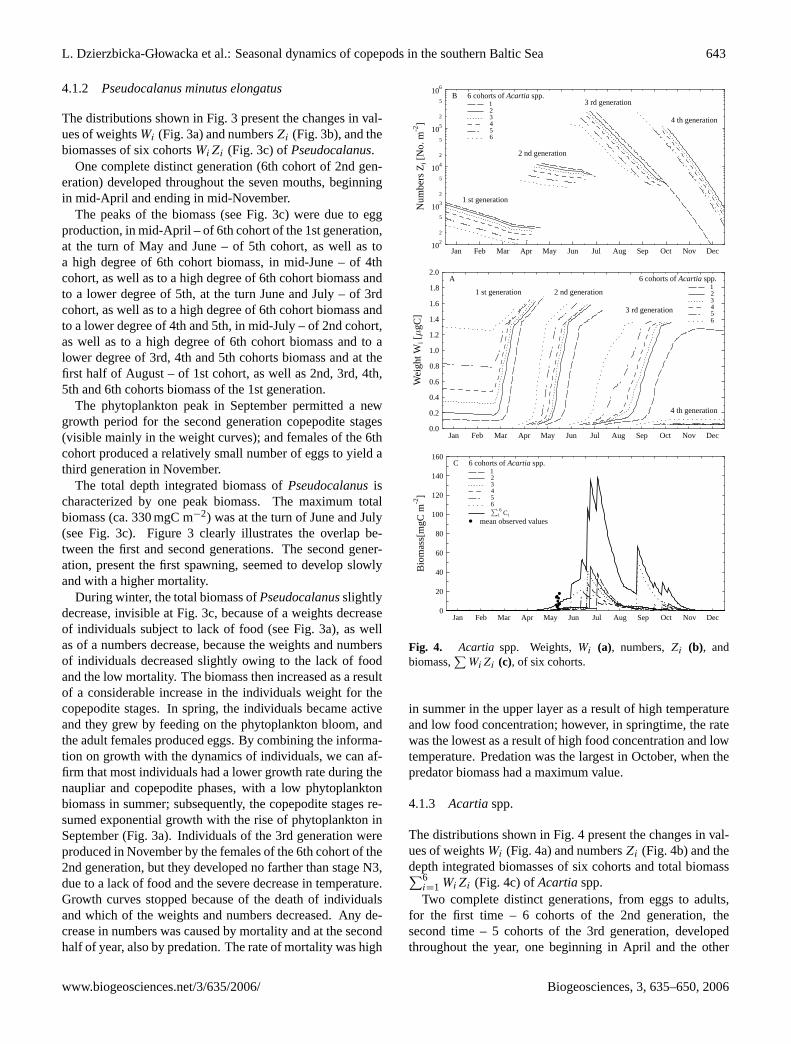
Fig. 4. Acartia spp. Weights,Wi (a), numbers,Zi (b), andbiomass,
∑WiZi (c), of six cohorts.
in summer in the upper layer as a result of high temperatureand low food concentration; however, in springtime, the ratewas the lowest as a result of high food concentration and lowtemperature. Predation was the largest in October, when thepredator biomass had a maximum value.
4.1.3 Acartiaspp.
The distributions shown in Fig. 4 present the changes in val-ues of weightsWi (Fig. 4a) and numbersZi (Fig. 4b) and thedepth integrated biomasses of six cohorts and total biomass∑6
i=1 WiZi (Fig. 4c) ofAcartiaspp.Two complete distinct generations, from eggs to adults,
for the first time – 6 cohorts of the 2nd generation, thesecond time – 5 cohorts of the 3rd generation, developedthroughout the year, one beginning in April and the other
www.biogeosciences.net/3/635/2006/ Biogeosciences, 3, 635–650, 2006
644 L. Dzierzbicka-Głowacka et al.: Seasonal dynamics of copepods in the southern Baltic Sea
from mid-June to mid-July (see Figs. 4a and b). The totalbiomass ofAcartia is characterized by two biomass peaks, inJuly – main, and small, in September. The peak of biomassin July (ca. 140 mgC m−2, see Fig. 4c) was mainly due tothe high egg production by adults of the 2nd generation (1st,2nd, 3rd and 4th cohorts), as a result of the very high num-bers of adults (Fig. 4b). Figures 4a and b clearly illustratesthe overlap between generations. The 3rd generation, presentfrom the first spawning in mid-June by the 6th cohort to theadults at the turn of August and September, as well as thefirst spawning at the turn June and July by the 5th, 4th, 3rd,and 2nd cohorts to the adults in September, seemed to devel-oped slowly (Fig. 4a) and had a high predation rate (Fig. 4b),i.e. the total development time of the 6th cohort was 75 daysand of the 2nd cohort – 90 days. The second peak of biomassin September (ca. 70 mgC m−2, see Fig. 4c) was mainly dueto the high egg production of adults of the 6th cohort of the3rd generation (Fig. 4b), as a result of high temperature. Thephytoplankton peak in September permitted a new growthperiod for the 3rd generation copepodite stages, and femalesof the 5th, 4th, 3rd, and 2nd cohorts of the 3rd generationproduced relatively small eggs to give a 4th generation inOctober.
In the spring bloom, a substantial growth of phytoplank-ton biomass was observed which fell at the next stage as aresult of an increase first in microzooplankton, and next inmesozooplankton biomass. This growth in biomass of suc-cessive cohorts of copepods is caused by an increase in bodyweight and egg production by each of the adults. This sit-uation leads to the substantial growth in the total biomass,∑2
k=1∑6
i=1 WiZi , which is the algebraic sum of the prod-ucts of the weights,Wi , and numbers,Zi , of both species.
The biomass peak ofPseudocalanusappeared at the turnof June and July; however, theAcartia biomass was char-acterized by two biomass peaks in a year; in July and inSeptember.
These small maxima occurring in the distributions of in-vestigated species are the result mainly of a brood by suc-cessive cohorts, causing their numbers to increase. The cal-culations demonstrate that the growth of the weight of eachcohort is mainly caused by temperature and a substantial in-crease in phytoplankton biomass. The body weight of cope-pods strongly increases in the spring bloom, because in thetime the growth rate is higher as a result of larger phyto-plankton biomass. In this period, temperature has also sig-nificant influence on the growth ofPseudocalanus, causingthe growth rate tends to maximum.
4.2 Experimental data
The most important species in the Gdansk Gulf areAcartiaspp. (i.e.A. bifilosa, A. longiremisandA. tonsa) andCen-tropages hamatus, Temora longicornis, andPseudocalanusminutus elongatus. In the Gdansk Deep a fourth species,Pseudocalanus, occurred in great abundance, where in a
deeper layer, below 30 m, it became dominant, and belowthe isohaline layer – almost the only representative of meso-zooplankton. In 1999 at the Gdansk Deep, the predominantspecies werePseudocalanus minutus elongatusandAcartialongiremis(see Maritime Branch Materials, IMGW 2000).The results of the numerical simulations described here arecompared to the mean observed values, assuming an organiccarbon content of copepodsgC/gw.w=0.064 (Vinogradovand Shushkina, 1987). The mean biomass of all copepods(8 species) in the whole column water in the Gdansk Deepin 1999, was obtained Maritime Branch Materials, IMGW2000, i.e. in March – ca. 20, April – ca. 45 , June – ca. 80 andAugust – ca. 100 mgw.w m−3 and it corresponds to 1.3, 2.9,5.1 and 6.4 mgC m−3. However, the mean biomass of inves-tigated species calculated here was ca. two times lower thanobserved values, except in March; i.e. in March – ca. 0.1,April – ca. 1.2, June – ca. 2.8 and August – ca. 3.8 mgC m−3.
The plankton material was also collected during 20–25May 1999 in diurnal cycles from the water column, whichwas divided into several layers. The hauls were made us-ing a Copenhagen net (100µm). Every single sample wasprepared and analysed according to standard methods (HEL-COM). Numbers ofP. m. elongatusandAcartiaspp. for spe-cific development stages were given by Mudrak (2004). Dur-ing this period, the vertical distributions of observed biomassin diurnal cycles were different, i.e. in the 0.07–0.8 mgC m−3
range in the upper-euphotic layer and 0.1–0.9 mgC m−3 inthe lower one forPseudocalanusand 0.02–1 mgCm−3 inthe upper layer and 0.03–0.55 mgC m−3 in the lower one forAcartia. The average value of the biomass in the whole col-umn water in these days was 0.395 mgC m−3 for Acartiaand0.728 mgC m−3 for Pseudocalanus.
Figures 3c and 4c show the results of numerical simula-tions, as well as observed data for depth integrated biomassof investigated species. Depth integrated biomass was in the1.8–42 mgC m−2 range forAcartiaand in the 6–63 mgC m−2
range for Pseudocalanusat the end of May after exper-imental data. However, the mean observed values were13 mgC m−2 for Acartia and 48 mgC m−2 for Pseudo-calanusand they are slightly higher (ca. 25%) forAcartiaand ca. 20% lower forPseudocalanusthan mean obtainedhere, i.e. the calculated mean biomass was ca. 10 mgC m−2
for Acartiaand ca. 60 mgC m−2 for Pseudocalanus.
5 Discussion
The simulated biological characteristics (i.e. the inorganicnitrogen and phosphate concentrations, the phytoplanktonbiomass and depth integrated ofPseudocalanus minutuselongatusandAcartiaspp. biomass) in the model were com-pared to the observations from the investigated water regions.Taking into consideration the fact that outputs of the meteo-rological submodel were obtained using meteorological datafor 1999, the comparison of numerical results will be made
Biogeosciences, 3, 635–650, 2006 www.biogeosciences.net/3/635/2006/
L. Dzierzbicka-Głowacka et al.: Seasonal dynamics of copepods in the southern Baltic Sea 645
Jan Feb Mar Apr May Jun AugJul Sep Oct Nov Dec
0
0.1
0.2
0.3
0.4
0.5
0.6 6
5
4
3
2
1
0
**
*
*
**p
ho
sph
ate
[mm
ol
m]
-3
O
O
O
OO O* *
O
O
tota
ln
itra
te[m
mo
lm
]-3
*Omean observed values of phosphate
mean observed values of nitrogen
simulated values of phosphate
simulated values of nitrogen
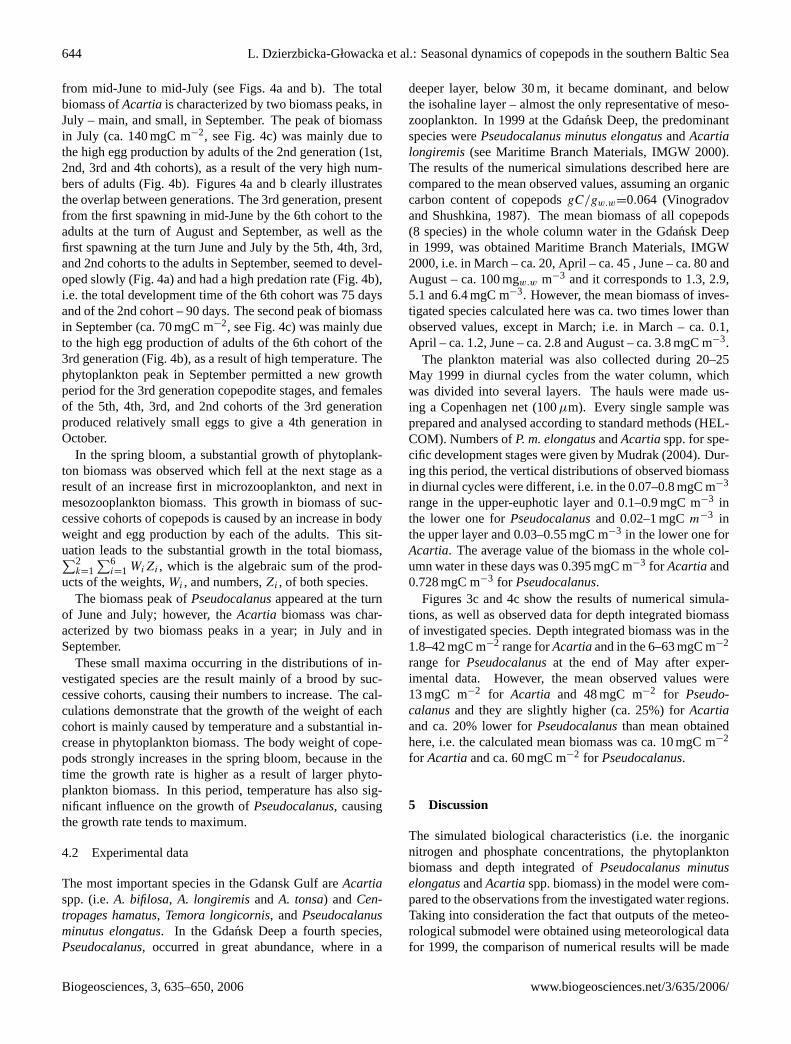
Fig. 5. Simulated and mean observed values of nutrient in the 15-mupper layer at the Gdansk Deep in 1999.
to the mean values of empirical data for 1999 on the basis ofvarious authorities.
The outstanding problem concerns the quality of field dataused to test such simulations. The problems of data arisefrom the fact that the variability in space and time of zoo-plankton is usually so great that any model that has the rightorders of magnitude in its outputs will fit the data. Thus,even with models treating herbivores in some detail, the test-ing of these models may rest primarily upon the nutrient andphytoplankton levels, which can be measured with greateraccuracy.
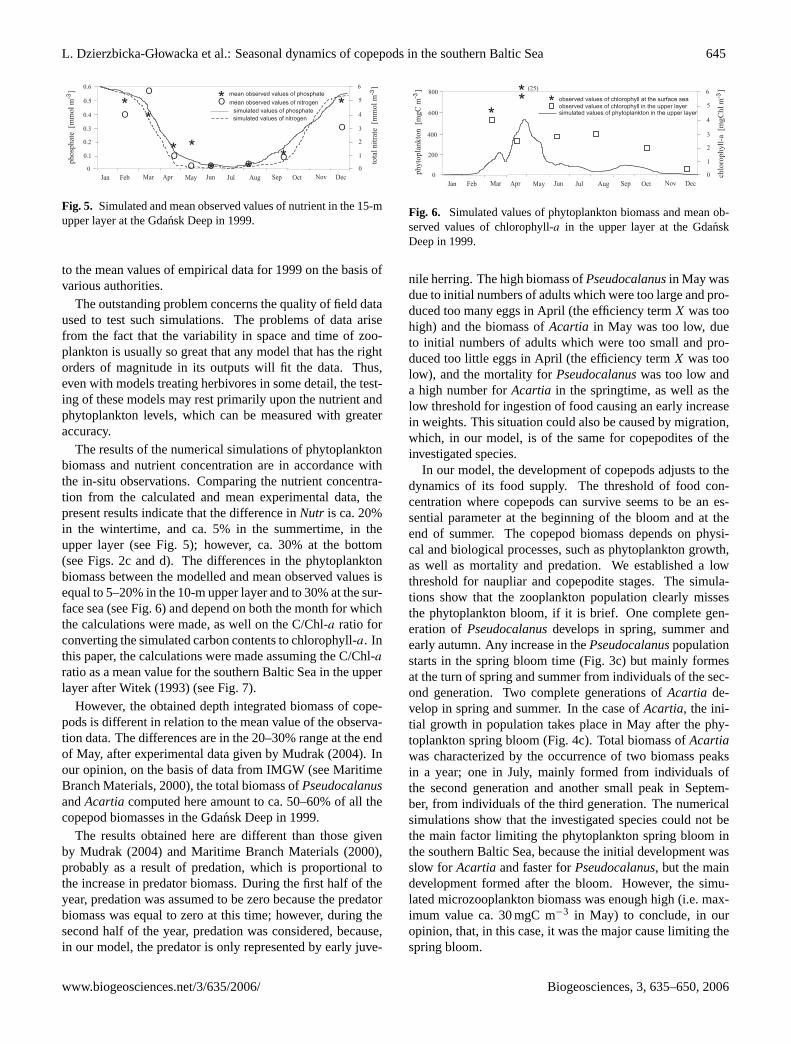
The results of the numerical simulations of phytoplanktonbiomass and nutrient concentration are in accordance withthe in-situ observations. Comparing the nutrient concentra-tion from the calculated and mean experimental data, thepresent results indicate that the difference inNutr is ca. 20%in the wintertime, and ca. 5% in the summertime, in theupper layer (see Fig. 5); however, ca. 30% at the bottom(see Figs. 2c and d). The differences in the phytoplanktonbiomass between the modelled and mean observed values isequal to 5–20% in the 10-m upper layer and to 30% at the sur-face sea (see Fig. 6) and depend on both the month for whichthe calculations were made, as well on the C/Chl-a ratio forconverting the simulated carbon contents to chlorophyll-a. Inthis paper, the calculations were made assuming the C/Chl-a
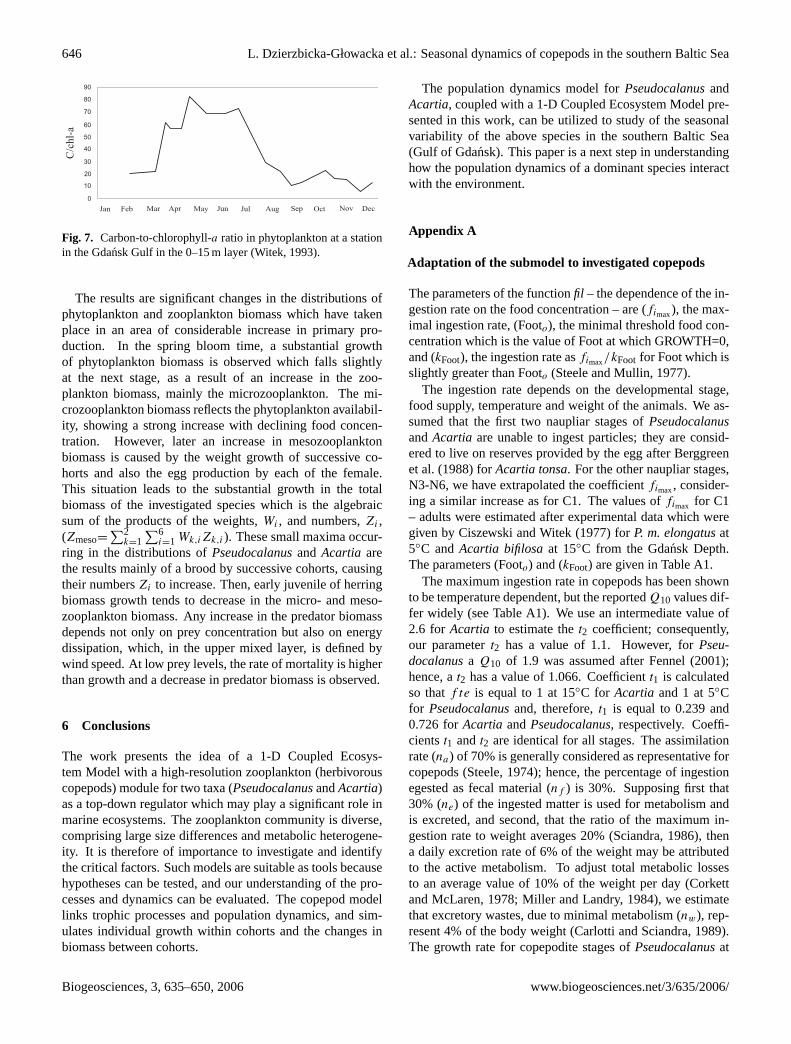
ratio as a mean value for the southern Baltic Sea in the upperlayer after Witek (1993) (see Fig. 7).
However, the obtained depth integrated biomass of cope-pods is different in relation to the mean value of the observa-tion data. The differences are in the 20–30% range at the endof May, after experimental data given by Mudrak (2004). Inour opinion, on the basis of data from IMGW (see MaritimeBranch Materials, 2000), the total biomass ofPseudocalanusandAcartia computed here amount to ca. 50–60% of all thecopepod biomasses in the Gdansk Deep in 1999.
The results obtained here are different than those givenby Mudrak (2004) and Maritime Branch Materials (2000),probably as a result of predation, which is proportional tothe increase in predator biomass. During the first half of theyear, predation was assumed to be zero because the predatorbiomass was equal to zero at this time; however, during thesecond half of the year, predation was considered, because,in our model, the predator is only represented by early juve-
Jan Feb Mar Apr May Jun AugJul Sep Oct Nov Dec
0
200
400
600
800 6
5
4
3
2
1
0
*
chlo
rop
hy
ll-a
[mg
Ch
lm
]-3
ph
yto
pla
nk
ton
[mg
Cm
]-3
* observed values of chlorophyll at the surface sea
simulated values of phytoplankton in the upper layer
**
(25)
observed values of chlorophyll in the upper layer
Fig. 6. Simulated values of phytoplankton biomass and mean ob-served values of chlorophyll-a in the upper layer at the GdanskDeep in 1999.
nile herring. The high biomass ofPseudocalanusin May wasdue to initial numbers of adults which were too large and pro-duced too many eggs in April (the efficiency termX was toohigh) and the biomass ofAcartia in May was too low, dueto initial numbers of adults which were too small and pro-duced too little eggs in April (the efficiency termX was toolow), and the mortality forPseudocalanuswas too low anda high number forAcartia in the springtime, as well as thelow threshold for ingestion of food causing an early increasein weights. This situation could also be caused by migration,which, in our model, is of the same for copepodites of theinvestigated species.
In our model, the development of copepods adjusts to thedynamics of its food supply. The threshold of food con-centration where copepods can survive seems to be an es-sential parameter at the beginning of the bloom and at theend of summer. The copepod biomass depends on physi-cal and biological processes, such as phytoplankton growth,as well as mortality and predation. We established a lowthreshold for naupliar and copepodite stages. The simula-tions show that the zooplankton population clearly missesthe phytoplankton bloom, if it is brief. One complete gen-eration ofPseudocalanusdevelops in spring, summer andearly autumn. Any increase in thePseudocalanuspopulationstarts in the spring bloom time (Fig. 3c) but mainly formesat the turn of spring and summer from individuals of the sec-ond generation. Two complete generations ofAcartia de-velop in spring and summer. In the case ofAcartia, the ini-tial growth in population takes place in May after the phy-toplankton spring bloom (Fig. 4c). Total biomass ofAcartiawas characterized by the occurrence of two biomass peaksin a year; one in July, mainly formed from individuals ofthe second generation and another small peak in Septem-ber, from individuals of the third generation. The numericalsimulations show that the investigated species could not bethe main factor limiting the phytoplankton spring bloom inthe southern Baltic Sea, because the initial development wasslow for Acartia and faster forPseudocalanus, but the maindevelopment formed after the bloom. However, the simu-lated microzooplankton biomass was enough high (i.e. max-imum value ca. 30 mgC m−3 in May) to conclude, in ouropinion, that, in this case, it was the major cause limiting thespring bloom.
www.biogeosciences.net/3/635/2006/ Biogeosciences, 3, 635–650, 2006
646 L. Dzierzbicka-Głowacka et al.: Seasonal dynamics of copepods in the southern Baltic Sea
Jan Feb Mar Apr May Jun AugJul Sep Oct Nov Dec
90
80
70
60
50
40
30
20
10
0
C/c
hl-
a
Fig. 7. Carbon-to-chlorophyll-a ratio in phytoplankton at a stationin the Gdansk Gulf in the 0–15 m layer (Witek, 1993).
The results are significant changes in the distributions ofphytoplankton and zooplankton biomass which have takenplace in an area of considerable increase in primary pro-duction. In the spring bloom time, a substantial growthof phytoplankton biomass is observed which falls slightlyat the next stage, as a result of an increase in the zoo-plankton biomass, mainly the microzooplankton. The mi-crozooplankton biomass reflects the phytoplankton availabil-ity, showing a strong increase with declining food concen-tration. However, later an increase in mesozooplanktonbiomass is caused by the weight growth of successive co-horts and also the egg production by each of the female.This situation leads to the substantial growth in the totalbiomass of the investigated species which is the algebraicsum of the products of the weights,Wi , and numbers,Zi ,(Zmeso=
∑2k=1
∑6i=1 Wk,iZk,i). These small maxima occur-
ring in the distributions ofPseudocalanusand Acartia arethe results mainly of a brood by successive cohorts, causingtheir numbersZi to increase. Then, early juvenile of herringbiomass growth tends to decrease in the micro- and meso-zooplankton biomass. Any increase in the predator biomassdepends not only on prey concentration but also on energydissipation, which, in the upper mixed layer, is defined bywind speed. At low prey levels, the rate of mortality is higherthan growth and a decrease in predator biomass is observed.
6 Conclusions
The work presents the idea of a 1-D Coupled Ecosys-tem Model with a high-resolution zooplankton (herbivorouscopepods) module for two taxa (PseudocalanusandAcartia)as a top-down regulator which may play a significant role inmarine ecosystems. The zooplankton community is diverse,comprising large size differences and metabolic heterogene-ity. It is therefore of importance to investigate and identifythe critical factors. Such models are suitable as tools becausehypotheses can be tested, and our understanding of the pro-cesses and dynamics can be evaluated. The copepod modellinks trophic processes and population dynamics, and sim-ulates individual growth within cohorts and the changes inbiomass between cohorts.
The population dynamics model forPseudocalanusandAcartia, coupled with a 1-D Coupled Ecosystem Model pre-sented in this work, can be utilized to study of the seasonalvariability of the above species in the southern Baltic Sea(Gulf of Gdansk). This paper is a next step in understandinghow the population dynamics of a dominant species interactwith the environment.
Appendix A
Adaptation of the submodel to investigated copepods
The parameters of the functionfil – the dependence of the in-gestion rate on the food concentration – are (fimax), the max-imal ingestion rate, (Footo), the minimal threshold food con-centration which is the value of Foot at which GROWTH=0,and (kFoot), the ingestion rate asfimax/kFoot for Foot which isslightly greater than Footo (Steele and Mullin, 1977).
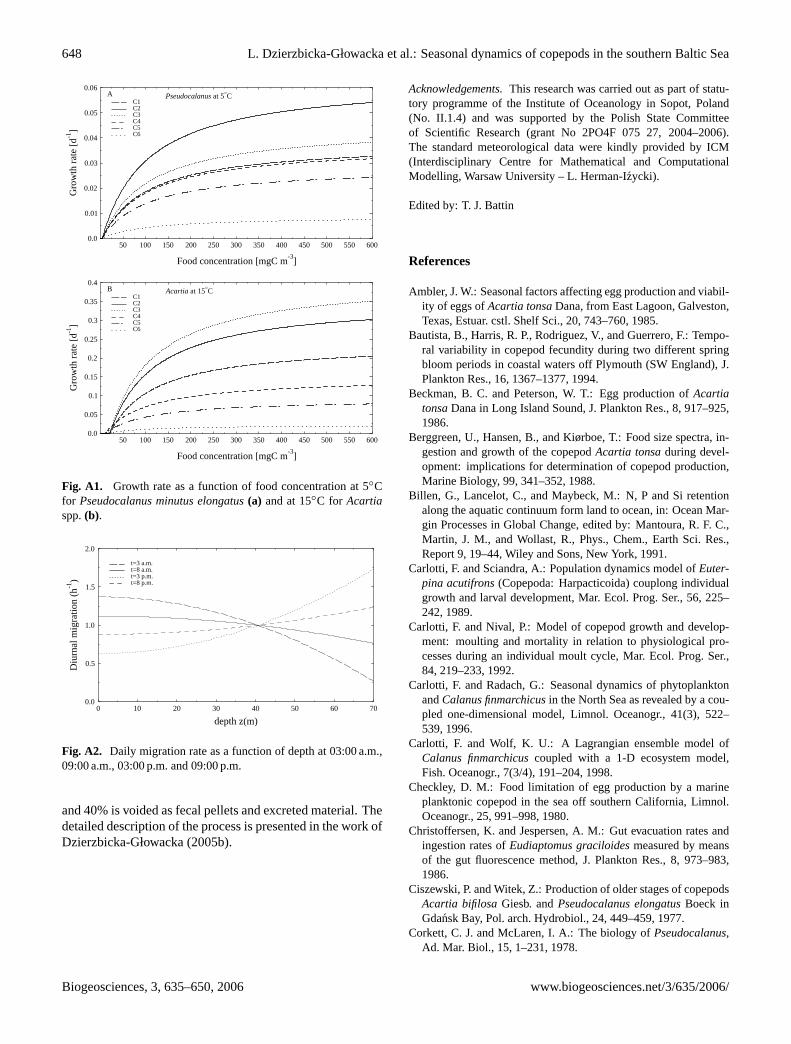
The ingestion rate depends on the developmental stage,food supply, temperature and weight of the animals. We as-sumed that the first two naupliar stages ofPseudocalanusandAcartia are unable to ingest particles; they are consid-ered to live on reserves provided by the egg after Berggreenet al. (1988) forAcartia tonsa. For the other naupliar stages,N3-N6, we have extrapolated the coefficientfimax, consider-ing a similar increase as for C1. The values offimax for C1– adults were estimated after experimental data which weregiven by Ciszewski and Witek (1977) forP. m. elongatusat5◦C andAcartia bifilosaat 15◦C from the Gdansk Depth.The parameters (Footo) and (kFoot) are given in Table A1.
The maximum ingestion rate in copepods has been shownto be temperature dependent, but the reportedQ10 values dif-fer widely (see Table A1). We use an intermediate value of2.6 for Acartia to estimate thet2 coefficient; consequently,our parametert2 has a value of 1.1. However, forPseu-docalanusa Q10 of 1.9 was assumed after Fennel (2001);hence, at2 has a value of 1.066. Coefficientt1 is calculatedso thatf te is equal to 1 at 15◦C for Acartia and 1 at 5◦Cfor Pseudocalanusand, therefore,t1 is equal to 0.239 and0.726 forAcartia andPseudocalanus, respectively. Coeffi-cientst1 andt2 are identical for all stages. The assimilationrate (na) of 70% is generally considered as representative forcopepods (Steele, 1974); hence, the percentage of ingestionegested as fecal material (nf ) is 30%. Supposing first that30% (ne) of the ingested matter is used for metabolism andis excreted, and second, that the ratio of the maximum in-gestion rate to weight averages 20% (Sciandra, 1986), thena daily excretion rate of 6% of the weight may be attributedto the active metabolism. To adjust total metabolic lossesto an average value of 10% of the weight per day (Corkettand McLaren, 1978; Miller and Landry, 1984), we estimatethat excretory wastes, due to minimal metabolism (nw), rep-resent 4% of the body weight (Carlotti and Sciandra, 1989).The growth rate for copepodite stages ofPseudocalanusat
Biogeosciences, 3, 635–650, 2006 www.biogeosciences.net/3/635/2006/
L. Dzierzbicka-Głowacka et al.: Seasonal dynamics of copepods in the southern Baltic Sea 647
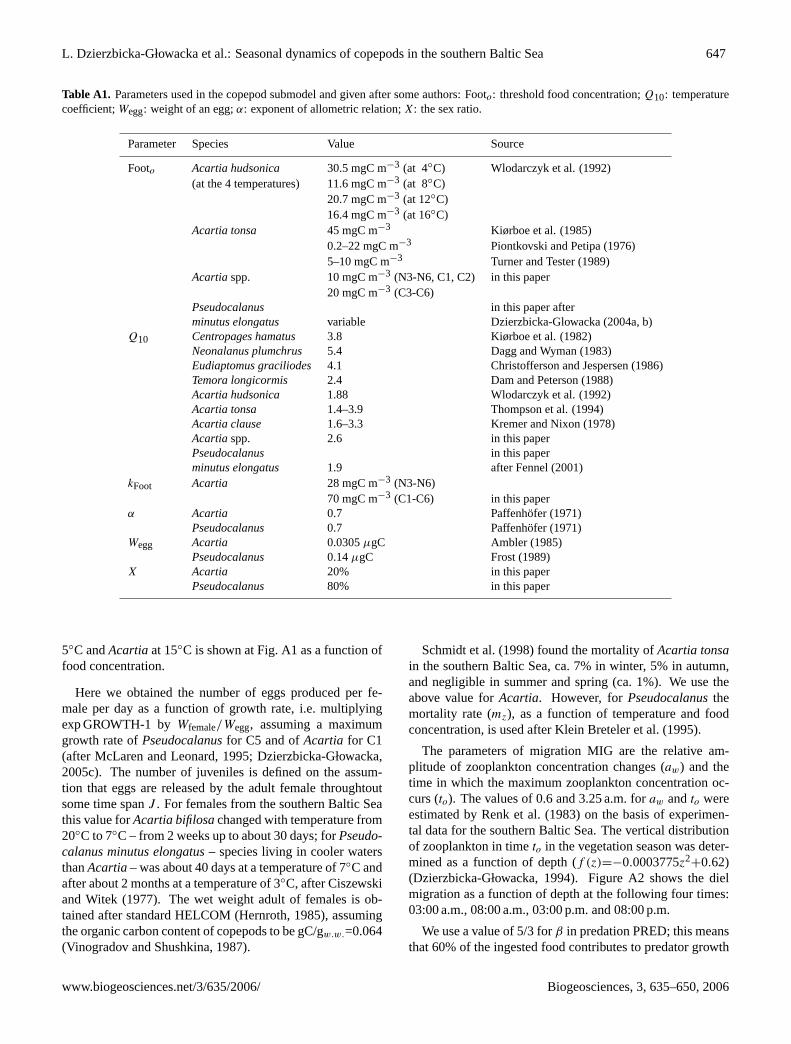
Table A1. Parameters used in the copepod submodel and given after some authors: Footo: threshold food concentration;Q10: temperaturecoefficient;Wegg: weight of an egg;α: exponent of allometric relation;X: the sex ratio.
Parameter Species Value Source
Footo Acartia hudsonica 30.5 mgC m−3 (at 4◦C) Wlodarczyk et al. (1992)(at the 4 temperatures) 11.6 mgC m−3 (at 8◦C)
20.7 mgC m−3 (at 12◦C)16.4 mgC m−3 (at 16◦C)
Acartia tonsa 45 mgC m−3 Kiørboe et al. (1985)0.2–22 mgC m−3 Piontkovski and Petipa (1976)5–10 mgC m−3 Turner and Tester (1989)
Acartiaspp. 10 mgC m−3 (N3-N6, C1, C2) in this paper20 mgC m−3 (C3-C6)
Pseudocalanus in this paper afterminutus elongatus variable Dzierzbicka-Glowacka (2004a, b)
Q10 Centropages hamatus 3.8 Kiørboe et al. (1982)Neonalanus plumchrus 5.4 Dagg and Wyman (1983)Eudiaptomus graciliodes 4.1 Christofferson and Jespersen (1986)Temora longicormis 2.4 Dam and Peterson (1988)Acartia hudsonica 1.88 Wlodarczyk et al. (1992)Acartia tonsa 1.4–3.9 Thompson et al. (1994)Acartia clause 1.6–3.3 Kremer and Nixon (1978)Acartiaspp. 2.6 in this paperPseudocalanus in this paperminutus elongatus 1.9 after Fennel (2001)
kFoot Acartia 28 mgC m−3 (N3-N6)70 mgC m−3 (C1-C6) in this paper
α Acartia 0.7 Paffenhofer (1971)Pseudocalanus 0.7 Paffenhofer (1971)
Wegg Acartia 0.0305µgC Ambler (1985)Pseudocalanus 0.14µgC Frost (1989)
X Acartia 20% in this paperPseudocalanus 80% in this paper
5◦C andAcartiaat 15◦C is shown at Fig. A1 as a function offood concentration.
Here we obtained the number of eggs produced per fe-male per day as a function of growth rate, i.e. multiplyingexp GROWTH-1 byWfemale/Wegg, assuming a maximumgrowth rate ofPseudocalanusfor C5 and ofAcartia for C1(after McLaren and Leonard, 1995; Dzierzbicka-Głowacka,2005c). The number of juveniles is defined on the assum-tion that eggs are released by the adult female throughtoutsome time spanJ . For females from the southern Baltic Seathis value forAcartia bifilosachanged with temperature from20◦C to 7◦C – from 2 weeks up to about 30 days; forPseudo-calanus minutus elongatus– species living in cooler watersthanAcartia– was about 40 days at a temperature of 7◦C andafter about 2 months at a temperature of 3◦C, after Ciszewskiand Witek (1977). The wet weight adult of females is ob-tained after standard HELCOM (Hernroth, 1985), assumingthe organic carbon content of copepods to be gC/gw.w.=0.064(Vinogradov and Shushkina, 1987).
Schmidt et al. (1998) found the mortality ofAcartia tonsain the southern Baltic Sea, ca. 7% in winter, 5% in autumn,and negligible in summer and spring (ca. 1%). We use theabove value forAcartia. However, forPseudocalanusthemortality rate (mz), as a function of temperature and foodconcentration, is used after Klein Breteler et al. (1995).
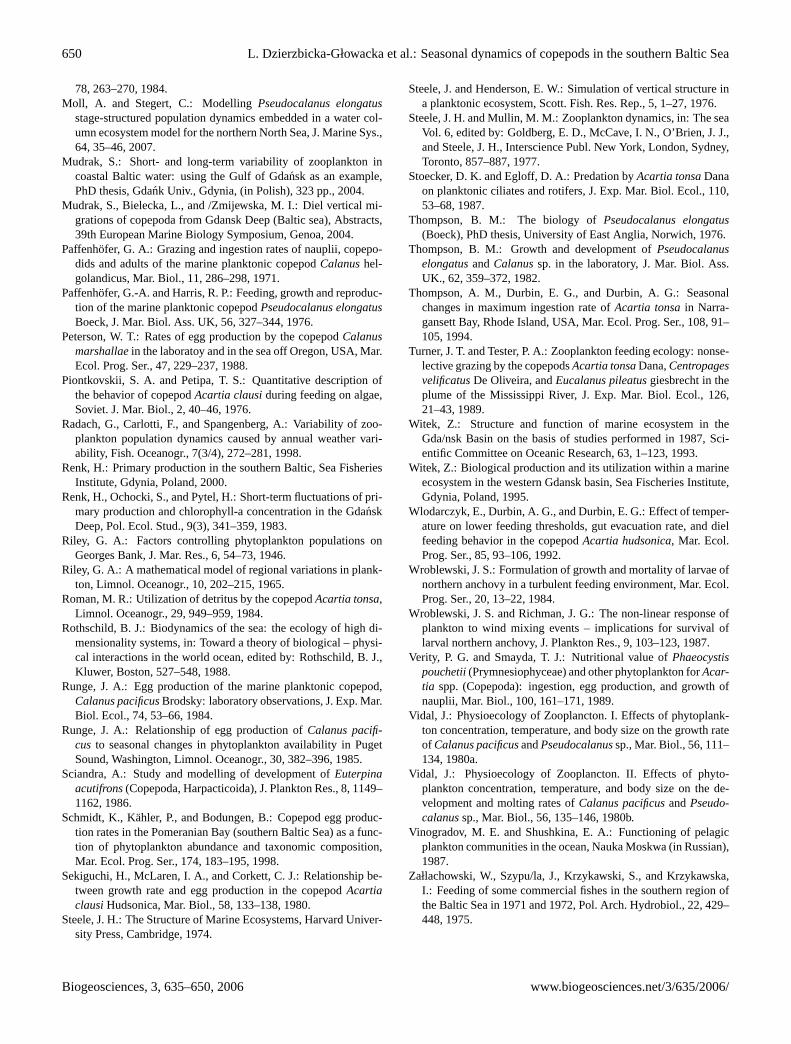
The parameters of migration MIG are the relative am-plitude of zooplankton concentration changes (aw) and thetime in which the maximum zooplankton concentration oc-curs (to). The values of 0.6 and 3.25 a.m. foraw andto wereestimated by Renk et al. (1983) on the basis of experimen-tal data for the southern Baltic Sea. The vertical distributionof zooplankton in timeto in the vegetation season was deter-mined as a function of depth (f (z)=−0.0003775z2
+0.62)(Dzierzbicka-Głowacka, 1994). Figure A2 shows the dielmigration as a function of depth at the following four times:03:00 a.m., 08:00 a.m., 03:00 p.m. and 08:00 p.m.
We use a value of 5/3 forβ in predation PRED; this meansthat 60% of the ingested food contributes to predator growth
www.biogeosciences.net/3/635/2006/ Biogeosciences, 3, 635–650, 2006
648 L. Dzierzbicka-Głowacka et al.: Seasonal dynamics of copepods in the southern Baltic Sea
50 100 150 200 250 300 350 400 450 500 550 600
Food concentration [mgC m-3
]
0.0
0.01
0.02
0.03
0.04
0.05
0.06
Gro
wth
rate
[d-1
]
A Pseudocalanus at 5 CC1C2C3C4C5C6
50 100 150 200 250 300 350 400 450 500 550 600
Food concentration [mgC m-3
]
0.0
0.05
0.1
0.15
0.2
0.25
0.3
0.35
0.4
Gro
wth
rate
[d-1
]
Acartia at 15 CC1C2C3C4C5C6
B
Fig. A1. Growth rate as a function of food concentration at 5◦Cfor Pseudocalanus minutus elongatus(a) and at 15◦C for Acartiaspp.(b).
0 10 20 30 40 50 60 70
depth z(m)
0.0
0.5
1.0
1.5
2.0
Diu
rnal
mig
ratio
n(h
-1)
t=3 a.m.t=8 a.m.t=3 p.m.t=8 p.m.
Fig. A2. Daily migration rate as a function of depth at 03:00 a.m.,09:00 a.m., 03:00 p.m. and 09:00 p.m.
and 40% is voided as fecal pellets and excreted material. Thedetailed description of the process is presented in the work ofDzierzbicka-Głowacka (2005b).
Acknowledgements.This research was carried out as part of statu-tory programme of the Institute of Oceanology in Sopot, Poland(No. II.1.4) and was supported by the Polish State Committeeof Scientific Research (grant No 2PO4F 075 27, 2004–2006).The standard meteorological data were kindly provided by ICM(Interdisciplinary Centre for Mathematical and ComputationalModelling, Warsaw University – L. Herman-Izycki).
Edited by: T. J. Battin
References
Ambler, J. W.: Seasonal factors affecting egg production and viabil-ity of eggs ofAcartia tonsaDana, from East Lagoon, Galveston,Texas, Estuar. cstl. Shelf Sci., 20, 743–760, 1985.
Bautista, B., Harris, R. P., Rodriguez, V., and Guerrero, F.: Tempo-ral variability in copepod fecundity during two different springbloom periods in coastal waters off Plymouth (SW England), J.Plankton Res., 16, 1367–1377, 1994.
Beckman, B. C. and Peterson, W. T.: Egg production ofAcartiatonsaDana in Long Island Sound, J. Plankton Res., 8, 917–925,1986.
Berggreen, U., Hansen, B., and Kiørboe, T.: Food size spectra, in-gestion and growth of the copepodAcartia tonsaduring devel-opment: implications for determination of copepod production,Marine Biology, 99, 341–352, 1988.
Billen, G., Lancelot, C., and Maybeck, M.: N, P and Si retentionalong the aquatic continuum form land to ocean, in: Ocean Mar-gin Processes in Global Change, edited by: Mantoura, R. F. C.,Martin, J. M., and Wollast, R., Phys., Chem., Earth Sci. Res.,Report 9, 19–44, Wiley and Sons, New York, 1991.
Carlotti, F. and Sciandra, A.: Population dynamics model ofEuter-pina acutifrons(Copepoda: Harpacticoida) couplong individualgrowth and larval development, Mar. Ecol. Prog. Ser., 56, 225–242, 1989.
Carlotti, F. and Nival, P.: Model of copepod growth and develop-ment: moulting and mortality in relation to physiological pro-cesses during an individual moult cycle, Mar. Ecol. Prog. Ser.,84, 219–233, 1992.
Carlotti, F. and Radach, G.: Seasonal dynamics of phytoplanktonandCalanus finmarchicusin the North Sea as revealed by a cou-pled one-dimensional model, Limnol. Oceanogr., 41(3), 522–539, 1996.
Carlotti, F. and Wolf, K. U.: A Lagrangian ensemble model ofCalanus finmarchicuscoupled with a 1-D ecosystem model,Fish. Oceanogr., 7(3/4), 191–204, 1998.
Checkley, D. M.: Food limitation of egg production by a marineplanktonic copepod in the sea off southern California, Limnol.Oceanogr., 25, 991–998, 1980.
Christoffersen, K. and Jespersen, A. M.: Gut evacuation rates andingestion rates ofEudiaptomus graciloidesmeasured by meansof the gut fluorescence method, J. Plankton Res., 8, 973–983,1986.
Ciszewski, P. and Witek, Z.: Production of older stages of copepodsAcartia bifilosaGiesb. andPseudocalanus elongatusBoeck inGdansk Bay, Pol. arch. Hydrobiol., 24, 449–459, 1977.
Corkett, C. J. and McLaren, I. A.: The biology ofPseudocalanus,Ad. Mar. Biol., 15, 1–231, 1978.
Biogeosciences, 3, 635–650, 2006 www.biogeosciences.net/3/635/2006/

L. Dzierzbicka-Głowacka et al.: Seasonal dynamics of copepods in the southern Baltic Sea 649
Dagg, M. J. and Wyman, K. D.: Natural ingestion rates of the cope-podsNeocalanus plumchrusandN. cristatus, calculated from gutcontents, Mar. Ecol. Prog. Ser., 13, 37–46, 1983.
Dam, H. G. and Peterson, W. T.: The effect of temperature on thegut clearance rate constant of planktonic copepods, J. exp. mar.Biol. Ecol., 123, 1–14, 1988.
Durbin, E. G., Durbin, A. G., Smayda, T. J., and Verity, P. G.: Foodlimitation of production by adultAcartia tonsain NarragansettBay, Rhode Island, Limnol. Oceanogr., 28, 1199–1213, 1983.
Durbin, E. G. and Durbin, A. G.: Effects of temperature and foodabundance on grazing and short-term weight change in the ma-rine copepodAcartia hudsonica, Limnol. Oceanogr., 37, 361–378, 1992.
Dzierzbicka-Głowacka, L.: Numerical analysis of the influenceof the grazing on the two-dimensional distribution function ofthe phytoplankton concentration in a stratified sea, Oceanologia,36(2), 155–173, 1994.
Dzierzbicka-Głowacka, L.: Growth and development of copepoditestages ofPseudocalanusspp, J. Plankton Res., 26, 49–60, 2004a.
Dzierzbicka-Głowacka, L.: The dependence of body weight incopepodite stages ofPseudocalanusspp. on variations of ambi-ent temperature and food concentration, Oceanologia, 46, 45–63,2004b.
Dzierzbicka-Głowacka, L.: A numerical investigation of phyto-plankton andPseudocalanus elongatusdynamics in the springbloom time in the Gdansk Gulf, J. Mar. Sys., 53, 19–36, 2005a.
Dzierzbicka-Głowacka, L.: Modelling the seasonal dynamics ofmarine plankton in southern Baltic Sea. Part 1. A CoupledEcosystem Model, Oceanologia, 47(4), 591–619, 2005b.
Dzierzbicka-G/lowacka, L.: Equivalence of rates of growth and eggproduction ofPseudocalanus, Ocean. Hydrobiol. Stud., 34(4),19–32, 2005c.
Dzierzbicka-Głowacka, L.: Encounter rate in zooplankton, Pol. J.Environ. Stud., 15(2), 243–257, 2006.
Fennel, W.: Modeling of copepods with links to circulation model,J. Plankton Res., 23, 1217–1232, 2001.
Fennel, W. and Neumann, T.: Variability of copepods as seen in acoupled physical biological model of the Baltic Sea, ICEM Ma-rine Science Symposia, 219, 208–219, 2003.
Fey, D. P.: Differences in temperature conditions and somaticgrowth rate of larval and early juvenile spring-spawned herringfrom the Vistula Lagoon, Baltic Sea manifested in the otolith tofish size relationship, J. Fish Biol., 58, 1257–1273, 2001.
Fransz, H., Moammerts, J., and Radach, G.: Ecological modellingof the North Sea, Nether. J. Sea Res. 28, 67–140, 1991.
Frost, B. W.: A taxonomy of the marine calanoid copepod genusPseudocalanus, Can. J. Zool., 67, 525–551, 1989.
Hay, S. J.: Egg production and secondary production of commonNorth Sea copepods: field estimates ith regional and seasonalcomparisons, ICES J. Mar. Sci., 52, 315–327, 1995.
Hernroth, L.: Recommendations on methods for marine biologicalstudies in the Baltic Sea. Mesozooplankton biomass assessment,The Baltic Marine Biologists, 10, 1–32, 1985.
Kiørboe, T., Møhlenberg, F. and Nicolajsen, H.: Ingestion rate andgut clearance in the planktonic copepodCentropages hamatus(lilljeborg) in relation to food concentration and temperature,Ophelia, 21, 181–194, 1982.
Kiørboe, T., Møhlenberg, F., and Hamburger, K.: Bioenergetics ofthe planktonic copepodAcartia tonsa: relation between feeding,
egg production and respiration, and composition of specific dy-namic action, Mar. Ecol. Prog. Ser., 26, 85–97, 1985.
Kiørboe, T. and Johansen, K.: Studies of a larval herring (ClupeaharengusL.) patch in the Buchan area. IV Zooplankton distribu-tion and productivity in relation to hydrographic features, Dana,6, 37–51, 1986.
Klein Breteler, W. C. M., Gonzales, S. R., and Schogt, N.: De-velopment of Pseudocalanus elongatus (Copepoda, Calanoida)cultured at different temperature and food conditions, Mar. Ecol.Progr. Ser., 119, 99–110, 1995.
Kleppel, G. S., Holliday, D. V., and Pieper, R. E.: Trophic interac-tions between copepods and micoplankton: a question about therole of diatoms, Limnol. Oceanogr., 36, 172–178, 1991.
Kleppel, G. S.: Environmental regulation of feeding and egg pro-duction byAcartia tonsaoff southern California, Mar. Biol., 112,57–65, 1992.
Koski, M., Breteler, W. K. and Schogt, N.: Effect of food qualityon rate growth and development of the pelagic copepodPseudo-calanus elongatus(Copepoda, Calanoida), Mar. Ecol. Prog. Ser.,170, 169–187, 1998.
Kremer, J. N. and Nixon, S. W.: A coastal marine ecosystem. Simu-lation and analysis, Ecological studies 24, Springer-Verlag, Hei-delberg, 1978.
Landry, M. R.: The development of marine calanoids with commenton the isochronal rule, Limnol. Oceanogr., 28, 614–624, 1983.
Last, J. M.: The food of four species of pleuronectiform larvae inthe eastern English Channel and southern North Sea, Mar. Biol.,45, 359–368, 1978a.
Last, J. M.: The food of three species of gadoid larvae in the easternEnglish Channel and southern North Sea, Mar. Biol., 45, 377–386, 1978b.
Last, J. M.: The food of twenty species of fish larvae in the west-central North Sea, Fisheries Research Technical report, Lowest-oft, 60, pp 44, 1980.
Maritime Branch Materials Institute of Meteorology and WaterManagement, Environmental conditions in the Polish zone of thesouthern Baltic Sea during 1999, 2000.
Margonski, P.: The abundance, growth rate and mortality of theearly life stages of herring (Clupea harengus) and smelt (Os-merus eperlanus) in the Vistula Lagoon (southern Baltic Sea)during 1998–1999, International Council for the Exploration ofthe Sea ICES CM 2000/N:21, 2000.
McLaren, I. A.: Generation lengths of some temperate marine cope-pods: estimation, production and implications, J. Fish Res. Bd.Can., 345, 1330–1342, 1978.
McLaren, I. A., Corkett, C. J., and Zillioux, E. J.: Temperatureadaptations of copepod eggs from the arctic to the tropics, Biol.Bull., 137, 486–493, 1969.
McLaren, I. A. and Leonard, A.: Assessing the equivalence ofgrowth and egg production of copepods, ICES J. Mar. Sci., 52,397–408, 1995.
McLaren, I. A., Sevigny, J. M., and Corkett, C. J.: Temperature-dependent development inPseudocalanusspecies, Can. J. Zool.,67, 559–564, 1989.
Miller, T. J., Crowder, L. B., Rice, J. A., and Marshall, E. A.: Larvalsize and recruitment mechanisms in fishes: toward a conceptualframework, Can. J. Fish. Aquat. Sci., 45, 1657–1670, 1988.
Miller, C. A. and Landry, M. R.: Ingestion-independent rates of am-monium excretion by the copepodCalanus pacificus, Mar. Biol.,
www.biogeosciences.net/3/635/2006/ Biogeosciences, 3, 635–650, 2006
650 L. Dzierzbicka-Głowacka et al.: Seasonal dynamics of copepods in the southern Baltic Sea
78, 263–270, 1984.Moll, A. and Stegert, C.: ModellingPseudocalanus elongatus
stage-structured population dynamics embedded in a water col-umn ecosystem model for the northern North Sea, J. Marine Sys.,64, 35–46, 2007.
Mudrak, S.: Short- and long-term variability of zooplankton incoastal Baltic water: using the Gulf of Gdansk as an example,PhD thesis, Gdank Univ., Gdynia, (in Polish), 323 pp., 2004.
Mudrak, S., Bielecka, L., and /Zmijewska, M. I.: Diel vertical mi-grations of copepoda from Gdansk Deep (Baltic sea), Abstracts,39th European Marine Biology Symposium, Genoa, 2004.
Paffenhofer, G. A.: Grazing and ingestion rates of nauplii, copepo-dids and adults of the marine planktonic copepodCalanushel-golandicus, Mar. Biol., 11, 286–298, 1971.
Paffenhofer, G.-A. and Harris, R. P.: Feeding, growth and reproduc-tion of the marine planktonic copepodPseudocalanus elongatusBoeck, J. Mar. Biol. Ass. UK, 56, 327–344, 1976.
Peterson, W. T.: Rates of egg production by the copepodCalanusmarshallaein the laboratoy and in the sea off Oregon, USA, Mar.Ecol. Prog. Ser., 47, 229–237, 1988.
Piontkovskii, S. A. and Petipa, T. S.: Quantitative description ofthe behavior of copepodAcartia clausiduring feeding on algae,Soviet. J. Mar. Biol., 2, 40–46, 1976.
Radach, G., Carlotti, F., and Spangenberg, A.: Variability of zoo-plankton population dynamics caused by annual weather vari-ability, Fish. Oceanogr., 7(3/4), 272–281, 1998.
Renk, H.: Primary production in the southern Baltic, Sea FisheriesInstitute, Gdynia, Poland, 2000.
Renk, H., Ochocki, S., and Pytel, H.: Short-term fluctuations of pri-mary production and chlorophyll-a concentration in the GdanskDeep, Pol. Ecol. Stud., 9(3), 341–359, 1983.
Riley, G. A.: Factors controlling phytoplankton populations onGeorges Bank, J. Mar. Res., 6, 54–73, 1946.
Riley, G. A.: A mathematical model of regional variations in plank-ton, Limnol. Oceanogr., 10, 202–215, 1965.
Roman, M. R.: Utilization of detritus by the copepodAcartia tonsa,Limnol. Oceanogr., 29, 949–959, 1984.
Rothschild, B. J.: Biodynamics of the sea: the ecology of high di-mensionality systems, in: Toward a theory of biological – physi-cal interactions in the world ocean, edited by: Rothschild, B. J.,Kluwer, Boston, 527–548, 1988.
Runge, J. A.: Egg production of the marine planktonic copepod,Calanus pacificusBrodsky: laboratory observations, J. Exp. Mar.Biol. Ecol., 74, 53–66, 1984.
Runge, J. A.: Relationship of egg production ofCalanus pacifi-cus to seasonal changes in phytoplankton availability in PugetSound, Washington, Limnol. Oceanogr., 30, 382–396, 1985.
Sciandra, A.: Study and modelling of development ofEuterpinaacutifrons(Copepoda, Harpacticoida), J. Plankton Res., 8, 1149–1162, 1986.
Schmidt, K., Kahler, P., and Bodungen, B.: Copepod egg produc-tion rates in the Pomeranian Bay (southern Baltic Sea) as a func-tion of phytoplankton abundance and taxonomic composition,Mar. Ecol. Prog. Ser., 174, 183–195, 1998.
Sekiguchi, H., McLaren, I. A., and Corkett, C. J.: Relationship be-tween growth rate and egg production in the copepodAcartiaclausiHudsonica, Mar. Biol., 58, 133–138, 1980.
Steele, J. H.: The Structure of Marine Ecosystems, Harvard Univer-sity Press, Cambridge, 1974.
Steele, J. and Henderson, E. W.: Simulation of vertical structure ina planktonic ecosystem, Scott. Fish. Res. Rep., 5, 1–27, 1976.
Steele, J. H. and Mullin, M. M.: Zooplankton dynamics, in: The seaVol. 6, edited by: Goldberg, E. D., McCave, I. N., O’Brien, J. J.,and Steele, J. H., Interscience Publ. New York, London, Sydney,Toronto, 857–887, 1977.
Stoecker, D. K. and Egloff, D. A.: Predation byAcartia tonsaDanaon planktonic ciliates and rotifers, J. Exp. Mar. Biol. Ecol., 110,53–68, 1987.
Thompson, B. M.: The biology ofPseudocalanus elongatus(Boeck), PhD thesis, University of East Anglia, Norwich, 1976.
Thompson, B. M.: Growth and development ofPseudocalanuselongatusandCalanussp. in the laboratory, J. Mar. Biol. Ass.UK., 62, 359–372, 1982.
Thompson, A. M., Durbin, E. G., and Durbin, A. G.: Seasonalchanges in maximum ingestion rate ofAcartia tonsain Narra-gansett Bay, Rhode Island, USA, Mar. Ecol. Prog. Ser., 108, 91–105, 1994.
Turner, J. T. and Tester, P. A.: Zooplankton feeding ecology: nonse-lective grazing by the copepodsAcartia tonsaDana,CentropagesvelificatusDe Oliveira, andEucalanus pileatusgiesbrecht in theplume of the Mississippi River, J. Exp. Mar. Biol. Ecol., 126,21–43, 1989.
Witek, Z.: Structure and function of marine ecosystem in theGda/nsk Basin on the basis of studies performed in 1987, Sci-entific Committee on Oceanic Research, 63, 1–123, 1993.
Witek, Z.: Biological production and its utilization within a marineecosystem in the western Gdansk basin, Sea Fischeries Institute,Gdynia, Poland, 1995.
Wlodarczyk, E., Durbin, A. G., and Durbin, E. G.: Effect of temper-ature on lower feeding thresholds, gut evacuation rate, and dielfeeding behavior in the copepodAcartia hudsonica, Mar. Ecol.Prog. Ser., 85, 93–106, 1992.
Wroblewski, J. S.: Formulation of growth and mortality of larvae ofnorthern anchovy in a turbulent feeding environment, Mar. Ecol.Prog. Ser., 20, 13–22, 1984.
Wroblewski, J. S. and Richman, J. G.: The non-linear response ofplankton to wind mixing events – implications for survival oflarval northern anchovy, J. Plankton Res., 9, 103–123, 1987.
Verity, P. G. and Smayda, T. J.: Nutritional value ofPhaeocystispouchetii(Prymnesiophyceae) and other phytoplankton forAcar-tia spp. (Copepoda): ingestion, egg production, and growth ofnauplii, Mar. Biol., 100, 161–171, 1989.
Vidal, J.: Physioecology of Zooplancton. I. Effects of phytoplank-ton concentration, temperature, and body size on the growth rateof Calanus pacificusandPseudocalanussp., Mar. Biol., 56, 111–134, 1980a.
Vidal, J.: Physioecology of Zooplancton. II. Effects of phyto-plankton concentration, temperature, and body size on the de-velopment and molting rates ofCalanus pacificusandPseudo-calanussp., Mar. Biol., 56, 135–146, 1980b.
Vinogradov, M. E. and Shushkina, E. A.: Functioning of pelagicplankton communities in the ocean, Nauka Moskwa (in Russian),1987.
Załlachowski, W., Szypu/la, J., Krzykawski, S., and Krzykawska,I.: Feeding of some commercial fishes in the southern region ofthe Baltic Sea in 1971 and 1972, Pol. Arch. Hydrobiol., 22, 429–448, 1975.
Biogeosciences, 3, 635–650, 2006 www.biogeosciences.net/3/635/2006/