Embed Size (px)
Citation preview

December 2002 Waterbody Numbers: WA-PS-0040, WA-PS-0240 Publication No. 02-03-059
Seasonal Patterns and Controlling Factors of Primary Production in Puget Sound’s Central Basin and Possession Sound
Abstract Primary production was measured using the carbon-14 uptake method in order to assess production and nutrient dynamics in the Central Basin and Possession Sound regions of Puget Sound. Ambient and nutrient-spiked production rates for the entire euphotic zone were determined every 2-6 weeks at four stations from October 1998 through October 2001 (n=42). Nutrient (dissolved nitrogen and phosphate) concentrations, chlorophyll a, incident radiation, temperature, and salinity were also measured to examine factors affecting production rates. Seasonal variation in production is well-defined for all four stations, with values integrated over the euphotic zone during summertime (May-September) as high as 13,000 mg C m-2 d-1, which drop to less than 100 mg C m-2 d-1 during wintertime. During the middle of the growing season (April-June) a reduction in production was measured at all stations. Similar variation in biomass, as measured by chlorophyll a, was also seen. Considerable interannual variation in production was observed, potentially linked to differences in external physical forcings. Variations in water properties suggest strong oceanic input during 2001. A maximal primary productivity rate was not consistently found at any particular station. Increased primary production due to experimental addition of nutrients was seen at times at all stations during spring and, more often, summer months. Nutrient enhancement of productivity was most evident in Possession Sound. However, based on annual averages, all four stations exhibit substantial production increases in response to added nutrients. Possession Sound and Admiralty Inlet appear to be most susceptible to nutrient limitation towards the tail end of the summer snow melt, when the water column becomes increasingly stratified. Nutrient stimulation was seen at the Admiralty Inlet station during the winter, although light appears to be the primary determinant of production levels during the winter. Consideration of these results along with physical data and modeling will be required to assess regional sensitivity of this part of Puget Sound to nutrient addition.
A D e p a r t m e n t o f E c o l o g y R e p o r t

Page 2
Publication Information This report is available on the Department of Ecology home page on the World Wide Web at http://www.ecy.wa.gov/biblio/0203059.html For additional copies of this report, contact the Department of Ecology Publications Distribution Office and refer to publication number 02-03-059.
E-mail: [email protected] Phone: (360) 407-7472 Address: PO Box 47600, Olympia WA 98504-7600
Author: Jan Newton and Kara Van Voorhis Washington State Department of Ecology Environmental Assessment Program Phone: (360) 407-6675
Address: PO Box 47600, Olympia WA 98504-7600
The Department of Ecology is an equal opportunity agency and does not discriminate on the basis of race, creed, color, disability, age, religion, national origin, sex, marital status, disabled veteran's status, Vietnam era veteran's status, or sexual orientation. If you have special accommodation needs or require this document in alternative format, contact Michelle Harper at 360-407-6677 (voice) or 711 or 1-800-877-8973 (TTY).

Page 3
Introduction Human population and land development have dramatically increased in the western Washington area during recent years, presumably leading to additional nutrient input to Puget Sound from both point and non-point sources. This stimulates the need to assess impacts of potential eutrophication in Puget Sound. Eutrophication, or adding excessive nutrients to a basin, can result in phytoplankton growth if, and only if, nutrients are limiting phytoplankton growth. Substantial increases in phytoplankton, in turn, can result in undesirable water quality impacts, such as reduced oxygen concentrations at depth, reduction in water clarity, and possible phytoplankton species shifts. Historically, Puget Sound has not been viewed as susceptible to eutrophication because of the typically high concentrations of nutrients incoming from the Pacific Ocean, as well as strong mixing in the Main Basin of Puget Sound, which limits exposure of phytoplankton to light and therefore reduces growth. These characteristics of central Puget Sound were responsible for the success of the diversion of sewage from Lake Washington to West Point (Puget Sound) in the late 1950’s (Edmondson, 1991). While nutrient loading to Lake Washington caused excessive algal growth, the same loading at West Point did not. Much of the current understanding of Puget Sound phytoplankton dynamics has been based on modeling and measurements of ambient productivity and nutrients at West Point (Winter et al. 1975). However, a much more complex picture is emerging, as a diversity of responses to nutrient addition is apparent both spatially and temporally within greater Puget Sound. In the early 1980’s, Harrison et al. (1983) evaluated the issue of eutrophication in the Strait of Juan de Fuca, Strait of Georgia, and Puget Sound. They judged potential impacts from eutrophication of the Main Basin of Puget Sound to be relatively low. However, they reported that the more poorly flushed bays and inlets of Puget Sound, particularly in the southern end, showed depleted surface nitrate concentrations and very low oxygen concentrations at depth. They assessed that the “early warning signs of eutrophication” were already evident in these poorly flushed bays and inlets of southern Puget Sound. Bricker et al. (1999) recently reported the overall level of expression of eutrophic conditions to be moderate in (the Main Basin of) Puget Sound and Whidbey Basin and high in Hood Canal and South Puget Sound. The symptoms contributing to eutrophic conditions were chlorophyll a, macroalgae, toxic blooms, and, in Hood Canal, low dissolved oxygen. They predicted conditions to worsen, especially in Hood Canal and South Puget Sound, due to increasing population pressures. Recent studies utilizing nutrient addition experiments on phytoplankton productivity support this conclusion, as data from Budd Inlet (Newton et al., 1998a) and Hood Canal (Newton et al., 1995) show substantially increased rates of primary production upon nutrient addition. However, until now similar studies on nutrient sensitivity of primary production for the Main Basin and nearby Possession Sound have been lacking.
Page 4
In response to rapid population growth in the Puget Sound region, King County Department of Natural Resources began a siting process in 1999 for a proposed new wastewater treatment plant and marine outfall. The potential for additional nutrient input and subsequent eutrophication effects by this new facility highlighted the need for a study of phytoplankton and nutrient dynamics in the central Puget Sound region. As part of the siting process, Washington State Department of Ecology was contracted to conduct a joint study with King County Department of Natural Resources to evaluate phytoplankton primary production and nutrient dynamics in Puget Sound’s central basin and Possession Sound. This study began in October 1998 and ended in October 2001. Presented herein are results of 36 months of data collection.
Methods Four stations, located in the central basin of Puget Sound and entrances to Admiralty Inlet and Possession Sound (Figure 1), were sampled every two to six weeks (higher frequency during summer) from October 1998 through October 2001. Stations were chosen to represent the waters of Admiralty Inlet (47 55.04 N, 122 27.97 W), Possession Sound (47 53.51 N, 122 21.41 W), Point Wells, (47 47.12 N, 122 24.40 W) and West Point (47 39.63 N, 122 26.83 W). At each station, we measured primary production (via C-14 uptake), chlorophyll a (extracted and in situ fluorescence), dissolved nutrients (nitrate, ammonium, nitrite, phosphate, and silicate), phytoplankton species, incident radiation (PAR), temperature, and salinity. Water samples were taken from depths corresponding to the 100, 50, 25, 12, 6, and 1 % surface light intensities, as estimated by secchi depth-derived extinction coefficients, in order to represent the entire euphotic zone (where there is enough light for photosynthesis) at each station. Standard sampling and analytical protocols are described in Newton et al., (1998a) or Newton et al., (1998b). The standard C-14 uptake experimental protocol was used (Strickland and Parsons, 1968). For the experiments conducted in this study, radioactive C-14 in the form of aqueous sodium bicarbonate was added to the seawater samples, which were then incubated in closed containers for 24 hours at their respective light intensities (simulated by screens in seawater-plumbed deck incubators). During photosynthesis, inorganic carbon, including any from the radioactively labeled bicarbonate, is taken up by phytoplankton and converted to cell biomass. At the end of the incubation, the amount of C-14 that was incorporated into phytoplankton biomass was obtained by filtration of the sample and measurement of the particulate specific activity via liquid scintillation counting. This procedure yields a measure of ambient primary production rates at each depth sampled, which can be integrated over the euphotic zone. In addition, we simulated anthropogenic nutrient loading by adding excess nutrients (30 µM ammonium and 3 µM phosphate) to a duplicate set of experimental samples to determine if there was a change in the production rate due to the increased nutrient concentrations. Primary production (P), the phytoplankton population growth rate, is the product of the phytoplankton population biomass (B) and the specific growth rate (µ) of the individuals in that population (i.e. normalized to biomass):
P = B * µ
Page 5
We measured chlorophyll a integrated through the euphotic zone (mg chl a m-2) as an estimate of the water column phytoplankton biomass (B) and integrated primary production (P) via C-14 uptake (mg C m-2 d-1). Unfortunately, because the cellular content of chlorophyll is variable, the use of chlorophyll to indicate phytoplankton biomass is an estimate. Thus, with measurements of both P and B, an approximation of specific growth rate (P:B) can be made, however this also will be biased by any variation in the cellular carbon to chlorophyll ratio, which is known to vary with light, nutrients and phytoplankton species.
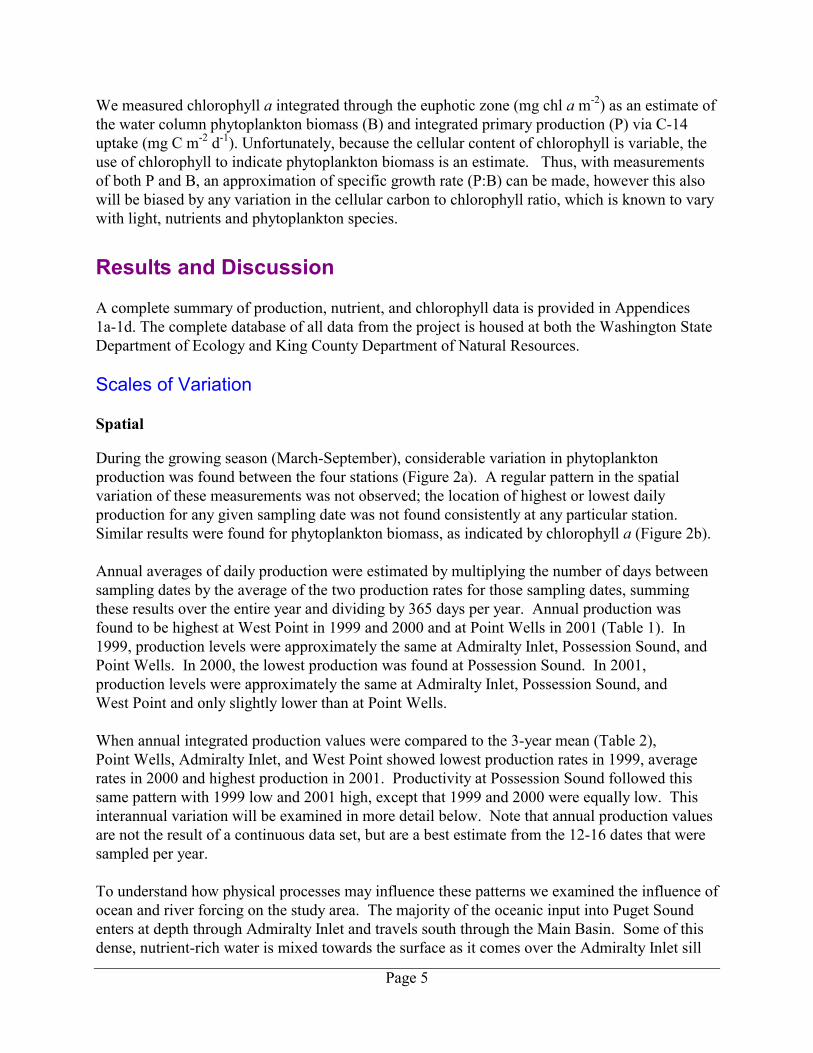
Results and Discussion A complete summary of production, nutrient, and chlorophyll data is provided in Appendices 1a-1d. The complete database of all data from the project is housed at both the Washington State Department of Ecology and King County Department of Natural Resources. Scales of Variation Spatial During the growing season (March-September), considerable variation in phytoplankton production was found between the four stations (Figure 2a). A regular pattern in the spatial variation of these measurements was not observed; the location of highest or lowest daily production for any given sampling date was not found consistently at any particular station. Similar results were found for phytoplankton biomass, as indicated by chlorophyll a (Figure 2b). Annual averages of daily production were estimated by multiplying the number of days between sampling dates by the average of the two production rates for those sampling dates, summing these results over the entire year and dividing by 365 days per year. Annual production was found to be highest at West Point in 1999 and 2000 and at Point Wells in 2001 (Table 1). In 1999, production levels were approximately the same at Admiralty Inlet, Possession Sound, and Point Wells. In 2000, the lowest production was found at Possession Sound. In 2001, production levels were approximately the same at Admiralty Inlet, Possession Sound, and West Point and only slightly lower than at Point Wells. When annual integrated production values were compared to the 3-year mean (Table 2), Point Wells, Admiralty Inlet, and West Point showed lowest production rates in 1999, average rates in 2000 and highest production in 2001. Productivity at Possession Sound followed this same pattern with 1999 low and 2001 high, except that 1999 and 2000 were equally low. This interannual variation will be examined in more detail below. Note that annual production values are not the result of a continuous data set, but are a best estimate from the 12-16 dates that were sampled per year. To understand how physical processes may influence these patterns we examined the influence of ocean and river forcing on the study area. The majority of the oceanic input into Puget Sound enters at depth through Admiralty Inlet and travels south through the Main Basin. Some of this dense, nutrient-rich water is mixed towards the surface as it comes over the Admiralty Inlet sill

Page 6
(Cannon, et al., 1990) and mixing also occurs near the south end of the Main Basin, at the Tacoma Narrows sill (Ebbesmeyer and Barnes, 1980). The net outflow from Puget Sound occurs primarily at the surface where fresher, less dense, water flows out of the Main Basin through Admiralty Inlet (Cannon, et al., 1984). Possession Sound, which receives a large percentage of the total freshwater input into Puget Sound, is a more river-dominated system than the Main Basin. Fresh water flows out of Possession Sound at the surface through Admiralty Inlet and, to a lesser extent, through Deception Pass (Cannon, et al., 1990). Water column stratification was found to vary by region. Figure 3 shows depth at which density (sigma-t) becomes 2 kg/m3 greater than the density at the surface as an indication of the depth of the mixed layer. The deeper this density occurs, the more well-mixed the water column is. Much of the time the depth of this density gradient is near the surface in Possession Sound, the more river-influenced side-basin of the study area, indicating that the water column is well-stratified year-round. The notable exception to this pattern occurs in the winter of 2001, when the Western Washington area experienced a severe drought. Freshwater input into Possession Sound at this time was considerably lower than other years. This is evident in flow data from the Skagit River (Figure 4), the dominant freshwater input to Puget Sound (the Snohomish River, which also empties into Possession Sound, follows a similar pattern). Diminished fresh water flow likely contributed to the observed decrease in water column stratification (Figure 3). Point Wells and West Point (average depth 123 and 64m, respectively) appear to follow similar stratification patterns (Figure 3). Both stations are usually well-mixed with the depth at which density is 2 kg/m3 greater than at the surface usually reaching to the sea floor. In the events where this depth does not reach to the sea floor at one station, it is, with one exception, found at nearly the same depth at the other. At Admiralty Inlet, most of the time the depth at which density becomes 2 kg/m3 greater than at the surface reaches all the way to the seabed (average depth of Admiralty Inlet is 119m), as occurs at Point Wells and West Point. During the summertime however, Admiralty Inlet becomes stratified, possibly due to increased freshwater input originating in Possession Sound and flowing out through Admiralty Inlet. Evident in flow data for the Skagit River (Figure 4) is the bimodal pattern of freshwater flow in the area. Flow peaks with winter rains and again in the summer during the snow melt. A similar bimodal pattern in water column stratification was seen at Admiralty Inlet. This pattern suggests that Admiralty Inlet would have a higher likelihood of becoming nutrient limited during the summertime snow melt. Results from the nutrient-added productivity experiments, to be discussed later, confirm a pattern of nutrient limitation occurring at Admiralty Inlet towards the tail end of the summer snow melt (Figure 4). Seasonal Consistent with Puget Sound’s temperate location, a distinct seasonal pattern in primary production was observed at all stations for all years (Figure 2a). Lower production occurred in winter months with higher levels observed between the months of March to September. This growing season was characterized by a spring bloom, followed by a distinct low in production, then subsequent summer and fall blooms. Phytoplankton biomass, as indicated by chlorophyll a,

Page 7
also showed this seasonal trend (Figure 2b). Since phytoplankton populations can change rapidly on a much shorter time scale (days) than we measured, this bi-weekly to monthly view could be missing much in terms of temporal dynamics. Interannual Annual integrated daily production (integrated from October to October) was found to be lowest in 1999 (1.9-2.6 g C m-2 d-1) and highest in 2001 (3.4-3.7 g C m-2 d-1) at all stations (Table 1). In 2000, levels at Point Wells, Admiralty Inlet and West Point (2.7-3.5 g C m-2 d-1) were within 8% of each station’s 3-year mean, while production at Possession Sound remained as low as in 1999 (2.1 g C m-2 y-1). In order to clarify the possible mechanisms driving this difference, we looked at several factors affecting phytoplankton production. Integrated dissolved inorganic nitrogen (DIN = nitrate + nitrite + ammonium) followed the same pattern as primary production. The interannual chlorophyll pattern did not vary between stations; integrated values were highest in 2001, lowest in 2000 and near the 3-y mean in 1999. We also examined these patterns in concert with certain physical factors of the greater Puget Sound system that may influence phytoplankton and nutrient dynamics: offshore upwelling of nutrient-rich deep water (Bakun upwelling index, from NOAA; http://www.pfeg.noaa.gov/), local river input (flow data, from USGS; http://water.usgs.gov/wa/nwis/) and local winds (wind speeds, direction, from NDBC; http://seaboard.ndbc.noaa.gov/) – all averaged over the entire year. Results are summarized in Table 2. Sunlight available for photosynthesis, measured either continuously during the growing season or on only the days that were sampled, was not found to vary interannually. Data from NOAA indicate that there was net downwelling in 1999 and 2000 and net upwelling in 2001 (Table 3). During the growing season there were equal amounts of up and downwelling in 1999 and 2000, but net upwelling in 2001. Downwelling occurred every year during winter months (Oct. 1999 to Feb. 2000). Flow data from the Skagit River, which empties into Possession Sound, signifies that the fresh water input into Puget Sound was elevated 17% in 1999, near the 59-y mean in 2000 (+4%), and 36% below average in 2001. During the growing season, winds, which cause mixing of the water column, were strongest in 2001 and weakest in 1999. Stronger wind speeds likely translated to increased mixing of the water column. The effect of winds is not straight forward as winds could cause nutrients to be mixed up towards the surface as well as phytoplankton to be mixed down below the euphotic zone, where light is not available for photosynthesis. Differences in wind direction may also be important: winds in 2001 were found to blow in a northward direction (009˚), whereas in 1999 and 2000 winds were northwestward (328˚ and 322˚). Some of these trends in external physical forcings are compatible with the observed variation in phytoplankton production, biomass and dissolved nutrients. In 1999 there was net downwelling offshore, which would theoretically limit the supply of nutrient-rich deep water entering Puget Sound through Admiralty Inlet. In addition, the above average river input would tend to stratify the water column, further limiting nutrient availability for phytoplankton production in the euphotic zone. These factors may have caused the lower nutrient concentrations we measured, which may have resulted in the observed lower production levels.

Page 8
Moderate levels of downwelling and river input, as well as nutrient concentrations and phytoplankton production were recorded at Admiralty Inlet, Point Wells and West Point in 2000; however, nutrients and production were both low at Possession Sound. Possibly, the slightly lower amount of downwelling that occurred offshore this year relative to 1999, coupled with decreased river input, was enough to affect nutrient (and thereby production) levels at the stations in the main basin, but was not strong enough to influence the more river-dominated Possession Sound. Consistent with known circulation patterns (Cannon, et al., 1984; Cannon, et al., 1990; Ebbesmeyer and Cannon, 2001), nutrients mixed to the surface, especially in the southern part of the Main Basin at The Narrows (Ebbesmeyer and Barnes, 1980), might travel back through the Main Basin, where the West Point, Point Wells and Admiralty Inlet stations are located, bypassing the more river-dominated side-basin of Possession Sound. Consistent with this pattern, dissolved nutrient concentrations were regularly found to be lower at Possession Sound than the other stations. The low chlorophyll levels at all stations could be due to mixing, grazing, or other loss factors that were not measured in this study. Of the 3 years that were sampled, upwelling was greatest and fresh water input was weakest in 2001. A strong oceanic input during 2001 suggests that more nutrient-rich deep water could have entered Puget Sound at depth through Admiralty Inlet, thereby increasing nutrient availability to phytoplankton and supporting high production levels. The lack of fresh water input would also tend to increase nutrient availability by lessening water column stratification, allowing nutrients to be mixed to the surface more easily. Interannual variations in upwelling may also help to explain why the higher production rates are observed in summer rather than spring months of 2001, as they are in 1999 and 2000. Integrated DIN concentrations (Figure 2c) were generally higher in 2001, possibly due to more frequent intrusions of nutrient-rich upwelled water. Abundant sunlight in summer months coupled with higher than average oceanic input of nutrient-rich deep water could have produced the higher production levels. It is also possible that due to our sampling frequency the height of the spring bloom may have been missed. The strong interannual variation that appears to correlate with differences in ocean and river conditions has implications for assessing the degree of nutrient limitation in future years. Factors affecting primary production Correlation of primary production and chlorophyll If specific growth rates are constant, indicating consistent growth conditions, then chlorophyll and primary production will be well-correlated. During this study, the variation measured in production was found to be only partially correlated with observed variations in chlorophyll (Figure 5). The strength of this correlation was spatially variable; linear regression correlation coefficient r2 values ranged from 0.58 (Admiralty Inlet) to 0.81 (West Point). This moderate level of coupling between production and chlorophyll at these areas implies that the production per unit chlorophyll is not a constant, that growth conditions, loss processes (grazing, mixing, sinking) or phytoplankton C:chl ratios vary, or a combination of these factors. Chlorophyll (biomass) is sometimes used to indicate primary production when the latter measurements do not

Page 9
exist, although it is well known that many factors can contribute to a non-correlation of these two parameters. Data from this study illustrate that measuring chlorophyll alone is not a precise means of determining phytoplankton production rates in the Puget Sound region. Seasonal variation in factors affecting primary production Productivity levels were typically below 100 mg C m-2 d-1 at all stations during winter months. A strong linear correlation of r2=0.89 was found between wintertime production and irradiance (Figure 6). This strong correlation indicates that sunlight availability is limiting primary production during winter. This relationship is not found during the spring through fall (Figure 6), implying that other factors are controlling production, such as nutrient availability, grazing losses, or mixing losses. A shift from low to high primary production and phytoplankton biomass occurred in spring at all four stations (Figure 2a). The P:B ratios also increased from winter (<10mg C mg chl-1 d-1) to spring (~40 mg C chl-1 d-1). During this time, light becomes more abundant than in winter and nutrient levels in the euphotic zone are high (Figure 2c). The increase in production is likely due to a higher specific growth rate (µ), consistent with an abundance of light and nutrients, and also an accumulation of biomass. By late spring, light is available but nutrient concentrations drop substantially, especially during 1999 (Figure 2c). Production rates and biomass similarly drop with a lag of approximately one month (Figure 2a,b). The timing of the transition from high to low nutrients and the subsequent spring phytoplankton decline was centered around May in 1999, April in 2000 and March in 2001. Decreased production and biomass could be due to nutrient limitation or result from increased zooplankton grazing and/or losses due to periodic mixing below the euphotic zone. Production rates and biomass during the summer and fall months were elevated at times, indicating sporadic blooms. This indicates a very dynamic environment in terms of conditions affecting phytoplankton such as light, nutrient availability, mixing, and grazing pressure. A consistent seasonal pattern in P:B ratios during the phytoplankton growing season was not found. P:B values during 1999 were higher in spring relative to summer, whereas the opposite trend was observed during 2000 and 2001. Values of P:B during summer 2000 and 2001 (except for West Point) were much higher (~70-110 mg C mg chl-1 d-1) than the maximum found during 1999 (~50-60 mg C mg chl-1 d-1). Nutrient limitation as a controlling factor of primary production The focus of this study was to assess the degree that nutrient limitation controls primary production. While this was adequately addressed by nutrient addition experiments, some key rates such as losses of phytoplankton biomass to grazing were not evaluated and may affect interpretation of system dynamics. Losses due to mixing of cells below the euphotic zone, while considered here, should be quantitatively assessed with a coupled hydrodynamic-water quality model.

Page 10
While the factors controlling primary production are difficult to assess, results of this study show that during the growing season, all stations show large increases in production as a result of added nutrients (by as much as 3 g C m-2 d-1), implying some degree of nutrient control is evident at times throughout central Puget Sound (Figure 7). Comparison of the differences in P:B between the spiked and ambient treatments indicates that nutrient limitation affects primary production in central Puget Sound (Table 6). This limitation is evident at all stations during the summer (March to September) and at the Admiralty Inlet station in the winter (October to February). The increase in plankton growth due to the addition of nutrients is more dramatic during the summer months, indicating a more acute nutrient limitation relative to the winter (Figure 8). The strong correlation of production and irradiance strongly suggests that primary production in central Puget Sound is predominately controlled by light availability in winter (Figure 6). The daily increase in primary productivity due to nutrient addition ranged as high as 77% of the ambient production on a given date (see Appendix 1). While substantial, the overall annual percent increase in production in central Puget Sound and Possession Sound due to nutrient addition was lower than that observed in Budd Inlet (Newton et al., 1998a) and Hood Canal (Newton et al., 1995) where values as high as 83 and 300%, respectively, were measured. Interannual and spatial variation in the strength of the nutrient response is evident. The average net annual increase in production due to addition of nutrient spike for the study area was about 250-350 mg C m-2 d-1 (Table 4, Figure 7). In order to assess nutrient sensitivity more quantifiably, we established four thresholds for evaluation (Table 5). We assessed: 1) the number of times that the increase of the nutrient-spiked production was greater than 450 mg C m-2 d-1 over the ambient production; 2) the number of times that the increase in nutrient-spiked production was 15% or more of the ambient production; 3) the number of times both of these thresholds were exceeded; and 4) the number of times that the DIN decrease over 24 hours was 5 uM more in the spiked treatment than in the ambient treatment, implying greater nutrient uptake. The times when these thresholds were surpassed are summarized in Appendix 2. Episodes where these four thresholds were surpassed occurred at every station, no less than 10% (Point Wells, threshold 3) and up to 41% (Possession Sound, threshold 4) of the time (Table 5). Possession Sound appears to be consistently the most sensitive area to nutrient addition, judged by all four thresholds. Due to high input of freshwater, this river-dominated side basin is characterized by a more stratified water column. Stronger stratification decreases mixing of nutrients up to the euphotic zone from depth, increasing the possibility of nutrient availability limiting phytoplankton production. While Possession Sound shows the highest sensitivity to added nutrients, as evident in Table 5 and Figure 7, all stations exhibited nutrient-enhanced production at times. Evaluated relative to thresholds marking extreme responses, Possession Sound stands out. However, based on annual averages of nutrient-spiked production rates, West Point, Admiralty Inlet, and Point Wells all exhibit substantial increases (Table 4). Analyzed by annual averages, the highest increases due to nutrient addition were Possession Sound in 1999, Point Wells in 2000 and West Point in 2001.

Page 11
Admiralty Inlet, the location of a sill and the entrance to Puget Sound, is generally considered a well-mixed region and was never the station with the highest annual increase in production due to added nutrients. Despite this, substantial levels of nutrient-enhanced production were measured at times each year (Figure 7, Table 4, Table 5). As described earlier, Admiralty Inlet exhibits a bimodal pattern in stratification linked to freshwater flow from winter rains and summer snow melt (Figure 4). Stratification inhibits mixing of nutrient-rich deep water into the euphotic zone. In winter, this is not likely to impact primary production rates since phytoplankton growth is light-limited. However, during the growing season, water column stratification can potentially lead to nutrient limitation. Results of nutrient addition productivity experiments demonstrate a pattern of nutrient limitation occurring towards the tail end of the summer snow melt at Admiralty Inlet (Figure 4). Possession Sound, well-stratified and highly influence by river input, exhibits a similar pattern. Results from the three years of this study show dynamic spatial and temporal variation in primary production and nutrient response. Despite this variation, enhancement of production from nutrient addition was clearly demonstrated. The analysis presented here relates preliminary findings regarding the association of the nutrient response to variations in water-column physics as well as external forcings. In order to assess the sensitivity of Puget Sound’s central basin and Possession Sound to added nutrients, these results will need to be considered relative to the extensive physical and circulation database generated by the King County Marine Outfall Siting Study as well as be interpreted along with changes in ocean, river and mixing conditions. Variability of zooplankton grazing may also affect system dynamics. Modeling which incorporates all of these parameters should be used to assess impacts on dissolved oxygen concentrations and other trophic levels of the food web. Phytoplankton species samples were taken during this study and preserved for possible future analysis. Though not addressed within the scope of this study, consideration should also be given to potential changes in phytoplankton species composition and succession in response to elevated nutrient concentrations.
Conclusions Strong spatial and temporal variations in productivity have been observed at all four stations. The magnitude of production was not consistently highest at any particular station, with relative values between the four stations varying on a given day. Distinct seasonal patterns in primary production were discernible though annual rates varied. Freshwater flow into the Puget Sound system appears to seasonally influence water column stratification and phytoplankton production. A pattern of nutrient limitation was observed at Admiralty Inlet and Possession Sound towards the end of the summer snow melt. Strong interannual variation was observed and appears to be related to external forcing factors including differences in ocean and river conditions. Comparing the 1999, 2000, and 2001 data we observe that oceanic influence appears to be relatively weak in 1999, moderate in 2000 and

Page 12
stronger in 2001. Such variations must be taken into account when assessing potential impacts to the region of nutrient addition and eutrophication effects. Despite this interannual variation, increased production due to nutrient addition was seen at all stations every year. All stations combined show nutrient sensitivity, independent of season. Nutrient limitation was most pronounced in Possession Sound, which is consistent with the stronger stratification of this area. Only the Admiralty Inlet station exhibited significant nutrient limitations during the winter months. Though Possession Sound stands out with regard to extreme events, yearly averages of nutrient enhanced production rates demonstrate that the main basin stations all show evidence of substantial increases and may even dominate in a given year. An important step to be taken with these data is to determine if increased carbon produced in response to added nutrients is of a magnitude that would significantly affect dissolved oxygen concentrations and/or impact other trophic levels of the food web.
Acknowledgements The authors would like to acknowledge support and input from Randy Shuman and Scott Mickelson of King County Department of Natural Resources for the conception of this project. We also thank Bob Kruger, Dan Smith, and Mark Patten of King County Environmental Laboratory and Julia Bos, Skip Albertson, and Eric Siegel of the Washington State Department of Ecology for project coordination and technical assistance. The authors especially wish to thank the following peer reviewers for their thoughtful and comprehensive reviews, which improved the content and quality of this report. External peer review was conducted by Dr. Bruce Nairn and Jim Simmonds, both of King County Department of Natural Resources. Internal peer review for Ecology was done by Dr. Rick Reynolds, Environmental Assessment Program, Environmental Monitoring and Trends Section.
References Bricker, S.B., C.G. Clement, D.E. Pirhalla, S.P. Orlando, and D.R.G. Farrow. 1999. National
Estuarine Eutrophication Assessment: Effects of Nutrient Enrichment in the Nation’s Estuaries. NOAA, National Ocean Service, Special Projects Office and the National Centers for Coastal Ocean Science. Silver Spring, MD: 71 pp.
Cannon, G.A., Bretschneider, D.E., and Holbrook, J.R. 1984. Transport variability in a fjord.
In: The Estuary as a Filter, V.S. Kennedy (ed.), Academic Press, pp. 67-78. Cannon, G.A., Holbrook, J.R., and Pashinski, D.J. 1990. Variations in the onset of bottom-
water intrusions over the entrance sill of a fjord. Estuaries, 13, 31-42.

Page 13
Ebbesmeyer, C.C., and Barnes, C.A. 1980. Control of a fjord basin's dynamics by tidal mixing in embracing sill zones. Estuarine and Coastal Marine Science, 11, 311-330.
Ebbesmeyer, C.C., and Cannon, G.A. 2001. Review of Puget Sound Physical Oceanography
related to the Triple Junction. Report for King County Department of Natural Resources, 34 pp.
Edmondson, W.T. 1991. The Uses of Ecology: Lake Washington and Beyond. University of
Washington Press. 329 p. Harrison, P.J, D.L. Mackas, B.W. Frost, R.W. Macdonald and E.A. Crecelius. 1994. An
assessment of nutrients, plankton and some pollutants in the water column of Juan de Fuca Strait, Strait of Georgia and Puget Sound, and their transboundary transport. Canadian Technical Report of Fisheries and Aquatic Sciences, No. 1948: 138-174.
Newton, J.A., A.L. Thomson, L.B. Eisner, G.A. Hannach, and S.L. Albertson. 1995. Dissolved
oxygen concentrations in Hood Canal: Are conditions different than forty years ago? In Puget Sound Research ‘95 Proceedings. Puget Sound Water Quality Authority, Olympia, WA, pp. 1002-1008.
Newton, J.A., M. Edie, and J. Summers. 1998a. Primary productivity in Budd Inlet: Seasonal
patterns of variation and controlling factors. In Puget Sound Research ‘98 Proceedings. Puget Sound Action Team, Olympia, WA, pp. 132-151.
Newton, J.A., S.L. Albertson, K. Nakata, and C.L. Clishe. 1998b. Washington State Marine
Water Quality in 1996 and 1997. Washington State Department of Ecology, Olympia, WA, Publication No. 98-338.
Strickland, J.D.H. and T.R. Parsons. 1968. A Practical Handbook of Seawater Analysis.
Bulletin 167, Fisheries Research Board of Canada, Ottawa. Winter, D.F., K. Banse, and G.C. Anderson. 1975. The dynamics of phytoplankton blooms in
Puget Sound, a fjord in northwestern U.S. Marine Biology, 29: 139-175.

Page 14
This page is purposely blank for duplex printing

Page 15
Tables 1-6

Page 16
This page is purposely blank for duplex printing
Page 17
Table 1. Average daily production (in mg C m-2 d-1) for each station in 1999, 2000, and 2001. Averages are a best estimate from the 12-16 dates that were sampled per year and were seasonally weighted.
Admiralty Inlet
Possession Sound Point Wells West Point
1999 1886 2127 2028 2559
2000 2694 2135 2901 3460
2001 3356 3525 3698 3551
mean 2645 2596 2876 3190
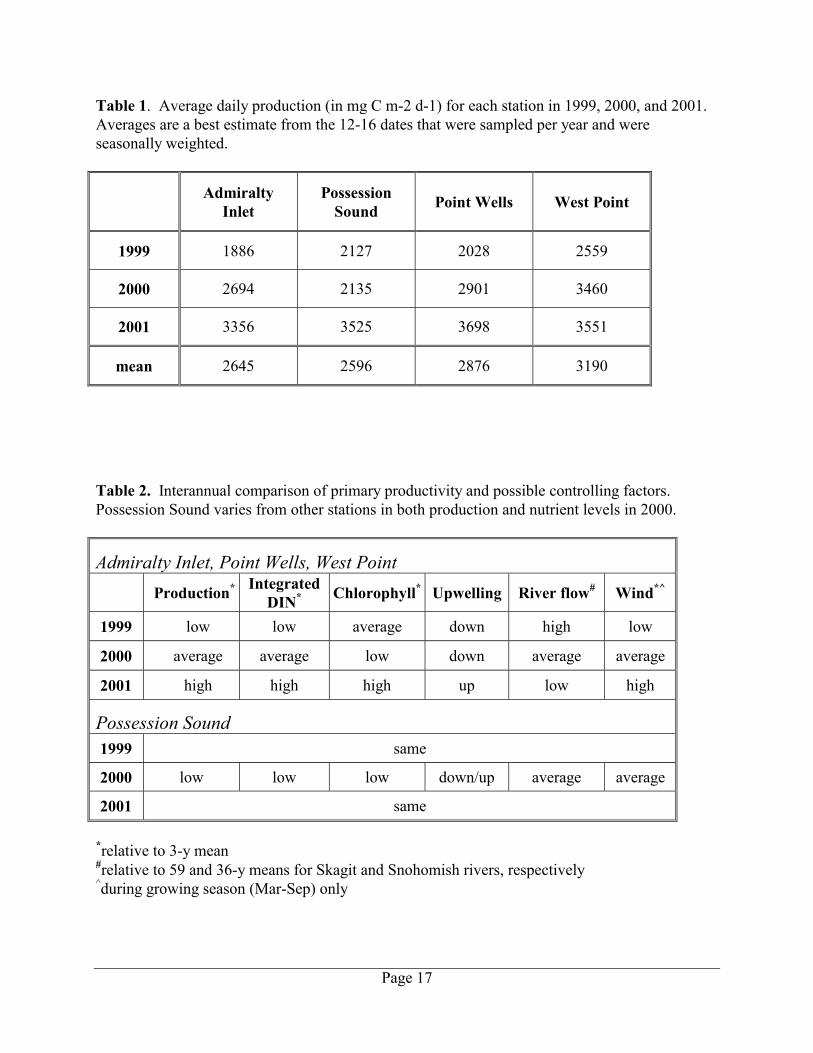
Table 2. Interannual comparison of primary productivity and possible controlling factors. Possession Sound varies from other stations in both production and nutrient levels in 2000.
Admiralty Inlet, Point Wells, West Point Production* Integrated
DIN* Chlorophyll* Upwelling River flow# Wind*^
1999 low low average down high low
2000 average average low down average average
2001 high high high up low high
Possession Sound 1999 same
2000 low low low down/up average average
2001 same *relative to 3-y mean #relative to 59 and 36-y means for Skagit and Snohomish rivers, respectively ^during growing season (Mar-Sep) only

Page 18
Table 3. Mean Bakun upwelling indices based on data from http://www.pfeg.noaa.gov/. Units are m3 s-1 100m of coastline-1. Positive numbers represent offshore transport (upwelling).
Annual Growing season (Mar-Sep)
Winter (Oct-Feb)
1999 -42 1 -110
2000 -37 0 -86
2001 6 23 -27
6-y mean -21 6 -65
Table 4. Annually averaged increases in daily production (in mg C m-2 d-1) due to nutrient addition.
Admiralty Inlet
Possession Sound Point Wells West Point average
1999 360 405 320 292 344
2000 173 292 334 236 259
2001 376 314 209 552 363

Page 19
Table 5. Increases in production due to nutrient addition. Percentage of times threshold was surpassed at each station, out of a total of 42 sampling dates. Possession Sound stands out as being the most sensitive to added nutrients.
# Threshold Admiralty Inlet
Possession Sound Point Wells West Point
1 increased production,
by wt (>450 mg C m-2 d-1)
24% 33% 19% 31%
2 increased production,
by % (>15%)
19% 36% 24% 29%
3
increased production, by wt and %
(>450 mg C m-2 d-1 AND >15%)
12% 24% 10% 19%
4 increased nutrient
utilization (spike>ambient+5uM)
21% 41% 24% 21%

Page 20
Table 6. P:B of ambient and spiked samples. P:B, Ambient
Sample (mean) P:B Spiked
Sample (mean) Significant Increase
in Spiked P:Ba
All StationsSummer 46.0 50.5 Yes Winter 16.5 17.6 Yes
Admiralty Inlet Summer 51.1 55.5 Yes Winter 15.3 16.3 Yes
Point Wells Summer 44.6 48.7 Yes Winter 15.6 16.3 No
Possession Sound Summer 49.7 56.1 Yes Winter 21.1 22.7 No
West Point Summer 39.1 42.2 Yes Winter 13.3 14.4 No a Non-parametric sign test, p=0.05

Page 21
Figures 1-8

Page 22
This page is purposely blank for duplex printing

Figure 1. Area of study. Admiralty Inlet (AI) is located at the well-mixed entrance to the estuary. Possession Sound (PS) is a partially stratified side basin. West Point (WP) is in the central main basin of Puget Sound. Point Wells (PW) is in the region where these three water bodies intersect.
122.6 122.5 122.4 122.347.5
47.6
47.7
47.8
47.9
48.0
AI
PS
PW
WP
Page 23

Figure 2. Seasonal pattern of (a) primary production, (b) phytoplankton biomass, as indicatedby chlorophyll a, and (c) surface DIN for each station for three years. Productionand chlorophyll values are integrated over the euphotic zone.
01500
30004500
60007500
900010500
1200013500
15000
Jul-98 Feb-99 Aug-99 Mar-00 Oct-00 Apr-01 Nov-01 May-02
P. P
rodu
ctio
n (m
g C
m-2
d-1
)
0
100
200
300
400
500
Jul-98 Feb-99 Aug-99 Mar-00 Oct-00 Apr-01 Nov-01 May-02
chlo
roph
yll (
mg
m-2
)
0
5
10
15
20
25
30
35
Jul-98 Feb-99 Aug-99 Mar-00 Oct-00 Apr-01 Nov-01 May-02
DIN
(µM
)
Point Wells Possession Sound Admiralty Inlet West Point
Page 24

Figure 3. Depth where sigma-t becomes 2 kg/m3 greater than at the surface. Average water column depth of PW=123m, PS=205m, AI=119m, and WP=64m.
0
50
100
150
200
250
Jul-98 Feb-99 Aug-99 Mar-00 Oct-00 Apr-01 Nov-01 May-02
dept
h (m
)
PW PS AI WP
Page 25

Figure 4. Flow data for Skagit River. Also shown are dates that phytoplankton production increased by more than 450 mg C m-2 d-1 at Admiralty Inlet and Possession Sound with addition of nutrient spike.
0
10000
20000
30000
40000
50000
60000
70000
80000
90000
Oct-98 Mar-99 Aug-99 Jan-00 Jun-00 Nov-00 Apr-01 Sep-01
disc
harg
e (c
ubic
feet
per
sec
ond)
AI PS both
Page 26
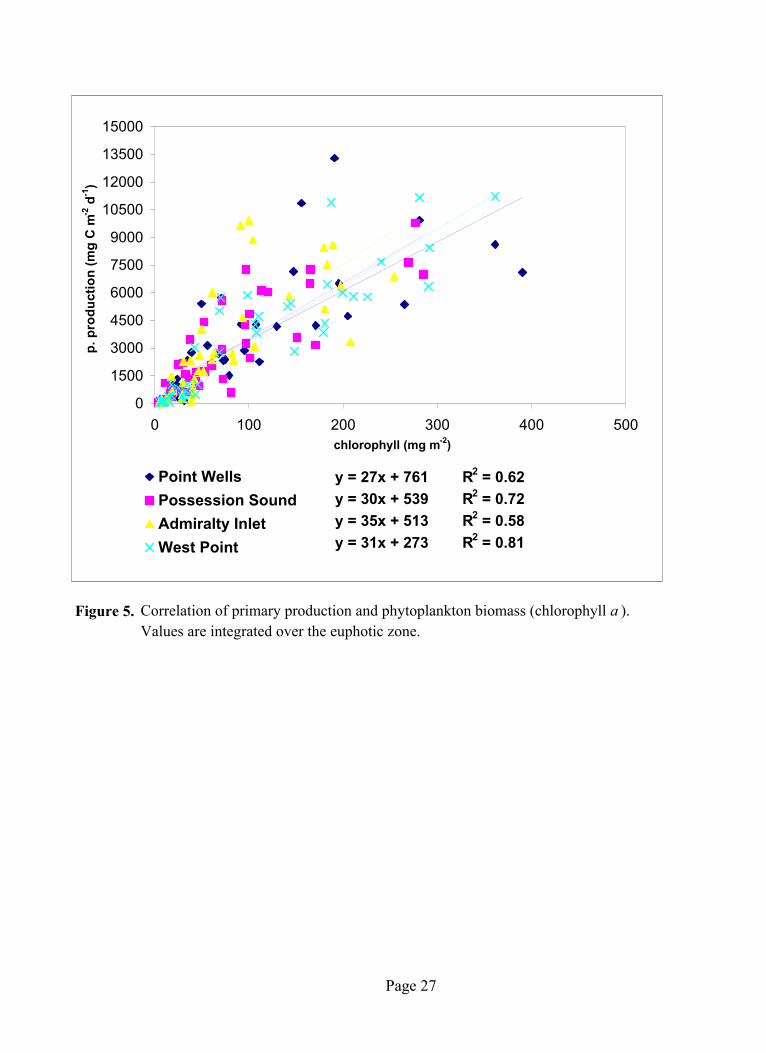
Figure 5. Correlation of primary production and phytoplankton biomass (chlorophyll a ). Values are integrated over the euphotic zone.
0
1500
3000
4500
6000
7500
9000
10500
12000
13500
15000
0 100 200 300 400 500chlorophyll (mg m-2)
p. p
rodu
ctio
n (m
g C
m-2
d-1
)
Point WellsPossession SoundAdmiralty InletWest Point
y = 27x + 761 R2 = 0.62y = 30x + 539 R2 = 0.72 y = 35x + 513 R2 = 0.58y = 31x + 273 R2 = 0.81
Page 27

Figure 6. Correlation of integrated primary production with water column irradiance forduration of study at Point Wells.
y = 5.4x - 16.9r2 = 0.89
0
2000
4000
6000
8000
10000
12000
14000
0 100 200 300 400 500
PAR (moles m-1d-1)
p. p
rodu
ctio
n (m
g C
m-2
d-1
)
Oct - Feb
Mar - Sept
Page 28

Figure 7. Increase in production (by weight) due to the addition of nutrient spike.
-1000
-500
0
500
1000
1500
2000
2500
3000
3500
4000
Jul-98 Feb-99 Aug-99 Mar-00 Oct-00 Apr-01 Nov-01 May-02
delta
pro
duct
ion
(mg
C m
-2 d
-1)
Point Wells Possession Sound Admiralty Inlet West Point
Page 29

Figure 8. Difference in P:B between ambient and spike samples for all sites combined.
-10
-5
0
5
10
15
Ja n F e b M a r A p r M a y Ju n e Ju ly A u g S e p t O c t N o v D e c
Month
Del
ta P
:B, S
pike
-Am
bien
t
Jan Mar May July Sept Nov
Page 30

Appendices

This page is purposely blank for duplex printing

Appendix 1a. Production, nutrient and chlorophyll data for all experiments at Admiralty Inlet. Integrated values are integrated over the euphotic zone.
Exp Date Euphotic Incident Integrated Surface Delta % change Integrated zone radiation DIN DIN ambient spike production chl ambient spike
# (m) (moles m-2 d-1) (mmoles m-2) (uM) (mg C m-2 d-1) (mg C m-2 d-1) (mg C m-2 d-1) (mg chl m-2) (mg C mg chl-1 d-1) (mg C mg chl-1 d-1)
1 27-Oct-98 35.1 n/a 695 18 140 141 1 1 39.0 4 42 2-Dec-98 24.2 5 575 24 61 64 3 5 6.6 9 103 6-Jan-99 17.4 8 440 26 75 73 -3 -4 6.1 12 124 10-Feb-99 15.1 11 432 29 80 84 5 6 5.0 16 175 17-Mar-99 19.5 17 525 27 670 622 -48 -7 18.3 37 346 13-Apr-99 28.9 n/a 690 15 4643 4036 -608 -13 93.5 50 437 12-May-99 17.7 35 331 9 3081 3490 408 13 105.5 29 338 9-Jun-99 25.2 46 436 9 2333 2741 408 17 37.7 62 739 30-Jun-99 31.5 21 575 10 1714 1912 199 12 51.6 33 37
10 22-Jul-99 15.3 35 94 0 3332 5328 1996 60 208.1 16 2611 4-Aug-99 17.9 n/a 147 3 6387 7958 1571 25 197.4 32 4012 25-Aug-99 19.2 45 344 15 2734 3612 878 32 63.1 43 5713 15-Sep-99 7.5 25 21 0 5122 6288 1166 23 180.5 28 3514 6-Oct-99 29.4 n/a 613 20 494 523 28 6 29.1 17 1815 27-Oct-99 30.9 6 706 22 487 488 1 0 40.6 12 1216 7-Dec-99 28.6 3 804 30 75 96 22 29 10.4 7 917 10-Jan-00 11.7 2 331 29 37 33 -5 -13 5.4 7 618 10-Feb-00 22.1 9 678 29 208 233 25 12 13.5 15 1719 8-Mar-00 22.9 n/a 570 24 2703 2826 123 5 81.9 33 3420 5-Apr-00 13.0 25 215 10 7520 7813 293 4 182.7 41 4321 3-May-00 26.0 43 508 20 1128 1161 33 3 30.3 37 3822 22-May-00 22.1 43 461 18 1276 1396 119 9 42.2 30 3323 15-Jun-00 11.4 56 152 8 4025 4448 423 11 49.5 81 9024 28-Jun-00 7.8 47 63 2 8867 8904 38 0 104.1 85 8625 13-Jul-00 12.7 50 191 9 6018 6765 747 12 61.1 98 11126 31-Jul-00 26.0 n/a 535 23 2274 2505 231 10 30.2 75 8327 16-Aug-00 15.1 46 211 7 9921 10541 620 6 100.0 99 10528 6-Sep-00 20.5 20 451 17 2588 2184 -404 -16 47.4 55 4629 27-Sep-00 28.3 22 561 19 2364 2175 -189 -8 60.6 39 3630 18-Oct-00 25.7 7 631 24 282 303 21 8 12.5 23 2431 13-Nov-00 41.6 12 1058 25 864 1137 273 32 40.6 21 2832 13-Dec-00 30.9 2 832 27 257 281 24 9 29.5 9 10
33 23-Jan-01 20.8 3 609 28 86 88 3 3.079007 8 10.09447398 10.4052835734 27-Feb-01 23.4 20 585 21 5818 6015 197 3.381252 142 40.86580499 42.2475806335 26-Mar-01 25.5 13 583 19 6892 7716 824 11.9 254 27.1 30.436 25-Apr-01 31.2 39 764 20 1753 1933 180 10.26054 47 37.67465452 41.5402766237 16-May-01 13.0 23 215 13 8458 9518 1059 12.52516 180 47.10023008 52.9996074838 30-May-01 14.3 48 120 6 8580 11289 2709 31.56946 189 45.38884489 59.7178574939 20-Jun-01 10.9 50 199 11 9642 10320 678 7.034686 91 105.8333599 113.278404540 1-Aug-01 27.6 43 509 17 1474 1641 167 11.33817 18 83.29823831 92.7427350941 17-Sep-01 20.5 8 351 13 2306 2068 -238 -10.33086 83 27.62865846 24.7743798942 30-Oct-01 26.0 6 634 24 200 194 -6 -3.073889 8 26.3486661 25.53873739
Integrated p.prod. P:B (µ)

Appendix 1b. Primary production, nutrient and chlorophyll data for all experiments at Point Wells. Integrated values are integrated over the euphotic zone.
Exp Date Euphotic Incident Integrated Surface Delta % change Integrated zone radiation DIN DIN ambient spike production chl ambient spike
# (m) (moles m-2 d-1) (mmoles m-2) (uM) (mg C m-2 d-1) (mg C m-2 d-1) (mg C m-2 d-1) (mg chl m-2) (mg C mg chl-1 d-1) (mg C mg chl-1 d-1)
1 27-Oct-98 32.5 n/a 659 18 158 132 -26 -17 31.0 5 42 2-Dec-98 19.5 5 479 26 103 106 3 3 11.6 9 93 6-Jan-99 11.7 8 313 26 73 69 -3 -4 5.7 13 124 10-Feb-99 17.7 11 516 29 94 97 3 3 6.4 15 155 17-Mar-99 22.4 17 611 27 870 1034 164 19 25.7 34 406 13-Apr-99 30.4 n/a 780 26 3161 3205 44 1 55.7 57 587 12-May-99 11.7 35 26 0 7107 8590 1483 21 390.4 18 228 9-Jun-99 24.4 46 401 17 1077 1191 114 11 20.7 52 579 30-Jun-99 29.9 21 456 5 2253 2489 236 10 110.7 20 2210 22-Jul-99 15.9 35 176 2 4733 5413 680 14 205.0 23 2611 4-Aug-99 10.9 n/a 102 1 4267 4498 231 5 107.5 40 4212 25-Aug-99 24.2 45 313 11 4219 3837 -382 -9 171.0 25 2213 15-Sep-99 28.1 25 542 17 2853 4693 1840 64 95.0 30 4914 6-Oct-99 25.5 n/a 495 18 1524 1823 300 20 78.8 19 2315 27-Oct-99 32.2 6 749 24 270 295 25 9 26.1 10 1116 7-Dec-99 26.0 3 703 31 56 96 41 73 8.4 7 1117 10-Jan-00 22.1 2 648 30 40 33 -7 -16 5.4 7 618 10-Feb-00 22.1 9 680 31 121 121 -1 0 8.2 15 1519 8-Mar-00 26.5 n/a 671 22 4157 4395 237 6 129.6 32 3420 5-Apr-00 11.4 25 141 5 9942 11356 1414 14 280.8 35 4021 3-May-00 23.9 43 419 14 2318 2745 427 18 72.5 32 3822 22-May-00 22.1 43 461 20 2711 2844 133 5 67.9 40 4223 15-Jun-00 26.8 56 499 17 2752 3043 291 11 38.8 71 7824 28-Jun-00 9.1 47 76 0 5719 6969 1251 22 70.9 81 9825 13-Jul-00 10.4 50 142 11 5402 5600 198 4 49.3 109 11426 31-Jul-00 32.0 n/a 632 24 2323 2456 133 6 34.7 67 7127 16-Aug-00 10.1 46 103 2 10856 11916 1060 10 155.6 70 7728 6-Sep-00 33.8 20 752 20 1376 1379 3 0 37.2 37 3729 27-Sep-00 30.2 22 573 16 2373 2554 181 8 74.5 32 3430 18-Oct-00 31.2 7 737 24 294 315 21 7 13.6 22 2331 13-Nov-00 42.1 12 1087 26 645 799 154 24 30.2 21 2632 13-Dec-00 31.2 2 845 28 107 89 -19 -18 10.0 11 9
33 23-Jan-01 20.8 3 592 29 131 175 44 34 9 14 1934 27-Feb-01 28.6 20 850 30 735 673 -62 -8 18 40 3735 26-Mar-01 18.5 13 322 17 8605 9472 867 10 361 24 2636 25-Apr-01 40.8 39 918 23 4298 4211 -87 -2 91 47 4637 16-May-01 13.3 23 209 12 6496 8102 1606 25 196 33 4138 30-May-01 17.9 48 250 12 7136 7552 416 6 147 49 5139 20-Jun-01 9.6 50 79 3 13295 13466 171 1 191 70 7140 1-Aug-01 32.5 43 595 16 1329 1438 109 8 24 56 6141 17-Sep-01 12.5 8 88 4 5367 4870 -497 -9 265 20 1842 30-Oct-01 31.2 6 742 23 402 376 -25 -6 15 26 25
Integrated p.prod. P:B (µ)
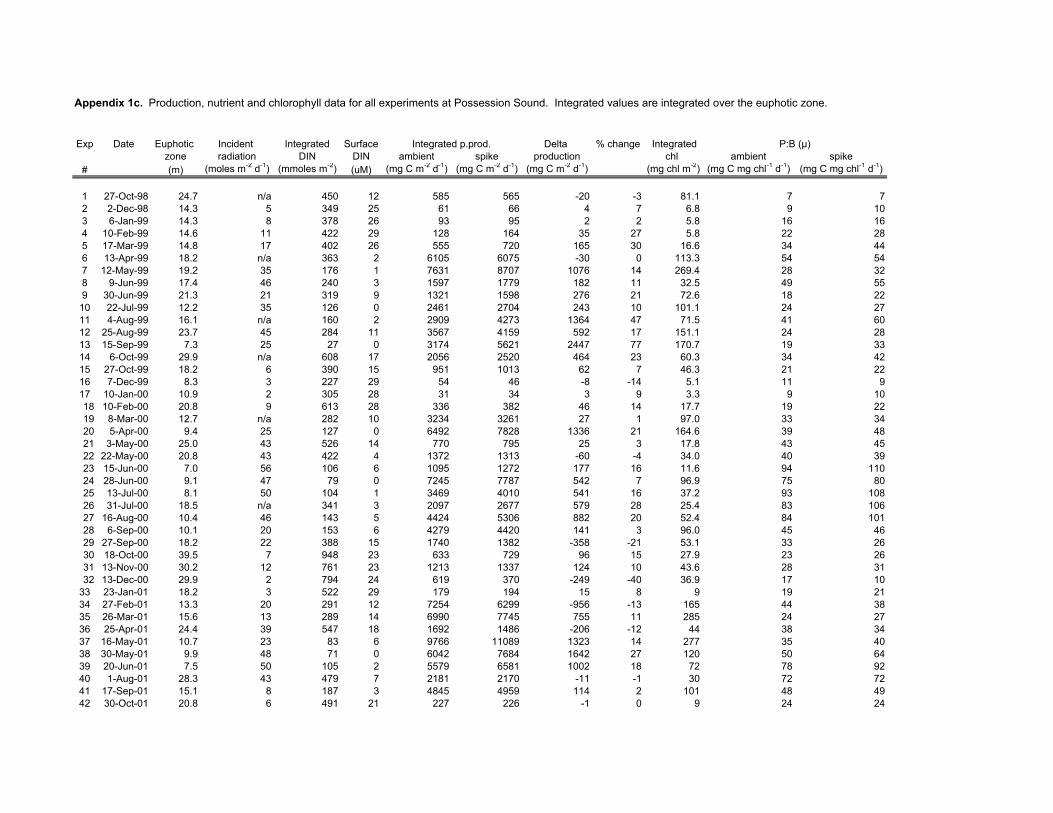
Appendix 1c. Production, nutrient and chlorophyll data for all experiments at Possession Sound. Integrated values are integrated over the euphotic zone.
Exp Date Euphotic Incident Integrated Surface Delta % change Integrated zone radiation DIN DIN ambient spike production chl ambient spike
# (m) (moles m-2 d-1) (mmoles m-2) (uM) (mg C m-2 d-1) (mg C m-2 d-1) (mg C m-2 d-1) (mg chl m-2) (mg C mg chl-1 d-1) (mg C mg chl-1 d-1)
1 27-Oct-98 24.7 n/a 450 12 585 565 -20 -3 81.1 7 72 2-Dec-98 14.3 5 349 25 61 66 4 7 6.8 9 103 6-Jan-99 14.3 8 378 26 93 95 2 2 5.8 16 164 10-Feb-99 14.6 11 422 29 128 164 35 27 5.8 22 285 17-Mar-99 14.8 17 402 26 555 720 165 30 16.6 34 446 13-Apr-99 18.2 n/a 363 2 6105 6075 -30 0 113.3 54 547 12-May-99 19.2 35 176 1 7631 8707 1076 14 269.4 28 328 9-Jun-99 17.4 46 240 3 1597 1779 182 11 32.5 49 559 30-Jun-99 21.3 21 319 9 1321 1598 276 21 72.6 18 22
10 22-Jul-99 12.2 35 126 0 2461 2704 243 10 101.1 24 2711 4-Aug-99 16.1 n/a 160 2 2909 4273 1364 47 71.5 41 6012 25-Aug-99 23.7 45 284 11 3567 4159 592 17 151.1 24 2813 15-Sep-99 7.3 25 27 0 3174 5621 2447 77 170.7 19 3314 6-Oct-99 29.9 n/a 608 17 2056 2520 464 23 60.3 34 4215 27-Oct-99 18.2 6 390 15 951 1013 62 7 46.3 21 2216 7-Dec-99 8.3 3 227 29 54 46 -8 -14 5.1 11 917 10-Jan-00 10.9 2 305 28 31 34 3 9 3.3 9 1018 10-Feb-00 20.8 9 613 28 336 382 46 14 17.7 19 2219 8-Mar-00 12.7 n/a 282 10 3234 3261 27 1 97.0 33 3420 5-Apr-00 9.4 25 127 0 6492 7828 1336 21 164.6 39 4821 3-May-00 25.0 43 526 14 770 795 25 3 17.8 43 4522 22-May-00 20.8 43 422 4 1372 1313 -60 -4 34.0 40 3923 15-Jun-00 7.0 56 106 6 1095 1272 177 16 11.6 94 11024 28-Jun-00 9.1 47 79 0 7245 7787 542 7 96.9 75 8025 13-Jul-00 8.1 50 104 1 3469 4010 541 16 37.2 93 10826 31-Jul-00 18.5 n/a 341 3 2097 2677 579 28 25.4 83 10627 16-Aug-00 10.4 46 143 5 4424 5306 882 20 52.4 84 10128 6-Sep-00 10.1 20 153 6 4279 4420 141 3 96.0 45 4629 27-Sep-00 18.2 22 388 15 1740 1382 -358 -21 53.1 33 2630 18-Oct-00 39.5 7 948 23 633 729 96 15 27.9 23 2631 13-Nov-00 30.2 12 761 23 1213 1337 124 10 43.6 28 3132 13-Dec-00 29.9 2 794 24 619 370 -249 -40 36.9 17 10
33 23-Jan-01 18.2 3 522 29 179 194 15 8 9 19 2134 27-Feb-01 13.3 20 291 12 7254 6299 -956 -13 165 44 3835 26-Mar-01 15.6 13 289 14 6990 7745 755 11 285 24 2736 25-Apr-01 24.4 39 547 18 1692 1486 -206 -12 44 38 3437 16-May-01 10.7 23 83 6 9766 11089 1323 14 277 35 4038 30-May-01 9.9 48 71 0 6042 7684 1642 27 120 50 6439 20-Jun-01 7.5 50 105 2 5579 6581 1002 18 72 78 9240 1-Aug-01 28.3 43 479 7 2181 2170 -11 -1 30 72 7241 17-Sep-01 15.1 8 187 3 4845 4959 114 2 101 48 4942 30-Oct-01 20.8 6 491 21 227 226 -1 0 9 24 24
Integrated p.prod. P:B (µ)
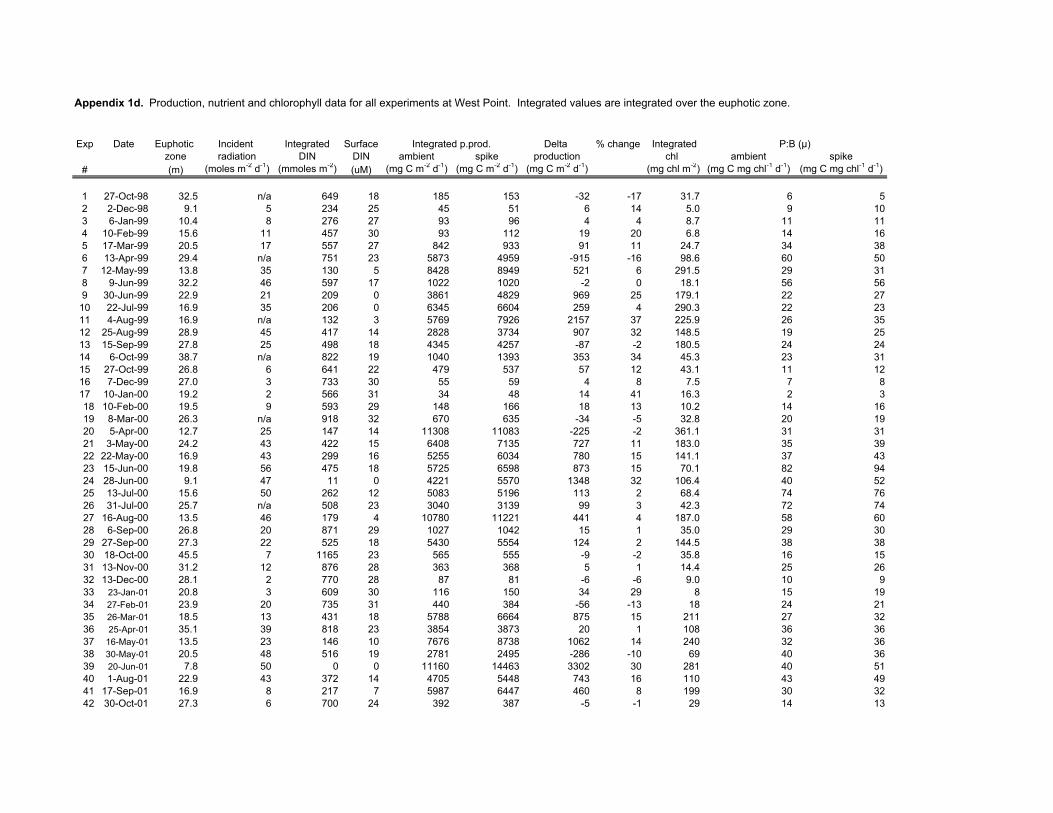
Appendix 1d. Production, nutrient and chlorophyll data for all experiments at West Point. Integrated values are integrated over the euphotic zone.
Exp Date Euphotic Incident Integrated Surface Delta % change Integrated zone radiation DIN DIN ambient spike production chl ambient spike
# (m) (moles m-2 d-1) (mmoles m-2) (uM) (mg C m-2 d-1) (mg C m-2 d-1) (mg C m-2 d-1) (mg chl m-2) (mg C mg chl-1 d-1) (mg C mg chl-1 d-1)
1 27-Oct-98 32.5 n/a 649 18 185 153 -32 -17 31.7 6 52 2-Dec-98 9.1 5 234 25 45 51 6 14 5.0 9 103 6-Jan-99 10.4 8 276 27 93 96 4 4 8.7 11 114 10-Feb-99 15.6 11 457 30 93 112 19 20 6.8 14 165 17-Mar-99 20.5 17 557 27 842 933 91 11 24.7 34 386 13-Apr-99 29.4 n/a 751 23 5873 4959 -915 -16 98.6 60 507 12-May-99 13.8 35 130 5 8428 8949 521 6 291.5 29 318 9-Jun-99 32.2 46 597 17 1022 1020 -2 0 18.1 56 569 30-Jun-99 22.9 21 209 0 3861 4829 969 25 179.1 22 27
10 22-Jul-99 16.9 35 206 0 6345 6604 259 4 290.3 22 2311 4-Aug-99 16.9 n/a 132 3 5769 7926 2157 37 225.9 26 3512 25-Aug-99 28.9 45 417 14 2828 3734 907 32 148.5 19 2513 15-Sep-99 27.8 25 498 18 4345 4257 -87 -2 180.5 24 2414 6-Oct-99 38.7 n/a 822 19 1040 1393 353 34 45.3 23 3115 27-Oct-99 26.8 6 641 22 479 537 57 12 43.1 11 1216 7-Dec-99 27.0 3 733 30 55 59 4 8 7.5 7 817 10-Jan-00 19.2 2 566 31 34 48 14 41 16.3 2 318 10-Feb-00 19.5 9 593 29 148 166 18 13 10.2 14 1619 8-Mar-00 26.3 n/a 918 32 670 635 -34 -5 32.8 20 1920 5-Apr-00 12.7 25 147 14 11308 11083 -225 -2 361.1 31 3121 3-May-00 24.2 43 422 15 6408 7135 727 11 183.0 35 3922 22-May-00 16.9 43 299 16 5255 6034 780 15 141.1 37 4323 15-Jun-00 19.8 56 475 18 5725 6598 873 15 70.1 82 9424 28-Jun-00 9.1 47 11 0 4221 5570 1348 32 106.4 40 5225 13-Jul-00 15.6 50 262 12 5083 5196 113 2 68.4 74 7626 31-Jul-00 25.7 n/a 508 23 3040 3139 99 3 42.3 72 7427 16-Aug-00 13.5 46 179 4 10780 11221 441 4 187.0 58 6028 6-Sep-00 26.8 20 871 29 1027 1042 15 1 35.0 29 3029 27-Sep-00 27.3 22 525 18 5430 5554 124 2 144.5 38 3830 18-Oct-00 45.5 7 1165 23 565 555 -9 -2 35.8 16 1531 13-Nov-00 31.2 12 876 28 363 368 5 1 14.4 25 2632 13-Dec-00 28.1 2 770 28 87 81 -6 -6 9.0 10 933 23-Jan-01 20.8 3 609 30 116 150 34 29 8 15 1934 27-Feb-01 23.9 20 735 31 440 384 -56 -13 18 24 2135 26-Mar-01 18.5 13 431 18 5788 6664 875 15 211 27 3236 25-Apr-01 35.1 39 818 23 3854 3873 20 1 108 36 3637 16-May-01 13.5 23 146 10 7676 8738 1062 14 240 32 3638 30-May-01 20.5 48 516 19 2781 2495 -286 -10 69 40 3639 20-Jun-01 7.8 50 0 0 11160 14463 3302 30 281 40 5140 1-Aug-01 22.9 43 372 14 4705 5448 743 16 110 43 4941 17-Sep-01 16.9 8 217 7 5987 6447 460 8 199 30 3242 30-Oct-01 27.3 6 700 24 392 387 -5 -1 29 14 13
Integrated p.prod. P:B (µ)

Appendix 2. Times when thresholds to assess nutrient sensitivity were surpassed.
Jan Feb Mar Apr May Jun Jul Aug Sep Oct Nov Dec
1) Increased Production (>450 mg C m -2 d -1 ):Admiralty Inlet 1998
1999 x xx x2000 x x2001 x xx x
Possession Sound 19981999 x xx x x2000 x x xx x2001 x xx x
Point Wells 19981999 x x x2000 x x x2001 x x
West Point 19981999 x x xx2000 xx xx2001 x x x x x
2) Increased Production (>15%):Admiralty Inlet 1998
1999 x x xx x x2000 x2001 x
Possession Sound 19981999 x x x xx x x2000 x x xx xx x2001 x x
Point Wells 19981999 x x x x x2000 x x x2001 x x
West Point 19981999 x x xx x2000 x xx2001 x x x x
Jan Feb Mar Apr May Jun Jul Aug Sep Oct Nov Dec

Appendix 2(cont). Times when thresholds to assess nutrient sensitivity were surpassed.
Jan Feb Mar Apr May Jun Jul Aug Sep Oct Nov Dec
3) Increased Production (>450 mg C m -2 d -1 and >15%):Admiralty Inlet 1998
1999 x xx x20002001 x
Possession Sound 19981999 xx x x2000 x xx x2001 x x
Point Wells 19981999 x x2000 x2001 x
West Point 19981999 x xx2000 xx2001 x x x
4) Increased Nutrient Utilization (spike>ambient+5uM):Admiralty Inlet 1998
1999 x x x2000 x x x2001 x x x
Possession Sound 1998 x1999 x x x x x x2000 x x xx x x2001 xx x x
Point Wells 19981999 x x x2000 x x x x2001 x x x
West Point 1998 x1999 x x x x2000 x x x2001 x
Jan Feb Mar Apr May Jun Jul Aug Sep Oct Nov Dec