Embed Size (px)
DESCRIPTION
Seatrade Middle East Maritime Energy Transportation. Middle East Oil and Shipping FAST FORWARD ! 5 December 2006 Peter M. Swift Managing Director, INTERTANKO. Seatrade Middle East Maritime Energy Transportation. Middle East Oil and Shipping TODAY. Seaborne Crude Oil Flows - 2005. - PowerPoint PPT Presentation
Citation preview
Seatrade Middle East MaritimeEnergy Transportation
Middle EastOil and Shipping
FAST FORWARD !
5 December 2006
Peter M. SwiftManaging Director, INTERTANKO
Seatrade Middle East MaritimeEnergy Transportation
Middle East
Oil and Shipping
TODAY
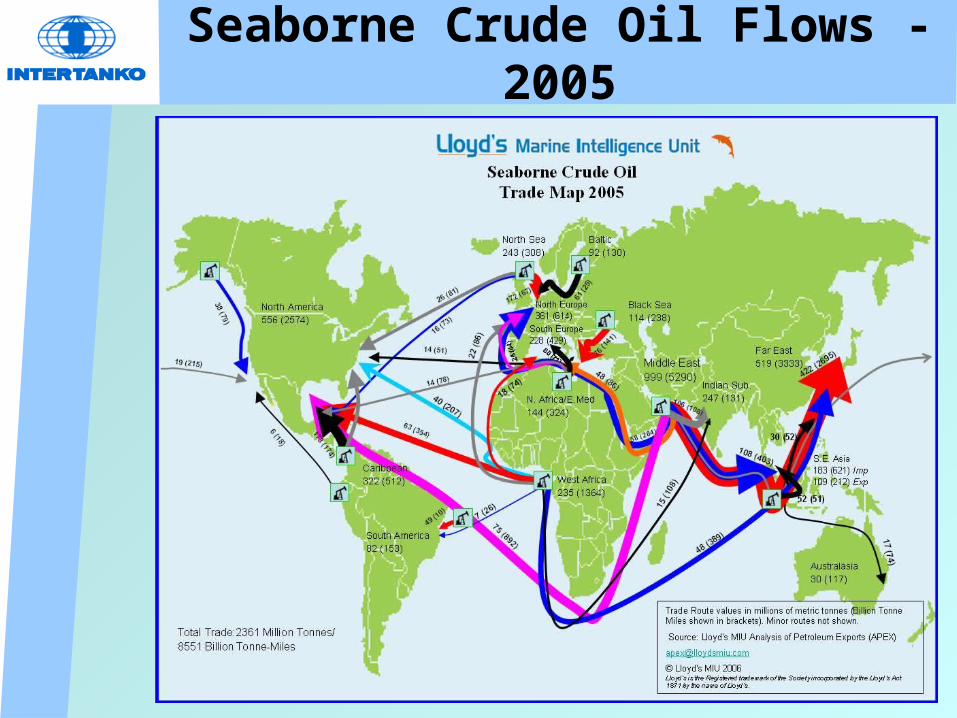
Seaborne Crude Oil Flows - 2005
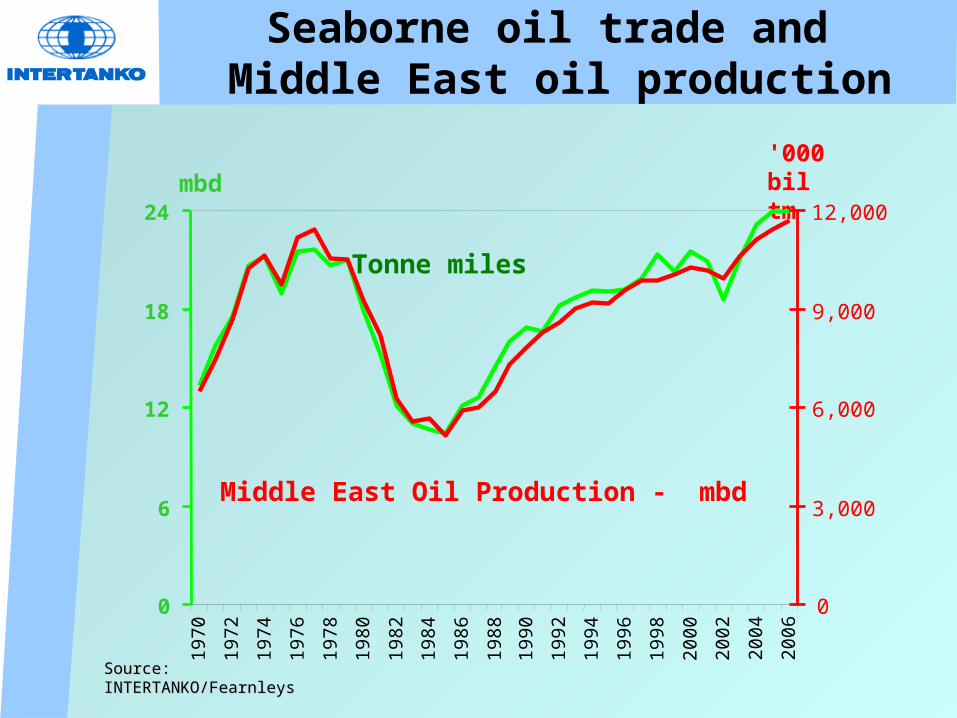
Seaborne oil trade and Middle East oil production
Source:Source:INTERTANKO/FearnleysINTERTANKO/Fearnleys
'000bil tmmbd
0
6
12
18
2419
70
197
2
197
4
197
6
197
8
198
0
198
2
198
4
198
6
198
8
199
0
199
2
199
4
199
6
199
8
200
0
200
2
200
4
200
6
0
3,000
6,000
9,000
12,000
Middle East Oil Production - mbd
Tonne miles
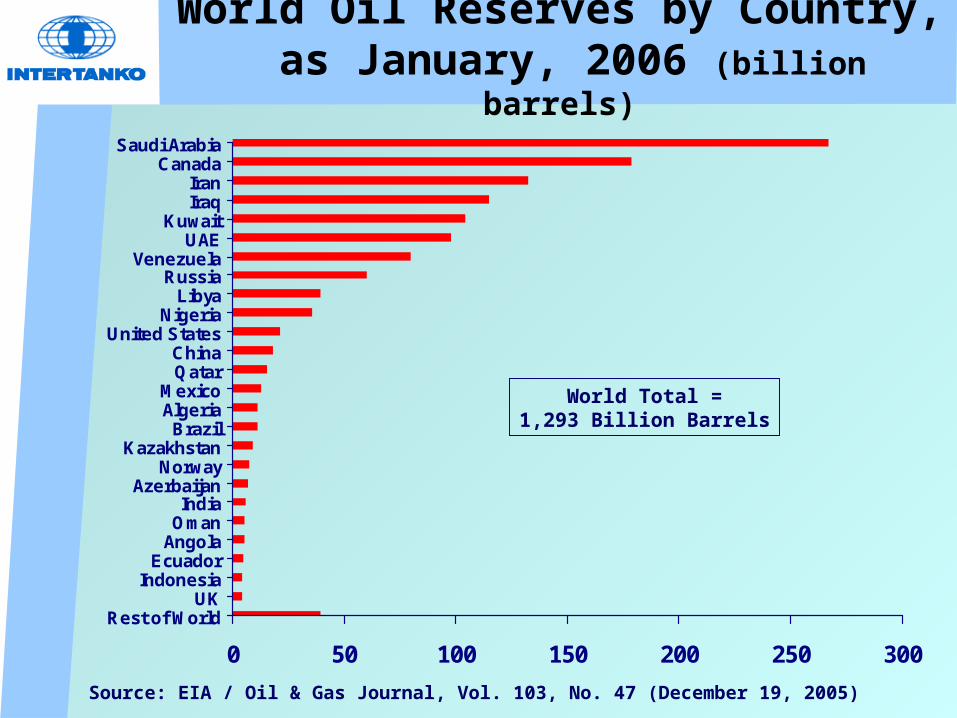
World Oil Reserves by Country, as January, 2006 (billion barrels)
0 50 100 150 200 250 300
Rest of WorldUK
IndonesiaEcuador
AngolaOmanIndia
AzerbaijanNorway
KazakhstanBrazil
AlgeriaMexico
QatarChina
United StatesNigeria
LibyaRussia
VenezuelaUAE
KuwaitIraqIran
CanadaSaudi Arabia
Source: EIA / Oil & Gas Journal, Vol. 103, No. 47 (December 19, 2005)
World Total =1,293 Billion Barrels
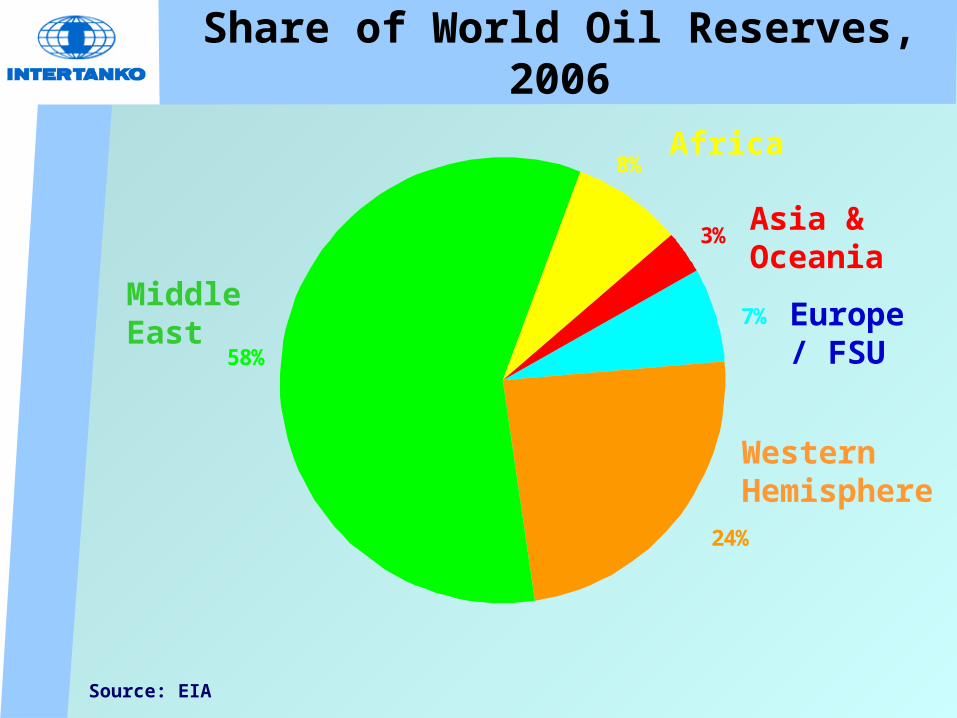
Share of World Oil Reserves, 2006
24%
7%
3%
58%
8%
Middle East
Western Hemisphere
Europe/ FSU
Asia &Oceania
Africa
Source: EIA
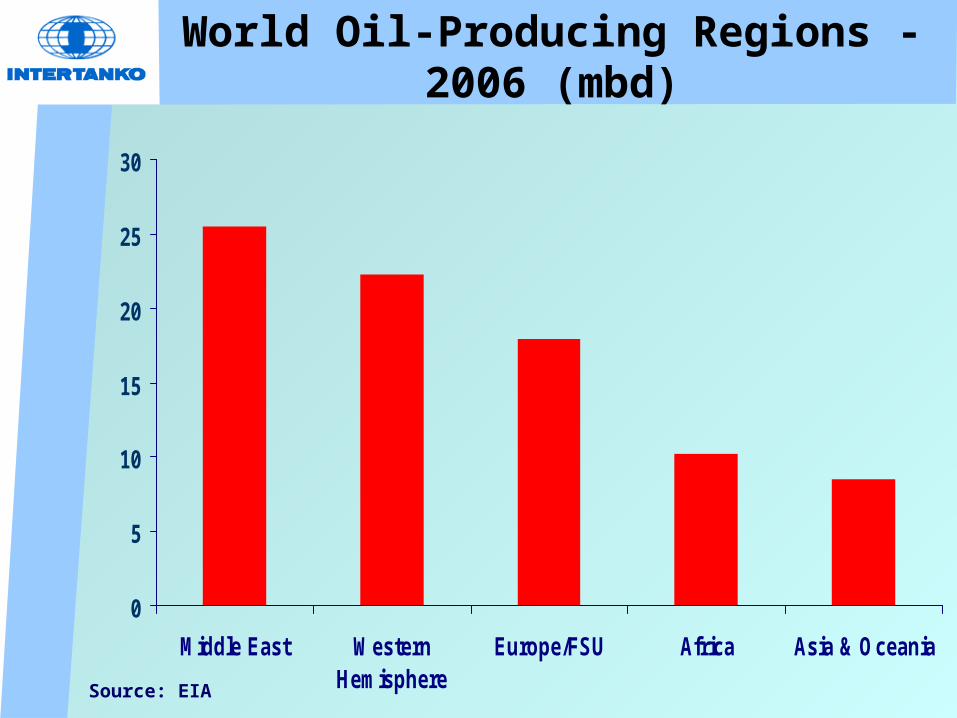
World Oil-Producing Regions - 2006 (mbd)
0
5
10
15
20
25
30
Middle East WesternHemisphere
Europe/FSU Africa Asia & Oceania
Source: EIA
Seatrade Middle East MaritimeEnergy Transportation
Middle East
Oil and Shipping
FAST FORWARD !
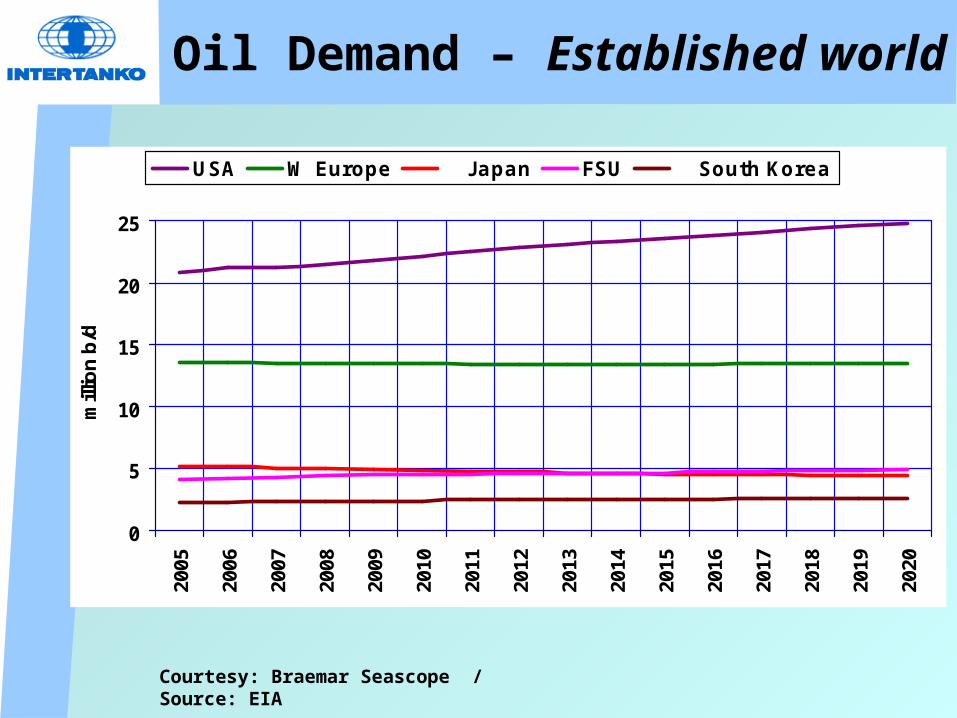
Oil Demand – Established world
Courtesy: Braemar Seascope / Source: EIA
0
5
10
15
20
25
2005
2006
2007
2008
2009
2010
2011
2012
2013
2014
2015
2016
2017
2018
2019
2020
mill
ion
b/d
USA W Europe J apan FSU South Korea
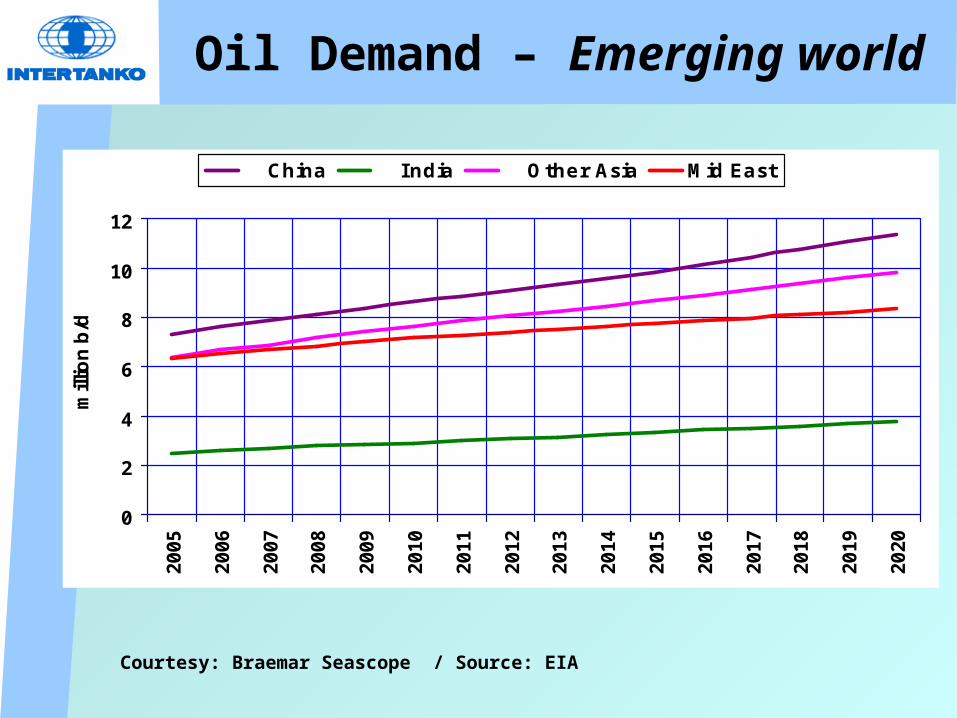
Oil Demand – Emerging world
Courtesy: Braemar Seascope / Source: EIA
0
2
4
6
8
10
12
20
05
20
06
20
07
20
08
20
09
20
10
20
11
20
12
20
13
20
14
20
15
20
16
20
17
20
18
20
19
20
20
mill
ion
b/d
China India Other Asia Mid East
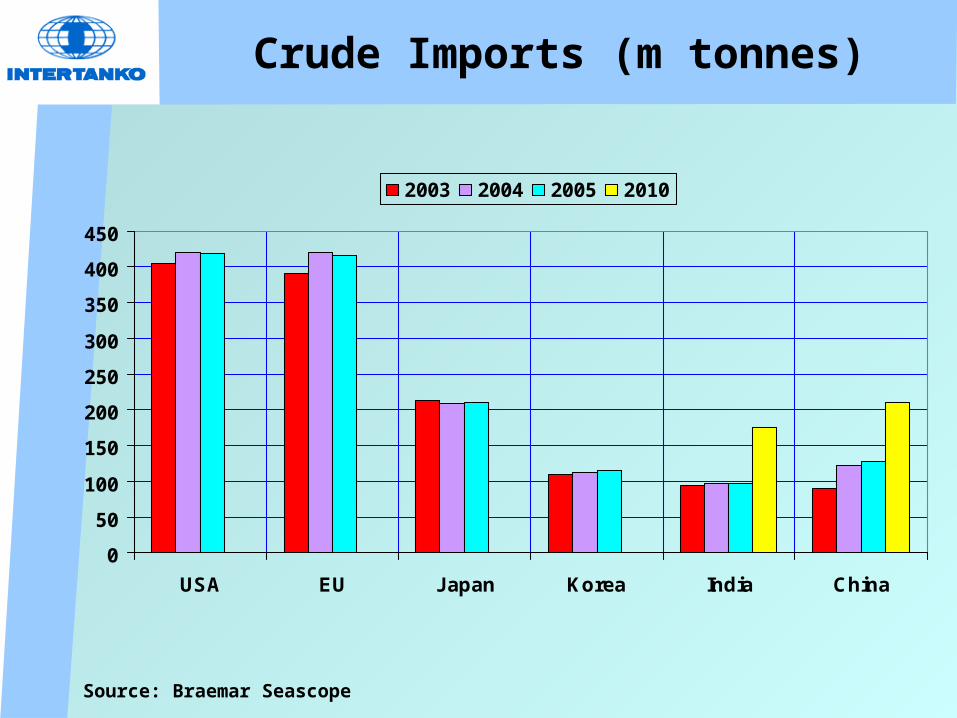
Crude Imports (m tonnes)
Source: Braemar Seascope
0
50
100
150
200
250
300
350
400
450
USA EU Japan Korea India China
2003 2004 2005 2010
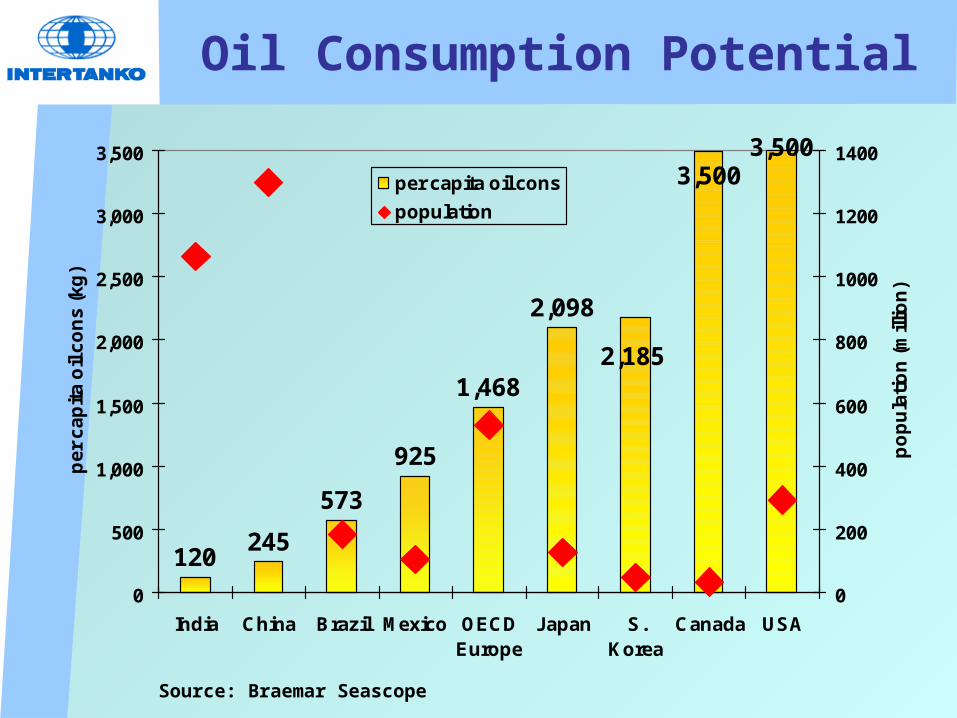
Oil Consumption Potential
Source: Braemar Seascope
120245
573
925
1,468
2,098
3,5003,500
2,185
0
500
1,000
1,500
2,000
2,500
3,000
3,500
India China Brazil Mexico OECDEurope
Japan S.Korea
Canada USA
pe
r c
ap
ita
oil
co
ns
(k
g)
0
200
400
600
800
1000
1200
1400
po
pu
lati
on
(m
illio
n)
per capita oil cons
population
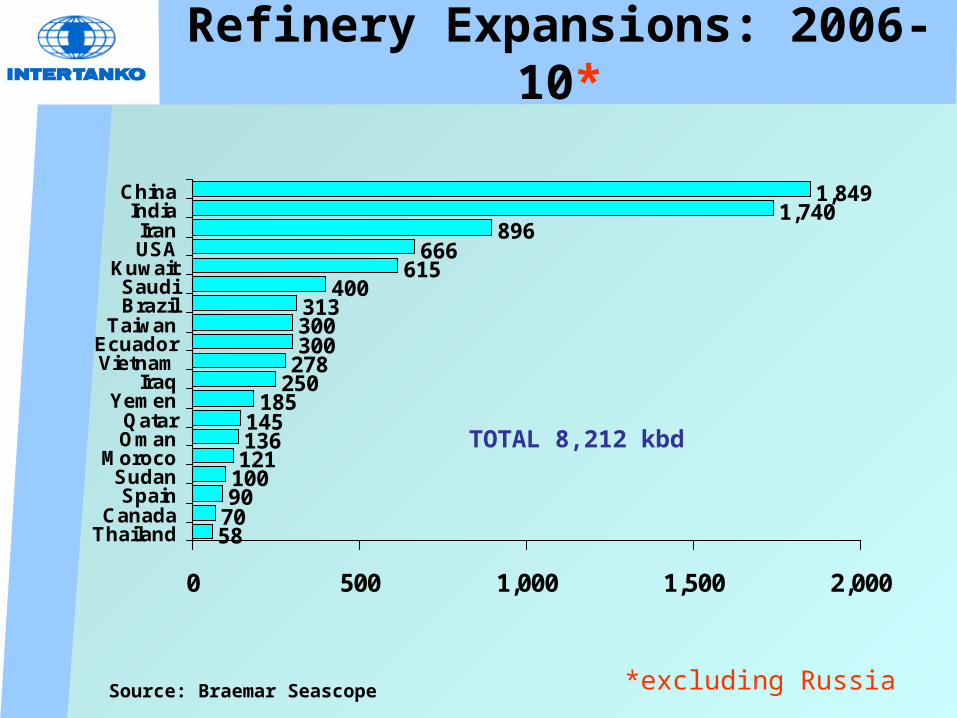
Refinery Expansions: 2006-10*
TOTAL 8,212 kbd
*excluding RussiaSource: Braemar Seascope
587090100121136145
185250278300300313
400615
666896
1,7401,849
0 500 1,000 1,500 2,000
ThailandCanada
SpainSudan
MorocoOmanQatar
YemenIraq
VietnamEcuador
TaiwanBrazilSaudi
KuwaitUSAIran
IndiaChina
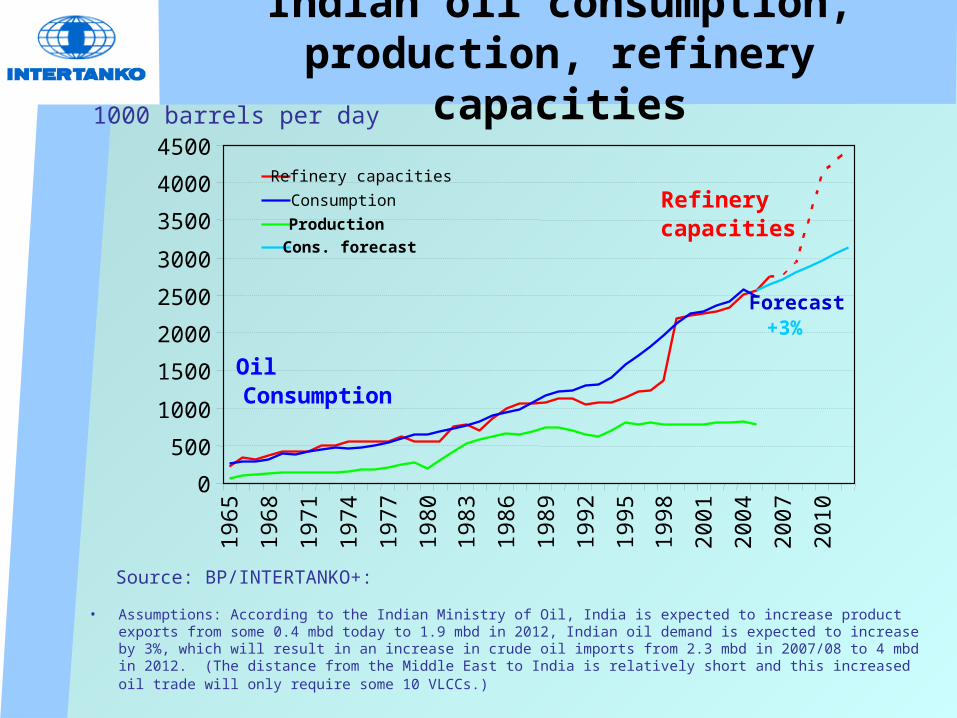
Indian oil consumption, production, refinery capacities
• Assumptions: According to the Indian Ministry of Oil, India is expected to increase product exports from some 0.4 mbd today to 1.9 mbd in 2012, Indian oil demand is expected to increase by 3%, which will result in an increase in crude oil imports from 2.3 mbd in 2007/08 to 4 mbd in 2012. (The distance from the Middle East to India is relatively short and this increased oil trade will only require some 10 VLCCs.)
Source: BP/INTERTANKO+:
1000 barrels per day
0
500
1000
1500
2000
2500
3000
3500
4000
4500
1965
1968
1971
1974
1977
1980
1983
1986
1989
1992
1995
1998
2001
2004
2007
2010
Refinery capacities
Consumption
Production
Cons. forecast
Refinery capacities
Oil Consumption
Forecast +3%
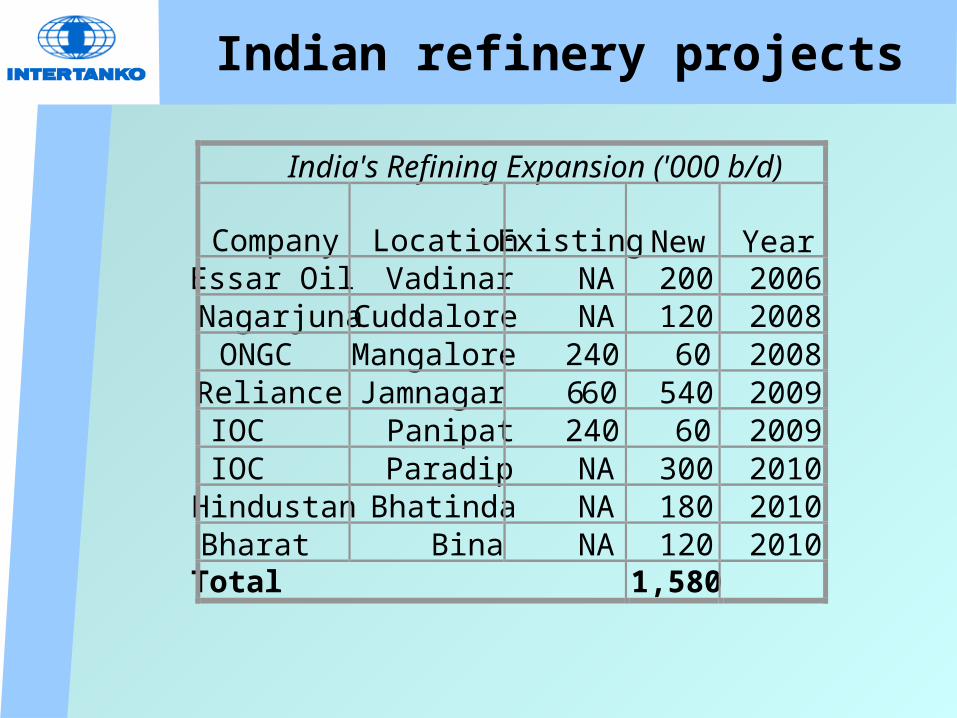
Indian refinery projects
India's Refining Expansion ('000 b/d)
Company Location Existing New Year Essar Oil Vadinar NA 200 2006 Nagarjuna Cuddalore NA 120 2008 ONGC Mangalore 240 60 2008 Reliance Jamnagar 660 540 2009 IOC Panipat 240 60 2009 IOC Paradip NA 300 2010 Hindustan Bhatinda NA 180 2010 Bharat Bina NA 120 2010 Total 1,580
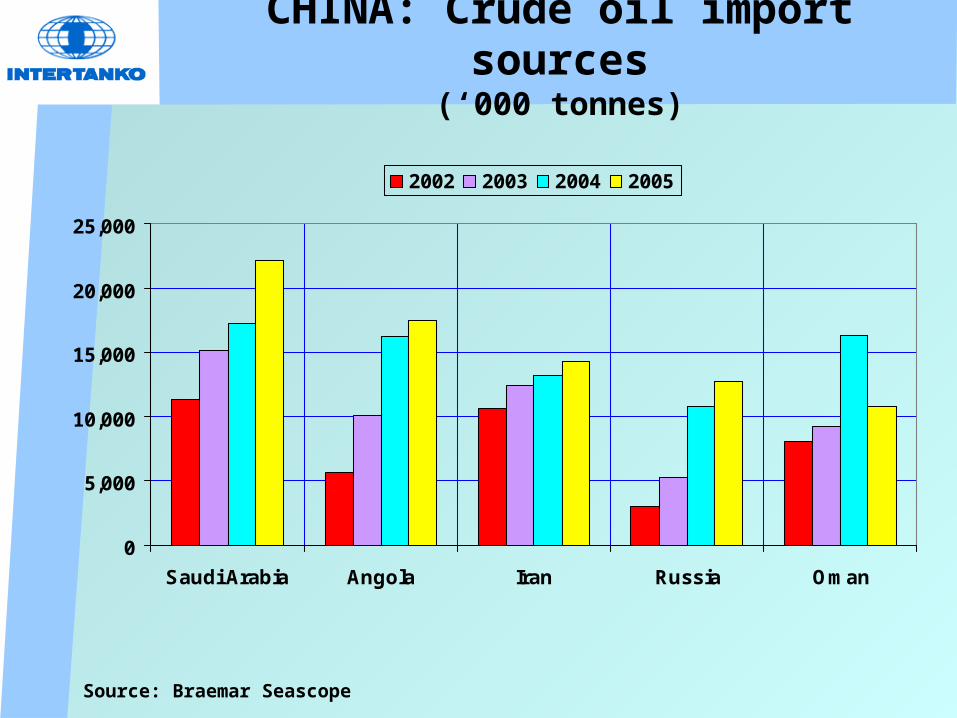
CHINA: Crude oil import sources(‘000 tonnes)
Source: Braemar Seascope
0
5,000
10,000
15,000
20,000
25,000
Saudi Arabia Angola Iran Russia Oman
2002 2003 2004 2005
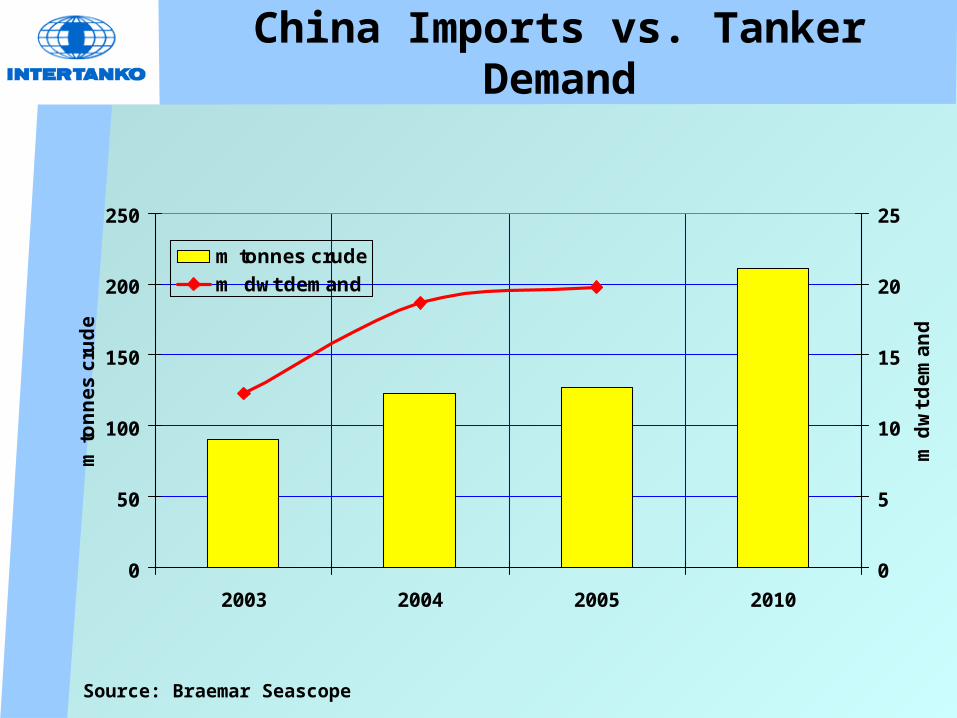
China Imports vs. Tanker Demand
Source: Braemar Seascope
0
50
100
150
200
250
2003 2004 2005 2010
m t
on
ne
s c
rud
e
0
5
10
15
20
25
m d
wt
de
ma
nd
m tonnes crude
m dwt demand
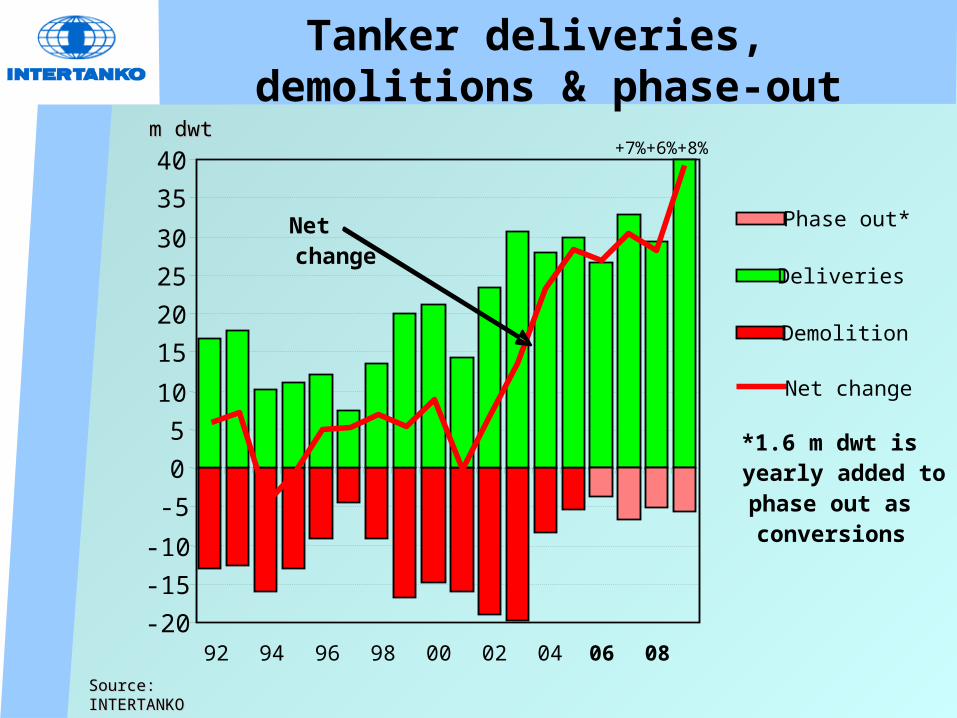
Tanker deliveries, demolitions & phase-out
Source:Source:INTERTANKOINTERTANKO
m dwtm dwt
-20
-15
-10
-5
0
5
10
15
20
25
30
35
40
92 94 96 98 00 02 04 06 08
Phase out*
Deliveries
Demolition
Net change
Net change
*1.6 m dwt is yearly added to phase out as conversions
+7%+6%+8%
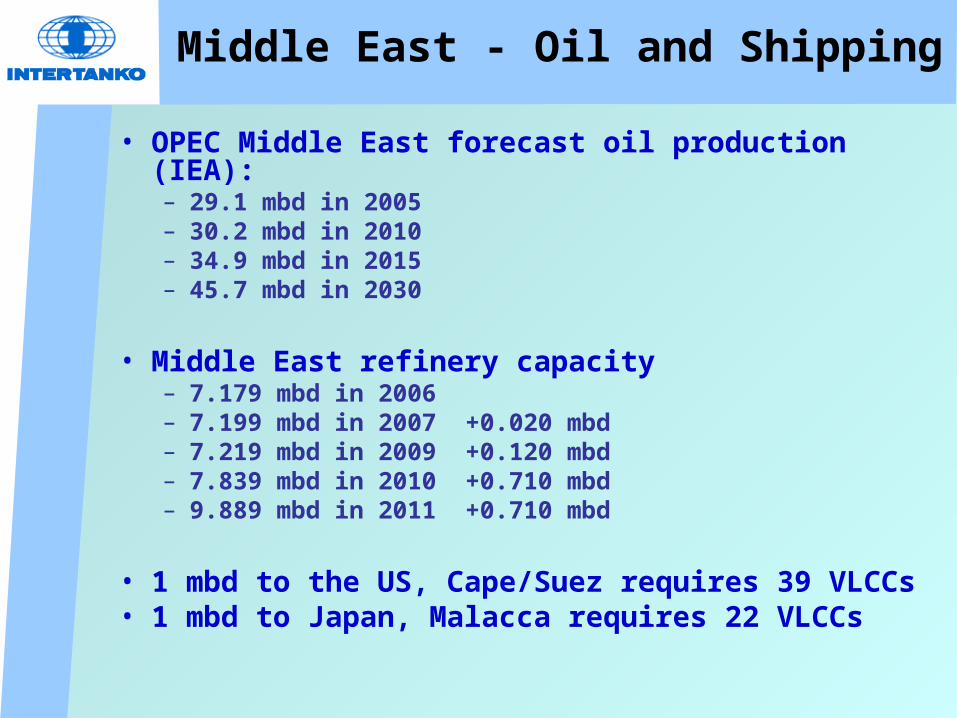
Middle East - Oil and Shipping
• OPEC Middle East forecast oil production (IEA):– 29.1 mbd in 2005– 30.2 mbd in 2010– 34.9 mbd in 2015– 45.7 mbd in 2030
• Middle East refinery capacity– 7.179 mbd in 2006– 7.199 mbd in 2007 +0.020 mbd– 7.219 mbd in 2009 +0.120 mbd– 7.839 mbd in 2010 +0.710 mbd– 9.889 mbd in 2011 +0.710 mbd
• 1 mbd to the US, Cape/Suez requires 39 VLCCs • 1 mbd to Japan, Malacca requires 22 VLCCs
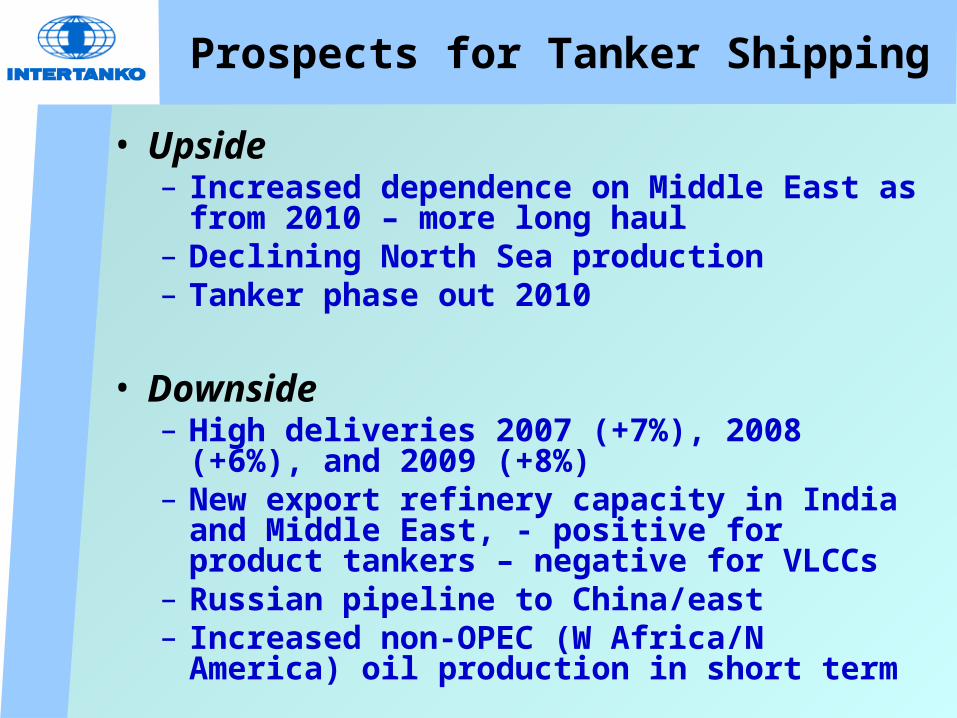
Prospects for Tanker Shipping
• Upside– Increased dependence on Middle East as from
2010 – more long haul– Declining North Sea production– Tanker phase out 2010
• Downside– High deliveries 2007 (+7%), 2008 (+6%), and
2009 (+8%)– New export refinery capacity in India and Middle
East, - positive for product tankers – negative for VLCCs
– Russian pipeline to China/east – Increased non-OPEC (W Africa/N America) oil
production in short term
Seatrade Middle East MaritimeEnergy Transportation
Fast Forward
On Tanker Issues ?
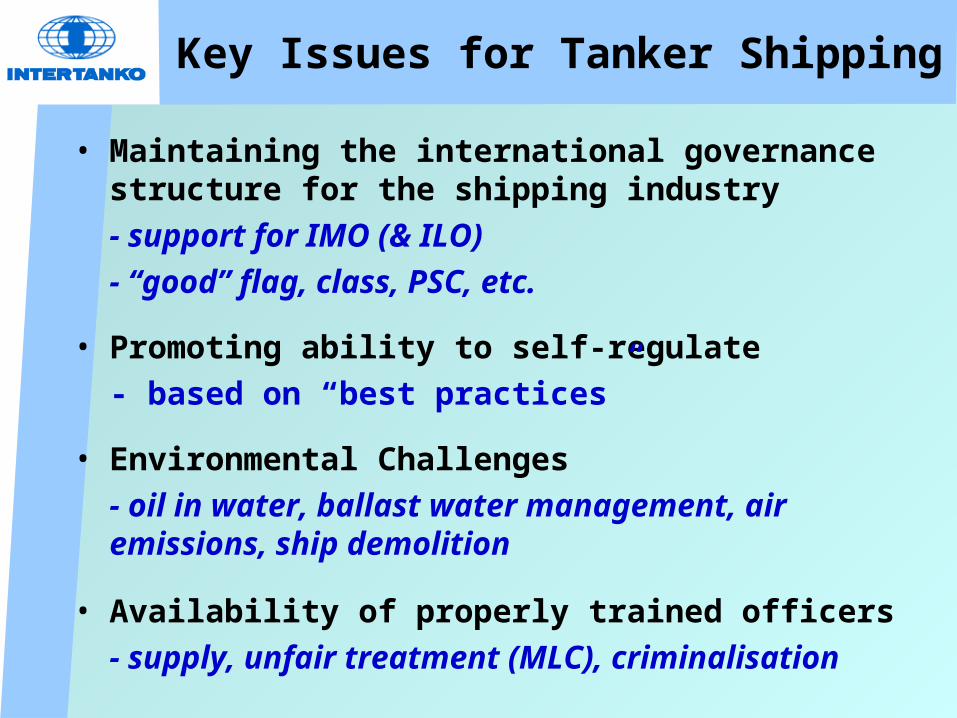
Key Issues for Tanker Shipping
• Maintaining the international governance structure for the shipping industry
- support for IMO (& ILO)
- “good” flag, class, PSC, etc.
• Promoting ability to self-regulate
- based on “best practices”
• Environmental Challenges
- oil in water, ballast water management, air emissions, ship demolition
• Availability of properly trained officers
- supply, unfair treatment (MLC), criminalisation

“Good” Flag
Afghanistan x x xxAlbania xx xx x xx x x x xxXxxx xxxxxxxxxAlgeria xxxxx xxxx x x xx xxxxxx d x d x x xx x
Ukraine x xxx x xxx xxx xxx xxxxx x x xx xxUnited Arab Emiratesx xxx x xx x x xxxx x x xxxd x x xxxxUnited Kingdom xxxxxxxxxxxx x xxxxxxxxxxxxxxxxx d d x d d xx xx dxxxxx xUnited Rep. of Tanzaniaxxxx x xx x x xx x x x x xUnited States xxxxxx xxxxx x x xxxxxxx x x xx xxxxUruguay xx xxx x xx x x xxxxx x x xx x xUzbekistan xxVanuatu xxxxxx xxxxxx x x xxxxxxxxxx d xx d xx xx x xxxx xVenezuela xxxx x xxxx x x x xxxxx d xx d xx xViet Nam x xxxx xxxx x xx xxx x xx
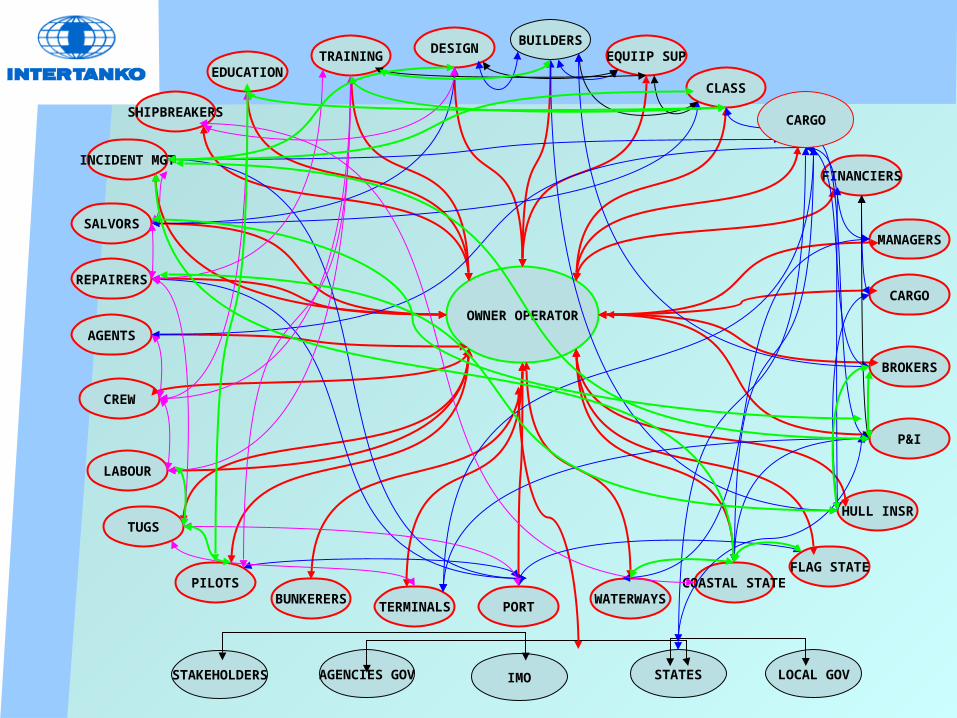
BUILDERS
MANAGERS
EQUIIP SUP
CLASS
FINANCIERS
CARGO
BROKERS
P&I
HULL INSR
FLAG STATECOASTAL STATE
WATERWAYSPORTTERMINALS
BUNKERERSPILOTS
TUGS
LABOUR
CREW
AGENTS
REPAIRERS
SALVORS
INCIDENT MGT
SHIPBREAKERS
EDUCATIONTRAINING
DESIGN
OWNER OPERATOR
STAKEHOLDERS AGENCIES GOV IMO STATES LOCAL GOV
CARGO

Poseidon Challenge- commitment to continuous improvement- commitment to working with all partners

The Poseidon Challenge
- an invitation to Partners

Joint ITOPF-INTERTANKO Seminar
INTERNATIONAL SEMINAR ONTANKER SAFETY, POLLUTION
PREVENTION &SPILL PREPAREDNESS
Jumeirah Emirates Towers Hotel, Dubai
6 December 2006
Registration from 0830
Seminar commences @ 0900
ALL WELCOME !
THANK YOUwww.intertanko.com
www.shippingfacts.comwww.themaritimefoundation.com
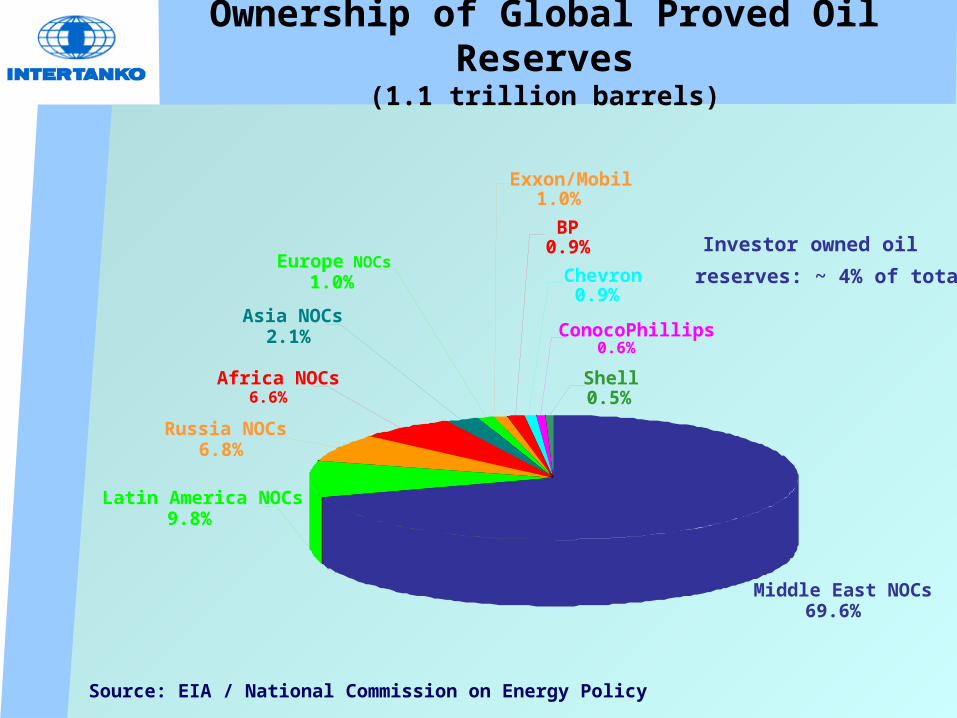
Middle East NOCs69.6%
Africa NOCs6.6%
Russia NOCs6.8%
Latin America NOCs9.8%
Europe NOCs1.0%
Exxon/Mobil1.0%
Asia NOCs2.1%
BP0.9%
Chevron0.9%
Shell0.5%
ConocoPhillips0.6%
Investor owned oil
reserves: ~ 4% of total
Ownership of Global Proved Oil Reserves(1.1 trillion barrels)
Source: EIA / National Commission on Energy Policy
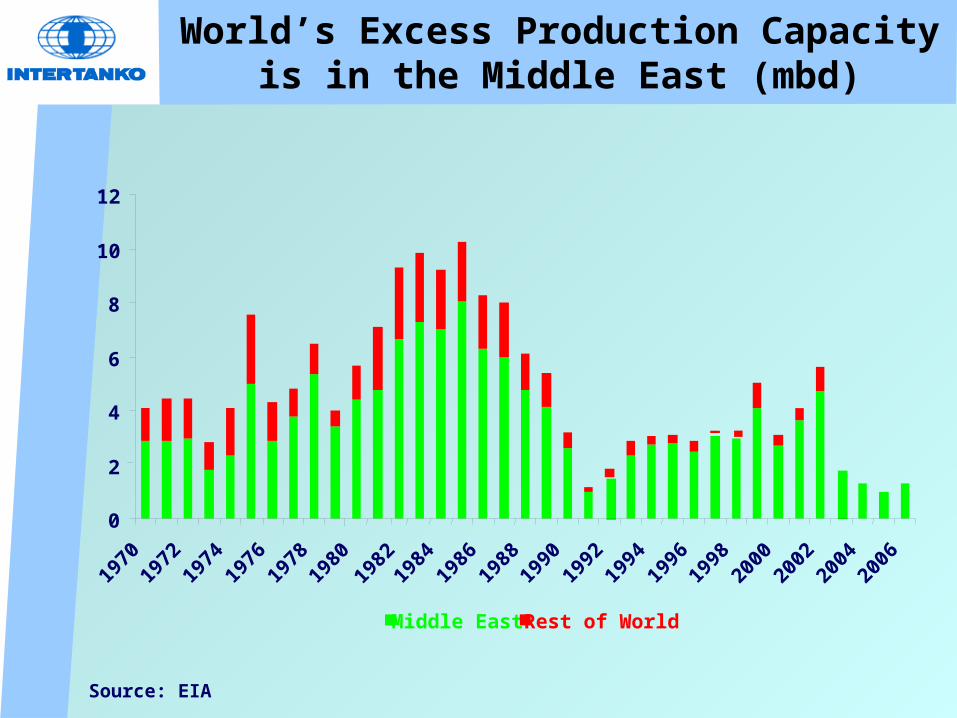
0
2
4
6
8
10
12
1970
1972
1974
1976
1978
1980
1982
1984
1986
1988
1990
1992
1994
1996
1998
2000
2002
2004
2006
Middle East Rest of World
Source: EIA
World’s Excess Production Capacity is in the Middle East (mbd)
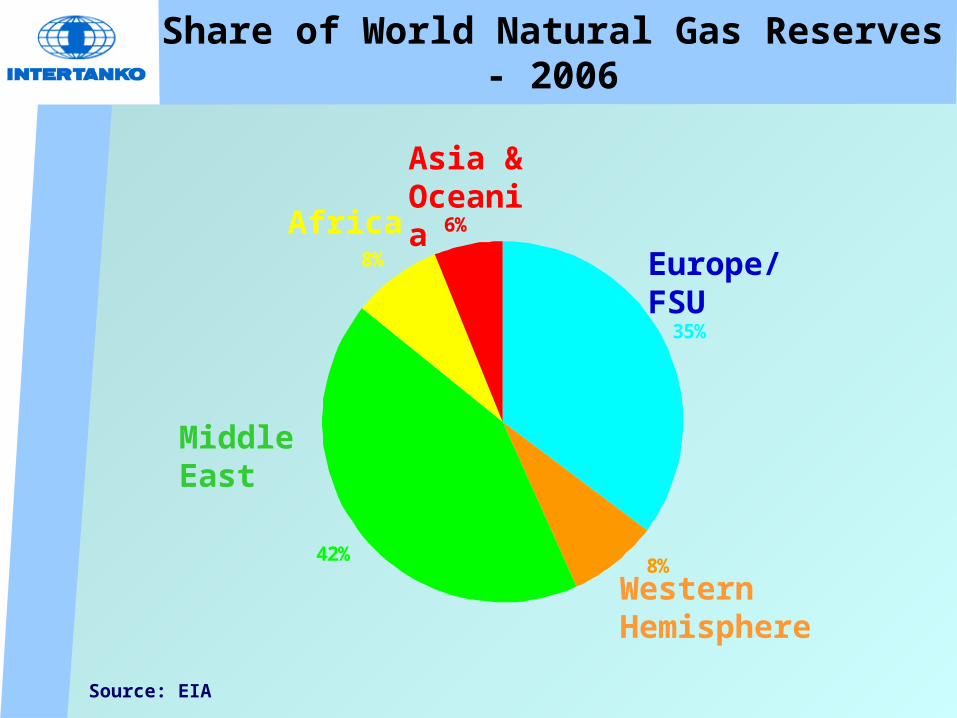
Share of World Natural Gas Reserves - 2006
35%
6%
42%8%
8%
Middle East
Africa
Asia & Oceania
Europe/FSU
Western Hemisphere
Source: EIA
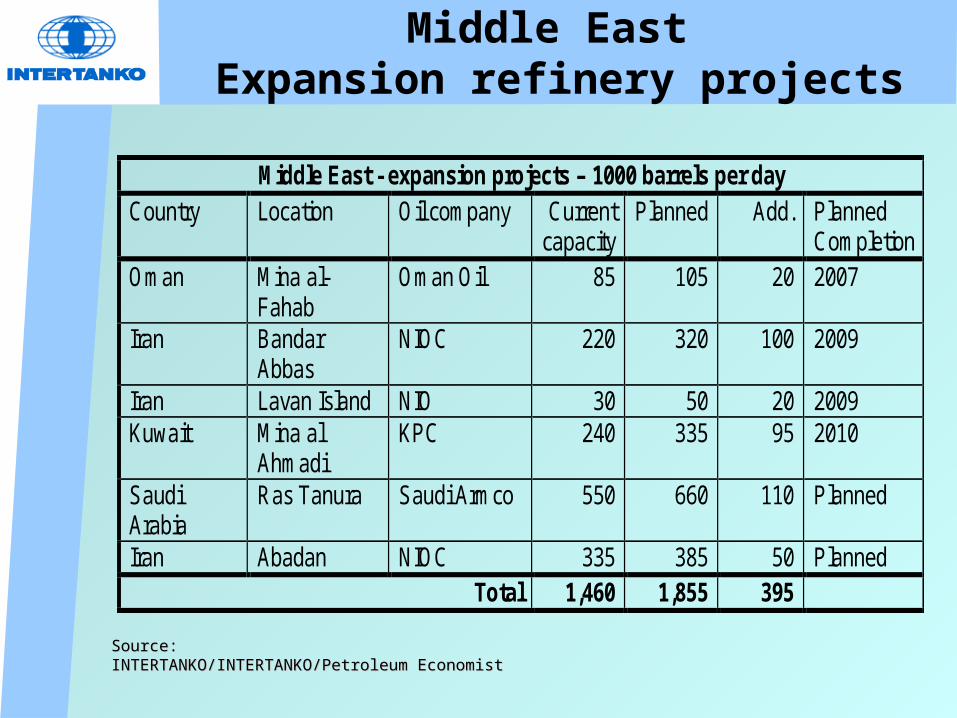
Middle East Expansion refinery projects
Source:Source:INTERTANKO/INTERTANKO/Petroleum EconomistINTERTANKO/INTERTANKO/Petroleum Economist
Middle East - expansion projects – 1000 barrels per day Country
Location Oil company
Current capacity
Planned Add. Planned Completion
Oman Mina al-Fahab
Oman Oil 85 105 20 2007
Iran Bandar Abbas
NIOC 220 320 100 2009
Iran Lavan Island NIO 30 50 20 2009 Kuwait Mina al
Ahmadi KPC 240 335 95 2010
Saudi Arabia
Ras Tanura Saudi Armco 550 660 110 Planned
Iran Abadan NIOC 335 385 50 Planned Total 1,460 1,855 395
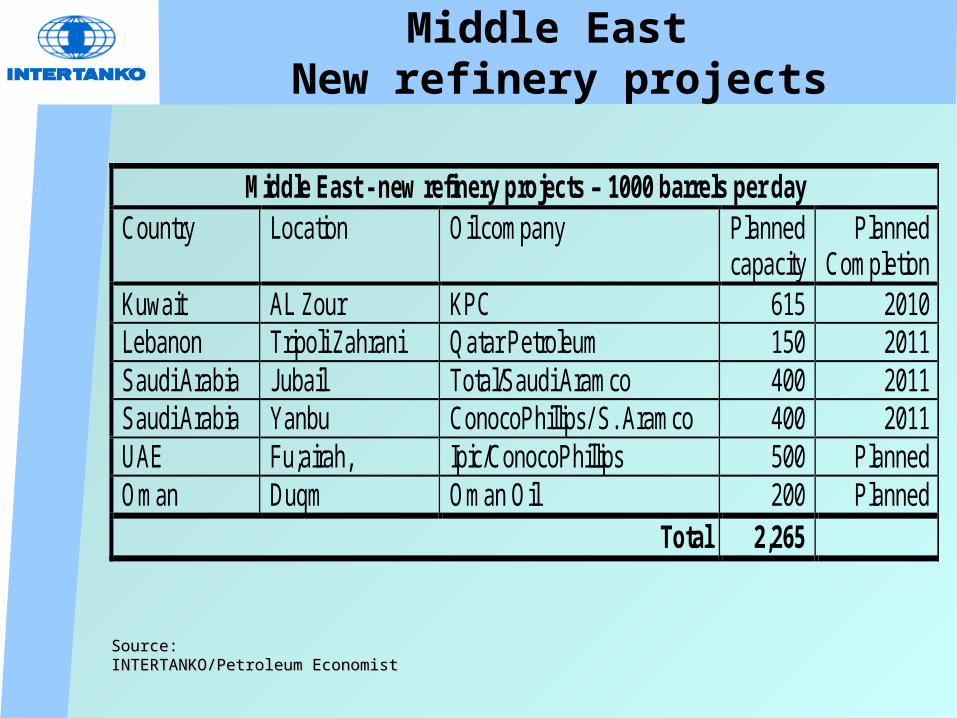
Middle East New refinery projects
Source:Source:INTERTANKO/Petroleum EconomistINTERTANKO/Petroleum Economist
Middle East - new refinery projects – 1000 barrels per day Country Location Oil company Planned
capacity Planned
Completion Kuwait AL Zour KPC 615 2010 Lebanon Tripoli Zahrani Qatar Petroleum 150 2011 Saudi Arabia Jubail Total/Saudi Aramco 400 2011 Saudi Arabia Yanbu ConocoPhillips/ S. Aramco 400 2011 UAE Fu;airah, Ipic/ConocoPhillips 500 Planned Oman Duqm Oman Oil 200 Planned
Total 2,265
Seatrade Middle East MaritimeEnergy Transportation
Middle East
Oil and Shipping
Future Shocks !

Future Shocks !
Political
Economic
Environmental / legislative
Other ??
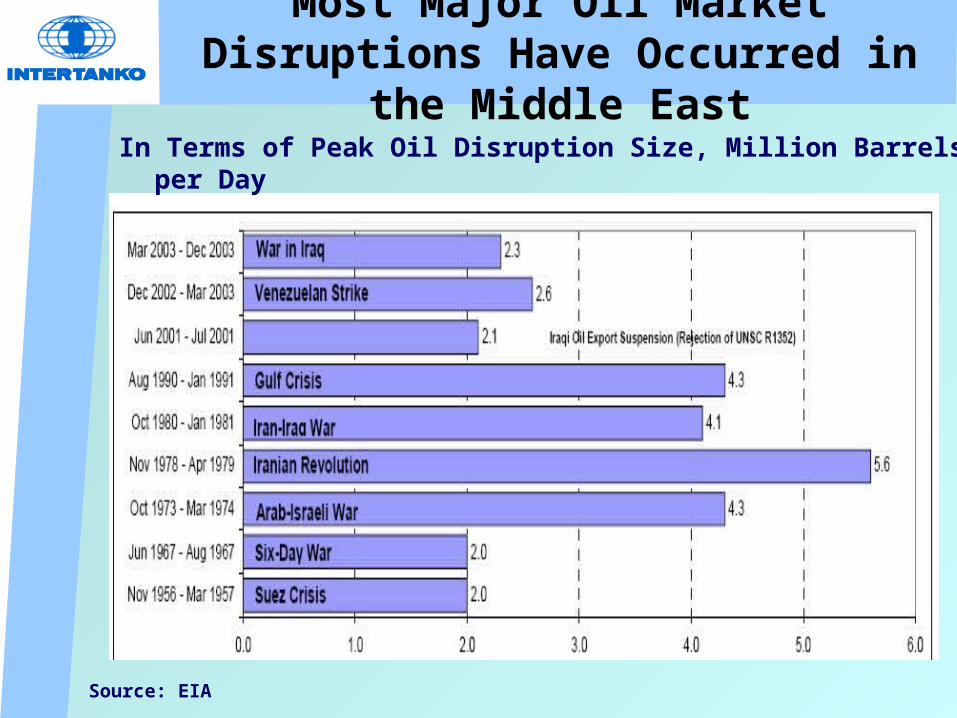
Most Major Oil Market Disruptions Have Occurred in the Middle East
In Terms of Peak Oil Disruption Size, Million Barrels per Day
Source: EIA
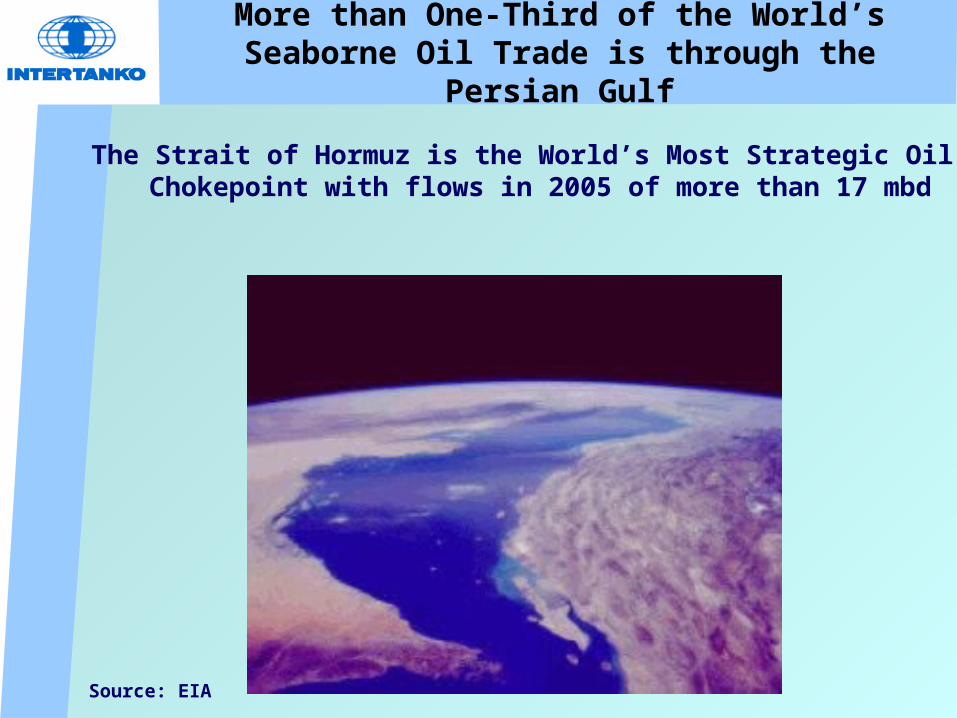
More than One-Third of the World’s Seaborne Oil Trade is through the Persian Gulf
The Strait of Hormuz is the World’s Most Strategic Oil Chokepoint with flows in 2005 of more than 17 mbd
Source: EIA
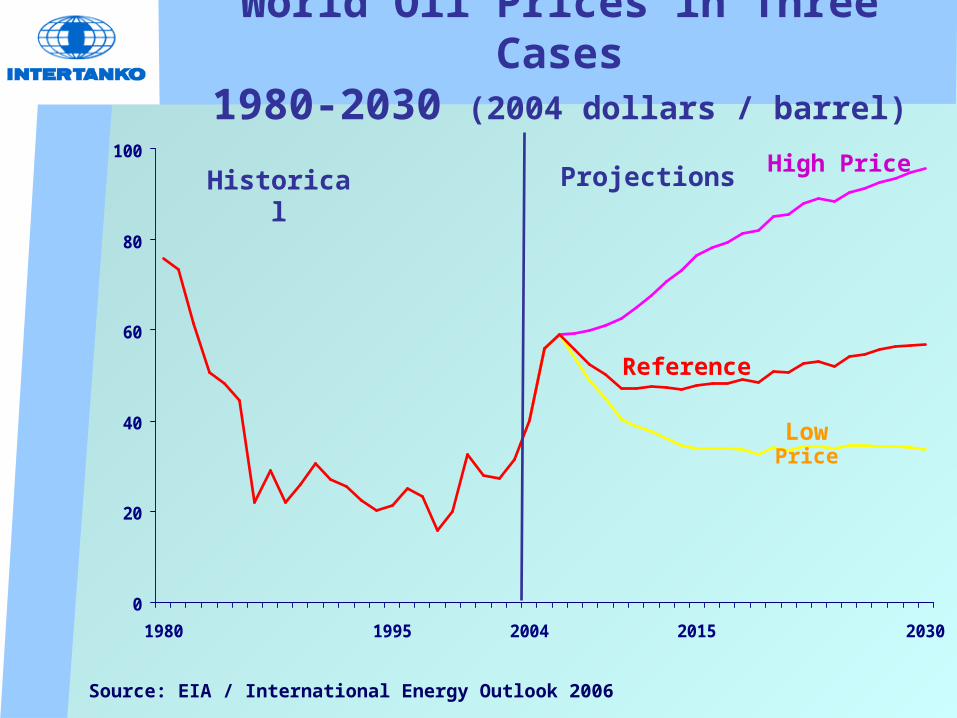
World Oil Prices in Three Cases1980-2030 (2004 dollars / barrel)
0
20
40
60
80
100
1980 1995 2004 2015 2030
Low Price
High Price
Reference
Historical Projections
Source: EIA / International Energy Outlook 2006
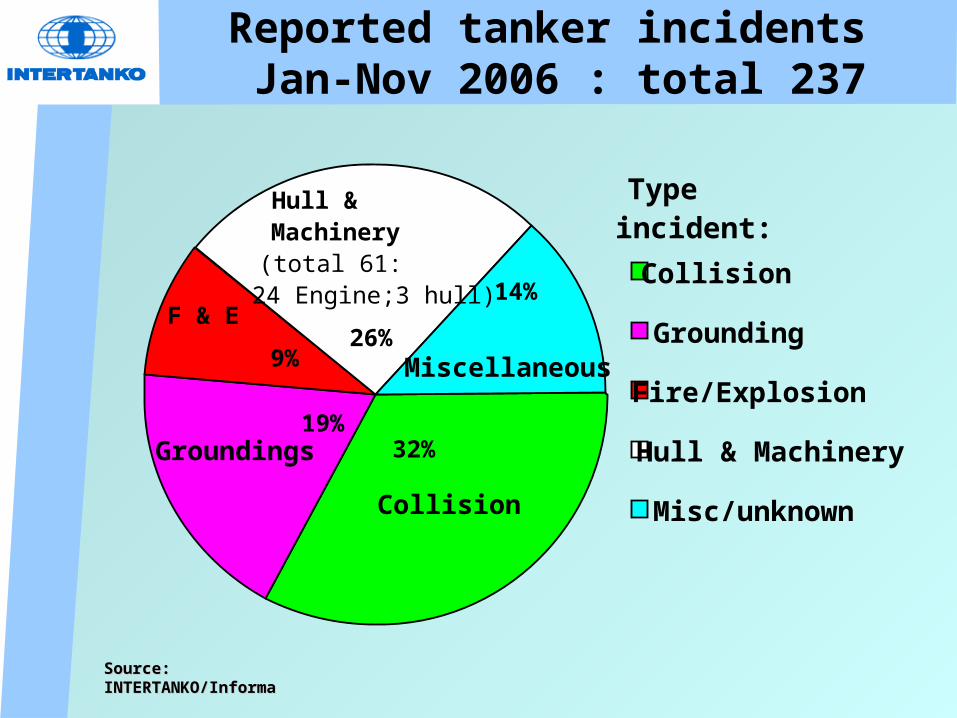
Reported tanker incidents Jan-Nov 2006 : total 237
Source:Source:INTERTANKO/InformaINTERTANKO/Informa
14%
26%9%
32%19%
Collision
Grounding
Fire/Explosion
Hull & Machinery
Misc/unknownCollision
Groundings
Hull & Machinery (total 61:24 Engine;3 hull)
Miscellaneous
F & E
Type incident:
Seatrade Middle East MaritimeEnergy Transportation
Middle East
Oil and Shipping
>>> Forward !
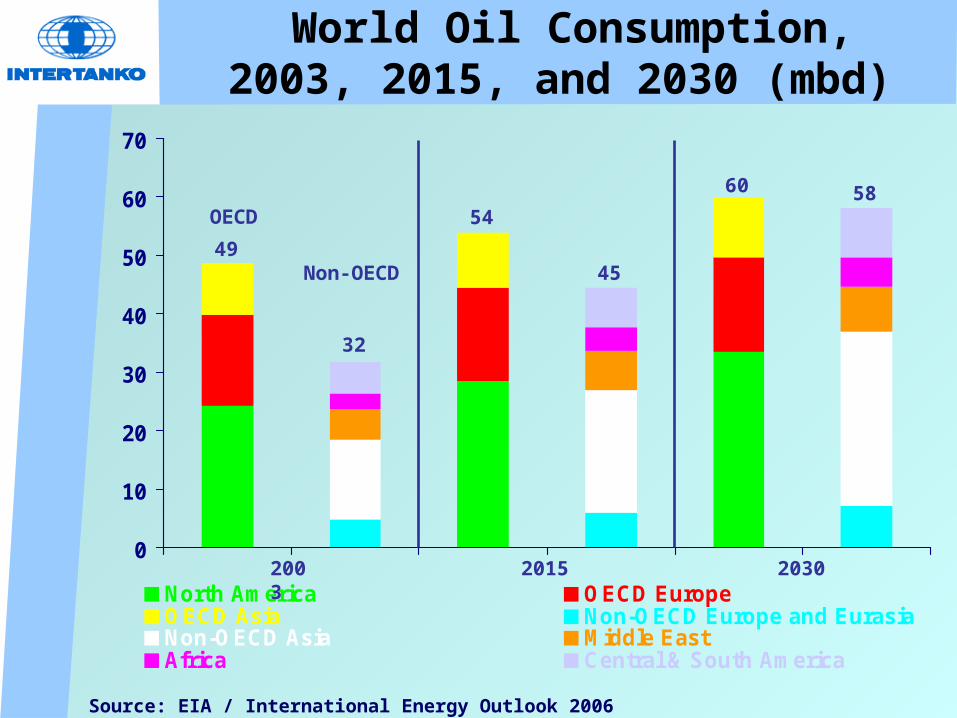
World Oil Consumption,2003, 2015, and 2030 (mbd)
0
10
20
30
40
50
60
70
North America OECD EuropeOECD Asia Non-OECD Europe and EurasiaNon-OECD Asia Middle EastAfrica Central & South America
2003 2015 2030
49
32
54
45
60 58OECD
Non-OECD
Source: EIA / International Energy Outlook 2006
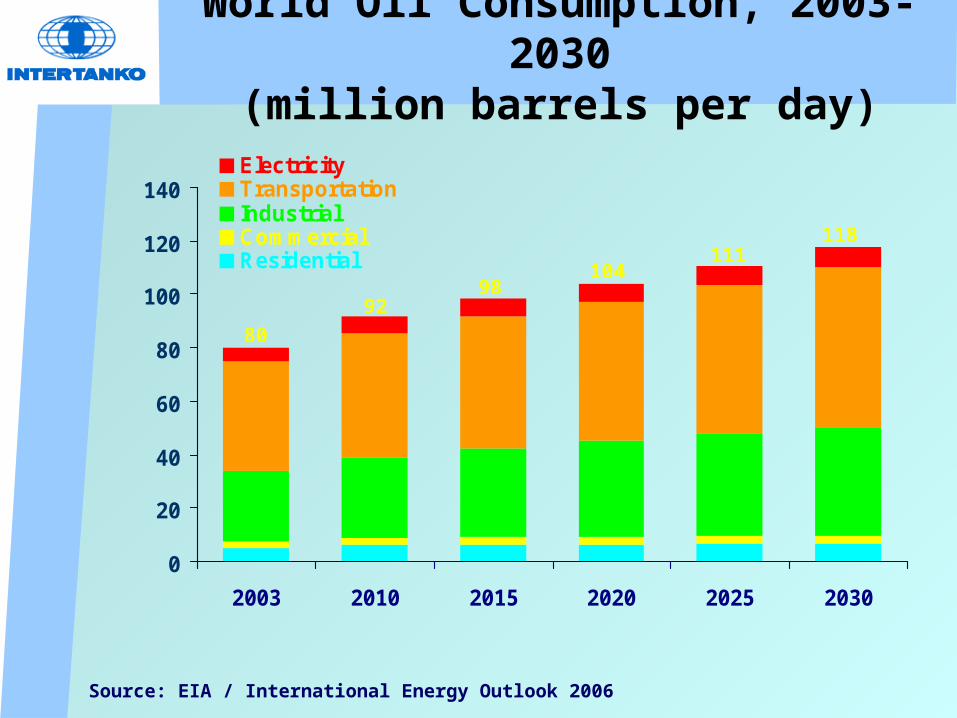
World Oil Consumption, 2003-2030(million barrels per day)
0
20
40
60
80
100
120
140
2003 2010 2015 2020 2025 2030
ElectricityTransportationIndustrialCommercialResidential
98104
118
92
80
111
Source: EIA / International Energy Outlook 2006