Embed Size (px)
Citation preview
AD-A088 841 WASHINGTON UNIV SEATTLE APPLED PHYSICS LAB F/6 8/10OCEANOGRAPHIC MEASURENENTS IN THE CHUXCHI SEA, APRIL-AUGUST 197-ETC(U)SEP 79 6 R GARRISON- M L WELCH, J T SHAW N00123-74-C-206
UNCLASSIFIED APL-U-7824'2Elinmiiiiinlll///llll/hl
"IIIII"""Il~Ilililillmlll
nr
LE w!
, '4
jj,
~ ~Sea-~ ~u-;~1~ ~I~OWu
*Wr;
Yin,
41- 1979
As,
4ff Ml~jFV.
~ ~Eib~ A
II
Oceanographic Measurements in the Chuckchi Sea
April - August 1977II
Iy by G.R. Garrison QM. L. Welch . -
J.T. Shaw
APL-UW 7824September 1979
I aII/ 0,Pproy." ' / ,
IPREPARED FOR:
IARCTIC SUBMARINE LABORATORY, CODE 54NAVAL OCEAN SYSTEMS CENTER, SAN DIEGO, CALIFORNIA
I UNDER CONTRACTS N00123-74-C-2064 AND N00123-77-C-1013
ACKNOWLEDGMENTS
Field support was provided by the Naval Arctic Research Laboratorythrough funding by the Office of Naval Research. This support includedshelters, food, fuel, and a convenient base for operations. The heli-copter that moved the prefabricated buildings and supplies to the icecamp and served as a platform for the oceanographic surveys xzs pro-vided by the National Oceanic and Atmospheric Administration.
."&
DIst.
IUNIVERSITY OF WASHINGTON APPLIED PHYSICS LABORATORY
ITABLE OF CONTENTS
I. INTRODUCTION ............ ........................... 1
II. SUMMARY .............. ............................. 3
III. ICE CAMP APLIS .......... .......................... .. 5
Search for a Floe .......... ........................ 5Camp Facilities ............ ......................... 5Aerial Photographs ........... ........................ 7Floe Drift ............. ............................ 7
IV. MEASUREMENTS ........... ........................... .. 10
April CTD Profiles off the Coast ........ ................. 10June CTD Profiles off the Coast ...... ................. ... 16
July CTD Profiles off the Coast ...... ................. ... 25July CTD Profiles from Drifting Ice Camp .... ............. .29August Profiles from Icebreaker ...... ................. ... 30Time Series at Stationary Ice Camp ....... ................ 37CTD Profiles at Stationary Ice Camp ....... ............... 37Weather Recording at Ice Camp ....... .................. ... 41Current Measurements at Ice Camp APLIS ..... .............. .44Water-Sample Analysis for Salinity and Oxygen ... .......... .46Satellite Photographs and Infrared Images .... ............ .56T-S Diagram ............. ........................... 56
V. DISCUSSION ............. ............................ 62
Changes in the Coastal Shallows .... .... ................. 62
Chukchi Sea Drainage ........ ....................... .. 63Warm Water on the Shelf in the Spring ..... .............. .64Surges of Atlantic Water ....... ..................... .. 65
VI. REFERENCES ............ ............................ .. 67
APPENDIX A, Chukchi Sea Oceanographic Data Obtained in April 1977 . . . Al-A6APPENDIX B, Chukchi Sea Oceanographic Data Obtained in June 1977. . . . B1-Bll
APPENDIX C, Chukchi Sea Oceanographic Data Obtained in July 1977. . . . Cl-CsAPPENDIX D, Chukchi Sea Oceanographic Data Obtained in July-August 1977
from the Icebreaker BURTON ISLAND ...... ............ D1-D18
APPENDIX E, Oceanographic Data at Ice Camp APLIS After Starting Driftto West ................................. EElO
APPENDIX F, Current Measurements at Ice Camp APLIS While Stationaryin Shore-Fast Ice ......... .................... F1,F13
APL-UW 7824 iii
_ _ _ _ _ UNIVERSITY OF WASHINGTON APPLIED PHYSICS LABORATORY
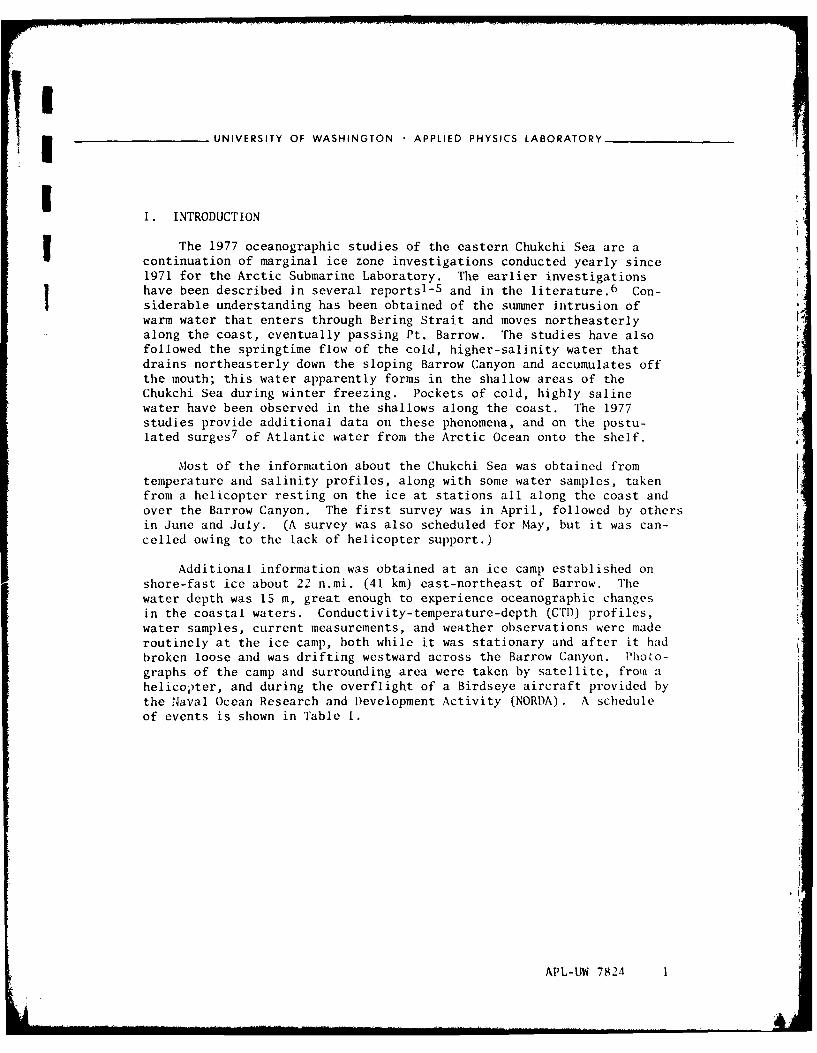
I. INTRODUCTION
The 1977 oceanographic studies of the eastern Chukchi Sea are acontinuation of marginal ice zone investigations conducted yearly since1971 for the Arctic Submarine Laboratory. The earlier investigationshave been described in several reportsl-5 and in the literature. 6 Con-siderable understanding has been obtained of the summer intrusion ofwarm water that enters through Bering Strait and moves northeasterlyalong the coast, eventually passing Pt. Barrow. The studies have alsofollowed the springtime flow of the cold, higher-salinity water thatdrains northeasterly down the sloping Barrow Canyon and accumulates offthe mouth; this water apparently forms in the shallow areas of theChukchi Sea during winter freezing. Pockets of cold, highly salinewater have been observed in the shallows along the coast. The 1977studies provide additional data on these phenomena, and on the postu-lated surges 7 of Atlantic water from the Arctic Ocean onto the shelf.
Most of the information about the Chukchi Sea was obtained fromtemperature and salinity profiles, along with some water samples, takenfrom a helicopter resting on the ice at stations all along the coast andover the Barrow Canyon. The first survey was in April, followed by othersin June and July. (A survey was also scheduled for May, but it was can-celled owing to the lack of helicopter support.)
Additional information was obtained at an ice camp established onshore-fast ice about 22 n.mi. (41 km) east-northeast of Barrow. Thewater depth was 15 m, great enough to experience oceanographic changesin the coastal waters. Conductivity-temperature-depth (CTm) profiles,water samples, current measurements, and weather observations were maderoutinely at the ice camp, both while it was stationary and after it hadbroken loose and was drifting westward across the Barrow Canyon. Photo-graphs of the camp and surrounding area were taken by satellite, fromn ahelicopter, and during the overflight of a Birdseye aircraft provided bythe Naval Ocean Research and Development Activity (NORDA). A scheduleof events is shown in Table 1.
APL-UW 7824 1
UNIVERSITY OF WASHINGTON APPLIED PHYSICS LABORATORY
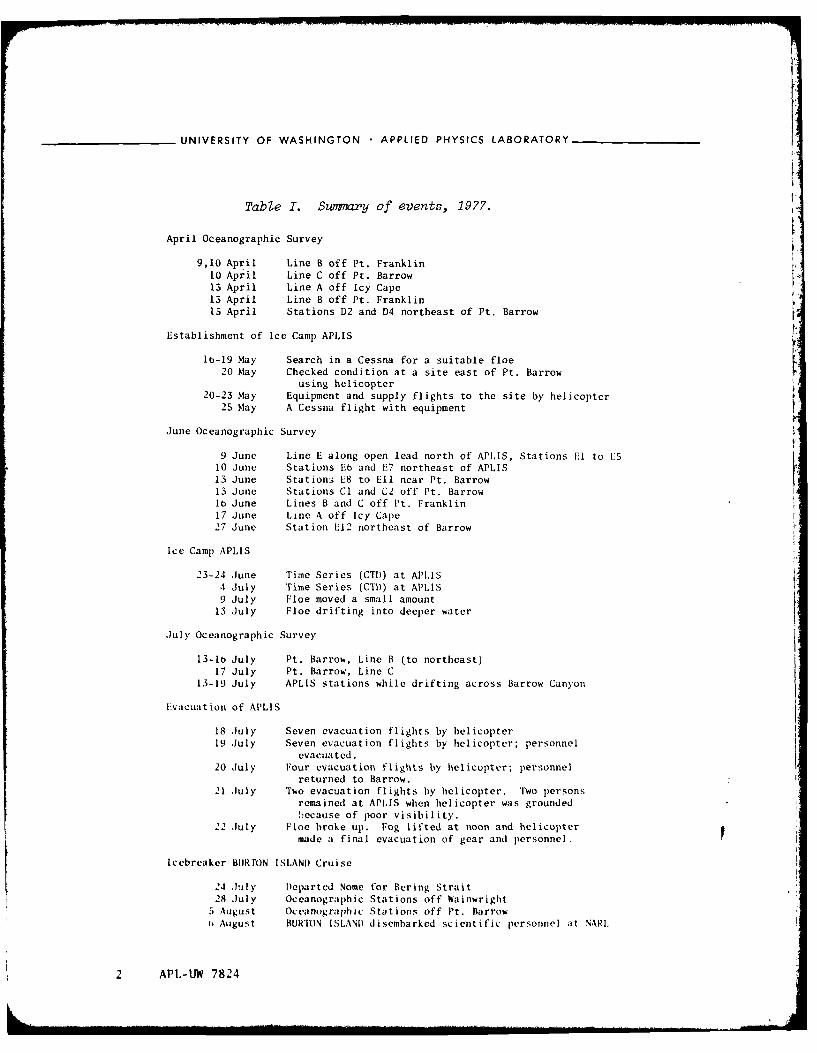
Table I. Sumnary of events, 1977.
April Oceanographic Survey
9,10 April Line B off Pt. Franklin10 April Line C off Pt. Barrow13 April Line A off Icy Cape13 April Line B off Pt. Franklin15 April Stations D2 and D4 northeast of Pt. Barrow
Establishment of Ice Camp APLIS
16-19 May Search in a Cessna for a suitable floe20 May Checked condition at a site east of Pt. Barrow
using helicopter20-23 May Equipment and supply flights to the site by helicopter
25 May A Cessna flight with equipment
June Oceanographic Survey
9 June Line E along open lead north of APLIS, Stations El to I'S10 June Stations Fb and E7 northeast of APLIS13 June Stations, E8 to Ell near Pt. Barrow13 June Stations Cl and C2 off Pt. Barrowlb June Lines B and C off Pt. Franklin17 June Line A off Icy Cape27 June Station E12 northeast of Barrow
Ice Camp APLIS
23-24 June Time Series (CTI)) at APLIS4 July 'rime Series (CTD) at APLIS9 July Floe moved a small amount
13 July Floe drifting into deeper water
July Oceanographic Survey
13-16 July Pt. Barrow, Line B (to northeast)17 July Pt. Barrow, Line C
13-19 July APLIS stations while drifting across Barrow Canyon
Evacuation of APLIS
18 July Seven evacuation flights by helicopter19 July Seven evacuation flights by helicopter; personnel
evacuated.20 July Four evacuation flights by helicopter; personnel
returned to Barrow.21 July Two evacuation flights by helicopter. Two persons
remained at APLIS when helicopter was groundedbecause of poor visibility.
22 July Floe broke up. Fog lifted at noon and helicoptermade a final evacuation of gear and personnel.
Icebreaker BURTON ISLANI) Cruise
24 July I)eparted Nome for Bering Strait28 July Oceanographic Stations off Wainwright
5 August Oceanographic Stations off Pt. Barrowt) August BURTON ISLANI) disembarked scientific personnel at NARI
2 APL-UW 7824
UNIVERSITY OF WASHINGTON APPLIED PHYSICS LABORATORY
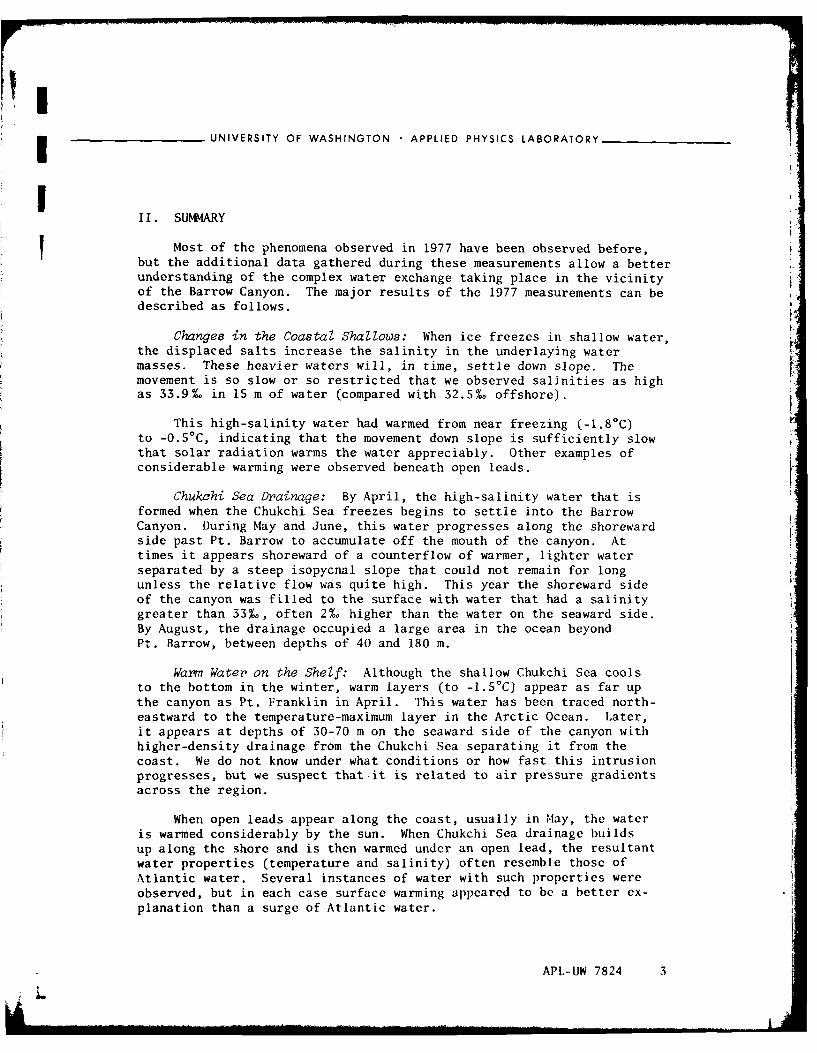
I ,II. SUMMARY
Most of the phenomena observed in 1977 have been observed before,but the additional data gathered during these measurements allow a betterunderstanding of the complex water exchange taking place in the vicinityof the Barrow Canyon. The major results of the 1977 measurements can bedescribed as follows.
Changes in the Coastal Shallows: When ice freezes in shallow water,the displaced salts increase the salinity in the underlaying watermasses. These heavier waters will, in time, settle down slope. Themovement is so slow or so restricted that we observed salinities as highas 33.9%. in 15 m of water (compared with 32.5%. offshore).
This high-salinity water had warmed from near freezing (-1.8 0 C)to -0.50 C, indicating that the movement down slope is sufficiently slowthat solar radiation warms the water appreciably. Other examples ofconsiderable warming were observed beneath open leads.
Chukchi Sea Drainage: By April, the high-salinity water that isformed when the Chukchi Sea freezes begins to settle into the BarrowCanyon. During May and June, this water progresses along the shorewardside past Pt. Barrow to accumulate off the mouth of the canyon. Attimes it appears shoreward of a counterflow of warmer, lighter waterseparated by a steep isopycnal slope that could not remain for longunless the relative flow was quite high. This year the shoreward sideof the canyon was filled to the surface with water that had a salinitygreater than 33%., often 2% higher than the water on the seaward side.By August, the drainage occupied a large area in the ocean beyondPt. Barrow, between depths of 40 and 180 m.
Warm Water on the Shelf: Although the shallow Chukchi Sea coolsto the bottom in the winter, warm layers (to -l.5°C) appear as far upthe canyon as Pt. Franklin in April. This water has been traced north-eastward to the temperature-maximum layer in the Arctic Ocean. Later,it appears at depths of 30-70 m on the seaward side of the canyon withhigher-density drainage from the Chukchi Sea separating it from thecoast. We do not know under what conditions or how fast this intrusionprogresses, but we suspect that it is related to air pressure gradientsacross the region.
When open leads appear along the coast, usually in IMay, the wateris warmed considerably by the sun. When Chukchi Sea drainage buildsup along the shore and is then warmed under an open lead, the resultantwater properties (temperature and salinity) often resemble those ofAtlantic water. Several instances of water with such properties wereobserved, but in each case surface warming appeared to be a better ex-planation than a surge of Atlantic water.
APL-UW 7824 3
UNIVERSITY OF WASHINGTON • APPLIED PHYSICS LABORATORY
Surges of Atlantic Water: Water with the same temperature andsalinity as Atlantic water was observed in the Barrow Canyon 50 m above Fthe normal depth of the same type of water in the Arctic Ocean. Thiswater was traced sufficiently far down the canyon to leave no doubt thatit was Atlantic water that had progressed up the canyon. The movementmay have been slow (weeks) or in the form of a surge (days).
Water with a temperature and salinity similar to those of Atlanticwater arrived at the ice camp along the shore-fast ice east of Barrowcoincident with southerly currents and low air pressure. Analysis ofthe oxygen content of this water showed some low values similar tosamples taken from the deep layer of Atlantic water in the Arctic Ocean;however, the spread in the results for samples from the same bottle wasso great that these values must be considered unreliable. The samplesthat did produce consistent results showed a high oxygen content andthus are evidence against a surge of water from the Arctic Ocean.
I
4 APL-W 782
II_ _ UNIVERSITY OF WASHINGTON • APPLIED PHYSICS LABORATORY
IIII. ICE CAMP APLIS
SThe ice camp was established primarily for acoustic studies. How-ever, oceanographic instrumentation was installed and operated routinelyto determine the character of the acoustic medium and to study the waterexchange in the area.
Search for a Floe
The intent was to establish APLIS on an old floe about 50 miles
west of Pt. Barrow. However, a search for several days with a Cessna 180did not reveal any floe of sufficient thickness to support a camp fora 3-month period. In desperation, the shore-fast ice that clings alongthe coast east of Pt. Barrow was examined. A few old floes thick enoughto survive the summer were observed within the pack, distinguishable bytheir uneven surface of greenish hard ice. The Cessna was landed nearone of the floes, and holes were drilled through the ice to check theice thickness and water depth. There appeared to be 2-3 m of ice over-laying 15 m of water, which was considered acceptable. The next day wereturned and selected a site for the camp buildings. Because of thedifficulty in leveling the irregular surface of the old floes, we choseto set the structures on the flat frozen melt ponds. Later in thesummer as the melt ponds encroached on the camp, we regretted that wehadn't somehow erected the huts on the thicker hummocks.
Camp Facilities
The camp structures consisted of four wooden 8 x 12 ft huts whichhad been prefabricated in 4 ft x 8 ft sections at NARL and flown to thesite slung beneath a helicopter. The huts were made of 2 x 3 in. stud-
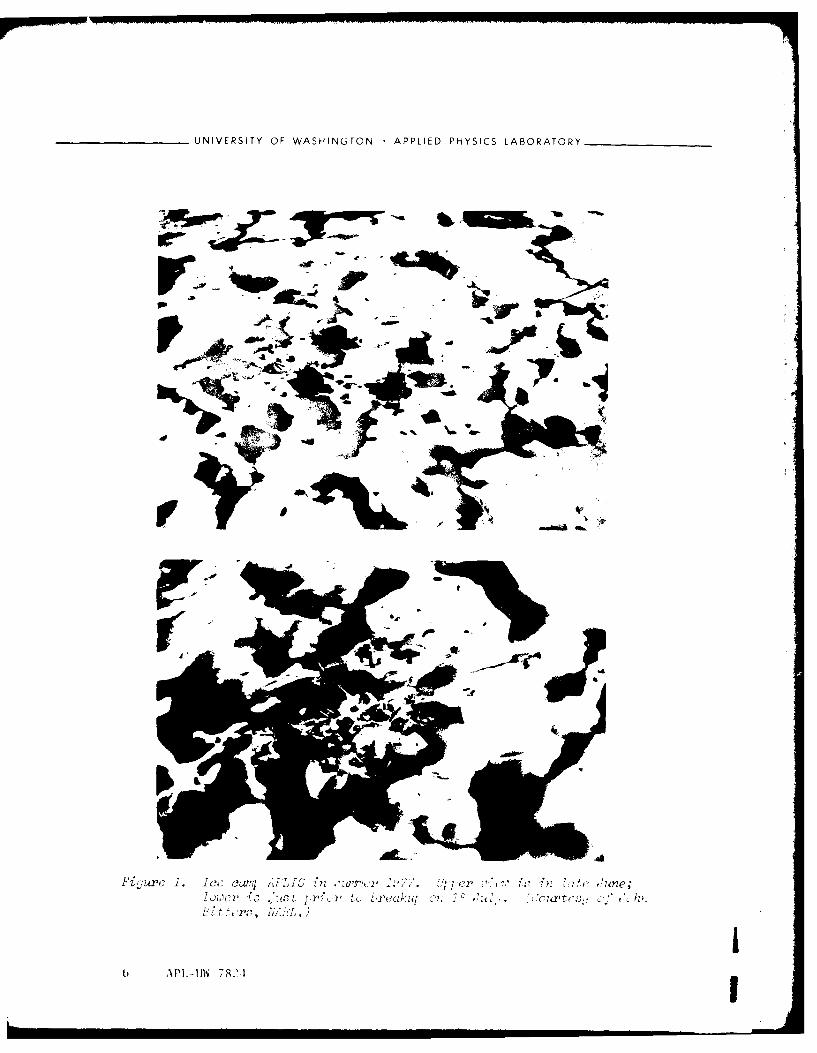
ding, plywood, and fiberglass insulation. They were outfitted as agenerator shed, a mess hall, an acoustic laboratory, and an ice-physicslaboratory. Tents were provided for the head, and for a rotating acous-tic projector/receiver. The laboratories doubled as bunk rooms. Thearrangement on the floe is shown in Figure 1; the upper photograph was
taken near the beginning of the melt season and the lower one was takenshortly before the breakup of the floe. The CTD profiler and the currentmeter were operated in the generator shed. The weather sensors weremounted 5 m above the roof of the mess hall.
Power was supplied to the camp by a 5-kVA diesel generator set upto use JPS helicopter fuel. The fuel tank was supported on the outsideof the shed. The buildings were heated with 20,000 Btu/h propane heaters.
The CTD profiler was a lightweight hand-operated unit.8 The sen-sors consisted of a thermistor, conductivity cell, and Digiquartz pres-sure sensor. The winch was attached to the wall of the generator shedover a 41-cm hole in the floor which extended through the 3-m thick ice
below.
APL-UW 7824 5
_______________UNIVERSITY OF WASHINGTON APPLIED PHYSICS LABORATORY__________
'I AMW I
~ jr, ~
404
r~..tow-
t IL-M~ 78241
UNIVERSITY OF WASHINGTON APPLIED PHYSICS LABORATORY
Aerial Photographs
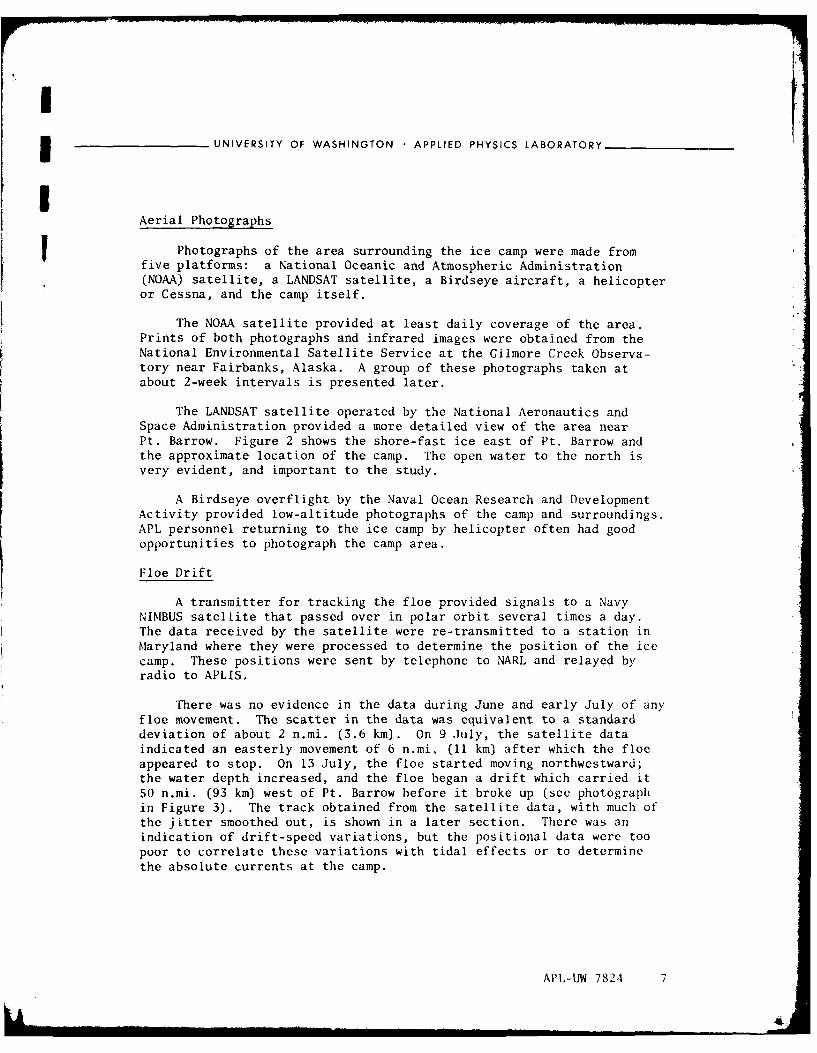
fPhotographs of the area surrounding the ice camp were made fromfive platforms: a National Oceanic and Atmospheric Administration(NOAA) satellite, a LANDSAT satellite, a Birdseye aircraft, a helicopteror Cessna, and the camp itself.
The NOAA satellite provided at least daily coverage of the area.Prints of both photographs and infrared images were obtained from theNational Environmental Satellite Service at the Gilmore Creek Observa-tory near Fairbanks, Alaska. A group of these photographs taken atabout 2-week intervals is presented later.
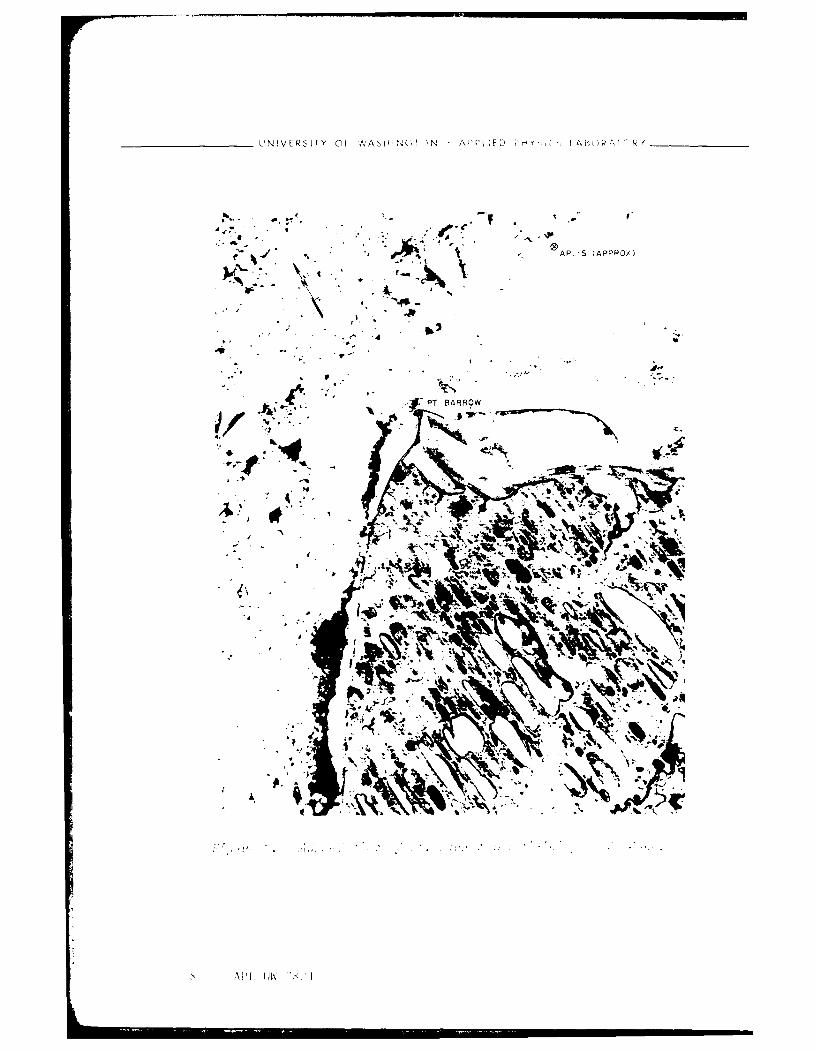
The LANDSAT satellite operated by the National Aeronautics andSpace Administration provided a more detailed view of the area nearPt. Barrow. Figure 2 shows the shore-fast ice east of Pt. Barrow andthe approximate location of the camp. The open water to the north isvery evident, and important to the study.
A Birdseye overflight by the Naval Ocean Research and DevelopmentActivity provided low-altitude photographs of the camp and surroundings.APL personnel returning to the ice camp by helicopter often had goodopportunities to photograph the camp area.
Floe Drift
A transmitter for tracking the floe provided signals to a Navy
NIMBUS satellite that passed over in polar orbit several times a day.The data received by the satellite were re-transmitted to a station inMaryland where they were processed to determine the position of the icecamp. These positions were sent by telephone to NARL and relayed byradio to APLIS.
There was no evidence in the data during June and early July of anyfloe movement. The scatter in the data was equivalent to a standard
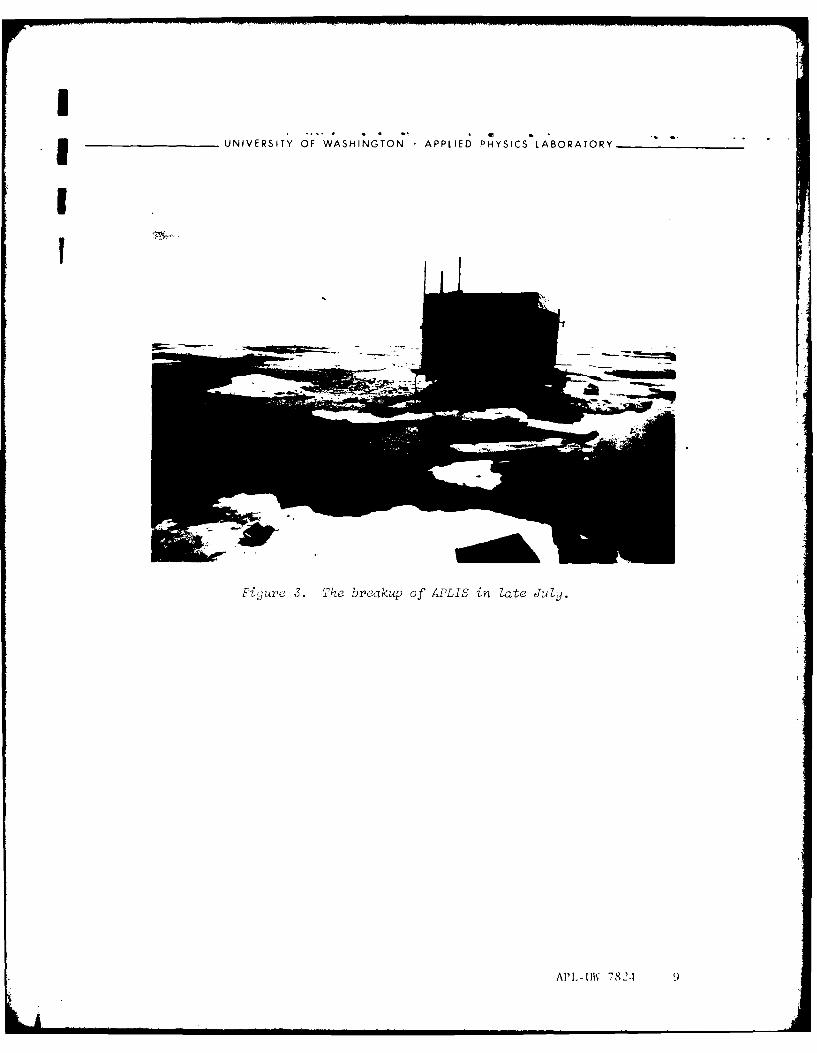
deviation of about 2 n.mi. (3.6 km). On 9 July, the satellite dataindicated an easterly movement of 6 n.mi. (11 km) after which the floeappeared to stop. On 13 July, the floe started moving northwestward;the water depth increased, and the floe began a drift which carried it50 n.mi. (93 km) west of Pt. Barrow before it broke up (see photographin Figure 3). The track obtained from the satellite data, with much ofthe jitter smoothed out, is shown in a later section. There was anindication of drift-speed variations, but the positional data were toopoor to correlate these variations with tidal effects or to determinethe absolute currents at the camp.
API,-UW 7824 7
_______________UNtVER',L(Y M~ VWASWN(! ', ^01FiE kY ________
100ft 1 ~ *-.AP' S (APPROX)
el~
PT. BARROW
4.I
r
j%,
iol
Ilk.-
UNIVERSITY OF W;ASHINGTON' APPLIED PHYSICS'LABORATORY
Fijurc 3. The breakup of APLIS i-n Late T:4Lj.
APL1-1IJW 7821
UNIVERSTY OF WASHINGTON APPLIED PHYSICS LABORATORY
IV. MEASUREMENTS
The oceanographic surveys off the coast were conducted by heli-copter. The positions of the stations were determined by dead reckon-ing. Occasional checks were made by flying the helicopter high enough
for one of the coastal radar stations to obtain a fix, and the range and
bearing from the radar station were radioed to the helicopter immediately.Using this method to locate the outer end of a line of stations greatlyincreased the positional accuracy of the intermediate stations along theline.
After landing, a hole was augered through the ice and the probe of
the APL lightweight hand-operated CTD profiler was slowly lowered to thebottom. Data were tape recorded as the probe was both lowered andraised.
Water samples were taken by attaching a plastic sampling bottle to
the CTD cable. Weather and current measurements at the camp were takenwith standard equipment. Satellite photographs were requested duringthe period that the camp was occupied.
April CTD Profiles off the Coast
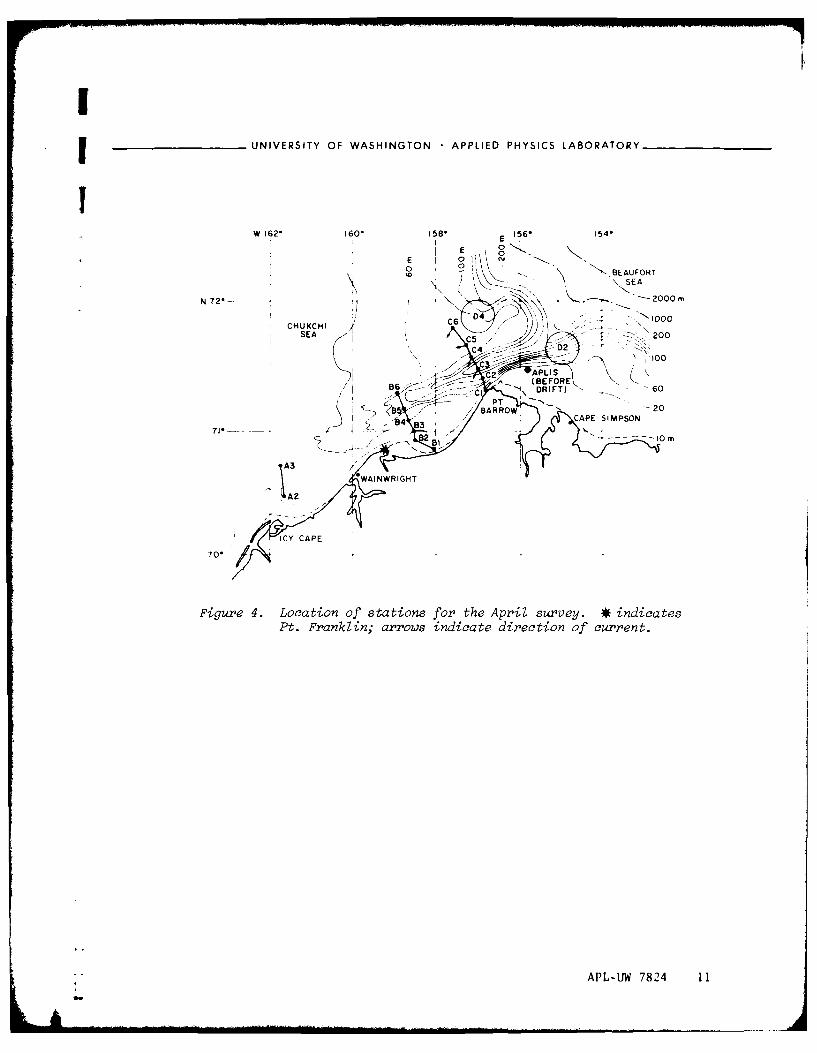
The locations of the stations for the April survey are shown inFigure 4. The arrows at some of the stations indicate the relativedirection of the current as determined from the angle of the cable when
raising and lowering the probe. For stations D2 and D4, the navigationwas so poor that the position has been indicated by a large circle. Theindividual profiles are shown in Appendix A.
Before April the eastern Chukchi Sea was ice covered. A slightopening occurred along the coast in March as the entire ice pack moved
southwestward. A satellite photograph taken on 13 April, the day the
survey started, shows an extensive crack along the coast in what appears
to be fairly thick ice. The CTD operator reported ice thicknesses
exceeding 2 m in this vicinity.
In the following figures, the cross section of each line of sta-
tions perpendicular to the coast has been plotted twice, once with iso-
thermals and once with isohalines. Shadings have been used to emphasize
an isothermal region near the surface, temperatures above -1.50C, and
salinities above 32.5%.
10 APL-UW 7824 I
______________UNIVERSITY OF WASHINGTON -APPLIED PHYSICS LABORATORY
W 162* 160* 1581 E 156* 154-
E 0r'
0 "',BEAUFORT
SEA
IN 72* -- 2000-
CHUKCHI C6 1000o~
SEA - z, 200
C - ~ 100
--- C2 APLIS
86 -j(BEFORE6C \DRIFT) 0
.A / AROW N20
82 ,I[ -- - - 10
A3
A2 *WA INWRIGH
ICY CAPE
Figure 4. Location of stations for the April survey. *indicatesPt. Frankl in; arrows indicate direction of current.
APL-UW 7824 1
UNIVERSITY OF WASHINGTON APPLIED PHYSICS LABORATORY
STATIONA3 A2 ICY CAPE
20-s it UNIFORMIO OFFPICY CAPELAE
60L
STATIONA3 AZ ICY CAPE
4 32.6 5
6.
323 OFF ICY CAPE
40s
60-
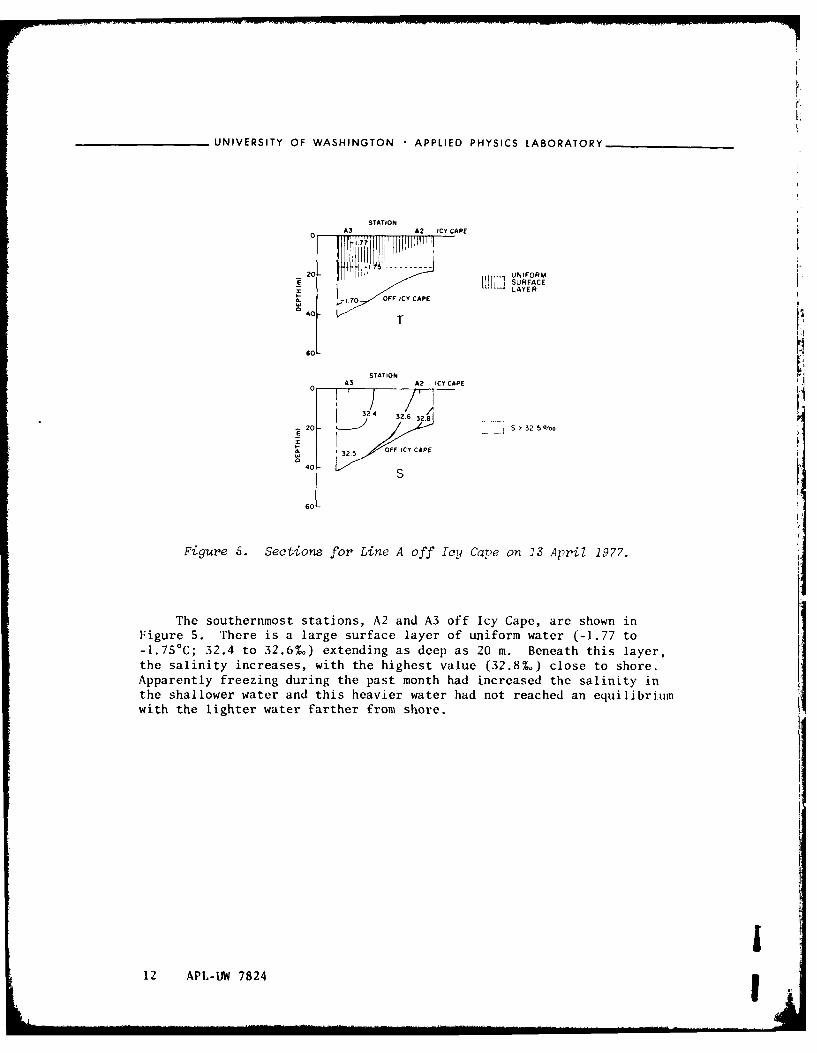
Figure 5. Sections for Line A off Icy Cape on 13 April 1977.
The southernmost stations, A2 and A3 off Icy Cape, are shown inFigure 5. There is a large surface layer of uniform water (-1.77 to-l.75OC; 32.4 to 32.6%.) extending as deep as 20 m. Beneath this layer,the salinity increases, with the highest value (32.8%.) close to shore.Apparently freezing during the past month had increased the salinity inthe shallower water and this heavier water had not reached an equilibrium
with the lighter water farther from shore.
12 APL-UW 7 824I
IUNIVERSITY OF WASHINGTON APPLIED PHYSICS LABORATORY
STATION PT. FRANKLIN
86 85 84 83 B2 a)
C0 -l6o I
20 11 jh ' '6
jj
IIo40T-ATION PT FRANKLIN iSUFC
2 0 TS40 - OFF PT, FRANKLINUNF R
60 -I, S
I00
STATION PT. FRANKLINB6 85 84 83 82 81
F17 S >32 5 0o
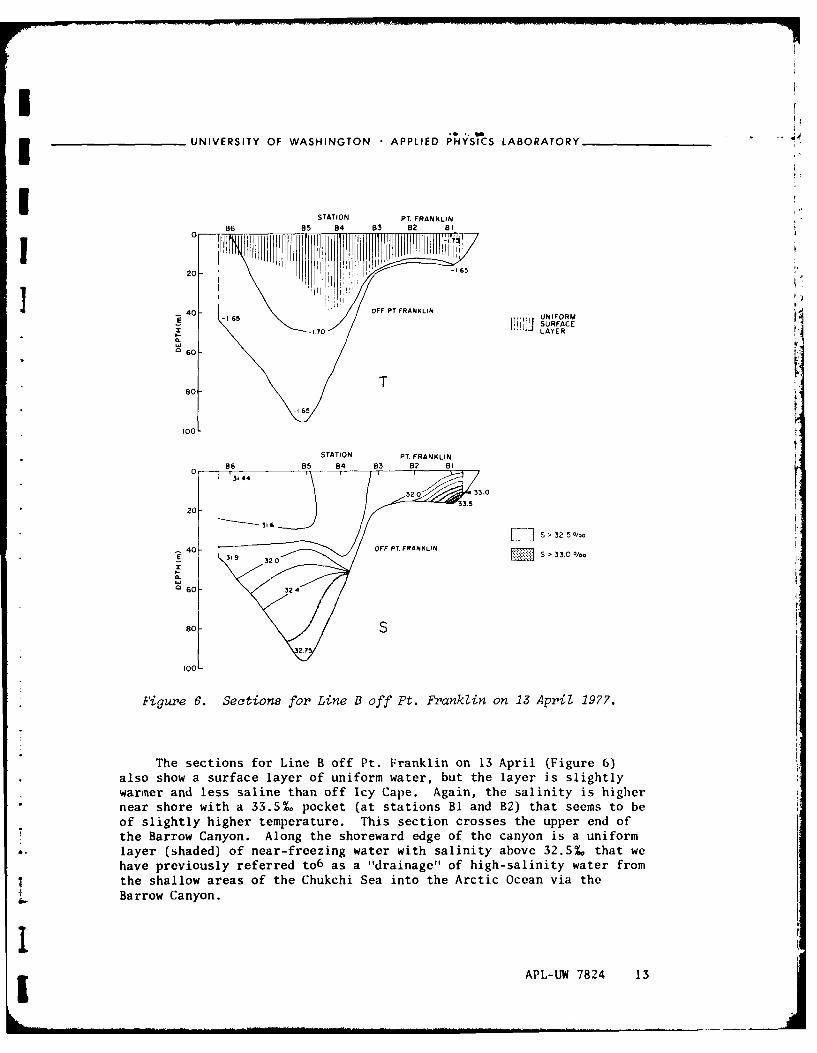
Figure 6. Sections for Line B off Pt. Franklin on 13 April 1977.
The sections for Line B off Pt. Franklin on 13 April (Figure 6)
also show a surface layer of uniform water, but the layer is slightly
warmer and less saline than off Icy Cape. Again, the salinity is higher
near shore with a 33.5% pocket (at stations B1 and B2) that seems to be
of slightly higher temperature. This section crosses the upper end of
" the Barrow Canyon. Along the shoreward edge of the canyon is a uniform
• - layer (shaded) of near-freezing water with salinity above 32.5% that we
have previously referred to6 as a "drainage" of high-salinity water from
! the shallow areas of the Chukchi Sea into the Arctic Ocean via the
: Barrow Canyon.
IAPL-UW 7824 13
..... 00
UNIVERSITY OF WASHINGTON APPLIED PHYSICS LABORATORY
STATION PT. FRANKLIN
B6 85 84 83 62 81
'I'017
20 ' 1
40 ,
-~ UNIFORM SURFACE LAYER1, 60 OFF PT. FRANKLIN
-. T 5*C
80 1 650
100
120
STATION PT. FRANKLIN
B6 B5 84 83 82 B'
20 I \/ 3432'°near bottomn
[12.0 S '32 5%o/060 OFF PT. FRANKLIN
C0
8O0
S100-
120
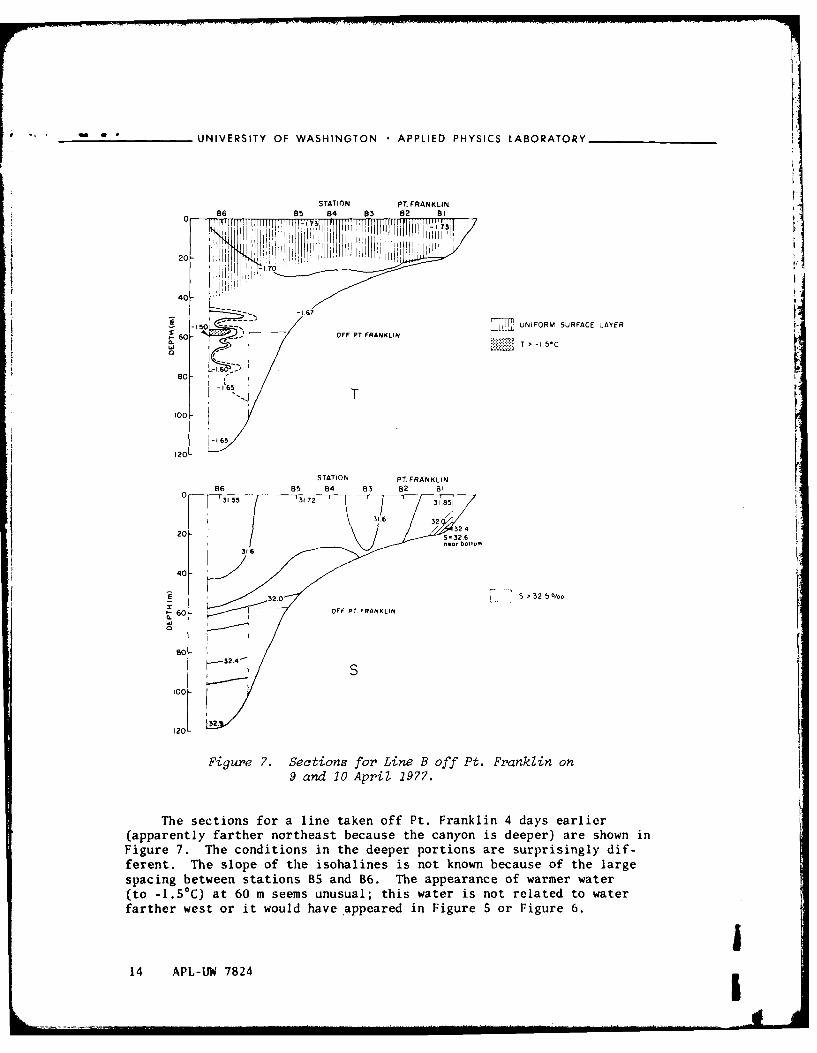
Figure 7. Sections for Line B off Pt. Franklin on9 and 10 April 1977.
The sections for a line taken off Pt. Franklin 4 days earlier(apparently farther northeast because the canyon is deeper) are shown inFigure 7. The conditions in the deeper portions are surprisingly dif-ferent. The slope of the isohalines is not known because of the largespacing between stations B5 and B6. The appearance of warmer water(to -1.50C) at 60 m seems unusual; this water is not related to waterfarther west or it would have appeared in Figure 5 or Figure 6.
14 APL-UW 7824 1
IC6 STATION
C6 C5 C4 C3 C2 CI PT. ARROW
20
40 1
5::k.7Q~>-~ 1.6 - T IO*C
60
II
OFF PT. BARROW
100
-1.60
120 T
-1.00
140 -062
STATION
C6 C5 C4 C3 C2 CI PT. BARROW
20 - I'
40 E-] S >32,5 O/oo
-60-
080-
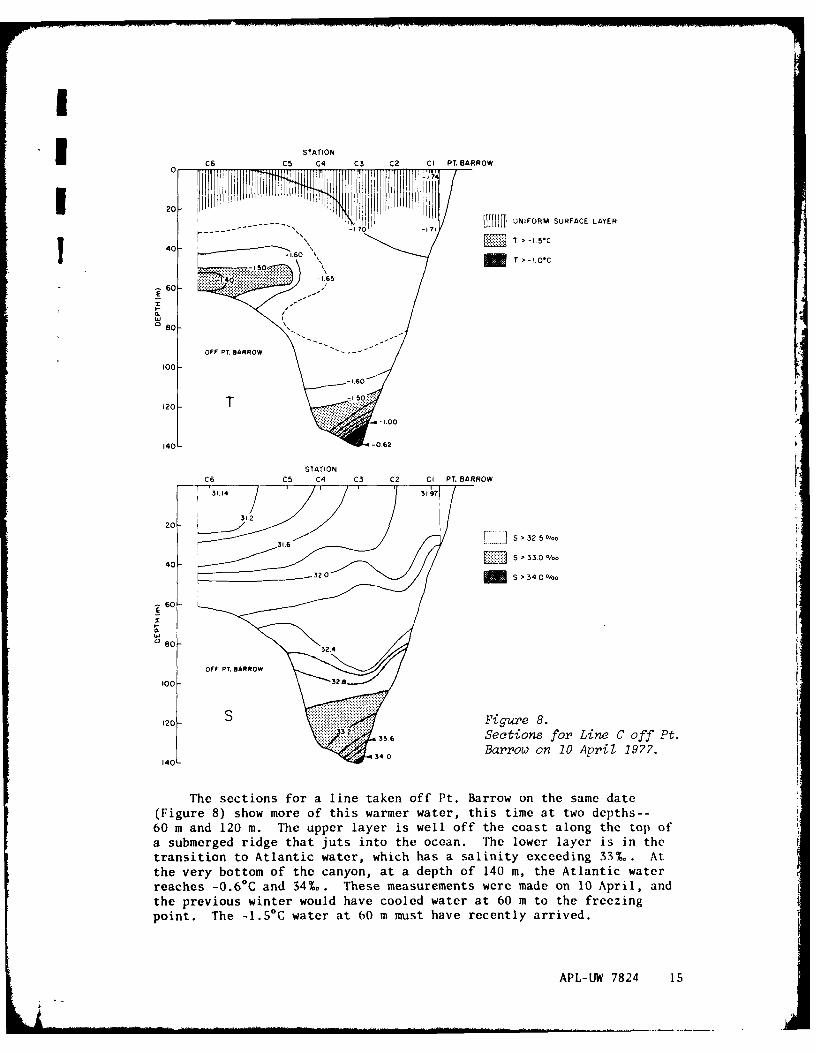
S3.6 Sections for Line C off Pt.Barrow on 10 April 1977.
140 3,
The sections for a line taken off Pt. Barrow on the same date(Figure 8) show more of this warmer water, this time at two depths--60 m and 120 m. The upper layer is well off the coast along the top ofa submerged ridge that juts into the ocean. The lower layer is in thetransition to Atlantic water, which has a salinity exceeding 33%o. Atthe very bottom of the canyon, at a depth of 140 m, the Atlantic waterreaches -0.60C and 34%.. These measurements were made on 10 April, andthe previous winter would have cooled water at 60 m to the freezingpoint. The -1.50C water at 60 m must have recently arrived.
APL-UW 7824 15
UNIVERSITY OF WASHINGTON APPLIED PHYSICS LABORATORY
STATION D4
0 ] I6T 30. 3065
I, I 3L zI
20
I O
40
- NORTH OF PT. BARROW4[1 32.0 t
z ~-1120Bo I I
so 'i:i'il i i '
-1 4 32 5
TEMPERATURE SALINITY Itoo (C)0)
STATION D2
0 - 170 31.31
E20 [J 2 NORTH Of PT.BARROW
1 32?.0I _ I40 Lj. . 70 Fgure 9.
TEMPERATURE SALINITY Two stations north of Pt.
60 Barrow on 15 April 1977.
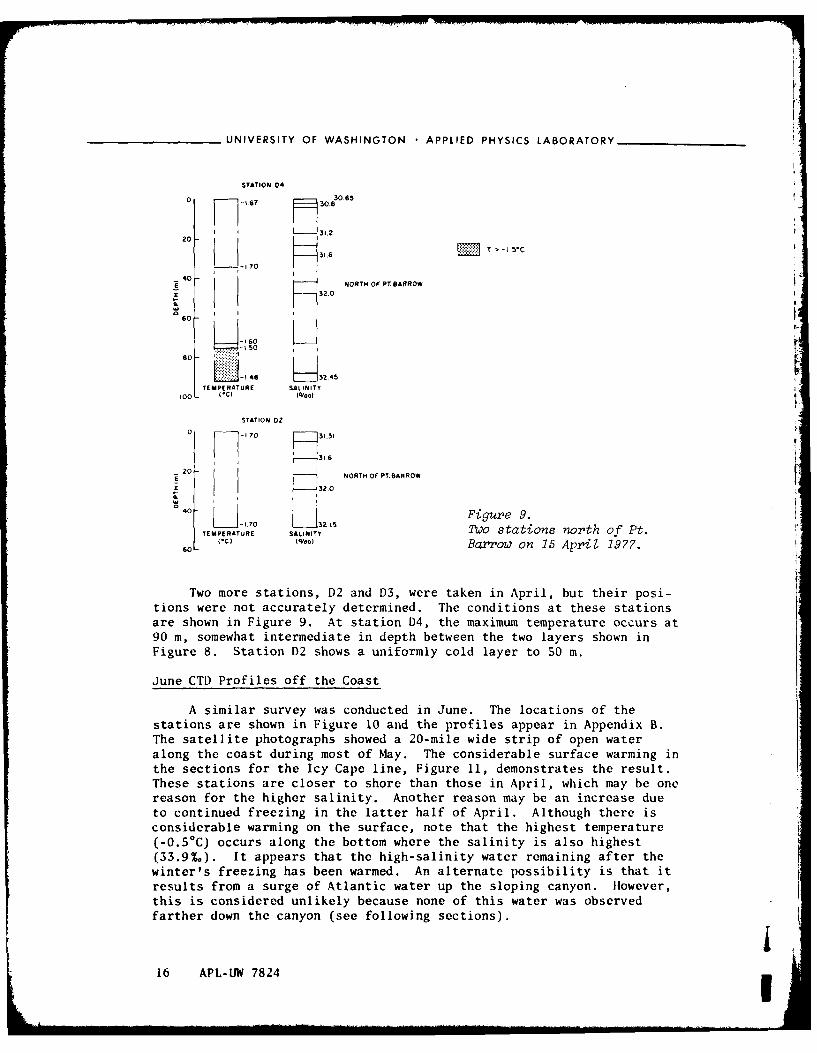
Two more stations, D2 and D3, were taken in April, but their posi-tions were not accurately determined. The conditions at these stationsare shown in Figure 9. At station D4, the maximum temperature occurs at90 m, somewhat intermediate in depth between the two layers shown inFigure 8. Station D2 shows a uniformly cold layer to 50 m.
June CTD Profiles off the Coast
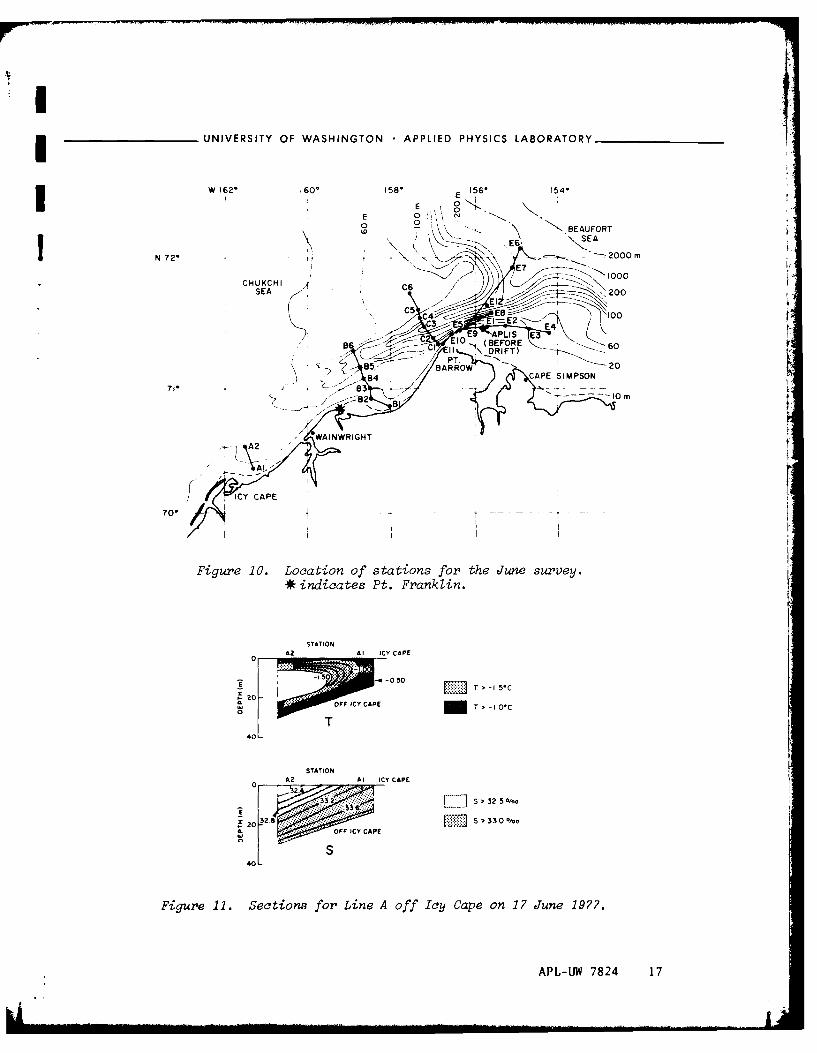
A similar survey was conducted in June. The locations of thestations are shown in Figure 10 and the profiles appear in Appendix B.The satellite photographs showed a 20-mile wide strip of open wateralong the coast during most of May. The considerable surface warming inthe sections for the Icy Cape line, Figure 11, demonstrates the result.These stations are closer to shore than those in April, which may be onereason for the higher salinity. Another reason may be an increase dueto continued freezing in the latter half of April. Although there isconsiderable warming on the surface, note that the highest temperature(-0.50C) occurs along the bottom where the salinity is also highest(33.9 L). It appears that the high-salinity water remaining after thewinter's freezing has been warmed. An alternate possibility is that itresults from a surge of Atlantic water up the sloping canyon. However,this is considered unlikely because none of this water was observedfarther down the canyon (see following sections).
16 APL-IJW 7824
UNIVERSITY OF WASHINGTON -APPLIED PHYSICS LABORATORY__________
162, 160* 158* 156* t54*EAFR
B --- C E~BEBAUFER6
CHKH -4-
* ~C indiate Et4Fakln
STATIOFOR
0T 2
B4 CAPE T I- M S71' ~ 20-8
I:3 S1020/m
A2 WAINWRIGHT
ICY OCACYPE
Figure 11. Setoatfone Af sttof foy Cape o7June 1977e.
indicates 7824 17nki
i
UNIVERSITY OF WASHINGTON APPLIED PHYSICS LABORATORY
STATION PT. FRANKLINB6 B5 84 B3 82 BI
0
-1.160
20- 15 T '-1 5-C
-. 70 -.
104 r 60.
80 T
100-
STATION PT. FRANKLINB6 85 84 83 82 81
32.4 L S>325O/oo
328 S > 33 0%0 o
... ......... S > 34.0O/oo
40
.. . ....................OFF PT. FRANK~LIN
o~~. 603.~............ ........
3-0
S60 Figure 12.
Sec tions for Line B off Pt.100L Frank7~in on 16 June 1977.
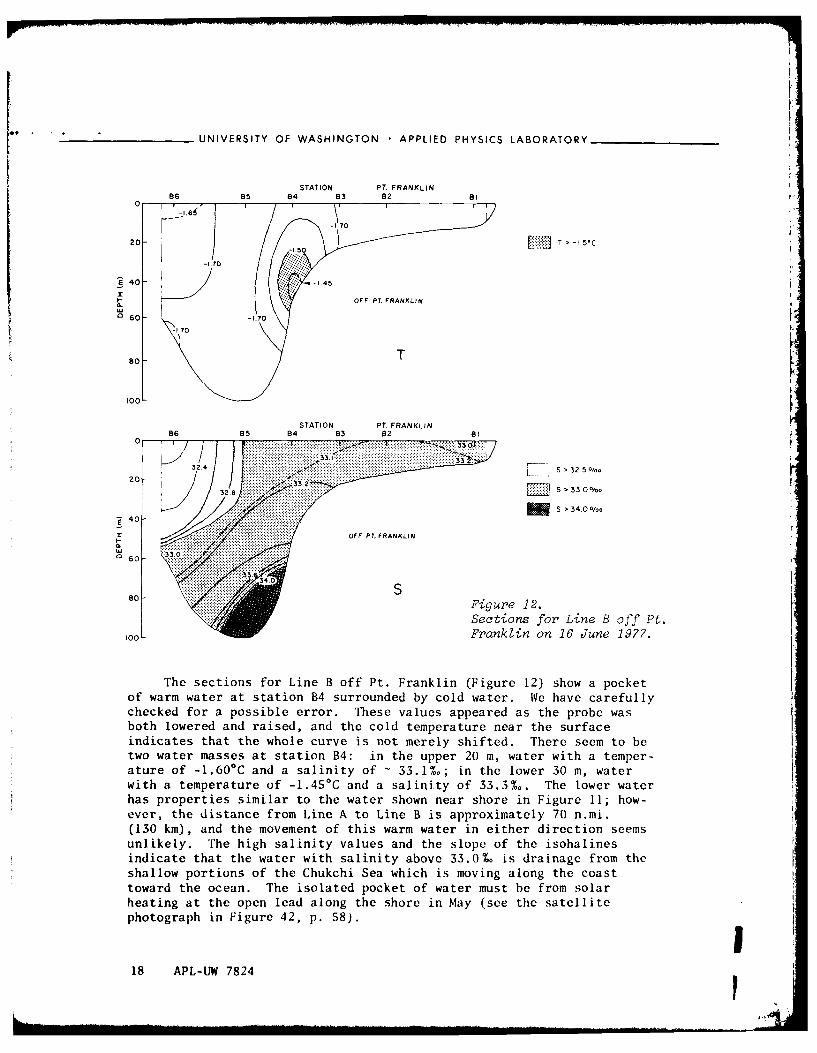
The sections for Line B off Pt. Franklin (Figure 12) show a pocketof warm water at station B34 surrounded by cold water. We have carefullychecked for a possible error. These values appeared as the probe wasboth lowered and raised, and the cold temperature near the surfaceindicates that the whole curve is not merely shifted. There seem to betwo water masses at station B4: in the upper 20 n, water with a temper-ature of -l.60*C and a salinity of -33.M%; in the lower 30 m, waterwith a temperature of -1.45'C and a salinity of 33.3%,. The lower waterhas properties similar to the water shown near shore in Figure 11; how-ever, the distance from Line A to Line B is approximately 70 n.ni.(130 kin), and the movement of this warm water in either direction seemsunlikely. The high salinity values and the slope of the isohalinesindicate that the water with salinity above 33.0%. is drainage from tileshallow portions of the Chukchi Sea which is moving along the coasttoward the ocean. The isolated pocket of water must be from solarheating at the open lead along the shore in May (see the satellitephotograph in Figure 42, p. 58).
18 APL-JW 7824
iiiiiiiii~iiiiii~iiiiiiii~ii o , ,
ISTATION
C6 C5 C4 C3 C2 CI PT. BARROW
2O0-
4OL -6
OFF PT. BARROW
120~
-1 70
T140
TATION
C6 C5 C 4 C3 C2 CI PT. BARROW
01~- Vo2Sio
31 6 S > 3200/0
120 Figure 13.
Sections for Line C off Pt. iS Barrow on 16> June 1977.140
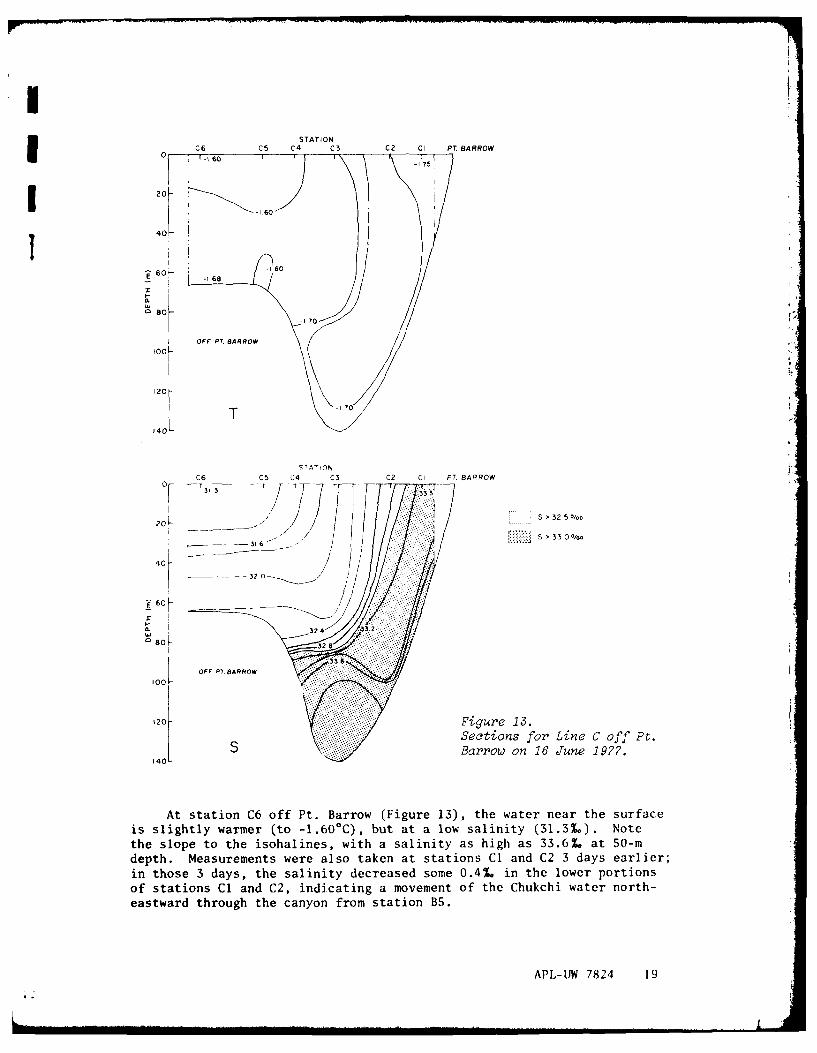
At station C6 off Pt. Barrow (Figure 13), the water near the surfaceis slightly warmer (to -1.60°C), but at a low salinity (31.3%0). Notethe slope to the isohalines, with a salinity as high as 33.6%. at 50-rnudepth. Measurements were also taken at stations Cl and C2 3 days earlier,in those 3 days, the salinity decreased some 0.4%, in the lower portions :of stations Cl and C2, indicating a movement of the Chukchi water north-eastward through the canyon from station B5.
APL-W 7824 19
0 0 3
OF r BRO
UNIVERSITY OF WASHINGTON APPLIED PHYSICS LABORATORY
STAT I ONE5 El E2 E3 E4:x
20-.0
S40 I20EAST OF P1'. BARROW
T
STATION6 0 T4~O 1.BRO80
Fiue 1 reet secionEfo poiE tkno9Je aog h
20 - 'tit -32 4 - --
40 ~ ~~~~~EAST OF PT. 19ARROW '' z5oo
. S >,! 0Oo
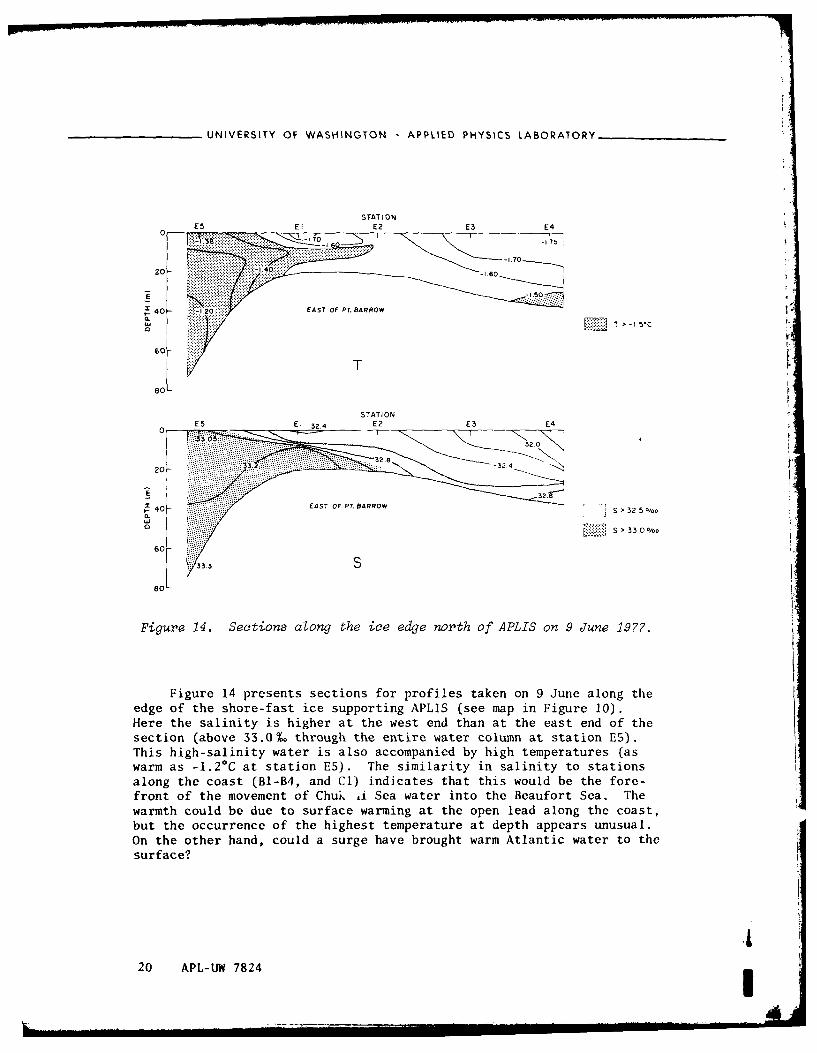
Figure 14. Sections along the ice edge north of APLIS on 9 June 1977.
Figure 14 presents sections for profiles taken on 9 June along the
edge of the shore-fast ice supporting APLIS (see map in Figure 10).Here the salinity is higher at the west end than at the east end of thesection (above 33.0%. through the entire water column at station E5).This high-salinity water is also accompanied by high temperatures (aswarm as -1.2C at station E5). The similarity in salinity to stationsalong the coast (Bl-B4, and Cl) indicates that this would be the fore-front of the movement of Chuk ,i Sea water into the Beaufort Sea. Thewarmth could be due to surface warming at the open lead along the coast,but the occurrence of the highest temperature at depth appears unusual.On the other hand, could a surge have brought warm Atlantic water to thesurface?
i20 APL-ULW 7824 -
_______________UNIVERSITY OF WASHINGTON APPLIED PHYSICS LABORATORY
STATION PT. BARROW
E6 E7______ E5____
-40- -3
20-
40- 30::
60-
60
T'-5
130 T~ 0*C
120L / 7 0
x
70,
0140h
.00
ISO / NORTIREAST OF PT. 94RR0W
50 5/
220-T
240-
260L~
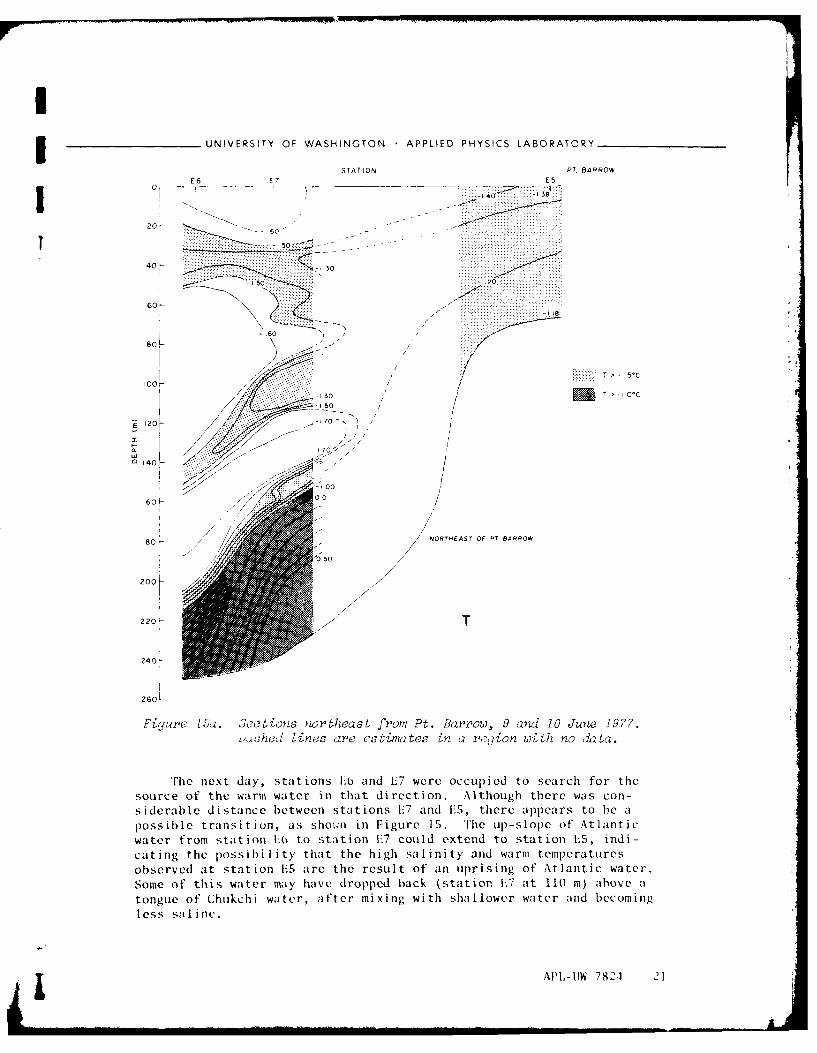
Fijure 15a. Sections northeast from Pt. Barrow, 9 and 10 June 19??.LAAjhed( lines are cstimates in a re,,ion with no data.
Trho next day, stations 1:6 and E7 were occupied to scarch for thesource of the warm water in that direction. Although there was con-siderable distance between stations F7 and I'S, there appears to bc apossible transition, as show;n in Figure 1S. 'rhe up-slopc of Atlanticwater from station 1:(0 to station 1:7 could extend to station 1E5, indi-cating the possibil ity' that the high salinity and warm temperaturesobserved at station 1:5 are the result of an uprising of Atlantic water.Some of this water may have dropped back (station E7 at 110 m) aibove atongue of Chtjkchi water, after mixing with shallower water and becomingless saline.
APL-U1W 7824 21
UNIVERSITY OF WASHINGTON -APPLIED PHYSICS LABORATORY________
STAT ION PT, BARROW6E6 E7 E5
---------- 13 / 33 - 1I--/ :':
33020
32 040-
3 2 - 33 2
80-/
S 3 33
O 40-
/NORTHEAST OF PT. BARROW
200-
220 S
24 0
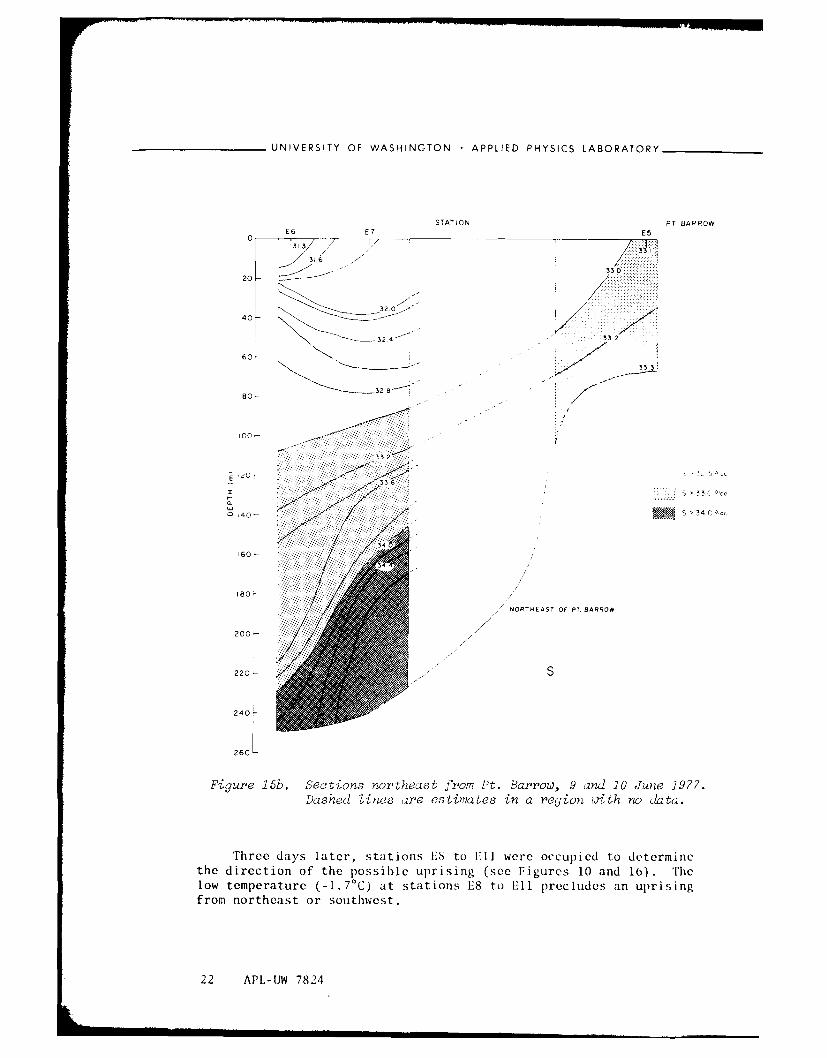
Figure 15b. Sections northeast from Pt. Barrow, 9 and 10 June 19??.Dashed Lines are estimates in a region with no data.
Three days later, stations 1:8 to 1:11 were occupied to determinethe direction of the possible uprising (see Figures 10 and 1(3). Thelow temperature (-1.7 0C) at stations E8 to I'll precludes an uprisingfrom northeast or Southwest.
22 APL-IJW 7824
_______________UNIVERSITY OF WASHINGTON APPLIED PHYSICS LABORATORY
STATION PT. BARROWE8E9 EIO Eli
20-
40- -LTO
607
SO--
1280
0NOSTHATOF PT. BARROW
40
I60 . .. T...
STHATO PTT BARROW
20-
140
160-
80 3 3 3o
IS
AP-W-84 2
UNIVERSITY OF WASHINGTON APPLIED PHYSICS LABORATORY
Any surge from station 17 to station ES would have to progress upthe axis of the canyon, and approach ES from the north rather than in a
straight line. Perhaps the 3-day time difference or the inaccuracy in
positioning produces some discrepancies. Observations of the cableangle during the profiling showed a very strong northerly current at
station E8, no current at the shallow station E9, and medium currents to
the northeast at stations E10 and Ell, thus giving evidence against anuprising from the north. Solar warming appears to be a better expla-nation for the warm water at station ES.
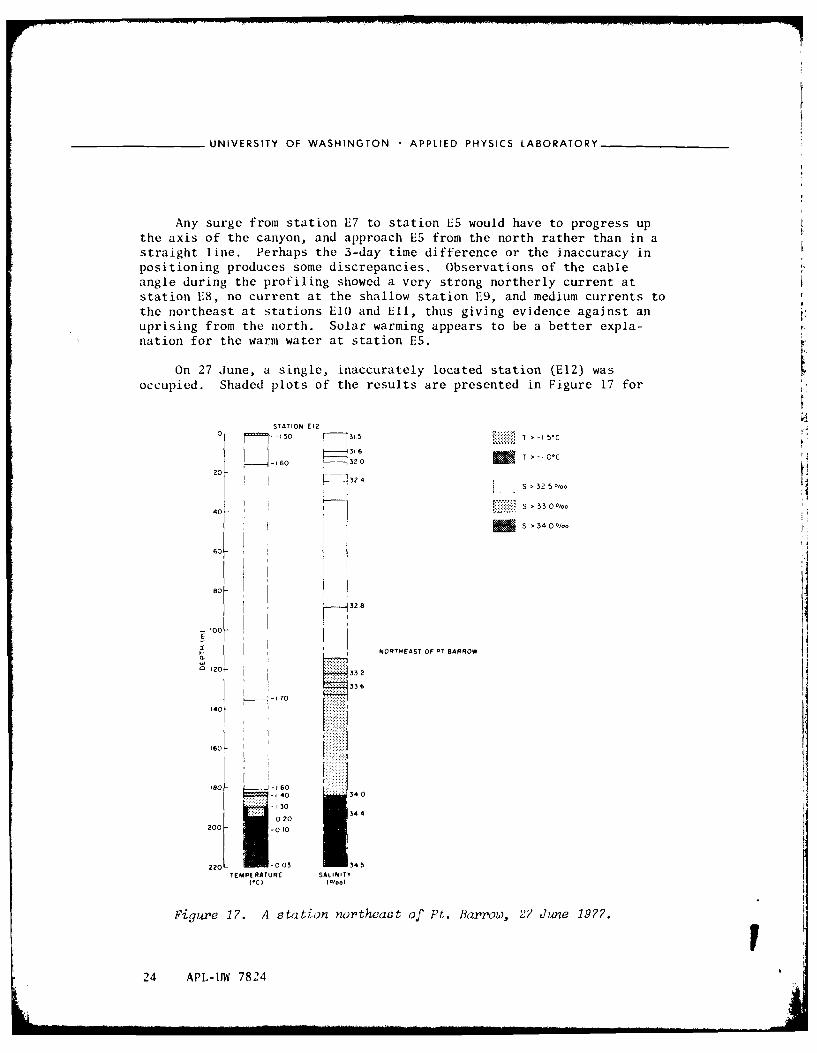
On 27 June, a single, inaccurately located station (E12) wasoccupied. Shaded plots of the results are presented in Figure 17 for
STATION E12
2 -60 320 T >-IOC20 -- -
324 s 325 O/ooi ::::: S > 33 0 %.
40 ::;I,1 .... S>330/oo
so II S~4~
132.800-
S. NORTHEAST OF PT, BARROW
~Iz0 ___336n
140-T
60
0.. . ..- 160- 40 340. - 1: 30
-020200 -01
220 1 03 34 5TEMPERAT RE SALINIT y
Figure 17. A station northeast of Pt. Barrow, 27 June 1977.
24 APL-IJW 7824
UNIVERSITY OF WASHINGTON • APPLIED PHYSICS LABORATORY
comparison with the other sections. Figure 17 shows the presence ofwarm, saline Atlantic water at depth and a large accumulation of colddrainage from the Chukchi Sea at 135 to 185 m. Above this, a new, coldlayer at 45 to 110 m with a salinity of 32.8%. has formed. This newlayer must be a more recent movement of Chukchi Sea water into theArctic Ocean.
July CTD Profiles off the Coast
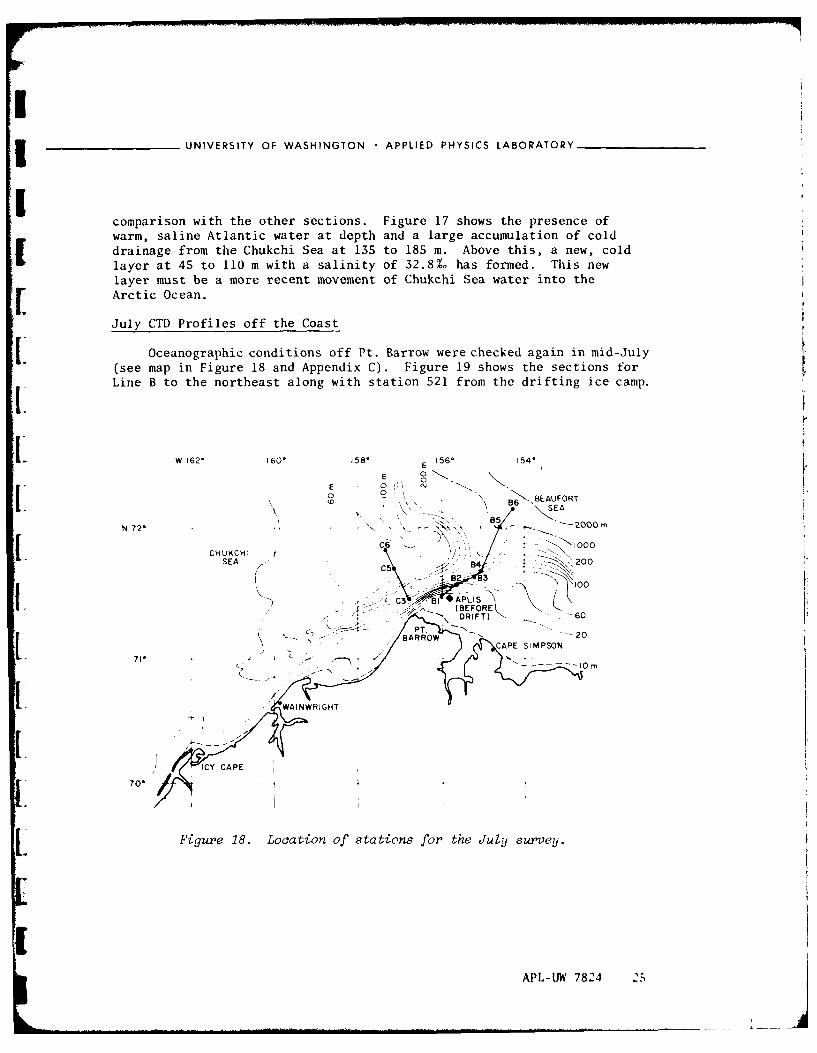
[ Oceanographic conditions off Pt. Barrow were checked again in mid-July(see map in Figure 18 and Appendix C). Figure 19 shows the sections forLine B to the northeast along with station 521 from the drifting ice camp.
W 162' 160 158 ° E 156* 154*
o '6 BEAUFORT
N 72* B5.. 2000mr
CHUKCHI 6~SEA I) - -" -SE 0
C3. -81 *APLIS
(BEFORE\ DRIFT)BA R WC P St M P SON
-- , WAINWRIGHT
IYCAPE I
APL-UW 7824 25[ J
UNIVERSITY OF WASHINGTON - APPLIED PHYSICS LABORATORY
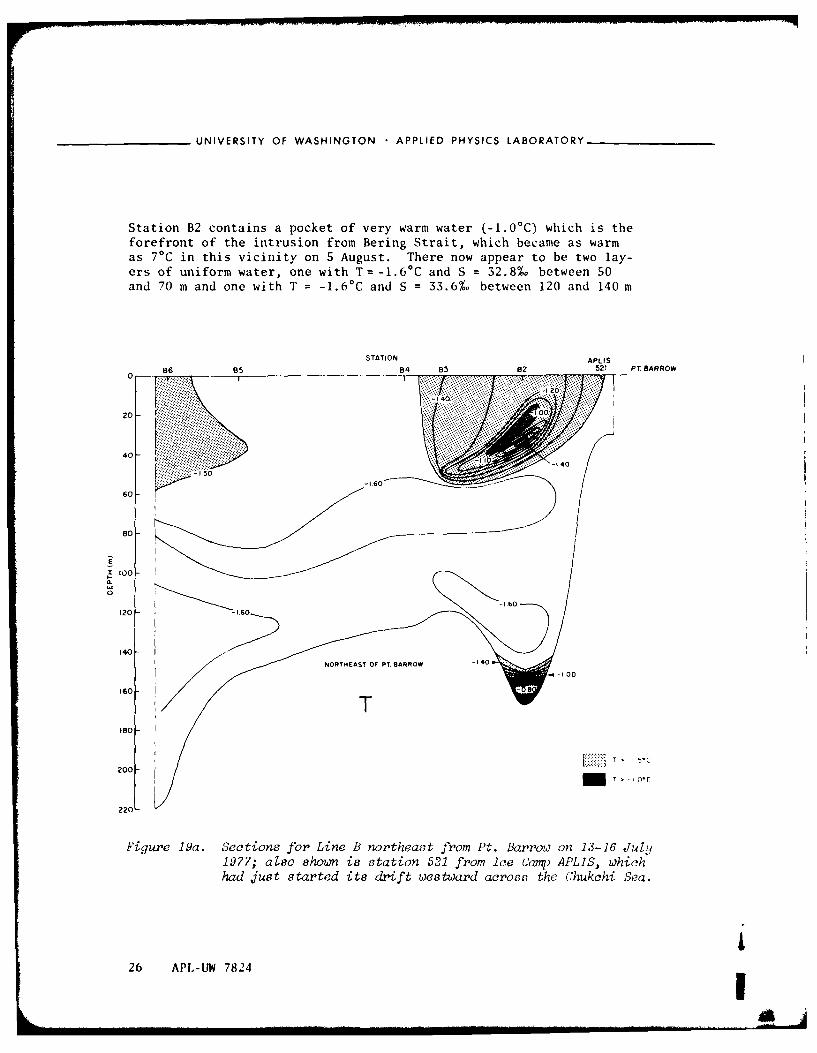
Station B2 contains a pocket of very warm water (-1.0oC) which is theforefront of the intrusion from Bering Strait, which became as warmas 7C in this vicinity on 5 August. There now appear to be two lay-ers of uniform water, one with T=-1.60 C and S = 32.8%. between 50and 70 m and one with T -1.6"C and S = 33.6%. between 120 and 140 m
STATION APLISB5 84 03 B2 521 PT. BARROW
20
60-
80 4
-16.0
160
220
Figure 19a. Sections for Line B northeast from Pt. Barrow on 13-16 July1977; also shown is station 522 from Ice Camp APLIS, whiwhhad just started its drift westward across the Chukchi Sea.
i26 APL-UW 7824 I
________________UNIVERSITY OF WASHINGTON -APPLIED PHYSICS LABORATORY
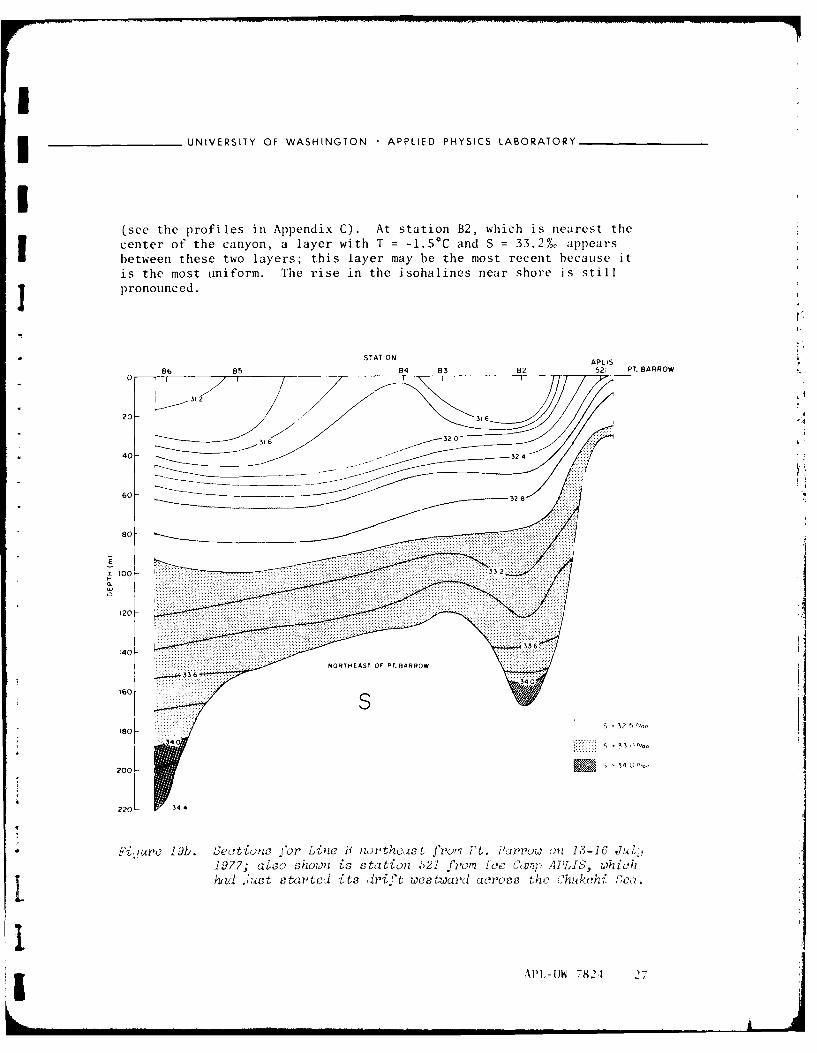
(see the profiles in Appendix C). At station B2, which is nearest thecenter of the canyon, a layer with T = -1.5'C and S = 33. 2L appears
between these two layers; this layer may be the most recent because itis the most uniform. The rise in the isohalines near shore is stillJ pronounced.
t
* STATIONAPIS
86 B588 2 521 PT. BARROW
20
20 Z40
60 -3
so 80 ...-
M 100-
120 A
404
160-
180- S 3 oo
200- 5 4 5Z0
'
F i.ae lab. sctions for Line iS niwtheas t fro'z Pt. iBarrow on 13-16 J14l,.1-19??. aI~so shown is station ')21 j'roP? fee C',rip ATLIS, which
L had ,h lst started its irift westward across the Chukchi Pe
II
UNIVERSITY OF WASHINGTON APPLIED PHYSICS LABORATORY__________
STATION PT. BARROWC6CS C5
40
40-T '- I 5*C
60-
100- 16
120L
STATION PT. BARROWC6 C5 C3
0 -
20[ 306
32 0-
40 -4 - i S,20o
322
10
120
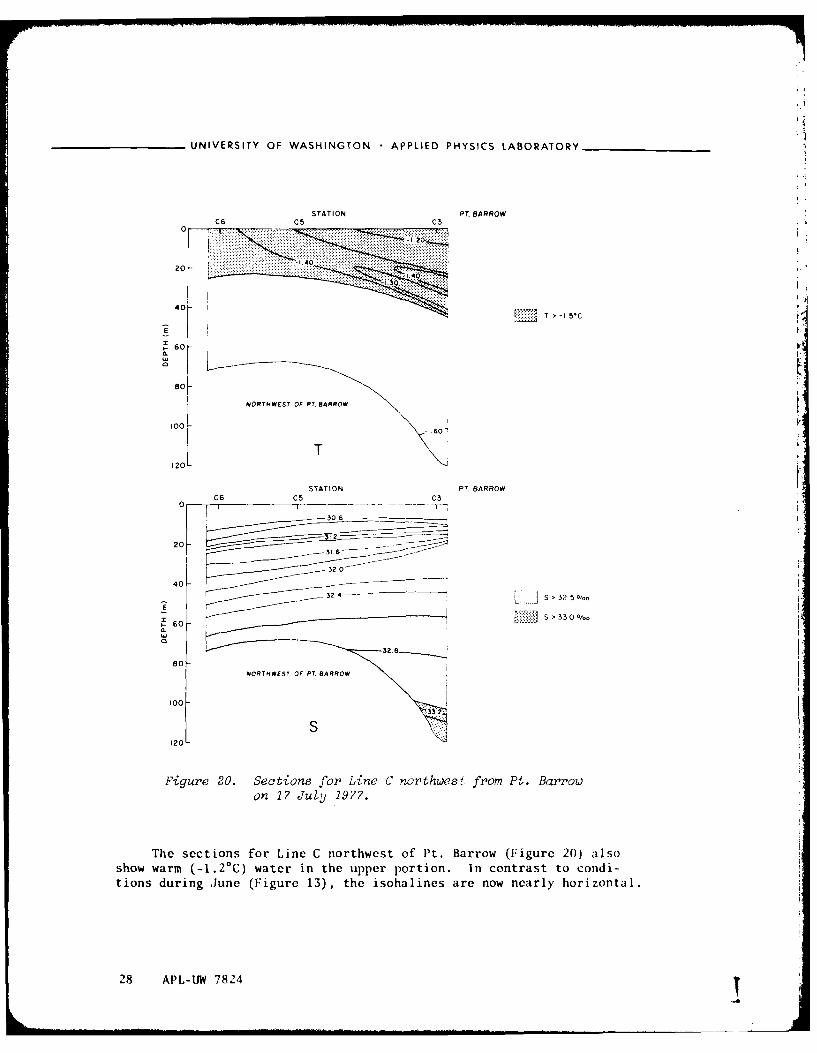
Figure 20. Sections for Line C northwest from Pt. Barrowon 17 July 19??.
The sections for Line C northwest of 11t. Barrow (Figure 20) alsoshow warm (-1.2*C) water in the upper portion. in contrast to condi-tions during June (Figure 13), the isohalines are now nearly horizontal.
28 APL-LJW 7824
"I
I_ _ UNIVERSITY OF WASHINGTON APPLIED PHYSICS LABORATORY
ISN 72-
0 5 10 15
0 :NAUTICAL MILES
7-t .130'
~ I. -- - I ~ OAPLIS19 18 17 16 15 14 13
JULY '77
PT.BARROW
7'*
W 159* 1580 157- 156* 155*
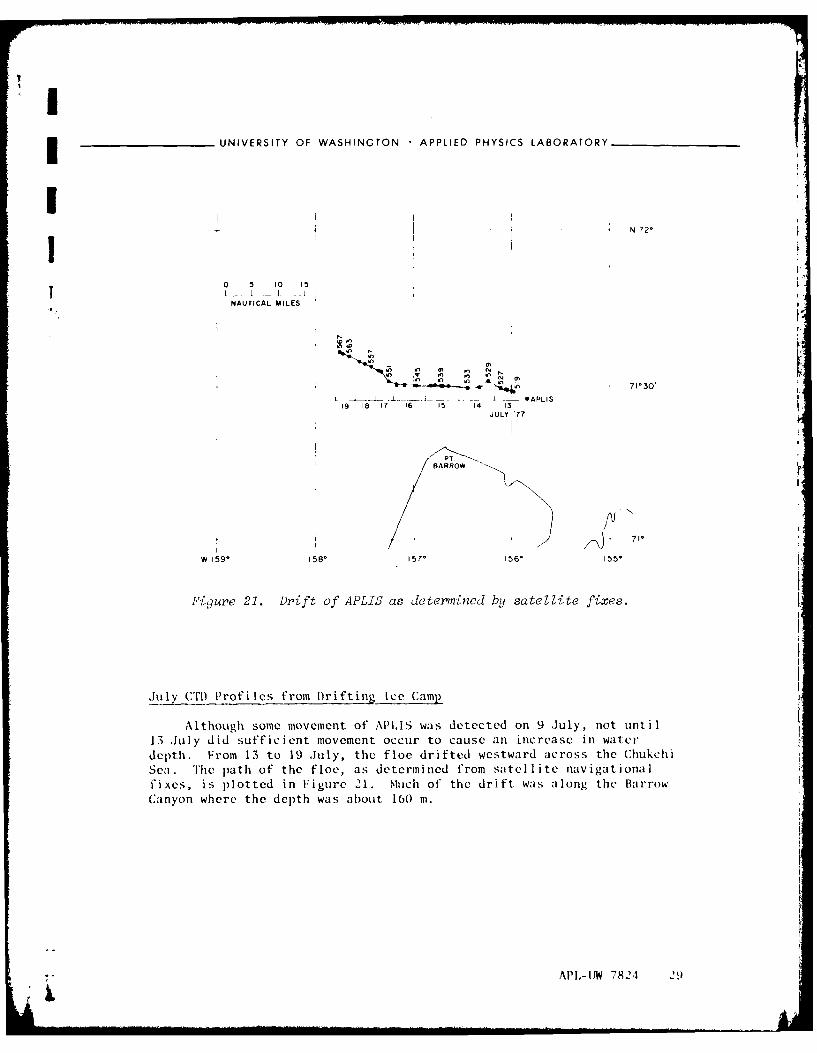
Figure 21. Drift of APLIS as determined by satelZite fixes.
July CTh Profiles from 1)rifting Ice Camt)
Although some movement of APLIS was detected on 9 July, not until13 July did sufficient movement occur to cause an increase in waterdepth. From 13 to 19 July, the floe drifted westward across the ChukchiSea. The path of the floe, as determined from satellite navigationalfixes, is plotted in Figure 21. Much of the drift was along the BarrowCanyon where the depth was about 160 m.
7- API,-IJW 7824 29
UNIVERSITY OF WASHINGTON APPLIED PHYSICS LABORATORY
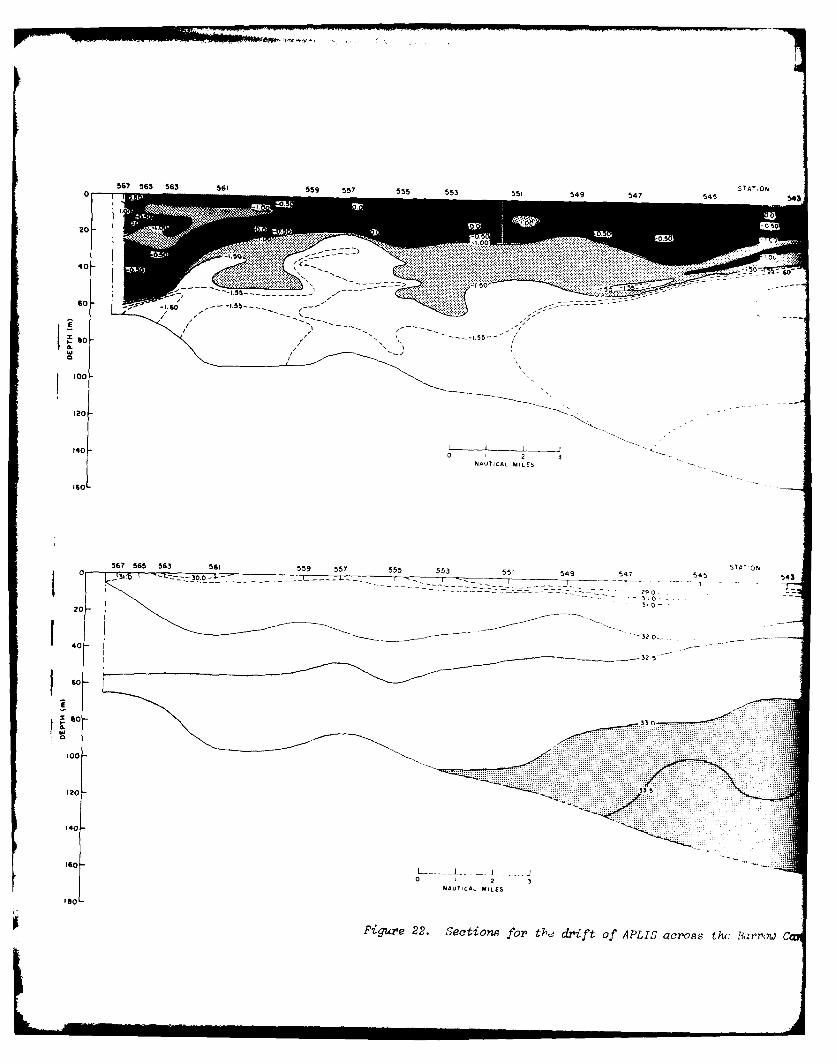
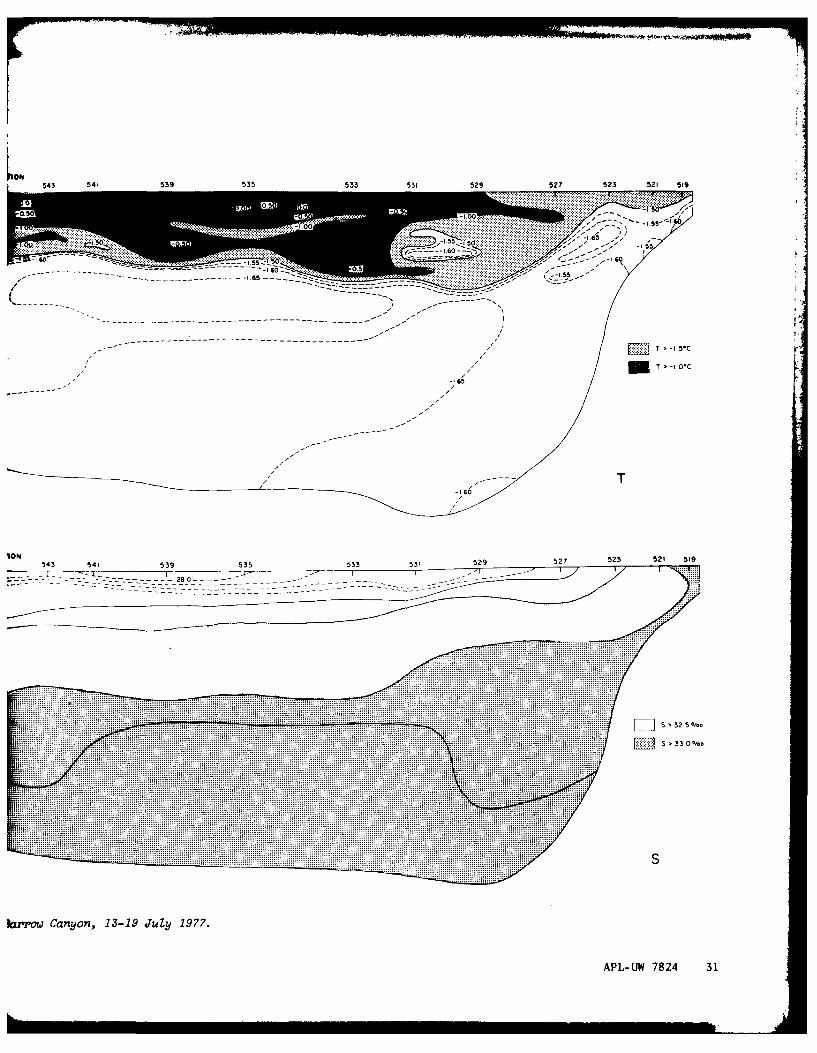
During the drift, three CTD profiles were obtained each day (seeAppendix E). The sections constructed from these profiles are shown inFigure 22. The lower regions contain several uniform layers withT < -1.60C and S > 33.0%.. These are believed to be formed by water
masses that drained from the Chukchi Sea in several stages. A layer ofuniform water (S = 32.8%., T < -1.60C) at 60 m is thought to be theremains of the winter-cooled water from the Chukchi Sea, now disturbed Vabove by the warm coastal intrusion and below by the easterly movement
of the more saline Chukchi drainage down the canyon.
At the east end of the section, both the isothermals and the iso-halines rise into the shallows.
The warm intrusion appears to be spreading across the surface ina very irregular manner. The APLIS floe drifted along the edge of thepack with open water to the southwest. Some of the warming could have
been at the surface; however, in many places a warm 20-m deep tongue ispresent, which is more indicative of an intrusion that is slightlyheavier (more saline) than the surface waters which contain low-salinity
melt water.
August Profiles from an Icebreaker
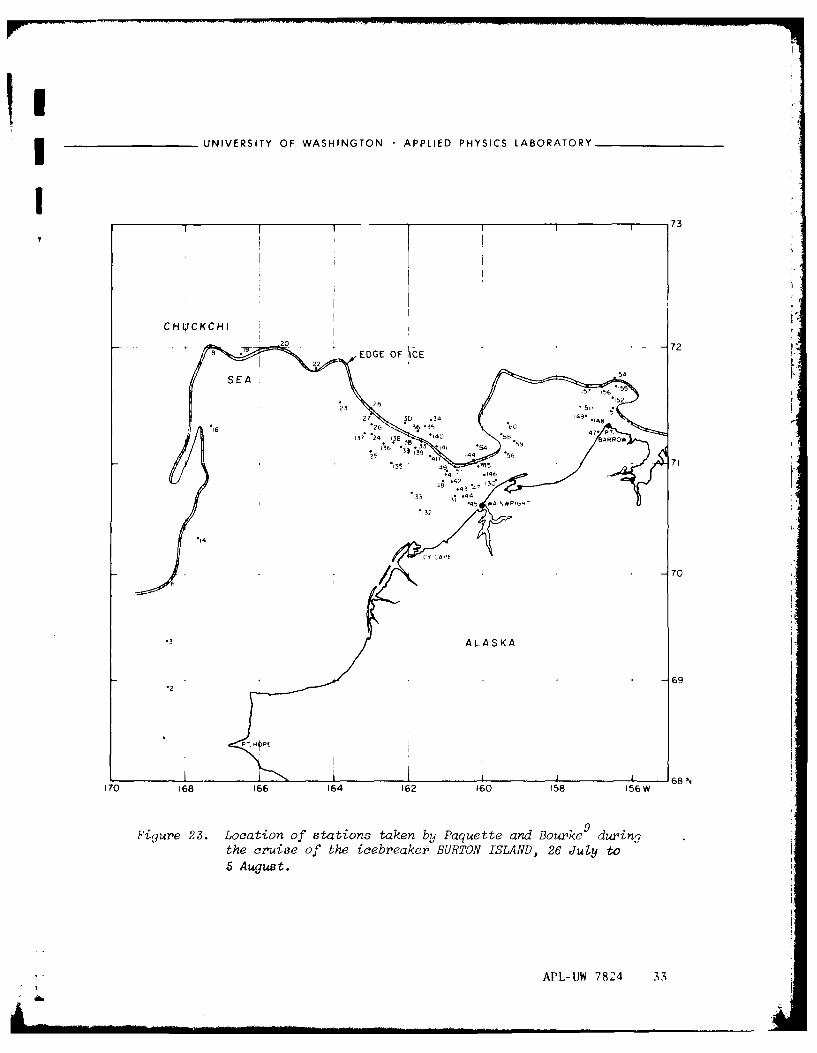
Paquette and Bourke 9 conducted an oceanographic cruise on the ice-breaker BURTON ISLAND along the coast from Pt. Hope to Pt. Barrow from26 July to 5 August 1977. A map of the stations taken during the cruise
is shown in Figure 23. Temperature and salinity profiles taken by APLare presented in Appendix D for the stations shown on the figure.
30 APL-UW 7824
0 56? 565 563 561 559 557 555 553 551 549 547 545 SA;N 543. ~ I .
..................... X.
40 w..
100
I 20
0 2140 0 N A U TICA L M IL ES
a 56?' 565 563 561 5, .. 55, 553 55(54 547 ST5 54N
31.3v S 54 54
32 5
1200
0 2 3
ISO[ NAUTICAL MILES
Fiure 22. Sections for tb& drift of APLIS across~ thc BarrPow C]
Ok 543 541 539 535 533 531 529 527 523 521 519
0 ~~~0.5 .... *:.
.0 .. . .....
Q V * .......- 1 5 0 .... ....0 ... ..~ ~ ~ ' 1 5 '
.55 .5c------------------ ~ 65 --- I--
~---------- ----------------
T -I.I*
-l 65
-160
NN 543 541 539 53 53 531 529 527 523 521 519
- -r---~---~-------------------------.
- - - - -- - - - - 00 -- -------
........ 3.....
.. ... ... ..
..... .....
~ar~ro Canyn, 13-9.Jul.1977
.............. 782 31...
3 UNIVERSITY OF WASHINGTON APPLIED PHYSICS LABORATORY
I I j73
CHYCKCHI
2I2254
628 N '
2*6 3036 .3 .5 34 4 16;
ITO16 476 1PT12.6 8
SAu9u4 0 t.
AP35 72 371 7"
',3 311 4..44P
1 '4 68 N EI-
'14i
5 uut. HOP
ii
AP L-UIW 7824 33
UNIVERSITY OF WASHINGTON APPLIED PHYSICS LABORATORY
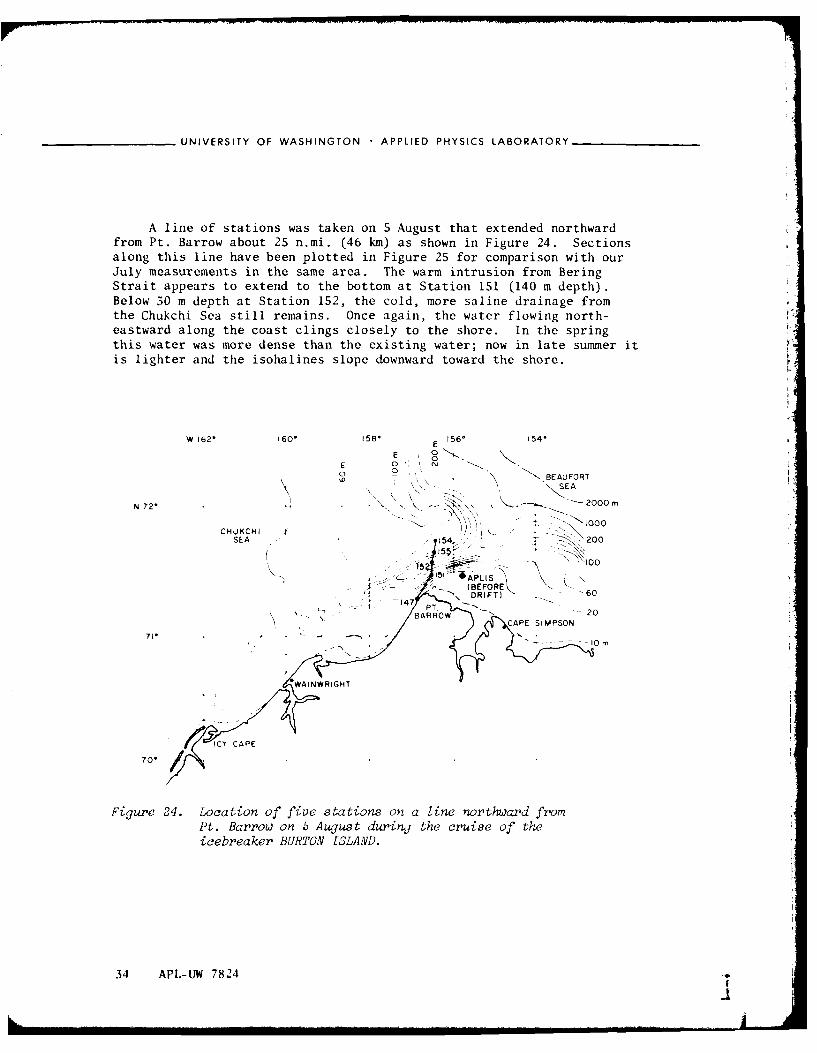
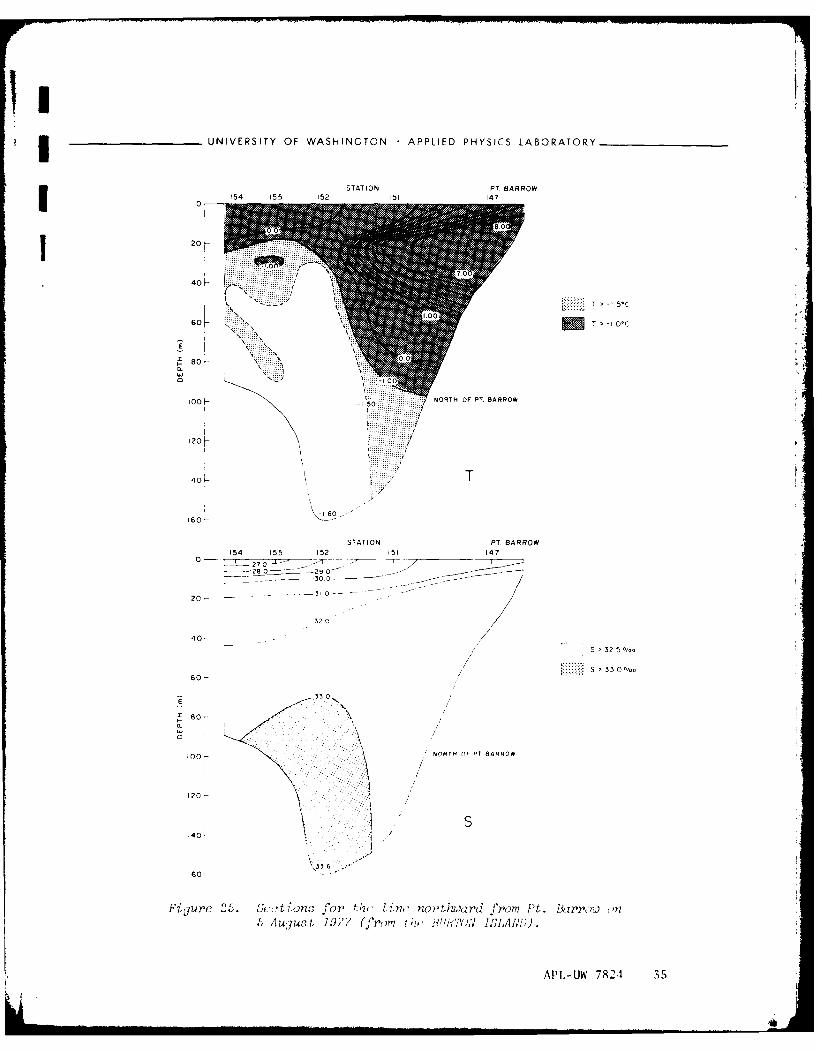
A line of stations was taken on 5 August that extended northwardfrom Pt. Barrow about 25 n.mi. (46 km) as shown in Figure 24. Sectionsalong this line have been plotted in Figure 25 for comparison with ourJuly measurements in the same area. The warm intrusion from BeringStrait appears to extend to the bottom at Station 151 (140 m depth).Below 30 m depth at Station 152, the cold, more saline drainage fromthe Chukchi Sea still remains. Once again, the water flowing north-eastward along the coast clings closely to the shore. In the springthis water was more dense than the existing water; now in late summer itis lighter and the isohalines slope downward toward the shore.
W 162' 160" 158* 156* 154'E
0-_ BEAUFORT
N 72 S EA
SEA ~-2000mCHUKCHI i - -
SEA 154,, _ 200
5 1 11' 00
~APLIS--- - ' ~ " -. P i - , (BEFORE -.
- DRIFT) -60- 147
BARROW20
BCAPE SIMPSON
Fiue2.Lcto7o0iesain na ienrhadfo
Figure 24. Location of five stations on a line northward from
Pt. Barrow on 5 August during the cruise of theicebreaker BURTON ISLAND.
34 APL-UW 7824 T
ii., II I II I I I" " - I " -I I l ... . . . .. . . ... . .... .. . = ,, . 4
______ UNIVERSITY OF WASHINGTON* APPLIED PHYSICS LABORATORY ___
STATION PT. BARROW54 155 152 1 51 1 47I 0
20
T > -I 0IC
so0,
100 00
120'
140-T
16060
STATION PT. BARROW154 155 152 1 51 147
0 --- _,- - O--Z - -- --2 90
-- 300 ----9--
20- 31
32 0
40- -
60- /S >'33 0 Ooo
33 0,
100- . -NORTH (OF PT BARROW
460s
Figure' -U).~ in. for fkr li nc nort21ard from 11t. Barrow on
APL,-W 78241 3 5
UNIVERSITY OF WASHINGTON APPLIED PHYSICS LABORATORY ______
o z
00
oz
C ,
to
00
00TN
0 0
- j 0~
(U)Hld3O WIJ Hld3O
I7
_______________UNIVERSITY OF WASHINGTON APPLIED PHYSICS LABORATORY
Time Series at Stationary Ice Camp
At two periods during the ice camp occupancy, when temperature andsalinity conditions seemed highly variable, CTD profiles were measuredevery hour.
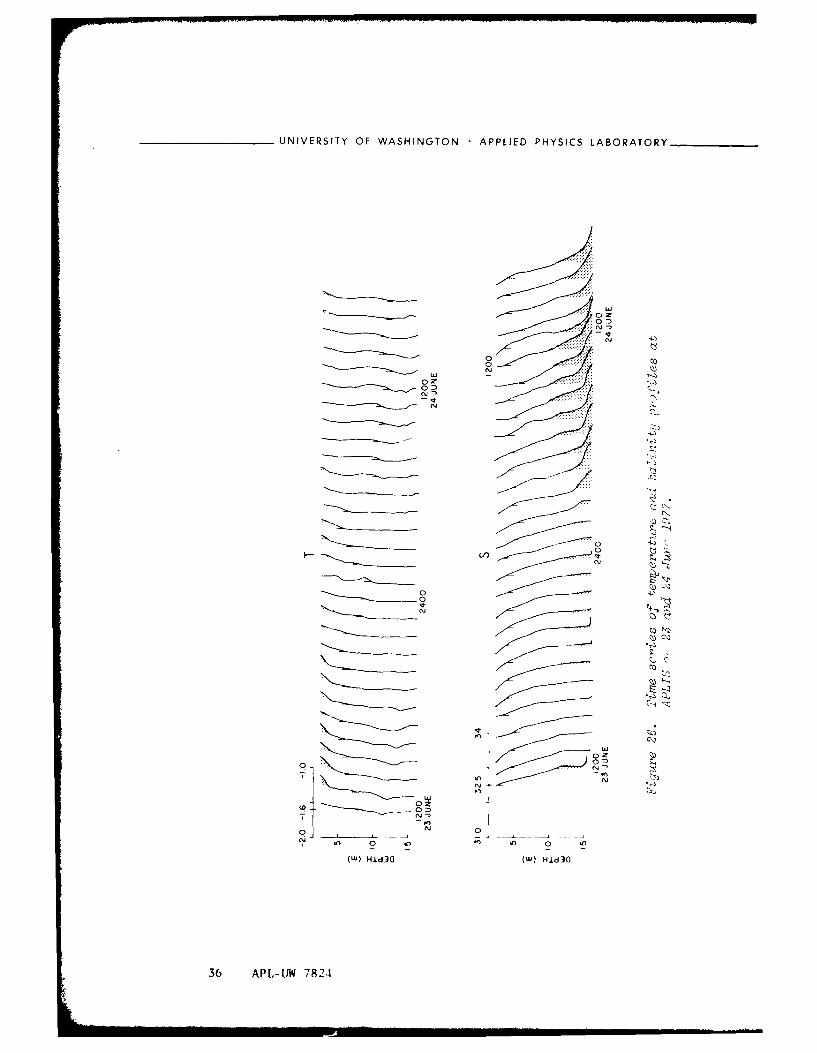
On 23 June, the temperature near the surface began increasing whilethe salinity at depth was decreasing. Starting at noon on 23 June, a30-h CTD time series was obtained with a cast each hour. The resultsare plotted in Figure 26. The vertical ticks on the profiles indicate-1.6'C and 32.5Lo; the shading indicates salinity greater than 33.0%L.An increase in salinity at the bottom is accompanied by a slight increasein temperature.
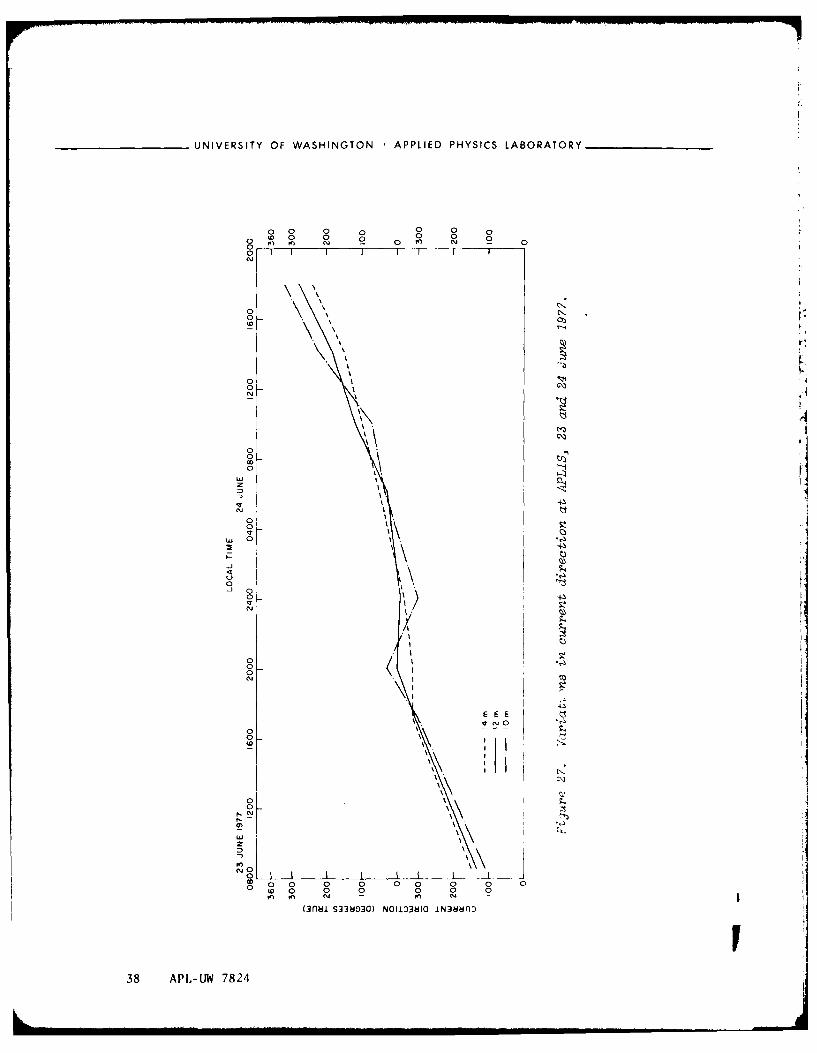
During this period, current measurements were taken every 4 h. Thedirection appeared to rotate, with a period of about 26 h (see Figure 27and further discussion under Current Measurements at Ice Camp APLIS).
During the increases in salinity, the current was toward the south.
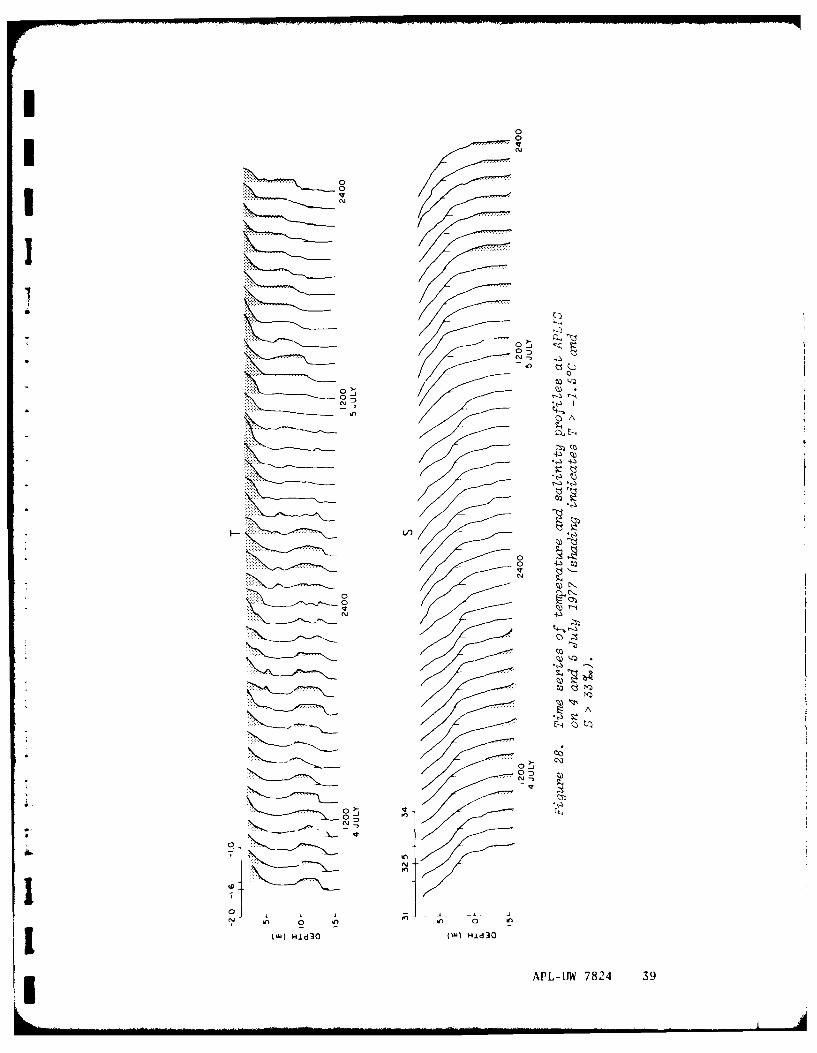
A second hourly CTD time series was started at 0800 on 4 July andran for 40 h. The results are shown in Figure 28. During this period,the salinity at the bottom of the water column passed through a minimum,as did the temperature in the lower half.
CTD Profiles at Stationary Ice Camp
CTD profiles were taken at the stationary APLIS camp three or fourtimes each day from May through July. The water depth was only 15 m,and, with the ice keels projecting 2-5 m downward, the water movementthrough the area must have been greatly disturbed.
Data were recorded during both the descent and the ascent of theprobe from the CTD profiler (the profiler was fastened to the wall overa hole in the generator hut). Comparison of the two records revealsthat the data recorded during the descent contained errors caused by twofactors. First, the probe was stored in the warm hut and was not placedin the water long enough to reach a thermal equilibrium before lowering;therefore, the water passing through the cell was warmed, increasing itsconductivity. The second error was due to a layer of very-low-salinitymelt water in the hole. This water did not flush out of the probeimmediately and often decreased the conductivity during the lowering.The lowering and the stop at the bottom to read the dials appear to haveprovided sufficient time for the probe to reach a temperature equilibriumand complete flushing, so that the ascent was free of these errors.However, the data taken during the ascent are degraded by the turbulencecreated by the cylindrical housing above the probes.
APL-UW 7824 37
UNIVERSITY OF WASHINGTON APPLIED PHYSICS LABORATORY
0 0 0 0 0 00 0 0 o o
0N 0
0
0 I I I I I
N7
cli
\ ,"
0 C-
\
I' \ 0:
0
"O
w
N IE
,0000
o,
0
C''I
I I A' I
00
0
0 0 0 0 0 0 0 0 0
. . .. . .. . ... . .. . . . . . .I | . . . . .. . I I I l
o0 0 0 0 0 0 0 0fn (M - fn NQ
(3n~i S3389030) NO1103NIO IN388fl)
38 APILW 7824
.....I.0Y
N1N
Il
II
T~
iw Hld30 (w-Hd3
AP -J 84 3
UNIVERSITY OF WASHINGTON - APPLIED PHYSICS LABORATORY
TEMPERATURE (*C)
-2.0 -1.5 -1.5 -1.5 -1.5 -1.5 -1.5 -1.5 -1.5 -1.5 -1.5 -1.5 -1 5 -1.5
26 28 0 'q54 7 9 11 13 15MAY JUNE
-2 0 - .5 - .5 - .5 - .5 - .5 - 1 5 - 5 - 1,5 - 1 5 - 1 - - 1 5 - 1 5
0-
-5
E 5-
01
26 20 23 24 27 28 30 2 4 8 0 12
JUNE JULY
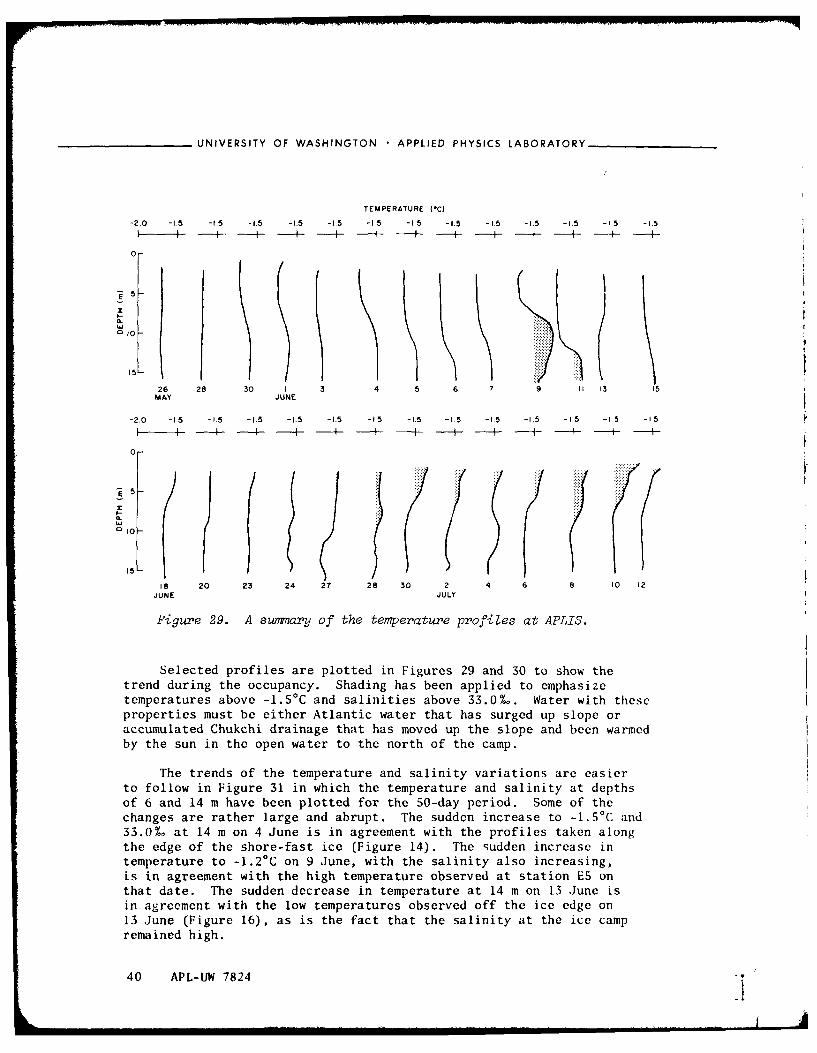
Figure 29. A sum~ary of the temperature profiles at APLIS.
I Selected profiles are plotted in Figures 29 and 30 to show the
trend during the occupancy. Shading has been applied to emphasizetemperatures above -. 5'C and salinities above 33.0%. Water with these
properties must be either Atlantic water that has surged up slope oraccumulated Chukchi drainage that has moved up the slope and been warmedby the sun in the open water to the north of the camp.
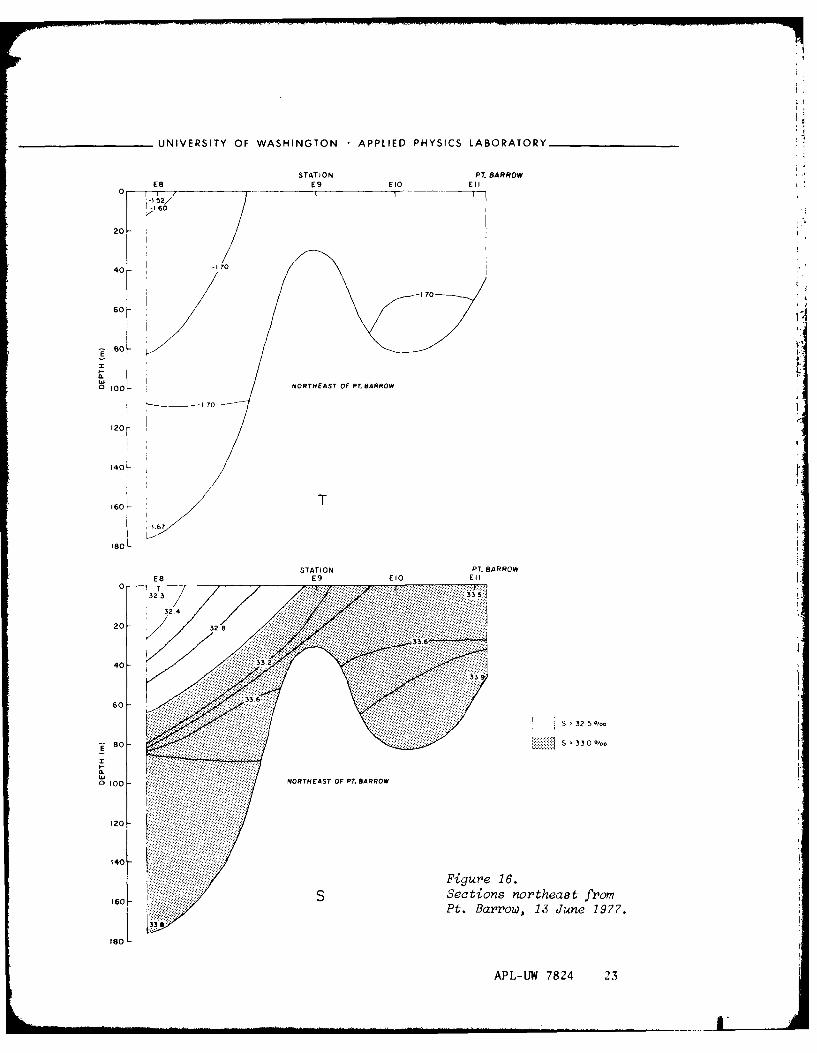
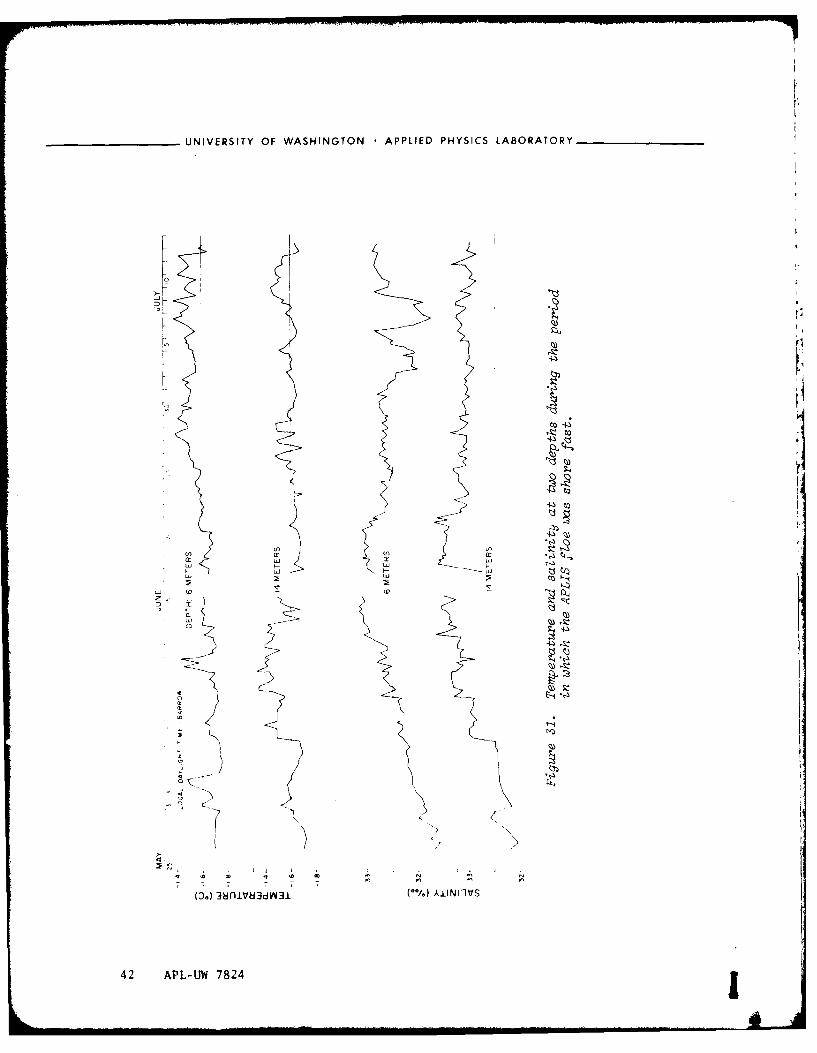
The trends of the temperature and salinity variations are easierto follow in Figure 31 in which the temperature and salinity at depthsof 6 and 14 In have been plotted for the 50-day period. Some of thechanges are rather large and abrupt. The sudden increase to -1.50C and33.0Lo at 14 m on 4 June is in agreement with the profiles taken alongthe edge of the shore-fast ice (Figure 14). The sudden increase intemperature to -1.2°C on 9 June, with the salinity also increasing,is in agreement with the high temperature observed at station ES onthat date. The sudden decrease in temperature at 14 m on 13 June isin agreement with the low temperatures observed off the ice edge on13 June (Figure 16), as is the fact that the salinity at the ice campremained high.
0 0 P-W72
I
SALINITY (%o)
31 32 32 32 32 32 32 32 32 33 33 33 33 33 33
-! to
15
26 28 30 1 3 4 5 6 7 9 II 13 t5MAY JUNE
31 32 33 33 33 33 33 33 33 33 33 33 33 33 33
0 I---- --- - -+ -- -4--- ---- 4- -A- -A- ---- -
5 -
15
18 20 23 24 27 28 30 2 4 6 8 I0 12
JUNE JULY
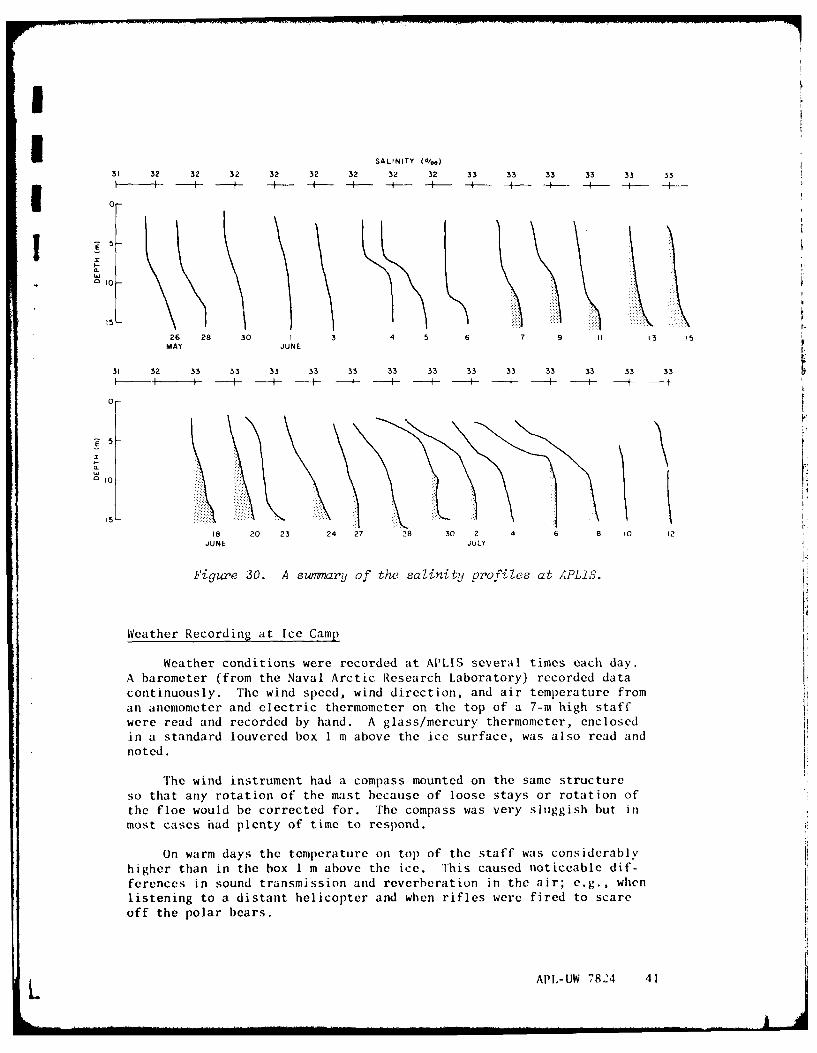
Figure 30. A swmmary of the salinity profiles at APLIS.
Weather Recording at Ice Camp
Weather conditions were recorded at APLIS several times each day.
A barometer (from the Naval Arctic Research Laboratory) recorded data
continuously. The wind speed, wind direction, and air temperature from
an anemometer and electric thermometer on the top of a 7-m high staffwere read and recorded by hand. A glass/mercury thermometer, enclosed
in a standard louvered box 1 m above the ice surface, was also read and
noted.
The wind instrument had a compass mounted on the same structure
so that any rotation of the mast because of loose stays or rotation ofthe floe would be corrected for. The compass was very sluggish but inmost cases had plenty of time to respond.
On warm days the temperature on top of the staff was considerably
higher than in the box 1 m above the ice. This caused noticeable dif-ferences in sound transmission and reverberation in the air; e.g., whenlistening to a distant helicopter and when rifles were fired to scare
off the polar bears.
APL-UW 7824 41
_______________UNIVERSITY OF WASHINGTON APPLIED PHYSICS LABORATORY
to -
'd C
(3.) dnlV3dVVl (* ) AiNIIV
42 IPU 782
I I
DV 0 L
>00
0- 0: 1
z cz
I fr
<4
zo
wD3~AOIPSM
'133d:6.0, N~ol.J
lm l _4 3
AP-W784 4
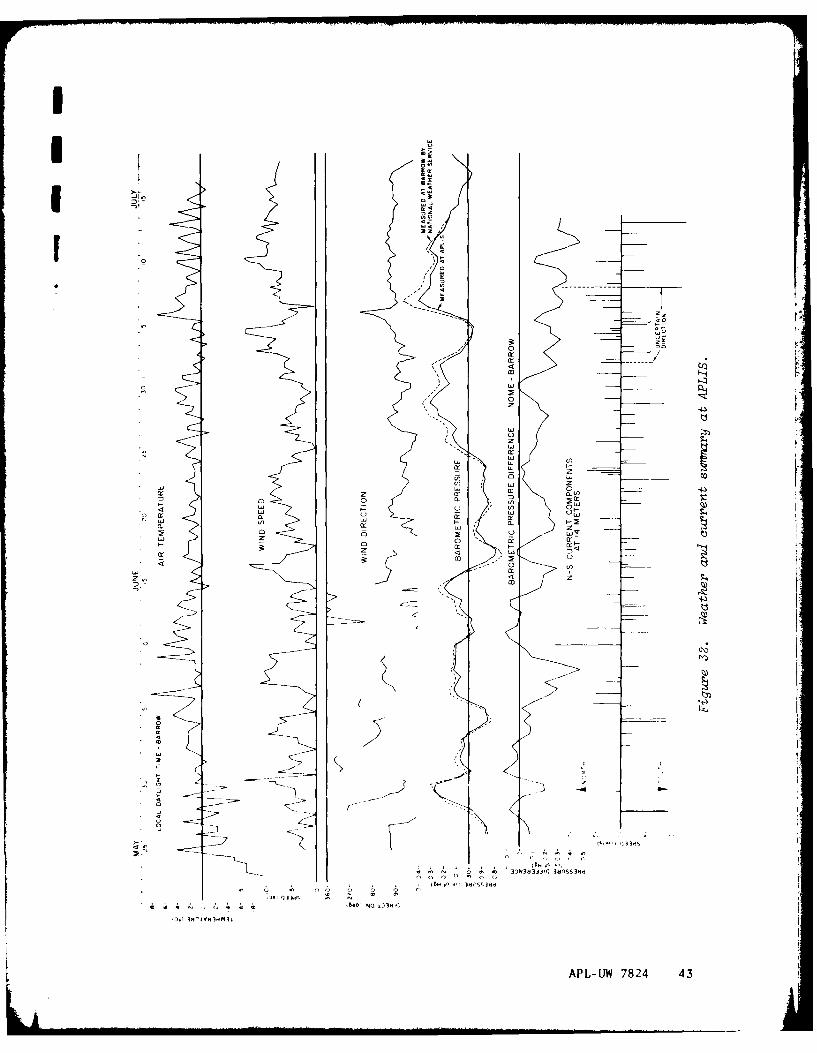
UNIVERSITY OF WASHINGTON APPLIED PHYSICS LABORATORY .
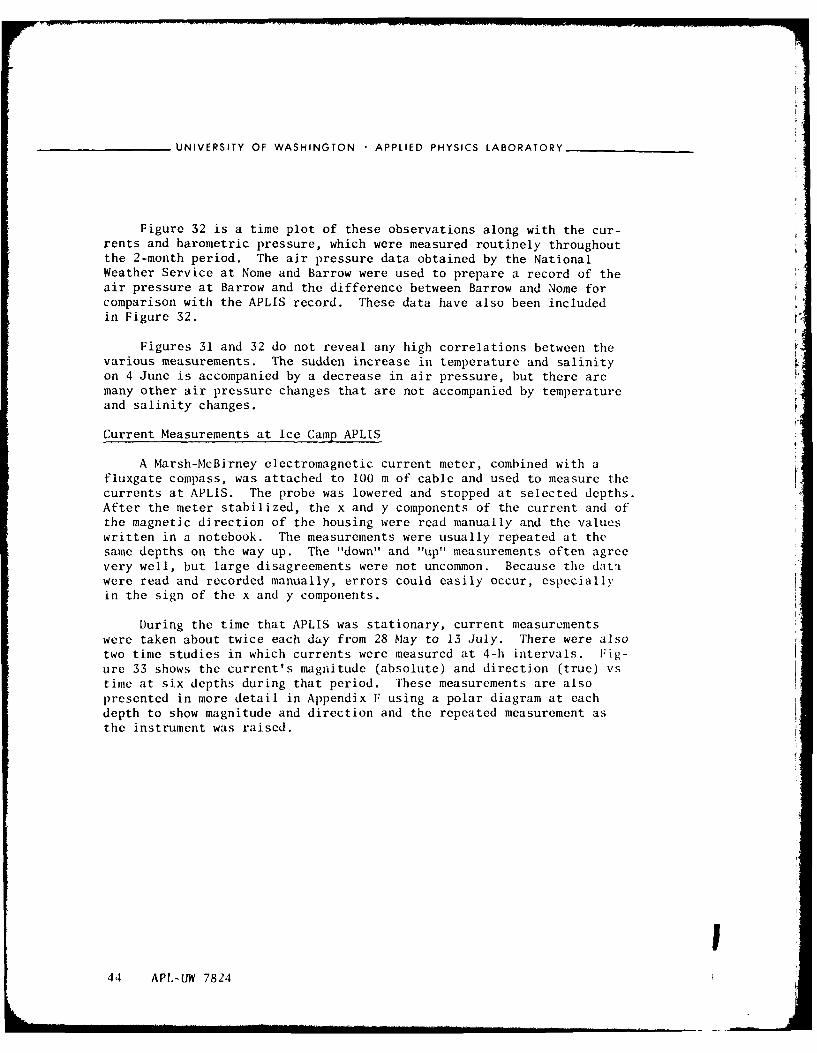
Figure 32 is a time plot of these observations along with the cur-
rents and barometric pressure, which were measured routinely throughoutthe 2-month period. The air pressure data obtained by the NationalWeather Service at Nome and Barrow were used to prepare a record of theair pressure at Barrow and the difference between Barrow and Nome forcomparison with the APLIS record. These data have also been includedin Figure 32.
Figures 31 and 32 do not reveal any high correlations between thevarious measurements. The sudden increase in temperature and salinityon 4 June is accompanied by a decrease in air pressure, but there aremany other air pressure changes that are not accompanied by temperatureand salinity changes.
Current Measurements at Ice Camp APLIS
A Marsh-McBirney electromagnetic current meter, combined with a
fluxgate compass, was attached to 100 m of cable and used to measure thecurrents at APLIS. The probe was lowered and stopped at selected depths.After the meter stabilized, the x and y components of the current and ofthe magnetic direction of the housing were read manually and the valueswritten in a notebook. The measurements were usually repeated at thesame depths on the way up. The "down" and "up" measurements often agreevery well, but large disagreements were not uncommon. Because the datawere read and recorded manually, errors could easily occur, especiallyin the sign of the x and y components.
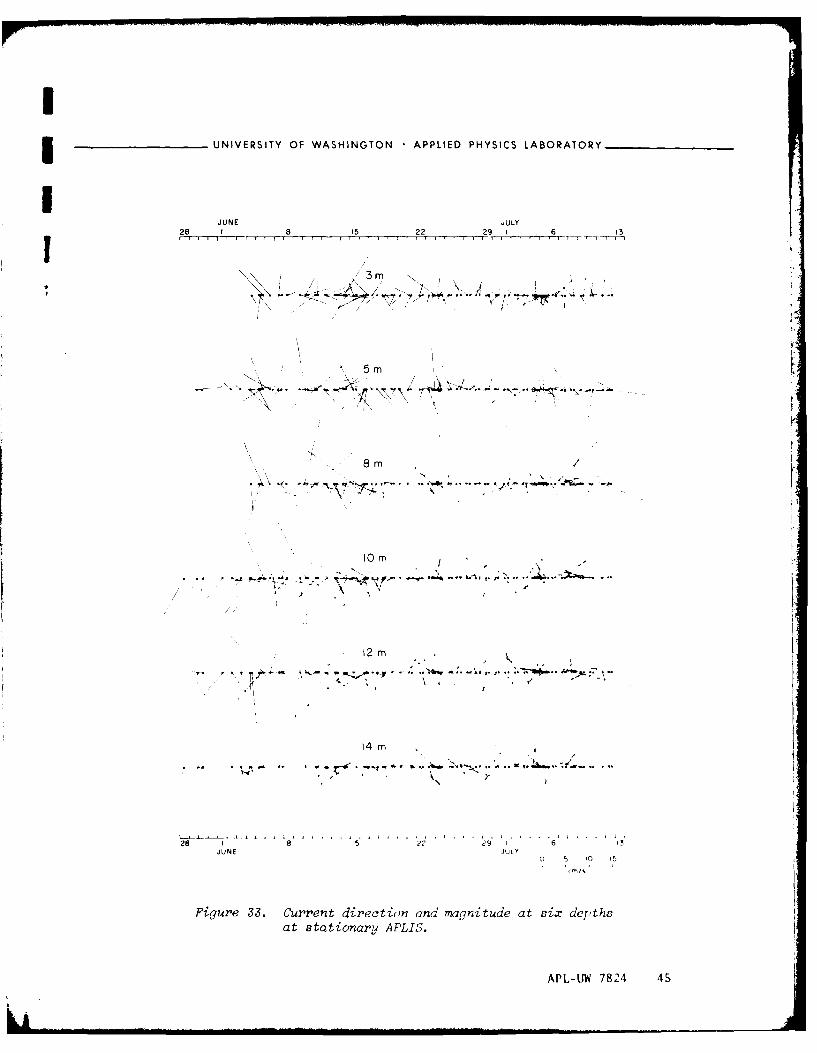
During the time that APLIS was stationary, current measurementswere taken about twice each day from 28 May to 13 July. There were alsotwo time studies in which currents were measured at 4-h intervals. Fig-
ure 33 shows the current's magnitude (absolute) and direction (true) vstime at six depths during that period. These measurements are alsopresented in more detail in Appendix F using a polar diagram at eachdepth to show magnitude and direction and the repeated measurement asthe instrument was raised.
444 APL-tUW 7824
i- UNIVERSITY OF WASHINGTON APPLIED PHYSICS LABORATORY
IJUNE JULY
28 1 8 15 22 29 I 6 13J n 'T r i - r-,- im-r'r
3m
' m
5m
''K
lOin
28 8 .. 2 2 6 3JUNE JULY
Ut./z0
Figure 33. Current direction and magnitude at six depthsat stationary APLIS3.
APL-UW 7824 45
UNIVERSITY OF WASHINGTON APPLIED PHYSICS LABORATORY,
The north-south component of the current at 14 m has been plottedfor comparison with other variables in Figure 32.
During the time series on 23 and 24 June, the current appeared torotate. A plot of the current direction during this time was shown inFigure 27 for depths of 10, 12, and 14 m. When the up and down measure-ments were greatly different, an average was plotted. A least-squaresfit of these points to a straight line gives a rotation of 301°/dayand 294°/day, respectively, for the 12 and 14 m depths during the 3-dayperiod. (The standard deviation of the current direction from theselines is 35'.) This seems to indicate some kind of eddy motion such asthat detected in the deeper areas of the Arctic 10 in 1972. In thatstudy, a clockwise rotation of 318°/day was observed (Event No. 2); thisis in very close agreement with our findings and indicates the possibilitythat we were also observing some effects of baroclinic eddies.
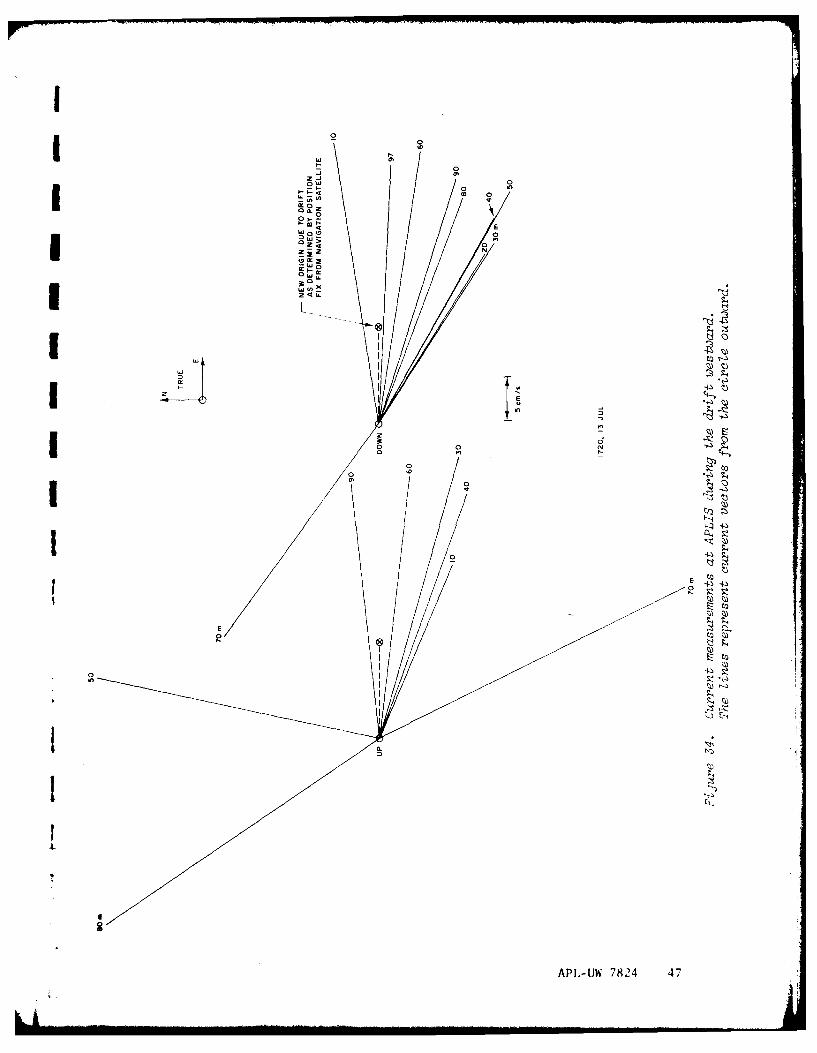
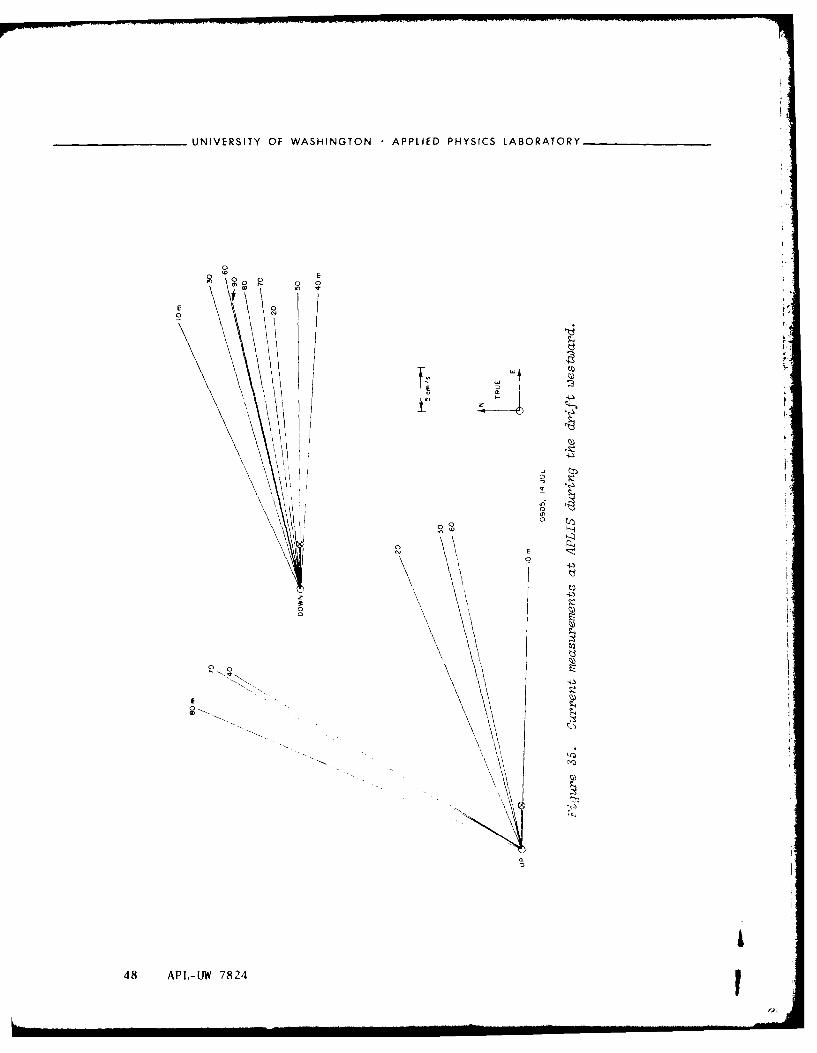
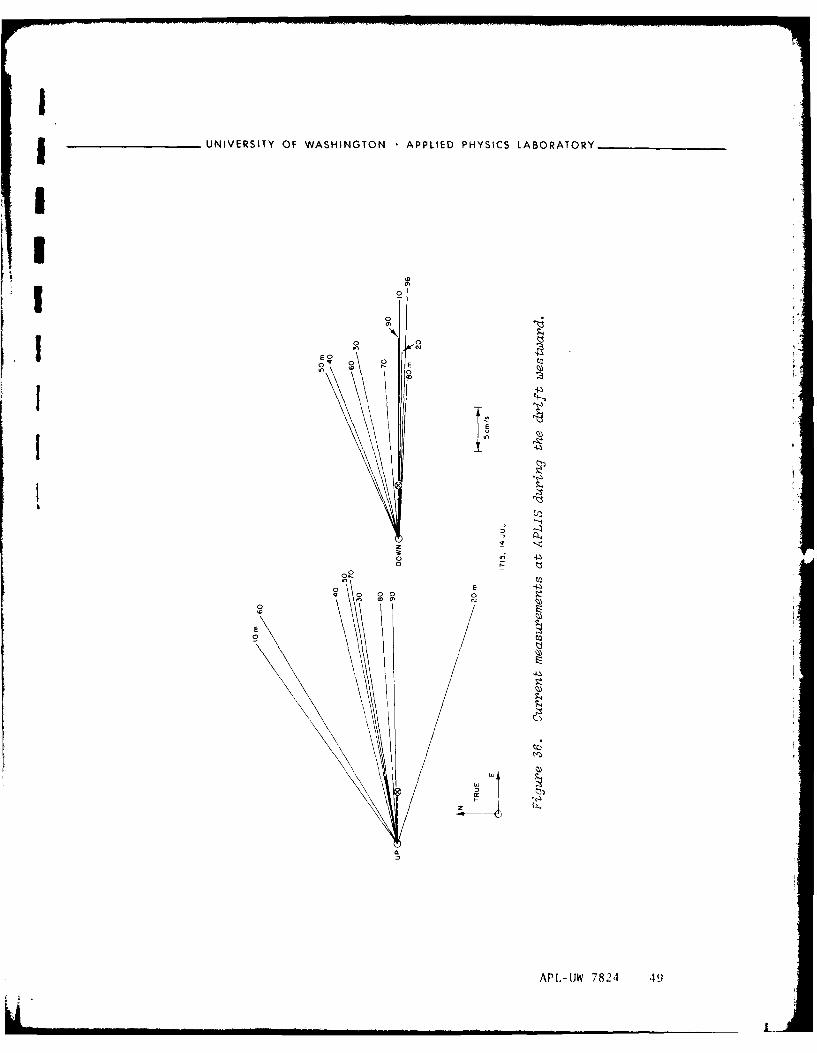
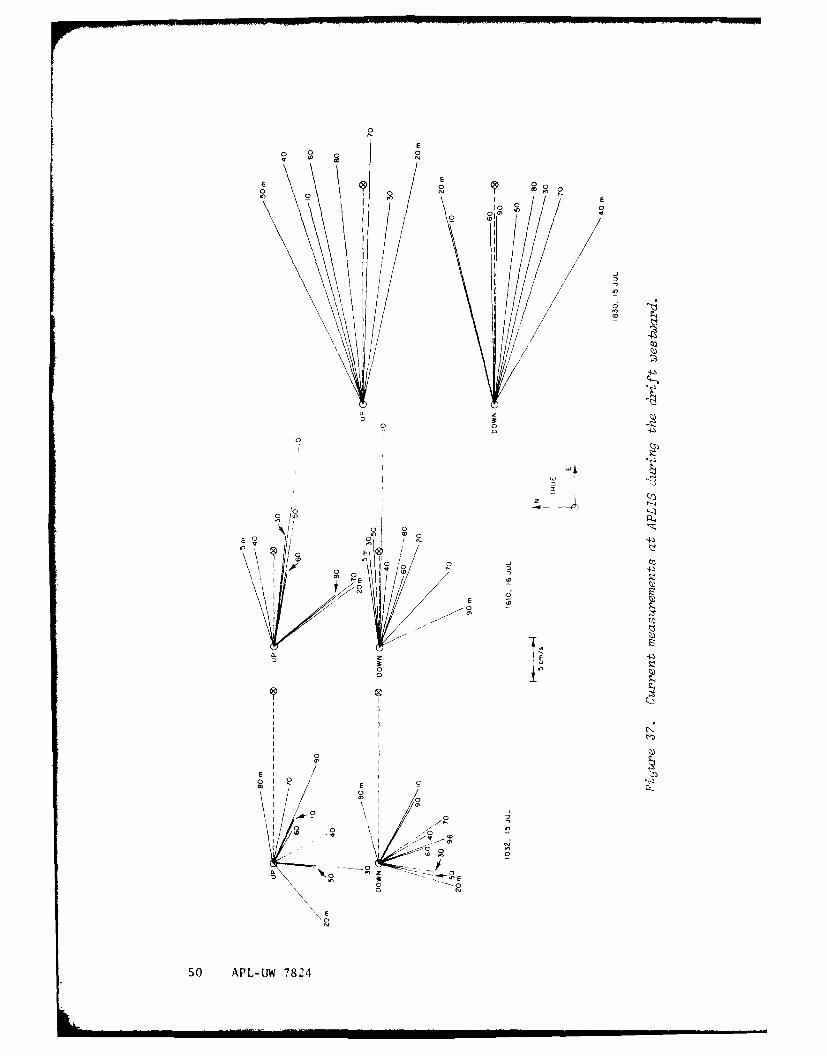
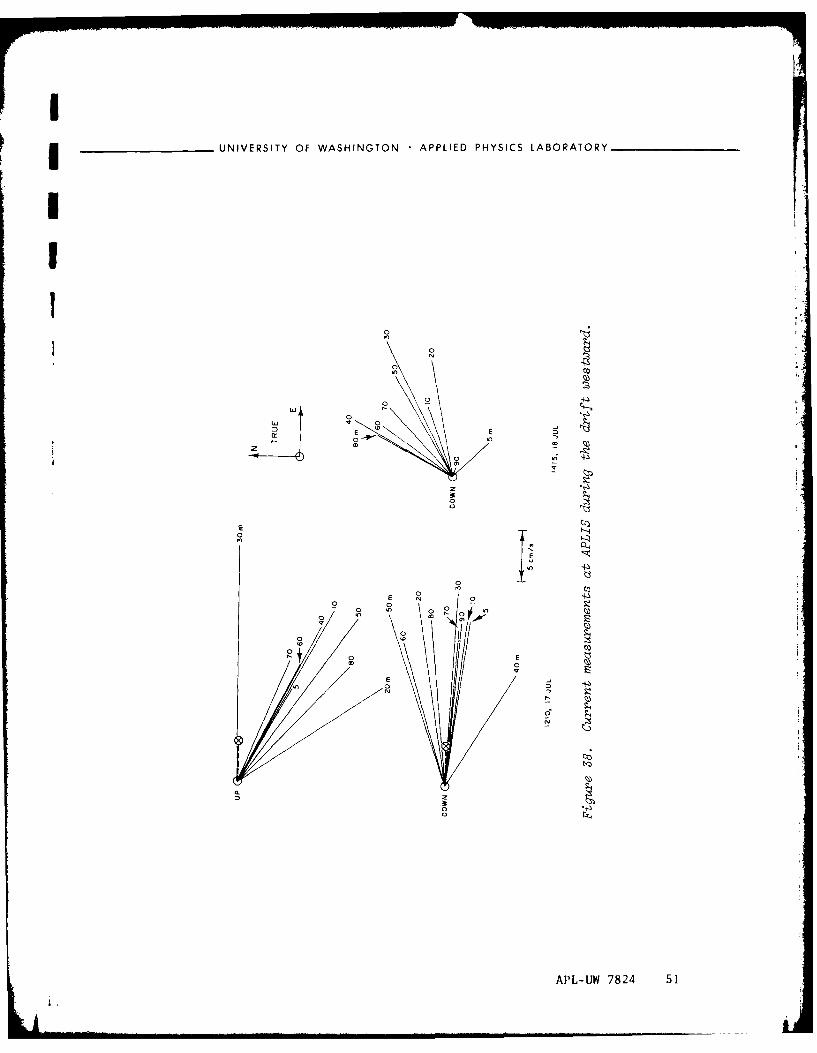
Figures 34-38 are plots of the currents measured after APLIS beganto drift westward. These measurements are all relative to the floe. Ifthe drift rate and tracl .. ie accurately known, we could determine theabsolute currents; however the jitter in the position data is so largethat only the average driit over I or 2 days is obtainable. In most ofthe plots, the relocation of the origin necessary to correct for thedrift velocity has been indicated. The vectors, however, have not beendrawn because the drift is so inaccurately known.
Water-Sample Analysis for Salinity and Oxygen
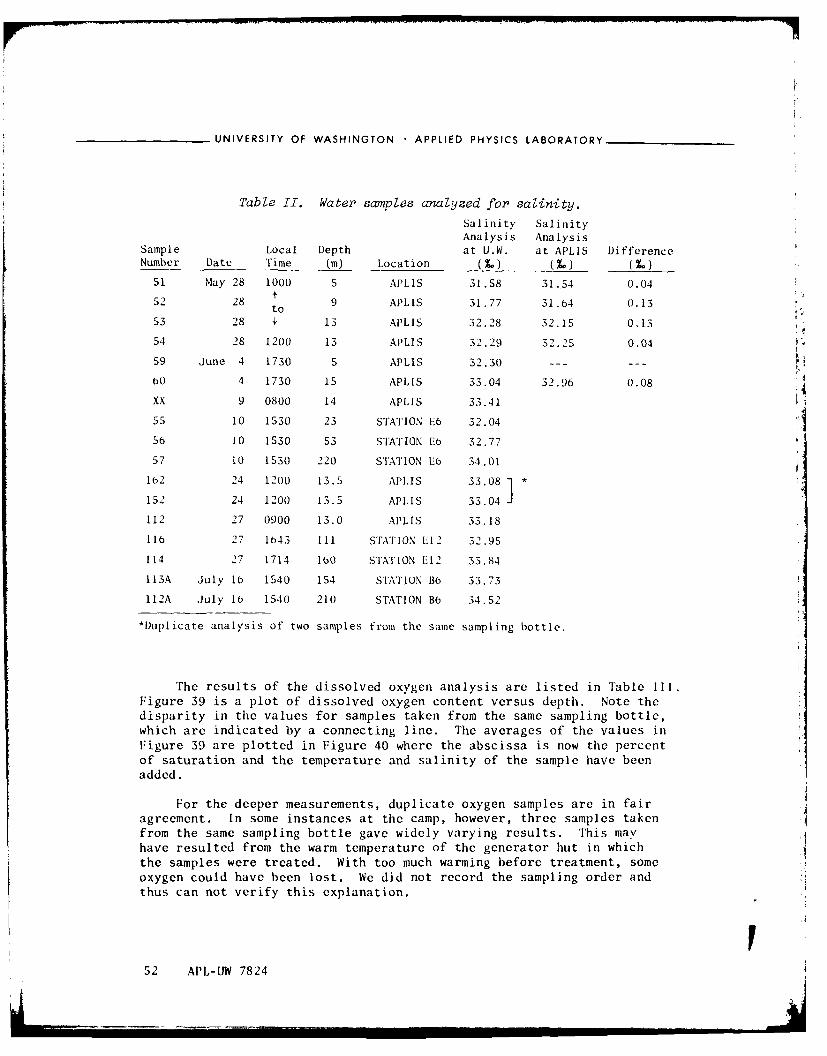
Water samples were occasionally taken at the i :amp and at thehelicopter stations. All oxygen samples were treat,: immediately tofix the oxygen content. These samples were returned to Seattle foranalysis at APL. Some of the salinity samples were analyzed at the icecamp; others were returned to the University of Washington for analysisin the Oceanography Department's laboratory. The results, listed inTable II, were used to check the calibration of tae conductivity cell ofthe CT) unit. As shown in the table, the analyses agreed with u.13%-.
4746 APLUW 782
Cc 0 za 019 0
1 0z<~
41iCT
APLIAJW 7824 47
_______________UNIVERSITY OF WASHINGTON APPLIED PHYSICS LABORATORY
00 w E
0 0r1
00
48 APL-UW 7824
j ~~~UNIVERSITY OF WASHINGTON APPLIED PHYSICS LABORATORY__________
0
z 0
0 0' E to
0
It 0 0 0E4.
0 to
API,-IW 7824 4 9
0
EE
0 0 100
01
ON 4
0 0
so AL-UW78-1
UNIVERSITY OF WASHINGTON APPLIED PHYSICS LABORATORY
0 t
FI
00
0 -n
0c
LPLU 782 01
UNIVERSITY OF WASHINGTON APPLIED PHYSICS LABORATORY
Table II. Water samples anaiyzed for salinity.
Salinity SalinityAnalysis Analysis
Sample Local Depth at U.W. at APLIS DifferenceNumber Date Time (m) Location (L) (Y) (L)
51 May 28 1000 5 APLIS 31.58 31.54 0.04
52 28 9 APLIS 31.77 31.64 0.13to
53 28 + 13 APLIS 32.28 32.15 0.13
54 28 1200 13 APLIS 32.29 32.25 0.04
S9 June 4 1730 5 APLIS 32.30 --- --
60 4 1730 15 APLIS 33.04 32.96 0.08.
XX 9 0800 14 APLIS 33.41
55 10 1530 23 STATION E6 32.04
56 10 1530 53 STATION E6 32.77
57 10 1530 220 STATION 136 34.01
162 24 1200 13.5 APLIS 33.08 1 *
152 24 1200 13.5 APLIS 33.04
112 27 0900 13.0 APLIS 33.18
116 27 1643 111 STATION E12 32.95
114 27 1714 160 STATION 112 33.84
113A July 16 1540 154 STATION B6 33.73
112A July lb 1540 210 STATION B6 34.52
*Duplicate analysis of two samples from the same sampling bottle.
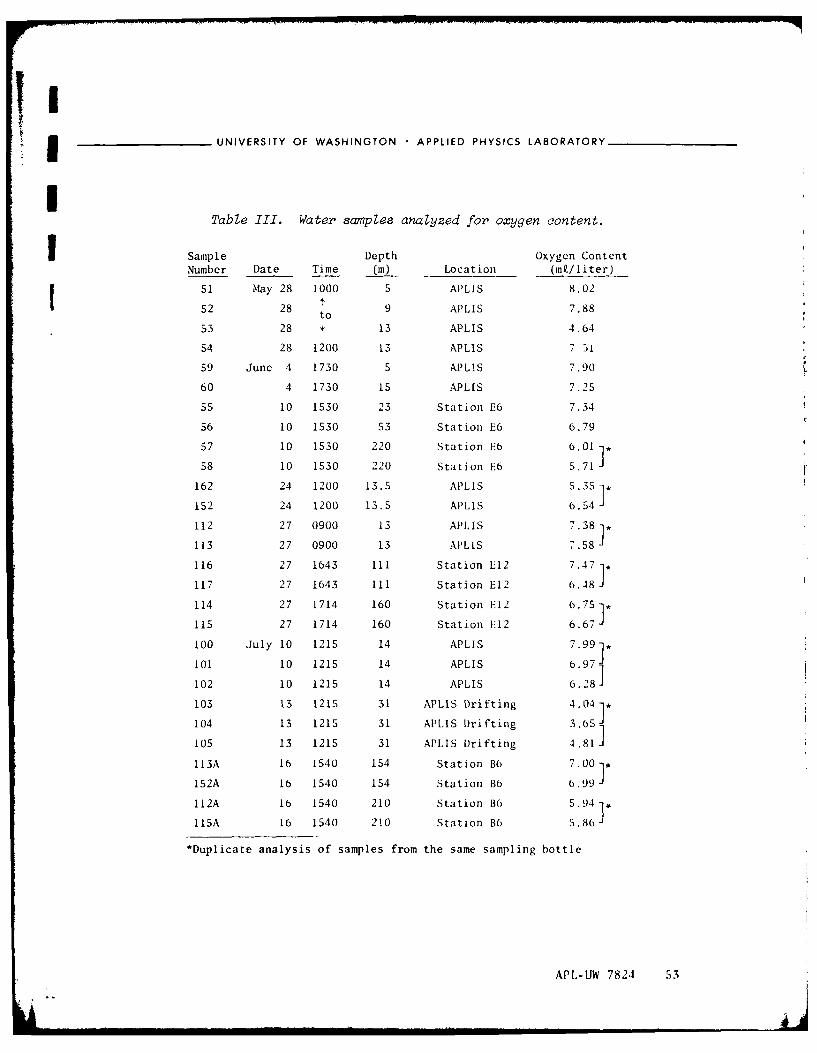
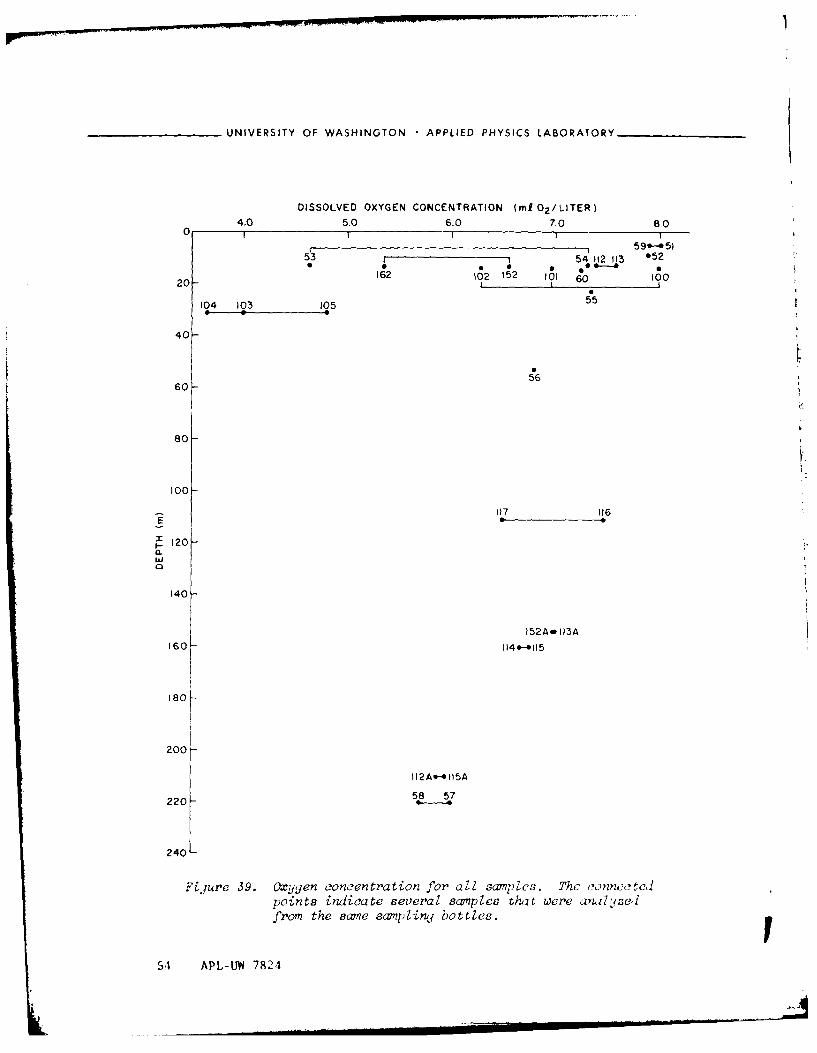
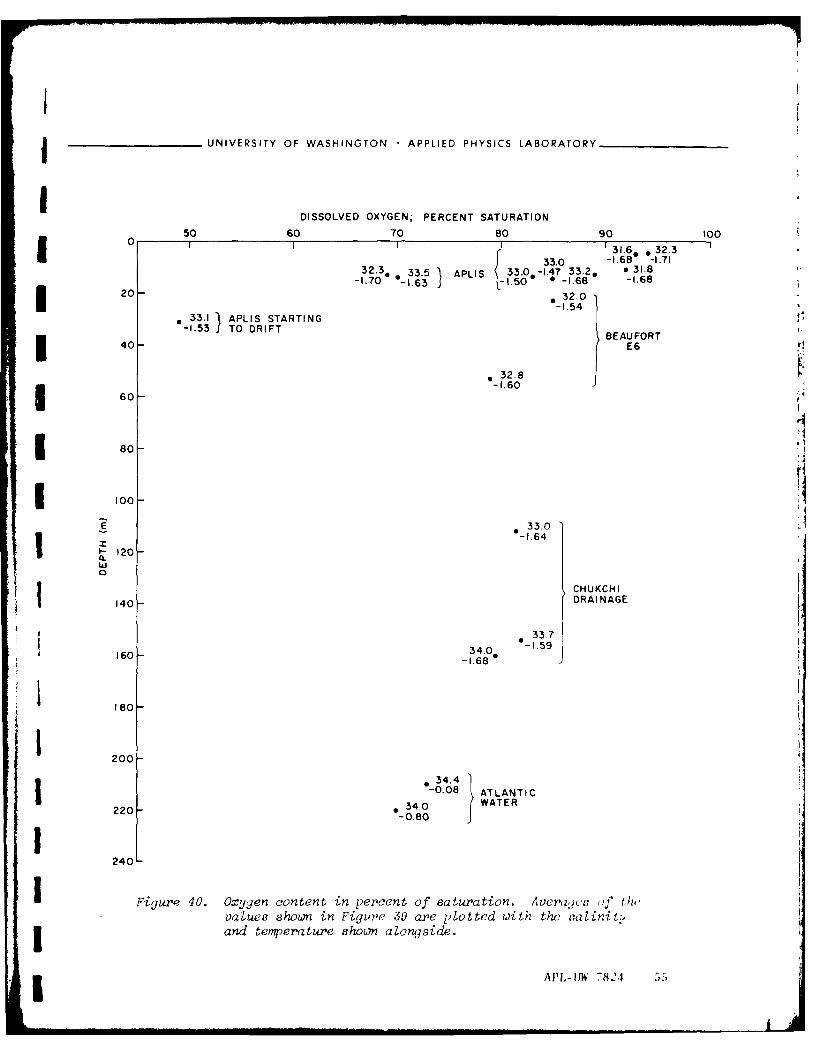
The results of the dissolved oxygen analysis are listed in Table III.Figure 39 is a plot of dissolved oxygen content versus depth. Note thedisparity in the values for samples taken from the same sampling bottle,which are indicated by a connecting line. The averages of the values inFigure 39 are plotted in Figure 40 where the abscissa is now the percentof saturation and the temperature and salinity of the sample have beenadded.
For the deeper measurements, duplicate oxygen samples are in fairagreement. In some instances at the camp, however, three samples takenfrom the same sampling bottle gave widely varying results. This may Ahave resulted from the warm temperature of the generator hut in whichthe samples were treated. With too much warming before treatment, someoxygen could have been lost. We did not record the sampling order andthus can not verify this explanation.
52 APL-UW 7824
__UNIVERSITY OF WASHINGTON APPLIED PHYSICS LABORATORY
I
Table III. Water sanples analyzed for oxygen content.
Sample Depth Oxygen Content
Number Date Time (m) Location (mk/liter)
51 May 28 1000 5 APLIS 8.0252 28 t 9 APLIS 7.88
to
53 28 + 13 APLIS 4.64
54 28 1200 13 APLIS 7 31
59 June 4 1730 5 APLIS 7.90
60 4 1730 15 APLIS 7.25
55 10 1530 23 Station E6 7.34
56 10 1530 53 Station E6 6.79
57 10 1530 220 Station E6 6.01
58 10 1530 220 Station E6 5.71
162 24 1200 13.5 APLIS 5.351*
152 24 1200 13.5 APLIS 6.54
112 27 0900 13 APLIS 7.381*
113 27 0900 13 APLIS 7.58'
116 27 1643 111 Station E12 7.471*
117 27 1643 il Station E12 6.48
114 27 1714 160 Station E12 6.751*
115 27 1714 160 Station E12 6.67
100 July 10 1215 14 APLIS 7.99]*
101 10 1215 14 APLIS 6.971
102 10 1215 14 APLIS 6.28]
103 13 1215 31 APLIS Drifting 4.04 j
104 13 1215 31 APLIS Drifting 3.65,
105 13 1215 31 APLIS Drifting 4.81]
113A 16 1540 154 Station B6 7.001,
152A 16 1540 154 Station B6 6.99 -
112A 16 1540 210 Station B6 5.941*
lISA 16 1540 210 Station B6 5.86
*Duplicate analysis of samples from the same sampling bottle
APL-UW 7821 53
UNIVERSITY OF WASHINGTON • APPLIED PHYSICS LABORATORY
DISSOLVED OXYGEN CONCENTRATION (mI 0 2 /LITER)
4.0 5.0 6.0 7.0 8.00 1 I
59-51
53 r 54 112 113 052
162 192 152 101 " - 10020 6010
0
104 103 105 55
40
5660
80
100
117 116
120
140
152Ae 113A
160 114"115
180-
200 -200 112 AS=- IISA
22-58 57220
2 4 0 L
Fijure 39. Oxygen concentration for all swnples. Thc oonneteJpoints indicate seVeral samples that were analyneifrom the same sampZirnj bottles.
54 APL-UW 7824
UNIVERSITY OF WASHINGTON APPLIED PHYSICS LABORATORY
DISSOLVED OXYGEN; PERCENT SATURATION
50 60 70 80 90 100C I 1 31.6 . 32.3
16" 33.0 -1.68 -1.7132.3. . APLIS 33.0 -1.47 33.20 * 31.81.70 13. PL 1.50* * -1.68 -1.68
20- 032.0-I.54
* 33.1 }APLIS STARTING 1-1.53 TO DRIFT
BE AU FORTI 40 E6
*32.8-. 60
60-
3 80-
100-
* 3300I 2 •-1.64
120 -
ILiJ0 CHUKCHI
140- DRAINAGE
33.7
160- 34.00 -I.59
-1.68
I 180-
200 -• 34.4
-0.08 ATLANTIC
220- *34. WATER-0.80
240
I Figure 40. Oxygen content in percent of saturation. Averaj'o uf th,oalues shown in Figure 39 are plotted with the aalinity
I and temperature shown alonqside.
SAPL,- 11W 7824 55
UNIVERSITY OF WASHINGTON • APPLIED PHYSICS LABORATORY .
The Atlantic water, which was obtained below 200 m, definitely hasa low oxygen content (about 70% of saturation). The cold drainage fromthe Chukchi Sea has a higher oxygen content (about 81% of saturation)which is, however, about the same as that at depths of 23 and 53 m atstation E6 beyond the canyon mouth (see Figur( 15). This is evidencethat the cold, deep water that we have labeled Chukchi drainage waterdid, indeed, come recently from the lower depths of the shallowerChukchi Sea.
The more consistent samples taken when APLIS was on the shallowshelf have a salinity near 32%. and an appreciably higher oxygen con-tent, more like surface water. Other samples show a low oxygen contentlike that of Atlantic water; the salinity of these samples is highenough to indicate Atlantic water, but the low temperature indicatesthat this water is drainage from the Chukchi Sea. Some of the lowoxygen values are considered unreliable, however, because of the largespread in the results for two samples from the same depth.
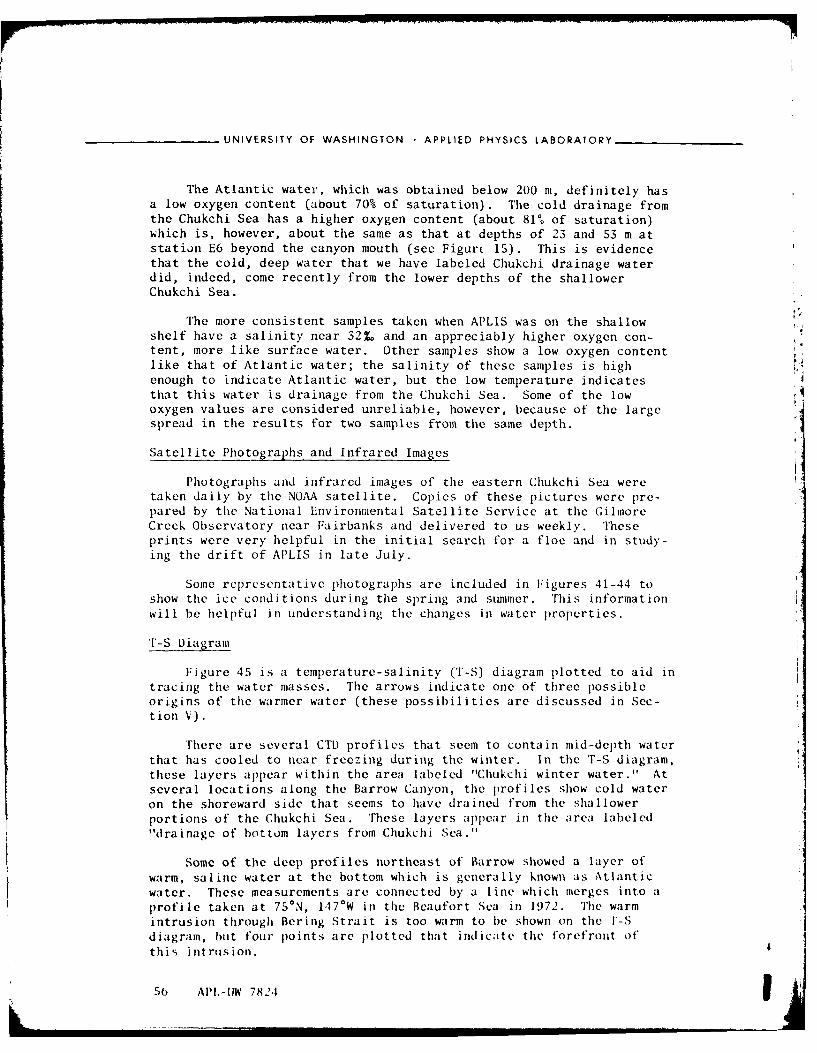
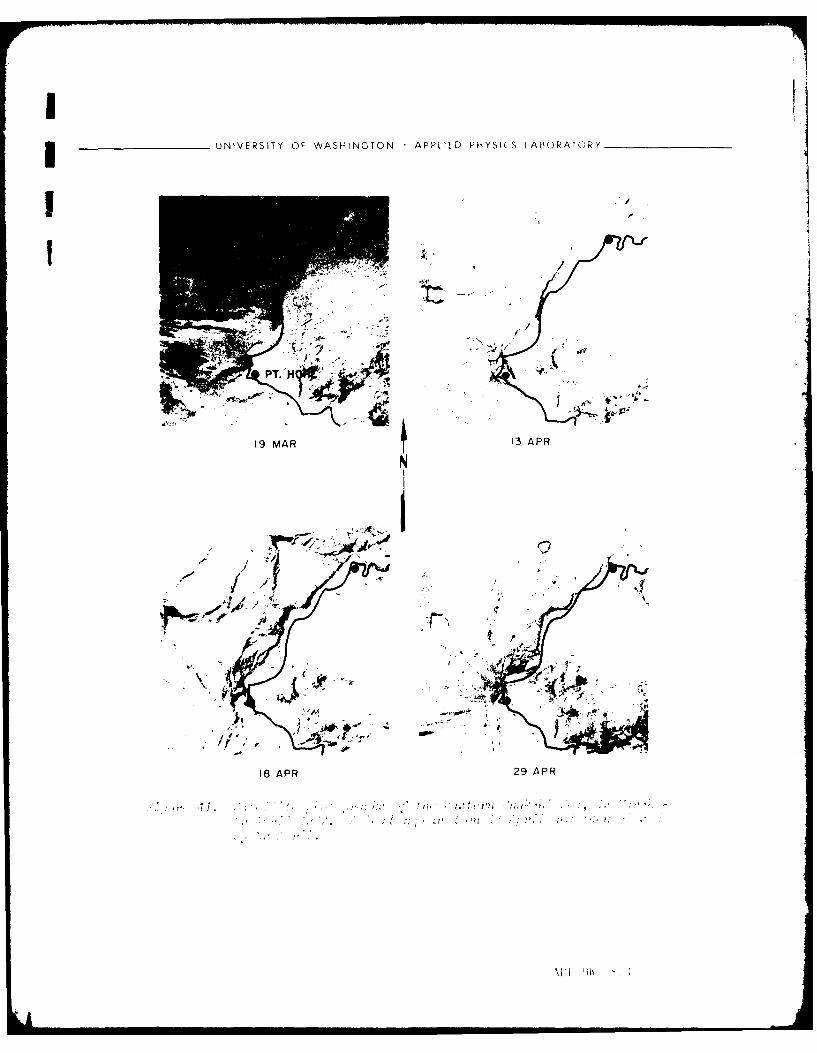
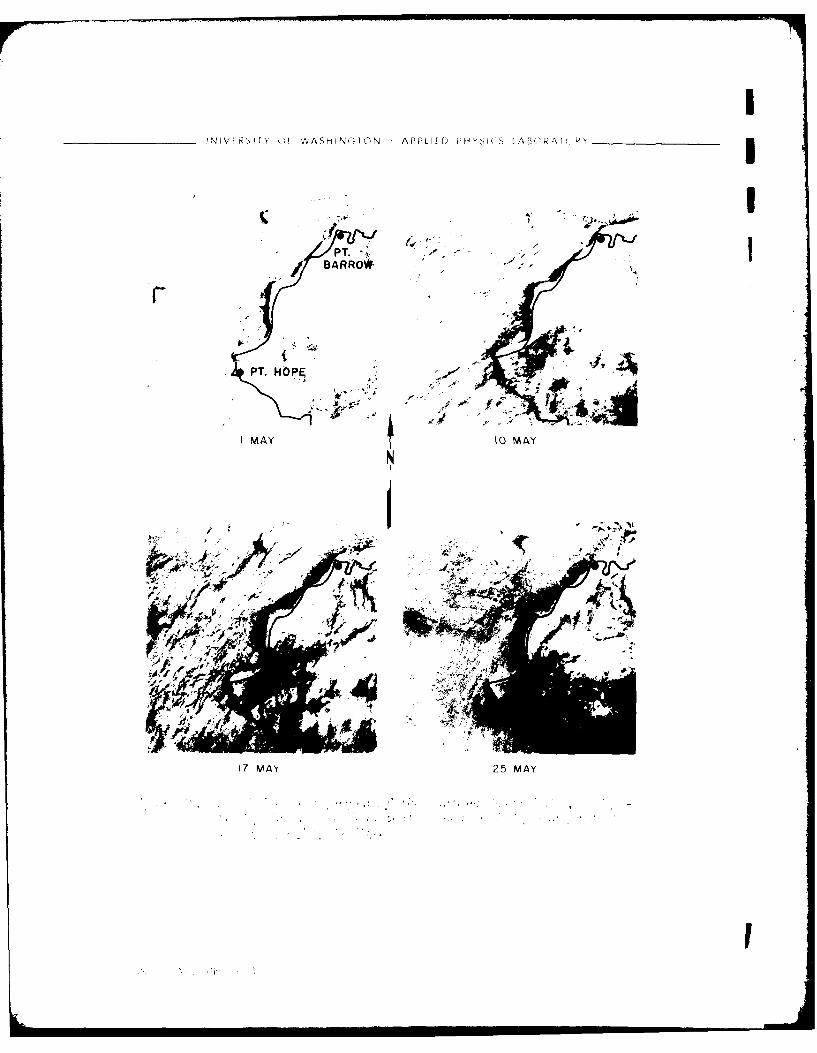
Satellite Photographs and Infrared Images
Photographs and infrared images of the eastern Chukchi Sea weretaken daily by the NOAA satellite. Copies of these pictures were pre-pared by the National Environmental Satellite Service at the GilmoreCreek Observatory near Fairbanks and delivered to us weekly. Theseprints were very helpful in the initial search for a floe and in study-ing the drift of APLIS in late July.
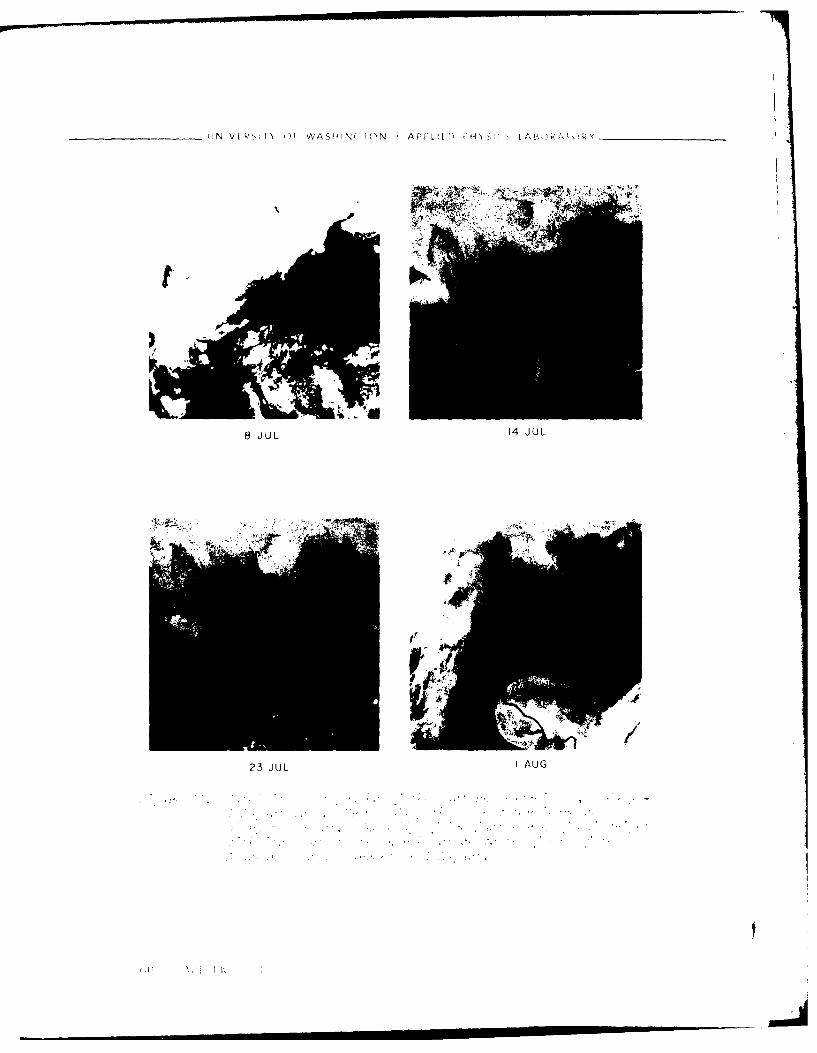
Some representative photographs are included in Figures 41-44 toshow the ice conditions during the spring and summer. This informationwill be helpful in understanding the changes in water properties.
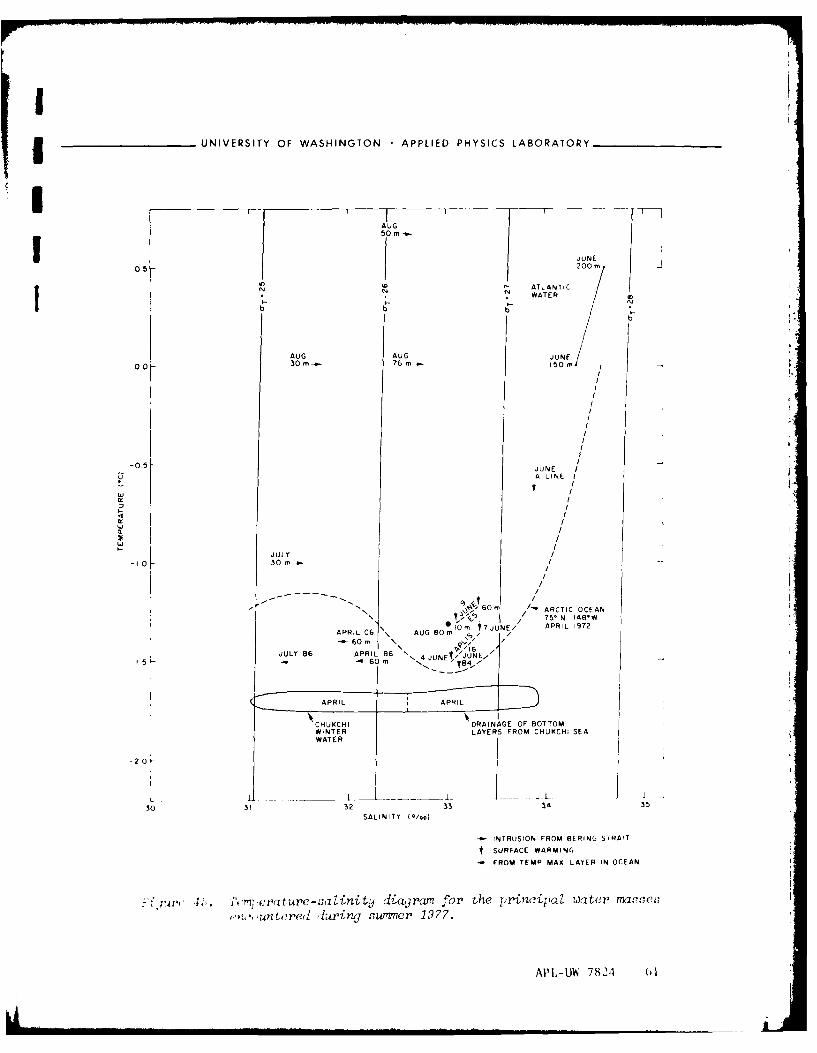
T-S Diagram
Figure 45 is a temperature-salinity (T-S) diagram plotted to aid intracing the water masses. The arrows indicate one of three possibleorigins of the warmer water (these possibilities are discussed in Sec-tion V).
There are several CTD profiles that seem to contain mid-depth waterthat has cooled to near freezing during the winter. In the T-S diagram,these layers appear within the area labeled "Chukchi winter water." Atseveral locations along the Barrow Canyon, the profiles show cold wateron the shoreward side that seems to have drained from the shallowerportions of the Chukchi Sea. These layers appear in the area labeled"drainage of bottom layers from Chukchi Sea."
Some of the deep profiles northeast of Barrow showed a layer ofwarm, saline water at the bottom which is generally known as Atlanticwater. These measurements are connected by a line which merges into aprofile taken at 750 N, 147 0W in the Beaufort Sea in 1972. The warmintrusion through Bering Strait is too warm to be shown on the T-Sdiagram, but four points are plotted that indicate the forefront ofthis intrusion.
56 APlI-IW 7824 1
________________UNIVERSITY OF WASHINGTON APPLIED PHYSICS [APORAIORY __________
NN
k>4
19 MAPR 29 APR
09 9
t N IV[ ,, SI Y U' ASH IN(; TON A PPLIEID P 11Y S S LA[P CRA P Y ___________
PT. IRBARRO*
PT. HOPE
I MAY 0O MAY
I V
7 MAY 25 MAY
_______________ N: vlg> I'Av'ykTON APPL IED PHYSICS LABORAT ORY
Io
8 JUN 1 U
8 JUN 29 JUN
1Al T..
8 JUL (4 JUL
23 JUL IAUG
IUNIVERSITY OF WASHINGTON APPLIED PHYSICS LABORATORY _
II -_
AUG
JUNE
0.5 200/
ATLANTIC
WATER
b b b
b
AUG AUG JUNE /
OO 30 m -6- 150 -
JUNE I0A LNE
JULY t I
-1 0 30 M'- /-
'I
60~ ARCTIC OCEAN7 75* N 4*C\61 A JU APRIL 1972
APRILC UNUEBr ~, /
-60r/JULY B6 APRIL 86 N t,'UNE/
-4 JUNE I/JUNE.,-15 5 NE60r 4 N N
APRIL APRIL
CHUKCHI ~DRAINAGE OF BOTTOMWINTER LAYERS FROM CHURCH; SEA
-20--WATER
LJ - ___ 1 --
30 3I 32 33 54 35
SALINITY I0/oc)
IINTRUSION FROM BERING STRAIT
SSURFACE WARMINGFROM TEMP MAX LAYER IN OCEAN
L ar 4;. ,'atur'-o2tinit diagram for the princip~al water maoe-itp,,,out#'TYd during su7Ner 1977.
APA-UW 7824 01
UNIVERSITY OF WASHINGTON • APPLIED PHYSICS LABORATORY
V. DISCUSSION
Many of the phenomena observed in 1977 were observed to some extentin previous years. 1-5 However, the new data allow a better understand-ing of the water movements and changes in properties. It appears thatsome of the explanations presented earlier for these phenomena mayrequire changes while others are reinforced. The following paragraphsdiscuss how the present measurements apply to phenomena observed andreported during the past few years.
Changes in the Coastal Shallows
In last year's report,5 we offered the following explanation forthe cold, saline bottom layers observed in the eastern Chukchi Sea:This type of water is created in the shallow areas of the Chukchi Seaduring winter when the surface freezes, with subsequent settling downslope. The shallower the area, the higher the salinity that will beproduced in the underlaying waters for a given amount of ice formation.High-salinity water formed in the shallows eventually moves by convec-tion beneath the existing waters and forms a bottom layer somewhat moresaline than the waters above.
During the helicopter surveys in April and June, we made a specialeffort to take stations very close to shore in an attempt to trace thismovement. Because helicopter support was unavailable in May, we wereunable to follow the process in detail, but we did observe some of thestages.
The CTD measurements in the shallow areas revealed some very highsalinities. The line off Icy Cape on 13 April (Figure 5) showed amaximum salinity of 32.8%. in 20 m of water near shore. On the samedate, the line off Pt. Franklin (Figure 6) showed a maximum salinityof 33.5%. for a thin bottom layer at station BI in the shallows nearPt. Franklin. The temperature was warmest along the bottom. At thistime, the area was ice covered with a break along the shore.
In 1975, a bottom layer was found that was warmer than the waterabove it. We have previously suggested4 that this warm bottom layermight have been formed by solar warming of the high-salinity coastalwater before it had settled and spread along the bottom of the Chukchi
Sea.
In April 1977, there was only a slight indication of warming.Figure 6 shows temperatures of -1.65'C along the bottom near Pt. Franklinon 13 April. The satellite photographs (Figures 41 and 42) show that
the area remained ice covered, except for breaks along the shore, throughApril. In May the ice movcd away leaving a wide, open area along thecoast, which remained open through the month.
662 APIL-Iih 782
I_ _ _ _ _ UNIVERSITY OF WASHINGTON APPLIED PHYSICS LABORATORY _
The next measurements near Icy Cape (17 June, Figure 11) showedthat the entire 20 m of water had warmed to -1.50C and some of it to-0.5°C. The salinity of this water was mostly between 33.0 and 33.9%,.
Table 25 in The OceansI1 predicts a total radiation of 0.269 calcm-2 min -1 reaching the sea surface at 60°N in May. If we reduce thisfor the higher latitude and assume open water for 20 days, we obtainabout 5000 cal of radiation per square centimeter. Table 27 shows thatthe percentage of solar radiation reaching 1 m depth in the clearestoceanic water is 26.7%. If we assume that the heat absorbed in theupper I m is lost by back radiation, conduction to the atmosphere, andevaporation, the average temperature rise in 20 m of water due to theabsorption of the heat posing below 1 m would be approximately
(5000)(0.267) = 0.70C2000
Therefore, solar radiation could account for most of the temperaturerise from -1.7°C in April (Figure S) to -l.0°C in June (Figure 11) thatwas observed in the 20-m deep area along the coast at Icy Cape.
This warm saline water in the shallows would have a tendency tosettle down slope during the next few weeks. However, the measure-ments from the BURTON ISLAND in July showed no warm bottom layer.Although the process that we wished to document seems to have started,there was apparently too much mixing as the warm saline water settleddown slope to form a warm layer along the bottom as was observed in1975.
Chukchi Sea Drainage
In 19754 we observed large regions of cold water to depths of 180 Inoff the mouth of the Barrow Canyon. We corroborated the suggestion byPaquette and Bourke 1 2 that this water represents drainage from theChukchi Sea via the Barrow Canyon.
In 19765 the path of the drainage in April was followed fromWainwright into the Arctic Ocean well beyond the canyon's mouth. \tthat time, the drainage held to the shoreward side of the canyon.
The 1977 measurements showed a uniform layer along the bottom onthe shoreward side of the canyon in April, but the salinity was not veryhigh (32.75 Lo. By the middle of June, the entire water mass off IcyCale had a salinity of 33.2 to 33.8% (Figure 11). Off 11t. Franklin,almost the entire water mass between the shore and the canyon was at33.2Lo (Figure 12). It appears that in June a large accumulation of thehigh-salinity water was moving toward the ocean while remaining closeagainst the coast. Some of this flow was evident off I't. Barrow(Fi gu rc I.).
API,-IIW 7821 O,3
A.|
UNIVERSITY OF WASHINGTON APPLIED PHYSICS LABORATORY
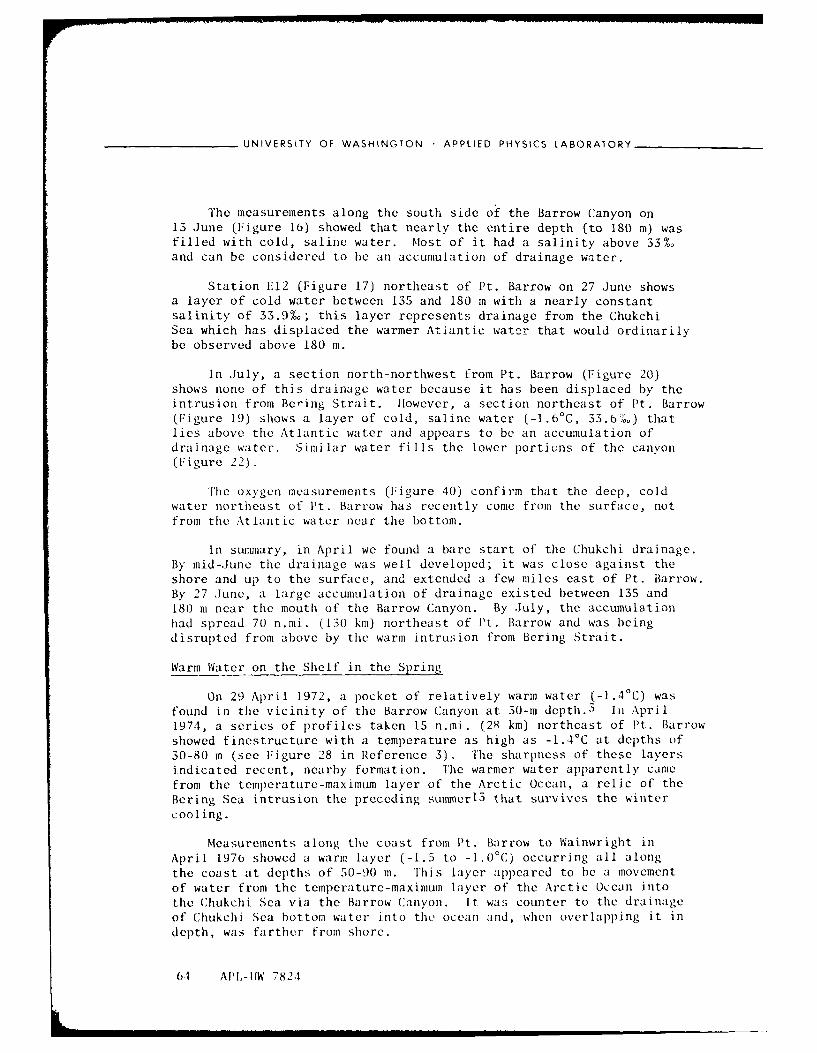
The measurements along the south side of the Barrow Canyon on13 June (Figure 16) showed that nearly the entire depth (to 180 m) wasfilled with cold, saline water. Most of it had a salinity above 33%and can be considered to be an accumulation of drainage water.
Station 1'12 (Figure 17) northeast of Pt. Barrow on 27 June showsa layer of cold water between 135 and 180 in with a nearly constantsalinity of 33.9L; this layer represents drainage from the ChukchiSea which has displaced the warmer Atlantic water that would ordinarilybe observed above 180 m.
In July, a section north-northwest from Pt. Barrow (Figure 20)shows none of this drainage water because it has been displaced by theintrusion from Bering Strait. However, a section northeast of Pt. Barrow(Figure 19) shows a layer of cold, saline water (-1.6 0 C, 33.b%,) thatlies above the Atlantic water and appears to be an accumulation ofdrainage water. Similar water fills the lower portions of the canyon(Figure 22).
The oxygen measurements (Figure 40) confirm that the deep, coldwater northeast of Pt. Barrow has recently come from the surface, notfrom the Atlantic water near the bottom.
In summary, in April we found a bare start of the Chukchi drainage.By mid-June the drainage was well developed; it was close against theshore and up to the surface, and extended a few miles east of Pt. Barrow.By 27 June, a large accumulation of drainage existed between 135 and180 m near the mouth of the Barrow Canyon. By July, the accumulationhad spread 70 n.mi. (130 kin) northeast of Pt. Barrow and was beingdisrupted from above by the warm intrusion from Bering Strait.
Warm Water on the Shelf in the Spring
On 29 April 1972, a pocket of relatively warm water (-1.4 0C) wasfound in the vicinity of the Barrow Canyon at 30-m depth.3 In April
1974, a series of profiles taken 15 n.mi. (28 km) northeast of Pt. Barrowshowed finestructure with a temperature as high as -1.4°C at depths of30-80 m (see Figure 28 in Reference 3). The sharpness of these layersindicated recent, nearby formation. The warmer water apparently camefrom the temperature-maximum layer of the Arctic Ocean, a relic of theBering Sea intrusion the preceding summerl3 that survives the wintercooling.
Measurements along the coast from Pt. Barrow to Wainwright in
April 1976 showed a warm layer (-1.5 to -1.00 C) occurring all along
the coast at depths of 50-90 m. This layer appeared to be a movementof water from the temperature-maximum layer of the Arctic Ocean intothe Chukchi Sea via the Barrow Canyon. It was counter to the drainageof Chukchi Sea bottom water into the ocean and, when overlapping it indepth, was farther from shore.
61 A1I,-IW 7824
IUNIVERSITY OF WASHINGION - APPLIED PHYSICS LABORATORY _
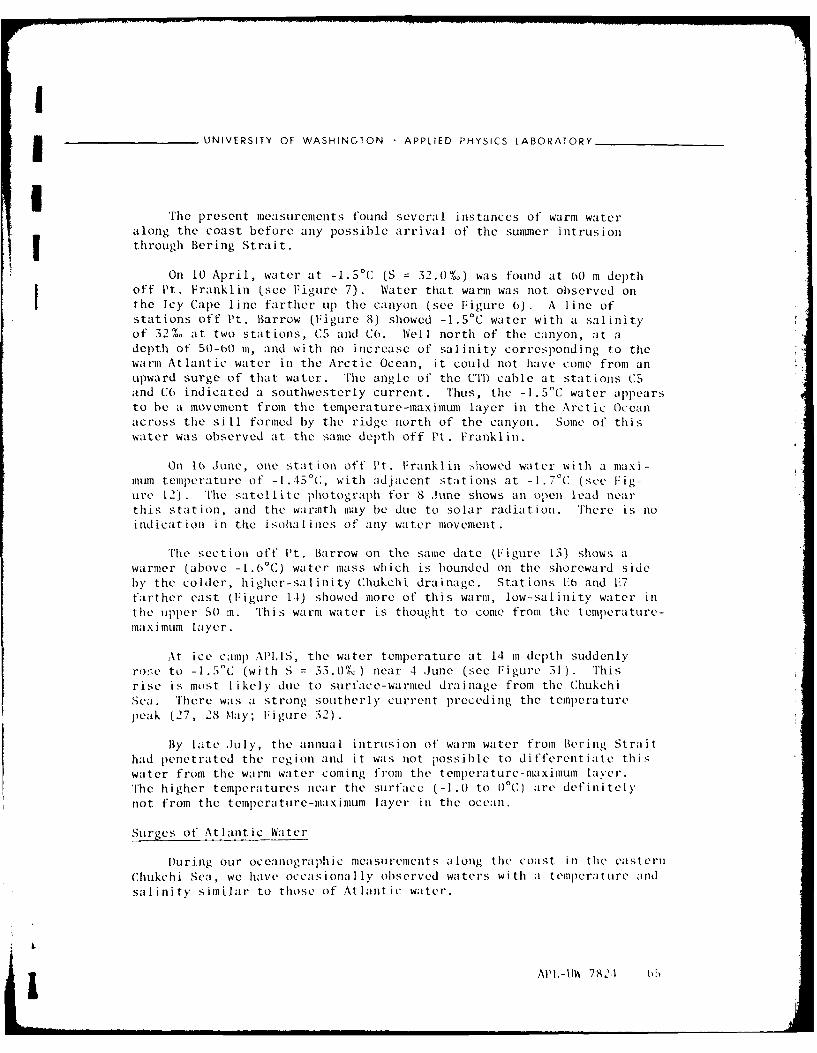
'File present measurements found several instances of warm wateralong the coast before any possible arrival of the summer intrusionthrough Bering Strait.
On 10 April, water at -1.5 0 C (S = 32.0%.) was found at 00 in depthoff Pt. Franklin (see Figure 7). Water that warm was not observed onthe Icy Cape line farther up the canyon (see Figure 6). A line ofstations off Pt. Barrow (Figure 8) showed -1.S°C water with a salinityof 32%. at two stations, CS and Co. Well north of the canyon, at adepth of SO-60 in, and with no increase of salinity corresponding to thewarim Atlantic water in the Arctic Ocean, it could not have cone from anupward surge of that water. The angle of the C'I) cable at stations CSand C6 indicated a southwesterly current. Thus, the -1.5C water appearsto be a movement from tile temperature-maximun layer in the Arctic Oceanacross the sill formed by the ridge north of the canyon. Some of thiswater was observed at the same depth off Pt. Franklin.
On 16 June, one station off Pt . Franklin showed water with a maxi-mum temlperature of -I.45°C, with adjacent stations at -1.70C (see Fig-ure 12) . The satellite photograph for 8 June shows an open lead nearthis station, and the warmth may be due to solar radiation. There is noid ication in the isohaliles of any water movement.
The section off Pt. Barrow on the same date (Figure 13) shows awarmer (above -I.0 °C) water mass which is bounded on the shoreward sideby the colder, higher-salinity Chukchi drainage. Stations 1:6 and [7farther east (Figure 1.1) showed more of this warm, low-salinity water inthe upper 50 in. This warm water is thought to come from the temperature-maximum layer.
At ice camp APLIS, the water temperature at 14 i depth suddenlyro:'e to -1.5 C (with S = 33.0%1 near 4 ,June (see Figure 31). Thisrise is most likely due to surface-wa rmed drainage from the ChukchiSea. There was a strong southerly current preceding the temperaturepeak (27, 28 May; Figure 32).
By late .July, the annual intrusion of warm water from Bering Straithad penetrated the region and it was not possible to differentiate thiswater from the warm water coming from the temperature-maximum layer.The higher temperatures near the surface (-1.0 to O0 C) are definitelynot from the temlprature-maximum layer in the ocean.
Surges of Atlantic Water
During our oceanographic mneasurements along the coast in the easternChukchi Sea, we have occasionally observed waters with a temperature andsalinity similar to those of Atlantic water.
.IA.L-li W 7821
UNIVERSITY OF WASHINGTON • APPLIED PHYSICS LABORATORY
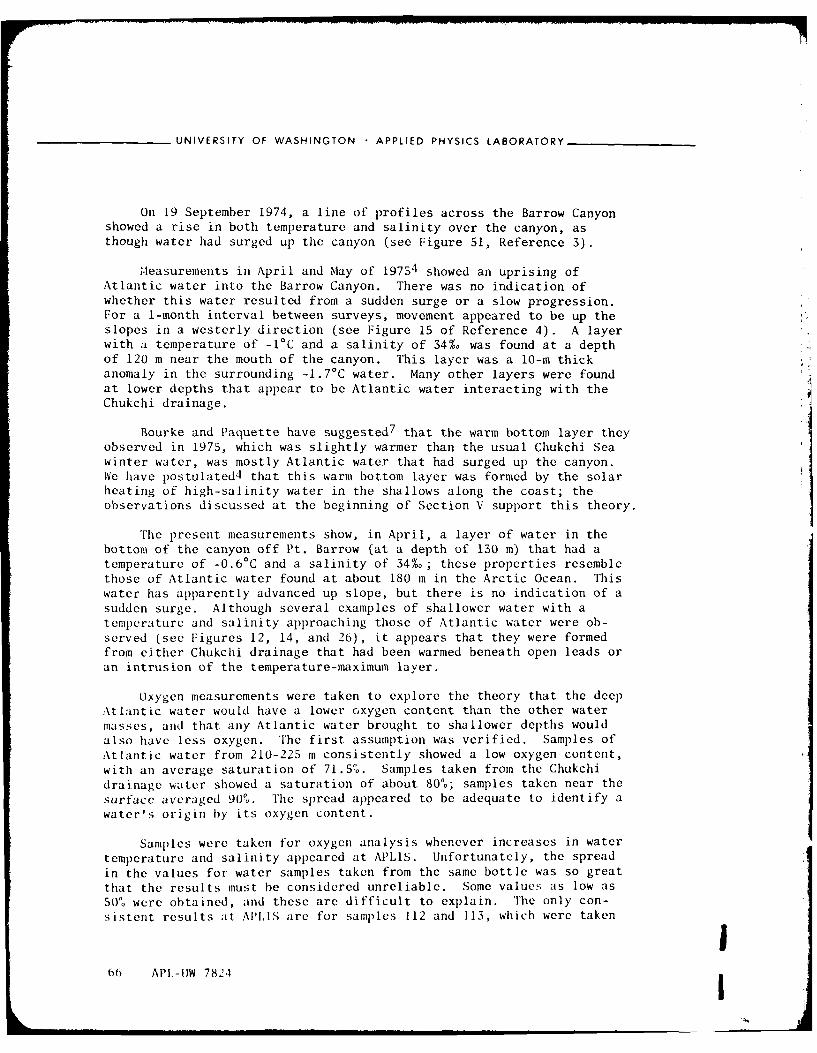
On 19 September 1974, a line of profiles across the Barrow Canyonshowed a rise in both temperature and salinity over the canyon, asthough water had surged up the canyon (see Figure 51, Reference 3).
Measurements in April and May of 19754 showed an uprising ofAtlantic water into the Barrow Canyon. There was no indication ofwhether this water resulted from a sudden surge or a slow progression.For a 1-month interval between surveys, movement appeared to be up theslopes in a westerly direction (see Figure 15 of Reference 4). A layerwith a temperature of -1°C and a salinity of 34% was found at a depthof 120 m near the mouth of the canyon. This layer was a 10-m thickanomaly in the surrounding -1.7°C water. Many other layers were foundat lower depths that appear to be Atlantic water interacting with theChukchi drainage.
Bourke and Paquette have suggested7 that the warm bottom layer theyobserved in 1975, which was slightly warmer than the usual Chukchi Sea
winter water, was mostly Atlantic water that had surged up the canyon.We have postulated4 that this warm bottom layer was formed by the solarheating of high-salinity water in the shallows along the coast; theobservations discussed at the beginning of Section V support this theory.
The present measurements show, in April, a layer of water in thebottom of the canyon off Pt. Barrow (at a depth of 130 m) that had atemperature of -0.6°C and a salinity of 34%.; these properties resemblethose of Atlantic water found at about 180 m in the Arctic Ocean. This
water has apparently advanced up slope, but there is no indication of asudden surge. Although several examples of shallower water with atemperature and salinity approaching those of Atlantic water were ob-served (see Figures 12, 14, and 26), it appears that they were formedfrom either Chukchi drainage that had been warmed beneath open leads oran intrusion of the temperature-maximum layer.
Oxygen measurements were taken to explore the theory that the deepAtlantic water would have a lower oxygen content than the other water
masses, and that any Atlantic water brought to shallower depths wouldalso have less oxygen. The first assumption was verified. Samples ofAtlantic water from 210-225 m consistently showed a low oxygen content,with an average saturation of 71.5%. Samples taken from the Chukchidrainage water showed a saturation of about 80%; samples taken near thesurface averaged 90%. The spread appeared to be adequate to identify awater's origin by its oxygen content.
Samples were taken for oxygen analysis whenever increases in watertemperature and salinity appeared at APLIS. Unfortunately, the spread
in the values for water samples taken from the same bottle was so greatthat the results must be considered unreliable. Some values as low as50 were obtained, and these are difficult to explain. The only con-
sistent results at AIAIS are for samples 112 and 113, which were taken
666 API,-OW 7824I
__ _ _ _ UNIVERSITY OF WASHINGTON • APPLIED PHYSICS LABORATORY -
from water with a temperature and salinity similar to those of Atlanticwater at a time that coincided with southerly currents and low airpressure. These samples show an average oxygen saturation of 88%, toohigh for this to be Atlantic water.
VI. REFERENCES
I. G.R. Garrison and E.A. Pence, "Studies in the Marginal Ice Zoneof the Chukchi and Beaufort Seas: A Report on Project MIZPAC-71B,"
APL-UW 7223, Applied Physics Laboratory, University of Washington,Seattle, Washington (,January 1973).
2. G.R. Garrison, F.A. Pence, II.R. Feldman, and S.R. Shah, "Studies inthe Marginal Ice Zone of the Chukchi Sea: Analysis of 1972 Data,"APL-UW 7311, Applied Physics Laboratory, University of Washington,Seattle, Washington (March 1974).
3. ;.R. Garrison and 1P. Becker, "Marginal Ice Zone OceanographicMesurements: Bering and Chukchi Seas, 1973 and 1974," APL-UW7505, Applied Physics Laboratory, University of Washington,Seattle, Washington (September 1975).
4. G.R. Garrison, "Chukchi Sea Oceanography: 1975 Measurements anda Review of Coastal Current Properties," APL-UW 7614, AppliedPhysics Laboratory, University of Washington, Seattle, Washington,(November 1976).
5. ;.R. Garrison, "Oceanographic Measurements in the Chukchi Sea andBaffin Bay--1976," APL-UW 7710, Applied Physics Laboratory,University of Washington, Seattle, Washington (October 1977).
6. (;.R. Garrison and P. Becker, "The Barrow Canyon: A Drain for theChukchi Sea," I. Geophys. Res., 81: 4445-4453 (1976).
7. R.11. Bourke and R.G. Paquette, "Atlantic Water on the ChukchiShelf," Geophys. Res. Lett., 3: 629-632 (1976).
8. P. Becker, "Light Aircraft i)eployable ClI) System," STI) Conferenceand Workshop Proceedings, Plessey Environmental Systems, San Diego,
California (February 1975).
9. R.G. Paquette and R.11. Bourke, "The Oceanographic Cruise of tileUSC(;C BURTON ISLANI) to the Marginal Sea-Ice Zone of the ChukchiSea--MIZPAC 77," NP6S18-78-001, Naval Postgraduate School, Monterey,California (February 1978).
APL- 11W 7824 (7
. . . .- ' " . . . . . .. . . .. I II I II I I
UNIVERSITY OF WASHINGTON APPLIED PHYSICS LABORATORY
10. J.L. Newton, K. Aagaard, and L.K. Coachman, "Baroclinic Eddiesin the Arctic Ocean," Deep-Sea Res., 21: 707-719 (1974).
11. I.U. Sverdrup, M.W. Johnson, and R.H. Fleming, The Oceans, Prentice-Hall, New York, 1087 pp. (1942).
12. R.G. Paquette and R.H. Bourke, "Observations on the Coastal Currentof Arctic Alaska," J. Mar. Res., 32(2): 195 (1974).
r
13. L.K. Coachman and C.A. Barnes, "The Contribution of Bering SeaWater in the Arctic Ocean," Arctic, 14(3): 147-161 (1961).
68 APL-tJW 7824
Ir
I~r
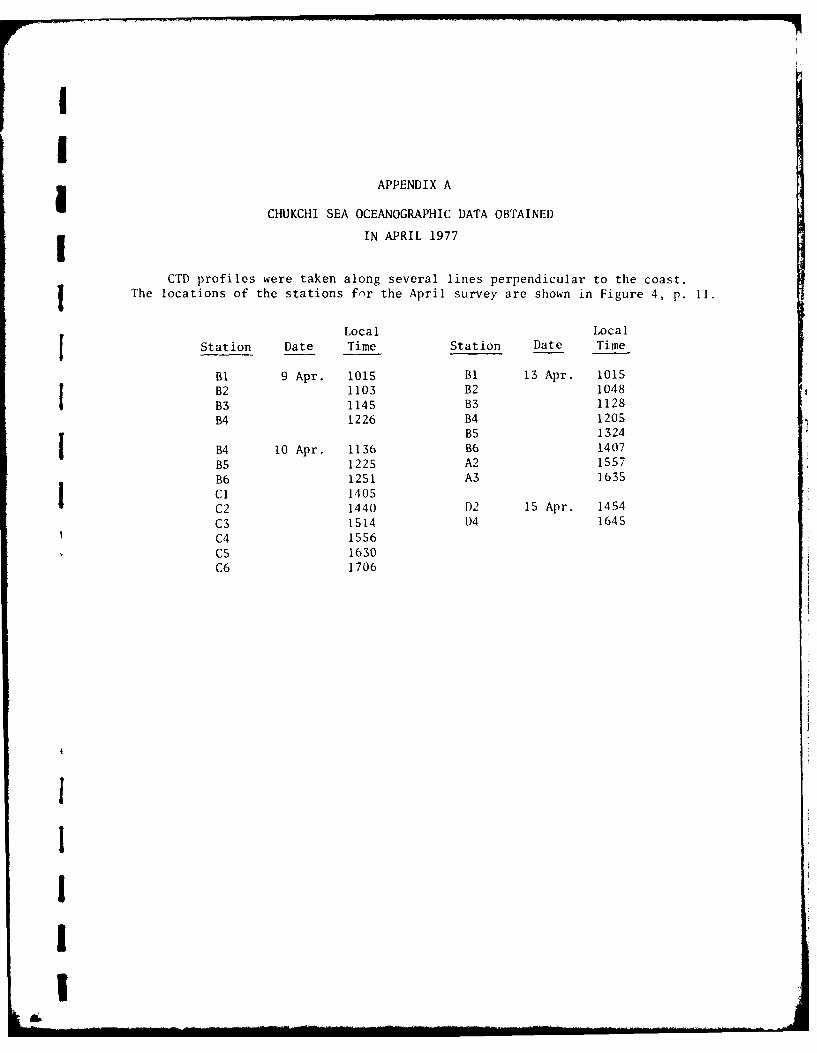
I APPENDIX A
CHUKCHI SEA OCEANOGRAPHIC DATA OBTAINED
I IN APRIL 1977
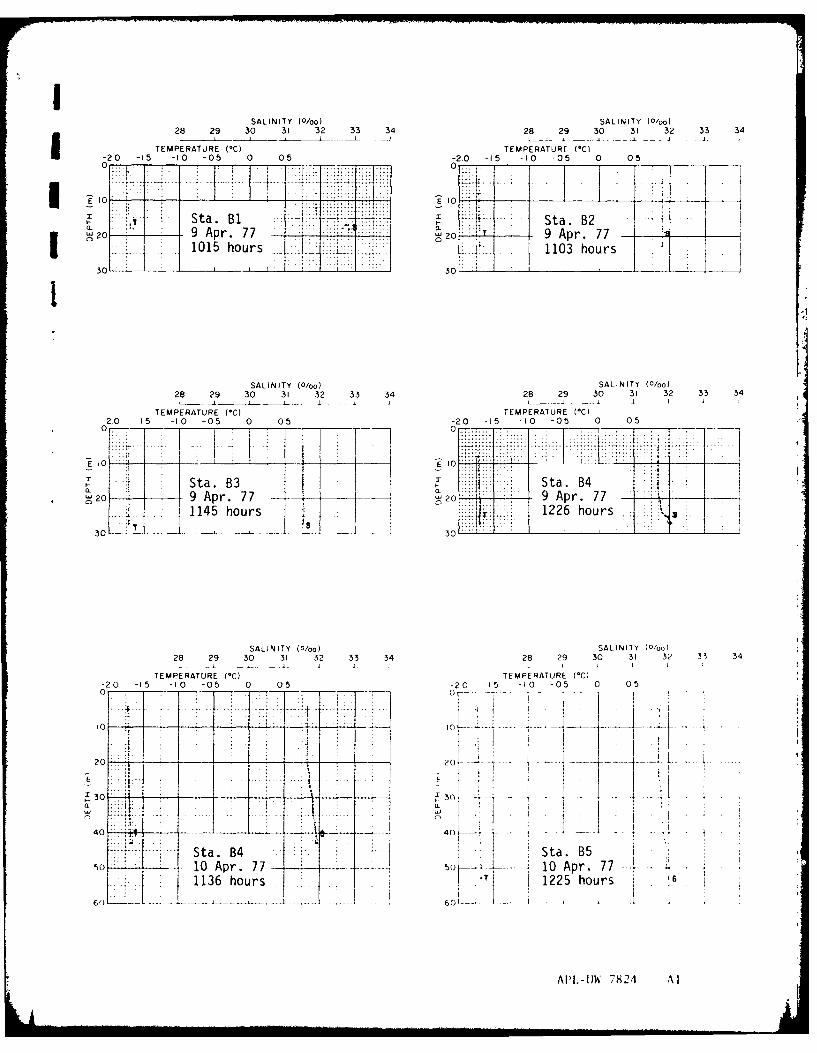
CTD profiles were taken along several lines perpendicular to the coast.
The locations of the stations fnr the April survey are shown in Figure 4, p. II.
Local Local
Station Date Time Station Date Time
Bi 9 Apr. 1015 Bi 13 Apr. 1015
B2 1103 B2 1048
B3 1145 B3 1128
B4 1226 B4 1205B5 1324
B4 10 Apr. 1136 B6 1407
B5 1225 A2 1557
B6 1251 A3 1635
Cl 1405C2 1440 D2 15 Apr. 1454
C3 1514 D4 1645
C4 1556
CS 1630C6 1706
IIII
I
ISALINITY (3/oo) SALINITY (
0/oo)
28 29 30 31 32 33 34 28 29 30 31 32 33 34
TEMPERATURE (°C) TEMPERATURE (*C)-20 -15 -10 -0.5 0 05 -2.0 -15 -10 -05 0 05
S, ... 0 ...
S. ...o.. Sta. B2
~~~~.......... n . ....... :::ii...... : :=w 0 A r 7 ....I T =201- 9 Apr. 77 .!1015 hours.:{: 1103 hours
... ... .zi.. 7 0 Ii__ _ _ _ _ _.
30= 1 30E-_____ _ _ _
1I
SALINITY (0/0o) SALINITY (0/oo1
28 29 30 31 32 33 34 28 29 30 31 32 33 34
TEMPERATURE (*C) TEMPERATURE (*C)-2.0 -15 -10 -05 0 05 -2.0 -15 -10 -05 0 050*.* .i7__f-.iC..:
0 0
Sta. B3 ! p Sta. B4'w20 9 Apr. 77 .o ",20 .... 9 Apr. 77 -
14 I 1226 hours .1145 hours _
30 : "
30 .. . . . . . , ' i :
SALINITY (0/oo) SALINITY (/oo)28 29 30 31 32 33 34 28 29 30 31 32 3 34
TEMPERATURE (0C) TEMPERATURE (*C)-20 -15 -10 -05 0 05 -20 -15 -10 -05 0 05
0 -7 -- -----
o4. ... .... ........ ... . ..
to to ----
20 .. .... 20 . . .. . .- -
40 -40--. .
Sta. 4 Sta B50 . 10 Apr. 77 10 Apr. 77
1136 hours iT i 1225 hours . t
... ... .. . 4 .... t.... . ' 0.. . . . . . 1 . 1
API,-IIW 7824 Al
Lmi
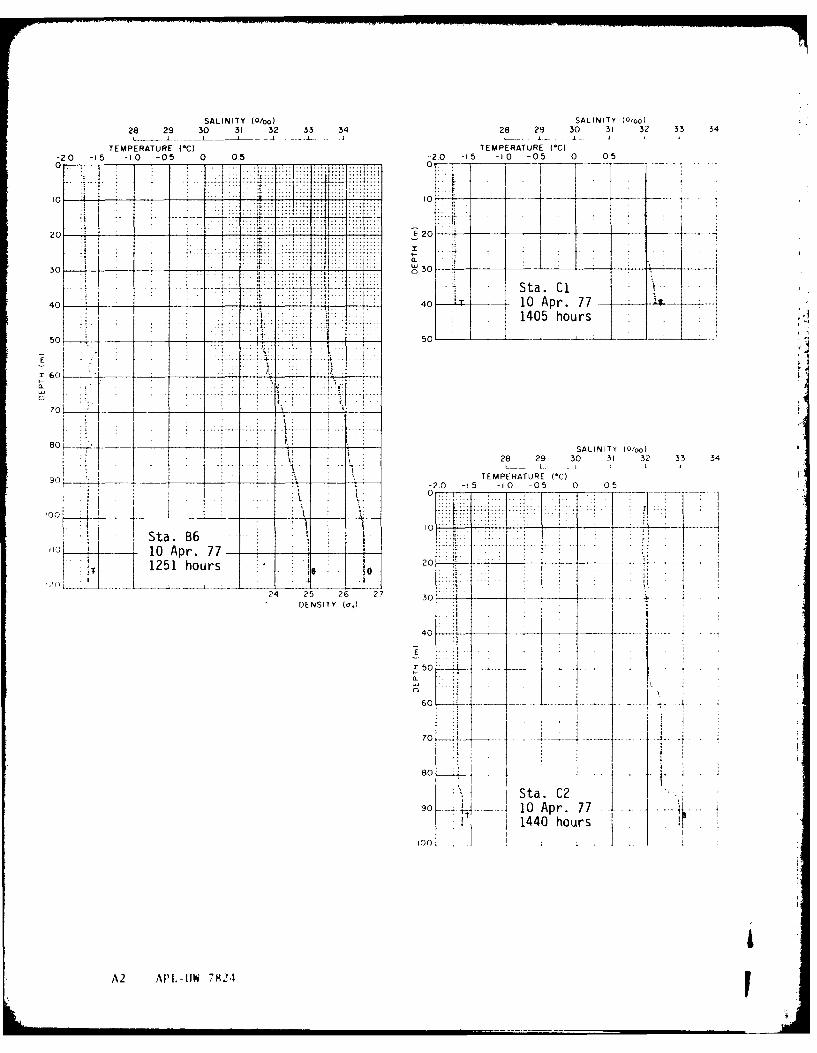
SALINITY (0/00) SALINITY (W'oo)28 29 30 31 32 33 34 28 29 30 31 32 33 34
TEMPERATURE (*C) TEMPERATURE (*C)-20 -15 -10 -05 0 0,5 -2,0 -I5 -10 -05 0 05
0I 0
r:: ii ii- it Sta
41 __ - 0 10A r 7 -
60 E- -
40 1- .7
40 - p
12511 hor hours7.
80 SADENSITY(0ooo
'S O -5 10 -05 0 0
77
10Sta B6 Sa.C
0. + 410 Apr. 77-125 1440s hous
200.
24 25 6 27 3A2 ADENSITY 7at)
40A
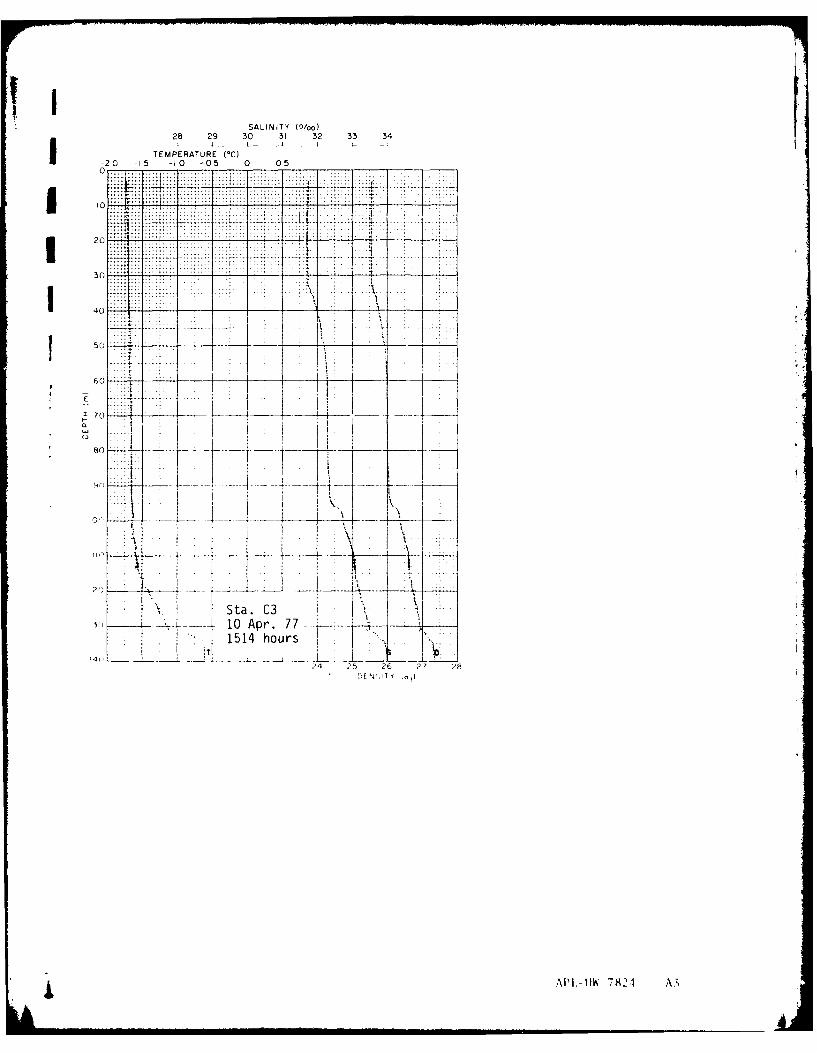
SALINITY (0/oo)211 29 30 31 32 33 34
-0 TEMPERATURE (*C)2 -15 -0 -05 0 05
20----
So---- -------
60 ------ _ _ _ _ - -
50 1a 0
Sta C3
15 10 Apr. 77 -- __
1514 hours.
?4 25 26 27 86
')EN,,Ii
API-11W 7922 A
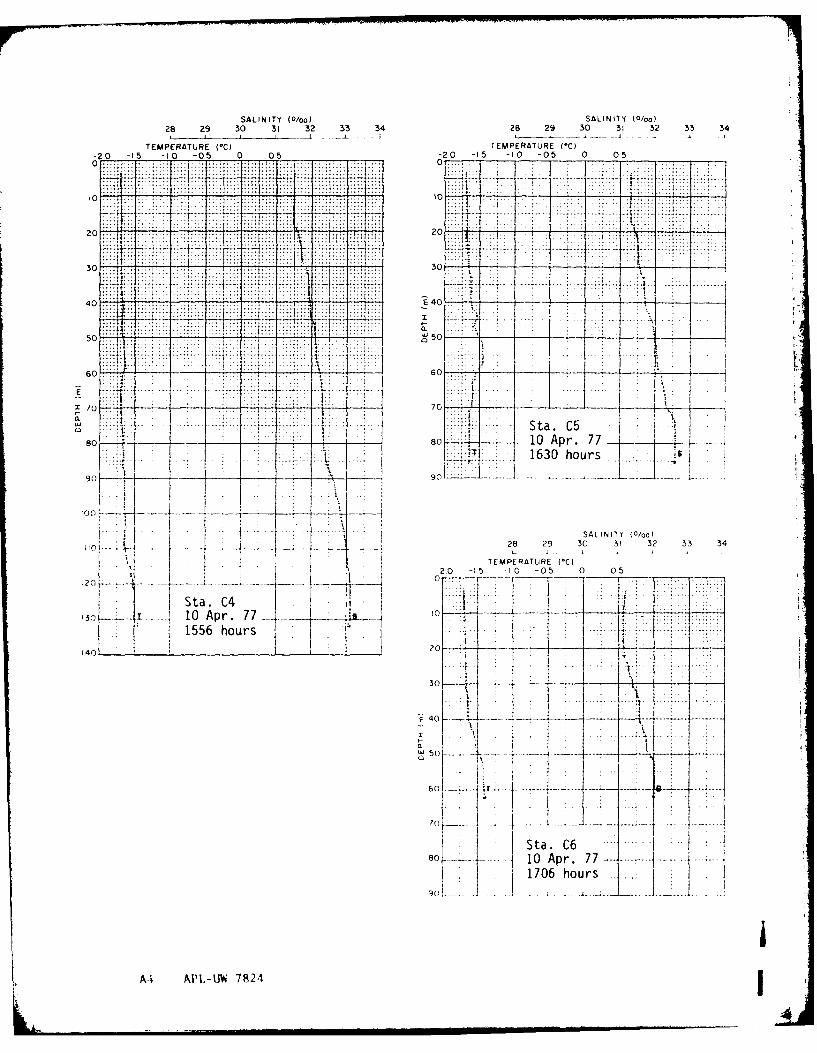
SALINITY (0/oo) SALINITY t~o/)
28 29 30 31 32 33 34 28 29 30 31 32 33 34
TEMPERATURE (*C) TEMPERATURE (*C)
-2.0 -15 -t0 -05 0 0 5 -2.0 -I5 -10 -05 0 050 -0
..... .i ...._iT 7: 7-
40 100 ..40
20 20L
60 ---- --60 -iI.2.
. .. St.. C5
50 510- 0A r7
1630 hours
100_ 90 -4--.-
ISALINITY (0/oo)
-2 5TEMPERATURE (*C(
'20 -1 -1 05 0 0
'30 TL 10 Apr. 77~ 7
1556 hours . ...... .
90.
htur
M APL-W 742
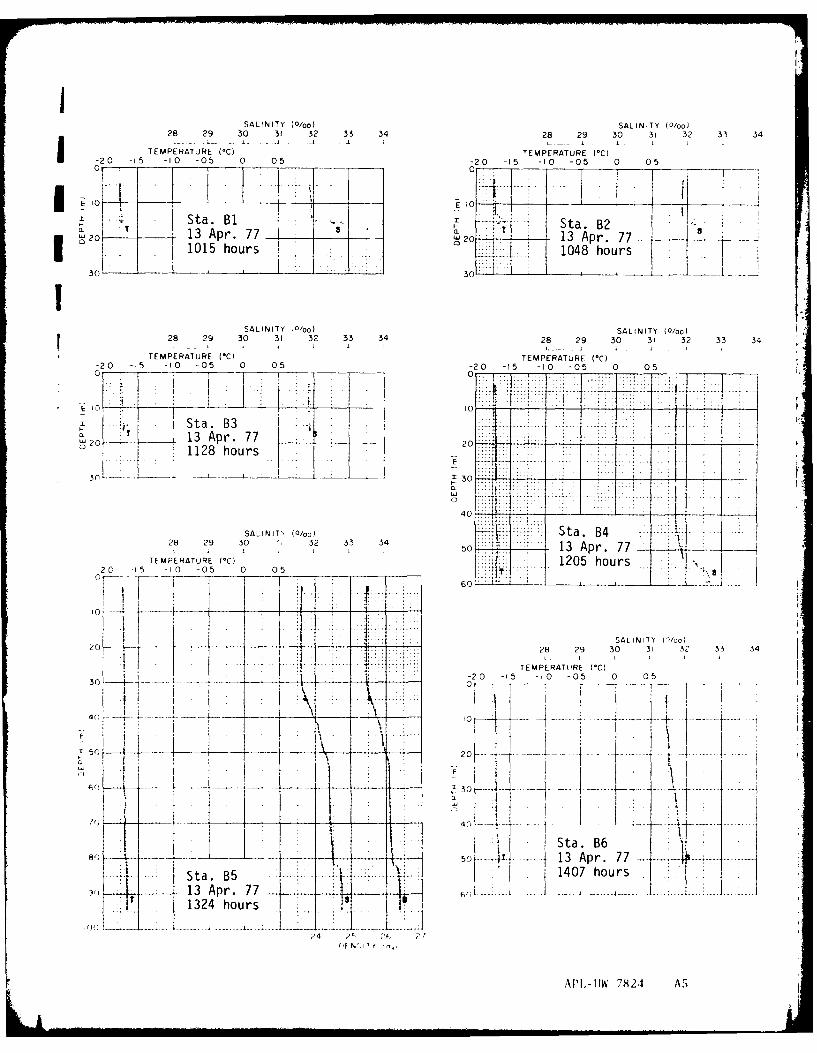
SALINITY (O/oo) SALINITY (O/oo)28 29 30 31 32 33 34 28 29 30 31 32 33 34
TEMPERATURE (°C) TEMPERATURE (°C)-20 -15 -10 -05 0 05 -2,0 -15 -10 -05 O 05
a .
2 120 13 Apr. 77-1015 hours .1048 hours
30 _ 30 - _ _ _ - LI1 jI
SALINITY .O/oo) SALINITY (0/oo)
28 29 30 31 32 33 34 28 29 30 31 32 33 34
TEMPERATURE (C) TEMPERATURE (°C)
-20 -15 -I0 -05 0 05 -20 -15 -0 -05 0 05
112 ho rs'-..i .. i ! :. .._ _ __ I _ _ : i " i !i:
20 Sta..B3 T.... (. )20 - Apr. 77 2-0-1
1128 hours
40 __
SALINITh (0/00) 7:: Sta. 84 ....:A28 29 03 .. 13 Apr. 77
TFAMPERATURE (*C) 1205 hours-20 -15 -10 -05 0 05 -.
"
-1- SALINITY ('/00I
/0.28 29 30 31 31, 33 34
t~ .TEMPERATUIRE (*C)
-2 -1 -10 -0 0 0
30- 4-1 71 ffi -47 __
Ito -
---- - __0 - - - - - - - --- ' O -- - -------
80 _ - -Sta. B6
50---4- 13 Apr. 77
Sta. B5 - ( 1407 hours
t .13 Apr. 77 ------- ---
'i. 1324 hours I i
OfEN',il
API.,-IIW 7824 AS
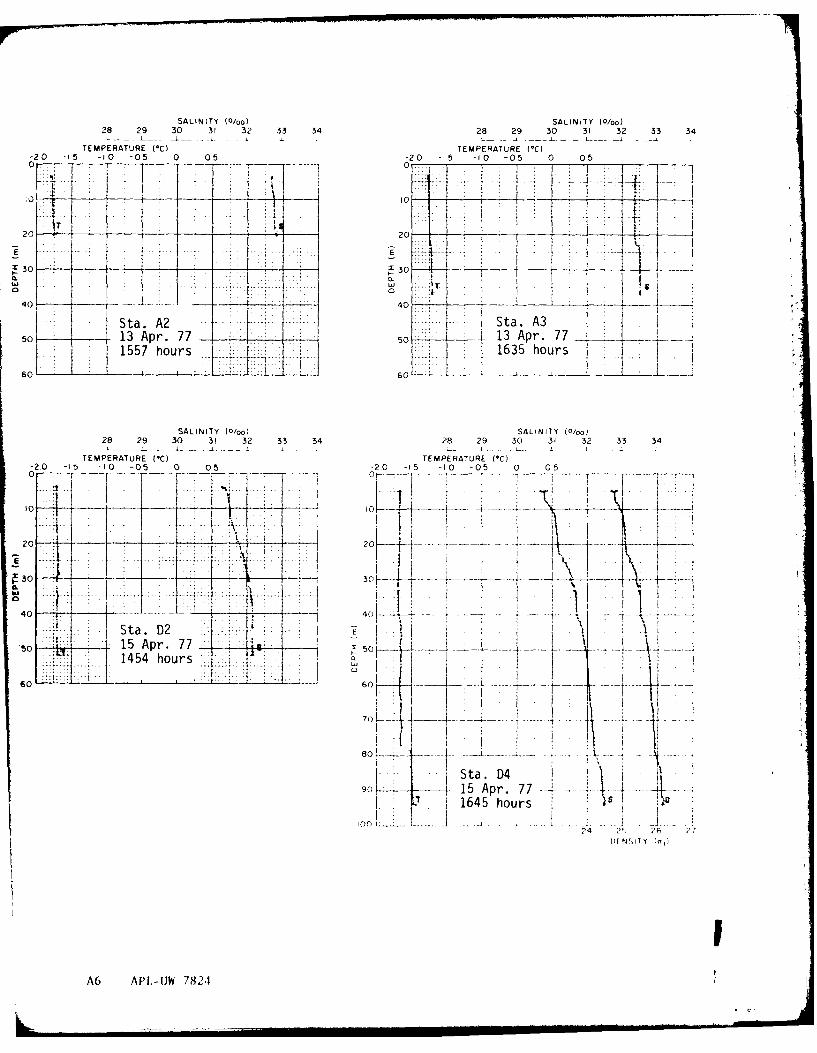
SALINITY (0/oo) SALINITY (0/oo)28 29 30 31 32 33 34 28 29 30 31 32 33 34
TEMPERATURE (*C) TEMPERATURE (*C)-20 -I5 -'0 -05 0 05 -20 -15 -'0 -05 0 05
U7 7
22. -J- -20
:r 3030--7 T
40 -- 40 L_ _ _ _
Sta. A2 Sta. A35 13 Apr.77 - .o 13 Apr. 77
1557 ours1635 hours
6060 ___
SALINITY (0/oo) SALINITY (Oloo)28 29 30 31 32 33 34 28 29 30 31 32 33 34
TEMPERATURE I*C) TEMPERATURE (*C)-2.0 -15 -10 -05 0 05 -20 -I5 -10 -05 0 050 ------- ' 0
--- T
20 30 ----- ------ 2... ... .. .. .40 -..401..
Sta. D2
15 Apr. 77- - -- . "
,oo LL .... . . ... .. .... t .701
- Sta. 04
90 15 Apr. 77- ---~.I 'c
'00 -i. ---. - 1 - - - - -
OfI N', IY (c,)
A6 APL-JW 7821
L -__ __ "
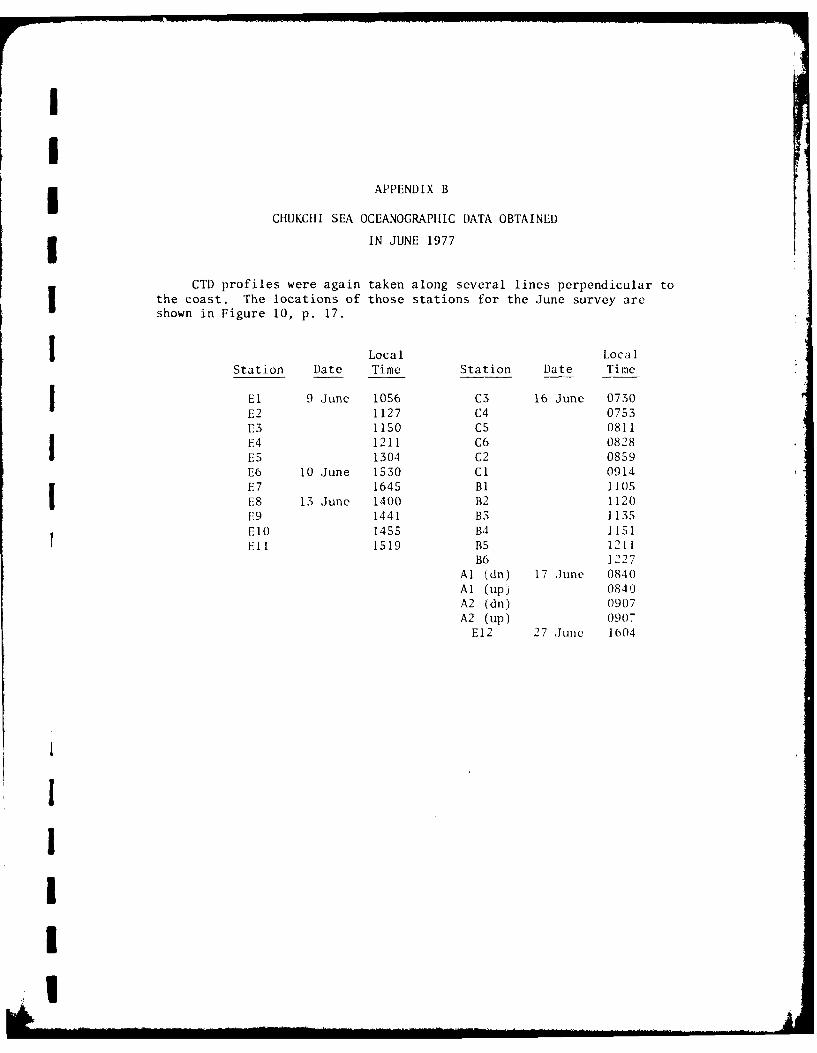
II APPENDIX B
CHUKCHI SEA OCEANOGRAPHIC DATA OBTAINED
I IN JUNE 1977
CTD profiles were again taken along several lines perpendicular tothe coast. The locations of those stations for the June survey areshown in Figure 10, p. 17.
Local LocalStation Date Time Station Date Time
I El 9 June 1056 C3 16 June 0730
E2 1127 C4 0753E3 1150 CS 0811E4 1211 C6 0828ES 1304 C2 0859E6 10 June 1530 Cl 0914E7 1645 BI 1105E8 13 June 1400 B2 1120E9 1441 B3 1135EIO 1455 B4 1151Ell 1519 BS 1211
B6 1227Al (dn) 17 ,June 0840Al (up) 0840A2 (dn) 0907A2 (up) 0907
E12 27 June 1604
1i
IIII.1ll a
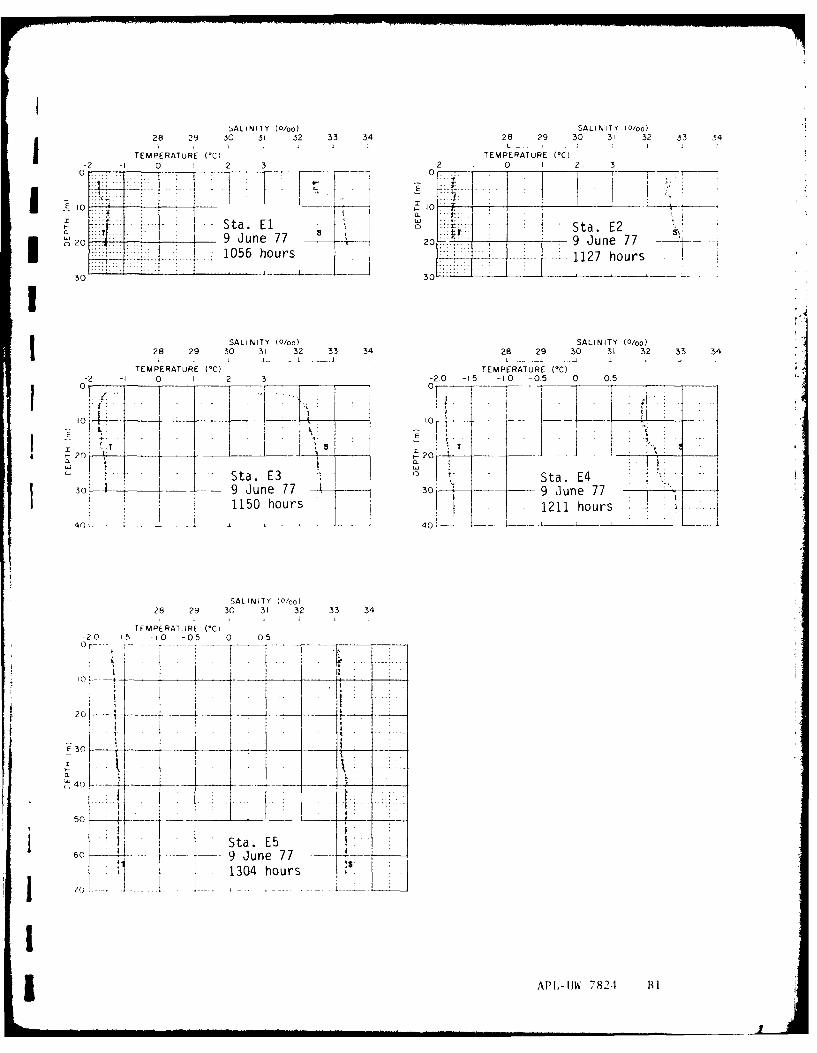
SALINITY (0/oo) SALINITY (0/oo)28 29 30 31 32 33 34 28 29 30 31 32 33 34
TEMPERATURE (*C) TEMPERATURE (°C)-2 -I 0 I 2 3 -2 I 0 I 2 3
. . . --
.... . Sta. E1 C" Sta. E22 U June 77 -20 9 June 77 -
1056 hours -12 or7 :7 - : ... '--- - 1127 hours.
30 30
SALINITY (0/oo) SALINITY (0O/o)28 29 30 31 32 33 34 28 29 30 31 32 33 34
TEMPERATURE (°C) TEMPERATURE (°C)-2 -I 0 2 3 -2.0 -15 -10 -05 0 05
0 - T! .t
Sta. E3 Sta. E4 "30 -i---------- 9 June 77 30 9 June 77 I
; 1150 hours 1211 hours-- L-- ~-- ~------- 40L__
SALINITY (0/oo)28 29 30 31 32 33 34
TEMPERATURE (°CI-20 -15 -10 -05 0 05------------------
; ! ,I. - i .i .
10.
4 -- -9 June 77 --1304 hours
10API,-I 7824 [l
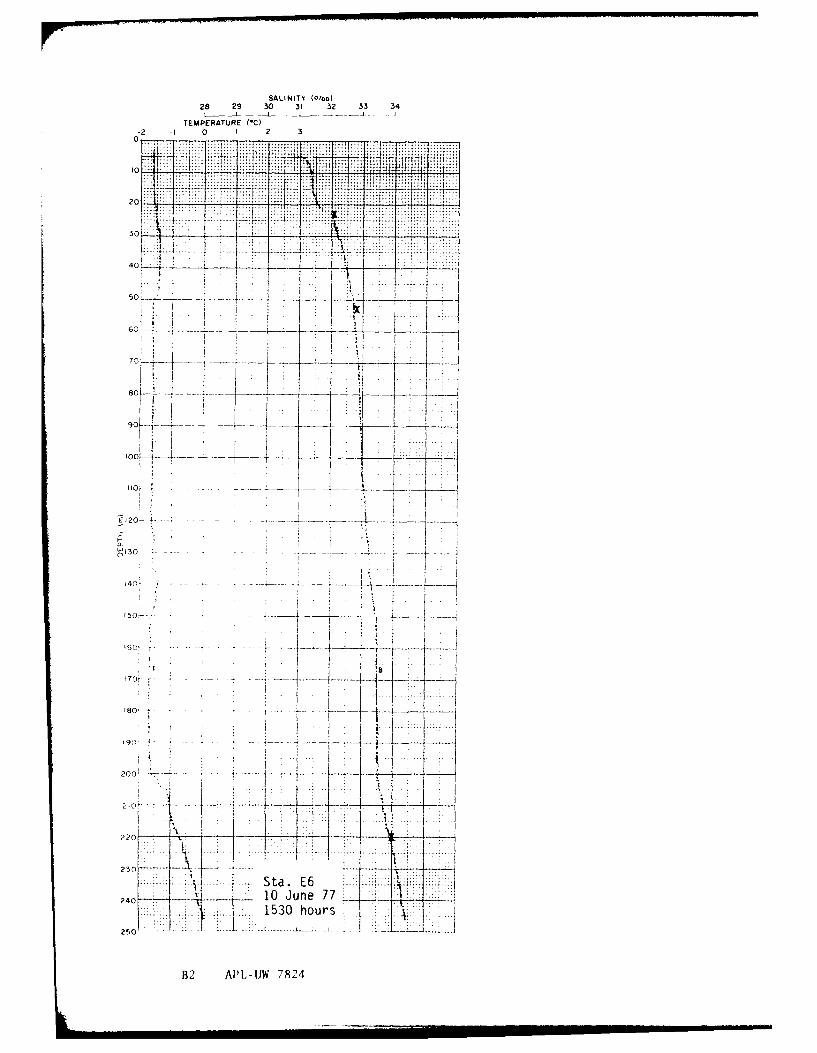
SALINITY (0/oo)
28 29 30 31 32 33 34
TEMPERATURE (*C)
- 1 0 I 2 3
0 .. ...
T-
.___ .... ...
240
60 ___
80
_
911-
f50-------------
ISO-
:00
- -
220 --
10 June 771530 hours
B2 APl'-[JW 7824
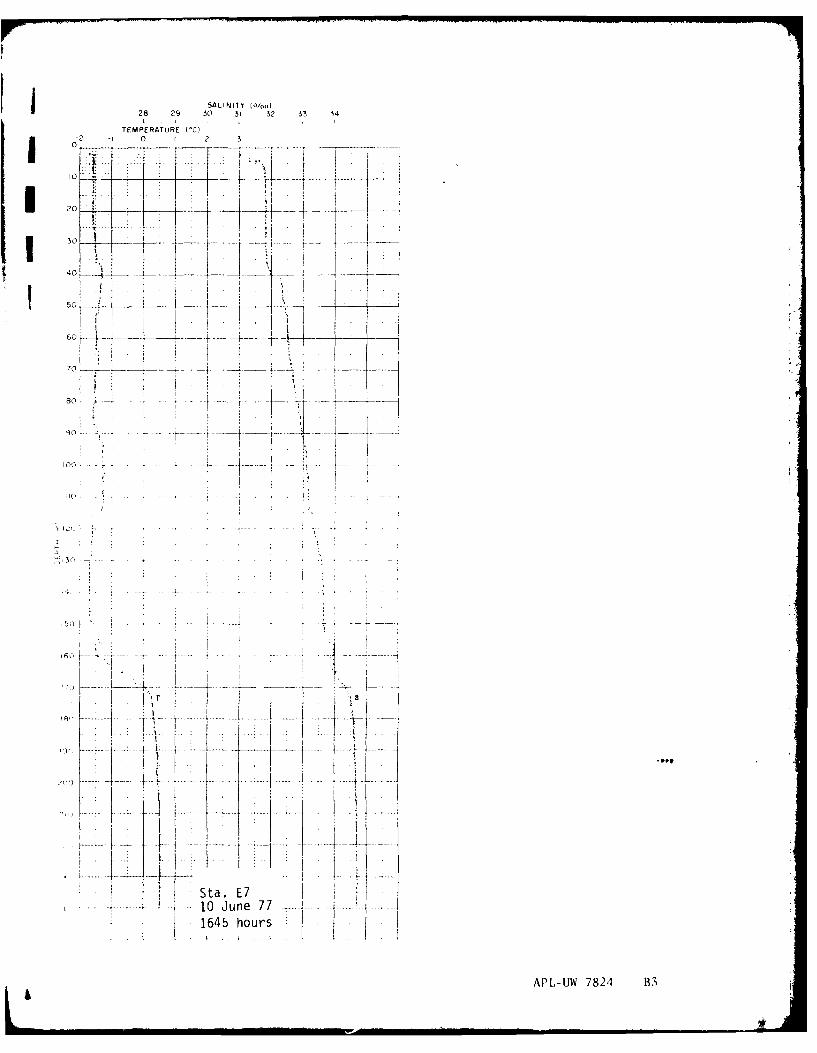
28 29 SALINITY (0/o0)2 29 30 31 32 33 34
TEMPERATUIRE (*C)2 -i 0 2 3
I .)
-
-- i------20
30 -
70
I lo I
131
- -- ----------
-- -- .i.---* - -- - --
-I--,IJ 7824---- -- --
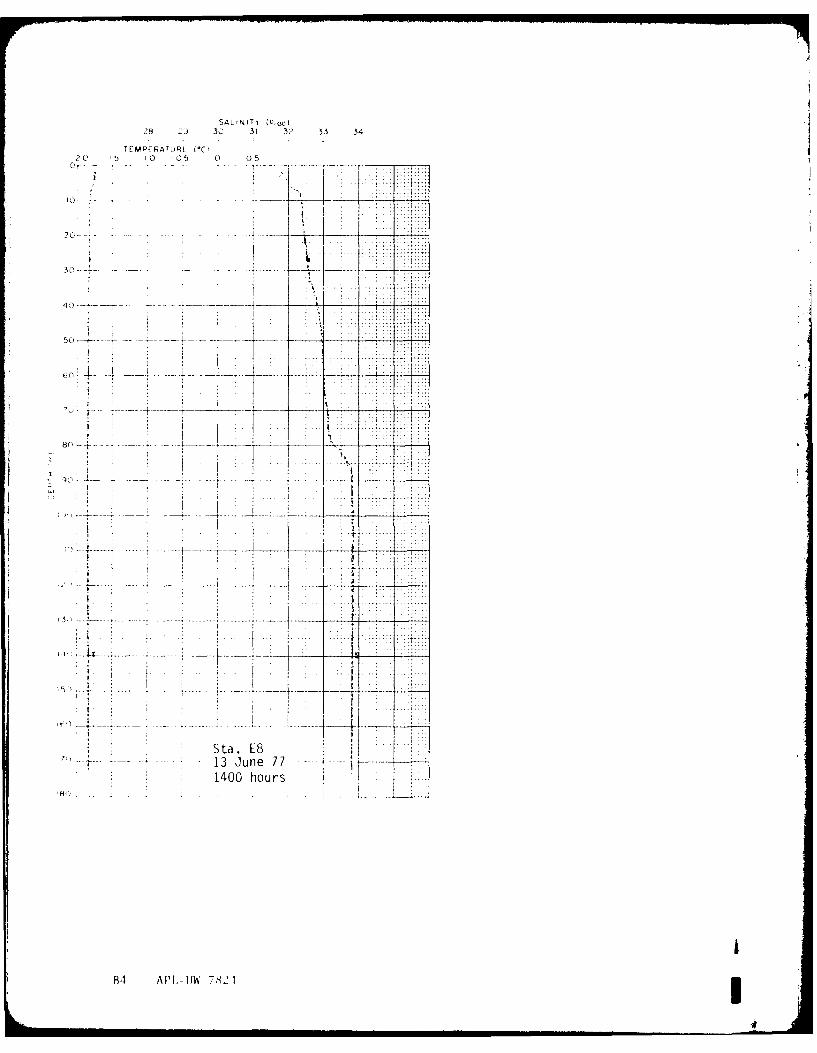
SALrNT (0,0028 2i 30 3 1 3? 33 34
-2c '1 t 10 -05 0 05
30 I
80 -
. 7t.4-
-T --- --- 13 J une 7
B1 A I.IJW7
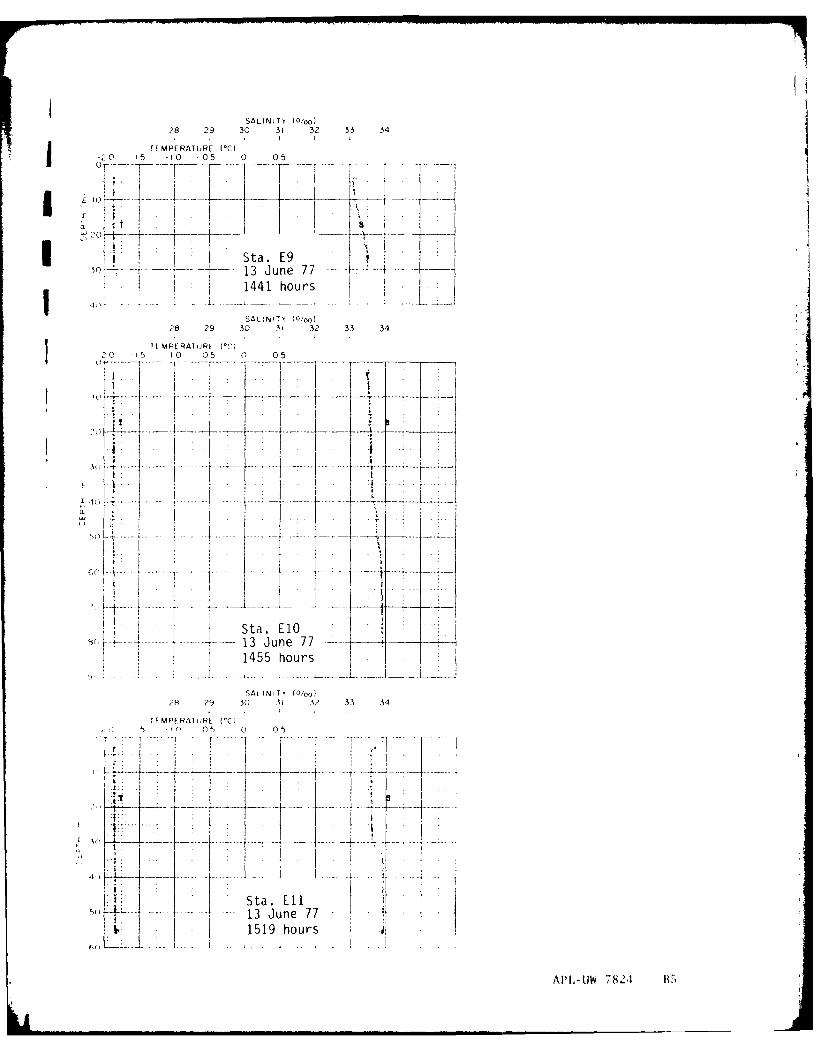
SALINITY (O/oo)28 29 30 31 32 33 34
0j -EMPERATURE (*C) 05-20 -15 -10 -05 0 05
H t St a. E913 June 77
4o --- [1441 hours ,40 , - - - -
SALINITY (0/00
28 9 30 Yt 32 33 34
T I MPF RAT ORE.
1 ) - 0 -05 0 05
T . .
' t
50 --- -------- -- ---- *-
I I
Sta. E1O
8/K----- ---- 4- 13 June 77
1455 hours
SALINITY (0/oo)
2H 29 30 31 32 33 34
TFMPfRATt;RE ('C,
I t I) -(-)5 U 05
T - T
Sta. Ell i
311 --l 13 June 77
1519 hours If
API,-UW 7821 B5
L . . I I II I I I I I 1 I I II . . . . I I
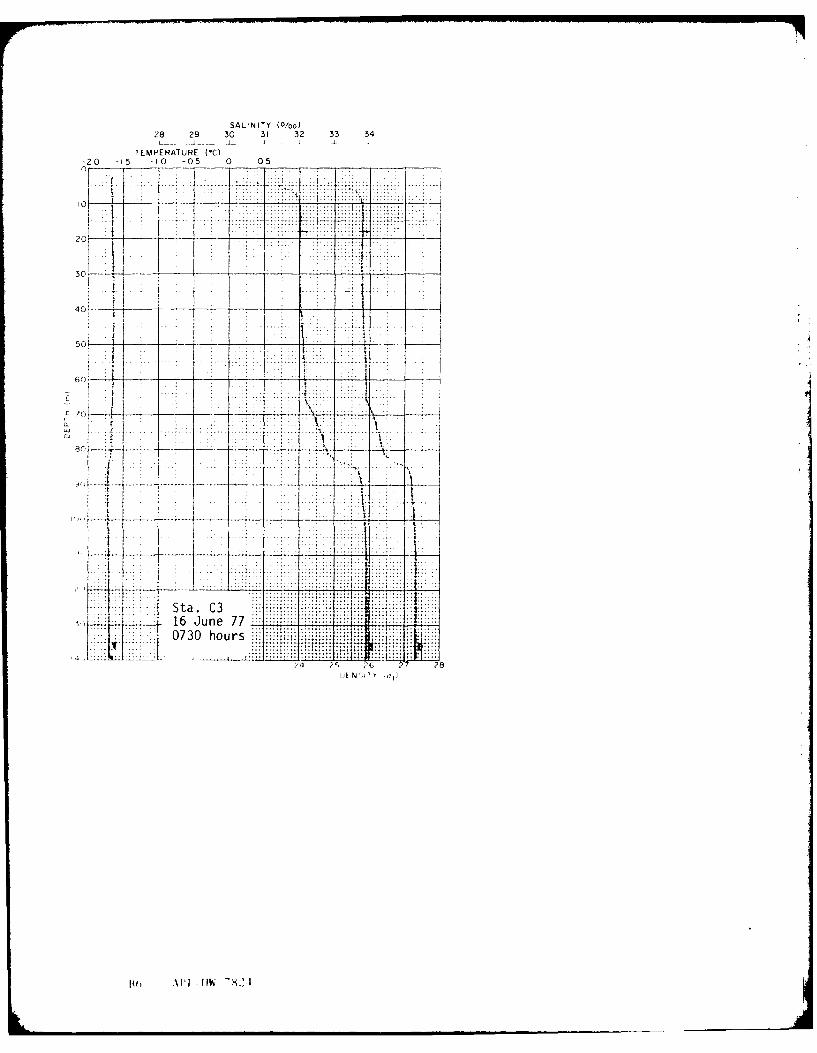
SALINITY (0/oo)28 29 30 31 32 33 34
TEMPERATURE (*C)20 -5 -0 -05 0 0
0 ~ ---.... . 0....
30-''
-- 4
5C
3 C r - --... . ..-.....
70_ __ _
a l . ...j .-. .
.. .. .. .. ... ...
...... Sta .* .
1. .... ...
16 June 770730 hours.{~ ~.i 77 11
?4 , 14. 7 2
l~o ~ II - ILb 'A,.
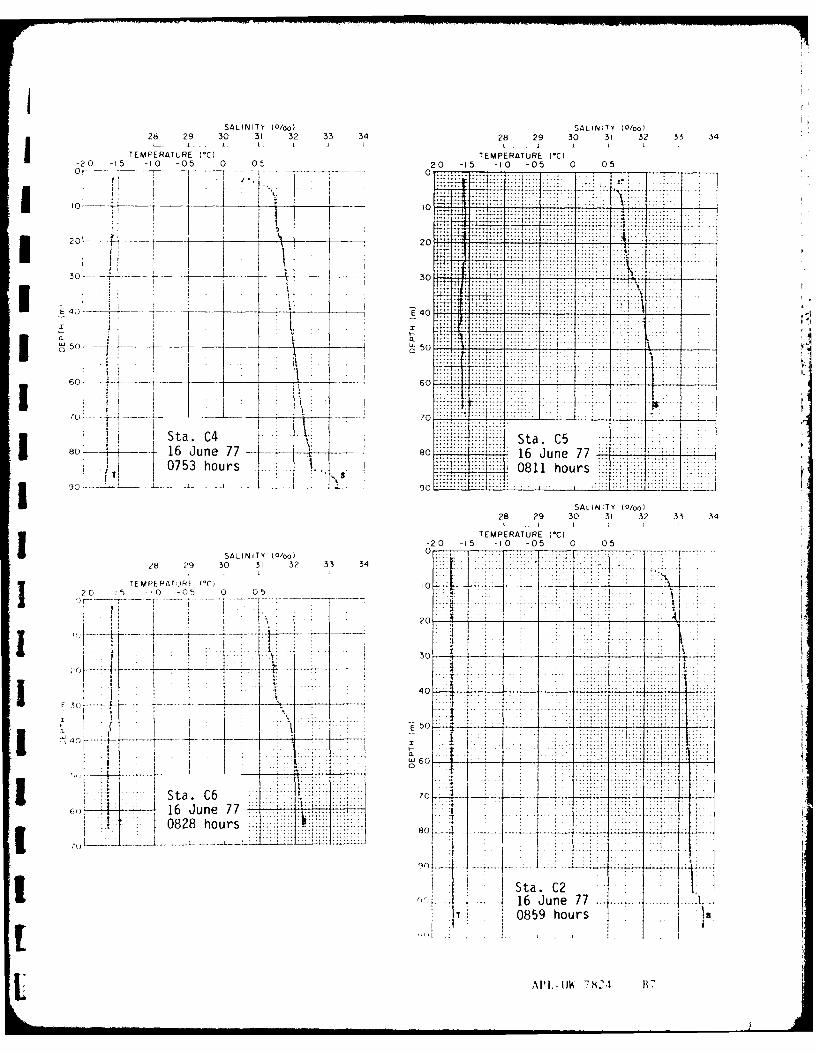
SALINITY (0/00)SAI TY 0/o28 29 30 3 32 3 3428 29 30 31 32 33 34
TEMPERATURE (*C) TEMPERATURE ('C)20 -iS5 -10 -05 0 05 -2.0 -15 0t -05 0 05
I 0 ...... ...-
20 ----- 20
.... . ..
o.:7 ...... -7 : - 7 ---~ ----4 _aa
II
0 Sta.C-~ 16Jue77.... C5
80 j- -.--- c-j50 1 Jn70753 ours0811hour
IrC......
Sta. C9 3 1 34 ... . .
80 41 - - 80
------ 90
3AIIY 0 )0 -=7 -1
_05 -
---- 16un7 :7777;K +:-
Sta. C6 3t.C
082 0859s hou0
;;;.16 June 77......089hor
LP-1 -21 B
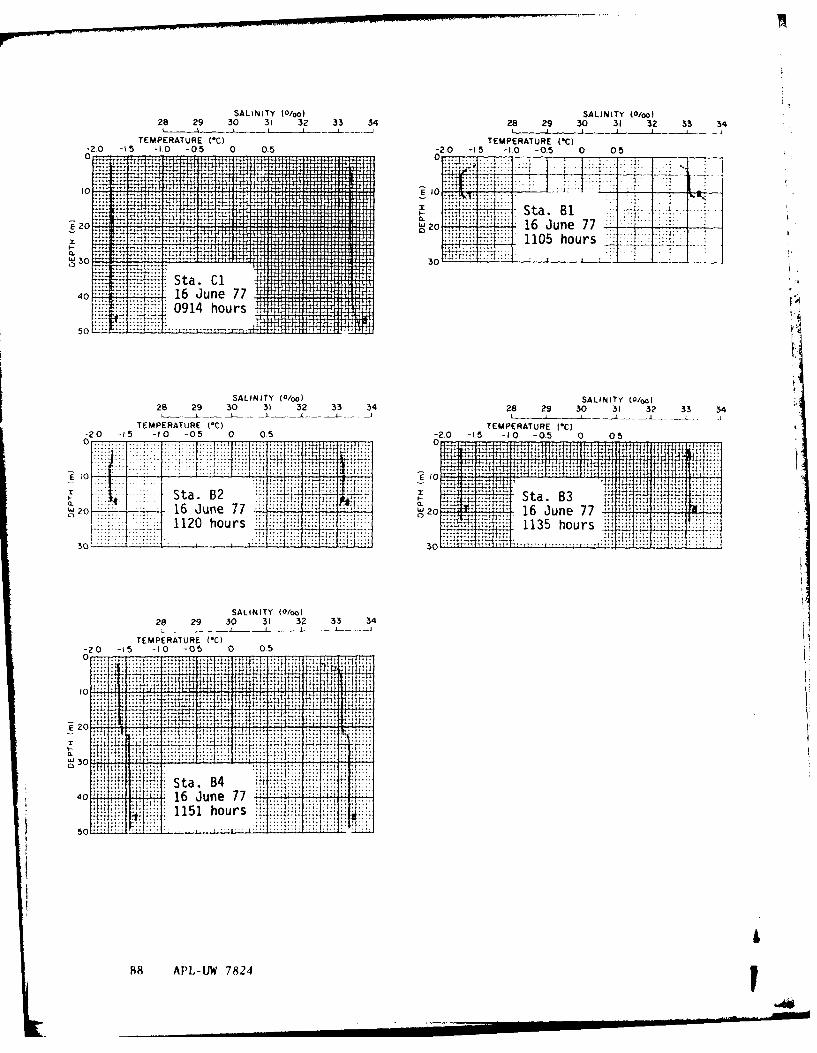
SALINITY (0Woo)SAITYWo28 29 30 31 32 33 34 28 29 30 31 32 S3 34
TEMPERATURE (*C) TEMPERATURE (*C)-2 -5 -10 -0 05-2.0 -15 -1.0 -0.5 0 0.5
S20,,, 16 June 77 .--
.... .... ..... 1105 hours
5 0 30
SALINITY (0/oo) SALINITY (0/ool28 29 30 31 32 33 34 28 29 30 31 32 33 34
TEMPERATURE (*C) TEMPERATURE (-C)-20 -15 -10 -05 0 0,5 - 1 05 0 0
80
{ - Sta. B2St.B~20 16 June 77 ~20 ~'" 16 June 77'
_ 1120 hours; t'~- t .. . .. . .. . .: ...4 ... ..
SALINITY Wool028 29 30 31 32 33 34
TEMPERATURE ("C)-20 -IS -t0 -05 0 0.5
0 ~ ~ ~ ~ , 'T':-''r-')it:
i021 I 1 iaw30 t
Sta. 844016 June 77 - ".. ** "- ' -'
S1151 hours
B18 APL-UW 7824
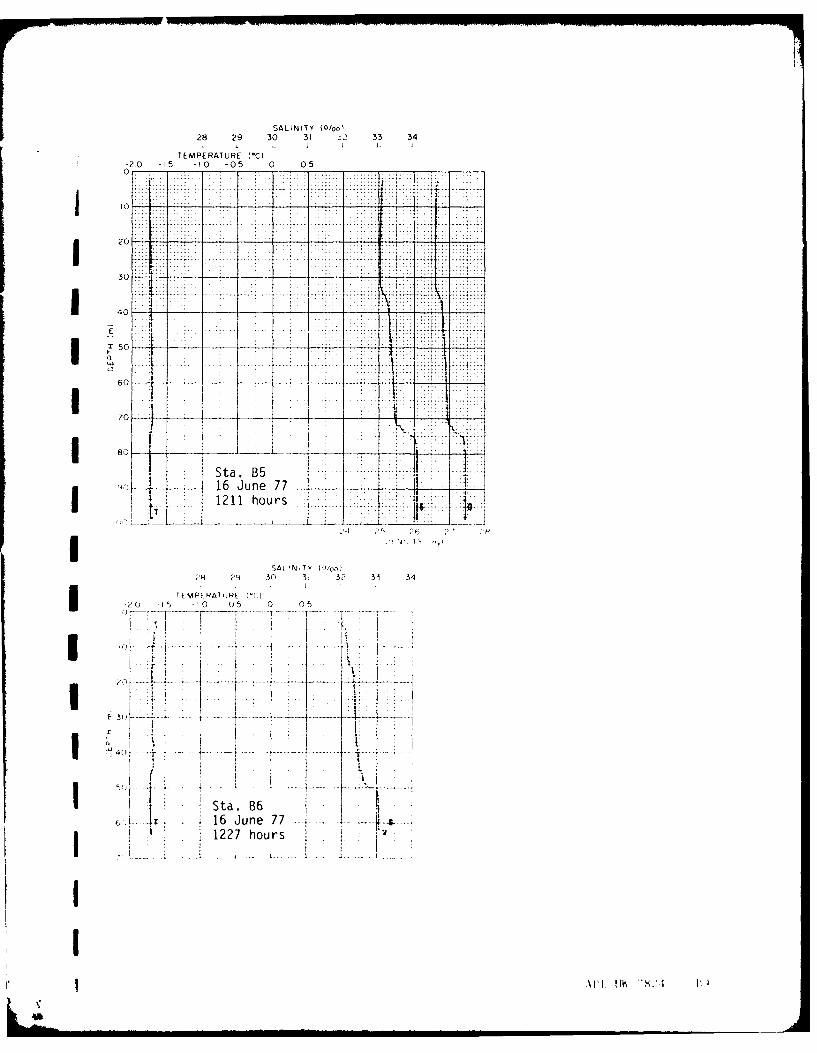
SALINITY lO/ooI28 29 30 31 2 33 34
TEMPERATURE (*C) I-20 -15 -0 -05 0 05
I 0
60
T _0
70i-
I~~. ...4...~. ....Sta. B516 June 77~-.
* t4.* 1211 hours
II"SAI 'NITY (O/oo1
?H ?9 50 31 32 35 34I ~ ~ E rM P 19AT1f k) p.? E
-7-----
40t - ---.. . . . --1. . . . .... ..--- -
I Sta. B6-. 16 June 77
1227 hours-- --- - -
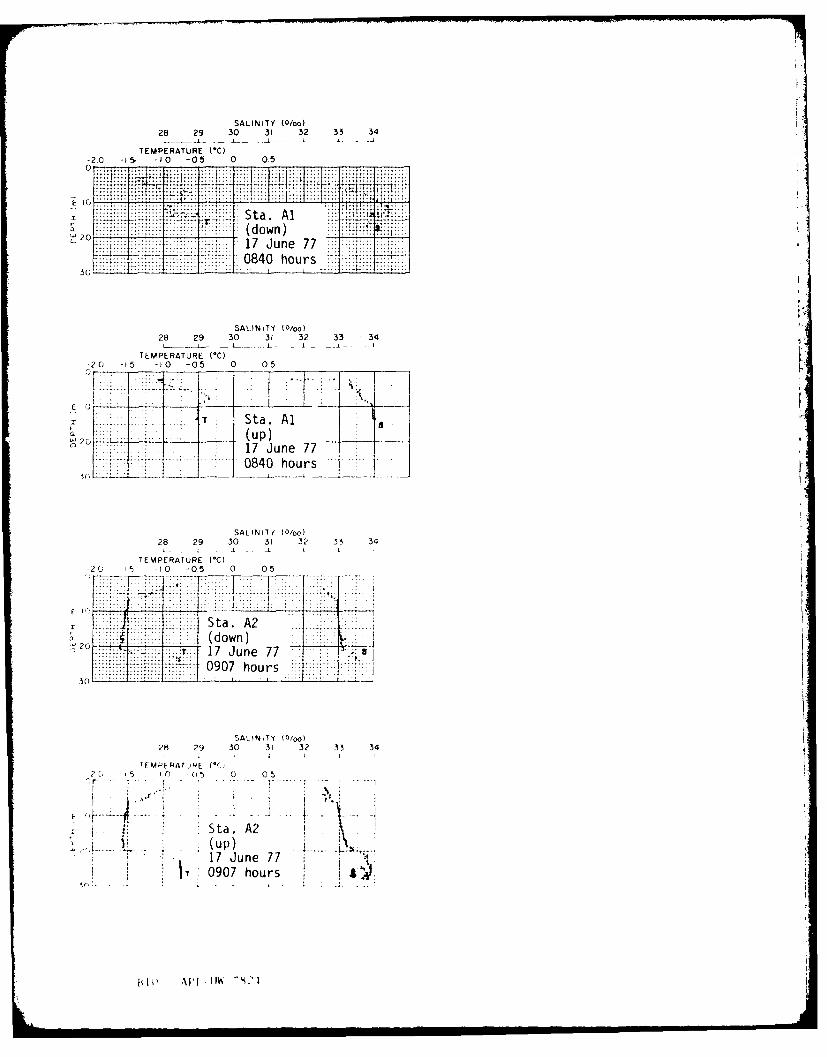
SALINITY (0/00)28 29 30 31 32 33 34
TEMPERATURE C C)
SAINT ( 0/wn)
28 29 30 31 32 33 34
TEMPERATURE (*C)20 -'5 -0 -05 0 05
E 10 - L
T Sta. AlIc20 (up)
17 June 770840 hours
SALINITY' (0/co)28 29 30 31 32 33 34
L - ..1 1 - A
TEMPERATURE (*C)-2 5 1 0 -05 0 05
Sta. A2
a (down)r 17 June 77 '-0907 hours
SALINITY (0/00)/8 29 30 31 32 33 34
EMPERAT.P ! f(T5 0 0~ 5S 0 0
Sta. A2------ (up)
~T 17 June 77T 0907 hours
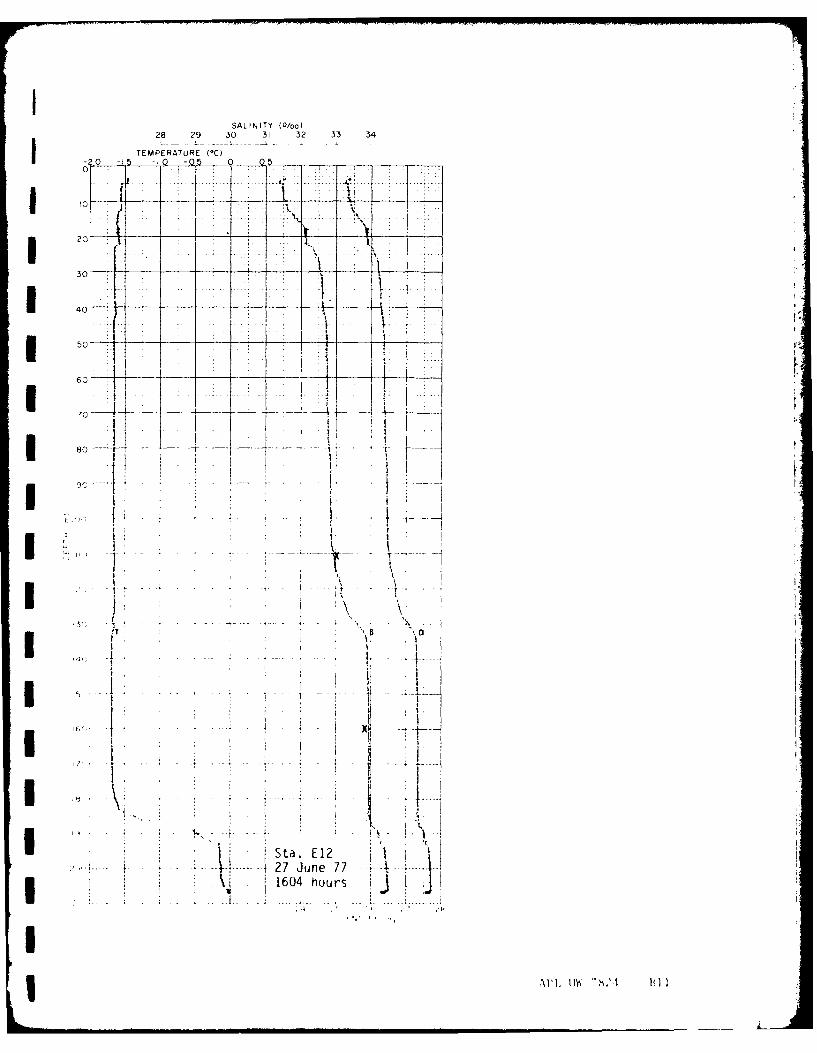
SALINITY (()/oo)28 29 30 31 32 33 34
TEMPERATURE (*C)0. .
20
30
I 40j
50 I ___
-- 80 - + . _ _
* pttT
tI
~~a E........2
27 Jun7160 hous--- ~.- .- T
......................
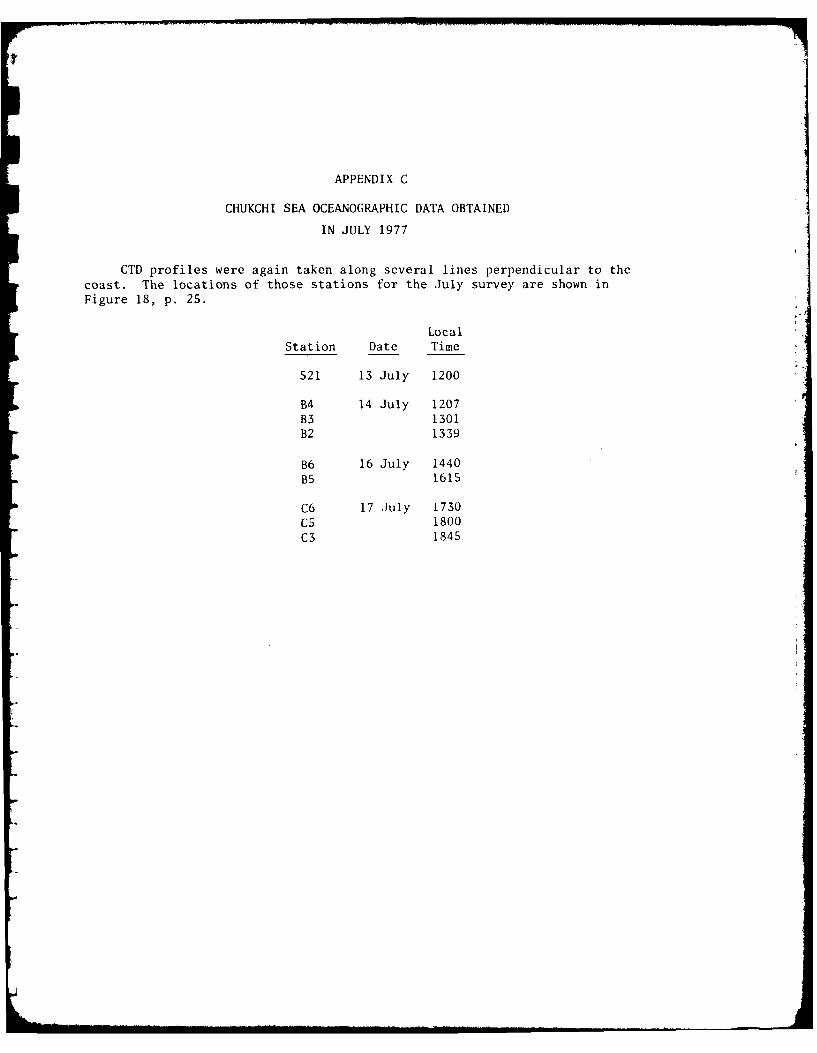
APPENDIX C
CHUKCHI SEA OCEANOGRAPHIC DATA OBTAINED
IN JULY 1977
CTD profiles were again taken along several lines perpendicular to the
coast. The locations of those stations for the July survey are shown inFigure 18, p. 25.
Local
Station Date Time
521 13 July 1200
B4 14 July 1207B3 1301B2 1339
B6 16 July 1440B5 1615
C6 17 July 1730C5 1800C3 1845
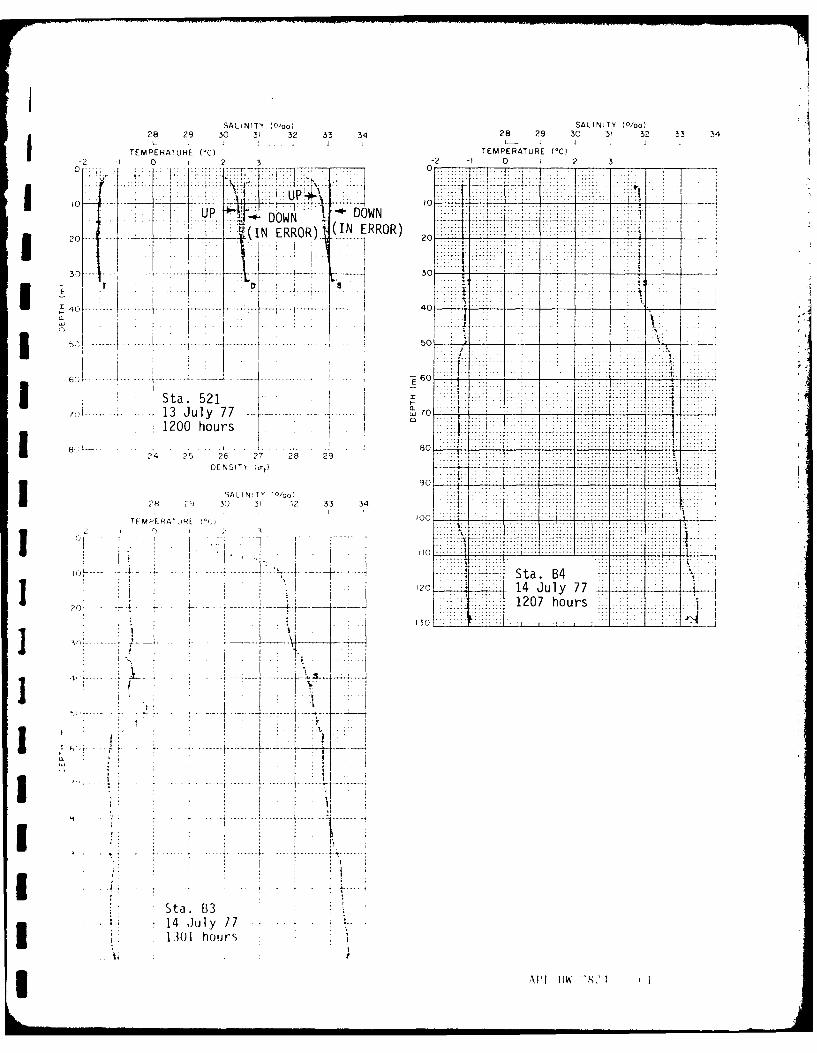
SALINITY tO/oo) SALINITY (0/oo)28 29 30 311 32 33 34 28 29 30 31 32 33 34
TEMPERATURE (1)TEMPERATURE (*C)-2 0 2 -
1 0. . p ...... ..
3 0. N ERROR) (N ERROR) 20.. ... ...
30 .. ... 0940 -- ------- 40
3~~~3 ....... .. . .. .. .. ..
3Sta. 521 :. ------ ---- -70 .. . 13 July 77- 70..~. .. .
1200 hours .I I: :I:
3 8 . ... ......?!4 ?'5 26 27 28 29 .........- ..-....
DENSITY 7a)...
90
SALINITh 10/oo) ...
28 Pj 3 31 3,3 74 --- :T ---
.~~~~. ...... ......1 0 _ _ __ _ __ _
j Sta. B4
.............
Sta. B3- 14 Jul y 77I 1301 houri
IAl P Il IV 8 1 (1I
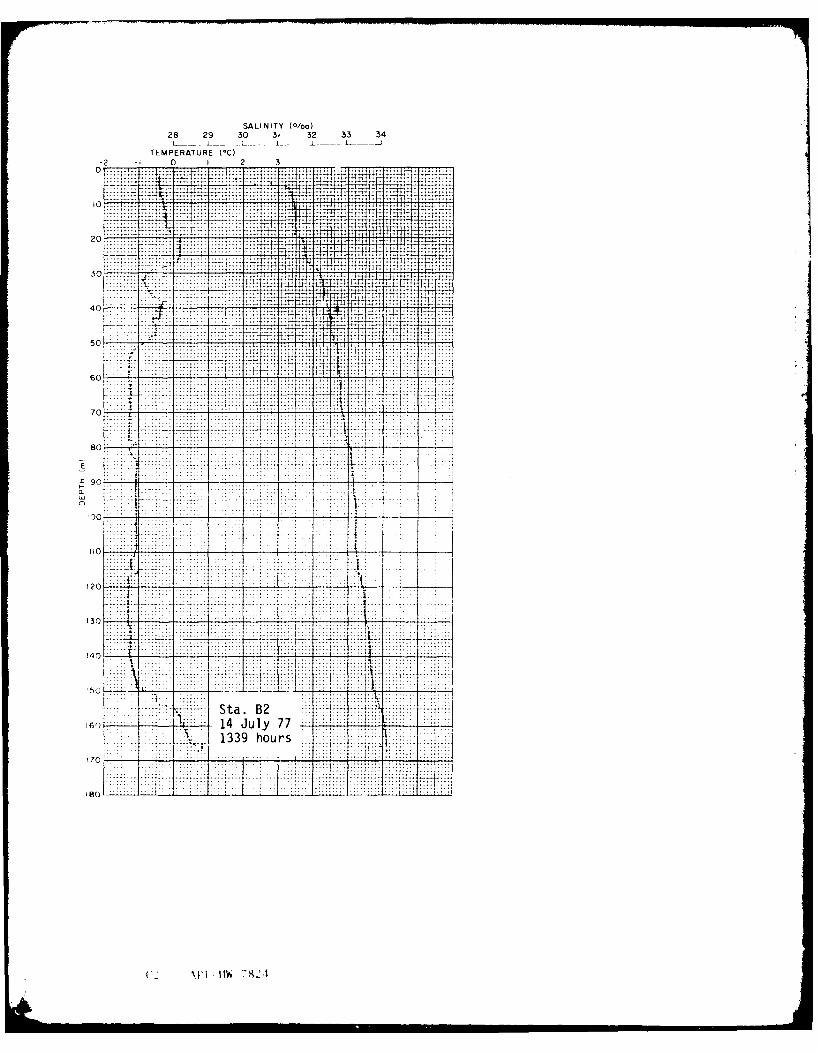
SALINITY (0/00)28 29 30 31 32 33 34
TEMPERATURE I C)
-20 1 2 3
30 --- --- ... ..
-7:-
10-
... .... ' .. . ..... ...
380
.. ................ ......
60i
7-7:77 S ta.- -- --- --- 7-.
60 14July77.
810
120782
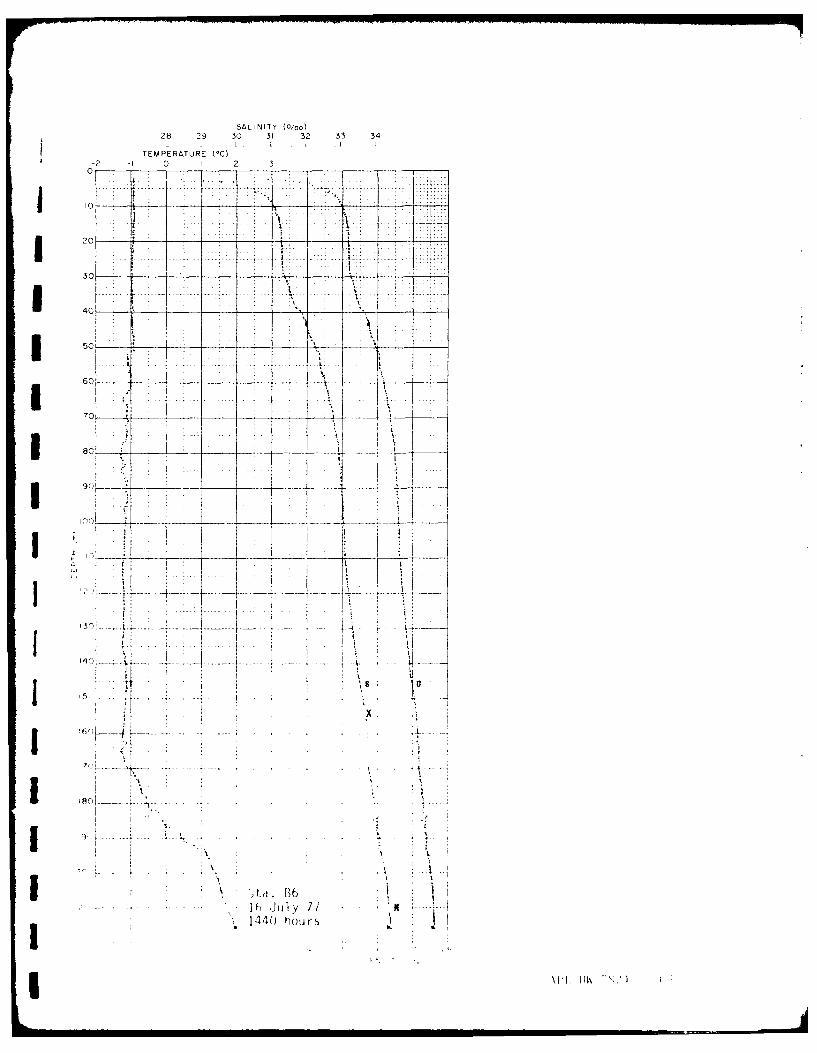
SALiNIT y (0/00)28 29 30 31 32 33 34
T EM PERATURIE (0C0I2 -I 0 I 2 3
3r
I4--
I ---K 4-I ..
144--------- hours
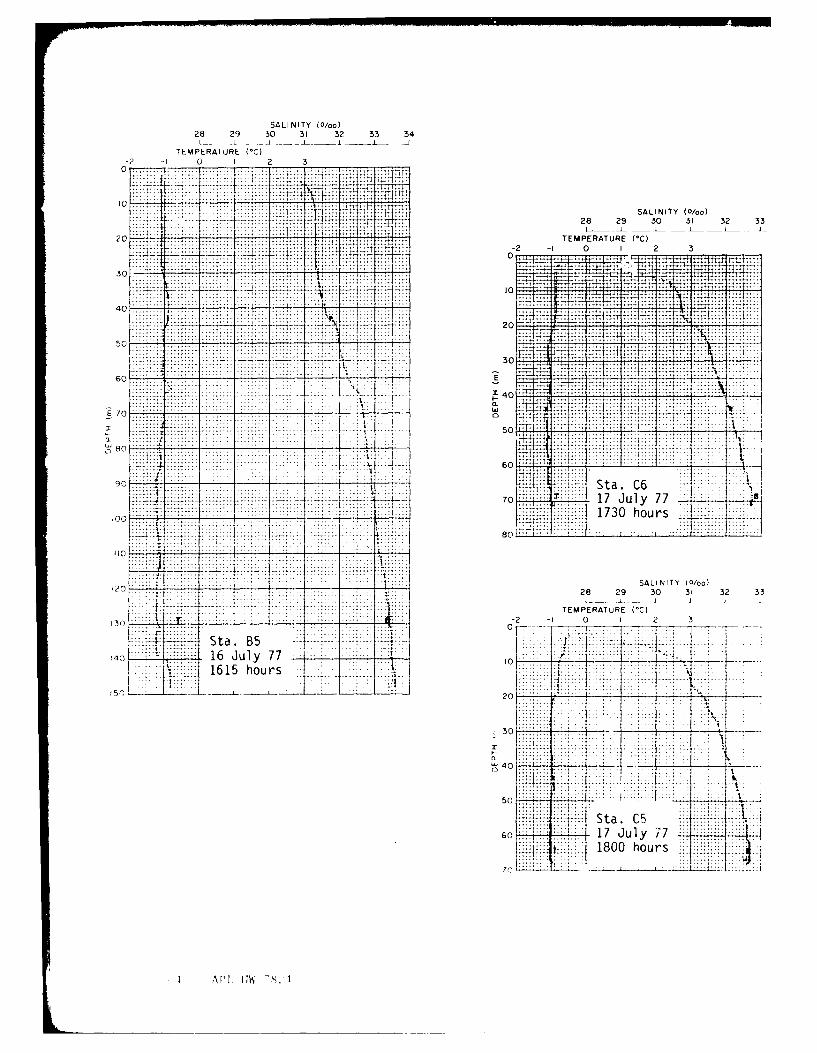
SALINITY (0/oo)28 29 30 31 32 33 34
TEMPERATURE (*C)-20 I 2 3
F~ ~ ~SALINITY (0/oo)
128 29 30 31 32 33
2 - " A-~ TEMPERATURE (*C)-2 I1 0 1 2 3
320
4:. , 1 ....... .
77 0
550
-- --- 30 .. .
... ...0.. .._
70 17Jly7
-. . .. .:8
. ............. ....................
L .......- ....
730 - 2 -w
'4016 ul77!- ..t ... ...._...
830
..... 0...................
-Sta. C670 17July 77
1800 hours4: 80.
110ll S
Ir7AD-A 84,1 WASHINGTON UNIV SEATTLE APPLIED PHYSICS LAB F/G t10OCEANOGRAPHIC MEASUREMENTS IN THE CHUKCHI SEA, APRIL-AUGUST 197--ETC(U)SEP 79 6 R GARRISON, M L WELCH, J T SHAW N0123-7'.C-2066
UNCLASSIFIED APL-UW-7824 NL__I _fIfIIIIII
IIIIIIIIIIIIIlEIIEEIIEEEEEEE
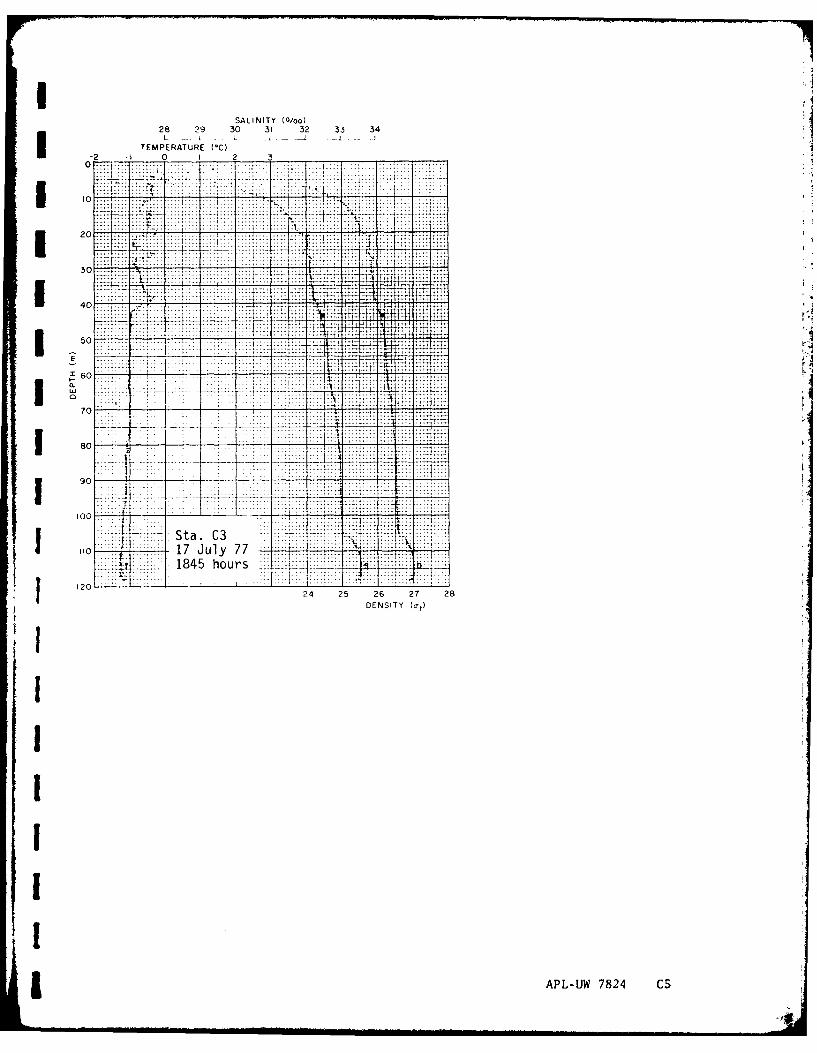
SALINITY (0/00)28 29 30 31 32 33 34
TEMPERATURE (1C) A1 2 -1 0 1 2 3
20
30 T . ........ 4
50 ....
7 90
---- Sta .. .....ii a17 Jly80
90 ~ ~ 14 hours.... ..
20 - -- -7 - 7w . .. . . .
240 25 2. 27 28t
StENSITY
.
120
I APL-IJW 7824 CS
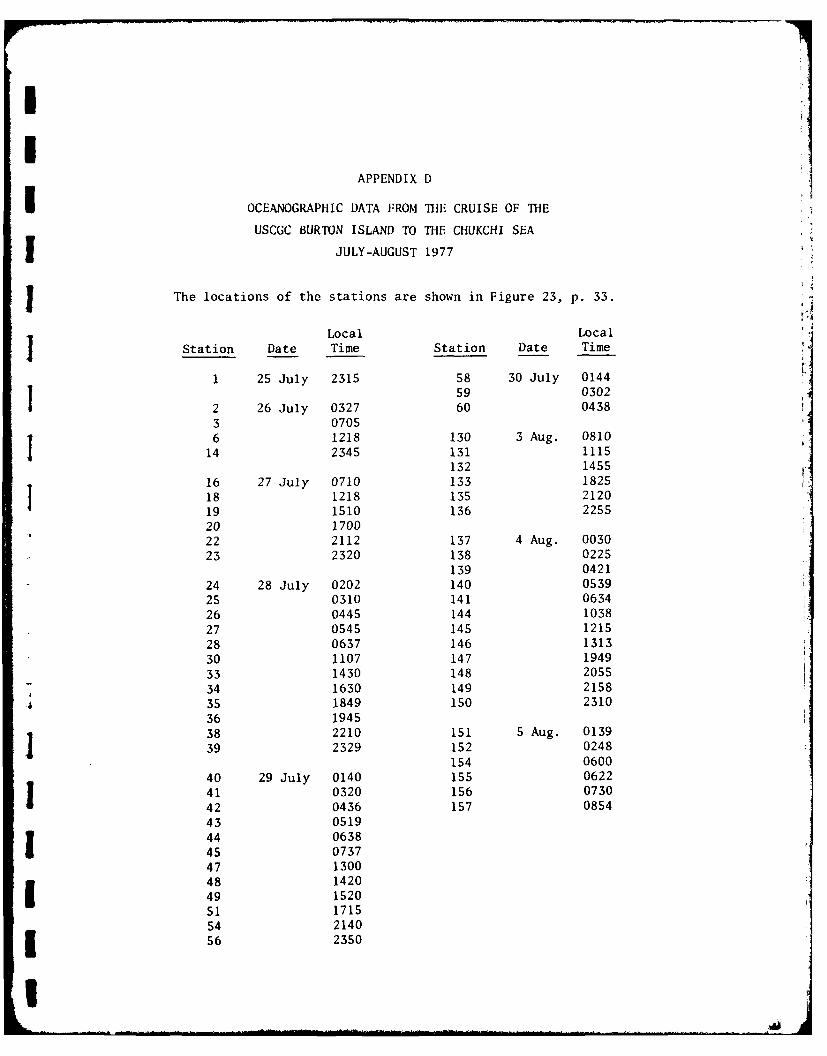
APPENDIX D
OCEANOGRAPHIC DATA FROM THE CRUISE OF THE
USCGC BURTON ISLAND TO THE CHUKCHI SEA
JULY-AUGUST 1977
The locations of the stations are shown in Figure 23, p. 33.
Local Local
Station Date Time Station Date Time
1 25 July 2315 58 30 July 014459 0302
2 26 July 0327 60 04383 0705
6 1218 130 3 Aug. 0810
1 14 2345 131 1115132 1455
16 27 July 0710 133 1825
18 1218 135 2120
19 1510 136 225520 1700
22 2112 137 4 Aug. 0030
23 2320 138 0225
139 042124 28 July 0202 140 0539
25 0310 141 0634
26 0445 144 1038
27 0545 145 1215
28 0637 146 131330 1107 147 194933 1430 148 2055
34 1630 149 2158
4 35 1849 150 2310
36 1945
38 2210 151 5 Aug. 0139
39 2329 152 0248154 0600
40 29 July 0140 155 0622
41 0320 156 0730
42 0436 157 0854
43 051944 063845 0737
47 130048 142049 1520
51 171554 214056 2350
I
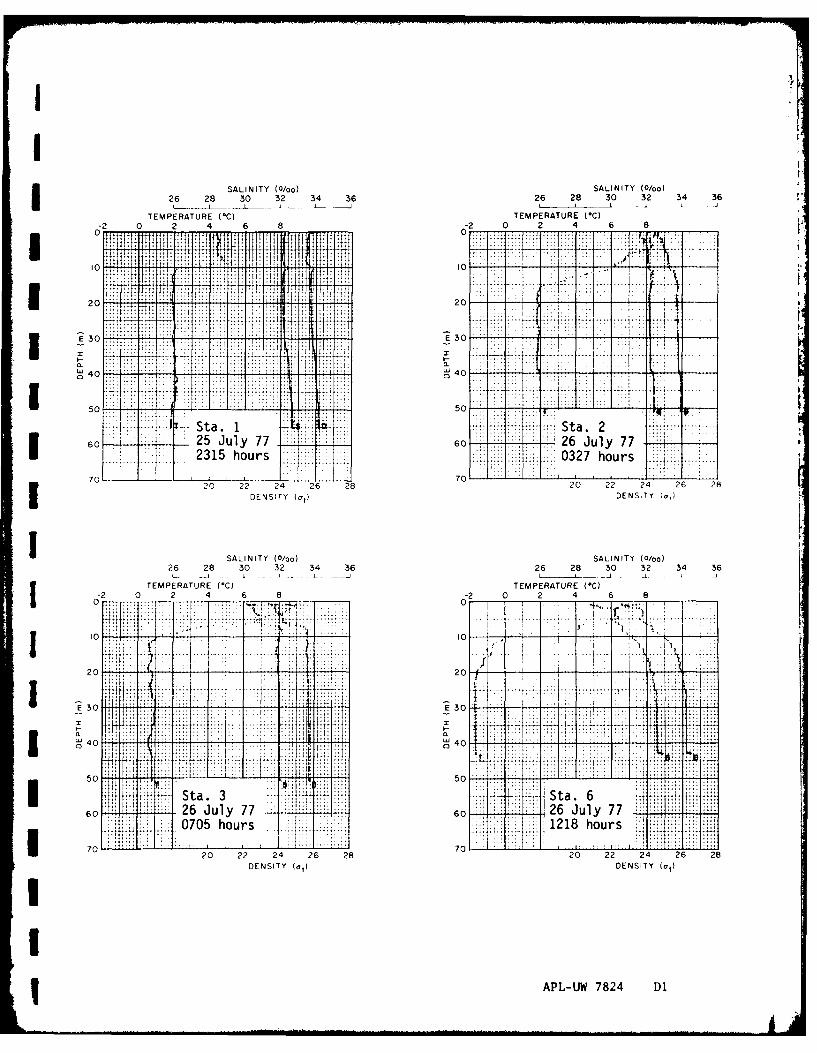
SALINITY W0/o) SALINITY WOoo)
26 28 30 32 34 36 26 28 30 32 34 36TEMPERATURE (*C) TEMPERATURE (*C)
-2 0 2 46 2 0 2 4 6 8
200 q0 T!.C..
60 26ul7 30
20 22 24620C 0 2 4 2 2
26 28 30 32 34. 36 26 28 l 30 32 34 3L..E~. 25 3Ay7 . ...
20 20 22 24 2
SA3NIT (0/00). . .28.303. 34C
- _I _ IT M E AT R *
~~wi
v0 ... ..5
30 Sta 33Sa0I 7760 26Jl40 2 uy7
60 26L Jul 782 6
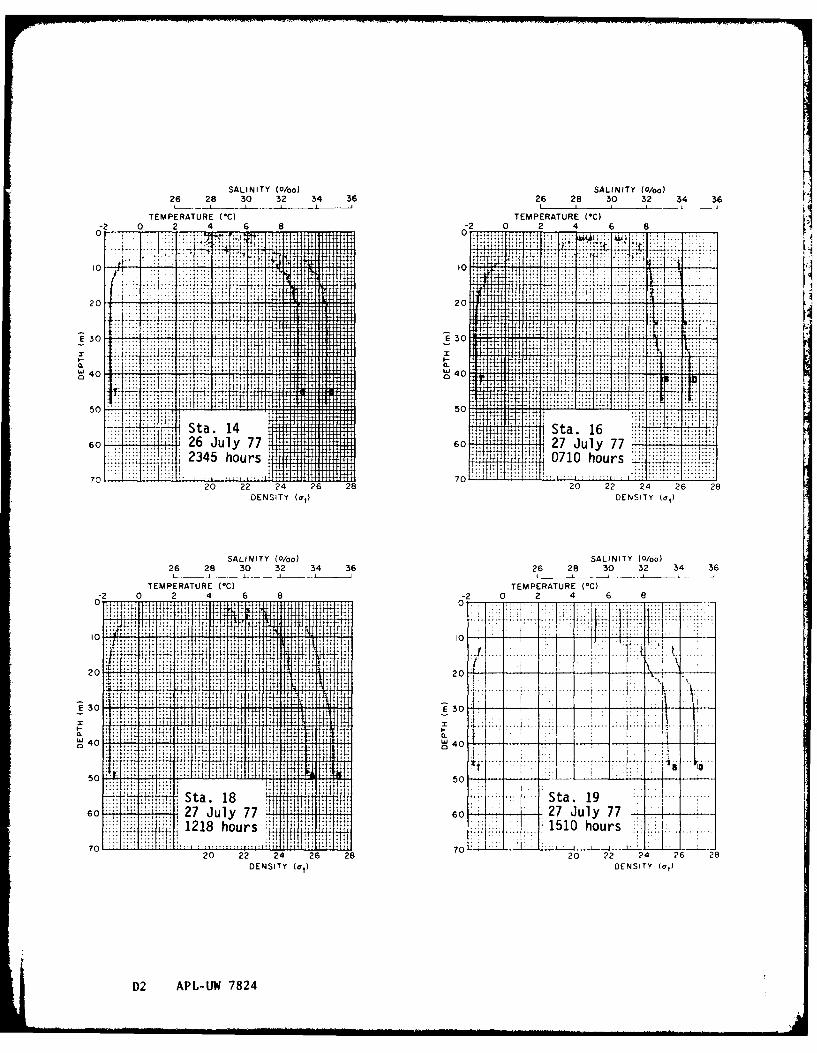
SALINITY W0oo) SALINITY (0/ba)26 28 30 32 34 36 26 28 30 32 34 36
TEMPERATURE (*C) TEMPERATURE (*C)
.40.
60 0 ~.~ ,2 uy7
........................................................... ..... .........
26 2... 30 33436208 30 3 4 3
40 0
0
'1............it 4.......................
50 Xi; ..
... . . . . . . . . . . .S. 19. 5
60. 26 July 60 27July77. .
1510 hours.
20 2 2 6 820 22 24 26 28DENSITY (a,) DENSITY (adI
SAINT APL-IJW 7824TY(0o
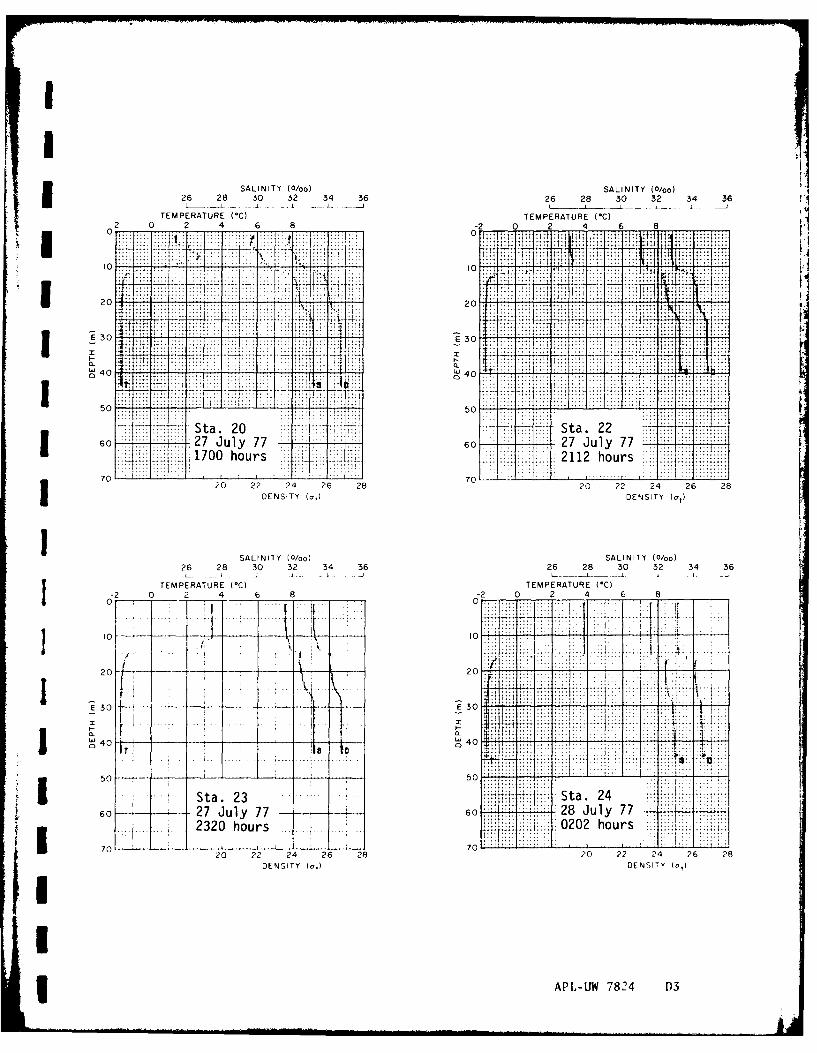
SALINITY (0/00) SALINITY (0/oo)I26 28 30 32 34 36 26 28 30 32 34 36TEMPEATURE(*C)TEMPERATURE (*C)
-2 0 2 4 6 8-2 0 2 4 6 8
.... ...... .. .. . . . . .. . . . . . ..... :t9.I-7
20 2C.. ... 20
U 30 8t : :;1: ::,E30
a 40 LU40
.. ... ... ... .2 ...Sta.... 20. .... ta 2
50
1700 ours2112 hours
7C/ 24 26 28 7020 22 24 26 28
SALINITY (0/00) SALINITY (0/00)26 28 30 32_ 34 36 26 28 30 32 34 36
TEMPERATURE (00) TEMPERATURE (*C)
0-2 0 2 4 6 8 02 0 2 4 6 8
20 -20
.. .....
[ 0
40 T 40
60 27ul7 - 60 28 July 772320 hours .02hours
20 22 24 26 28 20 22 24 26 28DENSITY (a) DENSTY (a,)
APL,-UW 7824 D3
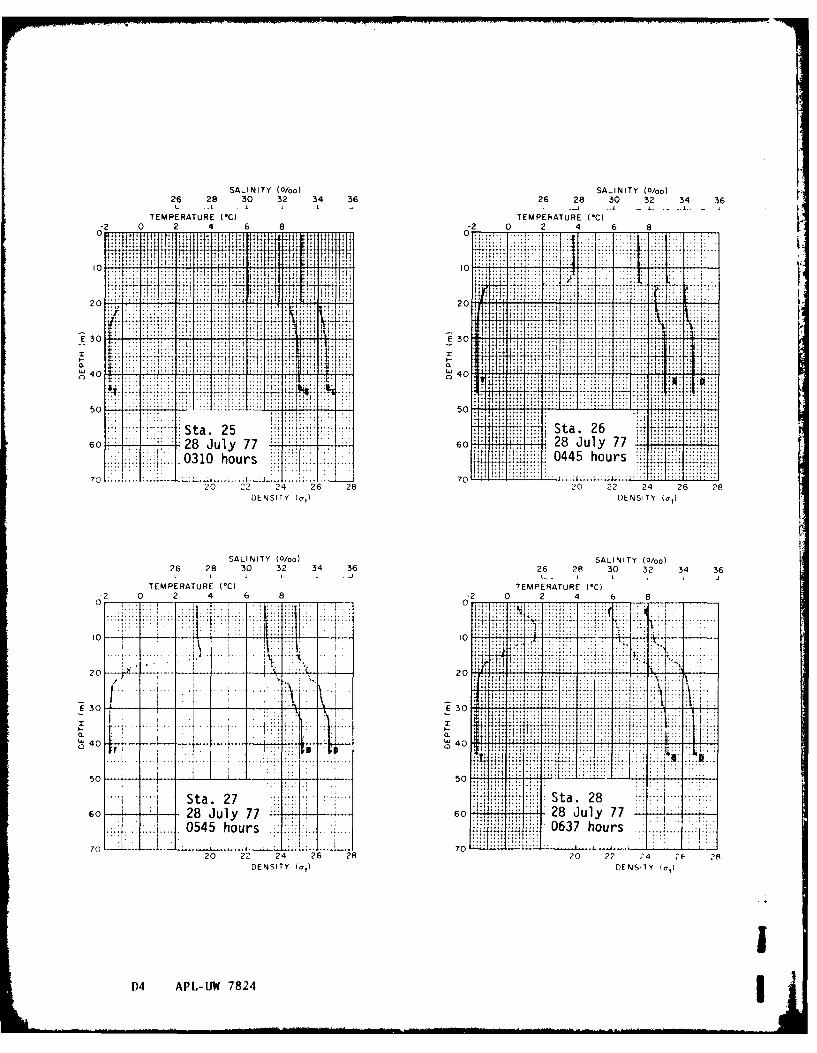
SALINITY (0/00) SALINITY (0/00)26 28 30 32 34 36 26 28 30 32 34 36
TEMPERATURE (*C) TEMPEhATURE (*C)-2 0 2 4 6 8 -2 0 2 4 6 8
0 0,.,. -
1 1 4 , :
202
E 30........ E 30.. .... .. . ...
40. . . . 40 t . ..
.. ~: .......
0 : :.:: . .. .:........................................................... .... .... .. ..50 50
Sta. 25ISa.260............28 July 77............60r 2J y7. .......
:1 :.. 310hous * lil: U5P~0445 hours
70 70 ... ... ..70.2 0 22 24 26 28 L 0 22 24 26 28
DENSITY (at) DENSITY (at)
SALINITY (0/oo) SALINITY (0/00)26 28 30 32 34 36 26 28 30 32 34 36L- - -1 - I L - - -
TEMPERATURE (*C) TEMPERATURE (*C)
0-2 0 2 4 6 8 -2 0 2 4 f6 8
41 .... ..
I0 -f- 4 ~ 10
30 .. 30
M .1** I.....
I................ ..
.Sta. 27 L~ ta. 2860 28 July 77 60 2Jl7
.0545 hours.................0637 hours,_____0 -- 70
20 22 24 26 28 ?0 2? 2DENSITY (at DENSITY (a,)
N4 APL-UW 78 2 4
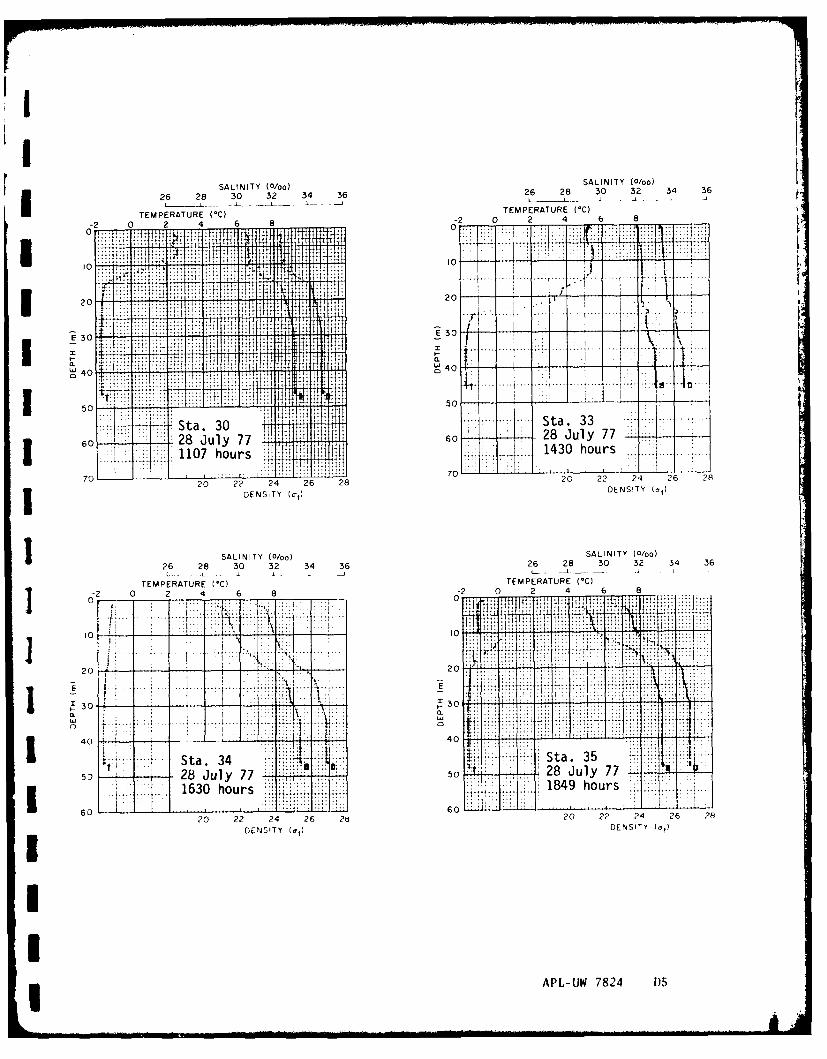
~ 1SALINITY (0/) SALINITY (0/o0) 34.3
26 28 3 32 34 36 26 28 30 32 34 6
TEMPERATURE M0
) TEMPERATURE M0
)
-2 0 2 4 6 8 -2 0 2 4 6 8
0 ma 0 iiqi T f .:1:
... . H 20 7r.7 .. 1 . . . k60 28Jly7
.... 1107 hour -El~ 140 hor
26 t28 30 32 34 3626 2 30 2 34 3
9AA 1,1% A01"'
-2 0 2 0 4 2 6 4 26 08 2 0 4 2 6 4 26 2
20- -i--1 --- 20- IL - -
I I 7H ;10 ~ ~ ...... t 77
St0 34. . .2.. St. 3220l7 5028ul7
163 hour .14 hours .... .
60~~~~.. .... L.. 0 0 2 ? 620 221 24 260
... ... T. Sta. 3ENIT Sta. 3
It532Iuy7 0172 uy7 -
APL-UW 7824 [Ds
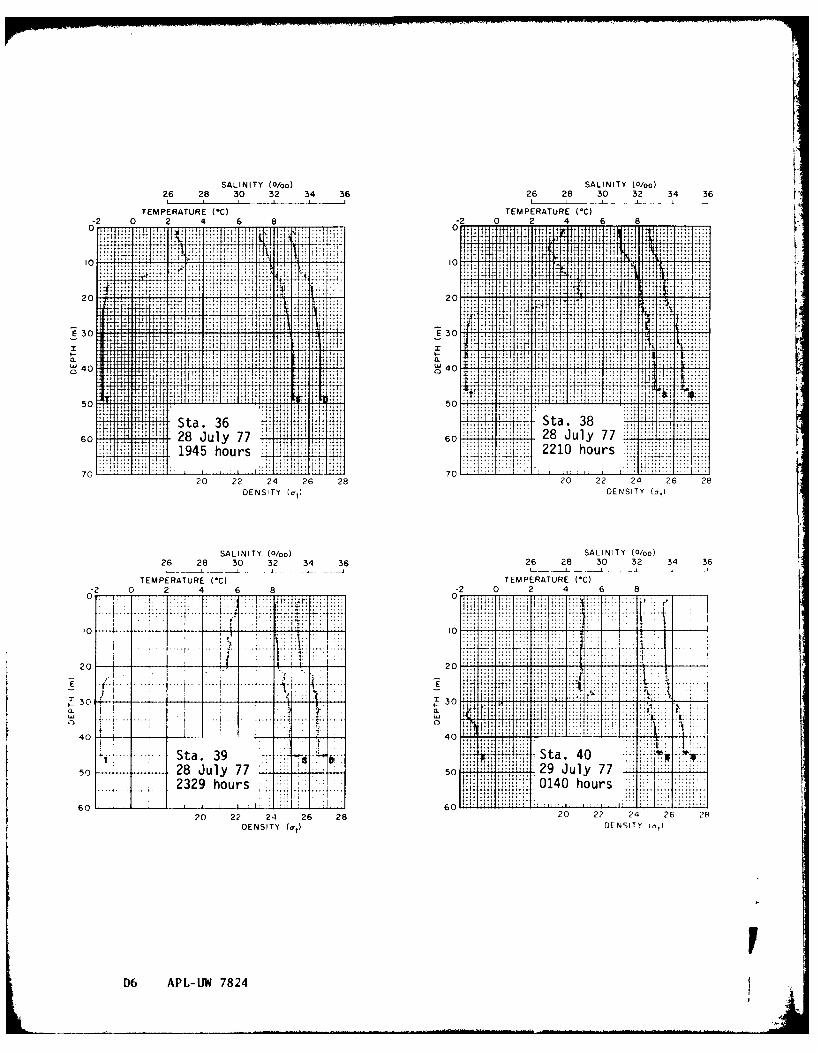
2 28 SALINITY (0/00) SALINITY (0/0)26 28 3 0 3 2 3 4 36 2 6 2 8 30 32 34 36
TEMPERATURE (*C) TEMPERATURE (*C)
-2 4 0 4 2 0
50
10 10
707 70
20 22 226 2 0 2 2 6 2
26 28 30 32 34. 362i 2 0 2 34 3
-~ jr
. .. . .. .. Iit
5 4V 1 - 5
40. ... ...40.
Sta. 36 Sta 38. ...I ...
60 - 28 July 77 L! 29Jul7719232 hours 010 hours ....
70 ~20 22 24 26 28702 22 4 26 8DENSITY (at) DENSITY (a,)
SAINT Woo)U 7824TY(0oo
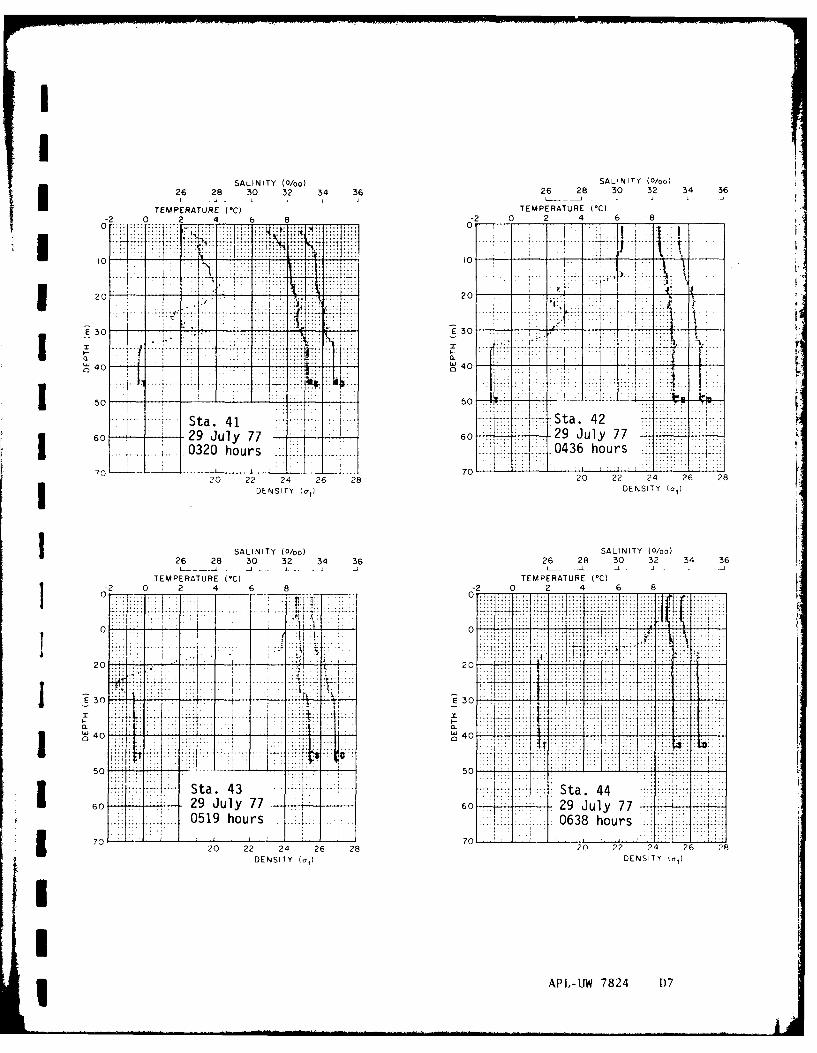
SALINITY (0/oo) SALINITY (0/00)26 28 30 32 34 36 26 28 30 32 34 36
TEMPERATURE *C) TEMPERATURE 1%C)-2 0 2 4 6 8-2 0 2 4 6 8
00- _
10 10
20 20-- t
30C -E - 30 -I
I........................
50 22 24 2-8 0 2 2 6 2
I - - ... ... 26 a 2 0 3 4 3
-2 0 6 8- 0 2 9 4ul 67 ..
20 t f0- . ..
7 01 L--4-- LC4 :
20 22 24 26 28 20 22 24 26 28
DENSITY (a,) DENSITY (,
0 A-2 UW 782 t)7 2 0 2
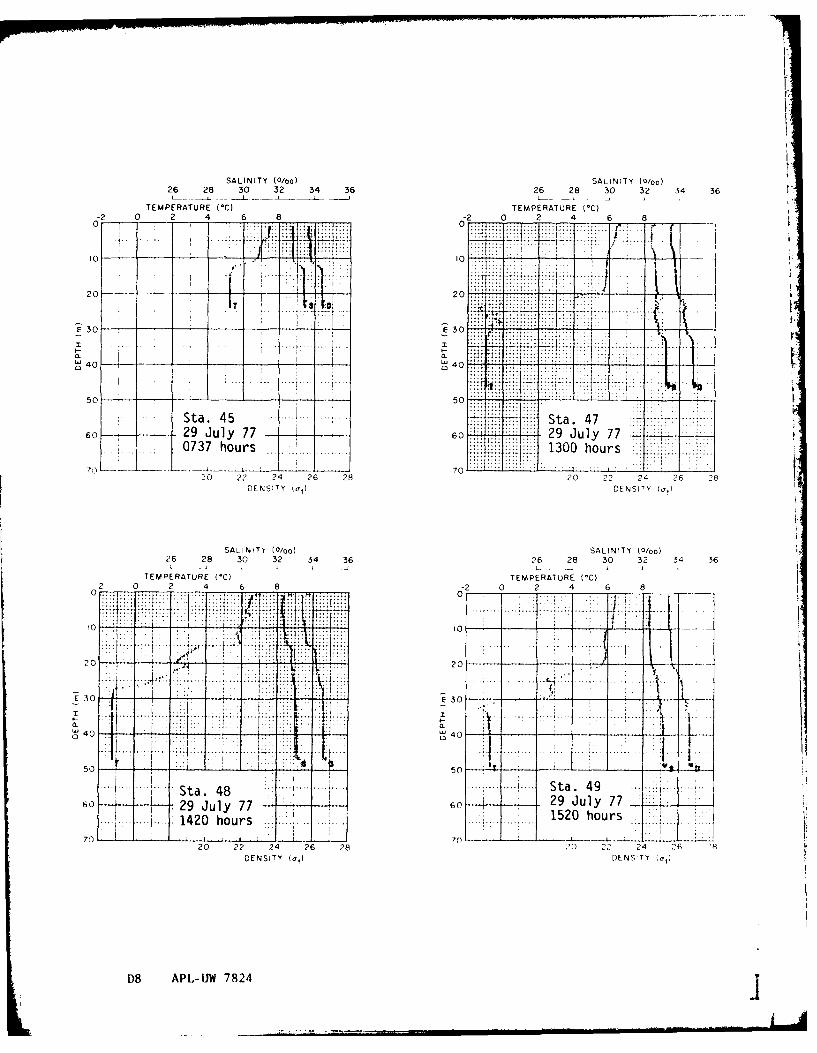
SALINITY (0/o) SALINITY (0/00)26 28 30 32 34 36 26 28 30 32 34 36
TEMPERATURE (*C) TEMPERATURE (*C)-2 0 2 4 6 8 -2 0 2 4 6 a
0 0.TT fI:ET.
20 -- - 20.
30. .0. ... .... ..
0.450 50
60 ~ Ld.4.b 60Sta.47 -
6029 July 77 [29 July 770737 hours 1300 hours
20 2 2 ?4 26 28 20 21, 24 ?6 -28DENSITY (a) D N IY(,
SALINITY 0/oo) SAL NTY /o
U 0 26 28 30 32 34 36 26 28m 30 32 34 36
050 --- -
142 hor2520or
26 28s '0 4 6 25ENI0 -50
Sta 48LJ 7824
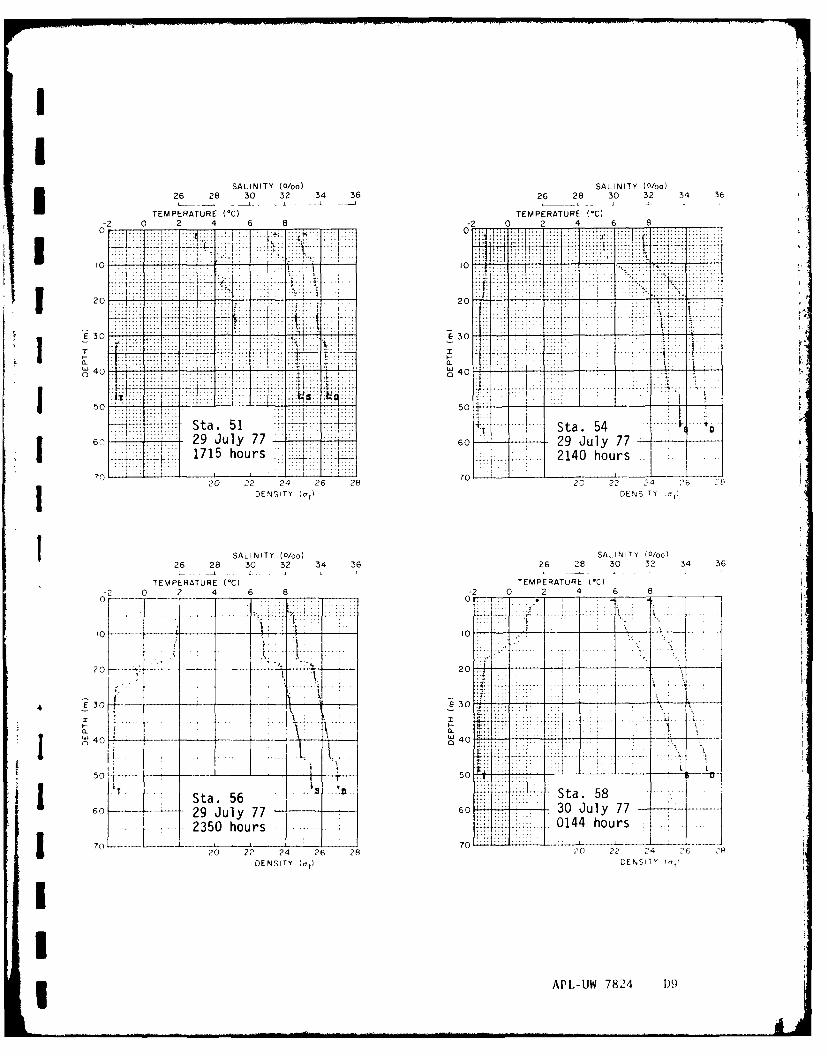
SALINITY (0/o0) SALINITY W~oo)26 28 30 32 34 36 26 28 30 32 34 36
TEMPERATURE (*C) TEMPERATURE (*C)-2 0 2 4 6 8-2 0 __2 _ 4 6 8
0 1~~~. .... ...4.,., ~ I
20-.... 20- -1"
E30 f: r 30 .- -
50 40
..~<.~* t.51 .7Sta. 54 4.
6029 J u l y 7 767 0-4 29 July 77.9....1715 hours,':I;: .m. .. 10hurs
T .4--t __ 777__ __ __ :._.j.. . . . . . . . . ..
20 22 24 26 28 20 2 2 24 2'6 E4
DENSITY (a,) DENSITY
S A LIN I TY W0oo) SAL.INITY (0/0o)26 28 30 32 34 36 26 28 30 32 34 36
TEMPERATURE (*C) TEMPERATURE (*c)-2 0 2 4 6 8 -2 0 2 4 6 8
0
0-- 10
50 -- 530 - -0
6() 30 July 77
..2350 hours - 04 hour~s
?0 2? 24 26 28 110 2 4 26 2
DENSITY (a~t) E STY(
3 APL-UW 7824 D)9
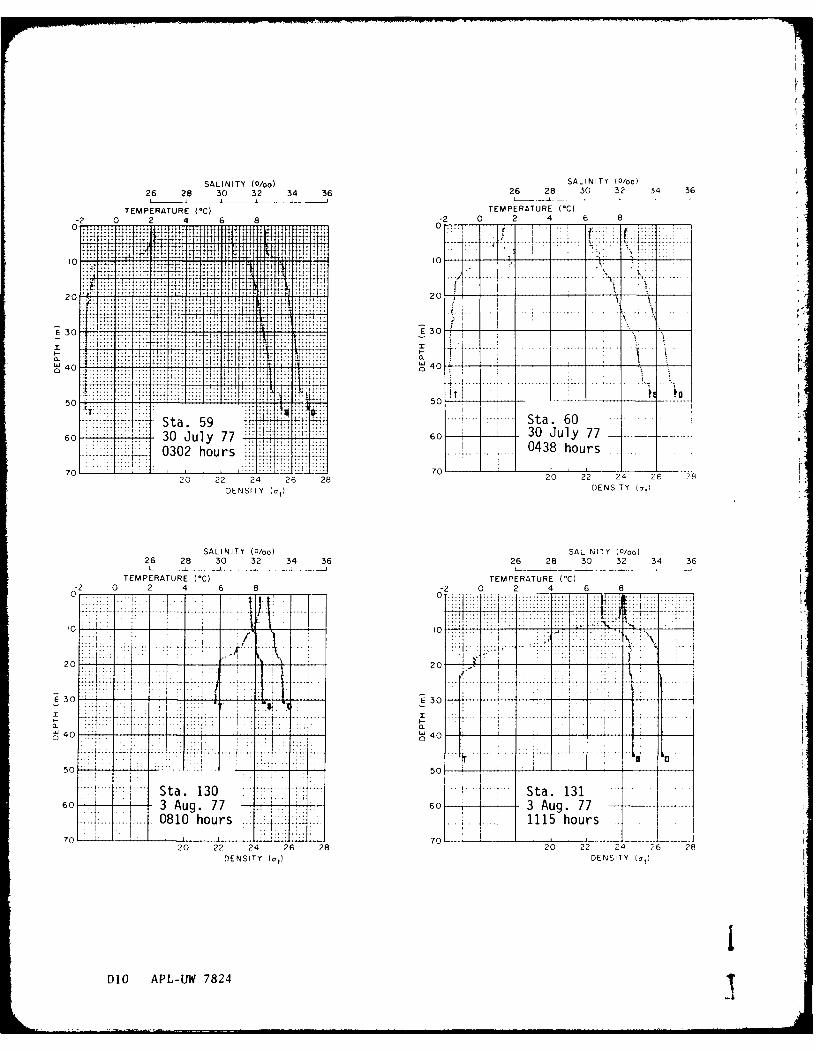
SALINITY (0/00) SALINITY (0/00)
26 28 30 32 34 36 26 28 30 32 34 36
TEMPERATURE (*C) TEMPERATURE (*C)-2 0 2 4 6 8-2 0 2 4 6 800 ri-
0 2
5 0 530
Sta 6030 Jul07
... 0302 hor..... .. 43 or
20 0 22l 24 266 0 0 22l 247
70DENSITY (a)DENSITY (at)
SALINITY (0/00) SALINITY (0/0 o)26 28 30 32 34 36 26 28 30 32 34 36
TEMPERATURE ()%) TEMPERATURE M )0 2 0 2 4 6 8 -2 0 2 4 6 6
I0 T1010
10 .
2C04-- ------ - 20 1. -
E31 ~ i.*30r.. .... . .
D10 Aug. 724 Ag.7
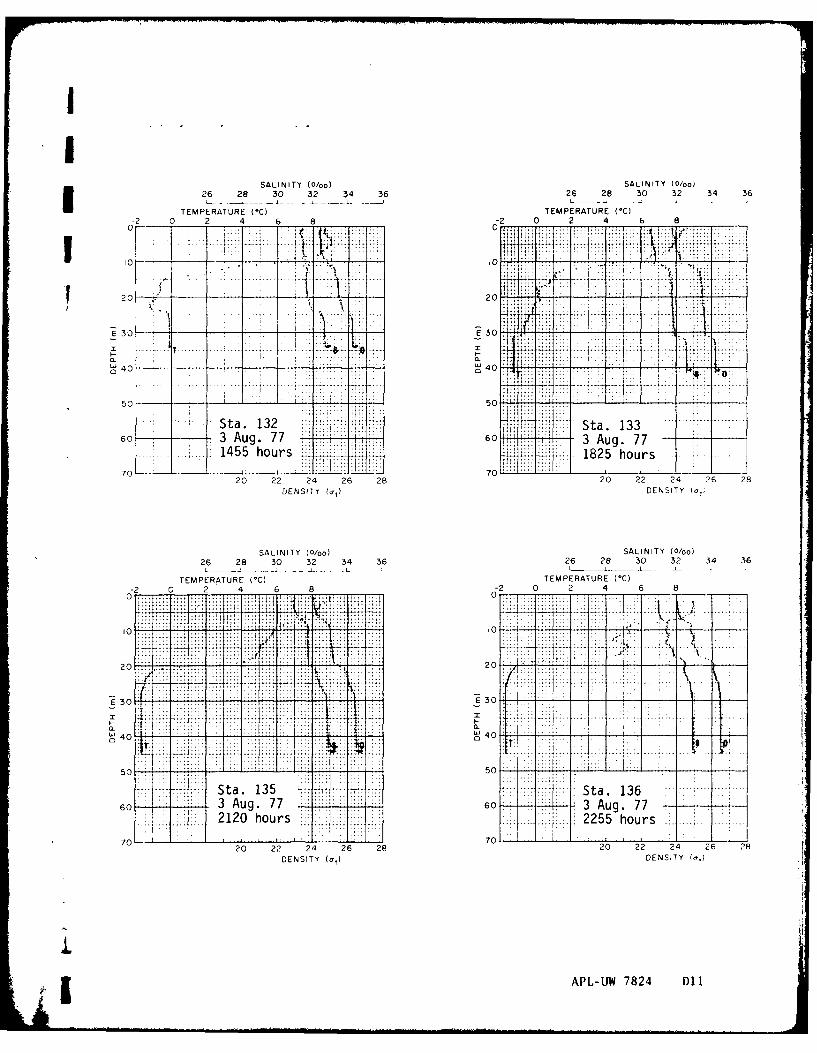
SALINITY Woo)SAI TY 0/oI26 28 30 32 34 36 26 26 30 32 34 36TEMPERATURE (*C) TEMPERATURE ('C)
2 0 2 4 6 8 -2 0 2 4 6 8
10 to~
20 --- -201 i
0. 7. 7 ..
50 -50
............. ta. 132 1 Sta. 13360 3 Aug. 77 60. 3 Aug. 77
...... 1455 hours .185huS
70- 20 22 24 26 28 7020 22 24 26 28
DENSITY (a,) DENSITY (a,;
SALINITY (0/ool SALINITY (0/o26 28 30 32 34 36 26 28 30 32 34 36
TMEAUE(C) TEMPERATURE) (C)2 0 2 4 6 8 -2 0 2 4 6 80:.,. 0*
..........................
20 t 80o
..............
St. 135 Sta 136- -60 3Aug 77 6 03Au.7
212 hour 225 hor7C F7C _
202C4 26 2 0 22 2 6 2DENIT . 1
DENSIT ...
40i. 4
603 u. 760Aug. 727 l
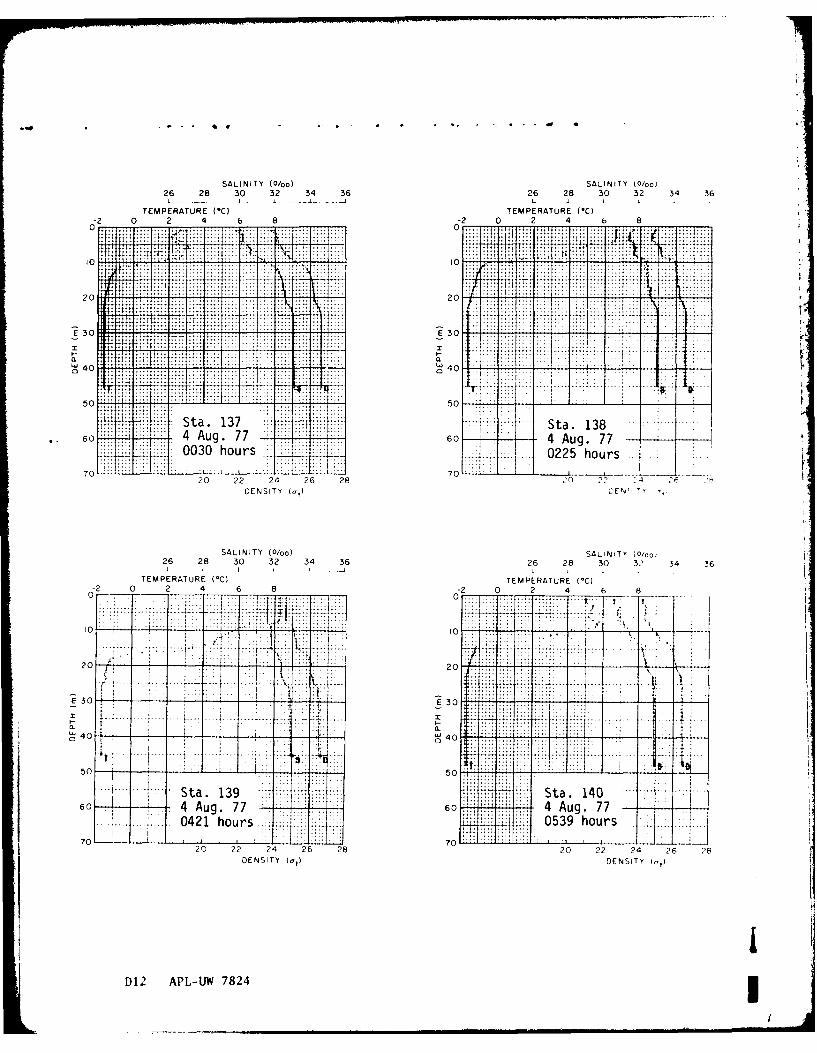
SALINITY (0/00)SAI TY(/o
2 28 3 32 3 3626 28 30 32 34 36
TEMPERATURE (*C) TEMPERATURE (*C)2 0 2 4 6 8 -2 0 2 4 6 8
0 00 10 -
20 7
E 30 j II:: :::4E3
50T : . ..: 5...
Sta. 37 Sa 13604 : u.7 0 4Ag.7
70 ~ .. 20. DENSIT ... 26 28 .. . ._ _ _ _ _ .. .... ....
-200 4 Aug 87 2602 4 6C Aug. 77
220 22-- 24 2 8" -
26 3028- 30 32 303 6 2 3 4 3TE PRTR (* IE EAUE(C
. . ... ....
20 ........................... ................................ .... ..............
50~.. ...-- -..-.-... .0.
.. ... Sta. 139St . 1 0 .. .........60 4 u.77 60 ..... 4 Aug. 77
0421 hours .~:. 0539 hours
7020 22 24 26 287 20 22 24 26 .28
DENSITY (adI DENSITYI'I
D12 APL-IJW 78241
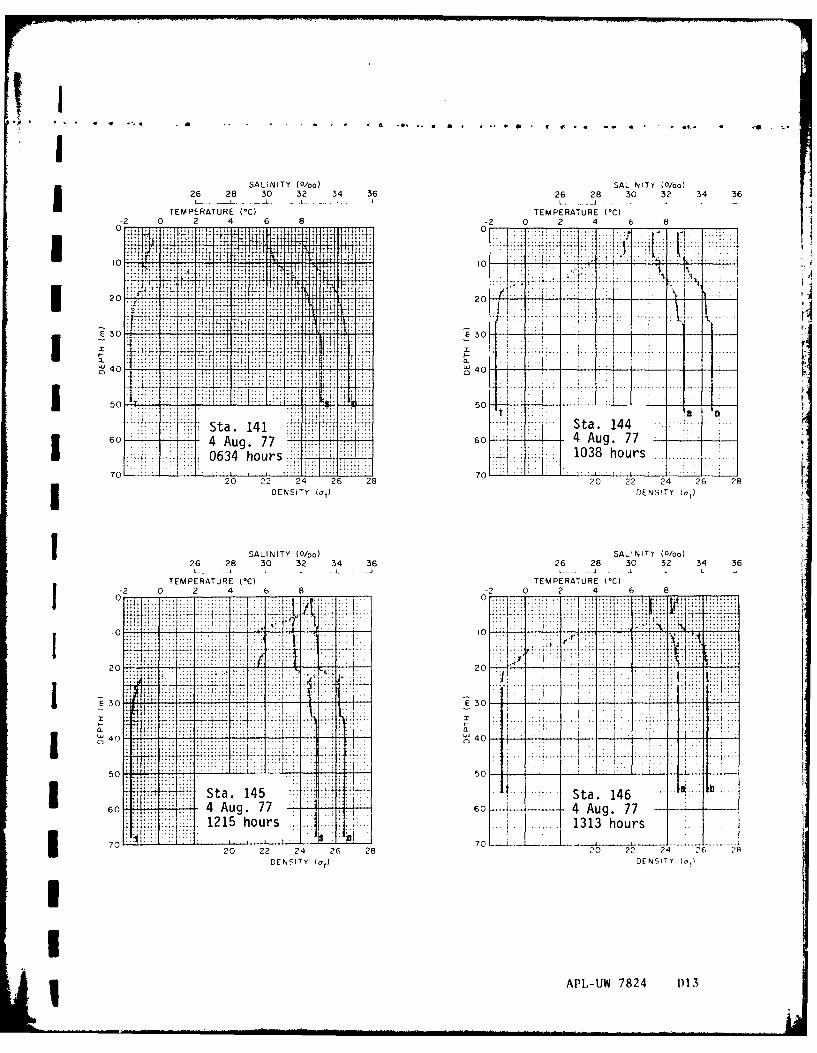
SALINITY (0/60 SLNTY)/o
26 28 30 32 34 36 26 28 30 32 34 36
TEMPERATURE (*C) TEMPERATURE (*C)
101E 30.
04 -.-...-- ..-.
40 ..... ... ... .. ......... .... .... . . . .Ti, 50
Sta. 1416 4 Aug. 77 7 260 4 Aug. 77
0634 hourS>: 1038 hours70 _____ :. 7 0 ~l~
20 2 2 26 2820 22 24 26 28
DENSITY (at) DENSITY iat)
SALINTY (/oo)SALINITY (0/00)26 28 30 32 34 36 26 28 30 32 34 36
TEMPERATURE (*C) TEMPERATURE (*C)
-2 0 2 4 6 8 -2 0 2 4 6 8J0: 0 rC~fw1k .1 :1 a
10: IC
...................... ... ....
E340
4m
50 .. E3CSta. 146
145 Aug- 4Ag.7 60 4 Aug. 77 604 71215 hours .. .. ...... 1313 hours
520 22 24 26 28 2 0 22 24- 26 R
DENSITY (ad~ DENSITY lcl
APL,-tW 7824 D)13
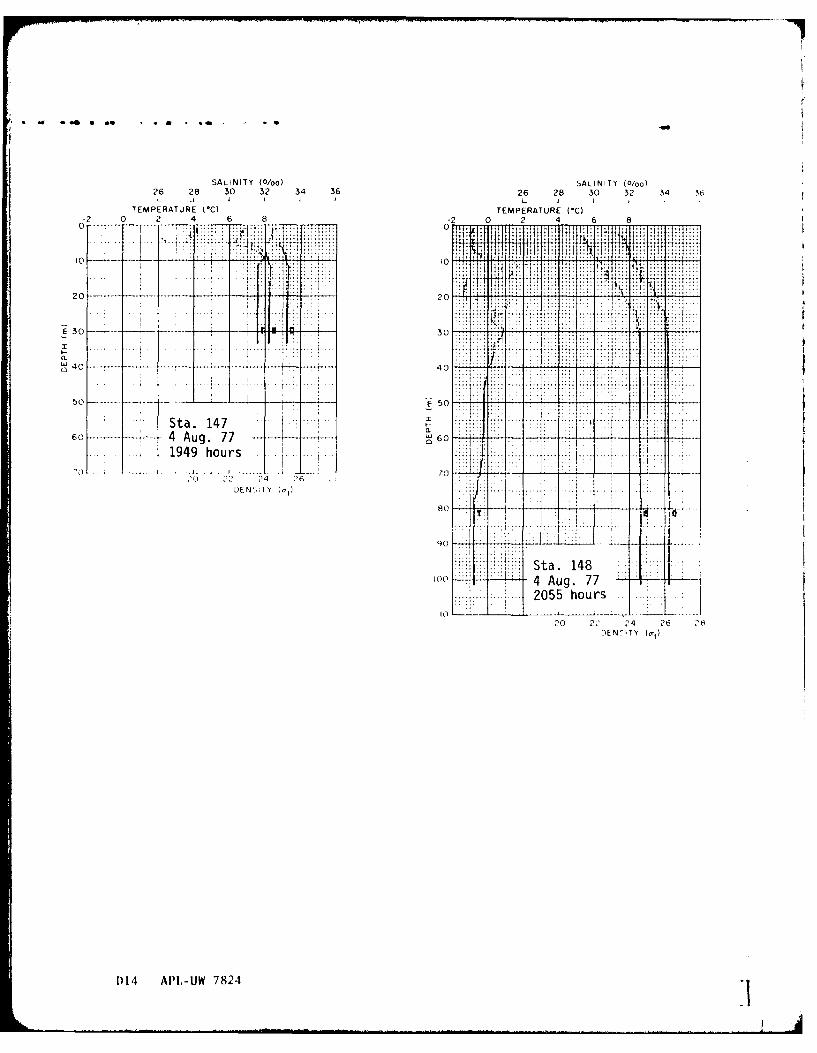
SALINITY (0/oo) SALINITY (0/0 o)26 28 30 32 34 36 26 28 30 32 34 3t6
L .- I I I L I I I
TEMPERATURE (*C) TEMPERATURE (*C)-2 0 2 4 6 8 -2 0 2 4 6 8
OT~~ ~ ..... .. ...... F T0
20 ------ - 20 r
40 40
50- 50T
Sta. 1476o------ 4 Aug. 77 60--* i
1949 hours- -- -- -- - ----- - - 1.. . .. .7
C) 2? 24 C6 -
80 I
Sta. 148)0........ 4 Aug. 77
2055 hours 2
20 2,' 7 1
D14 API.-UW 7824
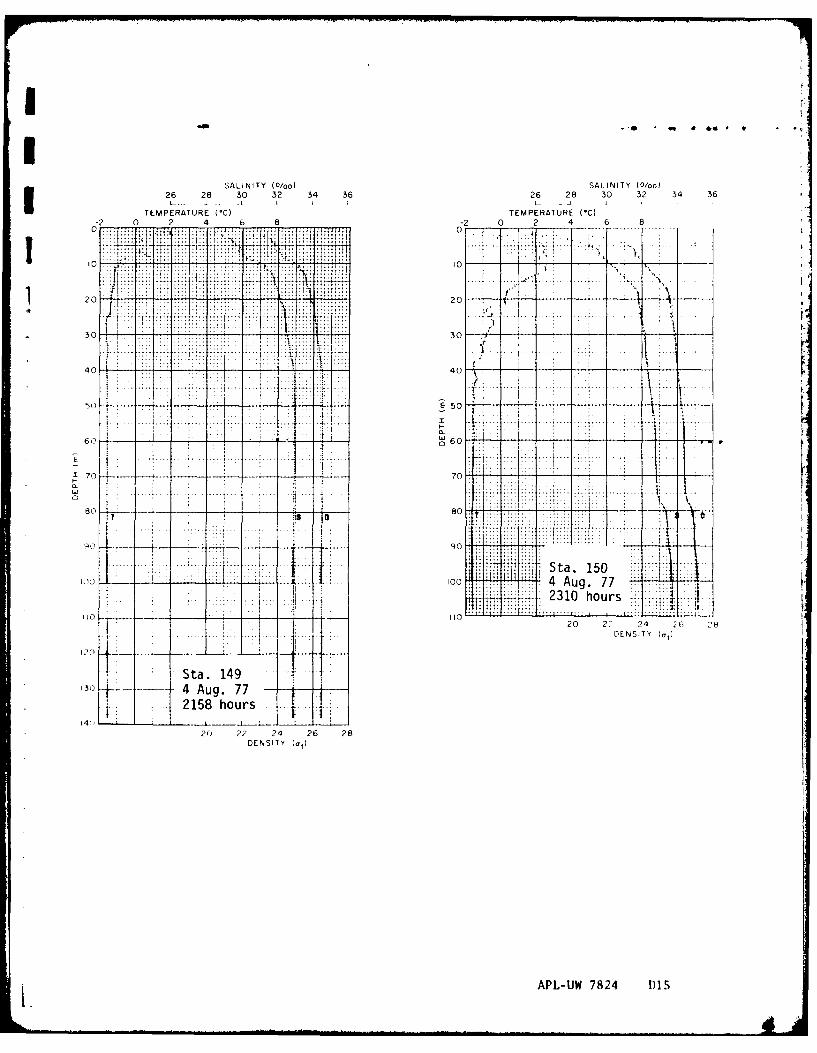
SALINITY (0/oo) SALINITY (0/00)I26 28 30 32 341 36 26 28 30 32 34 36TEMPE RATURE (*C) TEMPERATURE (*C)
-2 0 2 4 6 8 -2 0 2 4 6 8
Ii.j 0 *..t7yv.. -4-..-. .. ..
30 1 0-~
4 . ..... ...... . . .. . . . . . .
20~
7I- i, .. 90 ...
:7*: :7:: 7, .
5o St05T. u.. 77:.
231 hour 1 2:E, -........... .... .. .. .. .. ......................... .... . ...
20 70 4 6 2
I?() 90
Stta. 149501,1 100---- 4 Aug. 77
*~21 ho15uhurs*
20 22 24 26 289DENNSIT(a,
AP0U 782 Aug 7
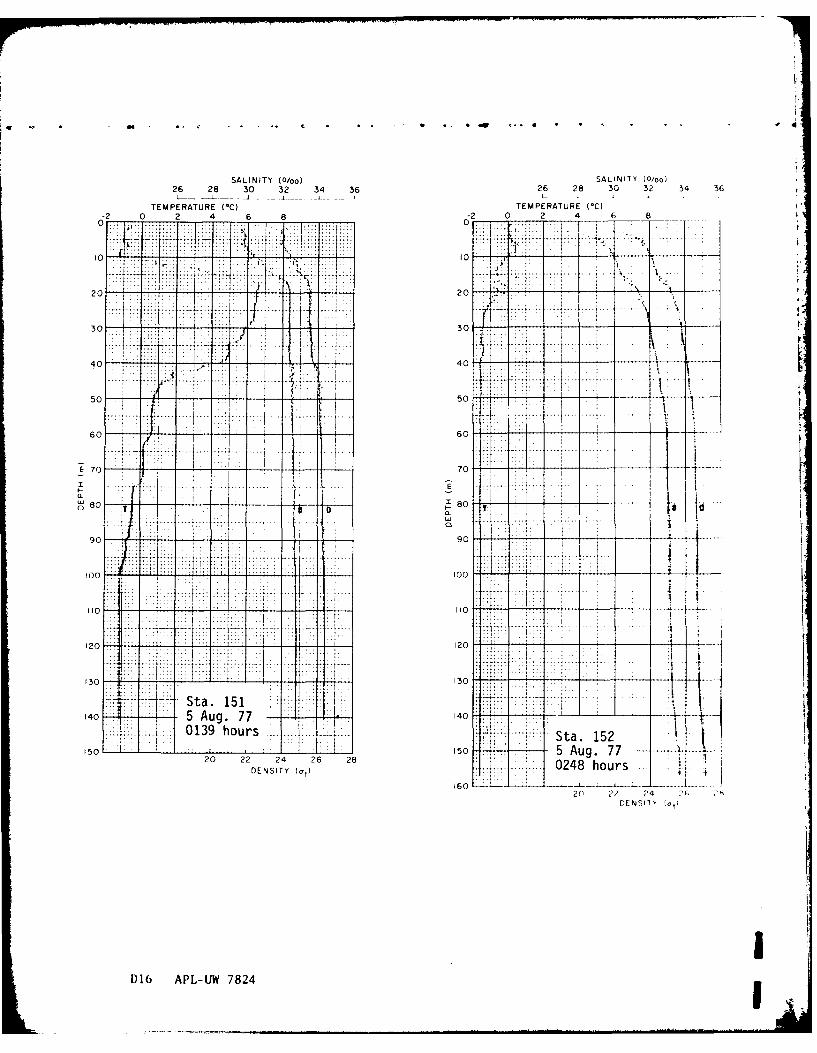
SALINITY (0/00) SALINITY (0/00)26 28 30 32 34 36 26 28 30 32 34 36
TEMPERATURE (*C) TEMPERATURE (*C)-2 0 2 4 6 8 -2 0 2 4 6 8
10 .. .... 10
20 I.20-4a- ------
40 40
30 -- 6 0 -J+±----
EI 10 7. .
ii~8 ..........
n 80G ------ --- I t-*-* 0 -
I I .. .. . . .- .. .
90~ .. ~;~19
100 ~ ::J : T. 1 T.
.: [ 7:, -7 -7-1 ---
Sta. 151(40 5 Aug. 7710
013 horsSta. 1520o 150 5 Aug. 77
20 22 24 26 28 04 orDENSITY (at) 04 or
160- --- - -- -20 ?4' - ,4
D16 APL-UW 7824
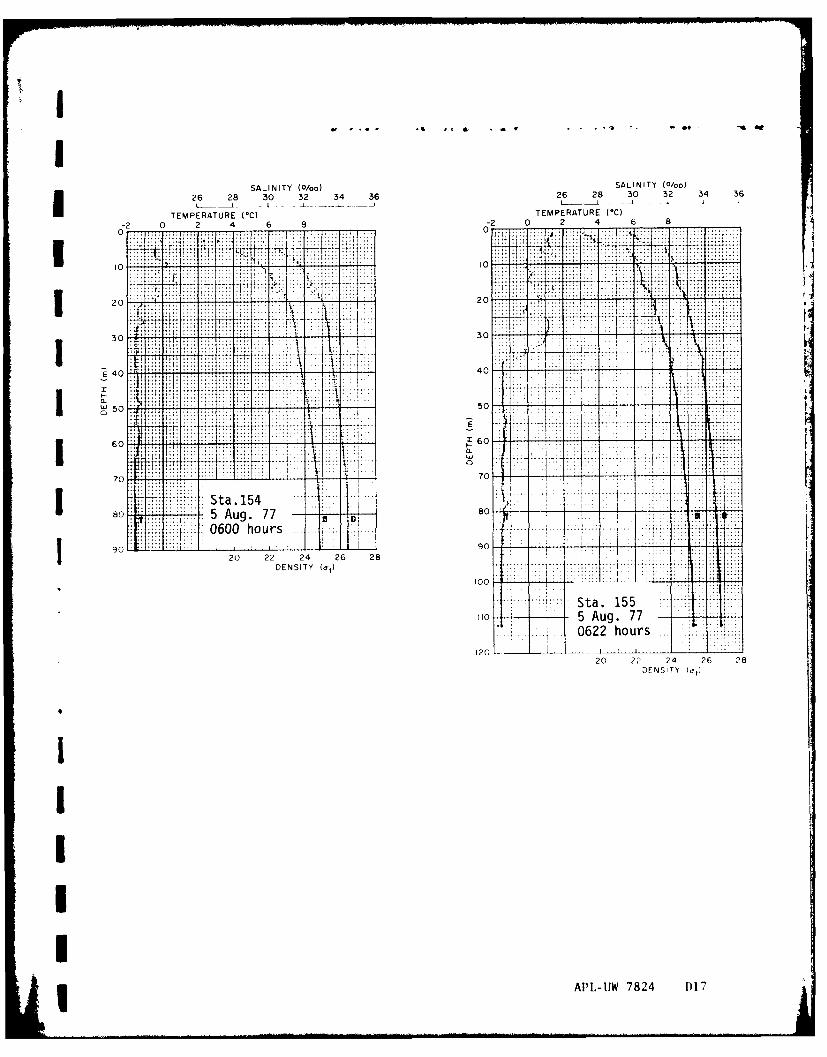
SALINITY (0/00) SALINITY W0/o)
26 28 30 32 34 36 26 28 30 32 34 36
TEMPERATURE (00) TEMPERATURE (0
C)
-2 0 2 4 6 8 -2 0 2 4 6 80 .. 0 ... ....- r
20 2
......... .......
60 30. j-. . . ... ..
70~~ . 70. .... h :
90 50 907-+20 22 ?: 26;28w!
-* Sta 155:
10 5 Aug. 77 100622 hours
20 2 24 26 DEENSITY (at)
10
St. 5
20 APLJ 7 24 1)17 B
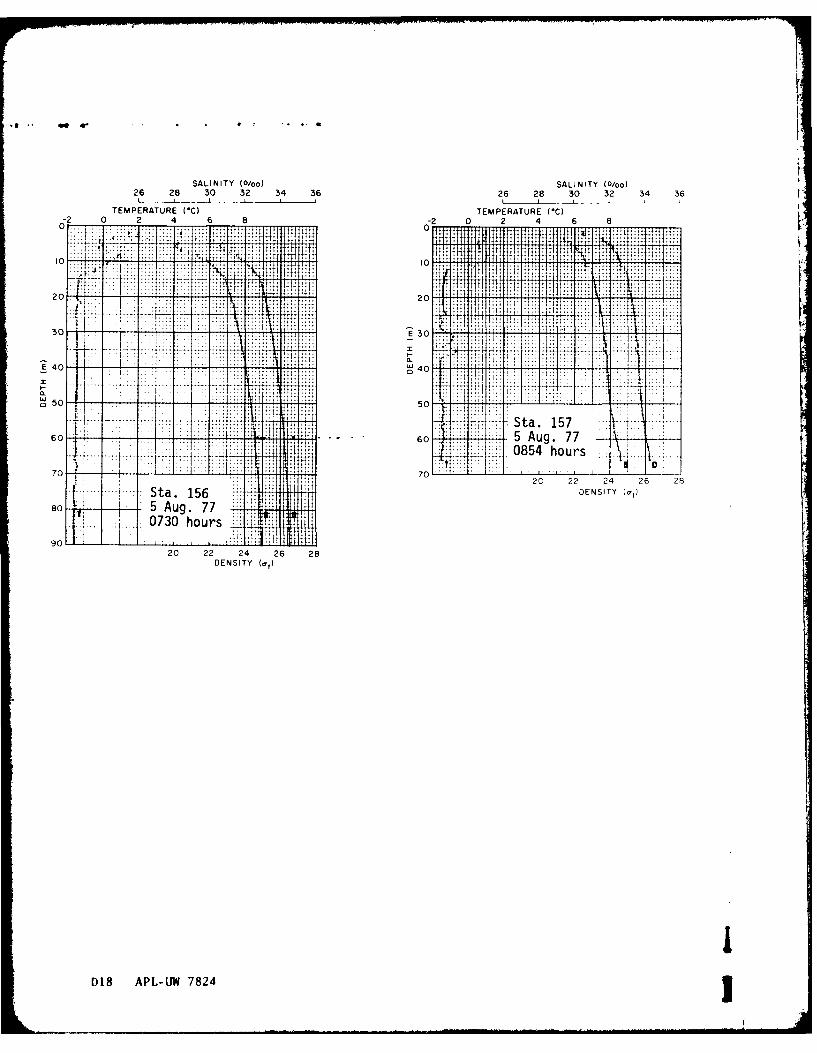
SALINITY (0/00) SALINITY (0/00)26 28 30 32 34 36 26 28 30 32 34 36
TEMPERATURE (*C) TEMPERATURE ('C)
0 -802 0 2 4 6 8
10~ ~~ ~ ~ ... ..... .. ....
'4 10*~20 20 ,
0E 30 1 L
7-775 Aug. 77
40 U0
20. 22. 24 26 28
203 22 24 26 2
208 22-U 782 26 2
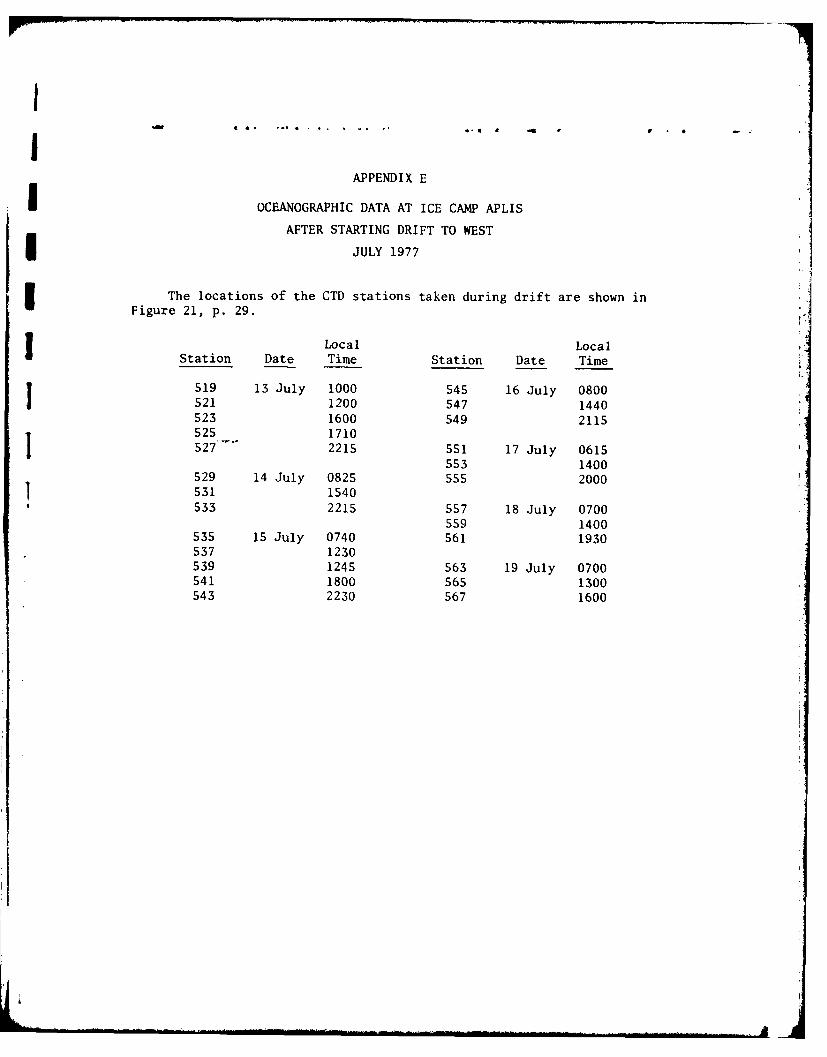
I
APPENDIX E
OCEANOGRAPHIC DATA AT ICE CAMP APLIS
AFTER STARTING DRIFT TO WEST
i JULY 1977
The locations of the CTD stations taken during drift are shown in
Figure 21, p. 29.
Local LocalStation Date Time Station Date Time
519 13 July 1000 545 16 July 0800521 1200 547 1440523 1600 549 2115525 1710527"- 2215 551 17 July 0615
553 1400529 14 July 0825 555 2000531 1540533 2215 557 18 July 0700
559 1400535 15 July 0740 561 1930537 1230539 1245 563 19 July 0700541 1800 565 1300543 2230 567 1600
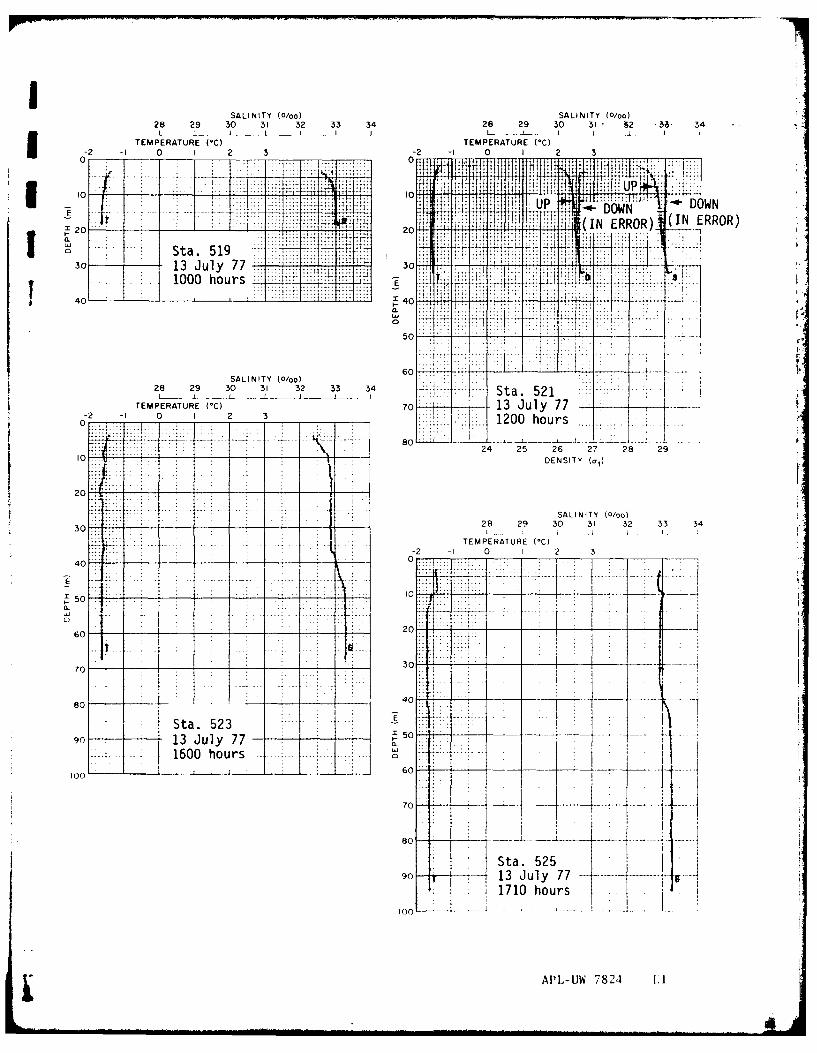
SALINITY (0/00) SALINITY (0/00)28 29 30 31 32 33 34 28 29 30 31 S2 .3-3 34
TEMPERATURE (*C) TEMPERATURE (*C)
0-2 -1 0 I 2 3 0- 1 0 1 '1
Et H ~ UP ~-DOWN -DW20 2(IN ERROR,) ( ERR
01.30 13 July 77 3
1000 hours~ T t
40---
SALINITY (0/00)28 29 30 31 32 33 34
TEMPERATURIE (*C) 701-uy7
*-2 -1 0 1 2 3
10- - DENSITY (a~
SA LI N ITY Wo)
--- -- - .28 29 30 31 32 33 3
-0 -1 C1 2
160 hors...............I ....100 - ~ ~ 60 7 _ _
70 P_
90; 13ul7 7:171 hour -A
7 730 - -- - - --- I -
70-
j APLUW 724 L
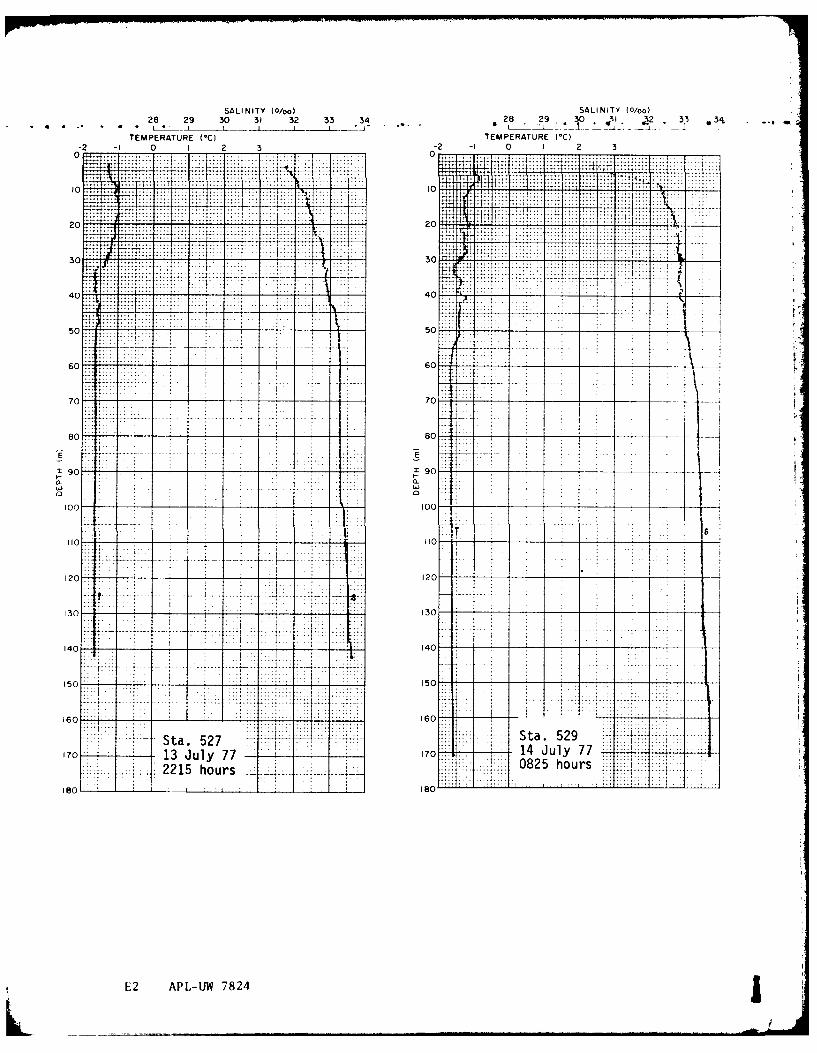
SALINITY (0/00) SALINITY (0/00)28 29 30 31 32 33 34 *28 29 30 AII 32* 33 0341
TEMPERATURE (*C) TEMPERATURE (*C)-2 -I 0 1 2 3 -2 I1 0 I 2 3
40 j0. '...
30 ~ ~ .. .... ... .... 444..
40 0 ... _..
30 ... .... 4 . ... 3
60 ...... . .0- .....
90 '90
80 -60c
7. --- -- 0
80 0
130 90-
120 120
150{ 1501
60 -.- . .:> H ~ 1160.7 Sta. 529
1013 52y 7 170 14 July 77July7- : t0825 hours:2215 hours -------
180E I I., I8t
E2 APL-UW 7824
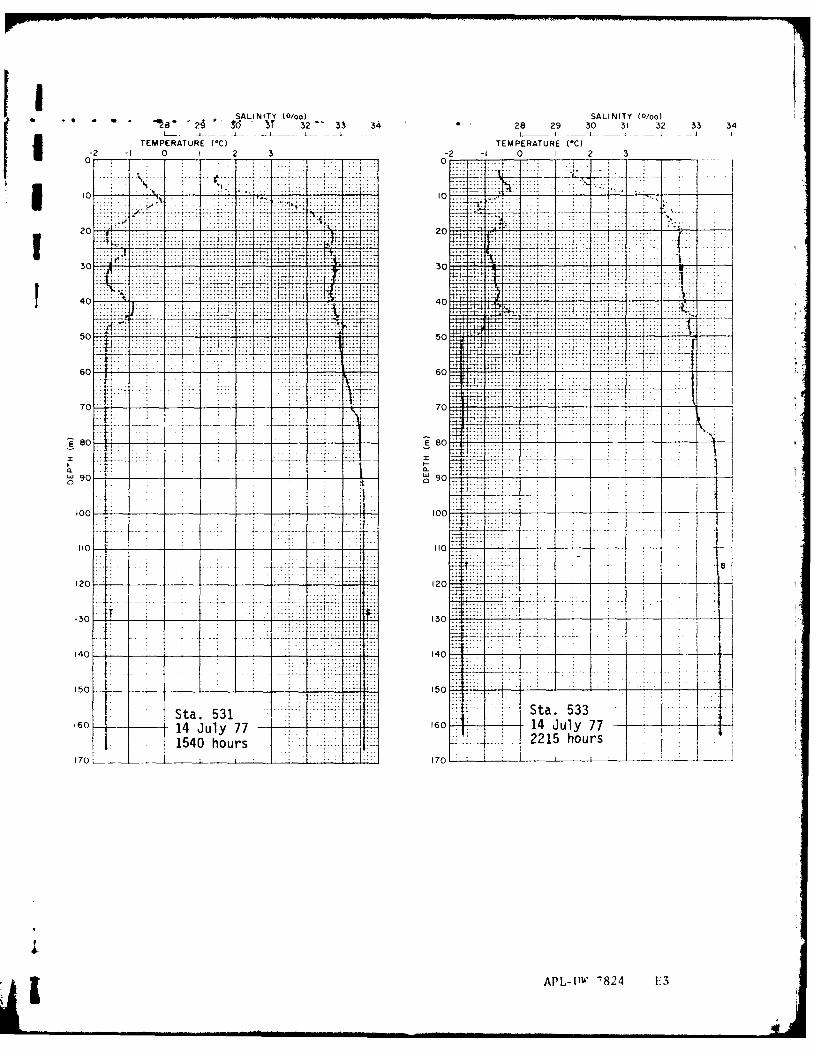
- 89~1~' 3~ ~3 8SALINITY (0/00)24 953 S 3 8 29 30 31 32 33 34
TEMPEATURE(*C)TEMPERATURE (*C)0-2 -I 0 I 2 3 0-2 -1
10- 0--
20 20
60 40
..... .. .. .. . .
-7--
610 -4.-
720 -70- -
. ... ... ... ..
a.a 531
60 14lul 7
1 154 hur
120 12 .... ..
13-1~ 18230
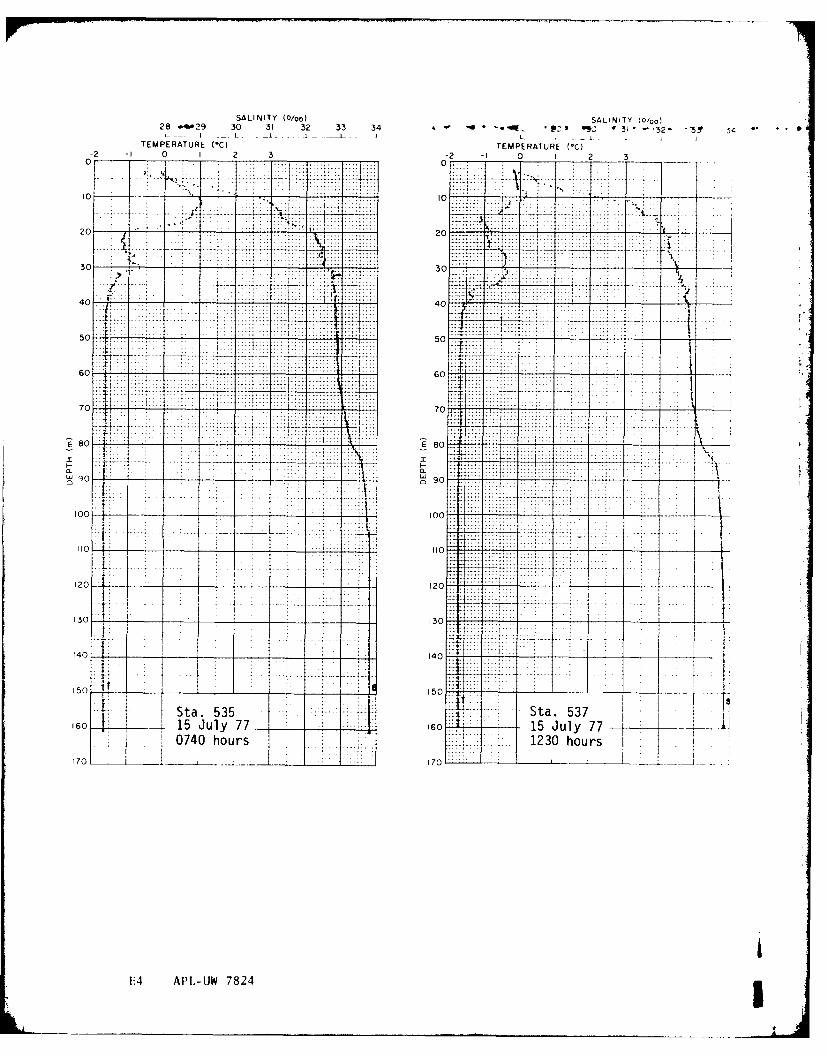
SALINITY (0/00) SALINITY (0/00)28 -4w29 30 31 32 33 34 *91 4~ ~'~ 31 -32- 3Y
TEMPERATURE (*C) TEMPERATURE (-C)0-2 1I 0 I 2 3 0-2 -l 0 1 7 2 3
-'... .. .. ..-
20 420S
77 -7777I
E~7 8077 ----- ---- -- . -E 8
5o 14 --- ------ ---
0_T_- -77-7-___ _
00~~~~~ ~ ----- ---- -7_ - - . -_ _ _
72 0 - - --- 7
i~~~o. ..... .- - _ _ _ _
7o ___ * !7_
0740 hors130hor
it 110P4 APL-IW 7824
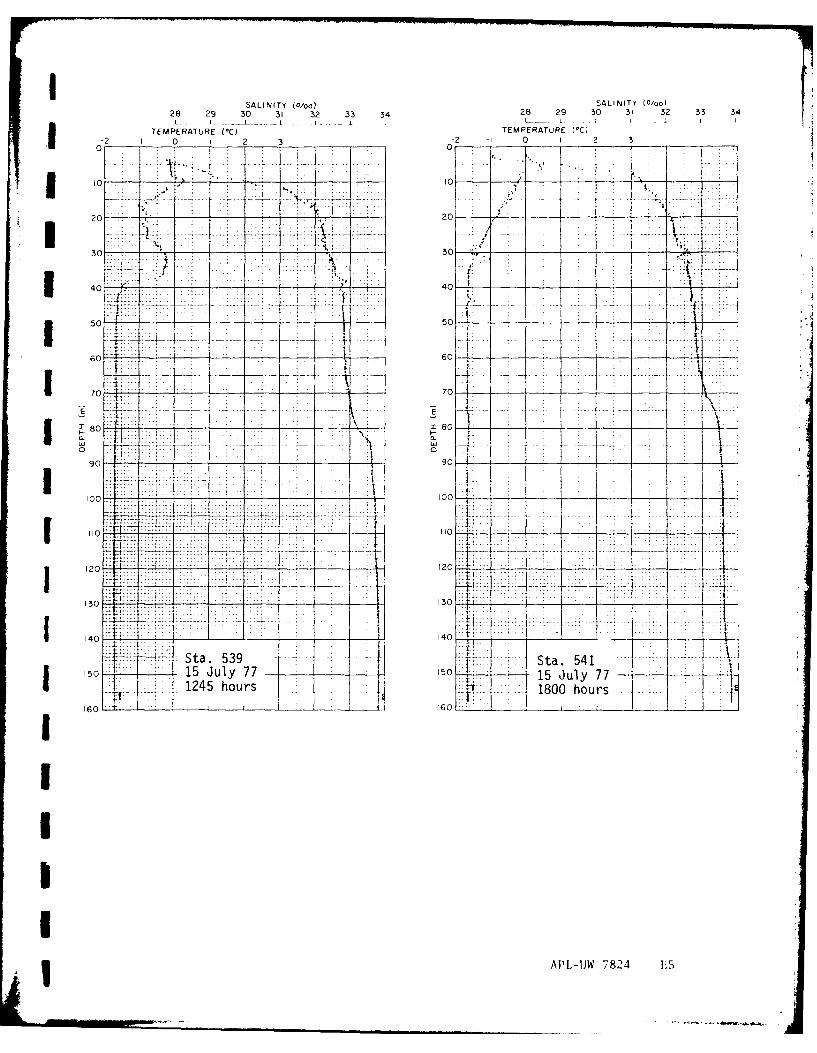
ISALINITY (O/oo) SALINITY (0/oo)28 29 30 31 32 33 34 28 29 30 31 32 33 34
TE MPERATURE (*)TEMPERATURE 10C)
-2 0 I 2 302 02
p *1
20 r~ -20
30A:30 -4 .-
.. .. ..... ..... 40
5--- -------
60 --- 460- - -
70_ 70 - -
---- ~~~~~1 -------- -------- ---- - -- - -
130 80- 1 '
(L q. .. - -
9 10 9~10 .
--- -ta 539 .. .t .54110 15uy7- 1 015 ly7
I~ ~ ~ ~~ 7 25hor 80 or120 _ __120_ __
160 ~ ~ ~ ~ ~ ~ ~ ~ ~ ~ ~ ~ ~ ~ ~ ~ ~ .. .....~__ __ _ _ _ _ _ _ _ _ i10 _ _ _ _ _ _ _ __ _ _13I3IqIt
14 4
15 5Jl 7101 JlyJ 772 E
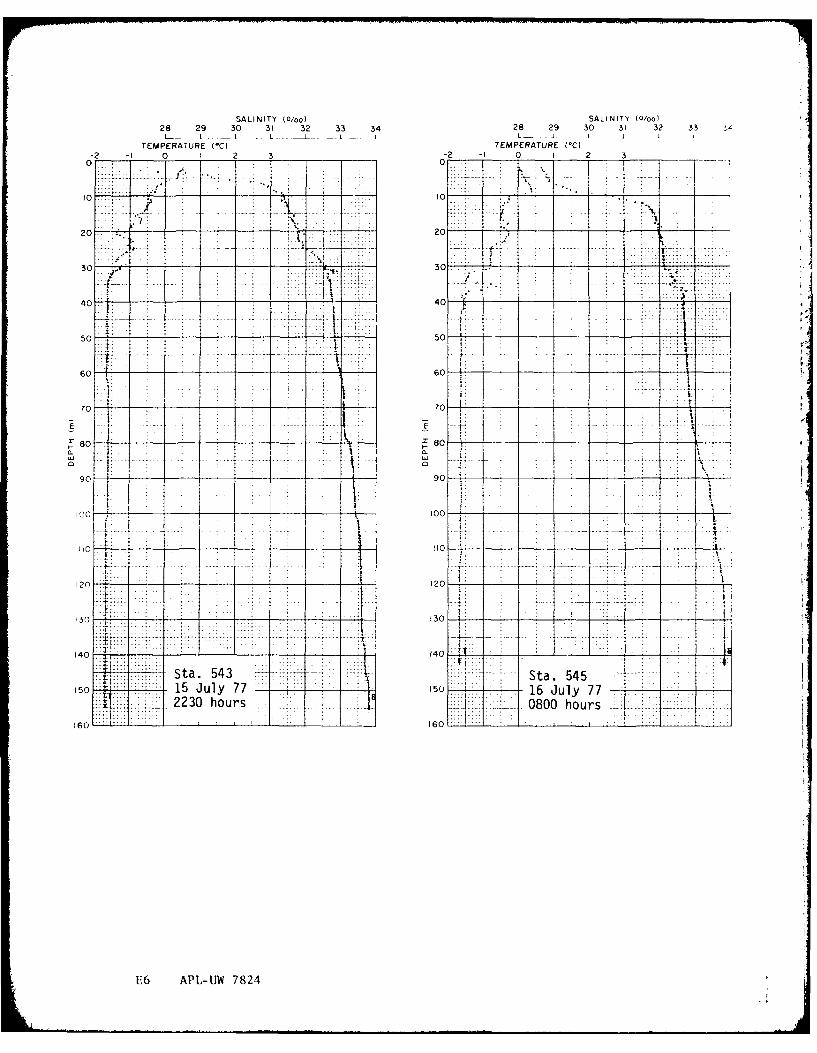
SALINITY (0/oo) SALINITY (0/00)28 29 30 31 32 33 34 28 29 30 31 32 33 ~
TEMPERATURE (*C) TEMPERATURE (*C)
0-2 1I___ 0 1 2 3 0__ -2 1I 0 I 2 3
0- --- -- -
(0 10
20 720
30 -1-i -i 30
-4--- - - - - -- - - -. . .' .......
4 0 - - - - -- 40-v -- -
50 q~--- - -so- - . + -
60 60
E
~8C____ 80- - - - -
900_90
-4-2
(30 -1 30 - -
(40 .- -1 40 --
IS 1::. Sta. 543 - - .vSta. 545 I150 ... ....... 1 Jul 7715016 July 77
.:: 2230 hour:. .:::.L 80hurs
(60 160------________ _ _ _ _ _ _- -_ _
1'.6 APL-JW 7824
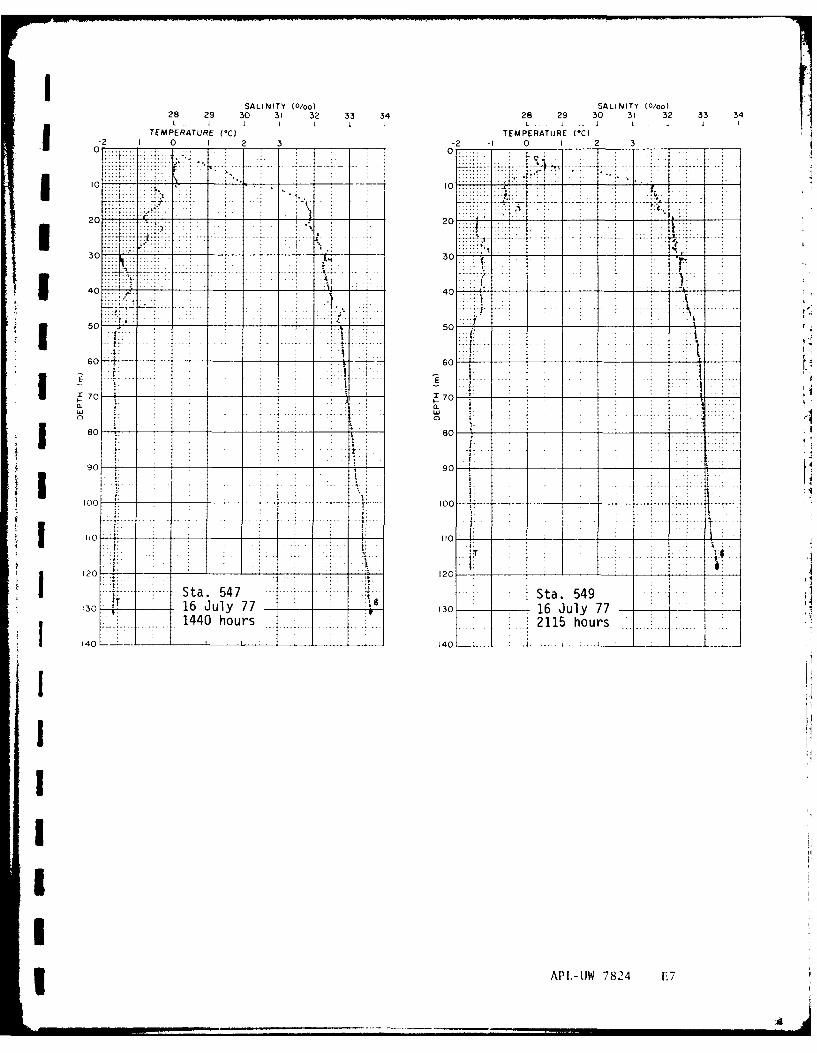
ISALINITY (O/oo)SAI TY 0/o28 29 30 31 32 33 34 28INT 290/0103) 3 3
L .. I. 28 29 30 3I 32 33 34 I . IaTEMPERATURE ('C) TMEAUE(C
0 2 0 I 2 3 0 -2 F -
10 30
........~~4 C ~ - -. --.- -; I- -- --
0 20--___ __
-7 ----------
40 A
70 0
80--- -__
*t80
90 90__
10120 _ _
Sta. 54 .. ..... ..!3 T6Juy7 Sta. 549
101 Juy7130 16 July 771440 hours 21 or
140. 1 40 15 or
AilIW784 E1
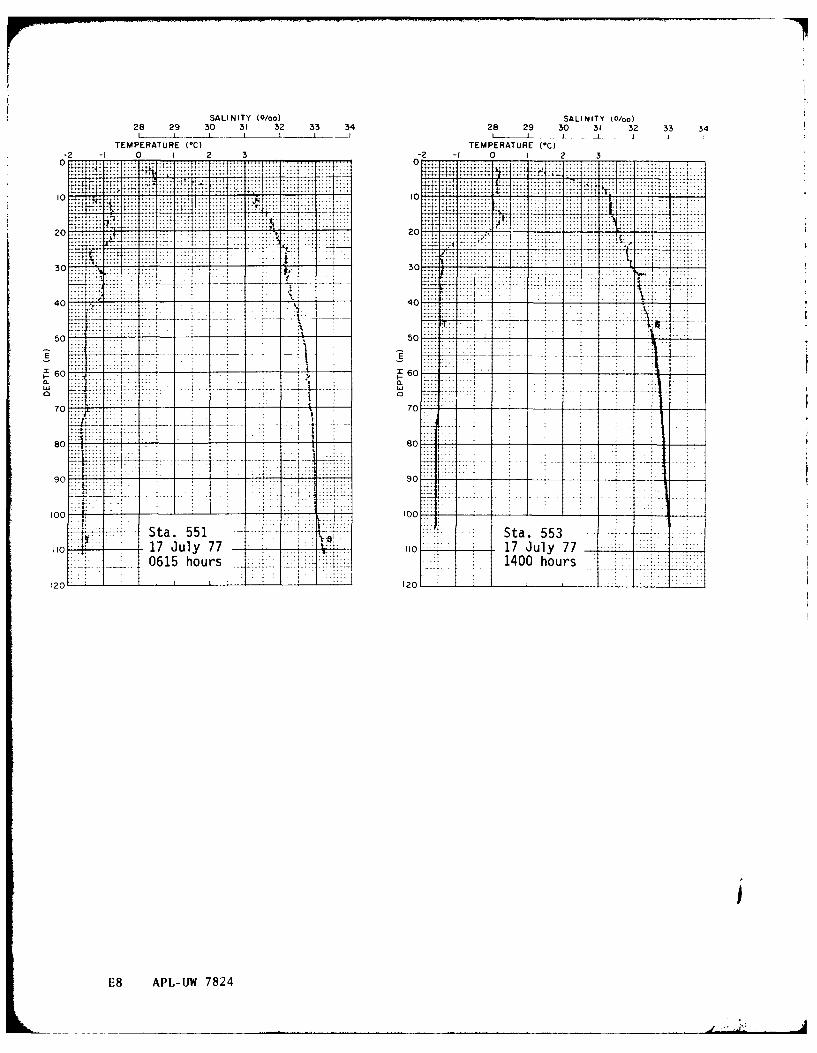
SALINITY (0/00) SALINITY (0/00)28 29 30 31 32 33 34 28 29 30 31 32 33 34
TEMPERATURE (*C) TEMPERATURE (*C)-2 -1 0 1 2 3 -2 I1 0 I 2 3
0 .. 0
20 2... 0
20 20L
.d .. .. . .
0 7= 40
-7c
50 A
12C _ . 0 -7-_
70 8 7P-W 72
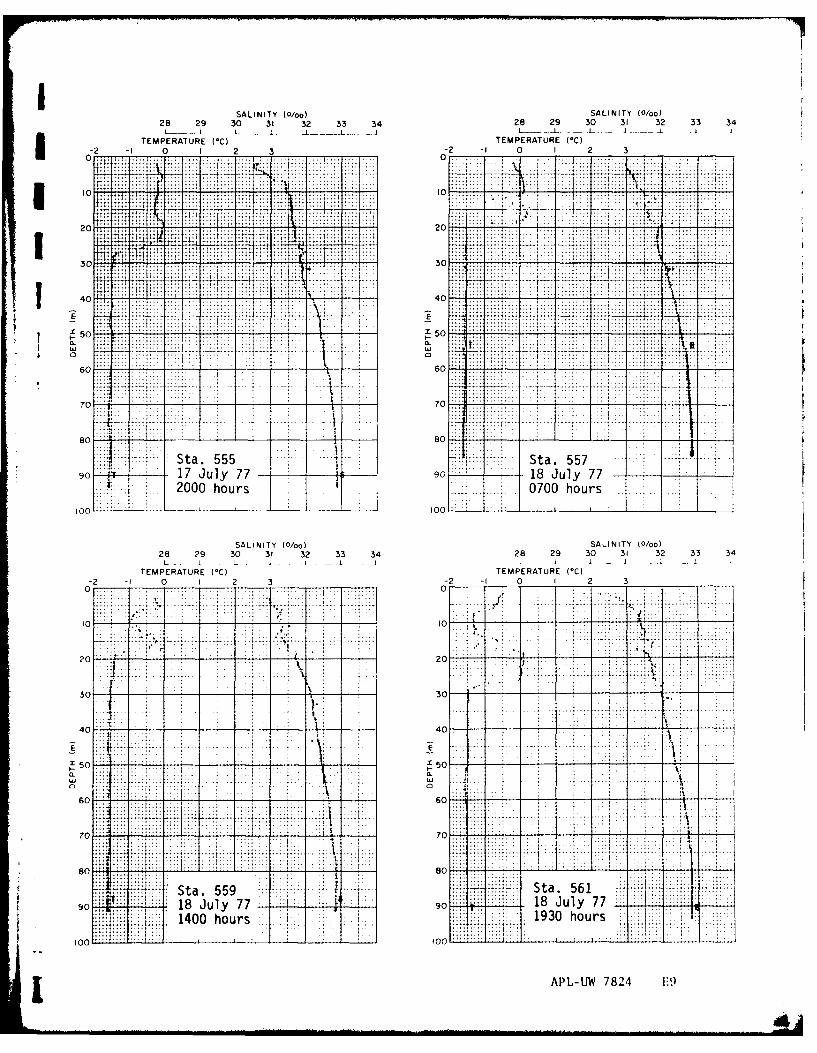
SALINITY (0/00) SAIIT.0/o
20 2 0 3 2 3 428 29 30 31 32 33 34- 1 - - - - - -
TEMPEATURE(*C)TEMPERATURE (*C)20 1 2 30-2 I 0 I :. 2 3
vC
7 .. .. .4. .4:T ~~~i2 . ... I.....
1- 7 tTT-Tv~ 4--Sta 557A
200 hours . .. 30070hor
. . . . . . . .
40 140.. ..... ... - - ------
... .. ...
60. .. .. 1'50 ~ 7 *...T
70
Sta 55 .... . t . 560 17- Ju- 67 0E 18 Jul 7
2000 ~ ~ ~ ~ .hors000hur ..
28 29 70 31 32 3 3-2-9 -0- 1 32 33 3
L I L 1 1 1L
-20 1 Jul 3 -24 90 1 2 77
10- - - - - 10
[ ..-U 7824.. a ...
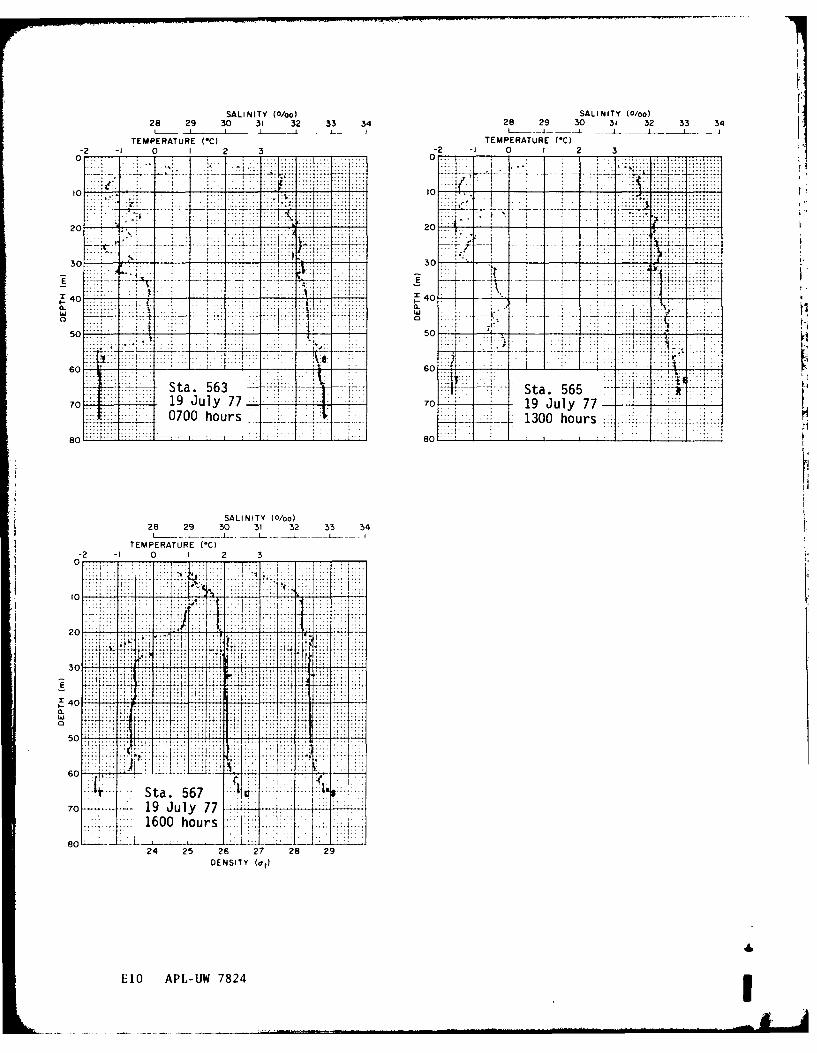
r:SALINITY (0/bo) SALINITY (0/00)
28 29 30 31 32 33 34 28 29 30 31 32 33 34
TEMPERATURE (*C) TEMPERATURE (*C)-202 3-2 -1 0 I 2 3
-2~. .0.I.2.3...
10 10..
20 -.--.- i 20-
- -. - - - - -~ .. .....-
Luo 404
SC 5 Orj - ---- ----
6C Sta. 563 01 -- Sta. 565--
70 19 July 77 70 19 July 77-0700 hours 1300 hours .....
80.L 8
SALINITY (0/00)
2 8 2 9 30 31 32 353 34
TEMPERATURE (*C)-2 -1 0 2 3
(0 .
30
0LuL
0
60
70 Sta. 567
I 1600 hours
24 25 26 27 28 29DENSITY
E10 APL-UW 78241
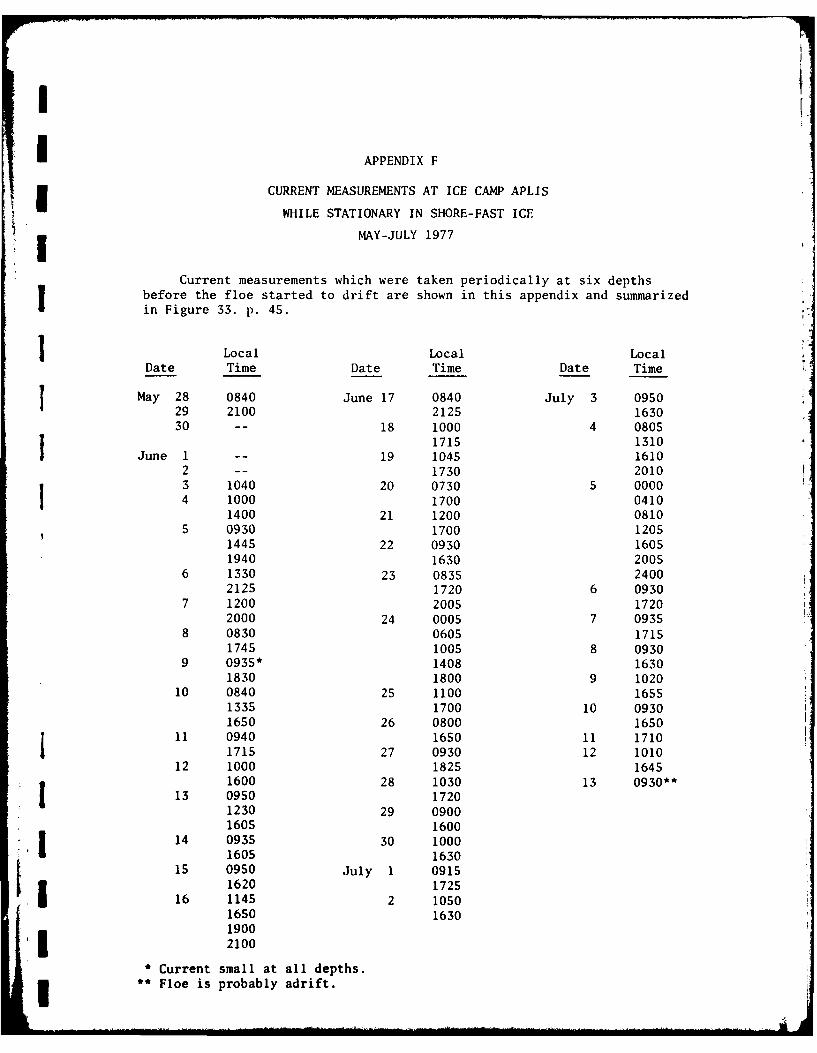
I I
I APPENDIX F
CURRENT MEASUREMENTS AT ICE CAMP APLIS
WHILE STATIONARY IN SHORE-FAST ICE
MAY-JULY 1977
Current measurements which were taken periodically at six depthsbefore the floe started to drift are shown in this appendix and summarizedin Figure 33. p. 45.
Local Local LocalDate Time Date Time Date Time
May 28 0840 June 17 0840 July 3 0950
29 2100 2125 163030 -- 18 1000 4 0805
1715 1310June 1 -- 19 1045 1610
2 -- 1730 20103 1040 20 0730 5 00004 1000 1700 0410
1400 21 1200 08105 0930 1700 1205
1445 22 0930 16051940 1630 2005
6 1330 23 0835 24002125 1720 6 0930
7 1200 2005 17202000 24 0005 7 0935
8 0830 0605 17151745 1005 8 0930
9 0935* 1408 16301830 1800 9 1020
10 0840 25 1100 16551335 1700 10 09301650 26 0800 1650
11 0940 1650 11 17101715 27 0930 12 1010
12 1000 1825 16451600 28 1030 13 0930**
j 13 0950 17201230 29 09001605 1600
14 0935 30 10001 1605 1630
15 0950 July 1 09151620 1725
, 16 1145 2 10501650 1630
19002100
* Current small at all depths.3 ** Floe is probably adrift.
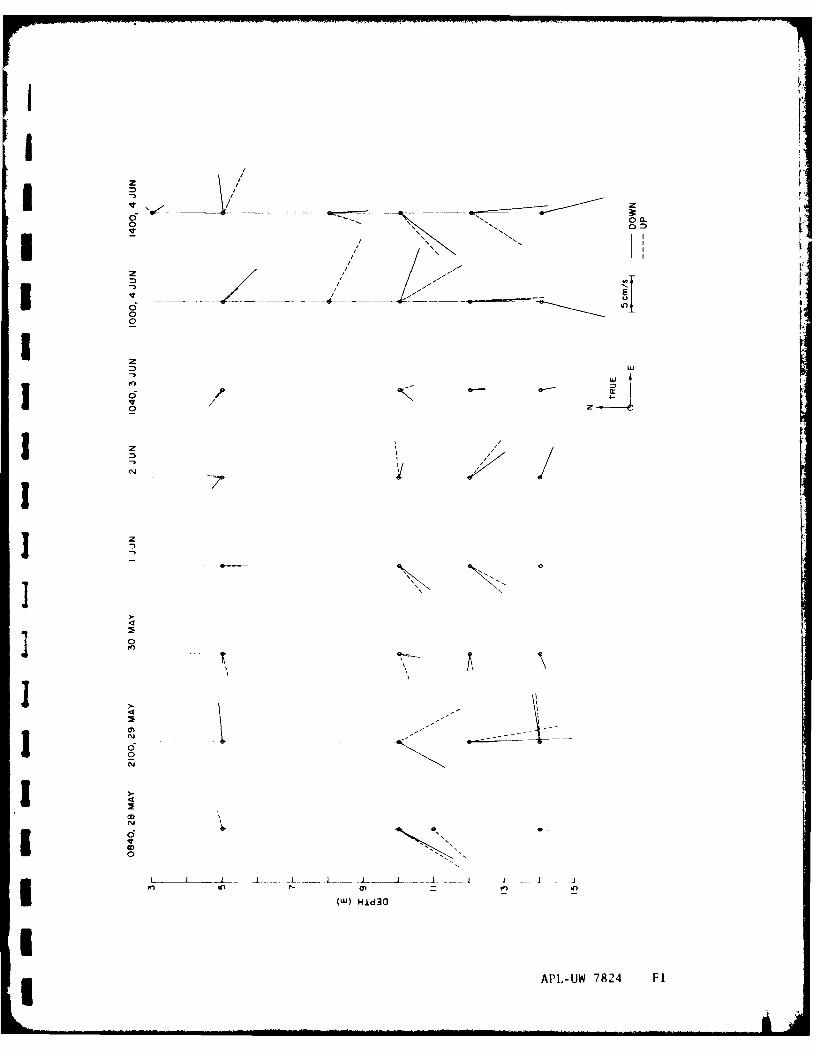
I7Ir0a
z I,
z
0
FnIo nIw -.9*j,
APL UW72 0
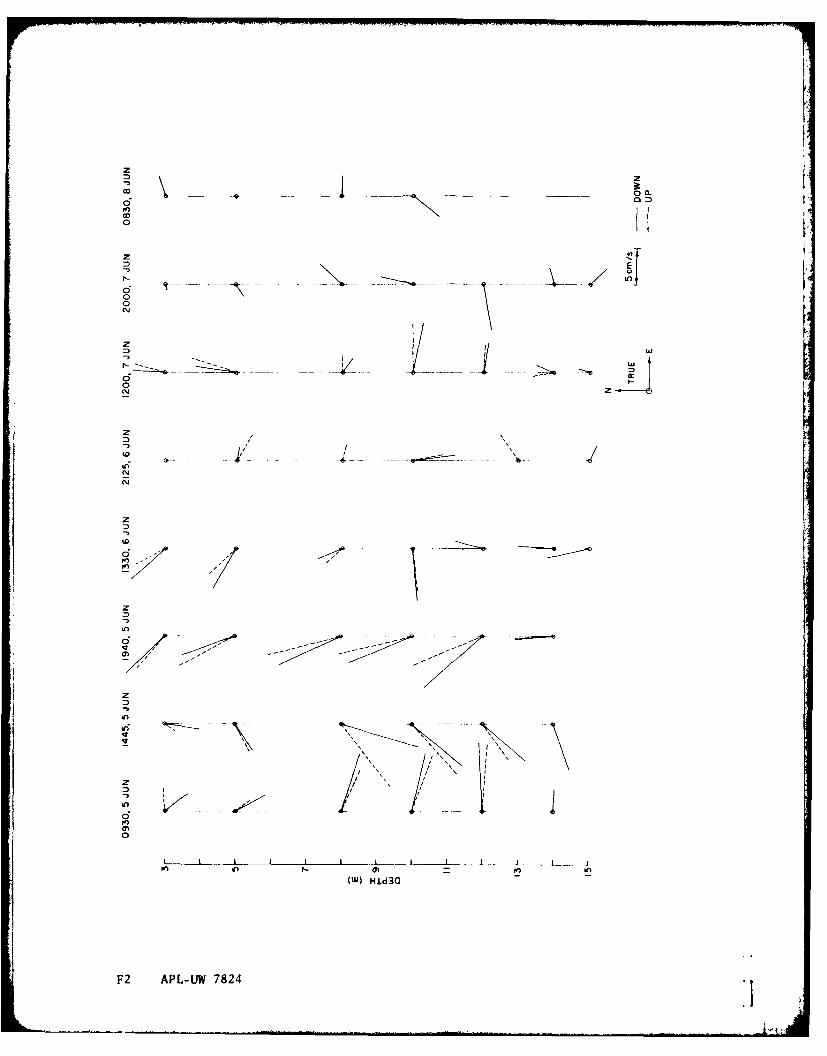
rz
0 C
oz0N
Yuz
InL
-z -__ 1 .
o0N' z
Z
tto
.- ,) Hid3O'
o2 -, "', 7824it)
0
/ S. .. . . . . . . . . . . . . . . . . . . . . . . . . . . . .. -- . " '
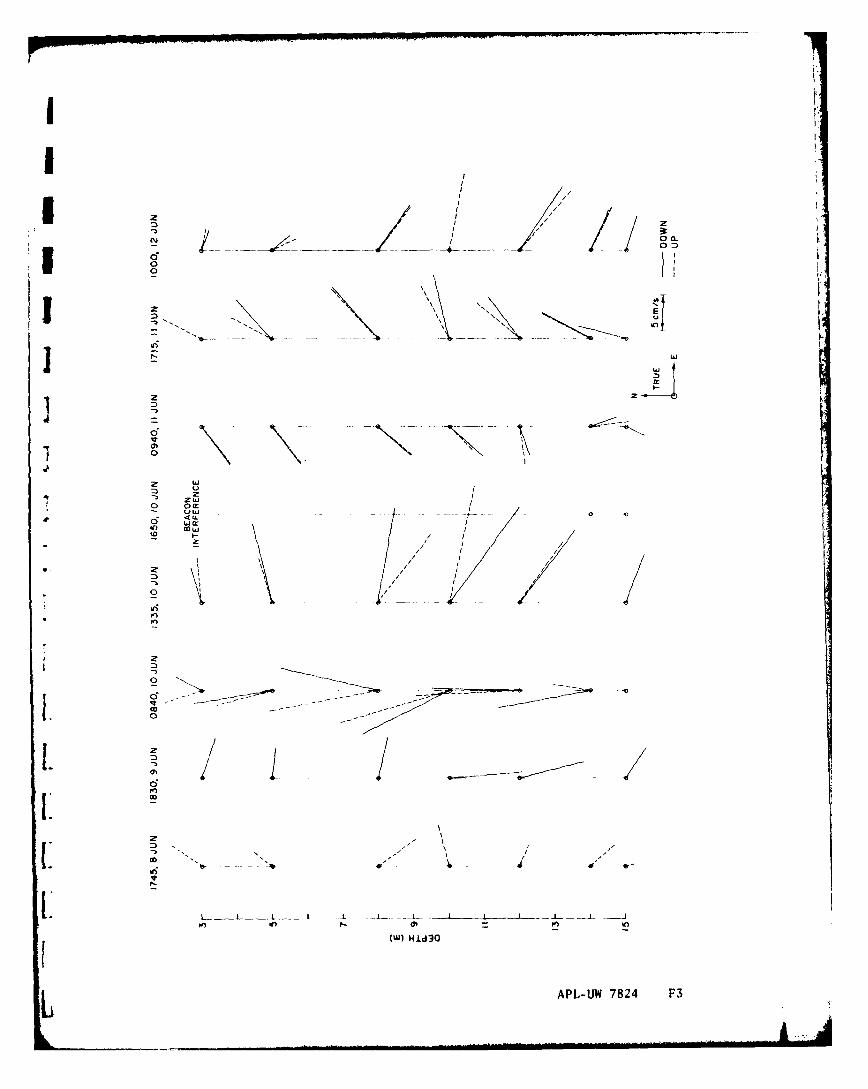
Em
1:
cr
I 0
L ---
Z ~Z I
z I
- // /
oe in~
I-/ l
. //
o
'-a
-) 7
2 a°* a
1.i L L -- 1 __I tL ~ I - 1 --- JL
L APL-IW 7824 F3
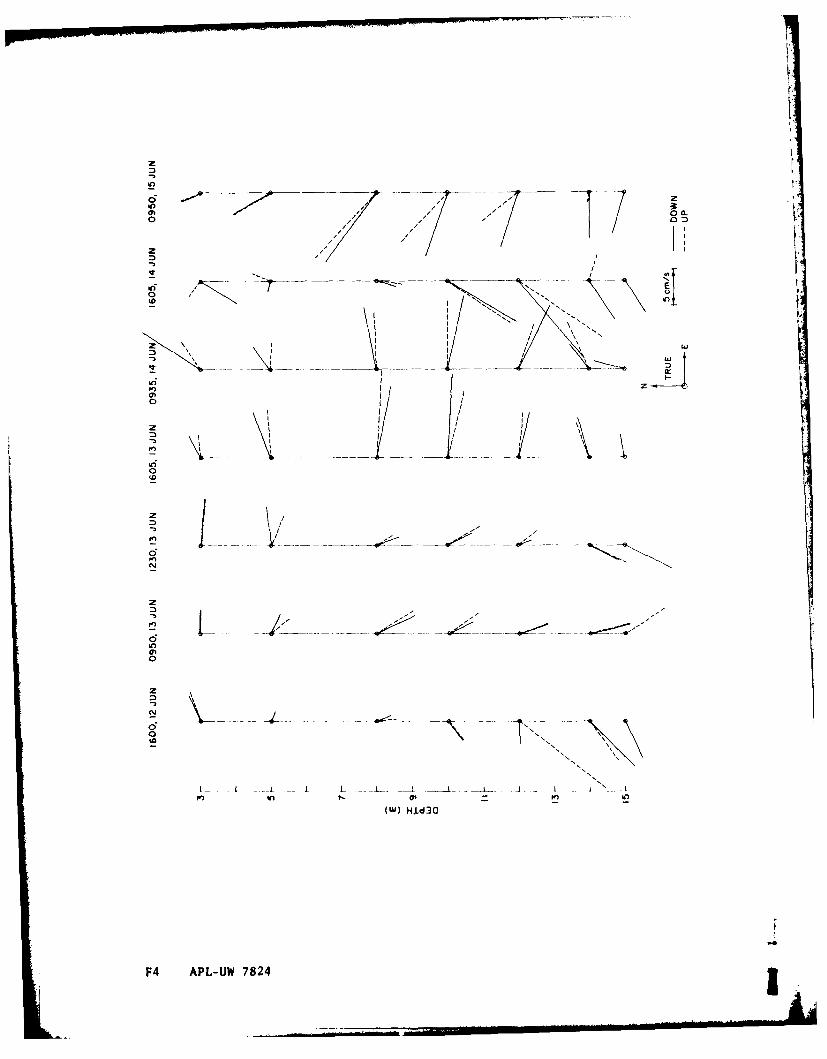
711
lei
0 efl ~ / - ' I '
ro
N injI
/ \
In/
z
z
I I o
0-, \I
m i
-
_e'jj
-, I, -)H.3
1:4 APL-UW 7824
I
III6 lllI II l .... ..
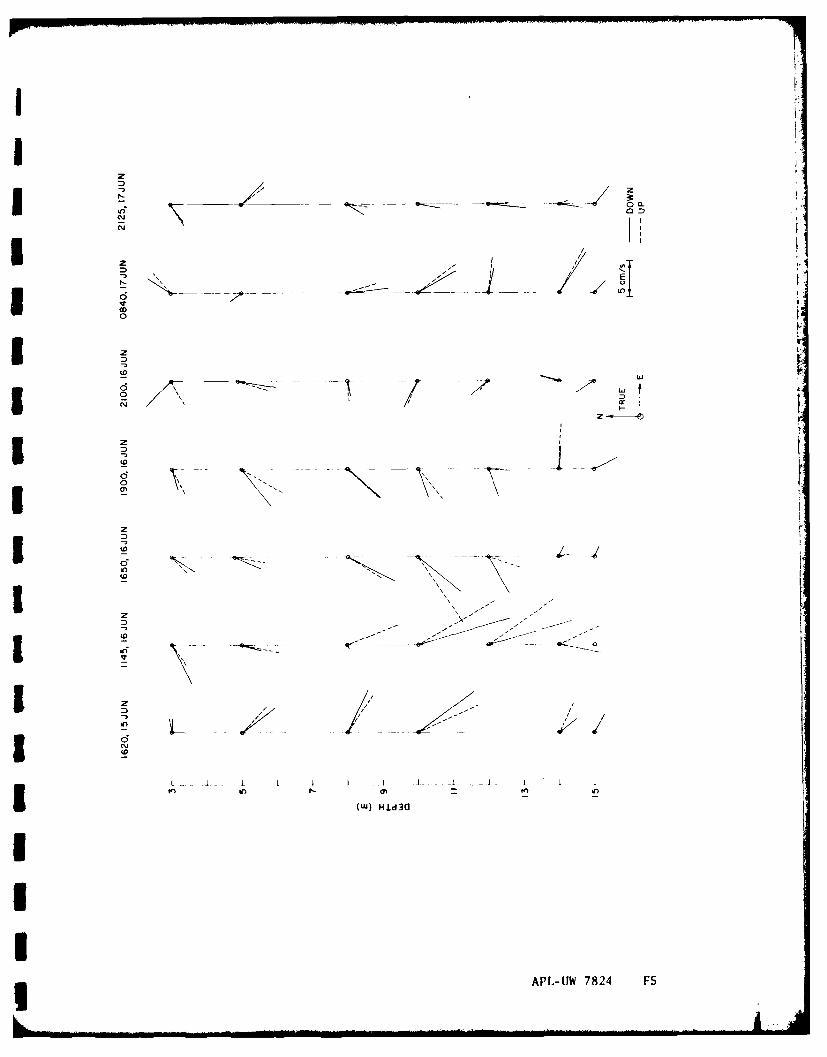
I0 C
I - .. ~ ------.-c--
IzD I z * / E
tI-'I /
CD-
I Jn
zD
II
IP-U 7824 FS
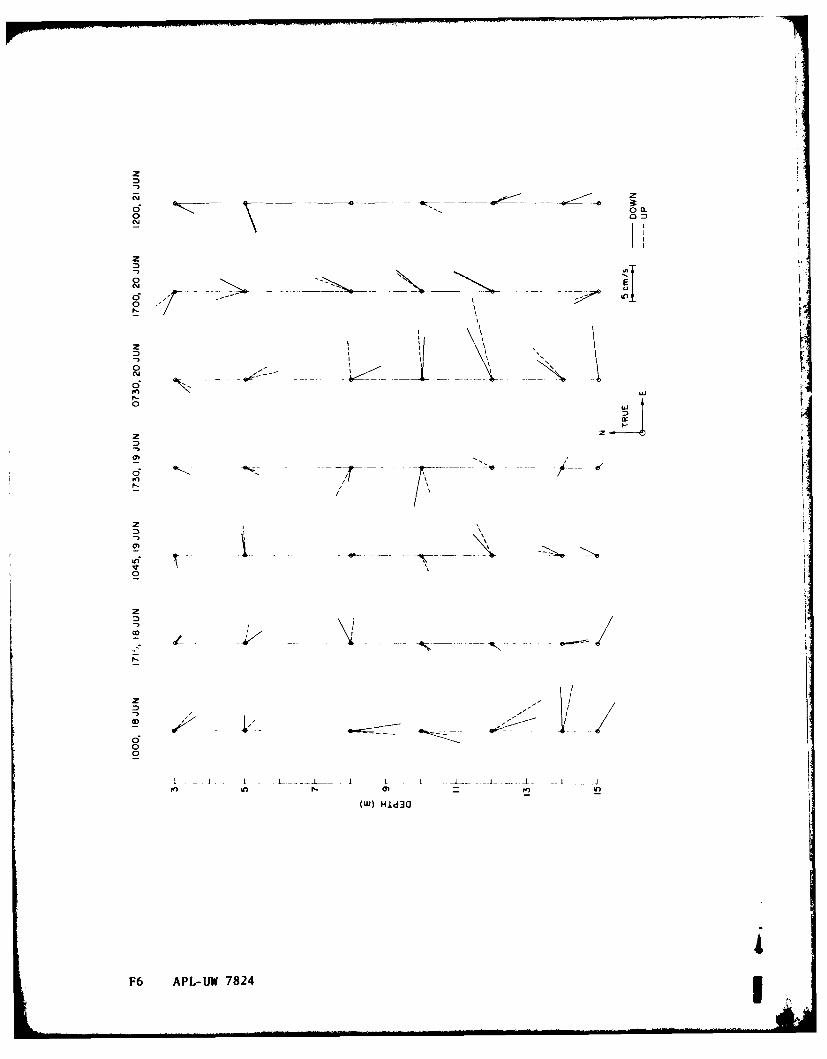
zI
0 E,
z I-
crr0
N -6,,'0
z i
I I
0 ,- --
0
z z *
0*
(W) Hld:]O
F6 - 78
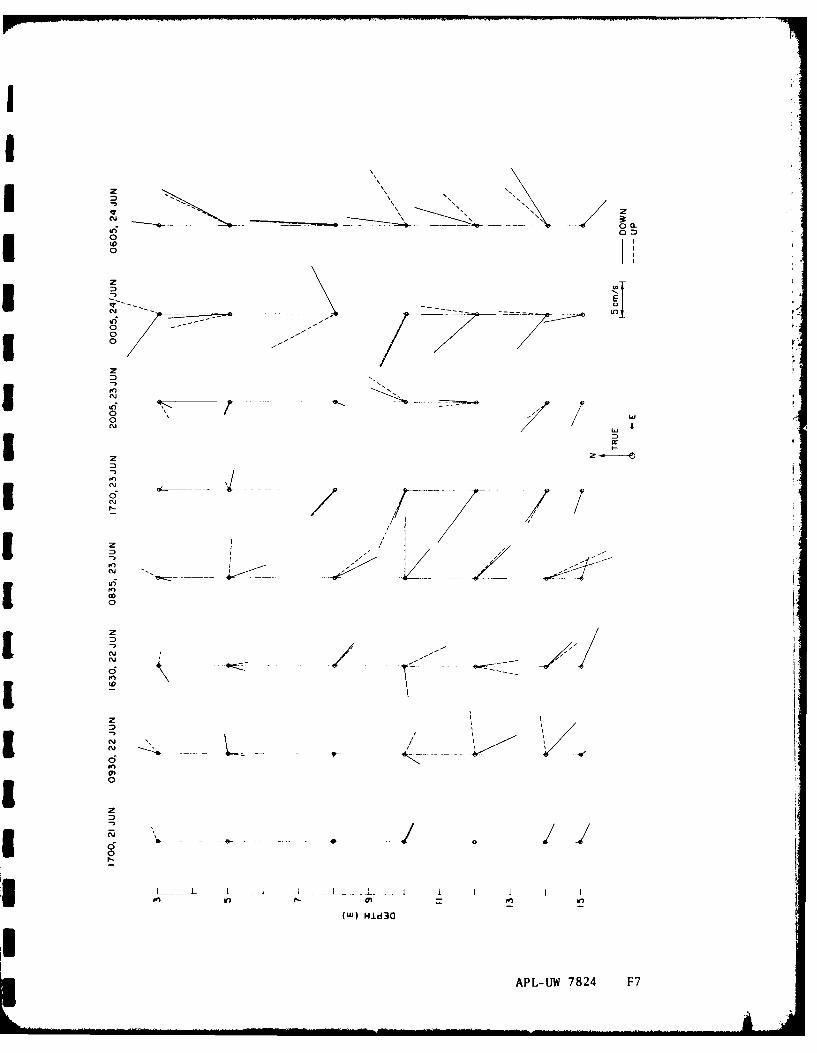
-, El
I6 N , I- 01-- a- I-0f0
z
flI T ~ ~ ~ ~ -.0 w
I z I
6
N
fnI 0z
fn*IIJ Hl3NP-U 782 F7~
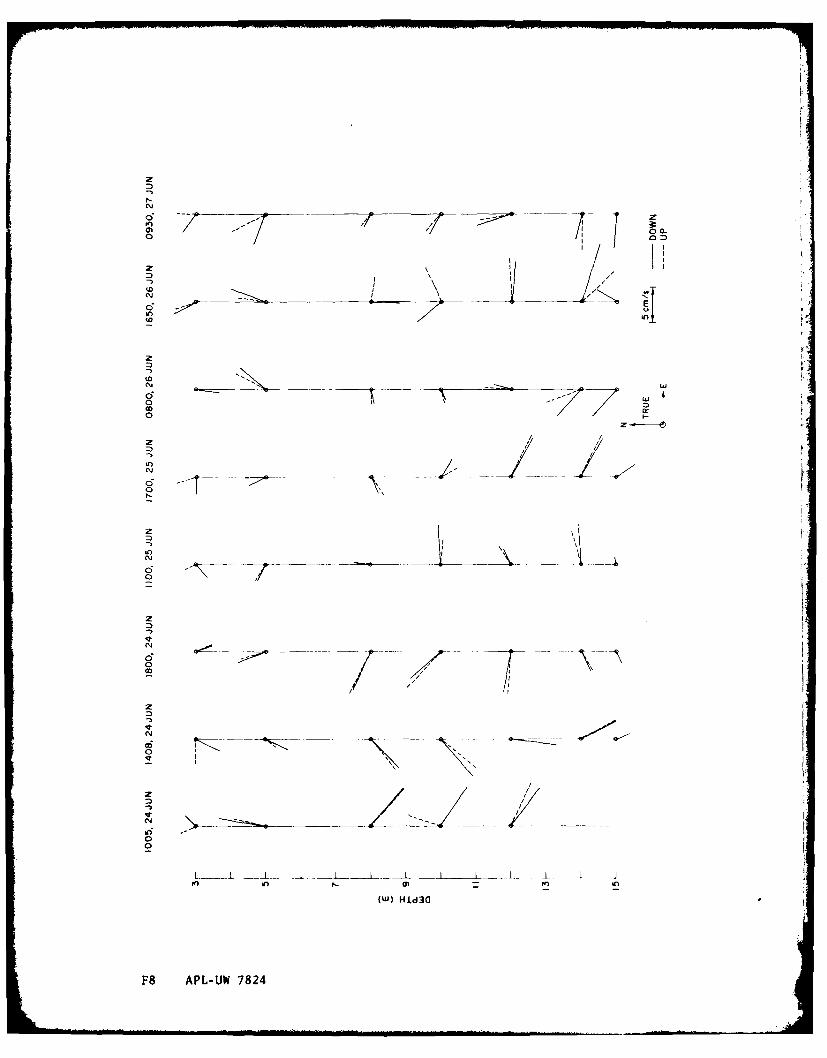
- --- ---- - --
o 0
2z
z
(0
o--(W) HLd3z
F8 /P-W72
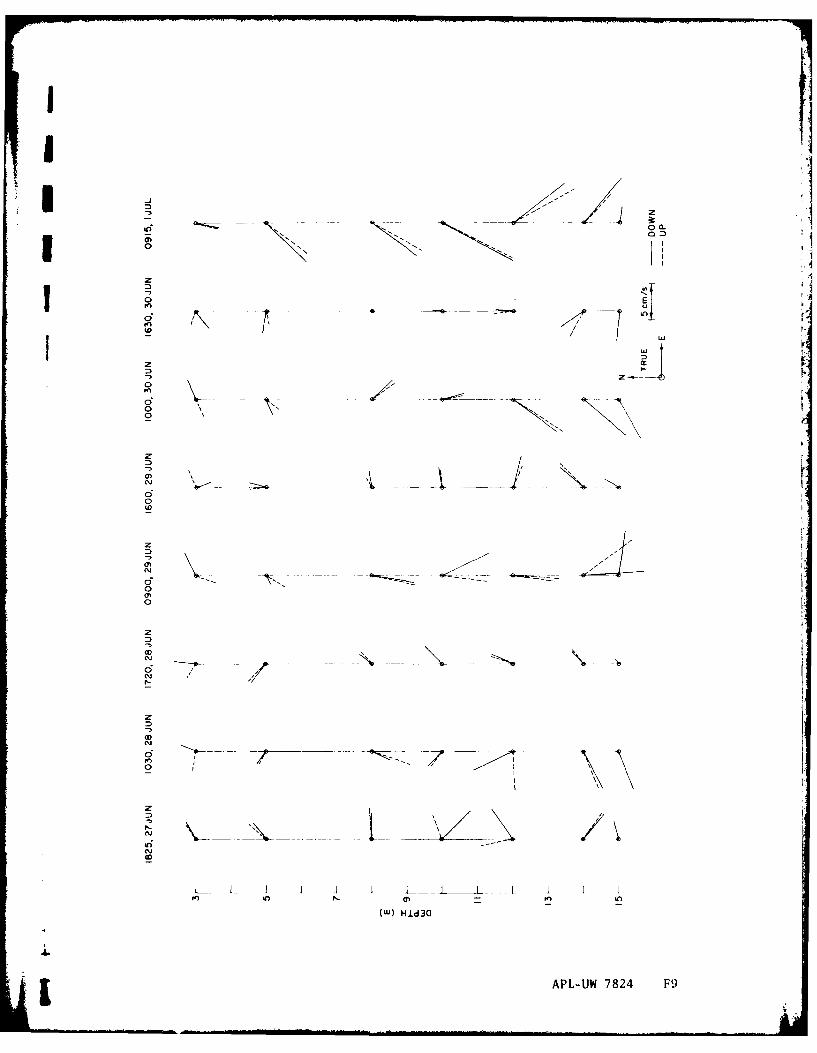
Etzz
OD
00
z
CD p-7zi
06
& Y
o pn0U)Hl3
zP-W784 F
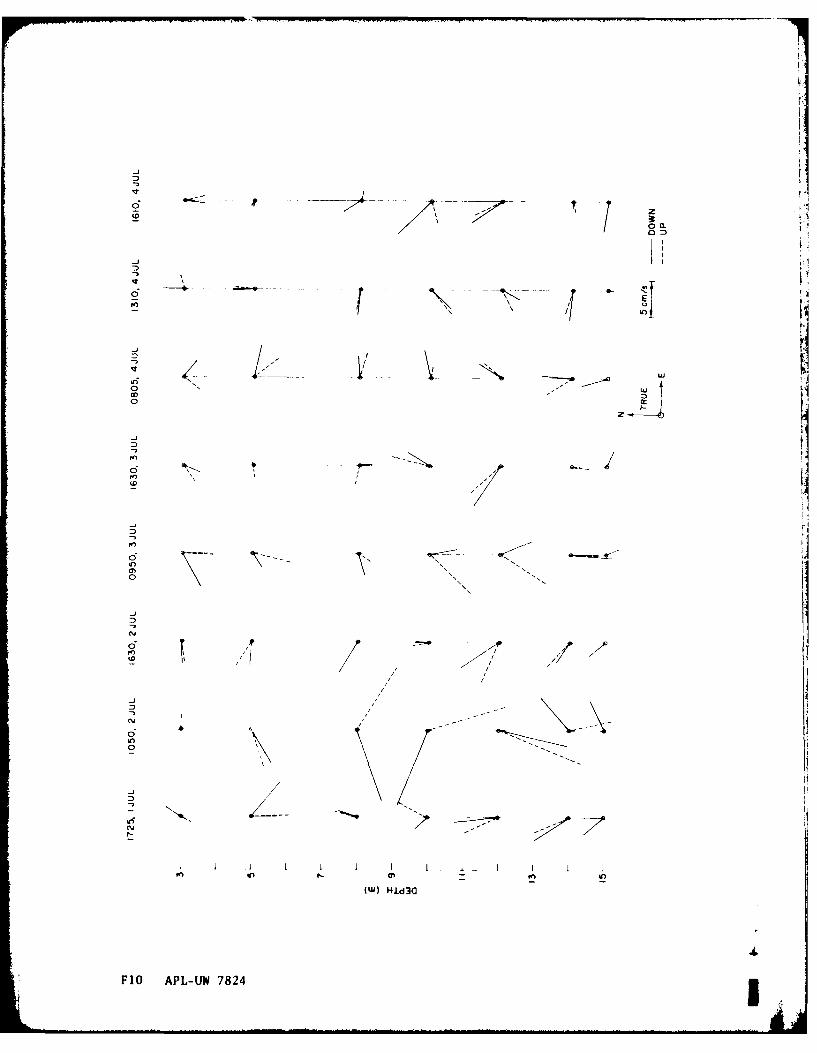
EF
-Ji
-4
- I
-4 Y_ __
/ V
Dx- ~oY
Pz
- n4nt
(W) HldIFo AP U 782
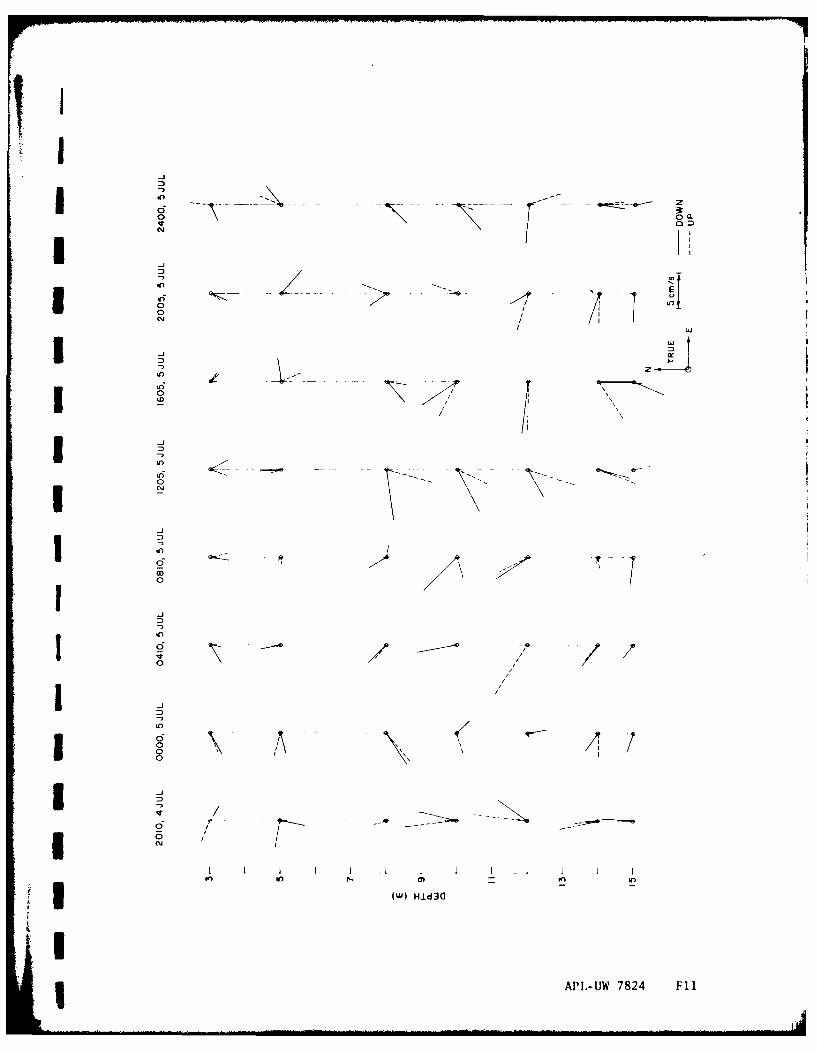
00I
* 00
oLNr
(U) Hl3
API.-W 784 Fw
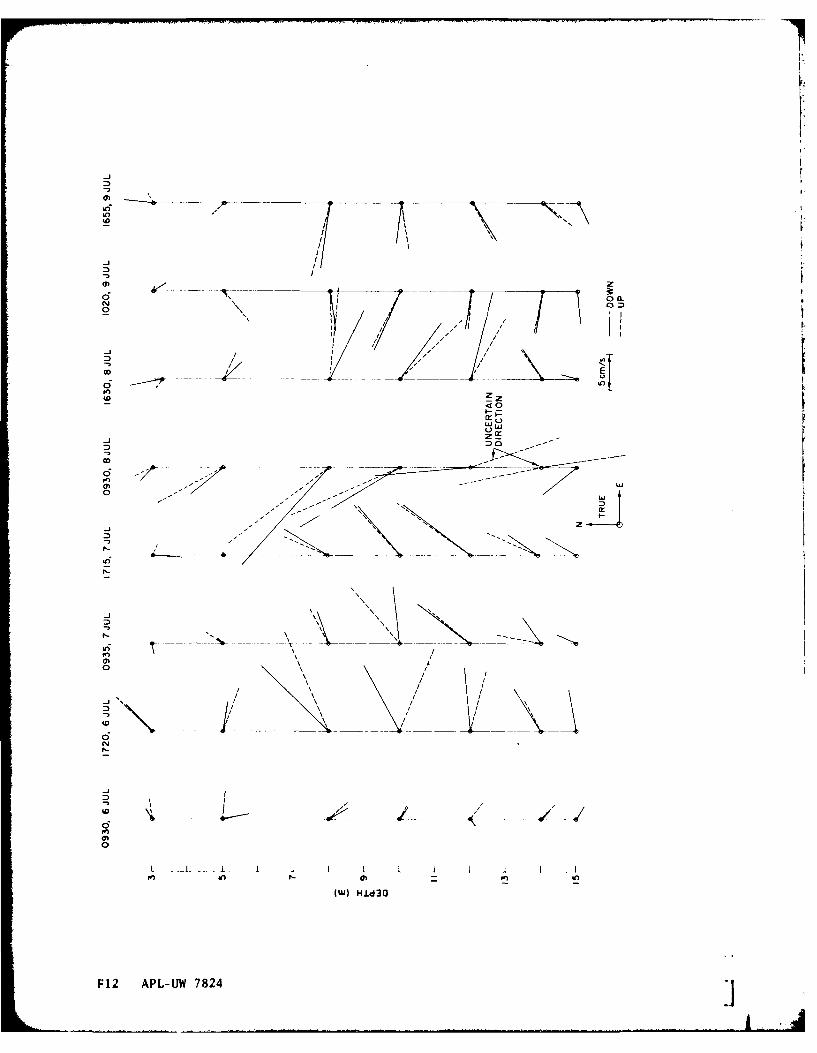
0~~~~~~~ D__ _ _ _ _ _ __ _ _ _ _ _ _
1 ''V Nr
OD
_ _ _ _ _ _ _ _ _ _ _i
L _ j
in In / nI
NO Hld30
F12 APLUW 780
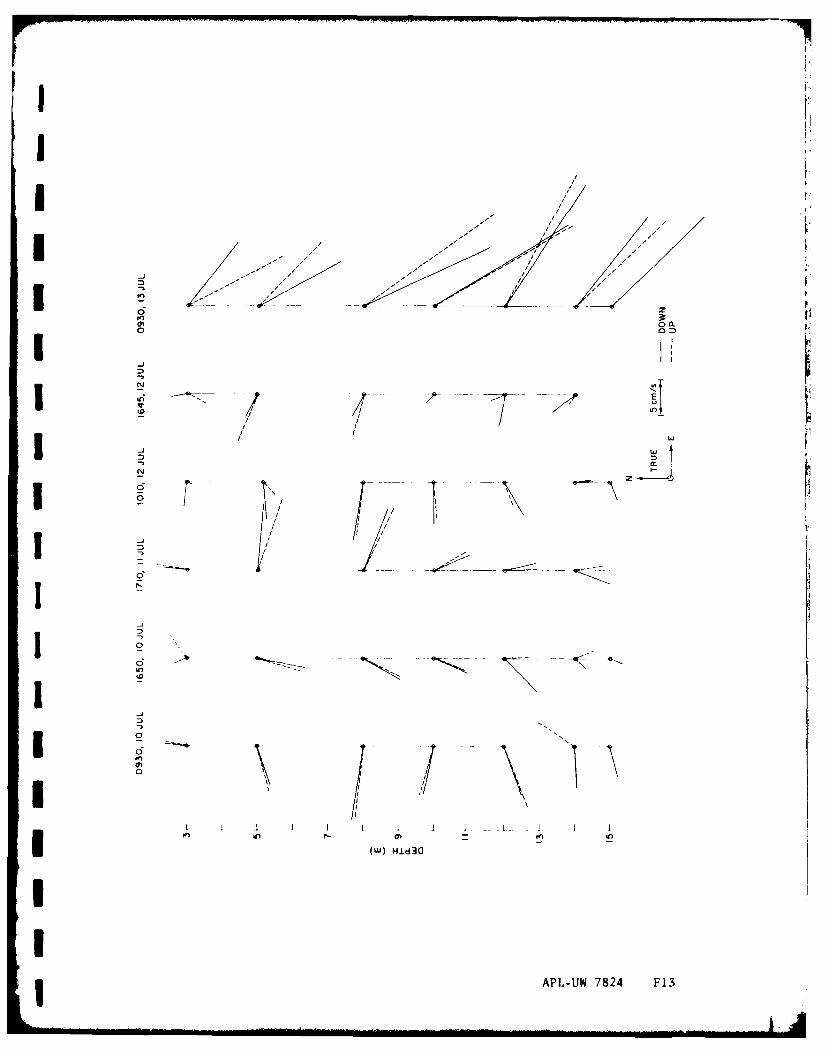
[I
,Ir
II /
r-/
o z
D EJ
COj
O n
t
1 1
I I'II I I I .
II i//
-//
T! -
I ,
L ! I I .I - ~ l- -
(w) Hld 3IG
I
1 ~ ~--IDi
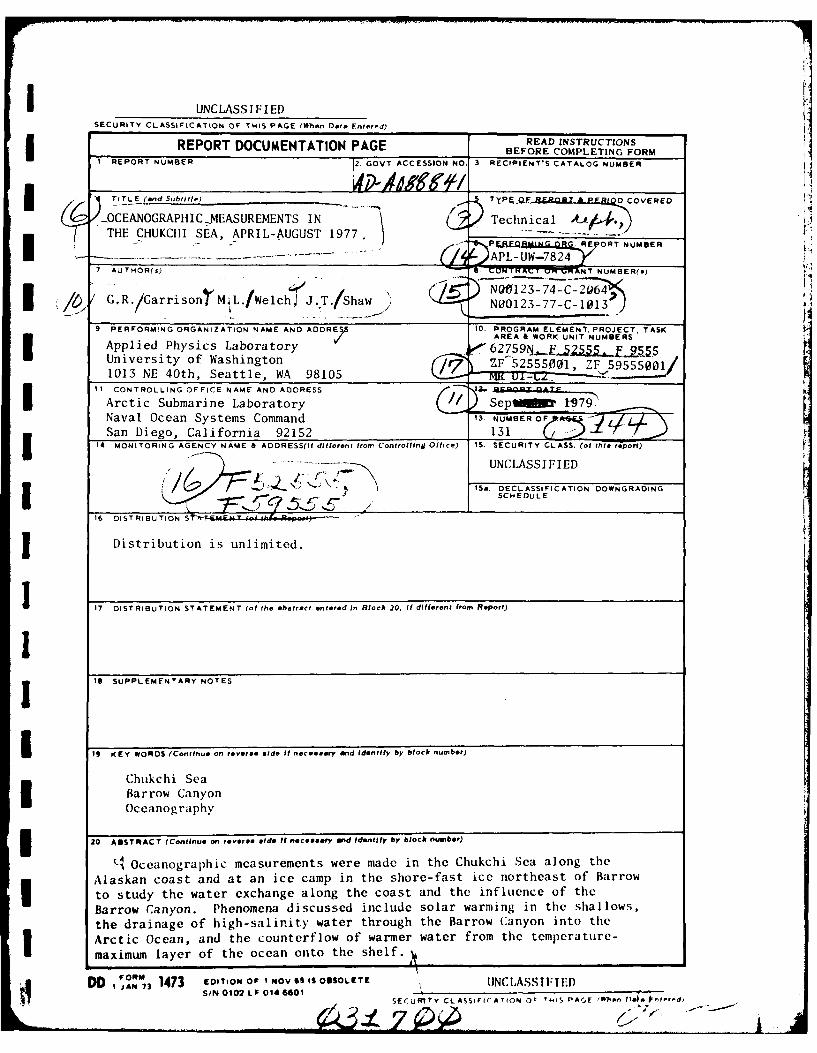
I UNCLASSIFIEDSECURITY CLASSIFICATION OF THIS PAGE (When D te Entered)
REPORT DOCUMENTATION PAGE READ MSTRUCTIOMNS___________________________________________ BEFORECOMPLETINGFORMI REPORT NUMBER GOVT ACCESSION NO 3 RECIPIENT'S CATALOG NUMBER
TITLE (and Subtitle) .. P- /E./ OCEANOGRAHIC-MEASUREMENTS IN D Technical .THE CHUKCHI SEA, APRIL-AUGUST 1977.
OAGPAU ET NhApL-U-7824
7 AUTHOR(S) 8. 1-ONIT R UW-UWANT NUMBER(.)
NQ612 3 -74- C'.2 96 4* / ' G.R.'Garrison L hae"cw)- N00l23-77-C-2013
9 PERFORMING ORGANIZATION NAME AND ADDRE 0. PROGRAM ELEMENT. PROJECT, TASK
/ AREA & WORK UNIT NUMBERSApplied Physics Laboratory 62759N,"25,5 5 .University of Washington C7 ZF'52555001, ZF 5951013 NE 40th, Seattle, WA 98105 /R 525501l -. 5955IICONTROLLING OFFICE NAME AND ADDRESS
Arctic Submarine LaboratoryNaval Ocean Systems Command 3 N
San Diego, California 92152 13 714 MONITORING AGENCY NAME - ADDRESS(If different from Controlling Office) 15. SECURITY CLASS. (of thle report)
" -'" -- UNCLASSIFIED
S '* 15. DECLASSIFICATION DOWNGRADINGSCHEDULE
16 DISTRIBUTION S , -u N' . "
1 Distribution is unlimited.
17. DISTRIBUTION STATEMENT (of rte &befract entered In Block 20, If different fro. Report)
IS SUPPLEMENTARY NOTES
i19 K EY WORDS (Continue on revere olde if neceeery and Identify by block number)
Chukchi SeaBarrow CanyonOceanography
20 ASSTRACT (Continue on revoree lde If nece ery and Identify by block number)
tI Oceanographic measurements were made in the Chukchi Sea along the
Alaskan coast and at an ice camp in the shore-fast ice northeast of Barrow
to study the water exchange along the coast and the influence of the
Barrow Canyon. Phenomena discussed include solar warming in the shallows,
the drainage of high-salinity water through the Barrow Canyon into the
Arctic Ocean, and the counterflow of warmer water from the temperature-maximum layer of the ocean onto the shelf.l DO Io,,- 1473 CEITION OF I 0oV 6S IS oUSOLETE IINCLASSIFTED
S/N 0102 L F 014 6601SECURITIY CLASSIFICATION OF' Ti IS P*CE'A' , e nFi-e~rI.rd)
D i St r Ibntjioi L ist
No. ot' No. Of,,-
Addressee Add rcsset, CI) I
Commande r Po lar Research ILaboratoiry , Inc.Na~ al 1Wvapous LCnter 123 Santa Barbara St reet'China Lake, California 9555S Santa Rarbara, tal i forni a 931011 2
At tii: Library
Lomniane l~ia"Ai9215 of* Naval O)perat ions,
Navxal occan S s temls Cen ter I' ashli g tonl 1). C. 201350)CatainaaO~loardNOI'-02
San Dliego, ioii -1- NO I- 22Attni: L Nrar 4MI'i)95
1) i rectorNaval Research Laborat ory CommiandeLi
Bashi ,ngton,. 1). C. 2037S SlubMa r ie Sqjoad ron THII.Sani Diego, California 9 213 2
Dlirector
App lied Re s LarchI Labhorator)y Comnman der
State College, Plelnsv valnia 10801 1 Fleet Stat ion Post OficeSall iego, Cal ifornia 92 1321
Comm11siander S a r i Hee CForceig HicNorfol k, Virgh: iii 2 3511 2 NaalItelligence Suppor't Ceter
I II S. ac it'ic IeN-21 IIomadl11) San YraiL' 1sco, La Iit'oria 900 1 1 Naval 1I. leCt rll I CS\ ySt ems1 C011Olld 11I
I Wlp I l'art IllI.11t Of tih ll' N
C, lllll1llidL I' Ka shlillg to Oi) C 0Il3 o15 NaI \ AIr K'le Iollillt C.LiiteLr NISC 0)3KirmilisterI, Il'ennsv lvautia 18974 1 111 12 1
llll ItL r Cilllillllldh k Otig l t L' IOa B' . I .1 I or Niaa Coastal Sstemls Ceniter'
Nvia Sb i p Re'Sca 'vi Anld leCVl1R-mllt P'anam~a C it)' Flotrida 32-10 I)"
Cklitu~r
Naval Snbma I' ilL'11 SchoolIC:111 t, of, \atai Mateyrial' J X 7j Nava l Subutaii c i 1'
Pea *T~i (I'Hc\t ' % Ne (Lnn
MMAl1' 0 812NIMA' 08 123 1 Ass ist ant Secret liv Otf till' NV%,y
SM l 1811I1ReSealrchl I1 moi 1L-l 11 li lt]an Svst i'lliI
Iii r~~d 01' Ba '11ii I lgt 1), 1 )31All )I ll lbs' is i L Ialioat or'vlii1i I's itv of* W;is ii i gt li Ili rector1 ill- )l'l'l)" Ikl'.-;il'l'i iimi 1.10 nc 1111 my
lu)13 Northeaist 10th Strett ieof' Vs i sIlilt Ili ICtoll llc'All i o11t ]'II1
Slit t IR BhL j t I11 r, o s a Ill' g'l ti OIMr. I .BW. Ia rI'v
11r i.l.l;rrlao o ltl11'ider. io NaLI A rctI lfi r\ ii iot;ti' \A. I 11Ca1 5~ 111 IOl11 - 2.1d
Ill'd 1, 1' I Id ih I jiI l] t
Slpe r i i t l'ln tINaval list gt'ilt. ; holll
lntbny ~iirs il1irr
No. of oofAddressee Copie Addressee Co i
Chief of Naval Research Officer-in-ChargeDepartment of the Navy New London Laboratory800 North Quincy Street Naval Underwater Systems CenterArlington, Virginia 22217 1 New London, Connecticut 06320
Code 102-OS ICode 220 1 CommanderCode 461 1 Submarine Development Squadron Twelve
Box 70Project Maanager Naval Submarine Base - New LondonAnti-Submarine Warfare Systems Groton, Connecticut 0b3-0
Project Office PiN14)Department of the Navy Office of the DirectorWashington, 0. C. 20360 Naval Oceanography Division (OP-952)
Navy DepartmentCommanding Officer Washington, 0. C. 20350Naval Underwater Systems CenterNewport, Rhode Island 02840 1 Commandant
II. S, Coast Guard HeadquartersCommander 400 Seventh Street, S. W.Naval Air Systems Command Headquarters Washington, D.C. 20590
epartment of the NavyWashington, D. C. 20301 2 Commander
Pacific Area, II. S. Coast ;uaruDirector 630 Sansome StreetDefense Supply Agency San Francisco, Calil,,rnia 94120Defense IDotnlliintition t~CnterCame ron Station Comma nderAlexandria, Virginia 22314 12 Atlantic Area, U. S. Coast Guard
Building 125, Room 204
D i rector Governors Island0efcnse Advanced Research Project Agency New York, N. Y . 1000411400 Wiison RoulevardArlington, Virginia 222109 1 Department of Oceanography
University of WashingtonCommander, SlICONI) Fleet Seattle, Washington 98195leet Post Office
New York, New York 09501
Commander, 1111RD FlectFleet Post OfficeSan Francisco, California 96601 1
CommanderNaval Surface Weapons CenterWhite OakSilver Spring, Maryland 20910
Mr. M.M. KleinermanLibrary I
4
ii
F A RN A08 84 OENOGRA MEASUREMENT N THE CHH H EAPRIL AGs A 77U WAHNGT TN UNVSETL A PPID
PHSI AR GH R ANNISON HTA. E 79 AP-W72
UNLSIID 0237-C2AF6 /0 I
EEEEEEEEV1os
1.6'~ 1328 21,L2
11111_L2 J.4 I .
MICROCOPY RESOLUTION TEST CHART
NATiQNAL BUREAU CF SFANDARDF 196' A
SUPPLEMENTARY
INFORMAT ON• -• i ....... ... . ... .iT•i
APPLIED PHYSICS LABORATORY Laboratory: (206) 543-1300
A DIVISION OF THE UNIVERSITY OF WASHINGTON Sender: (206)
OCT 2,7 19P?
ANNOUNCEMENT
REVISION TO APL-UW 7824"Oceanographic Measurements in the Chukchi Sea, April-August 1977"
The enclosed pages are corrected versions of the cover, title page,and pp. 26, BI, B4, B5, Cl, C2, C3, C4 and C5 in APL-UW 7824. The cor-rections to the text consist of the addition of some isothermals thatwere omitted in a temperature station and changes in the temperaturescale for a few profiles in the appendices.
Please remove the erroneous pages and replace them with thecorrected ones, using the enclosed T-comb.
We apologize for the errors and thank you for your trouble inmaking the changes.
Gerald R. GarrisonPrincipal Physicist
1013 Northeast Fortieth Street Seattle, Washington 98105
APL-UW 7824Distribution List
No. of N%. ofAddressee Copies Addressee
Commander Polar Research Laboratory, Inc.Naval Weapons Center 123 Santa Barbara StreetChina Lake, California 93555 Santa Barbara, California 93101
Attn: Library 1
Chief of Naval OperationsCommander Department of the NavyNaval Ocean Systems Center Washington, D. C. 20350271 Catalina Boulevard NOP-02San Diego, California 92152 NOP-22
Attn: Library 4 NOP-095NOP-098
DirectorNaval Research Laboratory CommanderWashington, D. C. 20375 Submarine Squadron THREE
Attn: Technical Information Division 3 Fleet Station Post OfficeSan Diego, California 92132
DirectorApplied Research Laboratory CommanderPennsylvania State University Submarine Group FIVEState College, Pennsylvania 16801 1 Fleet Station Post Office
San Diego, California 92132Commander Submarine ForceU. S. Atlantic Fleet Commanding OfficerNorfolk, Virginia 23511 Naval Intelligence Support Center
4301 Suitland RoadCommander Submarine Force Washington, D. C. 20390
U. S. Pacific FleetN-21 I CommanderFPO San Francisco, California 96601 1 Naval Electronic Systems Command Hq.
Department of the NavyCommander Washington, D. C. 20360 lNaval Air Development Center NESC 03 1Warminster, Pennsylvania 18974 1 PML 124 1
Commander Commanding OfficerDavid W. Taylor Naval Coastal Systems CenterNaval Ship Research and Development Panama City, Florida 32407
CenterBethesda, Maryland 20084 1 Commanding Officer
Naval Submarine SchoolChief of Naval Material Box 700, Naval Submarine Base,Department of the Navy New LondonWashington, D. C. 20360 Groton, Connecticut 06340
NMAT 08T 2.MAT 08T23 I Assistant Secretary of the NavyNNIAT 08D1 1 (Research Engineering and Systems)
Department of the NavyDirector Washington, 1). C. 20350Applied Physics LaboratoryUniversity of Washington Director of Defense Research and Engineering1013 Northeast 40th Street Office of Assistant Director (Ocean Control)Seattle, Washington 98105 Th" Pentagon
Mr. Robert E. Francois 1 Washington, D. C. 20301Mr. E.W. Early 1Dr. G.R. Garrison 1 CommanderLibrary I Naval Sea Systems Command
Department of the NavyDirector Washington, D. C. 20362 4Arctic Submarine Laboratory A. Franceschetti Code 63R-23Code S4, Building 371 Dr. E. Liszka Code 63R-1Naval Ocean Systems CenterSan Diego, California 92152 25
SuperintendentNaval Postgraduate SchoolMonterey, California 93940
Library 2
S A.-.. -.--
No. of So. of
Addressee Copies Addressee Copies
Chief of Naval Research Officer-in-Charge
Department of the Navy New London Laboratory
800 North Quincy Street Naval Underwater Systems Center
Arlington, Virginia 22217 1 New London, Connecticut 06320
Code 102-OS 1Code 220 1 Commander
Code 461 1 Submarine Development Squadron TwelveBox 70
Project Manager Naval Submarine Base - New London
Anti-Submarine Warfare Systems Groton, Connecticut 06340
Project Office (PM4)Department of the Navy Office of the DirectorWashington, D. C. 20360 1 Naval Oceanography Division (OP-952)
Navy DepartmentCommanding Officer Washington, 0. C. 20350Naval Underwater Systems CenterNewport, Rhode Island 02840 1 Commandant
U. S. Coast Guard Headquarters
Commander 400 Seventh Street, S. W.
Naval Air Systems Command Headquarters Washington, D.C. 20590Department of the Navy
Washington, D. C. 20361 2 CommanderPacific Area, U. S. Coast Guard
irector630 Sansome Streetefense Supply Agency San Francisco, California 94126Deense Documentation CenterCameron Sation Commander
Alexandria, Virginia 22314 12 Atlantic Area, U. S. Coast GuardBuilding 125, Room 204Governors Island
Defense Advanced Research ro New York, N. Y. 10004
1400 Wilson BoulevardArlington, Virginia 22209 1 Department of Oceanography
University of WashingtonCommander, SECOND Fleet Seattle, Washington 98195Fleet Post OfficeNew York, New York 09501
Commander, THIRD FleetFleet Post OfficeSan Francisco, California 96601
CommanderNaval Surface Weapons CenterWhite OakSilver Spring, Maryland 20910
Mr. M.M. KleinermanLibrary
44
7 :
1,. 4, I
A P
D I V- S 04 "
Corrected October 1983
III',
Oceanographic Measurements in the Chukchi Sea
April - August 1977
by G. R. GarrisonM. L. WelchJ.T. Shaw
APL-UW 7824September 1979
Applied Physics Laboratory University of WashingtonSeattle, Washington 98105
PREPARED FOR:ARCTIC SUBMARINE LABORATORY, CODE 54
NAVAL OCEAN SYSTEMS CENTER, SAN DIEGO, CALIFORNIAj UNDER CONTRACTS N00123-74-C-2064 AND N00123-77-C-1013
ACKNOWLEDGMENTS
Field support was provided by the Naval Arctic Research Laboratorythrough funding by the Office of Naval Research. This support includedshelters, food, fuel, and a convenient base for operations. The heli-copter that moved the prefabricated buildings and supplies to the iceccamp and served as a platform for the oceanographic surveys was pro-vided by the National Oceanic and Atmospheric Administration.
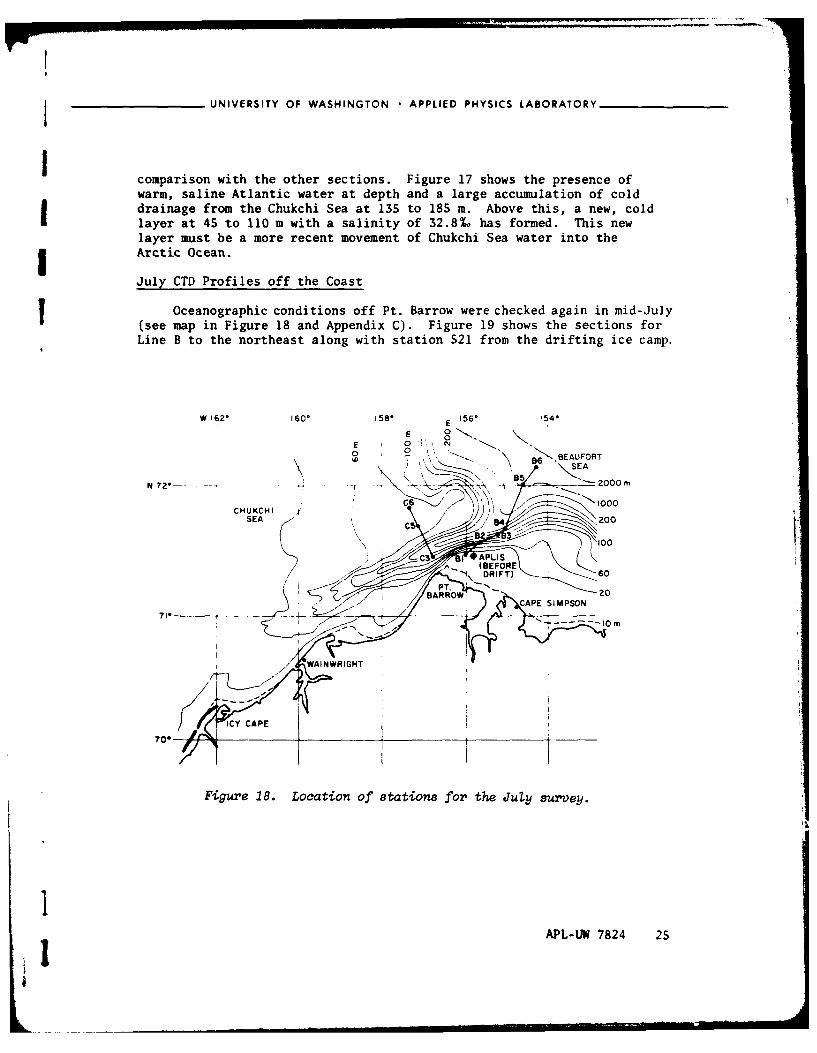
UNIVERSITY OF WASHINGTON • APPLIED PHYSICS LABORATORY
comparison with the other sections. Figure 17 shows the presence ofwarm, saline Atlantic water at depth and a large accumulation of colddrainage from the Chukchi Sea at 135 to 185 m. Above this, a new, coldlayer at 45 to 110 m with a salinity of 32.8% has formed. This newlayer must be a more recent movement of Chukchi Sea water into theArctic Ocean.
July CTD Profiles off the Coast
Oceanographic conditions off Pt. Barrow were checked again in mid-July(see map in Figure 18 and Appendix C). Figure 19 shows the sections forLine B to the northeast along with station 521 from the drifting ice camp.
W 162' 160* 158" 156* 154*E \
0 " ""BEAUFORT
SEA SE
718
Figure 18. Location of' 8tations for t;he July survey.
1APL-UW 7824 25
CAPE IMPSO
.. . .INWRIGHITJ I
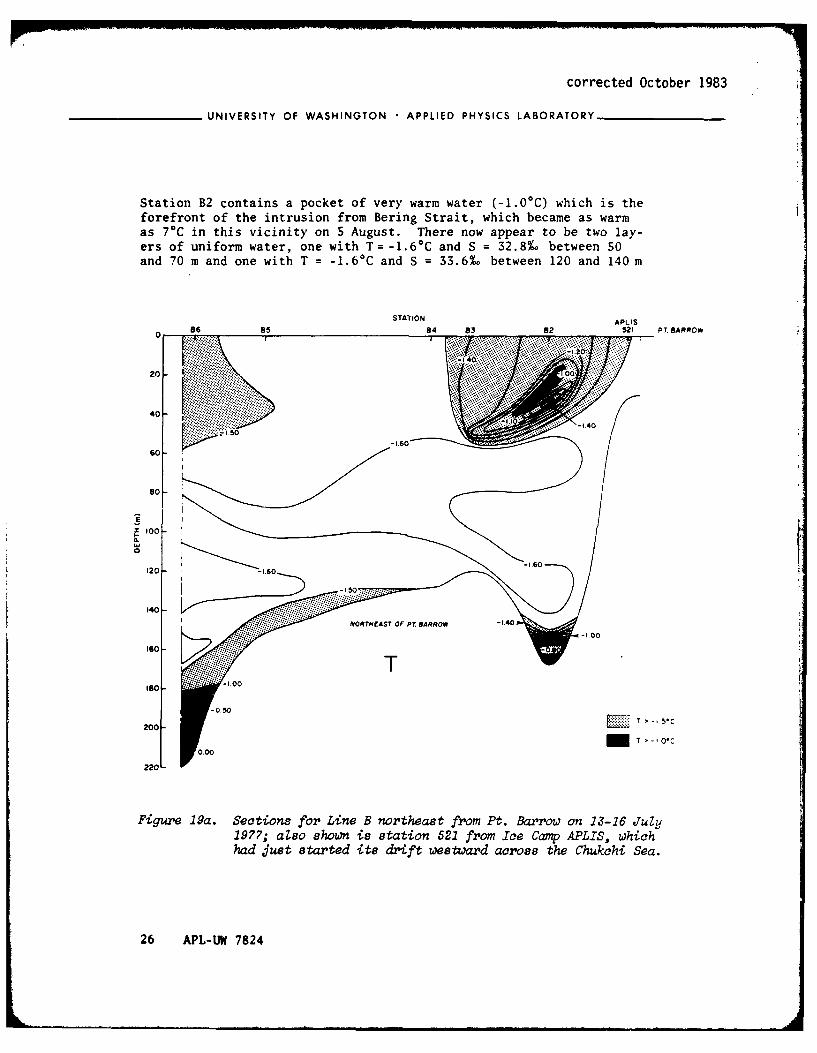
corrected October 1983
UNIVERSITY OF WASHINGTON APPLIED PHYSICS LABORATORY
Station B2 contains a pocket of very warm water (-1.0°C) which is theforefront of the intrusion from Bering Strait, which became as warmas 7*C in this vicinity on 5 August. There now appear to be two lay-ers of uniform water, one with T=-1.6C and S = 32.8%. between 50and 70 m and one with T = -1.6C and S = 33.6%. between 120 and 140 m
STATION APLIS
86 85 84 83 82 521 PT BARROW
40
.o
20-
40 - -
1050
m T >l*
220
Figure 19a. Sections for Line B northeast from Pt. Barrow on 13-16 July1977; also shown is station 521 from Ice Camtp APLIS, whichhad ,just started its dmft wes ,Ward across the Chukchi. Sea.
26 APL-UW 7824
_~ ~ ~ ~ ~ ~ ~~~~s -_. , .• .. . . .. = _.... . . .. , -
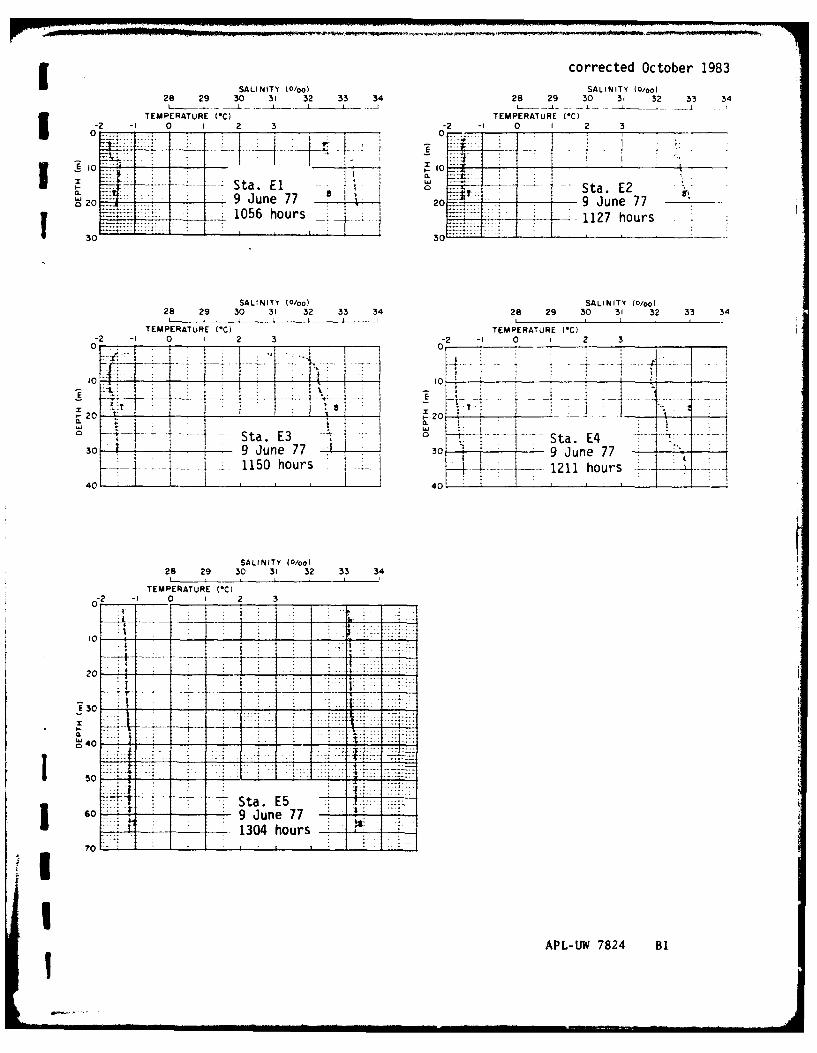
corrected October 1983ISALINITY (0/o) SALINITY (0/o028 29 30 31 32 33 34 28 29 30 31 32 33 34
TEMPERATURE (*C) TEMPERATURE (*C-2 -1 0 I 2 3 -
-7 ~ ta. Ela.E
-- ~20un7 9 June_71056 hours12hor
30 3
SALINITY (0/oo) SALINITY (W/oof
28 29 30 31 32 33 34 28 29 30 31 32 33 34
TEMPERATURE (IC) TEMPERATURE (*C)-2 -1 0 I 2 3 -2 -I 0 1 2 3
0 0
io4- 41 4. K>t~20 -'201.-
ta. E3St.E30 9~ June---- 973 ue7
4 1150 hours 11 o r
SALINITY )0/oo)28 29 30 31 32 33 34
TEMPERATURE (*C)
020 1 2 3 __
E -30
0.... ...........14.a E54
60 -i -- - 9 June 77---- 1304 hours
70-
APL-JW 7824 B!
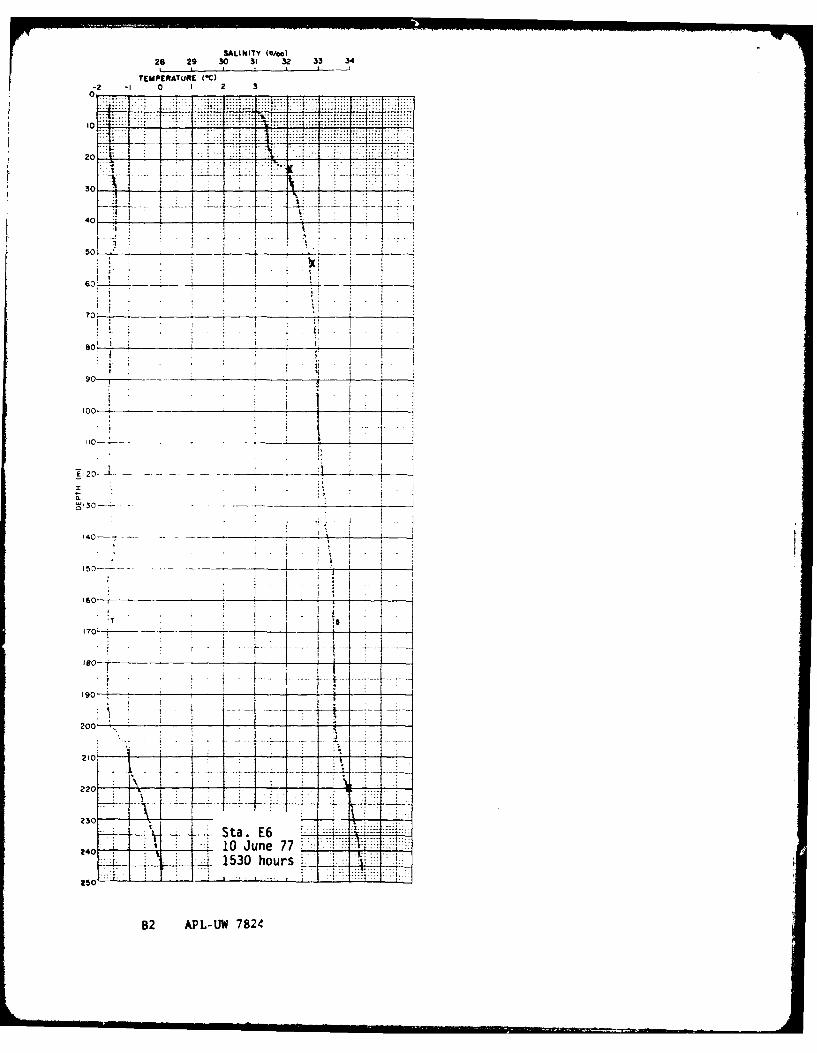
SALINITY (O/00)28 29 30 111 32 33 34
TEMPERATURE (*C)-2 -1 0 1 2 3
0Iii0 i 4-- 4 -
.0
40I
900
140- - -
ISO.
90 -t
20~
0-- Sta. E62G10 June 77
j 1530 hours 1T
B2 APL-JW 7824
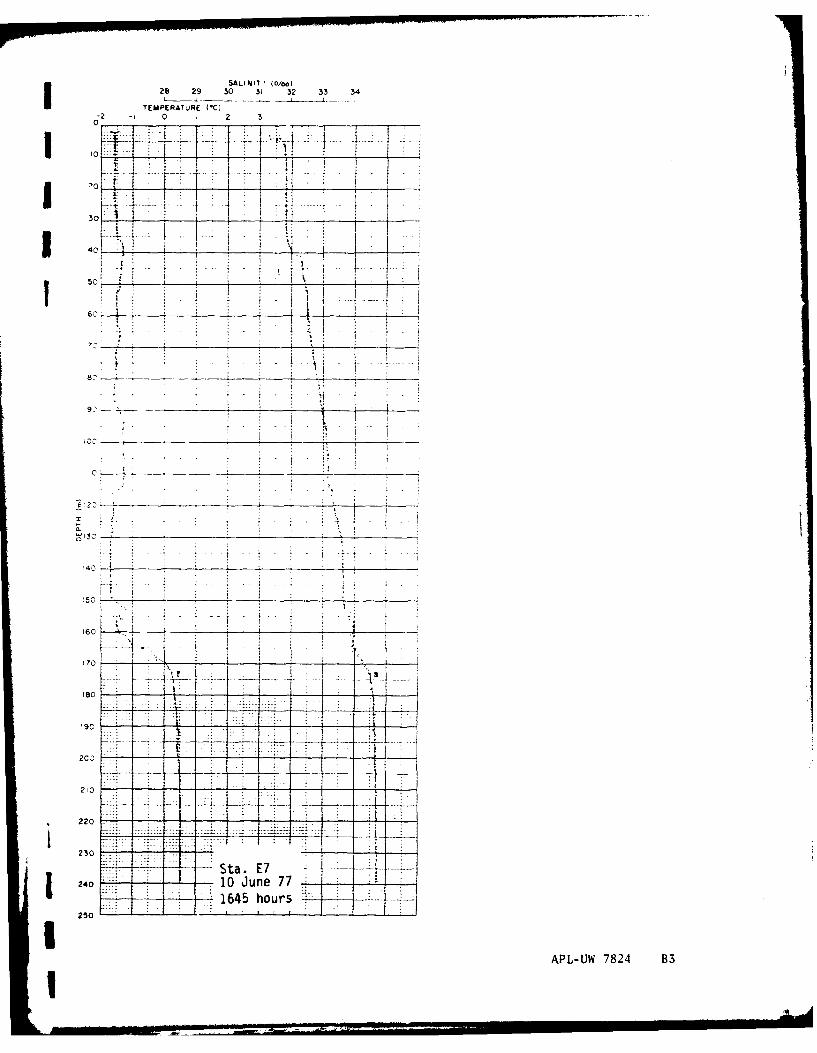
28 29 30 31 32 33 34
TEMPEIRATUR ( -----
-2 -' 0 I 2 3
30 ~VI
i a
7._7777j_7>
8c-i-
60 ------- ___
70 .L L i-
210-
230 E
A 240 -10June 77rm - -- ---- 1645 hours
250
APL-UW 7824 B3
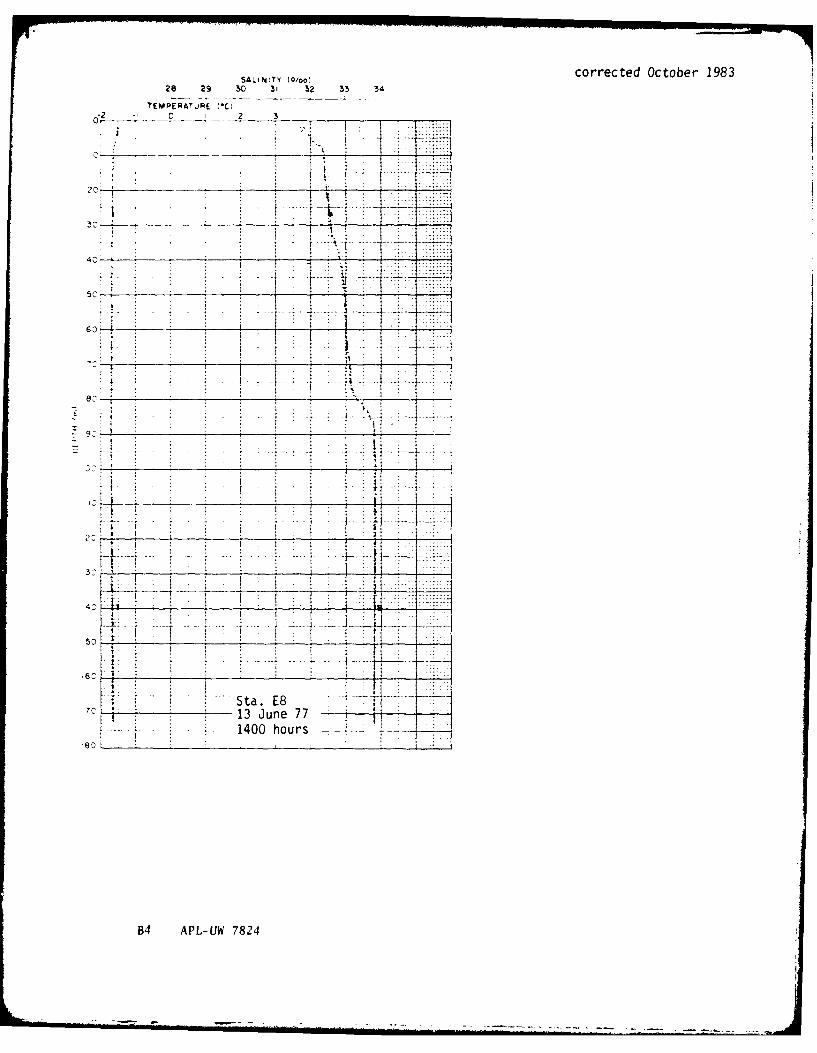
corrected October 1983SAL'N:TY (0/00)
28 29 so 31 32 33 34
TEMPERATURE (*C
303
4.0
_________ _-------------*
6 00
84 D
I-)6' _
,~Sta E8-
17 13_ Jun 77_ 1
140 hours
B4 APU 782
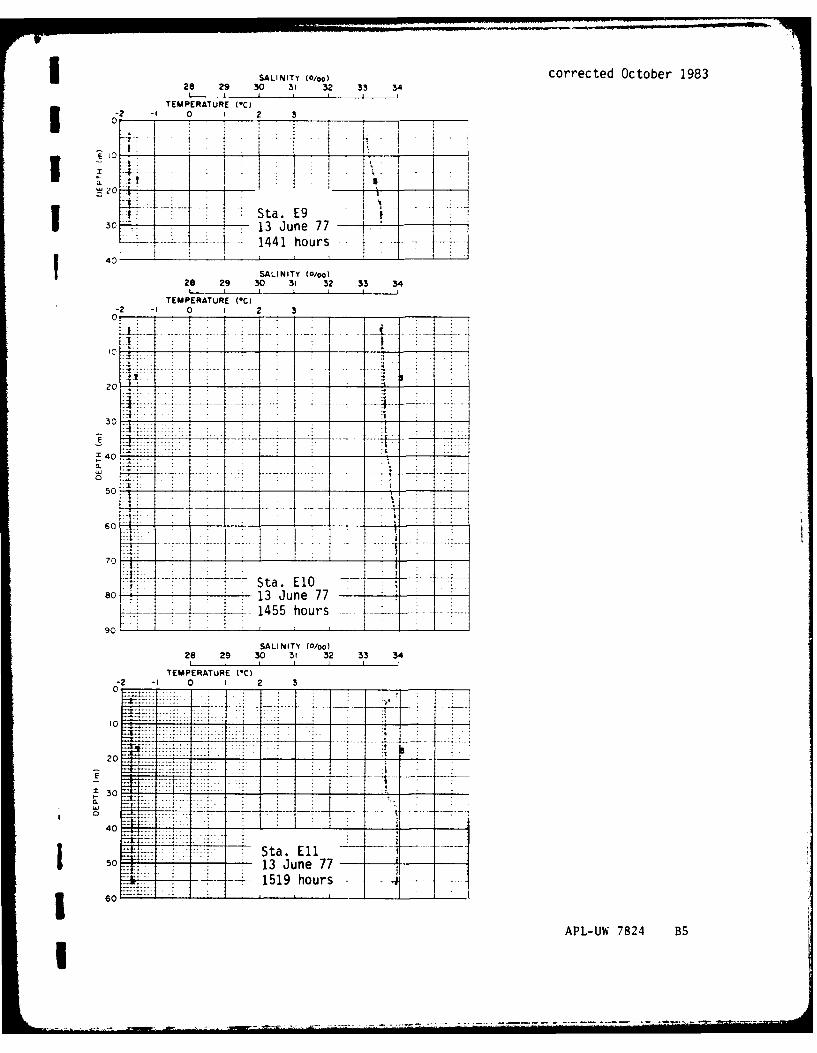
SALINITY (0/00) corrected October 198320 29 30 3I 32 33 34
J -I TEOPERATURE ~~IC) _ __
Sta. E93013 June 77-f+-I
- 1441 hours -40 SALINIT Y (0/oo),
28 29 30 31 3 2 3 13 3 .4
TEMPERATURE (*C)-2 -I 0 I 2 3
A TI t
74 - ---- ------ -- ----
50 -
6Cj~~ L - Sta. E1O0 _ KISALINITY (0/oo)
28 29 30 31 32 33 34
TEMPERATuRE MC)-2 -1 0- -3 -
10
.. .. ...
1 0 --- -------- - - -
0
40--- __ - - -
50Sta. Eli13 June77-1519 hours
60 _ _ _ _ __
APL-UW 7824 B5
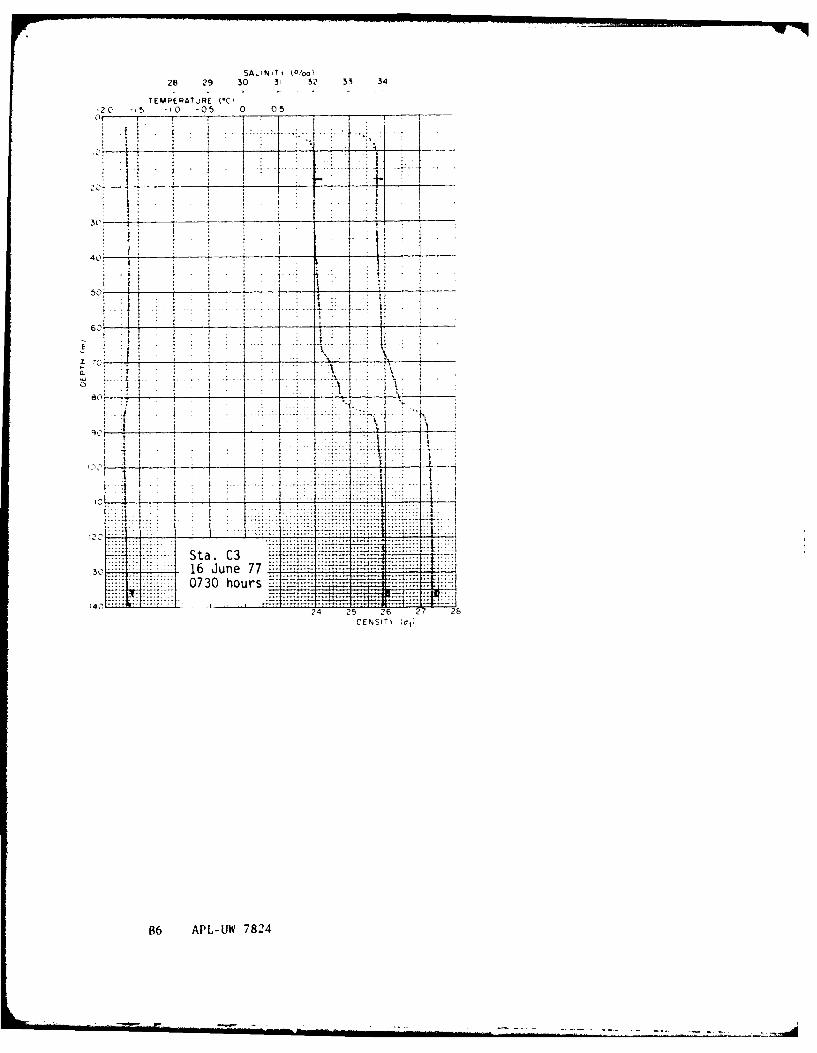
SALINiTt (0oo)28 29 30 3' 3? 33 34
TEMPERATJRE (*C)
-20 -1'5 -10 -05 0 0 5
I ___ __
40-t
4-- -' -~ -- - - - - - - -1
5,.ta C3_ *
14042
16 1Jun 7727 2
OENSiTY 1c11
B6 APL-UW 7824
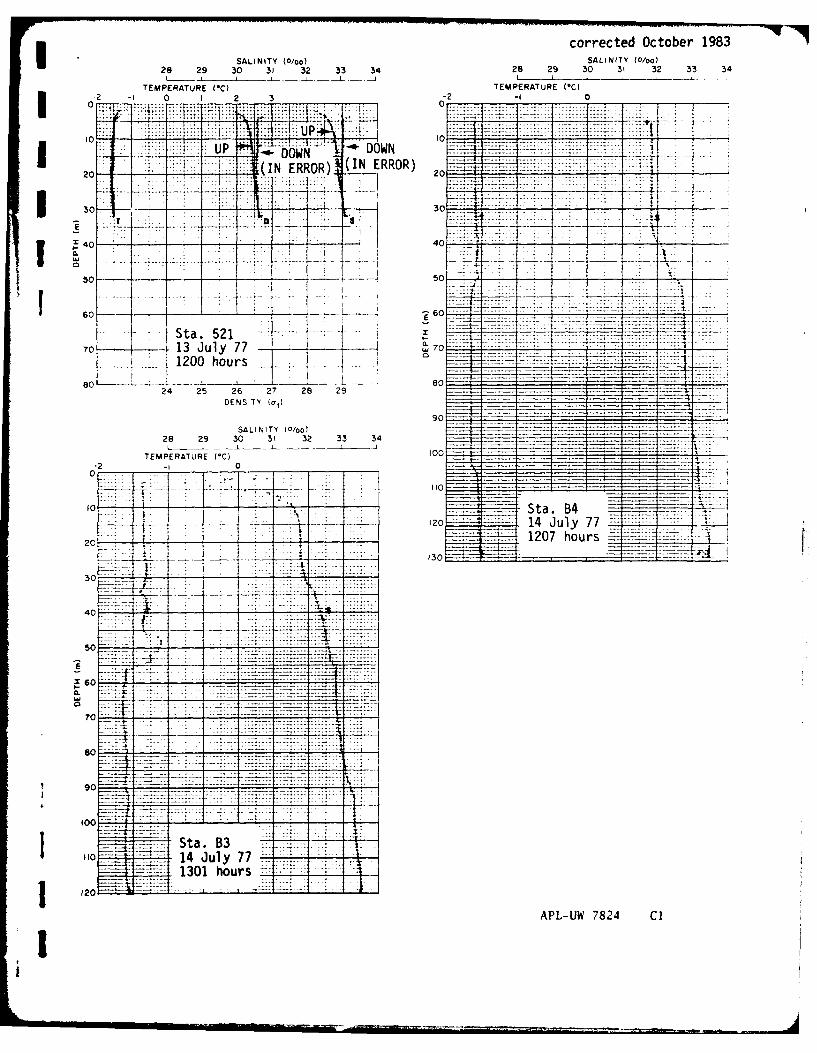
corrected October 1983SALINITY (0/o) SALIN17Y Woo)
28 29 30 3' 32 33 34 28 29 30 31 32 33 34
TEMPERATuRE (IC) TEMPERATURE (*C)
02 -1 0 I 2 3 0 -2 ....-
up: TP: ---- - . . ..-
3 UP DW 4-DOWN
20 - 2 I O)(IN ERROR) 20
of-~- 30-L'K -77 7 a44
- Sta. 5270 13 July 77 - CL-----
A 1200 hours HV +424 25 26 27 28 29
DENSITY (at)
28 29 30 3' 32 33 34
TEMPERATURE (*C 100C
-2 -,0
o Sta B4
___-.120__ 14 July 77
2-- . 1207 hours-~L
40 -
- -H:47 . .. . .....- ---- ---
*0j
90
1Jl-- -- ------- -j...
120 ~1301 hours Z Z . 1
APL-UW 7824 Cl
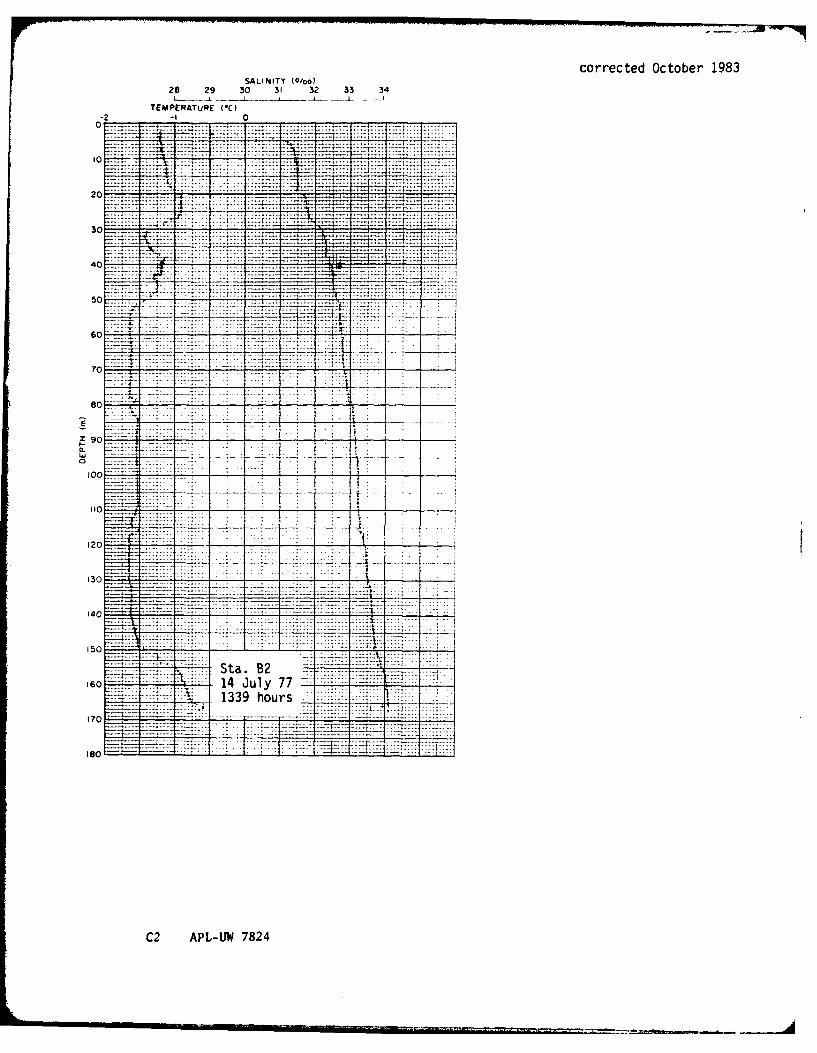
corrected October 1983SALINITY (0/oo)
28 29 30 31 32 33 34
TEMPERATuRE (*C)-2 -1 0
0± ----- ----
10
2C .. . . - - - -
30 ------......
137.
7-. 7 P-W72
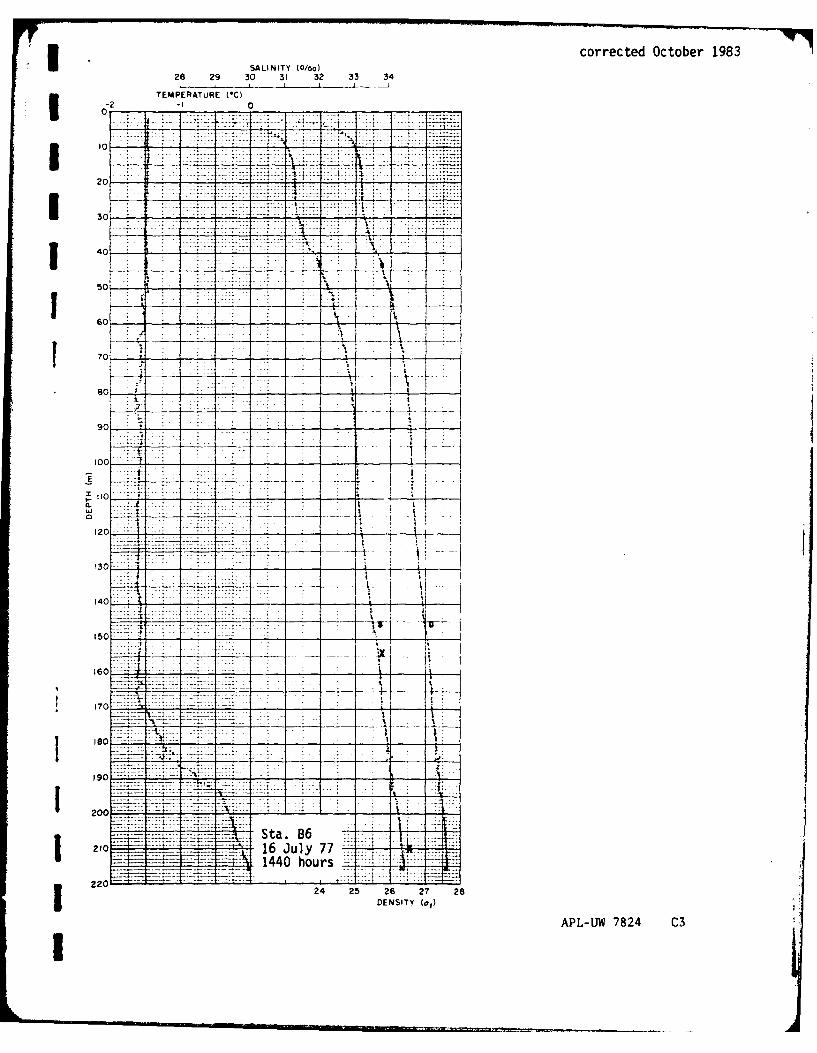
3 corrected October 1983ZSALINITY (0oo~)
28 29 30 31 32 33 34
TEMP ERATUR E (*C
.............................
20 -- - -- - - -- - -
_ _ _- ---------
90~.
E0 - - -
120z -a -
140.:
150.
16 0 -=;.
---- -----
-~ ~~ ----- 4---I90 .. .. .... . ....
14o --
200 ~ A ta. B ~ ~J
__ ~ 1440 hours
22~24 25 26 27 28
APL-JW 7824 C3
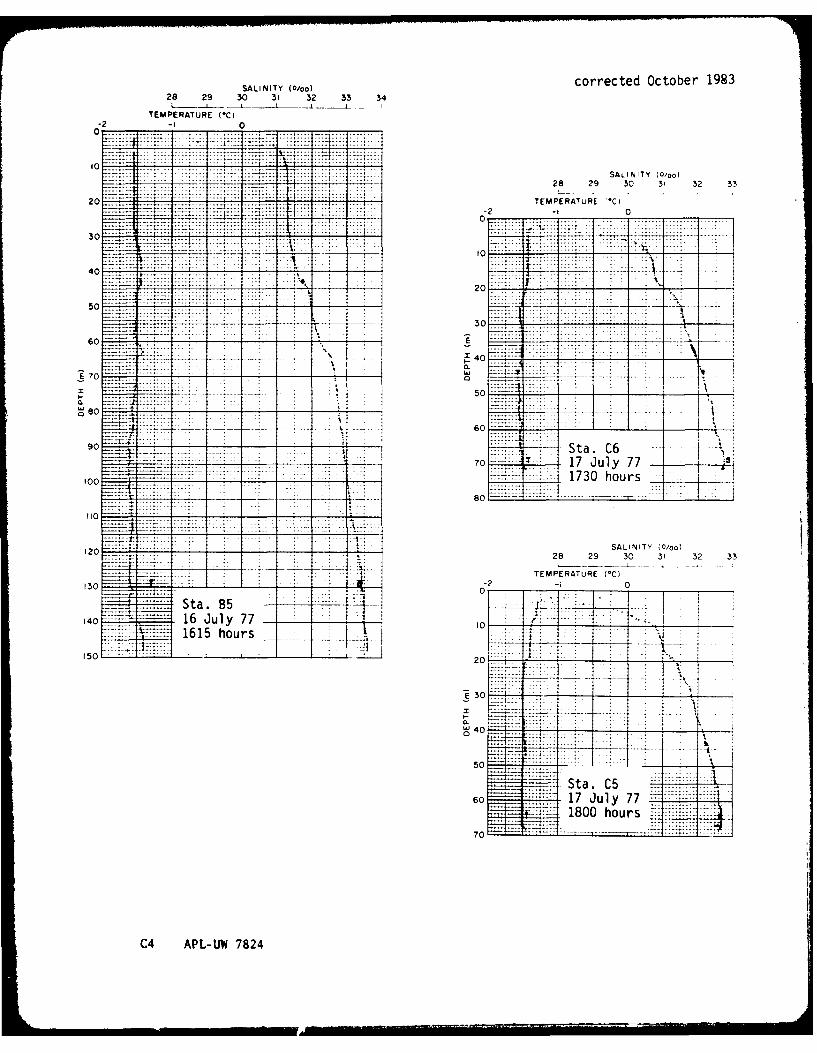
SALINTY (/00)corrected October 198328 29 30 31 32 33 34
L-A-~ _ _
TEMPERATURE (*C)-2 -1
0 - --. - . - -
SALINITY (0/oo)1+.28 29 30 31 32 33
20 .... t... TEMPERATLRE 'C)
30.
7C . 7 - -7.--7
4C4
50030 ------ -- -4
60 E .... - __
E 70- - ---------...
-80
-- -0-------- ...... _0
90 . . : :i~:~Sta. C670 T ~17 July 77 ;
100. 1730 hours
120 SALINITY (0/oo
128 29 30 31 32 33
- . TEMPERATURE (*C)
130 - - -2 0 _ _ _0 __
Sta. B5 IL- _
140 ~ 16 July 77 -,-0
1615 hours
____ 20
E 30-4- __
50.-.--
Sta. C5 -
60 17 July 77 - 7
:E~:1800 hours
C4 APL-UW 7824
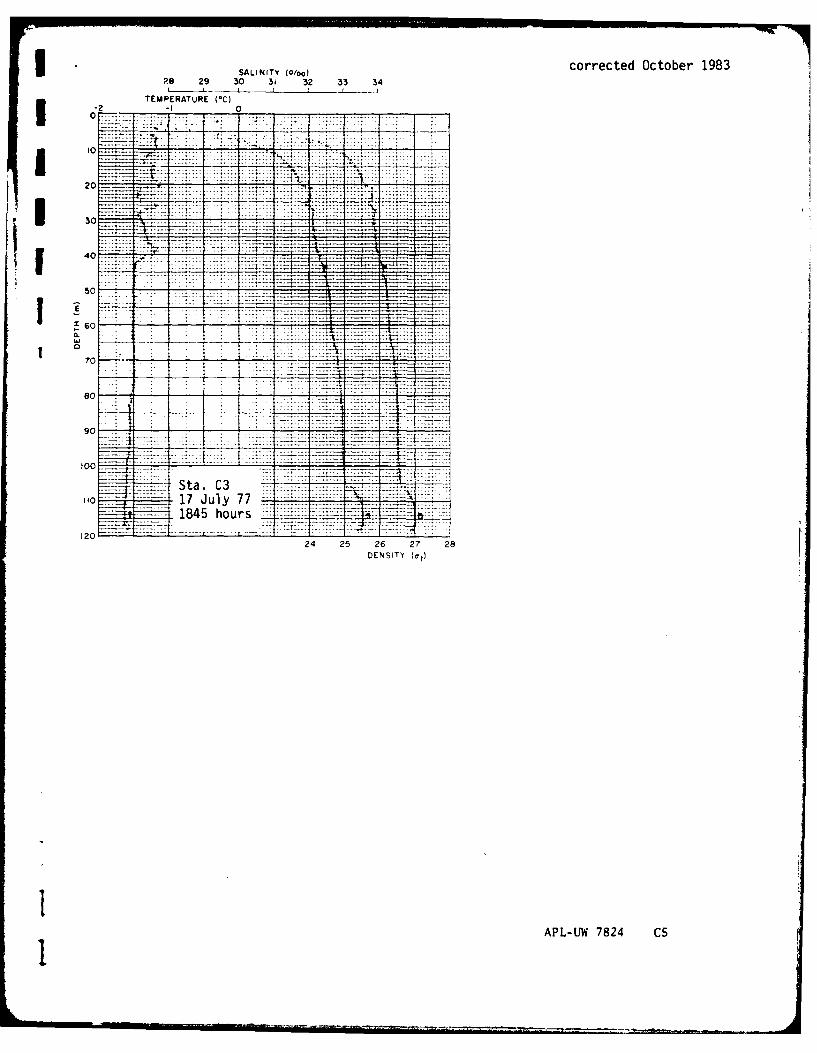
I SALITY (I~o ~corrected October 19832 1 29 3 50 3 32 3 3 4S
TEMPERATuRE (*C)2-1 0
I- -- -= ow_ - .
20 _
.....
185hor
2424607 2
DESTY0t
------60-W784 C
I0