Embed Size (px)
Citation preview

Slide 1
Seawater Desalination with Solar Energy Technologies and Potential
REM Conference Ravenna, March 1, 2012
Massimo Moser, German Aerospace Center (DLR)
Slide 2
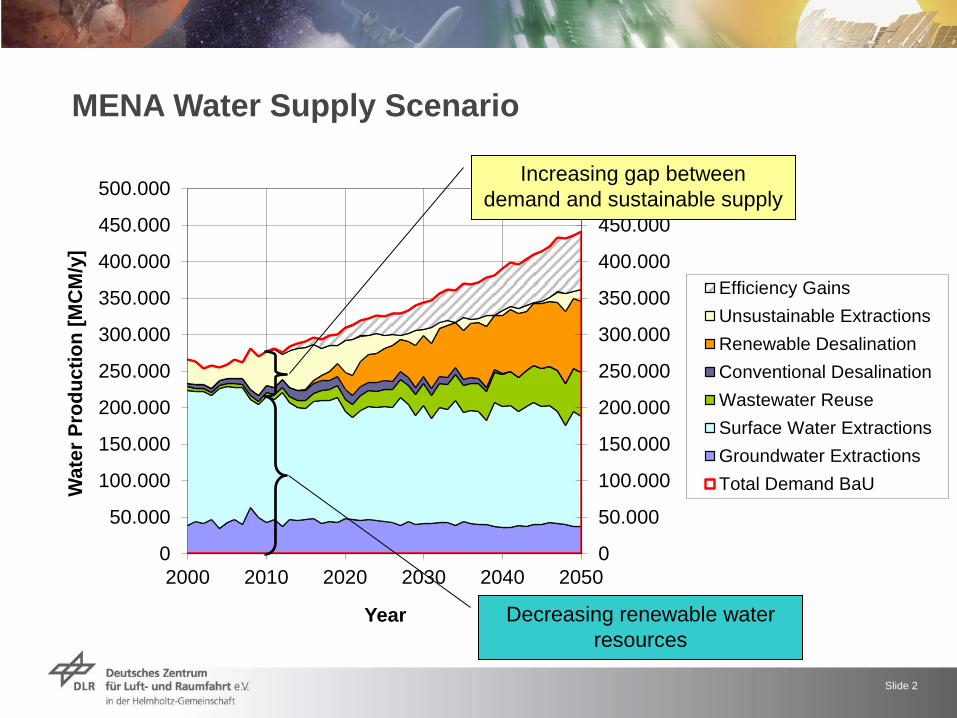
MENA Water Supply Scenario
0
50.000
100.000
150.000
200.000
250.000
300.000
350.000
400.000
450.000
500.000
0
50.000
100.000
150.000
200.000
250.000
300.000
350.000
400.000
450.000
500.000
2000 2010 2020 2030 2040 2050
Wat
er P
rodu
ctio
n [M
CM
/y]
Year
Efficiency GainsUnsustainable ExtractionsRenewable DesalinationConventional DesalinationWastewater ReuseSurface Water ExtractionsGroundwater ExtractionsTotal Demand BaU
Decreasing renewable water resources
Increasing gap between demand and sustainable supply

Slide 3
Conventional Desalination Plant
Screening, Filtration
Tunel Intake
Desalination Plant
Direct Discharge
Power Plant
Heat / Power
FuelFuel
Anti-Scaling Anti-Foaming Anti-Corrosion Desinfection
Slide 4
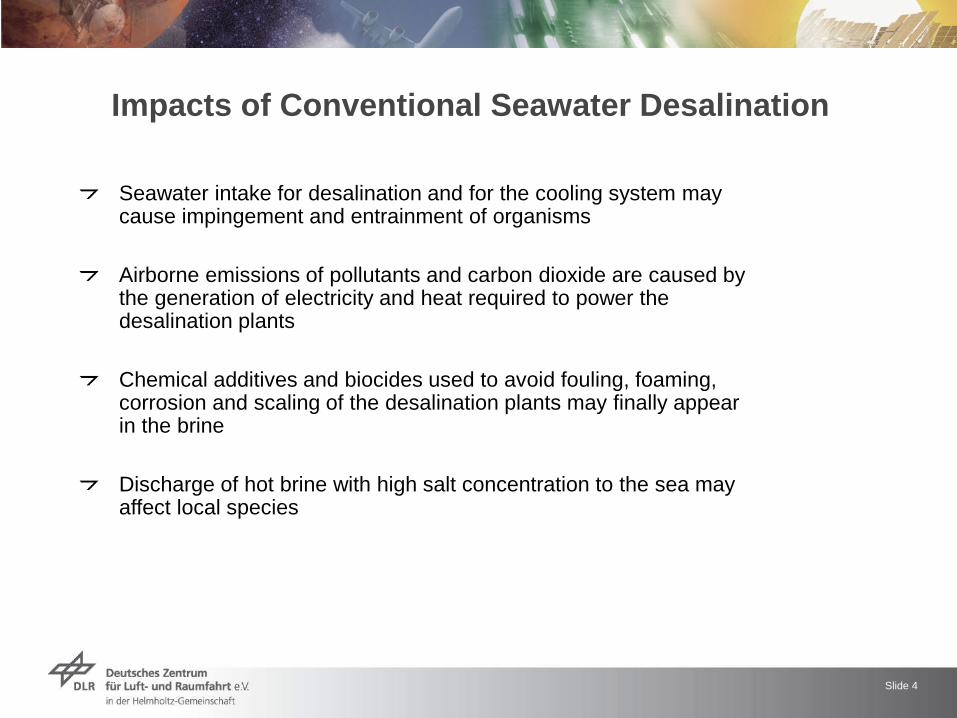
Impacts of Conventional Seawater Desalination Seawater intake for desalination and for the cooling system may cause impingement and entrainment of organisms Airborne emissions of pollutants and carbon dioxide are caused by the generation of electricity and heat required to power the desalination plants Chemical additives and biocides used to avoid fouling, foaming, corrosion and scaling of the desalination plants may finally appear in the brine Discharge of hot brine with high salt concentration to the sea may affect local species

Slide 5
Advanced CSP-Desalination Plant
Nano- Filtration
Horizontal Drain Intake or Micro- & Ultrafiltration
Desalination Plant
Multiport Diffuser Discharge
Power Plant
Heat / Power
Concentrating Solar Collector & Storage FuelFuel
Source: catalanadeperforacions.com; cormix.info

Slide 6 IWMI 2006
Global Water Scarcity

Slide 7
Global Potential for Concentrating Solar Power
REACCESS 2009

Slide 8
Fossil fuels cost 2002 - 2012 Coal (Australia)
x 4.2
Crude Oil
x 5.6
Natural Gas
x 1.2 Natural Gas (Russia)
x 4.4
www.indexmundi.com

Slide 9
Learning Curves for Renewable Energies
0
5
10
15
20
25
30
35
40
2000 2010 2020 2030 2040 2050
PV
Wind
Biomass CHP
Geothermal CHP
Concentrating solarthermal
LEC
[US$
cent
/kW
h]
EREC

Slide 10
Renewable Energies for Desalination: why CSP?
Desalination plants require continuous operation Conflict with the intermittent nature of renewable energies CSP offers the option of thermal energy storage Hybrid operation is possible in the same power block (no “shadow power plant” required)
A fair technology comparison has to be carried out by definition of a load profile!
To Wind and PV cost, storage (if available) and back-up cost have to be considered Grid import is not for free
Wind PV CSP
Power Supply Profile - PV + Fossil Backup
0.02.55.07.5
10.012.515.017.520.022.525.0
1 11 21 31 41 51 61 71 81 91 101 111 121 131 141 151 161
Hour of the week [-]Po
wer
[MW
]
PV Power PV Dump Fossil Backup Power Demand DES
Power Supply Profile - Wind + Fossil Backup
0.02.55.07.5
10.012.515.017.520.022.525.0
1 11 21 31 41 51 61 71 81 91 101 111 121 131 141 151 161
Hour of the week [-]
Pow
er [M
W]
Wind Power Wind Dump Fossil Backup Power Demand DES
Power Supply Profile - CSP Hybrid
0.02.55.07.5
10.012.515.017.520.022.525.0
1 13 25 37 49 61 73 85 97 109 121 133 145 157 169
Hour of the week [-]
Pow
er [M
W]
01002003004005006007008009001000
Stor
ed E
nerg
y [M
Wh]
CSP solar CSP fossil Demand DES Stored Thermal Energy

Slide 11
CSP Technology Overview
www.dlr.de/desertec; www.dlr.de/enermena

Slide 12
CSP Scheme
Solar FieldFossil Back-up Re-heater
Steam Turbine
Steam Generator
Thermal Storage
G
395 °C
295 °C
385 °C
285 °C
377 °C100 bar
Temperature depends on the configuration

Slide 13
Membrane stacks and high pressure pumps
Reverse Osmosis (RO)
Source: DME
Heat 0 kWhth/m³ Power 3 - 6 kWhel/m³

Slide 14
Multi Stage Flash (MSF)
Al Khobar, Saudi Arabia 267,000 m³/day
Stages 20 - 40 Heat 70 - 125 kWhth/m³ Power 3 - 5 kWhel/m³
www.dlr.de/tt/aqua-csp

Slide 15
Abutaraba – Libya 40,000 m³/day Stages 8 - 12 Heat 70 - 125 kWhth/m³ Power 1.5 kWhel/m³
Multi Effect Distillation (MED)

Slide 16
Possible CSP-DES Configurations
CSP: Parabolic Trough 2 desalination technologies:
MED: Multiple-Effect-Distillation RO: Reverse Osmosis
Desalination: 100,000 m3/d Power: ca. 100 MWel
Storage: 7.5 h (design) Plant operation: 8,000 h/y including fossil fuel back-up Levelized cost of electricity:
20 – 24 US$cent/kWh Levelized water cost:
1.5 – 1.9 US$/m3
Pre-treatment
MED
G
1
Sea
2 3 4 14
73 °C0,35 bar
377 °C16,5 bar
377 °C100 bar
Water intake
Brine discharge
Re-heater
Steam Turbine
Permeate
Brine
Pre-treatment
Once-ThroughCooling
G
SeaRO
Water intake
Brine discharge
377 °C100 bar
40 - 50 °C

Slide 17
Conclusions
High uncertainty on future water availability! Unmet water demand of MENA in 2050 between 85 km3 and 283 km3 (average scenario 199 km3) A set of countermeasures is urgently required: increased efficiency of water production, distribution, end-use and management, re-use of waste water, sustainable desalination Yearly adaptation cost US$ 103 Billion €2010.
Yemen (11.8%), Iraq (7.5%), Morocco (4.7%), Jordan (4.0%) and Egypt (2.4%) will face the highest cost in relation to the GDP Almost all countries have enough potential to develop CSP also on coastal areas Start to act now in order to build-up the required industrial capacities. Political support is required!

Slide 18
Thank you for your attention!
For more Info: www.dlr.de/tt/menawater
www.med-csd-ec.eu www.dlr.de/tt/aqua-csp