Embed Size (px)
Citation preview

Sebastián Nieto Parra
Economist LAC Unit Development Centre
OECD
October 2015
INTEGRATING SECURITIES MARKETS TO BOOST COMPETITIVENESS
The Latin American Integrated Market – MILA DAY 2015

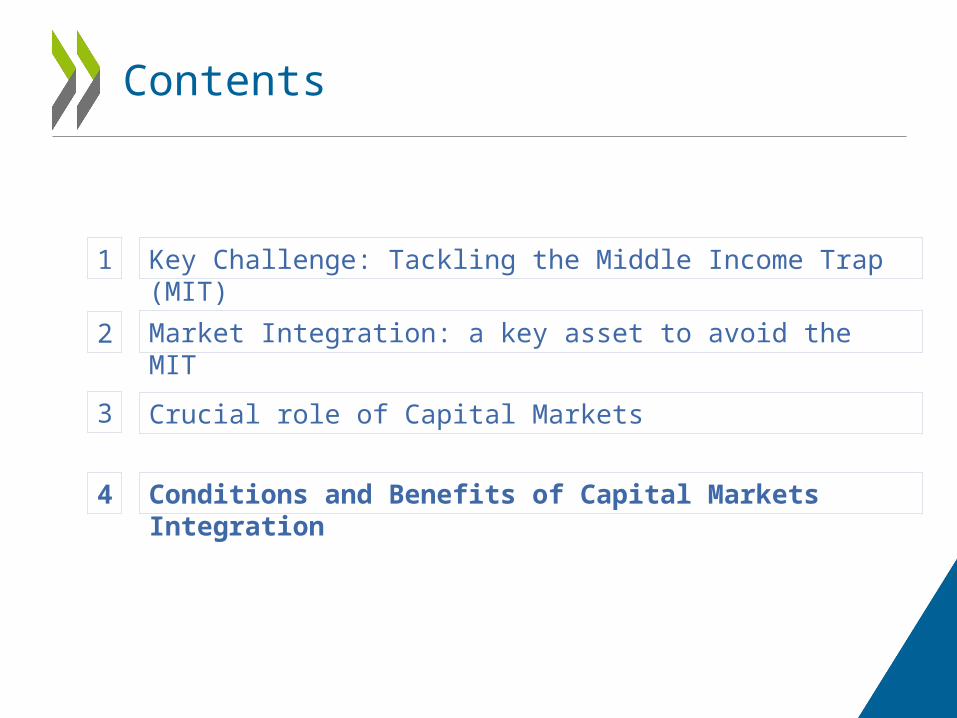
Contents
Key Challenge: Tackling the Middle Income Trap (MIT)1
Market Integration: a key asset to avoid the MIT2
Crucial role of Capital Markets3
Conditions and Benefits of Capital Markets Integration4
Contents
Key Challenge: Tackling the Middle Income Trap (MIT)
1
Market Integration: a key asset to avoid the MIT2
Crucial role of Capital Markets3
Conditions and Benefits of Capital Markets Integration4
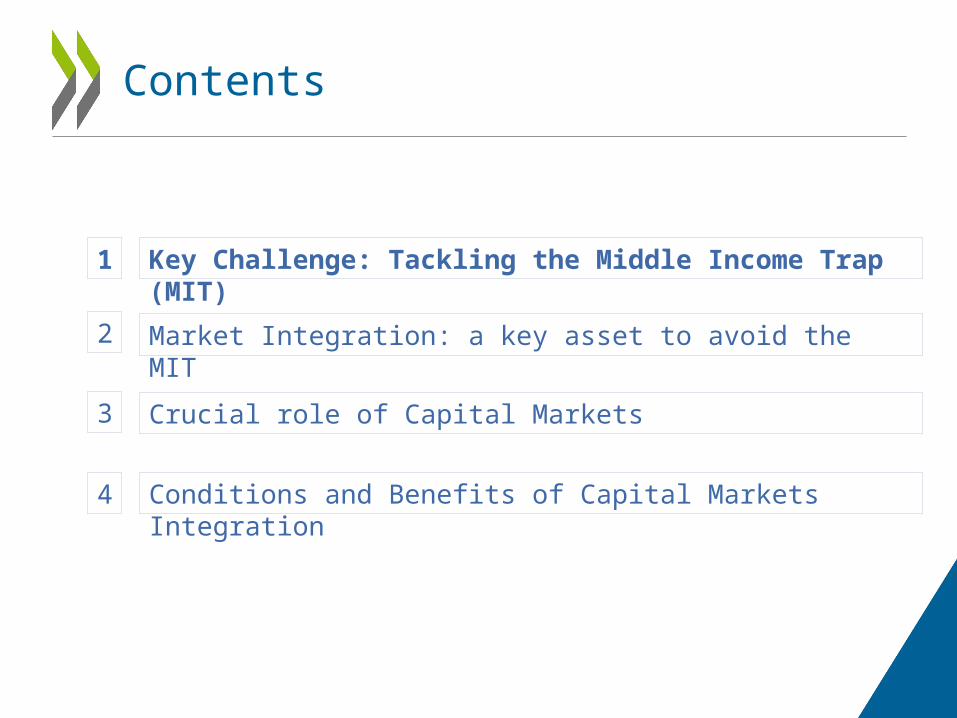
The Middle Income Trap: A common challenge in the MILA countries
Source: OECD-CAF-ECLAC Latin American Economic Outlook , 2014
GDP per capita (1990 USD )
CHL URY ARG VEN CRI MEX COL BRA PER DOM OECD average
0
5000
10000
15000
20000
25000
30000
35000
40000
2013 1980 1950
HI
UMI
LMI
LI
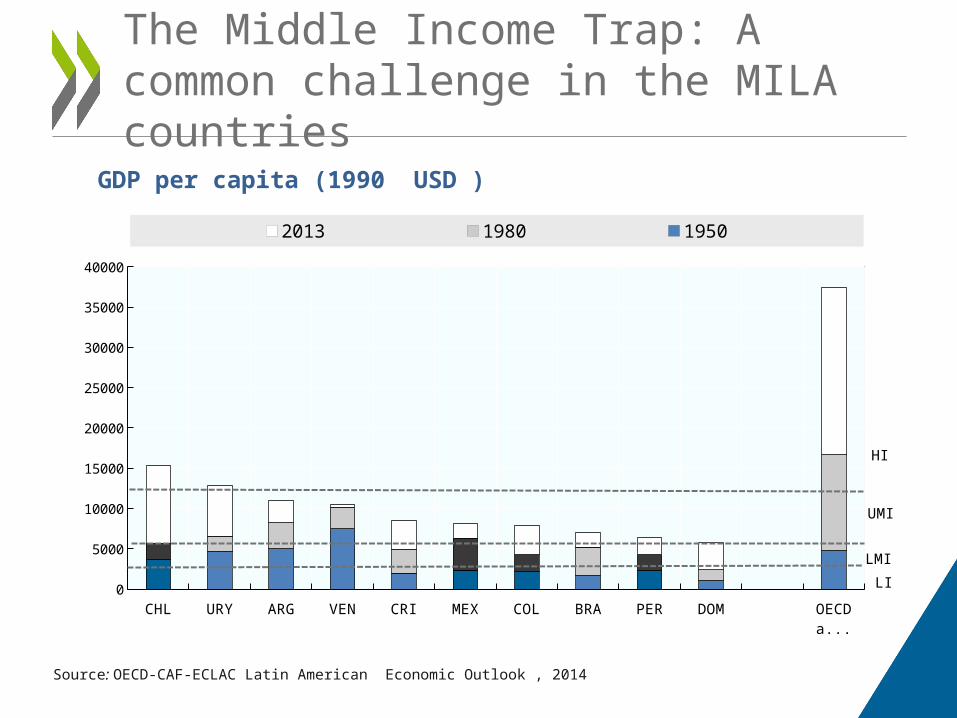
A disappointing progress compared to different OECD countries
Source: Author's calculation based on Felipe, Abdon and Kumar (2012). Data extracted from International Monetary Fund, World Economic Outlook Database (April 2015) and Madison (2010)
Evading the middle income trap
1950
1951
1952
1953
1954
1955
1956
1957
1958
1959
1960
1961
1962
1963
1964
1965
1966
1967
1968
1969
1970
1971
1972
1973
1974
1975
1976
1977
1978
1979
1980
1981
1982
1983
1984
1985
1986
1987
1988
1989
1990
1991
1992
1993
1994
1995
1996
1997
1998
1999
2000
2001
2002
2003
2004
2005
2006
2007
2008
2009
2010
2011
2012
2013
2014
2015
0
2000
4000
6000
8000
10000
12000
China South Korea Japan Portugal Israel
Spain LAC avg MILA avg
GD
P p
er c
apit
a c
on
sta
nt
1990P
PP
doll
ars
High-income> 11 750 USD
Middle-income7250 USD
Low-income> 2 000 USD
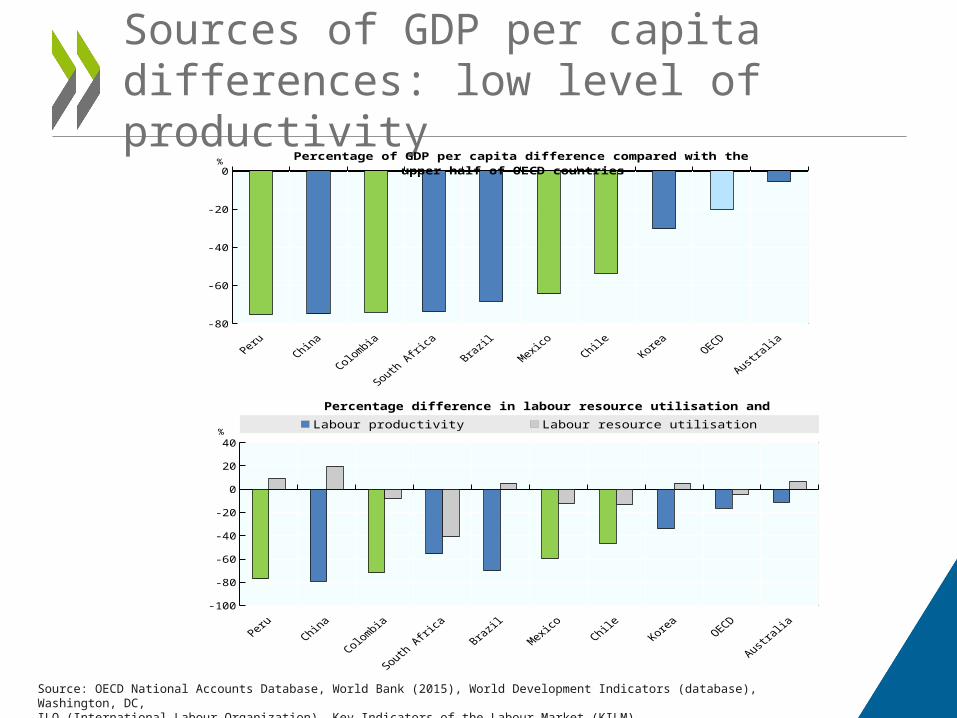
Sources of GDP per capita differences: low level of productivity
Peru China Colombia South Africa Brazil Mexico Chile Korea OECD Australia-80
-60
-40
-20
0
Percentage of GDP per capita difference compared with the upper half of OECD countries %
Source: OECD National Accounts Database, World Bank (2015), World Development Indicators (database), Washington, DC, ILO (International Labour Organization), Key Indicators of the Labour Market (KILM)
Peru China Colombia South Africa Brazil Mexico Chile Korea OECD Australia-100
-80
-60
-40
-20
0
20
40
Percentage difference in labour resource utilisation and labour productivity
Labour productivity Labour resource utilisation%
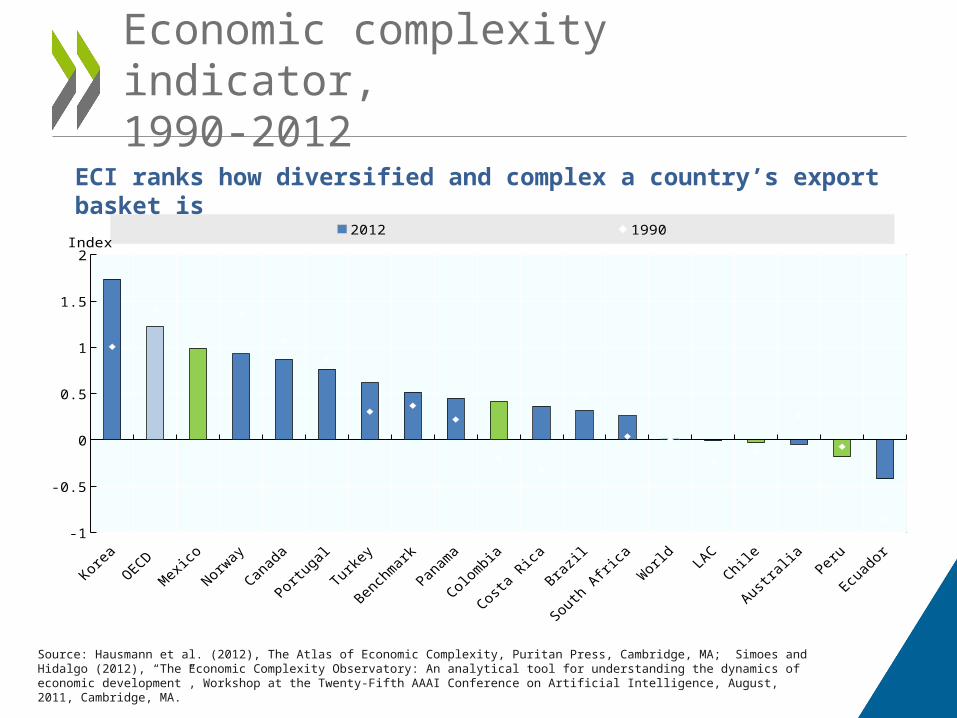
Economic complexity indicator, 1990-2012
Korea
OECD
Mexico
Norway
Canad
a
Portug
al
Turkey
Bench
mark
Panam
a
Colombia
Costa
RicaBraz
il
South
Africa
World
LAC
Chile
Austra
liaPeru
Ecuad
or-1
-0.5
0
0.5
1
1.5
2
2012 1990Index
ECI ranks how diversified and complex a country’s export basket is
Source: Hausmann et al. (2012), The Atlas of Economic Complexity, Puritan Press, Cambridge, MA; Simoes and Hidalgo (2012), “The Economic Complexity Observatory: An analytical tool for understanding the dynamics of economic development”, Workshop at the Twenty-Fifth AAAI Conference on Artificial Intelligence, August, 2011, Cambridge, MA.
Contents
Key Challenge: Tackling the Middle Income Trap (MIT)1
Market Integration: a key asset to avoid the MIT2
Crucial role of Capital Markets3
Conditions and Benefits of Capital Markets Integration4
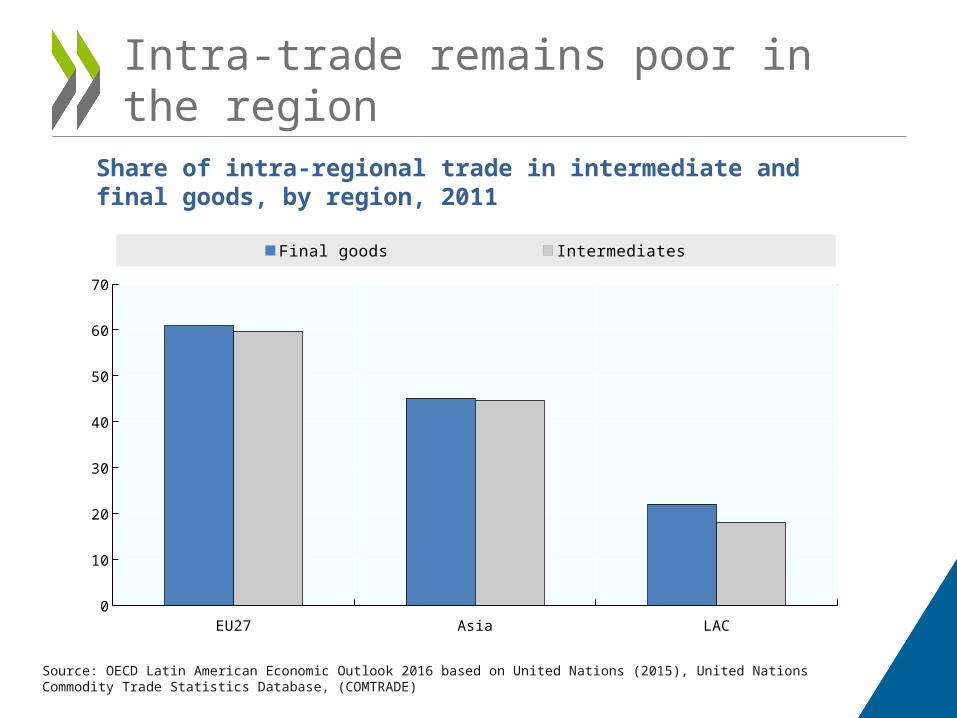
Intra-trade remains poor in the region
Share of intra-regional trade in intermediate and final goods, by region, 2011
EU27 Asia LAC0
10
20
30
40
50
60
70
Final goods Intermediates
Source: OECD Latin American Economic Outlook 2016 based on United Nations (2015), United Nations Commodity Trade Statistics Database, (COMTRADE)
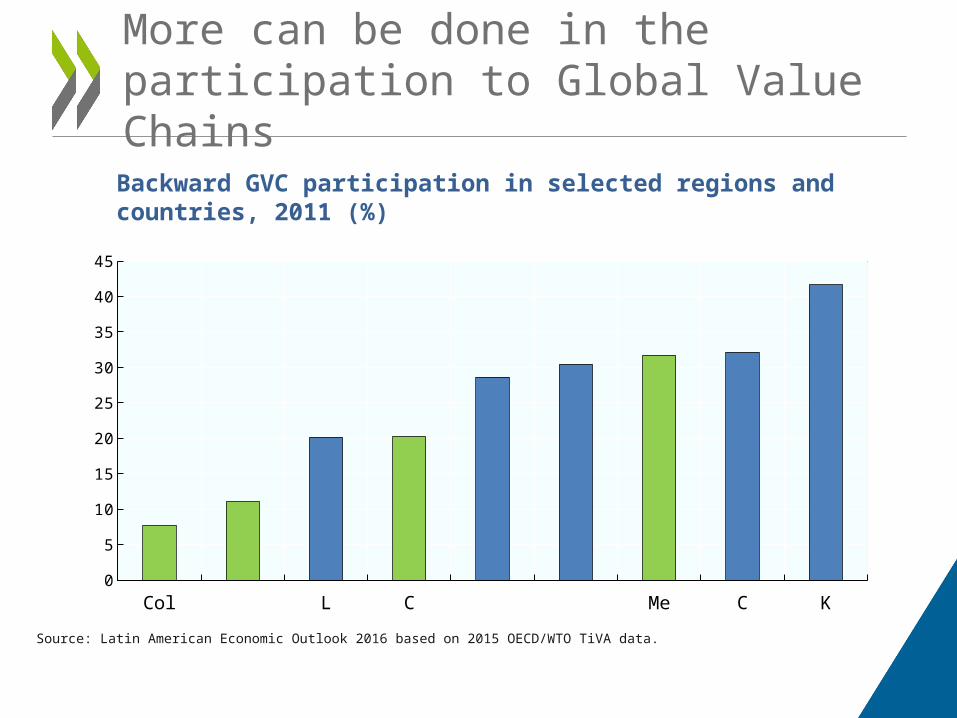
More can be done in the participation to Global Value Chains
Colombia Peru LAC 6 Chile EU27 Asia Mexico China Korea0
5
10
15
20
25
30
35
40
45
Backward GVC participation in selected regions and countries, 2011 (%)
Source: Latin American Economic Outlook 2016 based on 2015 OECD/WTO TiVA data.
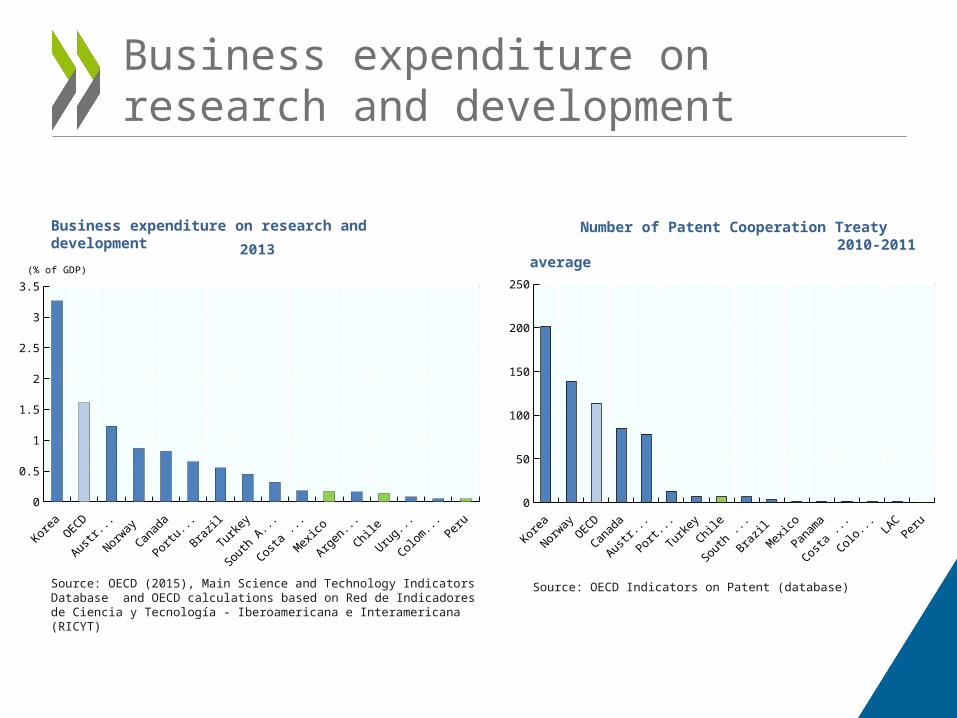
Business expenditure on research and development
Korea
OECD
Australi
a
Norway
Canada
Portuga
l Braz
il
Turkey
South A
frica
Costa R
ica
Mexico
Argentin
aChile
Uruguay
Colombia
Peru
0
0.5
1
1.5
2
2.5
3
3.5
2013(% of GDP)
Korea
Norway
OECDCana
da
Australi
a
Portuga
l
Turkey
Chile
South A
frica
Brazil
Mexico
Panama
Costa R
ica
Colombia LA
CPeru
0
50
100
150
200
250
Number of Patent Cooperation Treaty 2010-2011 average
Source: OECD Indicators on Patent (database)
Business expenditure on research and development
Source: OECD (2015), Main Science and Technology Indicators Database and OECD calculations based on Red de Indicadores de Ciencia y Tecnología - Iberoamericana e Interamericana (RICYT)
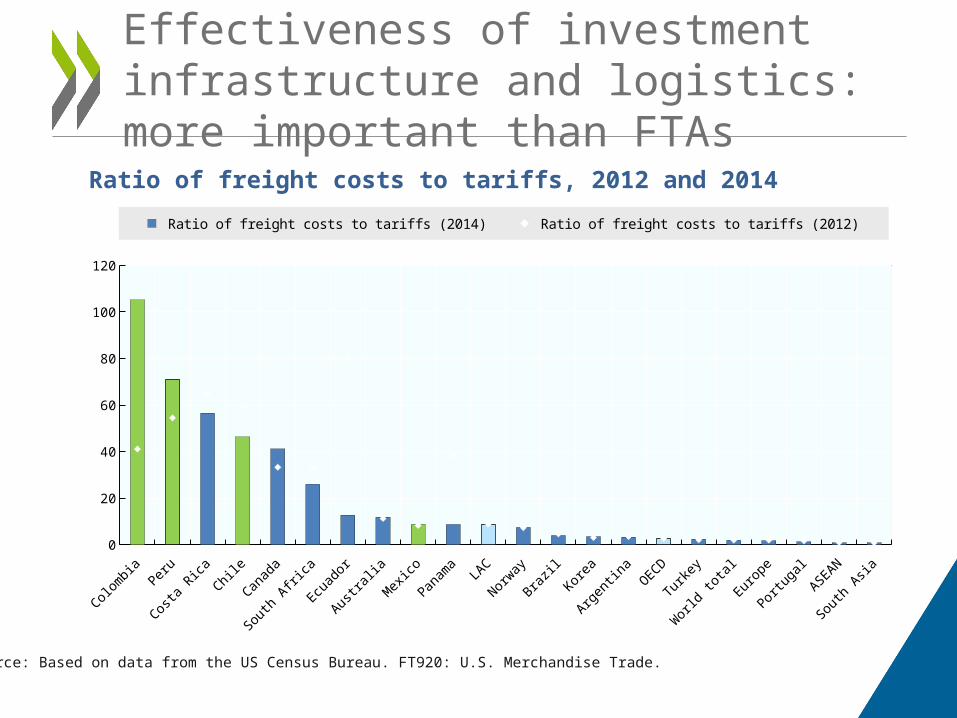
Effectiveness of investment infrastructure and logistics: more important than FTAs
Ratio of freight costs to tariffs, 2012 and 2014
Source: Based on data from the US Census Bureau. FT920: U.S. Merchandise Trade.
Colombia Peru
Costa R
ica Chile
Canad
a
South
Africa
Ecuado
r
Austral
iaMexi
co
Panam
aLA
C
Norway
Brazil
Korea
Argentin
aOECD
Turkey
World t
otal
Europe
Portug
al
ASEAN
South
Asia0
20
40
60
80
100
120
Ratio of freight costs to tariffs (2014) Ratio of freight costs to tariffs (2012)

Contents
Key Challenge: Tackling the Middle Income Trap (MIT)1
Market Integration: a key asset to avoid the MIT2
Crucial role of Capital Markets3
Conditions and Benefits of Capital Markets Integration4
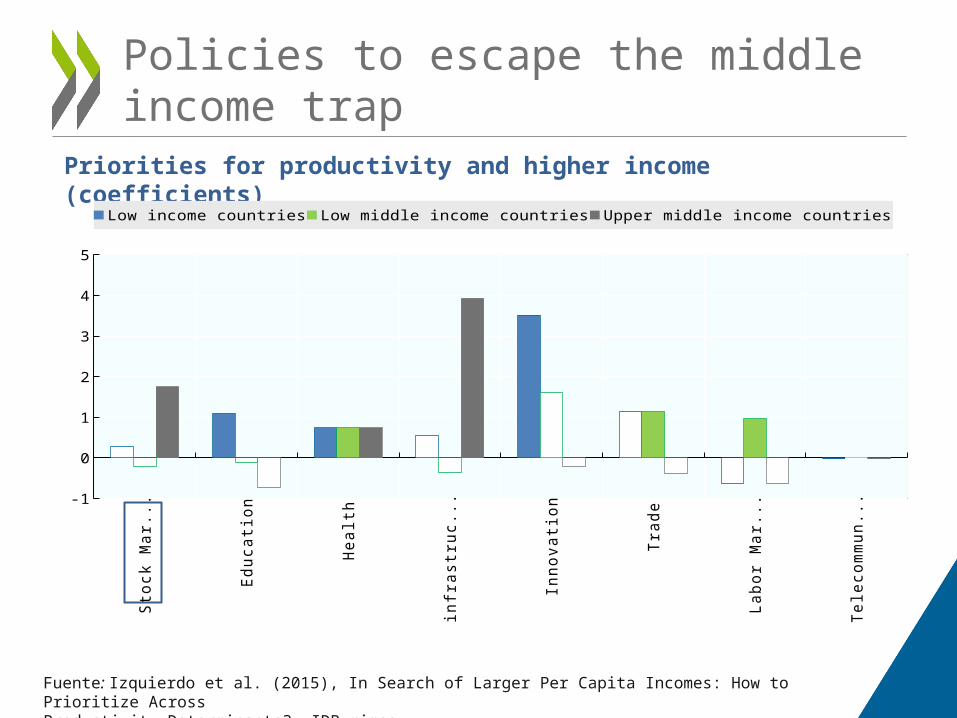
Priorities for productivity and higher income (coefficients)
Fuente: Izquierdo et al. (2015), In Search of Larger Per Capita Incomes: How to Prioritize Across Productivity Determinants?, IDB mimeo.
Policies to escape the middle income trapS
tock
Mar
kets
Edu
catio
n
Hea
lth
infra
stru
ctur
e
Inno
vatio
n
Trad
e
Labo
r Mar
kets
Tele
com
mun
icat
ion-1
0
1
2
3
4
5
Low income countries Low middle income countries Upper middle income countries
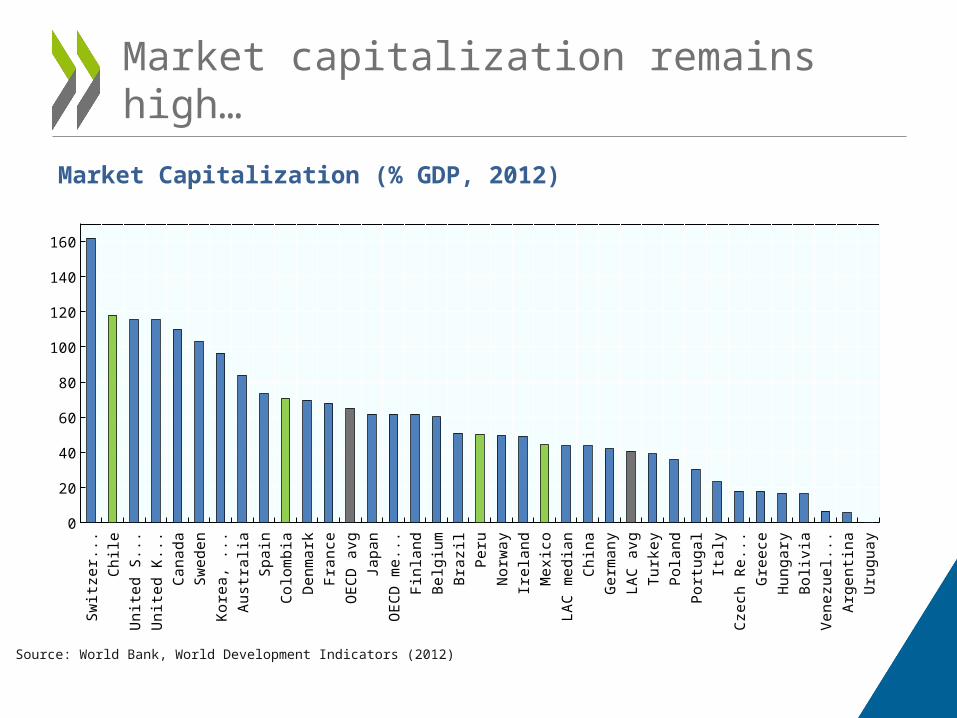
Market Capitalization (% GDP, 2012)
Source: World Bank, World Development Indicators (2012)
Switz
erla
ndC
hile
Uni
ted
Stat
esU
nite
d Ki
ngdo
mC
anad
aSw
eden
Kore
a, R
ep.
Aust
ralia
Spai
nC
olom
bia
Den
mar
kFr
ance
OEC
D a
vgJa
pan
OEC
D m
edia
nFi
nlan
dBe
lgiu
mBr
azil
Peru
Nor
way
Irela
ndM
exic
oLA
C m
edia
nC
hina
Ger
man
yLA
C a
vgTu
rkey
Pola
ndPo
rtuga
lIta
lyC
zech
Rep
ublic
Gre
ece
Hun
gary
Boliv
iaVe
nezu
ela,
RB
Arge
ntin
aU
rugu
ay
0
20
40
60
80
100
120
140
160
Market capitalization remains high…
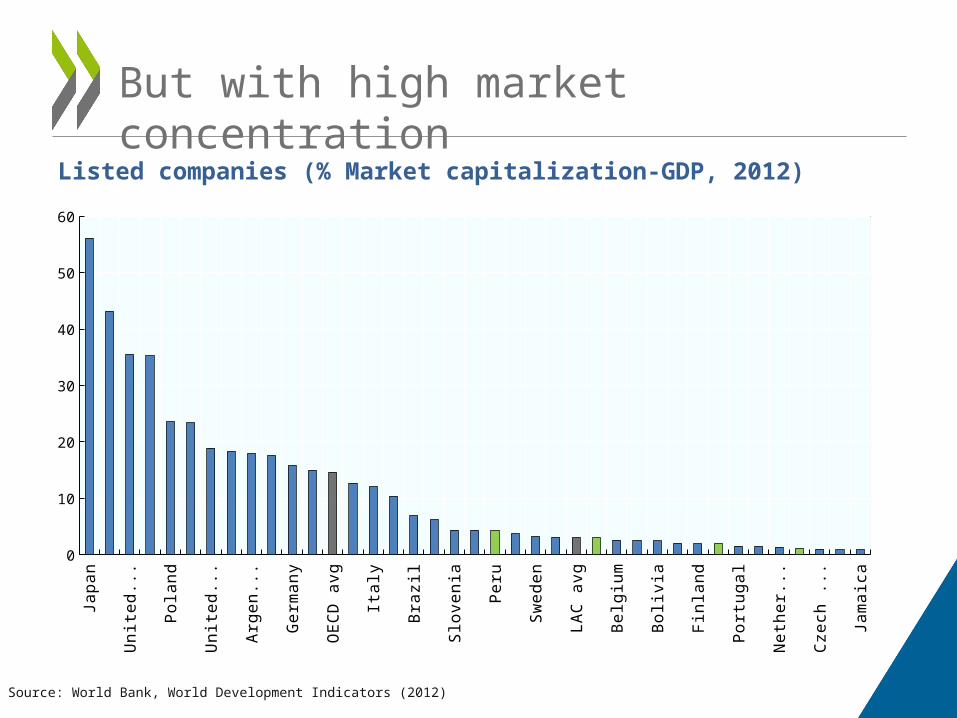
Listed companies (% Market capitalization-GDP, 2012)
Source: World Bank, World Development Indicators (2012)
Japa
nSp
ain
Unite
d St
ates
Cana
daPo
land
Aust
ralia
Unite
d Ki
n...
Kore
a, R
ep.
Arge
ntin
aUr
ugua
yG
erm
any
Gre
ece
OEC
D av
gFr
ance
Italy
Turk
eyBr
azil
Vene
zuel
a, R
BSl
oven
iaO
ECD
med
ian
Peru
Norw
aySw
eden
Hung
ary
LAC
avg
Mex
ico
Belg
ium
Denm
ark
Boliv
iaLA
C m
edia
nFi
nlan
dCh
ilePo
rtuga
lSw
itzer
land
Neth
erla
nds
Colo
mbi
aCz
ech
Repu
...Ire
land
Jam
aica
0
10
20
30
40
50
60
But with high market concentration
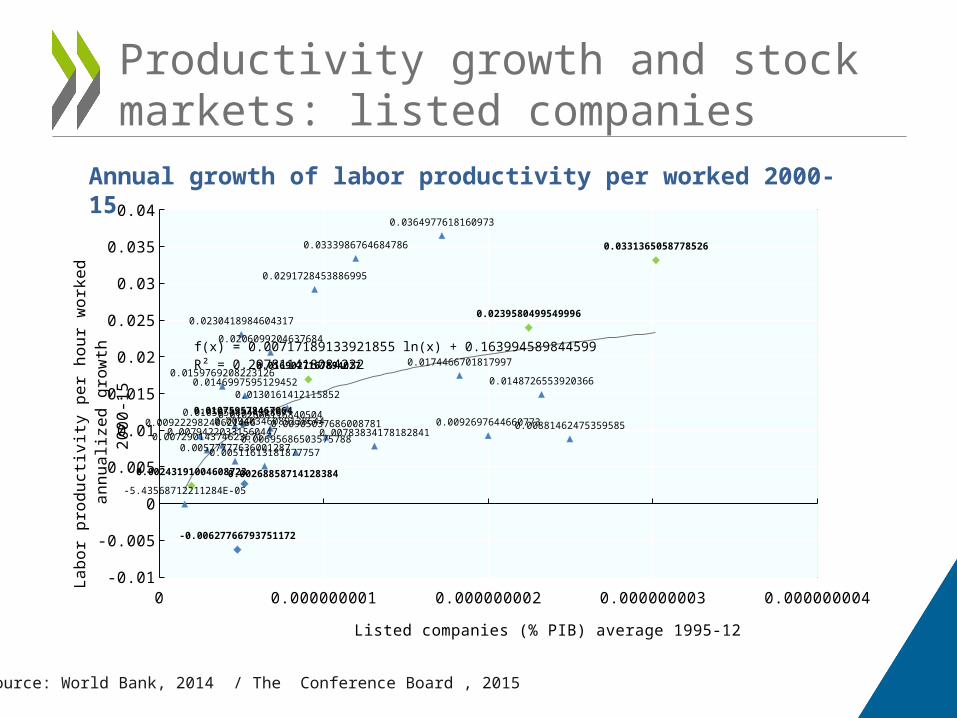
Annual growth of labor productivity per worked 2000-15
Source: World Bank, 2014 / The Conference Board , 2015
0 5E-10 0.000000001 0.0000000015 0.000000002 0.0000000025 0.000000003 0.0000000035-0.01
-0.005
0
0.005
0.01
0.015
0.02
0.025
0.03
0.035
0.040.0364977618160973
0.0333986764684786 0.0331365058778526
0.0291728453886995
0.02395804995499960.0230418984604317
0.0206099204637684
0.01744667018179970.01690271678940270.0159769208223126
0.01487265539203660.01469975951294520.0130161412115852
0.0107595784670640.01058506944918670.01026661168405040.00940346089138644 0.00926976446607730.00922298240621466 0.00905037686008781 0.00881462475359585
0.00794220331560447 0.007838341781828410.00729014374623671 0.006956865035757880.005777776360012870.00511613181877757
0.002688587141283840.00243191004608723
-5.43568712211284E-05
-0.00627766793751172
f(x) = 0.00717189133921856 ln(x) + 0.163994589844599R² = 0.297811418084232
Listed companies (% PIB) average 1995-12
Labo
r pro
duct
ivity
per
hou
r wor
ked
ann
ualiz
ed g
rowt
h 20
00-1
5Productivity growth and stock markets: listed companies
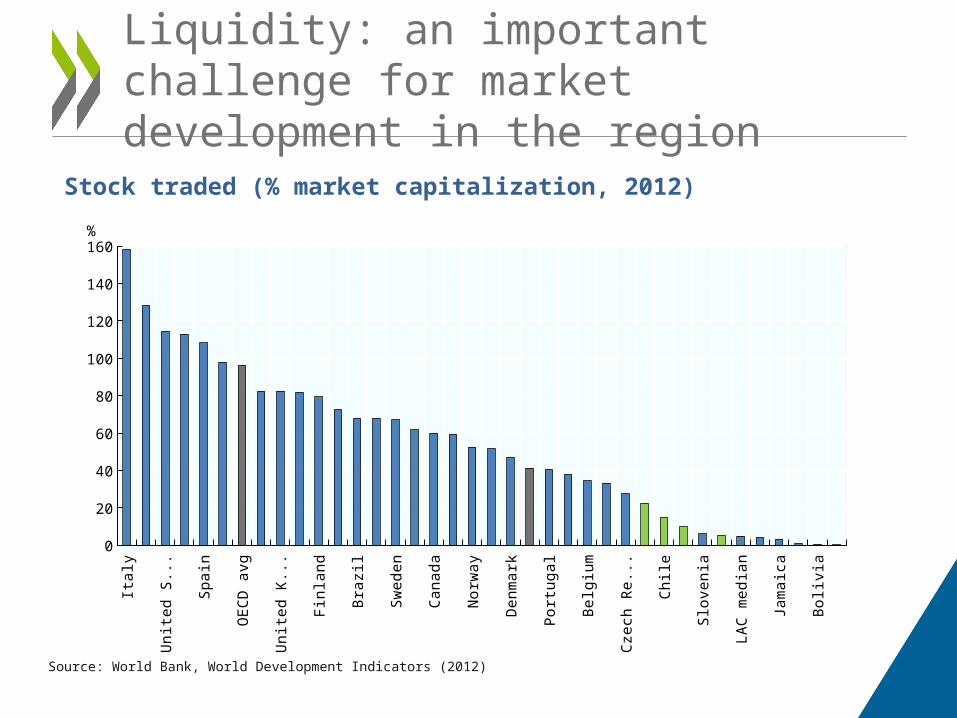
Stock traded (% market capitalization, 2012)
Italy
Kore
a, R
ep.
Uni
ted
Stat
esTu
rkey
Spai
nJa
pan
OEC
D a
vgG
erm
any
Uni
ted
King
dom
Aust
ralia
Finl
and
OEC
D m
edia
nBr
azil
Net
herla
nds
Swed
enFr
ance
Can
ada
Switz
erla
ndN
orw
ayH
unga
ryD
enm
ark
LAC
avg
Portu
gal
Pola
ndBe
lgiu
mG
reec
eC
zech
Rep
ublic
Mex
ico
Chi
leC
olom
bia
Slov
enia
Peru
LAC
med
ian
Arge
ntin
aJa
mai
caU
rugu
ayBo
livia
Vene
zuel
a
0
20
40
60
80
100
120
140
160%
Source: World Bank, World Development Indicators (2012)
Liquidity: an important challenge for market development in the region
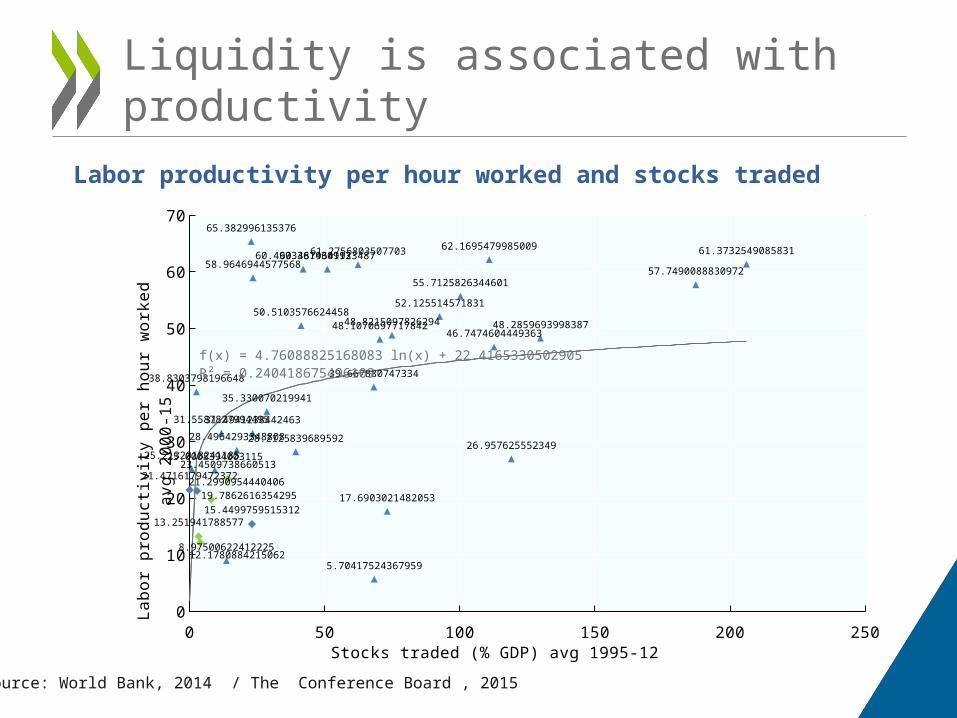
Liquidity is associated with productivity
Source: World Bank, 2014 / The Conference Board , 2015
Labor productivity per hour worked and stocks traded
0 50 100 150 200 2500
10
20
30
40
50
60
7065.382996135376
62.1695479985009 61.373254908583161.275680350770360.499336143091360.487964192348758.9646944577568
57.749008883097255.7125826344601
52.12551457183150.5103576624458
48.8215097826294 48.285969399838748.107069771784246.7474604449363
39.66788074733438.8303798196648
35.330070219941
31.558782799449531.4941238442463
28.496429334880828.212583968959226.9576255523491
25.213201824118525.000839400311523.4509738660513
21.471617947237221.299095444040619.7862616354295 17.6903021482053
15.449975951531213.251941788577
12.17808842150628.97500622412225
5.70417524367959
f(x) = 4.76088825168084 ln(x) + 22.4165330502905R² = 0.24041867549611
Stocks traded (% GDP) avg 1995-12
Labo
r pro
duct
ivity
per
hou
r wor
ked
avg
2000
-15
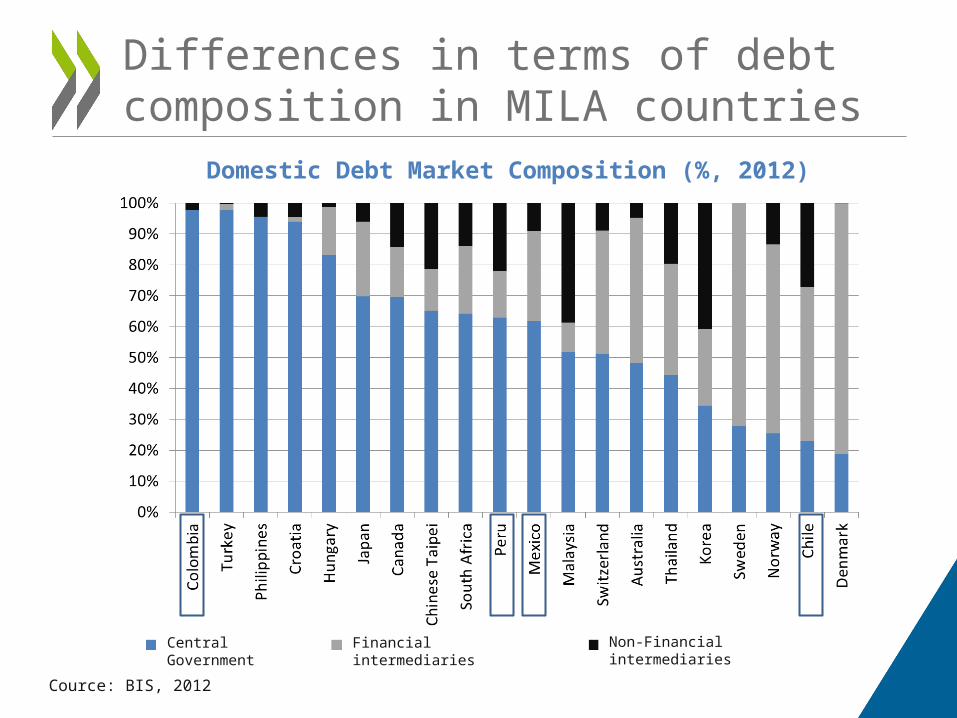
Differences in terms of debt composition in MILA countries
Domestic Debt Market Composition (%, 2012)
Cource: BIS, 2012
Central Government
Financial intermediaries Non-Financial intermediaries
Contents
Key Challenge: Tackling the Middle Income Trap (MIT)1
Market Integration: a key asset to avoid the MIT2
Crucial role of Capital Markets3
Conditions and Benefits of Capital Markets Integration
4
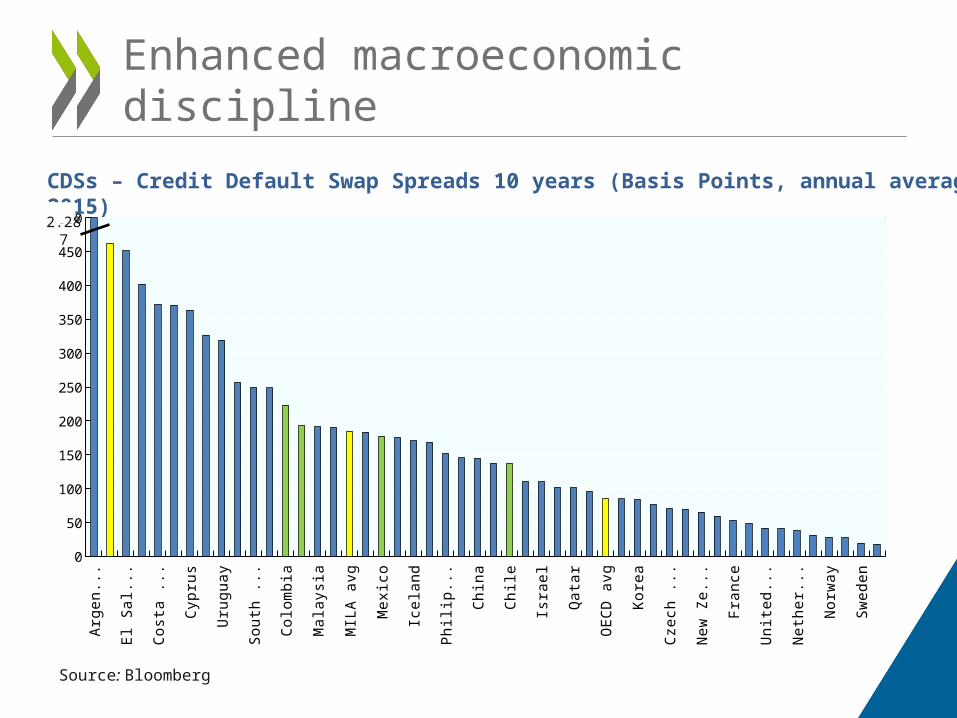
CDSs – Credit Default Swap Spreads 10 years (Basis Points, annual average 2015)
Enhanced macroeconomic discipline
Source: Bloomberg
Arge
ntin
aLA
C a
vgEl
Sal
vado
rD
omin
ican
r...
Cos
ta R
ica
Rus
sia
Cyp
rus
Gua
tem
ala
Uru
guay
Indo
nesi
aSo
uth
Afric
aTu
rkey
Col
ombi
aPe
ruM
alay
sia
Pana
ma
MIL
A av
gPo
rtuga
lM
exic
oH
unga
ryIc
elan
dTh
aila
ndPh
ilipp
ines
Slov
enia
Chi
na Italy
Chi
leSp
ain
Isra
elPo
land
Qat
arSi
ngap
ore
OEC
D a
vgSl
ovak
Rep
u...
Kore
aEs
toni
aC
zech
Rep
u...
Irela
ndN
ew Z
eala
ndBe
lgiu
mFr
ance
Japa
nU
nite
d Ki
n...
Finl
and
Net
herla
nds
Aust
riaN
orw
ayD
enm
ark
Swed
enG
erm
any
0
50
100
150
200
250
300
350
400
450
5002.287
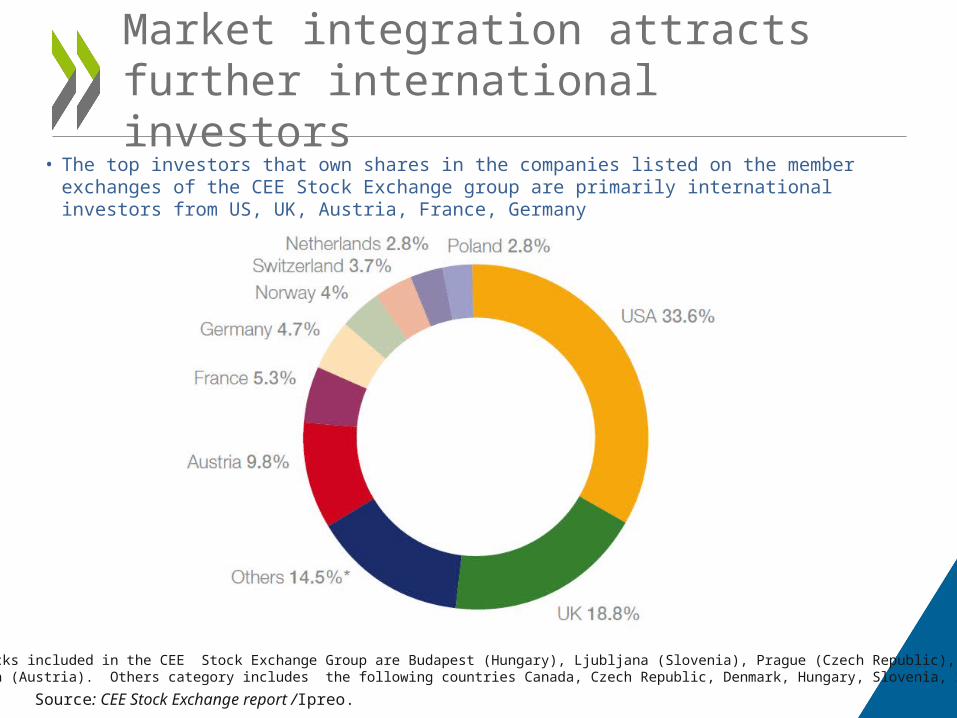
Market integration attracts further international investors
• The top investors that own shares in the companies listed on the member exchanges of the CEE Stock Exchange group are primarily international investors from US, UK, Austria, France, Germany
Source: CEE Stock Exchange report /Ipreo.
Note: Stocks included in the CEE Stock Exchange Group are Budapest (Hungary), Ljubljana (Slovenia), Prague (Czech Republic), and Vienna (Austria). Others category includes the following countries Canada, Czech Republic, Denmark, Hungary, Slovenia, Sweden
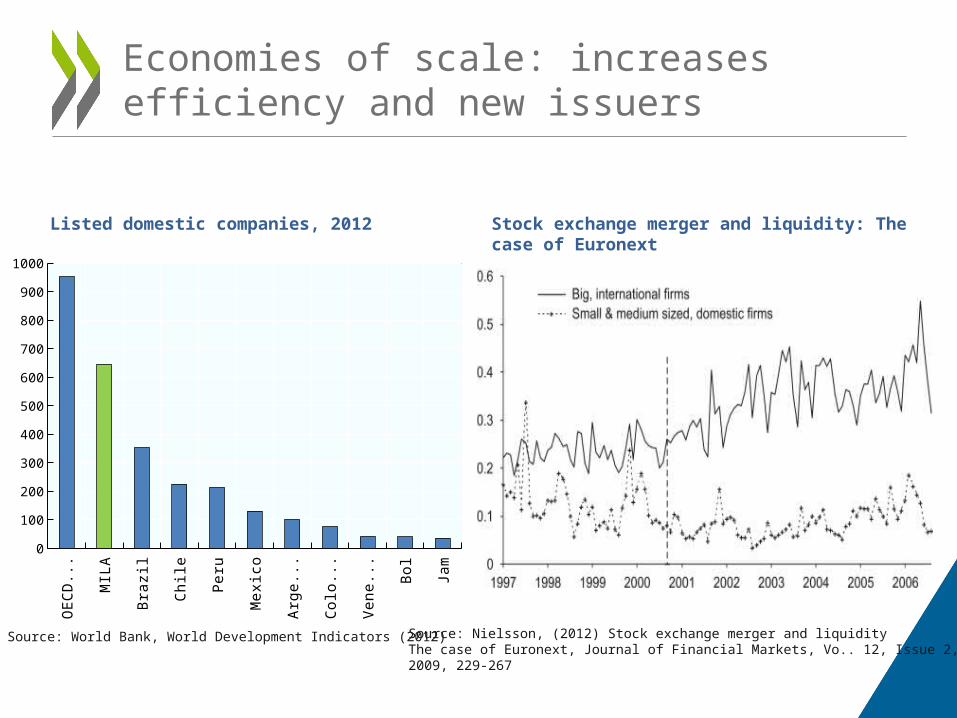
Economies of scale: increases efficiency and new issuers
Listed domestic companies, 2012
Source: World Bank, World Development Indicators (2012)
OEC
D...
MIL
A
Braz
il
Chi
le
Peru
Mex
ico
Arge
ntin
a
Col
ombi
a
Vene
z...
Boliv
ia
Jam
aica
0
100
200
300
400
500
600
700
800
900
1000
Stock exchange merger and liquidity: The case of Euronext
Source: Nielsson, (2012) Stock exchange merger and liquidityThe case of Euronext, Journal of Financial Markets, Vo.. 12, Issue 2, 2009, 229-267
Conclusions
- Pacific Alliance countries have a common challenge: to boost productivity and competitiveness
To tackle the Middle Income Trap.
- A key actor to facilitate improvements in these areas: Capital Markets.
- In particular MILA: to increase the number of listed companies, the liquidity, and to attract new investors.
- A key pillar: credibility of macroeconomic policies.
- OECD supports regional integration in Latam and in particular close work/collaboration with MILA/Pacific Alliance countries: - Chile and Mexico: OECD members- Colombia: Accession Process to join the OECD- Peru: OECD Country Programme

Sebastián Nieto Parra
Development Centre
OECD
October 2015
INTEGRATING SECURITIES MARKETS TO BOOST COMPETITIVENESS
The Latin American Integrated Market – MILA DAY 2015