Embed Size (px)
Citation preview

MATH 1342Section 7.4

Confidence Interval for a Population Mean
If you know population standard deviation (sigma), then use a z‐testIf you do not know population standard deviation, then use a t‐test.


So, what is t*?
t‐distribution is based on sample‐size (it will change shape to become closer to a z‐distribution as sample size increases).

How do we find critical values for a t‐distribution?Look at the online text book, under appendices.
Degrees of freedom are on the left and the top end (1‐confidence level/2) are given at the top.
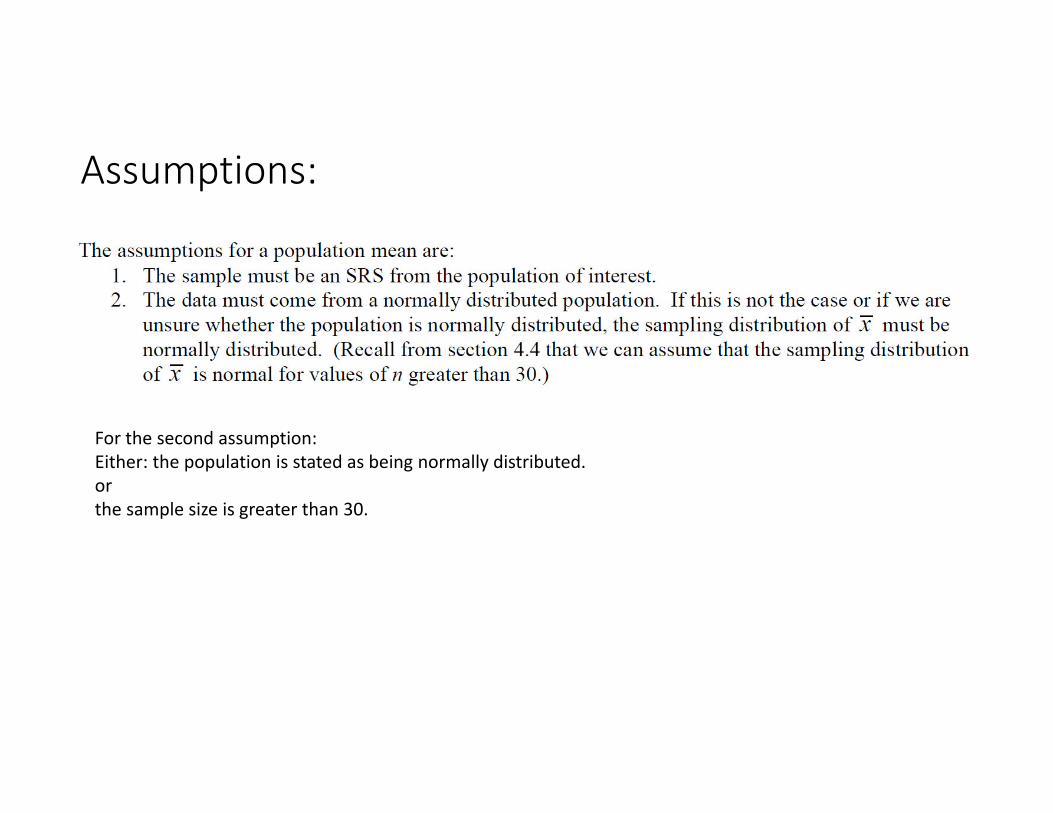
Assumptions:
For the second assumption:Either: the population is stated as being normally distributed.orthe sample size is greater than 30.

Changes is the Confidence Interval:The following will cause an increase in the width of the confidence interval:• An increase in the Margin of Error• An increase in the Standard Deviation (σ or s).• An increase in the Confidence Level.• A decrease in the Sample Size.
Note: Changes in the sample mean (𝑥) will affect the center of the interval but will have no effect on the interval width.

Examples: Look for the first mention of the sample. If standard deviation is given after that, it is sample standard deviation (use t‐test). If standard deviation is given before that, then it is population standard deviation (use a z‐test).
[0.992, 0.997]We are 90% confident that the population mean is between 0.992 and 0.998 oz.If we repeat this process several times, 90% of intervals will contain the population mean

Popper 25You select a sample of 50 people with a mean height of 72 inches from a population that has a standard deviation of 3 inches.
1. What would the margin of error be for a 95% confidence interval?a. 0.698 b. 0.832 c. 16.748 d. 1.644
2. What is the width of confidence interval?a. 1.396 b. 0.349 c. 1.66 d. 0.415
3. What is the confidence interval?a. [71.17, 72.83] b. [69.43, 75.11] c. [72.41, 75.21] d. [47.31, 53.65]

Popper 25 Continued:4. Give an interpretation of this interval:a. A randomly selected person from the population has a 95% chance being
within the interval.b. There is a 95% chance that the population mean will fall within the
interval.c. If numerous similar samples are selected, 95% of them will contain the
population mean.d. All of these choicese. 2 of the choices a, b or c.5. What will cause the width of the confidence interval to increase?a. decrease n b. decrease confidence level
c. decrease standard deviation d. increase the mean

Examples: Population standard deviation was NOT given. Sample standard deviation was used. This means we must use a t‐test to find the confidence interval.

t‐score table:

t‐score table:
Since n = 16, we are going to use the value for n – 1 = 15 degrees of freedom.
Since we want a confidence level of 90%, we will use an “Upper Tail Probability” of (1 – 0.90)/2 = 0.05.
This is to account for only using one tail end of our graph, rather than 2.
Our t* value will be 1.7531.
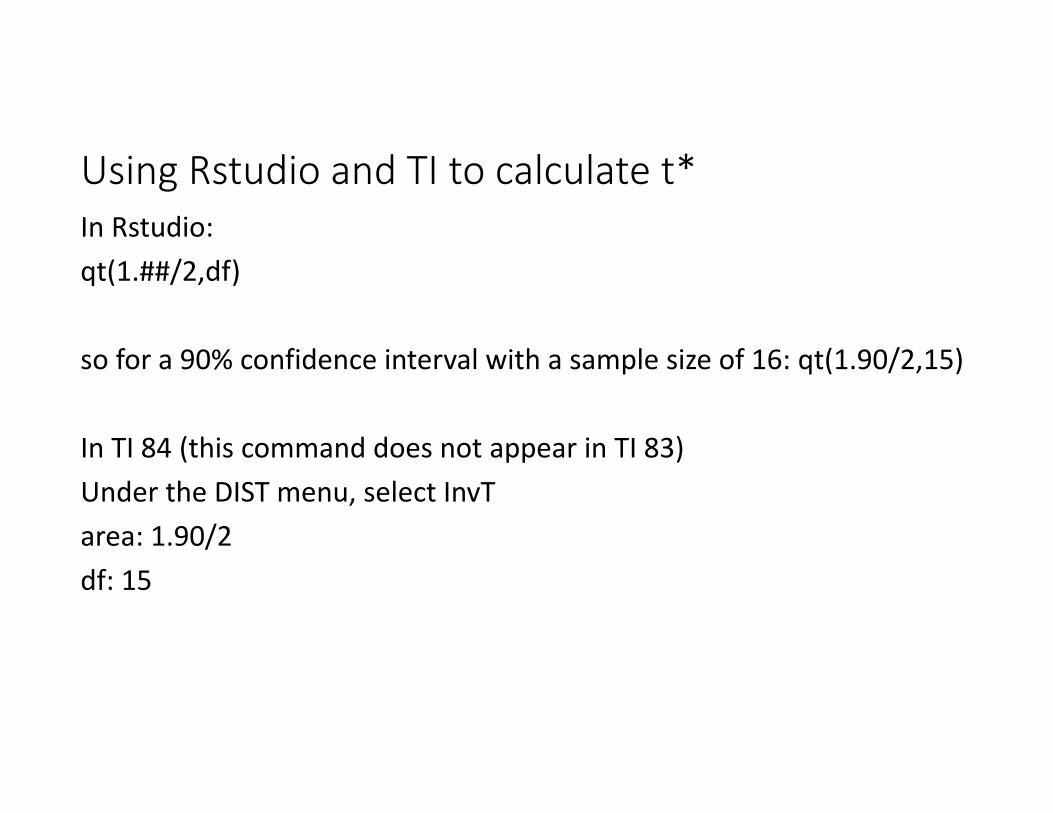
Using Rstudio and TI to calculate t*In Rstudio:qt(1.##/2,df)
so for a 90% confidence interval with a sample size of 16: qt(1.90/2,15)
In TI 84 (this command does not appear in TI 83)Under the DIST menu, select InvTarea: 1.90/2df: 15

Confidence Interval Calculation:
[456.17, 543.82]We are 90% confident that the mean SAT scores of students in HISD are between 456 and 544.

Look at the following example:The effect of exercise on the amount of lactic acid in the blood was examined in an article for an exercise and sport magazine. Eight males were selected at random from those attending a week‐long training camp. Blood lactate levels were measured before and after playing three games of racquetball, as shown in the accompanying table. Use this data to estimate the mean increase in blood lactate level using a 95% confidence interval.

Values to cut and paste:assign(“before”,c(13,20,17,13,13,16,15,16))assign(“after”,c(18,37,40,35,30,20,33,19))

Interpretation of the Confidence Interval:
[6.703, 20.547]We are 95% confident that the increase in blood lactate levels after exercise will be between 6.7 and 20.5.

Example:A 95% confidence interval for the mean of a population is to be constructed and must be accurate to within 0.3 unit. A preliminary sample standard deviation is 2.9. Find the smallest sample size n that provides the desired accuracy.
Note: anytime you are trying to find n, you must use a z‐test.

When to use z* or t*?Use z* if:the question involved proportionsyou are given standard deviation of the population (σ).you are asked to find sample size.
Use t* if:you are not provided with standard deviation of population.
(you may be given standard deviation of your sampleor given data to calculate standard deviation.)
z* test is the preferred method. If you have an option, use z*
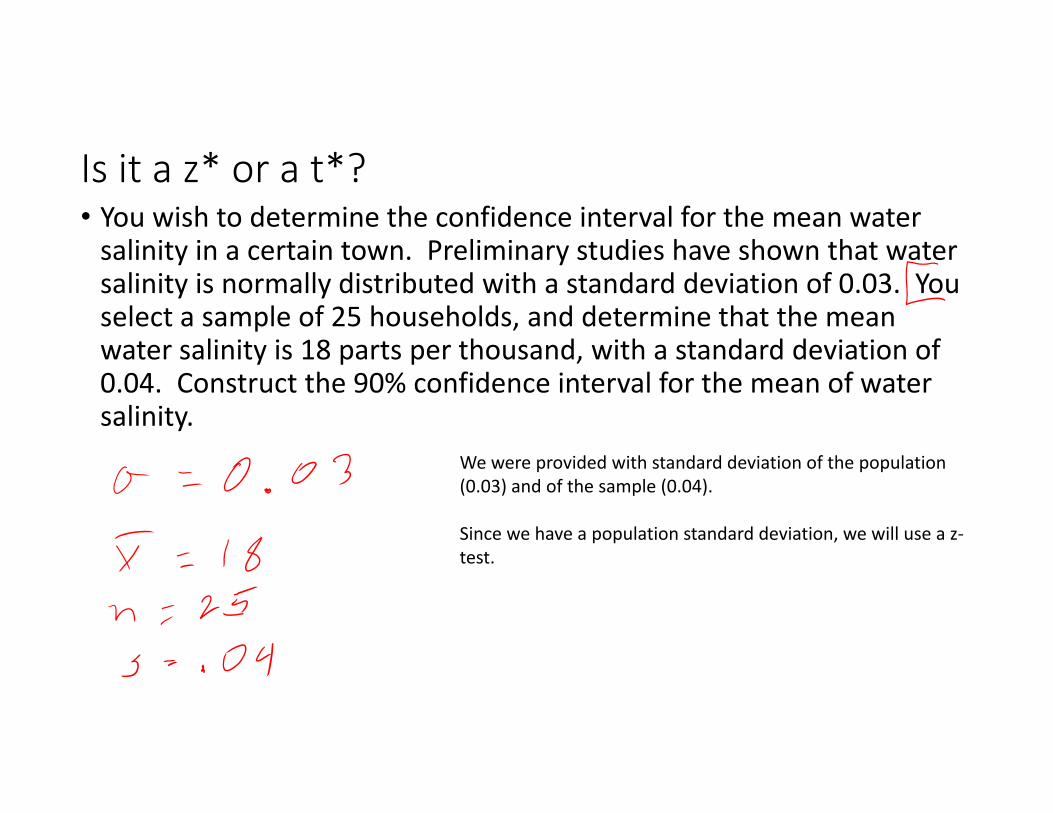
Is it a z* or a t*?• You wish to determine the confidence interval for the mean water salinity in a certain town. Preliminary studies have shown that water salinity is normally distributed with a standard deviation of 0.03. You select a sample of 25 households, and determine that the mean water salinity is 18 parts per thousand, with a standard deviation of 0.04. Construct the 90% confidence interval for the mean of water salinity.
We were provided with standard deviation of the population (0.03) and of the sample (0.04).
Since we have a population standard deviation, we will use a z‐test.

Is it z* or t*?• In a sample of 50 examinees, you have determined the mean score to be 87 with a standard deviation of 2. Determine the 95% confidence interval for the mean score of the population.
We are provided with a sample standard deviation (not a population standard deviation). We will use a t‐test (with 49 degrees of freedom)

Is it t* or z*?• You are designing a study to determine the interaction between sugar intake and insomnia. To do this, you wish to construct a sample of subjects that will have large amounts of sugar prior to bed and measure the duration of their sleep. Preliminary studies show that this will have a standard deviation of 0.5 hours. What size interval must be used to have a margin of error of no more than 1 hour?
We are looking for a sample size. We must use a z‐test regardless of the information provided.

Popper 25:A group of 10 students are comparing exam scores for a test they recently took. Based on these results, you want to find out, with 90% confidence, what range of grades you can expect to receive.Exam Scores: 70, 75, 80, 87, 90, 90, 93, 94, 96, 1006. What is the sample mean?
a. 90 b. 87.5 c. 80 d. 91.67. What is the sample standard deviation?
a. 9.62 b. 92.5 c. 5.65 d. 13.838. What is the t* value that can be used here?
a. 1.3722 b. 1.3968 c. 1.8331 d. 1.6449 9. What is the margin of error?
a. 5.58 b. 5.00 c. 4.03 d. 6.1210. What is the confidence interval?
a. [70,100] b. [87.5, 100] c. [85.67, 89.33] d. [81.92, 93.08]