Embed Size (px)
Citation preview

AAttaAttacmmm
Second evaluation of the voluntary labelling initiative to place pregnancy health warnings on alcohol products
Appendices
31 May 2017
Contents
Appendix 1: Stakeholders who consented to have their name and/or organisation name published in this report as a stakeholder that was consulted as part of the evaluation 3 Appendix 2: Outlet study 6
2.1 Methods 6 2.1.1 Study design and sample selection 6
2.2 Detailed description of the outlet study sampling procedure 11 2.2.1 Aim one 11 2.2.2 Aim two 11 2.2.3 Pregnancy warning label legibility and prominence 12
Appendix 3: An estimated cost to industry of placing pregnancy health warning labels on alcohol products 13
3.1 Average cost estimates 14 3.2 Estimating the total cost to industry 16
Appendix 4: Consumer awareness online survey detailed methods and data analyses 17 4.1 Data collection methodology 17 4.2 Online survey design 19 4.3 Data analyses 19 4.4 Detailed analyses of the results 21
Appendix 5: Key informant interviews 77 5.1 Summary of key themes from stakeholders consulted: 77 5.2 Detailed data analysis 81
Appendix 6: Updated literature and document review 89 6.1 Purpose of the literature and document review 89
6.1.1 Method 89 6.2 Drinking patterns of pregnant women in Australia 89 6.3 Exposure to alcohol during pregnancy 92 6.4 Awareness and knowledge of the risks associated with drinking alcohol while pregnant 93 6.5 Effective reduction of risks to the unborn child arising from drinking alcohol during pregnancy 94 6.6 Increasing consumer knowledge about the risks associated with alcohol consumption 96 6.7 Implementation of the pregnancy labelling voluntary initiative 97
6.7.1 Activities implemented in parallel with the pregnancy labelling voluntary initiative 99 6.8 National and international context of pregnancy warnings 103
6.8.1 Health warning labels on alcohol products 103 6.8.2 Types of consumer information 104 6.8.3 Rationales for health warning labelling of alcohol products 104
6.9 Should this labelling be voluntary or mandatory? 105 6.10 Visibility and legibility issues of pregnancy health warning labels 107 6.11 Reviews of evidence of the effectiveness of health warning labelling of alcohol products 108 6.12 The effectiveness of pregnancy health warning labels on alcohol products 110
Bibliography 133
Alcohol and Pregnancy Labelling Evaluation - Appendices 2
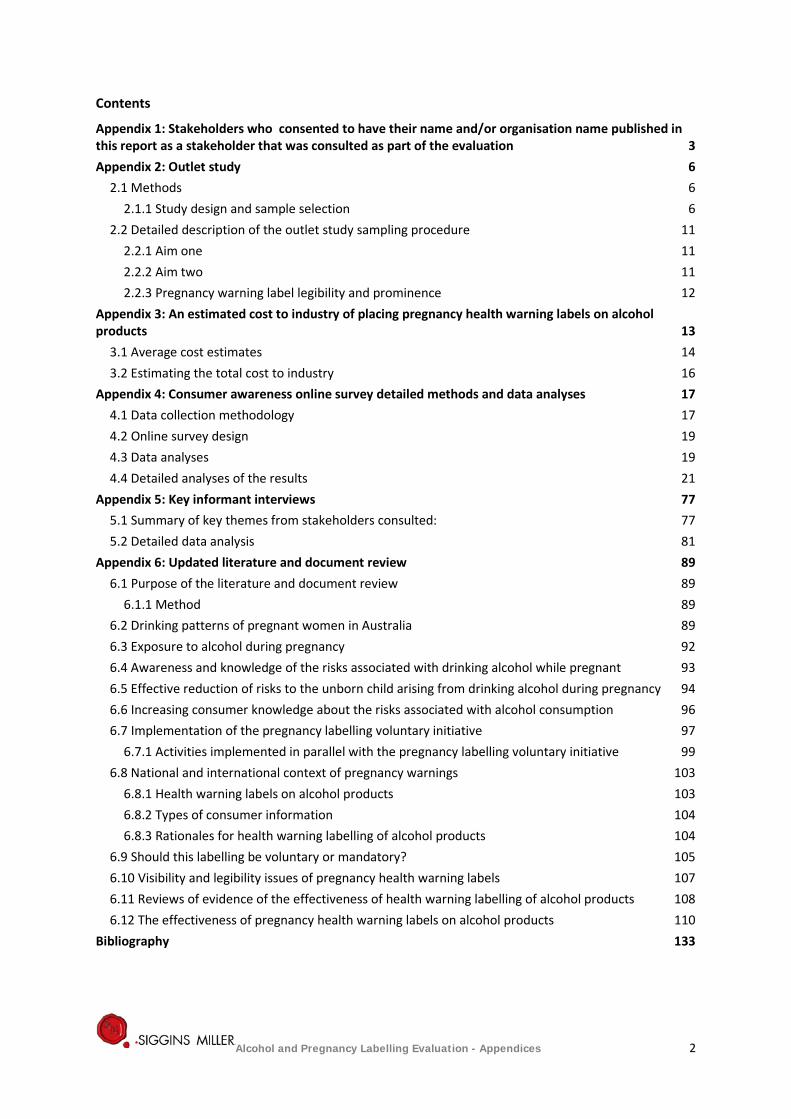
Appendix 1: Stakeholders who consented to have their name and/or organisation name published in this report as a stakeholder that was consulted as part of the evaluation Name Position/s Unit /branch, organisation
Government stakeholders
Catrina McStay Senior Scientific Officer – Policy Drug Strategy Branch (Reference Group Chair) Simone Cormack State Director, Drug and Alcohol Services Healthy Living and Food Policy Branch (Reference Group Member)
Marina Bowshall Deputy State Director, Drug and Alcohol Services SA Centre for Population Health, NSW Ministry of Health (Reference Group Member)
Roxanne Portolesi Senior Food Safety Science Officer Victorian Department of Health Human Services and Economic Development, Jobs, Transport and Resources
Sylvia Engles Policy Development, Mental Health, Alcohol and Drug Directorate
Department of Health and Human Services Tasmania
Laura McNeill Manager, Partnership Development, Public Health Services
ACT Health
Daniel Madeddu Director, Alcohol & Other Drugs Branch NSW Health
Industry stakeholders
Kim Bateman Compliance Officer Accolade Wines
Jonathan Breach Risk and Quality Accolade Wines
Daniel Baker Corporate Buying AUS - Quality Assurance and Corporate Responsibility
ALDI
Jason Bowyer Buying Director - Wine and Sparkling Wine ALDI
Paul Handley Buying Director - Beers, Sprits and RTDs ALDI
Terry Mott CEO Australian Liquor Stores Association
Denis Brown Managing Director Bacardi Martini
John Rosair Oceania Managing Director Beam Suntory Pty Ltd.
Rob Frederick VP, Director of Corporate Responsibility Brown Forman
Tim Wallwork VP, Director of Corporate Affairs & Assistant General Counsel
Brown Forman
Alcohol and Pregnancy Labelling Evaluation - Appendices 3

Name Position/s Unit /branch, organisation
Not provided Not provided Not provided Carlton and United Breweries
Nicki Drinkwater Industry Associations & PR Manager, Alcohol & Coffee Coca-Cola Amatil
Laura Altarac Compliance Manager, Risk and Regulatory Compliance Coles
Varinder Kaur Licensing Officer, Risk and Regulatory Compliance Coles
Heshika Taylor Licensing & Regulatory Affairs Manager Coles
Not provided Not provided Not provided Coopers Brewery
Chris McNamara CEO Craft Beer Industry Association
Not provided Not provided Not provided De Bortoli Wines Pty Ltd
Kylie McPherson Legal Diageo
Vanessa Percy Corporate Social Responsibility Manager Diageo
Alec Wagstaff Executive Director Distilled Spirits Industry Council of Australia
Tess McLachlan Research Manager DrinkWise Australia
John Scott CEO DrinkWise Australia
Simon Strahan Marketing Director DrinkWise Australia
Michael Callaway Head of Commercialisation and Quality Endeavour Drinks Group
Andrew Wilsmore Head of Reputation and Risk Endeavour Drinks Group
Rob Glass Not provided Firetail Wines
Matt Fawcett Not provided Gapstead
Lyn Sykes Not provided Hainault Vineyard and Winery
Leela Gantman External Relations Director Lion Beers Australia
David Lowe Not provided Lowe Wines
Andrew McLaren Managing Director Moet Hennessy
Bruce McMullen Insights Director Moet Hennessy
Jonathan Chew Public Affairs Manager Pernod Ricard Winemakers Australia
Not provided Not provided Not provided Providence Vineyards
James Gannaway Production Manager Rathbone Wine Group
Alcohol and Pregnancy Labelling Evaluation - Appendices 4
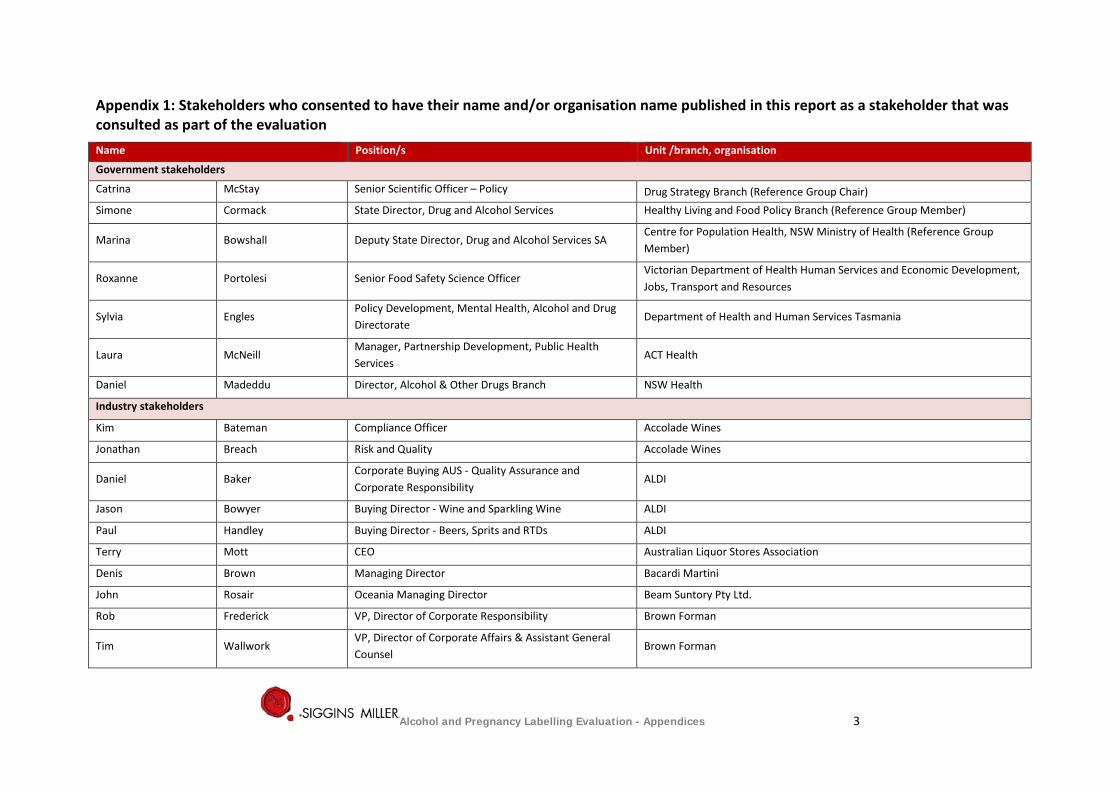
Name Position/s Unit /branch, organisation
Bruce Redman Not provided Redman Wines
Not provided Not provided Not provided Silos Estate & Wileys Creek
Not provided Not provided Not provided Tahbilk Group
John Ellis Not provided The Hanging Rock Winery Pty Ltd
Cecelia Burgman Public Affairs & Corporate Social Responsibility Manager Treasury Wine Estates
Danielle Matthews Not provided William Grant & Sons
Nicola Cosgrove Manager, Government Relations Winemakers Federation of Australia
Public health stakeholders
Louise Gray Executive Director National Organisation on Fetal Alcohol Syndrome (NOFASD)
Devin Bowles Executive Director National Alliance for Action on Alcohol
Sarah Ward Senior Policy Officer Foundation for Alcohol Research and Education
Amy Ferguson Senior Policy Officer Foundation for Alcohol Research and Education
Nyanda McBride Research Fellow National Drugs Research Institute
Anthony Shakeshaft Professor National Drug and Alcohol Research Centre (NDARC)
Alcohol and Pregnancy Labelling Evaluation - Appendices 5
Appendix 2: Outlet study
This study was designed to measure the extent to which alcohol products and containers carry a pregnancy health warning label and/or a pictogram. In line with the methodology in the agreed Evaluation Framework, the specific aims of this study are:
1. To identify the proportion of market-leading alcohol products consumed in Australia that have a pregnancy health warning label and/or a pictogram.
2. To identify the proportion of alcohol products for sale in alcohol outlets in Australia that have a pregnancy health warning label and/or a pictogram, and to identify:
a. if that proportion differs by product type (e.g. beer vs wine vs spirits)
b. if that proportion differs by state/territory
c. the extent to which warning labels are consistent with NHMRC guidelines
d. the extent to which warning labels are legible and visible.
2.1 Methods
Definition of an alcohol product available for sale
Packaged-alcohol products available for sale are defined as those stocked on shelves sold through retail outlets and exclude products that are exclusively for sale direct to consumers, such as via wine clubs, cellar door or other distribution networks. (It is assumed that the majority of products sold through these networks are also available for retail sale in alcohol outlets). In 2010, store-based retailing accounted for 98.4% of off-site (i.e. not on licensed premises) alcohol expenditure.1
A product is categorised by alcohol type, brand, variety, package size and type. In the case of wine, the vintage year is also used to differentiate each product. For example, Carlton mid-strength individual 375ml glass bottle is different from Carlton mid-strength six pack of 375ml glass bottles or a 24 case of 375ml glass bottles or an individual Carlton mid-strength 375ml metal can. Similarly, Wolf Blass Yellow label cabernet sauvignon 2015 750ml bottle is considered a different product from Wolf Blass Yellow label cabernet sauvignon 2015 187ml bottle, from Wolf Blass red label cabernet sauvignon 2015 750ml bottle, and again from Wolf Blass Yellow label cabernet sauvignon 2014 750ml bottle.
2.1.1 Study design and sample selection
Identification of market leading products (Aim One)
Market leading products were restricted to eight categories (Beer, Cider, White and Red Wine above and below $20, Spirits, and Ready to Drink (RTDs)) because these broadly comprise 100% of the available alcohol products in Australia. Within each of these categories, the brands that broadly constitute 75% of the market share by volume were identified using data provided by IRI.2
Identification of products for sale in alcohol outlets (Aim Two)
A cluster, block-randomised, stratified sampling procedure was used. First, product categories were further divided into 12 categories, as detailed below:
Wine was separated by both product and price characteristics. First, wine was separated into either red or white wine, reflecting a primary characteristic of wine. Here, red wine includes fortified wines, where champagne, sparkling wine and dessert wines were included as white
1 Euromonitor International (2011) Wine-Australia in Country Sector Briefing April 2011. Euromonitor International: Australia 2 Excerpts provided by industry with permission for use in this study
Alcohol and Pregnancy Labelling Evaluation - Appendices 6
wine.3 Secondly, wine was divided by products with a retail price of more or less than $20. This reflects a natural market segmentation as well as potential differences in product manufacturing cost structures and target consumers: that is, production runs for lower priced wine may be larger than for higher priced wine which in turn may influence the decision to carry a label. Additionally, higher priced wine may target a more affluent consumer who may have alternative preferences regarding health warnings. Beer was divided into four categories: international beers, Australian craft or premium beer, full strength domestic beer and mid or light strength domestic beer. International beers were separated from national beers because it is possible that suppliers of domestic brand products may be more willing to adopt Australian specific labelling initiatives than international branded products. National brand beers are separated into craft/premium, full strength or low/mid strength beers due to potential differences in target audience and production costs. Craft/premium beers are potentially more likely to target more affluent consumers whereas low/mid strength beers are potentially more likely to target more health conscious consumers. Spirits were divided into white (clear) and dark spirits to reflect a natural product separation and the possibility that target audiences may differ across white and dark spirit consumers. It is hypothesised that white spirits are drunk more frequently by young females than dark spirits. Clear spirits include: rum, vodka, tequila, gin, schnapps, ouzo, sake and absinthe. Alternatively dark spirits include: whisky, liqueurs, brandy, cognac and aperitifs. Ready to drink (RTD) or alcopops are products that contain a portion of alcohol (typically spirits) and a non-alcoholic beverage within the same container.
Cider includes both apple, pear and other fruit ciders. Second, the total number of products available within each group was estimated from the number of active SKUs provided by IRI.
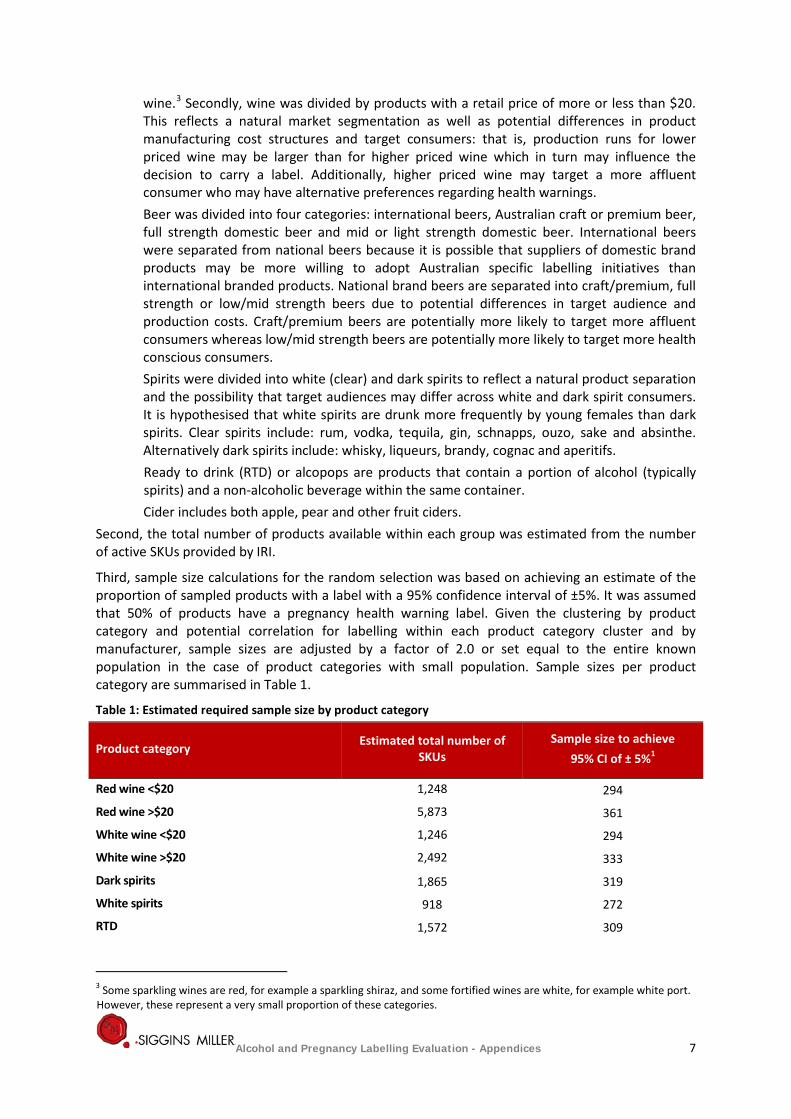
Third, sample size calculations for the random selection was based on achieving an estimate of the proportion of sampled products with a label with a 95% confidence interval of ±5%. It was assumed that 50% of products have a pregnancy health warning label. Given the clustering by product category and potential correlation for labelling within each product category cluster and by manufacturer, sample sizes are adjusted by a factor of 2.0 or set equal to the entire known population in the case of product categories with small population. Sample sizes per product category are summarised in Table 1.
Table 1: Estimated required sample size by product category
Product category Estimated total number of SKUs
Sample size to achieve 95% CI of ± 5%1
Red wine <$20 1,248 294
Red wine >$20 5,873 361
White wine <$20 1,246 294
White wine >$20 2,492 333
Dark spirits 1,865 319
White spirits 918 272
RTD 1,572 309
3 Some sparkling wines are red, for example a sparkling shiraz, and some fortified wines are white, for example white port. However, these represent a very small proportion of these categories.
Alcohol and Pregnancy Labelling Evaluation - Appendices 7
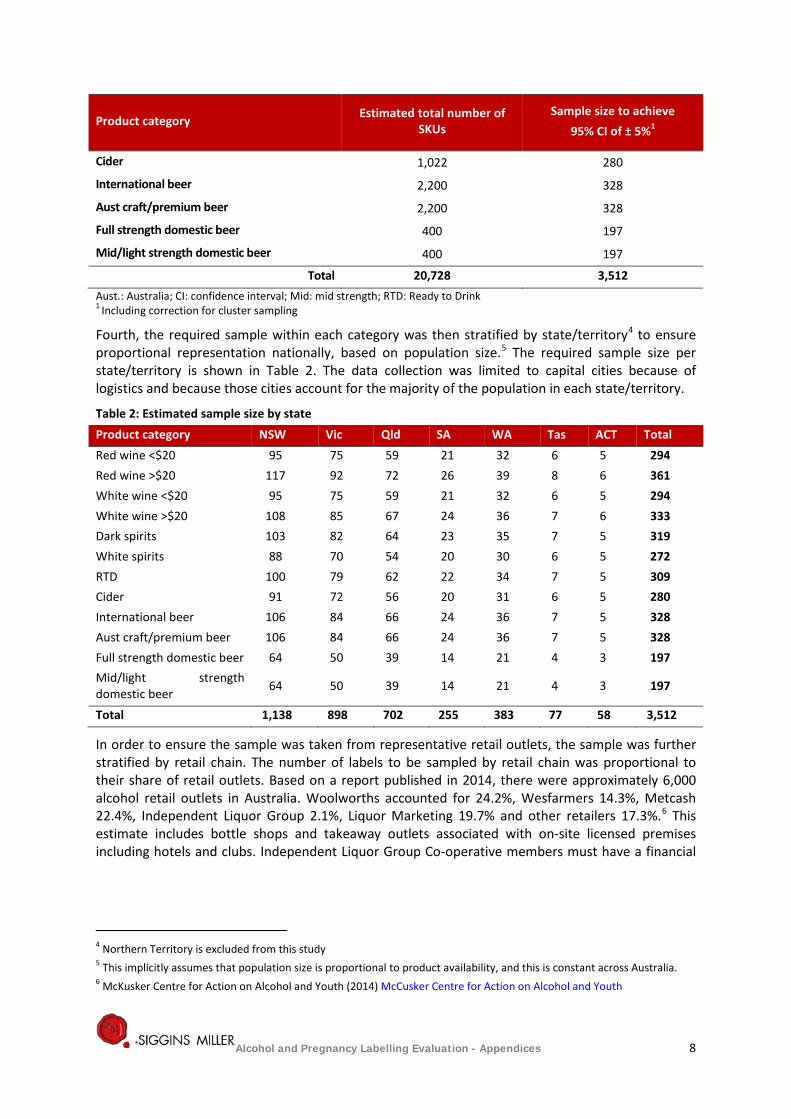
Product category Estimated total number of SKUs
Sample size to achieve 95% CI of ± 5%1
Cider 1,022 280
International beer 2,200 328
Aust craft/premium beer 2,200 328
Full strength domestic beer 400 197
Mid/light strength domestic beer 400 197
Total 20,728 3,512 Aust.: Australia; CI: confidence interval; Mid: mid strength; RTD: Ready to Drink 1 Including correction for cluster sampling
Fourth, the required sample within each category was then stratified by state/territory4 to ensure proportional representation nationally, based on population size.5 The required sample size per state/territory is shown in Table 2. The data collection was limited to capital cities because of logistics and because those cities account for the majority of the population in each state/territory.
Table 2: Estimated sample size by state Product category NSW Vic Qld SA WA Tas ACT Total Red wine <$20 95 75 59 21 32 6 5 294 Red wine >$20 117 92 72 26 39 8 6 361 White wine <$20 95 75 59 21 32 6 5 294 White wine >$20 108 85 67 24 36 7 6 333 Dark spirits 103 82 64 23 35 7 5 319 White spirits 88 70 54 20 30 6 5 272 RTD 100 79 62 22 34 7 5 309 Cider 91 72 56 20 31 6 5 280 International beer 106 84 66 24 36 7 5 328 Aust craft/premium beer 106 84 66 24 36 7 5 328 Full strength domestic beer 64 50 39 14 21 4 3 197 Mid/light strength domestic beer 64 50 39 14 21 4 3 197
Total 1,138 898 702 255 383 77 58 3,512
In order to ensure the sample was taken from representative retail outlets, the sample was further stratified by retail chain. The number of labels to be sampled by retail chain was proportional to their share of retail outlets. Based on a report published in 2014, there were approximately 6,000 alcohol retail outlets in Australia. Woolworths accounted for 24.2%, Wesfarmers 14.3%, Metcash 22.4%, Independent Liquor Group 2.1%, Liquor Marketing 19.7% and other retailers 17.3%.6 This estimate includes bottle shops and takeaway outlets associated with on-site licensed premises including hotels and clubs. Independent Liquor Group Co-operative members must have a financial
4 Northern Territory is excluded from this study 5 This implicitly assumes that population size is proportional to product availability, and this is constant across Australia. 6 McKusker Centre for Action on Alcohol and Youth (2014) McCusker Centre for Action on Alcohol and Youth
Alcohol and Pregnancy Labelling Evaluation - Appendices 8
share in a NSW liquor licence. As such, Independent Liquor Group outlets were assumed to exist only in NSW.7
Outlet selection
To ensure representation across different suburbs or areas within each major capital city, outlets sampled were further stratified by districts of each of the larger cities, Sydney, Melbourne, Brisbane, Adelaide and Perth (generally north, south, east and west districts). Outlets were randomly sampled across the entire cities of Canberra and Hobart.
Data collection (sampling) procedure
For both studies, the same lead research officers visited the selected bottle shops in each capital city in each state/territory. The same lead researchers were used to optimise standardisation in the data collection process and maximise inter-rater reliability.
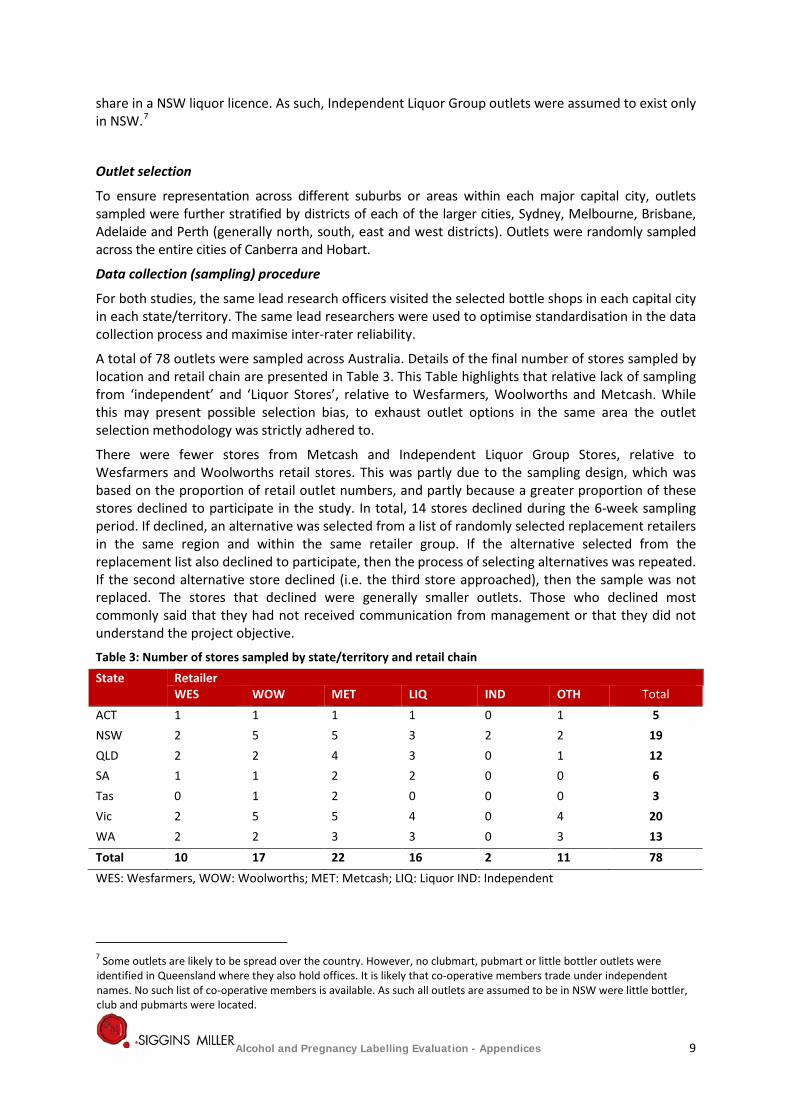
A total of 78 outlets were sampled across Australia. Details of the final number of stores sampled by location and retail chain are presented in Table 3. This Table highlights that relative lack of sampling from ‘independent’ and ‘Liquor Stores’, relative to Wesfarmers, Woolworths and Metcash. While this may present possible selection bias, to exhaust outlet options in the same area the outlet selection methodology was strictly adhered to.
There were fewer stores from Metcash and Independent Liquor Group Stores, relative to Wesfarmers and Woolworths retail stores. This was partly due to the sampling design, which was based on the proportion of retail outlet numbers, and partly because a greater proportion of these stores declined to participate in the study. In total, 14 stores declined during the 6-week sampling period. If declined, an alternative was selected from a list of randomly selected replacement retailers in the same region and within the same retailer group. If the alternative selected from the replacement list also declined to participate, then the process of selecting alternatives was repeated. If the second alternative store declined (i.e. the third store approached), then the sample was not replaced. The stores that declined were generally smaller outlets. Those who declined most commonly said that they had not received communication from management or that they did not understand the project objective.
Table 3: Number of stores sampled by state/territory and retail chain State Retailer
WES WOW MET LIQ IND OTH Total ACT 1 1 1 1 0 1 5 NSW 2 5 5 3 2 2 19 QLD 2 2 4 3 0 1 12 SA 1 1 2 2 0 0 6 Tas 0 1 2 0 0 0 3 Vic 2 5 5 4 0 4 20 WA 2 2 3 3 0 3 13 Total 10 17 22 16 2 11 78 WES: Wesfarmers, WOW: Woolworths; MET: Metcash; LIQ: Liquor IND: Independent
7 Some outlets are likely to be spread over the country. However, no clubmart, pubmart or little bottler outlets were identified in Queensland where they also hold offices. It is likely that co-operative members trade under independent names. No such list of co-operative members is available. As such all outlets are assumed to be in NSW were little bottler, club and pubmarts were located.
Alcohol and Pregnancy Labelling Evaluation - Appendices 9
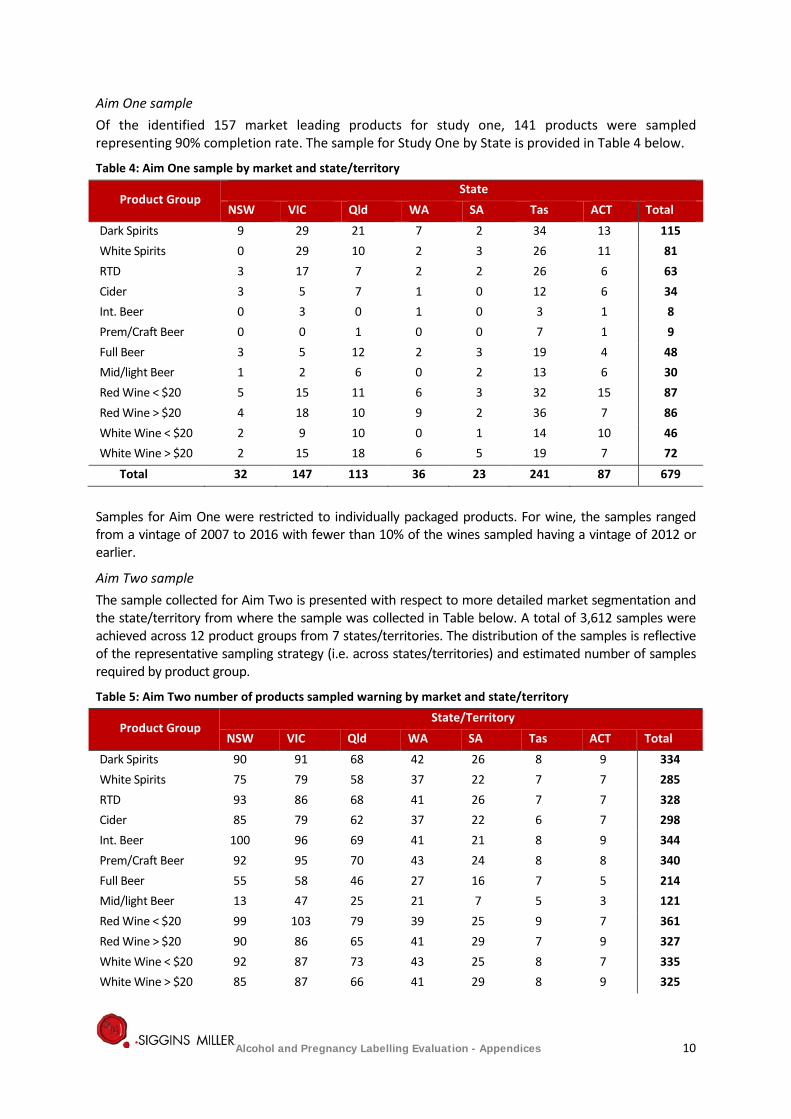
Aim One sample Of the identified 157 market leading products for study one, 141 products were sampled representing 90% completion rate. The sample for Study One by State is provided in Table 4 below.
Table 4: Aim One sample by market and state/territory
Product Group State
NSW VIC Qld WA SA Tas ACT Total Dark Spirits 9 29 21 7 2 34 13 115 White Spirits 0 29 10 2 3 26 11 81 RTD 3 17 7 2 2 26 6 63 Cider 3 5 7 1 0 12 6 34 Int. Beer 0 3 0 1 0 3 1 8 Prem/Craft Beer 0 0 1 0 0 7 1 9 Full Beer 3 5 12 2 3 19 4 48 Mid/light Beer 1 2 6 0 2 13 6 30 Red Wine < $20 5 15 11 6 3 32 15 87 Red Wine > $20 4 18 10 9 2 36 7 86 White Wine < $20 2 9 10 0 1 14 10 46 White Wine > $20 2 15 18 6 5 19 7 72
Total 32 147 113 36 23 241 87 679
Samples for Aim One were restricted to individually packaged products. For wine, the samples ranged from a vintage of 2007 to 2016 with fewer than 10% of the wines sampled having a vintage of 2012 or earlier.
Aim Two sample The sample collected for Aim Two is presented with respect to more detailed market segmentation and the state/territory from where the sample was collected in Table below. A total of 3,612 samples were achieved across 12 product groups from 7 states/territories. The distribution of the samples is reflective of the representative sampling strategy (i.e. across states/territories) and estimated number of samples required by product group.
Table 5: Aim Two number of products sampled warning by market and state/territory
Product Group State/Territory
NSW VIC Qld WA SA Tas ACT Total Dark Spirits 90 91 68 42 26 8 9 334 White Spirits 75 79 58 37 22 7 7 285 RTD 93 86 68 41 26 7 7 328 Cider 85 79 62 37 22 6 7 298 Int. Beer 100 96 69 41 21 8 9 344 Prem/Craft Beer 92 95 70 43 24 8 8 340 Full Beer 55 58 46 27 16 7 5 214 Mid/light Beer 13 47 25 21 7 5 3 121 Red Wine < $20 99 103 79 39 25 9 7 361 Red Wine > $20 90 86 65 41 29 7 9 327 White Wine < $20 92 87 73 43 25 8 7 335 White Wine > $20 85 87 66 41 29 8 9 325
Alcohol and Pregnancy Labelling Evaluation - Appendices 10
Product Group State/Territory
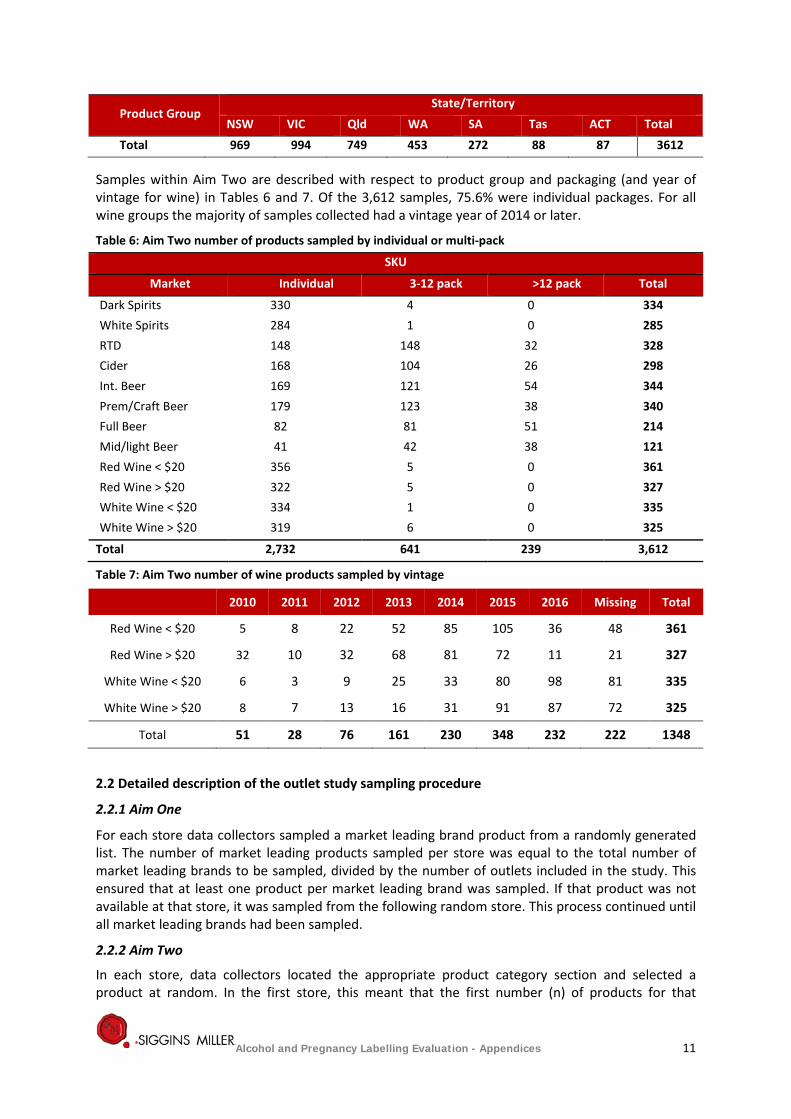
NSW VIC Qld WA SA Tas ACT Total Total 969 994 749 453 272 88 87 3612
Samples within Aim Two are described with respect to product group and packaging (and year of vintage for wine) in Tables 6 and 7. Of the 3,612 samples, 75.6% were individual packages. For all wine groups the majority of samples collected had a vintage year of 2014 or later.
Table 6: Aim Two number of products sampled by individual or multi-pack
SKU
Market Individual 3-12 pack >12 pack Total
Dark Spirits 330 4 0 334 White Spirits 284 1 0 285 RTD 148 148 32 328 Cider 168 104 26 298 Int. Beer 169 121 54 344 Prem/Craft Beer 179 123 38 340 Full Beer 82 81 51 214 Mid/light Beer 41 42 38 121 Red Wine < $20 356 5 0 361 Red Wine > $20 322 5 0 327 White Wine < $20 334 1 0 335 White Wine > $20 319 6 0 325
Total 2,732 641 239 3,612
Table 7: Aim Two number of wine products sampled by vintage
2.2 Detailed description of the outlet study sampling procedure
2.2.1 Aim One
For each store data collectors sampled a market leading brand product from a randomly generated list. The number of market leading products sampled per store was equal to the total number of market leading brands to be sampled, divided by the number of outlets included in the study. This ensured that at least one product per market leading brand was sampled. If that product was not available at that store, it was sampled from the following random store. This process continued until all market leading brands had been sampled.
2.2.2 Aim Two
In each store, data collectors located the appropriate product category section and selected a product at random. In the first store, this meant that the first number (n) of products for that
2010 2011 2012 2013 2014 2015 2016 Missing Total
Red Wine < $20 5 8 22 52 85 105 36 48 361
Red Wine > $20 32 10 32 68 81 72 11 21 327
White Wine < $20 6 3 9 25 33 80 98 81 335
White Wine > $20 8 7 13 16 31 91 87 72 325
Total 51 28 76 161 230 348 232 222 1348
Alcohol and Pregnancy Labelling Evaluation - Appendices 11
category was selected and checked until the quota for that product category for that store was reached. In the next store, the same process occurred, unless that product had already been checked, in which case it was not re-examined but the adjacent product was checked instead. Data were entered electronically to facilitate easy verification that each sample was a unique product.
Pregnancy health warnings were checked to consider if the warning was a picture, text or a combination of the two. If it was text, then the wording was assessed for consistency with the 2009 NHMRC Australian guidelines regarding alcohol consumption during pregnancy, in order to address Aim Two. Where uncertainty with respect to consistency arose, a photograph of the label was taken for further verification.
Legibility and prominence data were collected to answer Aim Two Question d. Both were recorded with respect to the legibility requirements for food labels in Standard 1.2.9 Food Standards Australia New Zealand Code. The user guide to this standard was read by all data collectors. Where a data collector was unsure of a label, it was presented to an alternative data collector for verification. Where uncertainty or inconsistency between investigators arose, a photograph of the label was taken for further verification.
2.2.3 Pregnancy warning label legibility and prominence
Pregnancy warning label legibility and prominence was assessed to the Food Standards Australia New Zealand standard 1.2.9 on Legibility Requirements. Using these guidelines field researchers reviewed and evaluated each pregnancy warning label and provided an assessment of below, average or above average.
Legibility assessment requirements involved researchers evaluating the label’s size, distinction against other stimuli, message complexity, exclusion area/bordering, spacing, font type and text casting (if applicable).
Prominence assessment requirements involved researchers evaluating the label’s size, location and position on packaging or label or labels, the noticeable nature of the text or picture, colour and image contrast, bordering, font differences, spacing and segmenting from other label stimuli.
It should be noted that external factors affecting legibility and prominence of how easily a consumer can read food labels at point of sale were not taken into consideration for this study.
Labels which presented the assessment factors in a suitable manner were evaluated and noted as standard for both legibility and prominence. Those which utilised only some factors or were considered too difficult to distinguish or see amongst the label’s logo, product title text, product description and overall location of the warning on packaging or label were evaluated and noted as below standard. Labels assessed as above standard featured assessment factors but tended to be larger in size, have greater contrast in both colour, font type (if applicable) and be positioned in a more accessible site on the label or package. These factors in turn create a warning which is far more dominant and visible on the label or packaging warranting the above standard evaluation.
Alcohol and Pregnancy Labelling Evaluation - Appendices 12

Appendix 3: An estimated cost to industry of placing pregnancy health warning labels on alcohol products
The online industry survey was piloted by Siggins Miller staff, went live on 13 February 2017, and closed on the 24 March 2017. It was distributed directly to identified key contacts of manufacturing organisations and key representatives of the relevant industry bodies listed in Appendix 1.
Survey completion rates were monitored during the survey period to determine whether small, medium and large producers from all alcohol markets were represented in the survey responses. Peak associations were followed-up in cases where markets were poorly represented.
Compared to the previous evaluation, there were a total of 75 respondents (i.e. answered at least one question) compared to 12.
The majority of respondents to the industry survey of labelling costs were from companies where the main activity was manufacturing (n=69, 92%). As seen in Table 11: below, the other two company types were ‘importer/distributor company’ and ‘industry representative’.
Table 11: Nature of respondent company’s activities Company activities n (75) %
Manufacturer 69 92 Importer/distributor 5 6.67 Industry representative 1 1.33
Product markets
Respondents represented companies from all alcohol markets: beer, cider, wine, spirits and RTD alcohol beverages (see Table 12). The most common market in which respondents’ products were sold was the wine market (n=64, 85.33%), whereas the least represented markets were RTDs (n=7, 9.33%) and cider (n=7, 9.33%). Twelve respondents (16%) had products in more than one market (e.g. beer, cider and spirits), whereas the remaining respondents sold products in only one market.
Table 12: Markets respondent company products sold in Market Number of Respondents % of Respondents* Wine 64 85.33 Spirit 11 14.67 Beer 9 12 Cider 7 9.33 Ready to Drink (RTD) alcoholic beverages 7 9.33 *Percentages are presented as the proportion of all respondents to this question who have product in each market, therefore percentages do not add up to 100
In total, 75 responses to the survey were received which included small, medium and large companies. This is inclusive of both complete and incomplete responses, as several respondents did not provide responses to some questions. Percentages reported are presented as proportions of total respondents who answered each question, as opposed to the total number of respondents who completed the entire survey.
Alcohol and Pregnancy Labelling Evaluation - Appendices 13
Industry participant details Role in company
73 respondents indicated their role in their company. These included:
• CEO • Proprietor • Group supply chain manager • Head of Global Regulatory Affairs • Managing Director South East Asia and pacific • Logistics & Supply Director • Marketing Co-Ordinator • Marketing Manager • Purchasing Packaging and Senior Management • Winemaker and Director • Administration • Business Services Director • Quality Assurance
• Production Manager
• Head of Quality and Regulatory Affairs
• Sustainability Manager
3.1 Average cost estimates
Estimates were provided by forty respondents for the total costs associated with implementing pregnancy health labels across each of the identified cost items. Eight respondents reported an estimate of total costs for any additional cost items (i.e. material write offs and relabelling of imported products). Where a respondent only provided a range of values, the midpoint was calculated as an estimate of the average cost. Zero costs reported by respondents for cost items were incorporated into the average cost calculations for each cost item per labelled SKU. This enabled the zero costs to be represented in the averages and ranges of the cost estimates.
The number of labelled SKUs was estimated by multiplying the proportion of SKUs that had a pregnancy health label by the total number of SKUs. The estimation of the value of the cost items per labelled SKU was calculated by multiplying the value of the cost items by the proportion of labelled SKU. For each respondent, the individual cost items per labelled SKU were summed to give a total cost per labelled SKU. An average of these totals was then calculated to provide an average total cost per labelled SKU ($388.76) and a range ($0.00 - $4,665). See Table 13 below for average cost per packaging type.
The opportunity cost of the package space that a pregnancy health warning occupies as well as the potential benefit from improving a company’s reputation (from including a pregnancy health warning on their products) were identified as potential key indirect costs and benefits. However, the indirect costs and benefits associated with including a pregnancy health warning, whilst potentially not insignificant, were not included in the final estimated cost to industry.
Alcohol and Pregnancy Labelling Evaluation - Appendices 14
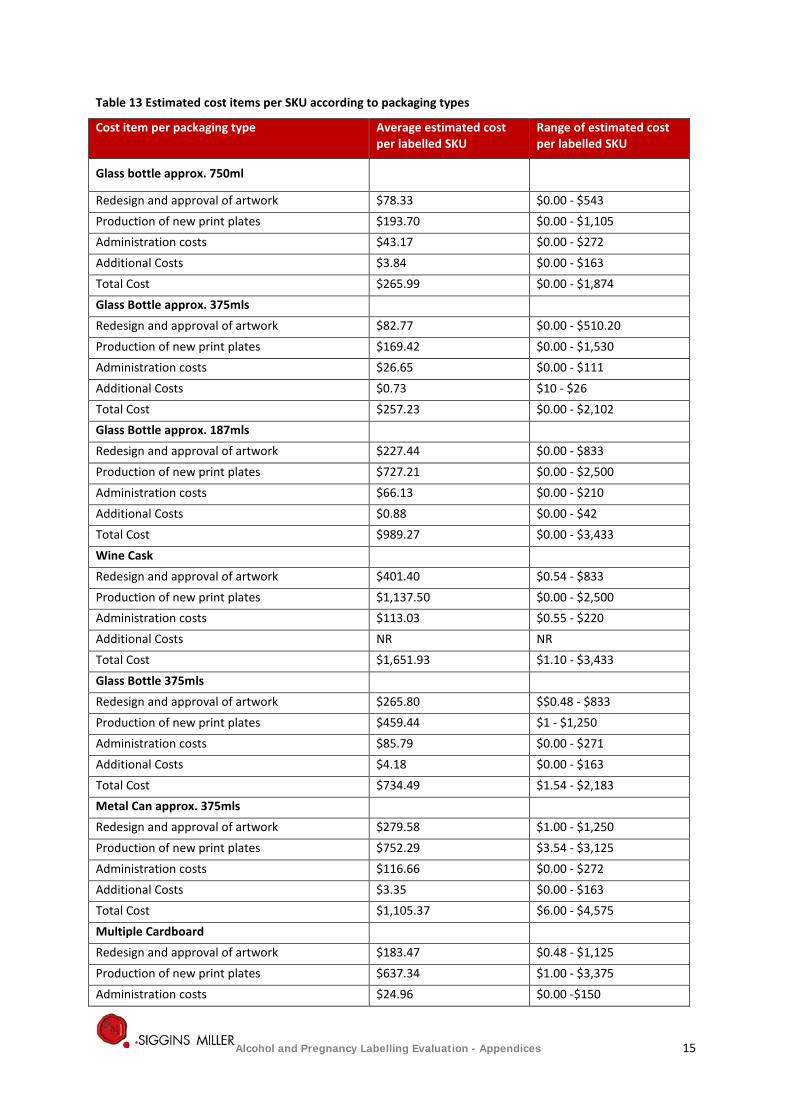
Table 13 Estimated cost items per SKU according to packaging types
Cost item per packaging type Average estimated cost per labelled SKU
Range of estimated cost per labelled SKU
Glass bottle approx. 750ml
Redesign and approval of artwork $78.33 $0.00 - $543 Production of new print plates $193.70 $0.00 - $1,105 Administration costs $43.17 $0.00 - $272 Additional Costs $3.84 $0.00 - $163 Total Cost $265.99 $0.00 - $1,874 Glass Bottle approx. 375mls Redesign and approval of artwork $82.77 $0.00 - $510.20 Production of new print plates $169.42 $0.00 - $1,530 Administration costs $26.65 $0.00 - $111 Additional Costs $0.73 $10 - $26 Total Cost $257.23 $0.00 - $2,102 Glass Bottle approx. 187mls Redesign and approval of artwork $227.44 $0.00 - $833 Production of new print plates $727.21 $0.00 - $2,500 Administration costs $66.13 $0.00 - $210 Additional Costs $0.88 $0.00 - $42 Total Cost $989.27 $0.00 - $3,433 Wine Cask Redesign and approval of artwork $401.40 $0.54 - $833 Production of new print plates $1,137.50 $0.00 - $2,500 Administration costs $113.03 $0.55 - $220 Additional Costs NR NR Total Cost $1,651.93 $1.10 - $3,433 Glass Bottle 375mls Redesign and approval of artwork $265.80 $$0.48 - $833 Production of new print plates $459.44 $1 - $1,250 Administration costs $85.79 $0.00 - $271 Additional Costs $4.18 $0.00 - $163 Total Cost $734.49 $1.54 - $2,183 Metal Can approx. 375mls Redesign and approval of artwork $279.58 $1.00 - $1,250 Production of new print plates $752.29 $3.54 - $3,125 Administration costs $116.66 $0.00 - $272 Additional Costs $3.35 $0.00 - $163 Total Cost $1,105.37 $6.00 - $4,575 Multiple Cardboard Redesign and approval of artwork $183.47 $0.48 - $1,125 Production of new print plates $637.34 $1.00 - $3,375 Administration costs $24.96 $0.00 -$150
Alcohol and Pregnancy Labelling Evaluation - Appendices 15
Cost item per packaging type Average estimated cost per labelled SKU
Range of estimated cost per labelled SKU
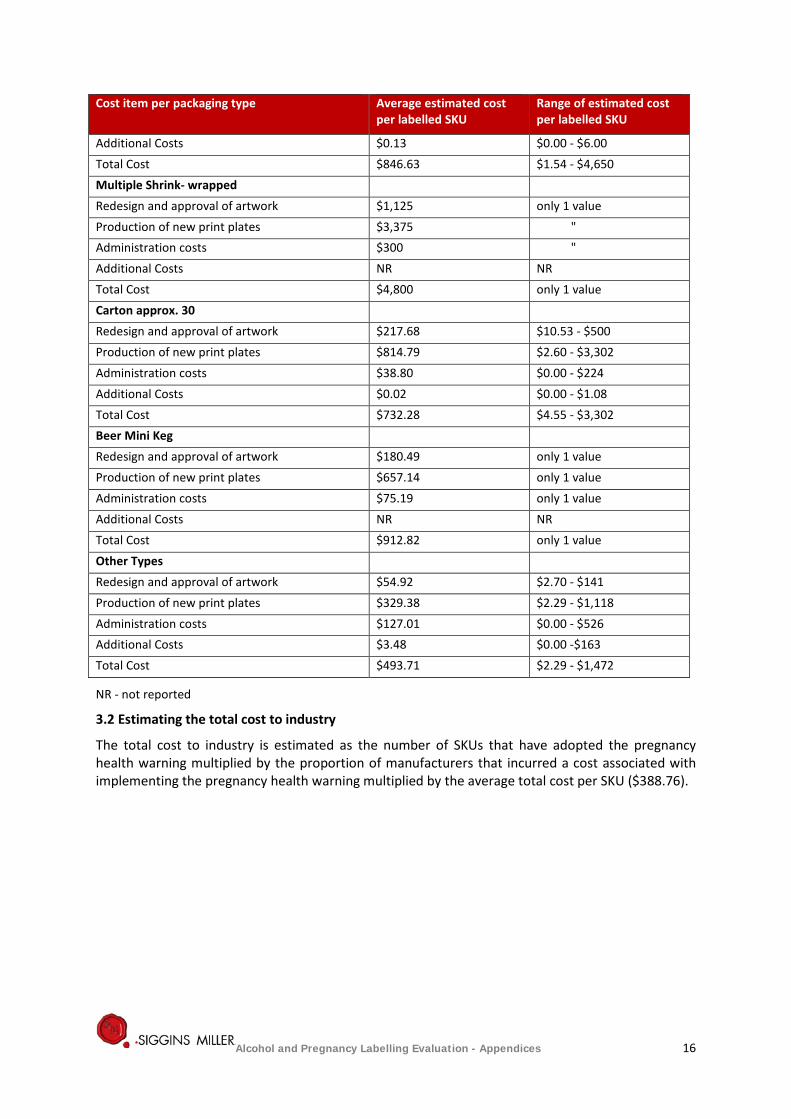
Additional Costs $0.13 $0.00 - $6.00 Total Cost $846.63 $1.54 - $4,650 Multiple Shrink- wrapped Redesign and approval of artwork $1,125 only 1 value Production of new print plates $3,375 " Administration costs $300 " Additional Costs NR NR Total Cost $4,800 only 1 value Carton approx. 30 Redesign and approval of artwork $217.68 $10.53 - $500 Production of new print plates $814.79 $2.60 - $3,302 Administration costs $38.80 $0.00 - $224 Additional Costs $0.02 $0.00 - $1.08 Total Cost $732.28 $4.55 - $3,302 Beer Mini Keg Redesign and approval of artwork $180.49 only 1 value Production of new print plates $657.14 only 1 value Administration costs $75.19 only 1 value Additional Costs NR NR Total Cost $912.82 only 1 value Other Types Redesign and approval of artwork $54.92 $2.70 - $141 Production of new print plates $329.38 $2.29 - $1,118 Administration costs $127.01 $0.00 - $526 Additional Costs $3.48 $0.00 -$163 Total Cost $493.71 $2.29 - $1,472
NR - not reported
3.2 Estimating the total cost to industry
The total cost to industry is estimated as the number of SKUs that have adopted the pregnancy health warning multiplied by the proportion of manufacturers that incurred a cost associated with implementing the pregnancy health warning multiplied by the average total cost per SKU ($388.76).
Alcohol and Pregnancy Labelling Evaluation - Appendices 16
Appendix 4: Consumer awareness online survey detailed methods and data analyses
Consumer awareness online survey The overarching aims of the consumer awareness online survey component of the evaluation are:
1. Examining consumer awareness of the alcohol warnings on labels
2. Understanding of the message and/or pictograms they contain.
Identification and recall of messages and/pictograms is an important element of evaluation. An examination of awareness requires asking respondents if they have seen any pregnancy-related warning labels on alcohol containers. Establishing whether they understand the messages seen involves questions about recall of messages and how they understand them. Attention was given to reaching Aboriginal and Torres Islander communities to minimize any bias resulting from online survey method as far as possible.
The survey was designed mindful of the required scope and therefore did not seek to measure changes in behavioural intentions, attitude change or behaviour change as the evaluation is an implementation evaluation only; and the labels are expected to affect awareness but, in and of themselves, they are not expected to change attitudes or behaviour.
4.1 Data collection methodology
Full ethical clearance for the online survey was provided from Griffith University Human Research Ethics Committee on 3 February 2017 (GU Reference No. 2017/060).
An online approach was selected due to its ability to reach a broad range of respondents quickly and cost effectively. Furthermore, an online methodology minimises response biases, such as social desirability response, that are commonly observed for sensitive topics.
The reach of the survey included: • A whole of community survey to reach people around women • Attention will be given to reaching Aboriginal and Torres Islander people to minimise any
bias resulting from online survey method.
The survey comprised closed questions (e.g. Yes/No responses) and open-ended questions.
Online research panel provider, I-view, was engaged by Siggins Miller to recruit the desired sample and manage the function and delivery of the online consumer awareness survey. I-view provided the target sample size for each of the specific groups and locations in the evaluation framework. In addition, Siggins Miller also developed a targeted online advertising campaign to ensure that any under-representation of the targeted sample populations was supplemented by a broader general and targeted population recruitment drive. The supplementary online advertising campaign ran from 10 February to 24 March 2017, and comprised a combination of banner advertisements and electronic direct marketing campaigns running across the websites of Baby Centre8 and Sky News Australia.9
Before the survey was distributed among online research panel participants and the public by online advertising, the survey was piloted by both Siggins Miller and I-view staff. The consumer survey went live on 10 February 2017 and closed on 24 March 2017.
They were provided with the following sampling framework and target response rates:
Sample size: 3, 600 (600 per target group)
8 Babycentre 9 Skynews
Alcohol and Pregnancy Labelling Evaluation - Appendices 17
Six groups:
1. Pregnant women (18 - 50 years, mean age expected to be 31 years) 2. Women planning to have a child in the next 18 months (18 - 50 years, mean age expected to
be 31 years) 3. Women with a child under 18 months of age (18 - 50 years, mean age expected to be 31
years) 4. Males whose partner is one of the following: currently pregnant, planning to become
pregnant within 18 months or has a child under 18 months of age (18+ years) 5. People with an adult child who is one of the following: currently pregnant, planning to
become pregnant within 18 months or has a child under 18 months of age (18+ years) 6. Adults over 18.
Aged 18 and over with representation from:
• both university educated and non-university educated • low-income earners, mid-income earners and high-income earners • 2.5% indigenous representation nationally.
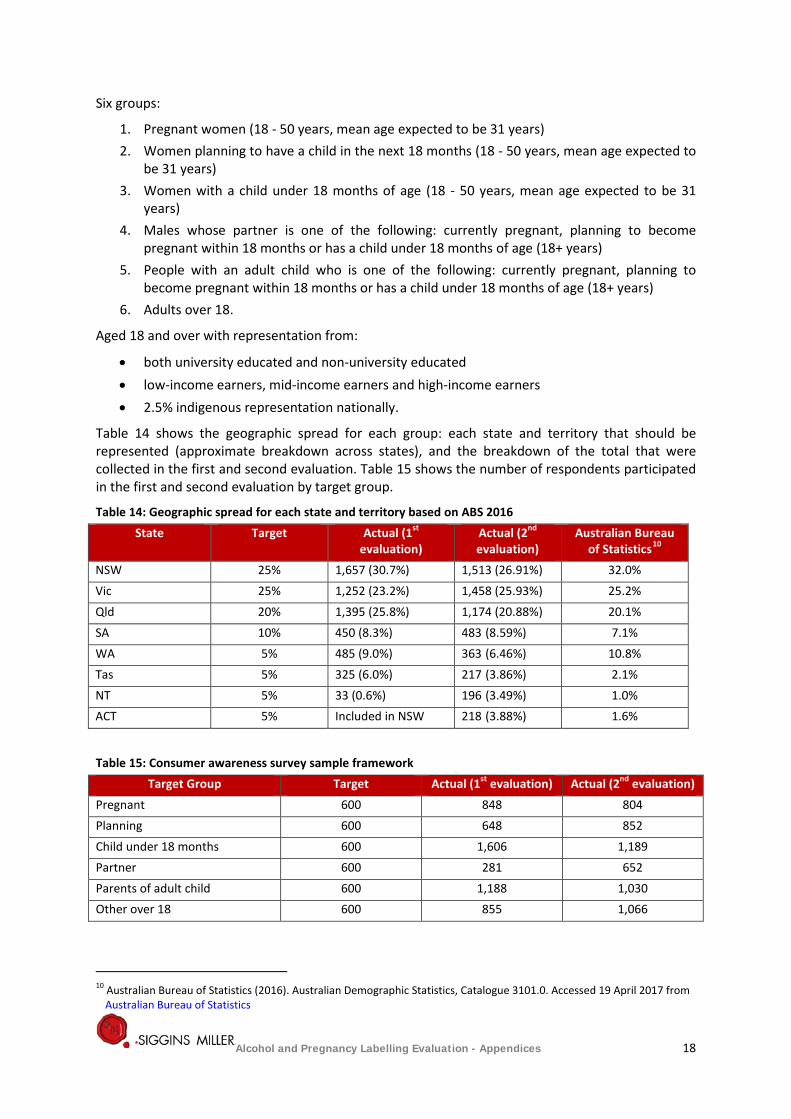
Table 14 shows the geographic spread for each group: each state and territory that should be represented (approximate breakdown across states), and the breakdown of the total that were collected in the first and second evaluation. Table 15 shows the number of respondents participated in the first and second evaluation by target group.
Table 14: Geographic spread for each state and territory based on ABS 2016 State Target Actual (1st
evaluation) Actual (2nd evaluation)
Australian Bureau of Statistics10
NSW 25% 1,657 (30.7%) 1,513 (26.91%) 32.0% Vic 25% 1,252 (23.2%) 1,458 (25.93%) 25.2% Qld 20% 1,395 (25.8%) 1,174 (20.88%) 20.1% SA 10% 450 (8.3%) 483 (8.59%) 7.1% WA 5% 485 (9.0%) 363 (6.46%) 10.8% Tas 5% 325 (6.0%) 217 (3.86%) 2.1% NT 5% 33 (0.6%) 196 (3.49%) 1.0% ACT 5% Included in NSW 218 (3.88%) 1.6%
Table 15: Consumer awareness survey sample framework Target Group Target Actual (1st evaluation) Actual (2nd evaluation)
Pregnant 600 848 804 Planning 600 648 852 Child under 18 months 600 1,606 1,189 Partner 600 281 652 Parents of adult child 600 1,188 1,030 Other over 18 600 855 1,066
10 Australian Bureau of Statistics (2016). Australian Demographic Statistics, Catalogue 3101.0. Accessed 19 April 2017 from Australian Bureau of Statistics
Alcohol and Pregnancy Labelling Evaluation - Appendices 18
4.2 Online survey design
A key aim of this survey is to evaluate unprompted awareness of alcohol warnings on labels. To ensure unprompted awareness is gained, the purpose of the survey cannot be revealed until after exposure to the labels in the online survey.
Any indication the survey is about warning labels prior to exposure in the survey will bias awareness results upwards and a true estimate of unprompted awareness is a necessary component in this methodology to evaluate label awareness.
A statement prior to submission for completion of the survey was made to ensure respondents are comfortable with submitting their responses as follows:
This study is funded by the Department of Health. Your feedback is assisting the Department’s evaluation of the voluntary labelling initiative to place pregnancy warning labels on alcohol products.
Thank you for assisting this research.
The survey submission button was placed after this statement to ensure respondents are fully aware of the purpose of the survey.
Key constructs and measures were:
Key constructs Key demographic items
• Label awareness
• Message understanding
• Gender
• Age • Employment status • Educational attainment • Ethnicity • Postcode • Pregnancy details
• Household size • Number of children
Incentives To achieve a good response rate from the supplementary broader general population recruitment drive for the online survey, we offered participants entry into the draw to win one of 60 of $100 eftpos cards. This is standard in market research. Participant Consent The full participant information sheet was provided to the participants via a link on the first page of the survey. The front page of the survey protocol informed participants that the survey was voluntary and confidential and that they could withdraw at any time without penalty, up until they submitted the survey. It also informed participants that submitting the online questionnaire was accepted as their consent to participate in the project.
All participants had to actively self-select to participate in the research by clicking on the survey link and then by clicking on the submit button at the end of the survey.
4.3 Data analyses
Statistical analyses (independent sample t-tests and hierarchical logistic regressions) were conducted to determine whether the observed difference in responses between the first and second evaluation on the variables of interest (unprompted awareness, and prompted awareness of the pictogram and the text label) reached levels of statistical significance. Statistical analyses were undertaken based on
Alcohol and Pregnancy Labelling Evaluation - Appendices 19
the total sample and by groups. When conducting logistic regression, the variable used in the analyses as control were:
• Age (years) • Gender (0=male; 1 = female) • Target groups (1 = Pregnant women; 2 = Women planning to be pregnant; 3= Mothers of
child under 18 months; 4 = Pregnant partner; 5= Partner planning to be pregnant; 6 = Dad to a child under 18 months; 7 = Adult child (or their partner) is pregnant; 8 = Adult child (or their partner is planning to become pregnant); 9 = My adult child has a child under 18 months of age)
• Income level (1= Less than $10 000 2= $10 000 - less than $20 000; 3= $20 000 - less than $40 000; 4= $40 000 - less than $60 000; 5 = $60 000 - less than $80 000; 6 = $80 000 - less than $100 000; 7 = $100 000 - less than $120 000; 8 = $ 120,000 and over)
• Alcohol use (1 = 1 week or less; 2 = More than 1 week, less than 2 weeks; 3 = 2 weeks to less than 1 month; 4 = 1 month to less than 3 months; 5 = 3 months to less than 12 months; 6 = 12 months; 7 = More than 12 months)
• Education level (1 = Never attended school; 2 = Some primary school; 3 = Completed primary school; 4 = Some high school; 5 = Completed high school (i.e. Year 12, Form 6, HSC); 6 = TAFE or Trade Certificate or Diploma; 7 = Undergraduate degree; 8 = Postgraduate degree).
Control variables were entered as the first step of the logistic regression analyses. Then, evaluation timepoints were entered. The evaluation timepoints were coded as 0 = first timepoint and 1 = second timepoint. Key categories that emerged from qualitative responses in the first evaluation were also compared with those from the second evaluation.
We undertook a detailed analysis and description of the findings, including frequencies and cross-tabulations, tables and charts to illustrate the results where appropriate, and commentary on the results including summaries for key sections of the final report.
Alcohol and Pregnancy Labelling Evaluation - Appendices 20
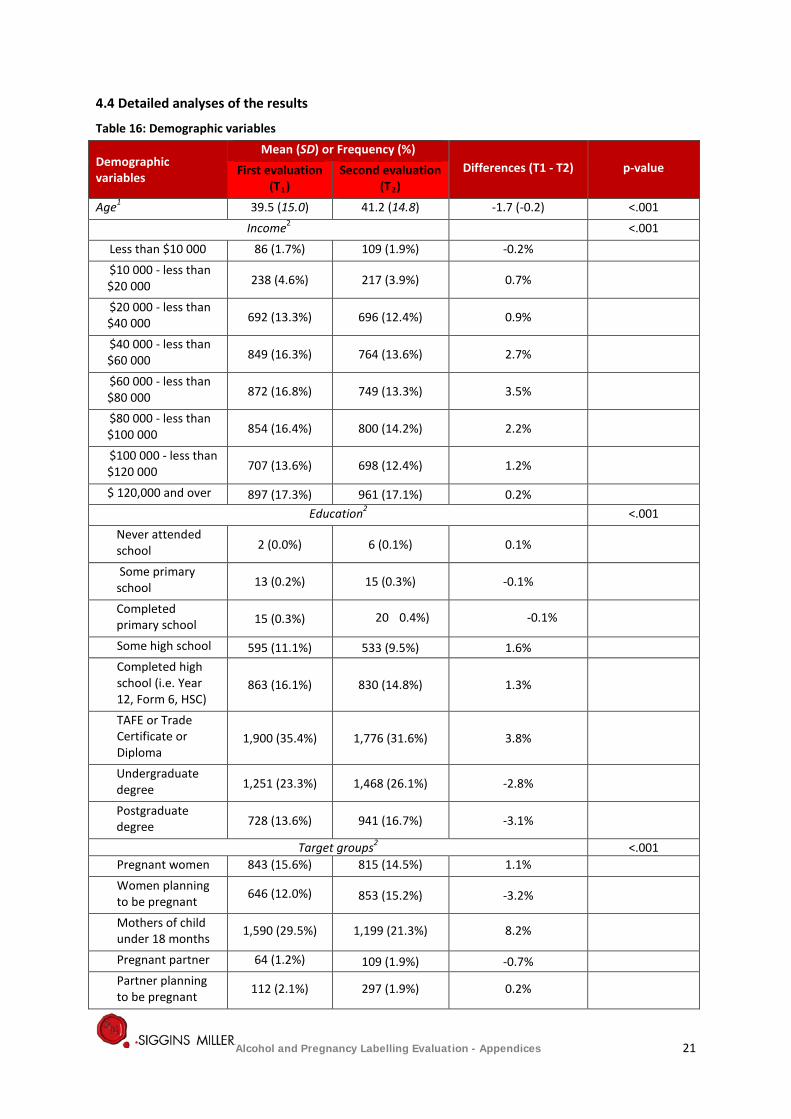
4.4 Detailed analyses of the results
Table 16: Demographic variables
Demographic variables
Mean (SD) or Frequency (%) Differences (T1 - T2) p-value First evaluation
(T1) Second evaluation
(T2) Age1 39.5 (15.0) 41.2 (14.8) -1.7 (-0.2) <.001
Income2 <.001 Less than $10 000 86 (1.7%) 109 (1.9%) -0.2% $10 000 - less than $20 000 238 (4.6%) 217 (3.9%) 0.7%
$20 000 - less than $40 000 692 (13.3%) 696 (12.4%) 0.9%
$40 000 - less than $60 000 849 (16.3%) 764 (13.6%) 2.7%
$60 000 - less than $80 000 872 (16.8%) 749 (13.3%) 3.5%
$80 000 - less than $100 000 854 (16.4%) 800 (14.2%) 2.2%
$100 000 - less than $120 000 707 (13.6%) 698 (12.4%) 1.2%
$ 120,000 and over 897 (17.3%) 961 (17.1%) 0.2% Education2 <.001
Never attended school 2 (0.0%) 6 (0.1%) 0.1%
Some primary school 13 (0.2%) 15 (0.3%) -0.1%
Completed primary school 15 (0.3%) 20 0.4%) -0.1%
Some high school 595 (11.1%) 533 (9.5%) 1.6% Completed high school (i.e. Year 12, Form 6, HSC)
863 (16.1%) 830 (14.8%) 1.3%
TAFE or Trade Certificate or Diploma
1,900 (35.4%) 1,776 (31.6%) 3.8%
Undergraduate degree 1,251 (23.3%) 1,468 (26.1%) -2.8%
Postgraduate degree 728 (13.6%) 941 (16.7%) -3.1%
Target groups2 <.001 Pregnant women 843 (15.6%) 815 (14.5%) 1.1% Women planning to be pregnant 646 (12.0%) 853 (15.2%) -3.2%
Mothers of child under 18 months 1,590 (29.5%) 1,199 (21.3%) 8.2%
Pregnant partner 64 (1.2%) 109 (1.9%) -0.7% Partner planning to be pregnant 112 (2.1%) 297 (1.9%) 0.2%
Alcohol and Pregnancy Labelling Evaluation - Appendices 21
Demographic variables
Mean (SD) or Frequency (%) Differences (T1 - T2) p-value First evaluation
(T1) Second evaluation
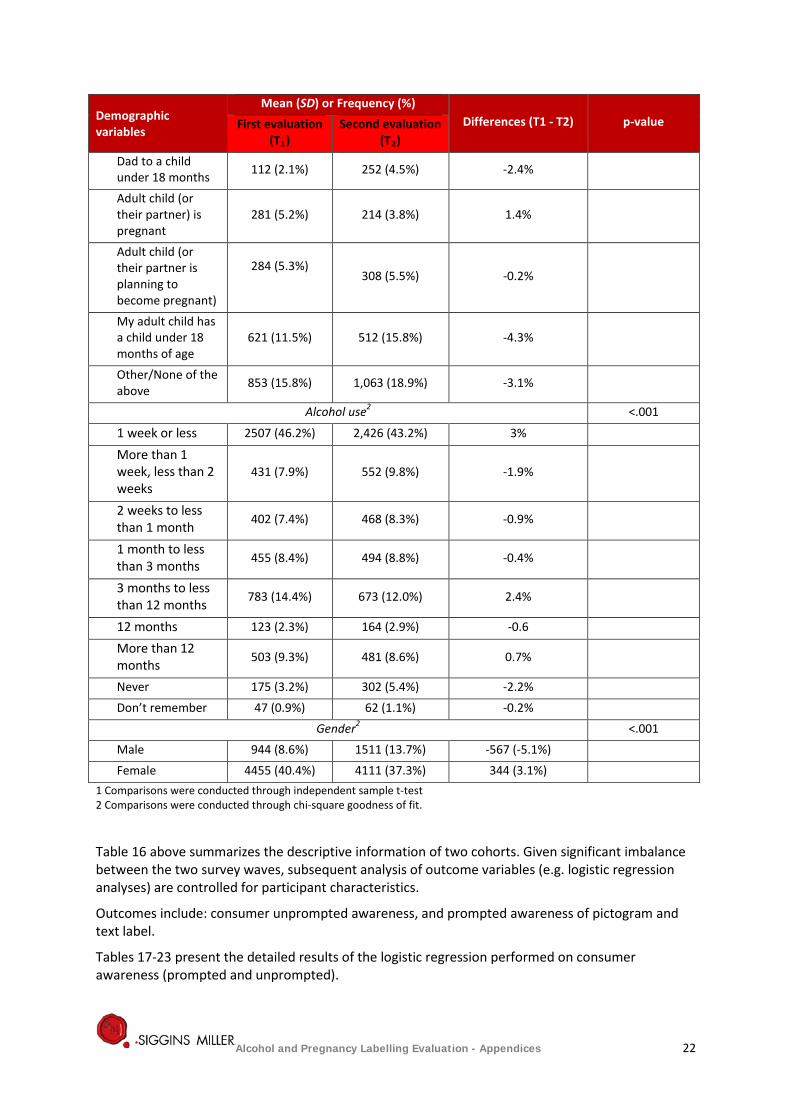
(T2) Dad to a child under 18 months 112 (2.1%) 252 (4.5%) -2.4%
Adult child (or their partner) is pregnant
281 (5.2%) 214 (3.8%) 1.4%
Adult child (or their partner is planning to become pregnant)
284 (5.3%)
308 (5.5%) -0.2%
My adult child has a child under 18 months of age
621 (11.5%) 512 (15.8%) -4.3%
Other/None of the above 853 (15.8%) 1,063 (18.9%) -3.1%
Alcohol use2 <.001
1 week or less 2507 (46.2%) 2,426 (43.2%) 3%
More than 1 week, less than 2 weeks
431 (7.9%) 552 (9.8%) -1.9%
2 weeks to less than 1 month 402 (7.4%) 468 (8.3%) -0.9%
1 month to less than 3 months
455 (8.4%) 494 (8.8%) -0.4%
3 months to less than 12 months
783 (14.4%) 673 (12.0%) 2.4%
12 months 123 (2.3%) 164 (2.9%) -0.6
More than 12 months 503 (9.3%) 481 (8.6%) 0.7%
Never 175 (3.2%) 302 (5.4%) -2.2% Don’t remember 47 (0.9%) 62 (1.1%) -0.2%
Gender2 <.001 Male 944 (8.6%) 1511 (13.7%) -567 (-5.1%) Female 4455 (40.4%) 4111 (37.3%) 344 (3.1%)
1 Comparisons were conducted through independent sample t-test 2 Comparisons were conducted through chi-square goodness of fit.
Table 16 above summarizes the descriptive information of two cohorts. Given significant imbalance between the two survey waves, subsequent analysis of outcome variables (e.g. logistic regression analyses) are controlled for participant characteristics.
Outcomes include: consumer unprompted awareness, and prompted awareness of pictogram and text label.
Tables 17-23 present the detailed results of the logistic regression performed on consumer awareness (prompted and unprompted).
Alcohol and Pregnancy Labelling Evaluation - Appendices 22
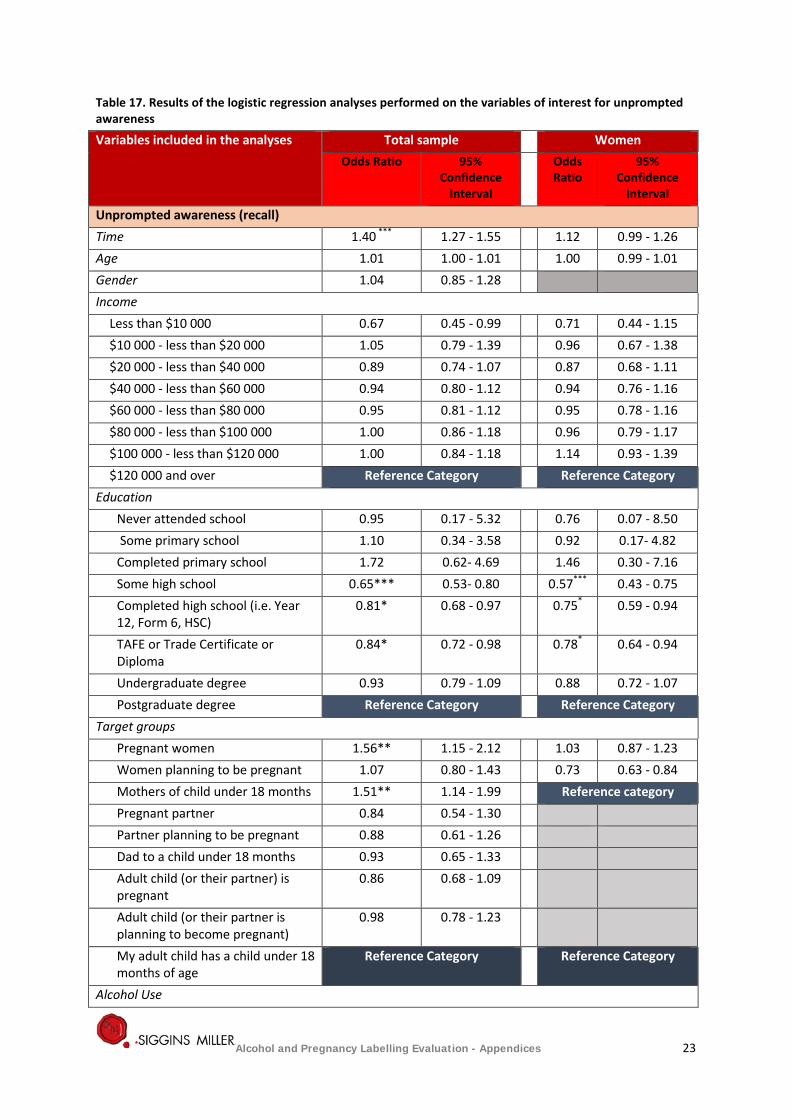
Table 17. Results of the logistic regression analyses performed on the variables of interest for unprompted awareness
Variables included in the analyses Total sample Women Odds Ratio 95%
Confidence Interval
Odds Ratio
95% Confidence
Interval
Unprompted awareness (recall) Time 1.40 *** 1.27 - 1.55 1.12 0.99 - 1.26 Age 1.01 1.00 - 1.01 1.00 0.99 - 1.01 Gender 1.04 0.85 - 1.28 Income
Less than $10 000 0.67 0.45 - 0.99 0.71 0.44 - 1.15 $10 000 - less than $20 000 1.05 0.79 - 1.39 0.96 0.67 - 1.38 $20 000 - less than $40 000 0.89 0.74 - 1.07 0.87 0.68 - 1.11 $40 000 - less than $60 000 0.94 0.80 - 1.12 0.94 0.76 - 1.16 $60 000 - less than $80 000 0.95 0.81 - 1.12 0.95 0.78 - 1.16 $80 000 - less than $100 000 1.00 0.86 - 1.18 0.96 0.79 - 1.17 $100 000 - less than $120 000 1.00 0.84 - 1.18 1.14 0.93 - 1.39 $120 000 and over Reference Category Reference Category
Education Never attended school 0.95 0.17 - 5.32 0.76 0.07 - 8.50 Some primary school 1.10 0.34 - 3.58 0.92 0.17- 4.82 Completed primary school 1.72 0.62- 4.69 1.46 0.30 - 7.16 Some high school 0.65*** 0.53- 0.80 0.57*** 0.43 - 0.75 Completed high school (i.e. Year 12, Form 6, HSC)
0.81* 0.68 - 0.97 0.75* 0.59 - 0.94
TAFE or Trade Certificate or Diploma
0.84* 0.72 - 0.98 0.78* 0.64 - 0.94
Undergraduate degree 0.93 0.79 - 1.09 0.88 0.72 - 1.07 Postgraduate degree Reference Category Reference Category
Target groups Pregnant women 1.56** 1.15 - 2.12 1.03 0.87 - 1.23 Women planning to be pregnant 1.07 0.80 - 1.43 0.73 0.63 - 0.84 Mothers of child under 18 months 1.51** 1.14 - 1.99 Reference category Pregnant partner 0.84 0.54 - 1.30 Partner planning to be pregnant 0.88 0.61 - 1.26 Dad to a child under 18 months 0.93 0.65 - 1.33 Adult child (or their partner) is pregnant
0.86 0.68 - 1.09
Adult child (or their partner is planning to become pregnant)
0.98 0.78 - 1.23
My adult child has a child under 18 months of age
Reference Category Reference Category
Alcohol Use
Alcohol and Pregnancy Labelling Evaluation - Appendices 23
Variables included in the analyses Total sample Women Odds Ratio 95%
Confidence Interval
Odds Ratio
95% Confidence
Interval
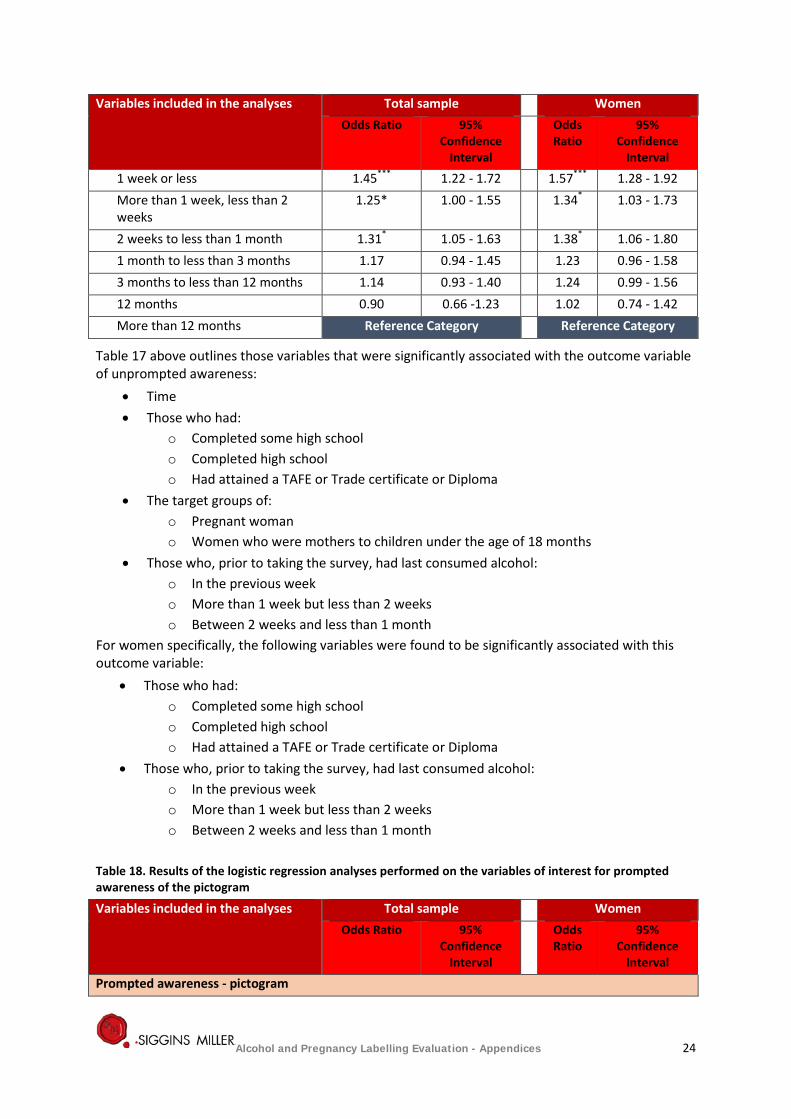
1 week or less 1.45*** 1.22 - 1.72 1.57*** 1.28 - 1.92 More than 1 week, less than 2 weeks
1.25* 1.00 - 1.55 1.34* 1.03 - 1.73
2 weeks to less than 1 month 1.31* 1.05 - 1.63 1.38* 1.06 - 1.80 1 month to less than 3 months 1.17 0.94 - 1.45 1.23 0.96 - 1.58 3 months to less than 12 months 1.14 0.93 - 1.40 1.24 0.99 - 1.56 12 months 0.90 0.66 -1.23 1.02 0.74 - 1.42 More than 12 months Reference Category Reference Category
Table 17 above outlines those variables that were significantly associated with the outcome variable of unprompted awareness:
• Time • Those who had:
o Completed some high school o Completed high school o Had attained a TAFE or Trade certificate or Diploma
• The target groups of: o Pregnant woman o Women who were mothers to children under the age of 18 months
• Those who, prior to taking the survey, had last consumed alcohol: o In the previous week o More than 1 week but less than 2 weeks o Between 2 weeks and less than 1 month
For women specifically, the following variables were found to be significantly associated with this outcome variable:
• Those who had: o Completed some high school o Completed high school o Had attained a TAFE or Trade certificate or Diploma
• Those who, prior to taking the survey, had last consumed alcohol: o In the previous week o More than 1 week but less than 2 weeks o Between 2 weeks and less than 1 month
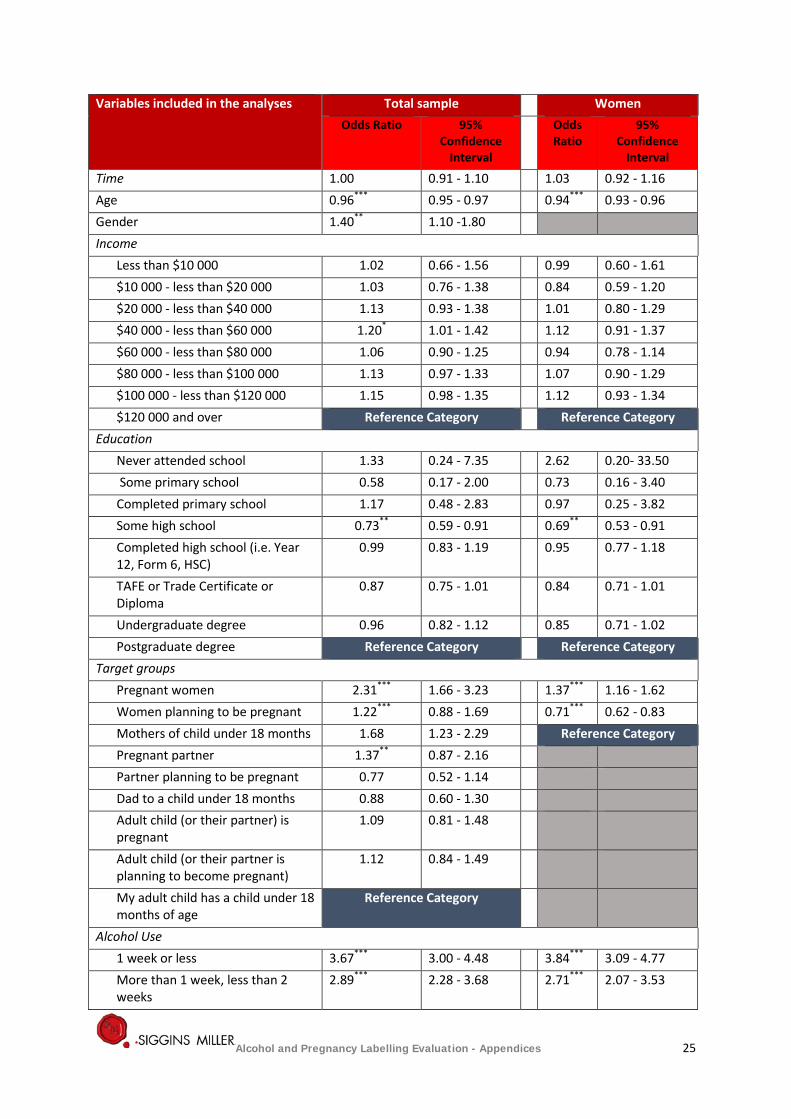
Table 18. Results of the logistic regression analyses performed on the variables of interest for prompted awareness of the pictogram
Variables included in the analyses Total sample Women Odds Ratio 95%
Confidence Interval
Odds Ratio
95% Confidence
Interval
Prompted awareness - pictogram
Alcohol and Pregnancy Labelling Evaluation - Appendices 24
Variables included in the analyses Total sample Women Odds Ratio 95%
Confidence Interval
Odds Ratio
95% Confidence
Interval
Time 1.00 0.91 - 1.10 1.03 0.92 - 1.16 Age 0.96*** 0.95 - 0.97 0.94*** 0.93 - 0.96 Gender 1.40** 1.10 -1.80 Income
Less than $10 000 1.02 0.66 - 1.56 0.99 0.60 - 1.61 $10 000 - less than $20 000 1.03 0.76 - 1.38 0.84 0.59 - 1.20 $20 000 - less than $40 000 1.13 0.93 - 1.38 1.01 0.80 - 1.29 $40 000 - less than $60 000 1.20* 1.01 - 1.42 1.12 0.91 - 1.37 $60 000 - less than $80 000 1.06 0.90 - 1.25 0.94 0.78 - 1.14 $80 000 - less than $100 000 1.13 0.97 - 1.33 1.07 0.90 - 1.29 $100 000 - less than $120 000 1.15 0.98 - 1.35 1.12 0.93 - 1.34 $120 000 and over Reference Category Reference Category
Education Never attended school 1.33 0.24 - 7.35 2.62 0.20- 33.50 Some primary school 0.58 0.17 - 2.00 0.73 0.16 - 3.40 Completed primary school 1.17 0.48 - 2.83 0.97 0.25 - 3.82 Some high school 0.73** 0.59 - 0.91 0.69** 0.53 - 0.91 Completed high school (i.e. Year 12, Form 6, HSC)
0.99 0.83 - 1.19 0.95 0.77 - 1.18
TAFE or Trade Certificate or Diploma
0.87 0.75 - 1.01 0.84 0.71 - 1.01
Undergraduate degree 0.96 0.82 - 1.12 0.85 0.71 - 1.02 Postgraduate degree Reference Category Reference Category
Target groups Pregnant women 2.31*** 1.66 - 3.23 1.37*** 1.16 - 1.62 Women planning to be pregnant 1.22*** 0.88 - 1.69 0.71*** 0.62 - 0.83 Mothers of child under 18 months 1.68 1.23 - 2.29 Reference Category Pregnant partner 1.37** 0.87 - 2.16 Partner planning to be pregnant 0.77 0.52 - 1.14 Dad to a child under 18 months 0.88 0.60 - 1.30 Adult child (or their partner) is pregnant
1.09 0.81 - 1.48
Adult child (or their partner is planning to become pregnant)
1.12 0.84 - 1.49
My adult child has a child under 18 months of age
Reference Category
Alcohol Use 1 week or less 3.67*** 3.00 - 4.48 3.84*** 3.09 - 4.77 More than 1 week, less than 2 weeks
2.89*** 2.28 - 3.68 2.71*** 2.07 - 3.53
Alcohol and Pregnancy Labelling Evaluation - Appendices 25
Variables included in the analyses Total sample Women Odds Ratio 95%
Confidence Interval
Odds Ratio
95% Confidence
Interval
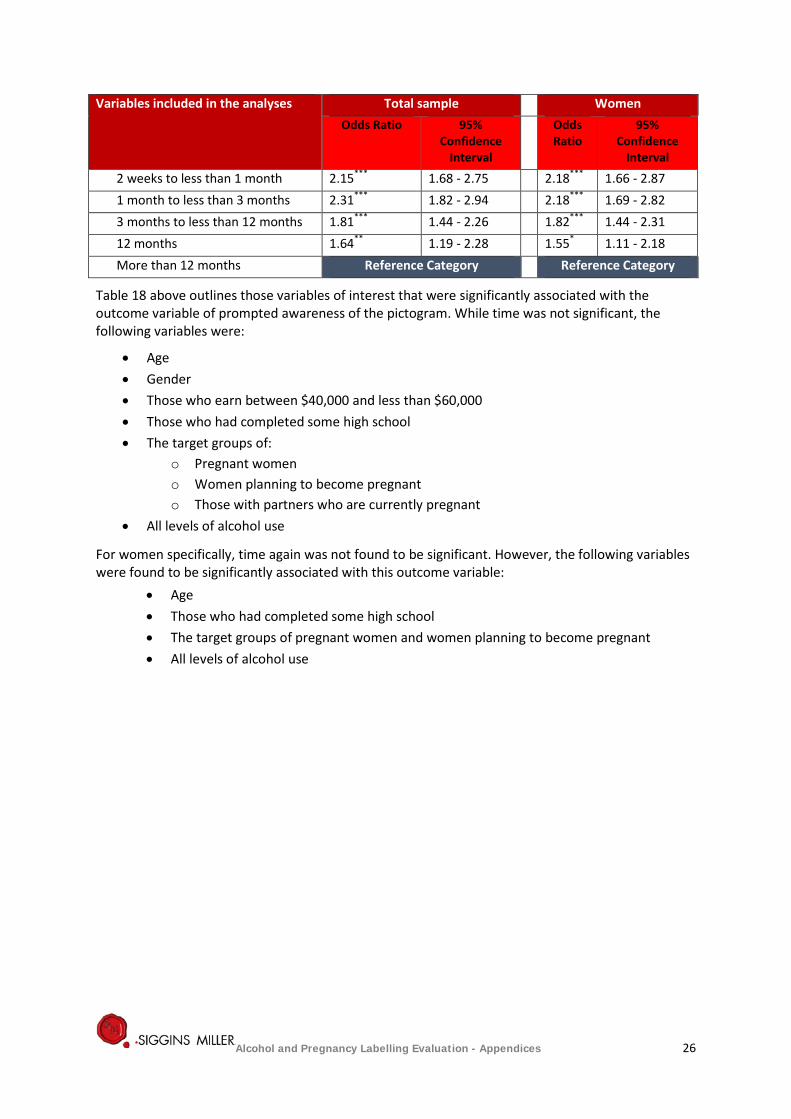
2 weeks to less than 1 month 2.15*** 1.68 - 2.75 2.18*** 1.66 - 2.87 1 month to less than 3 months 2.31*** 1.82 - 2.94 2.18*** 1.69 - 2.82 3 months to less than 12 months 1.81*** 1.44 - 2.26 1.82*** 1.44 - 2.31 12 months 1.64** 1.19 - 2.28 1.55* 1.11 - 2.18 More than 12 months Reference Category Reference Category
Table 18 above outlines those variables of interest that were significantly associated with the outcome variable of prompted awareness of the pictogram. While time was not significant, the following variables were:
• Age • Gender • Those who earn between $40,000 and less than $60,000 • Those who had completed some high school • The target groups of:
o Pregnant women o Women planning to become pregnant o Those with partners who are currently pregnant
• All levels of alcohol use
For women specifically, time again was not found to be significant. However, the following variables were found to be significantly associated with this outcome variable:
• Age • Those who had completed some high school • The target groups of pregnant women and women planning to become pregnant • All levels of alcohol use
Alcohol and Pregnancy Labelling Evaluation - Appendices 26
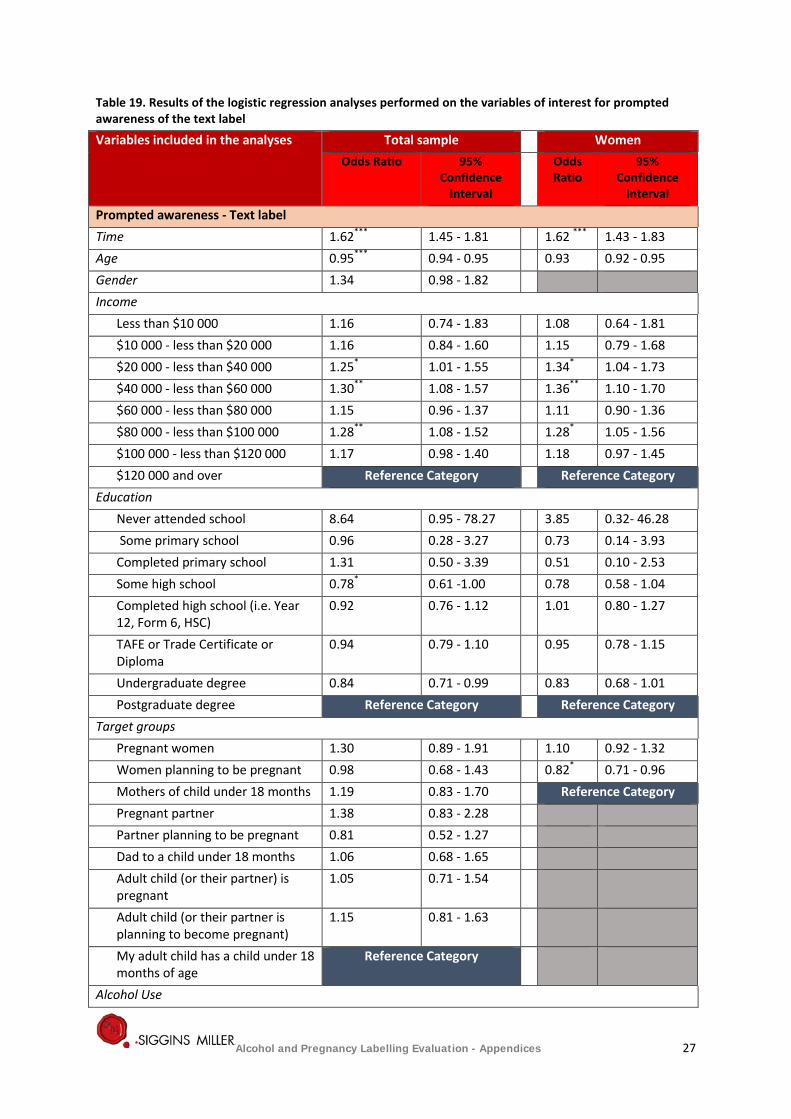
Table 19. Results of the logistic regression analyses performed on the variables of interest for prompted awareness of the text label
Variables included in the analyses Total sample Women Odds Ratio 95%
Confidence Interval
Odds Ratio
95% Confidence
Interval
Prompted awareness - Text label Time 1.62*** 1.45 - 1.81 1.62 *** 1.43 - 1.83 Age 0.95*** 0.94 - 0.95 0.93 0.92 - 0.95 Gender 1.34 0.98 - 1.82 Income
Less than $10 000 1.16 0.74 - 1.83 1.08 0.64 - 1.81 $10 000 - less than $20 000 1.16 0.84 - 1.60 1.15 0.79 - 1.68 $20 000 - less than $40 000 1.25* 1.01 - 1.55 1.34* 1.04 - 1.73 $40 000 - less than $60 000 1.30** 1.08 - 1.57 1.36** 1.10 - 1.70 $60 000 - less than $80 000 1.15 0.96 - 1.37 1.11 0.90 - 1.36 $80 000 - less than $100 000 1.28** 1.08 - 1.52 1.28* 1.05 - 1.56 $100 000 - less than $120 000 1.17 0.98 - 1.40 1.18 0.97 - 1.45 $120 000 and over Reference Category Reference Category
Education Never attended school 8.64 0.95 - 78.27 3.85 0.32- 46.28 Some primary school 0.96 0.28 - 3.27 0.73 0.14 - 3.93 Completed primary school 1.31 0.50 - 3.39 0.51 0.10 - 2.53 Some high school 0.78* 0.61 -1.00 0.78 0.58 - 1.04 Completed high school (i.e. Year 12, Form 6, HSC)
0.92 0.76 - 1.12 1.01 0.80 - 1.27
TAFE or Trade Certificate or Diploma
0.94 0.79 - 1.10 0.95 0.78 - 1.15
Undergraduate degree 0.84 0.71 - 0.99 0.83 0.68 - 1.01 Postgraduate degree Reference Category Reference Category
Target groups Pregnant women 1.30 0.89 - 1.91 1.10 0.92 - 1.32 Women planning to be pregnant 0.98 0.68 - 1.43 0.82* 0.71 - 0.96 Mothers of child under 18 months 1.19 0.83 - 1.70 Reference Category Pregnant partner 1.38 0.83 - 2.28 Partner planning to be pregnant 0.81 0.52 - 1.27 Dad to a child under 18 months 1.06 0.68 - 1.65 Adult child (or their partner) is pregnant
1.05 0.71 - 1.54
Adult child (or their partner is planning to become pregnant)
1.15 0.81 - 1.63
My adult child has a child under 18 months of age
Reference Category
Alcohol Use
Alcohol and Pregnancy Labelling Evaluation - Appendices 27
Variables included in the analyses Total sample Women Odds Ratio 95%
Confidence Interval
Odds Ratio
95% Confidence
Interval
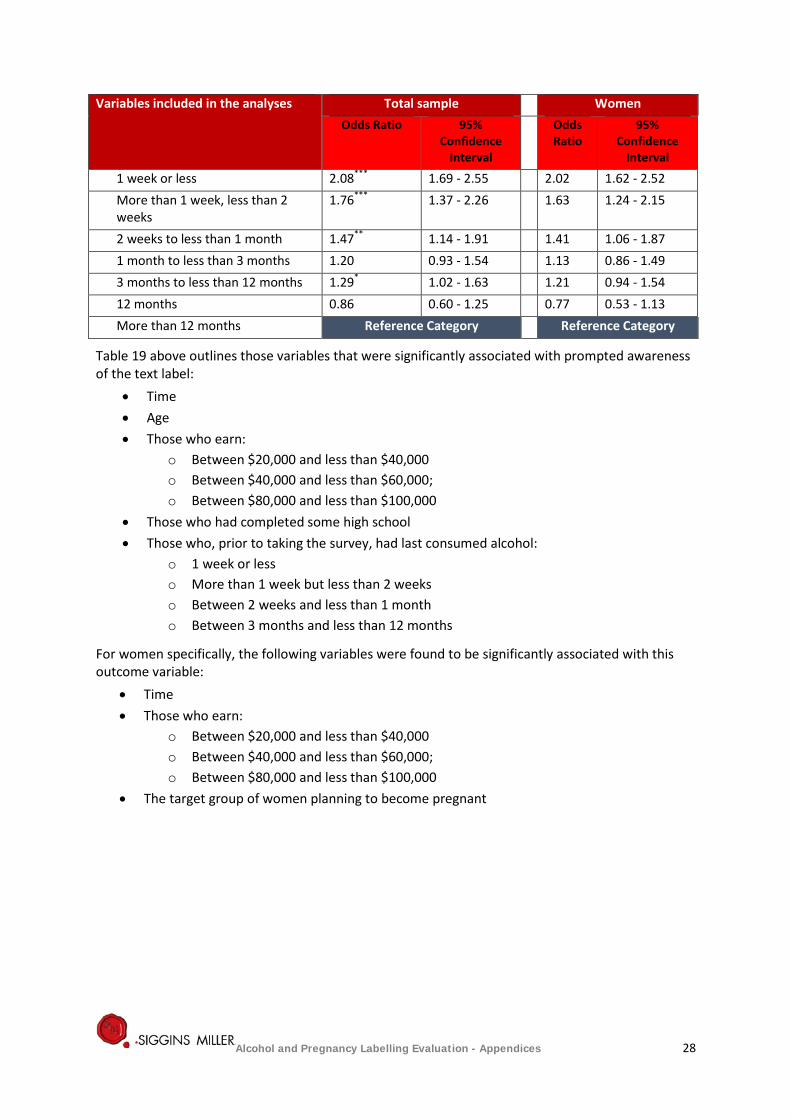
1 week or less 2.08*** 1.69 - 2.55 2.02 1.62 - 2.52 More than 1 week, less than 2 weeks
1.76*** 1.37 - 2.26 1.63 1.24 - 2.15
2 weeks to less than 1 month 1.47** 1.14 - 1.91 1.41 1.06 - 1.87 1 month to less than 3 months 1.20 0.93 - 1.54 1.13 0.86 - 1.49 3 months to less than 12 months 1.29* 1.02 - 1.63 1.21 0.94 - 1.54 12 months 0.86 0.60 - 1.25 0.77 0.53 - 1.13 More than 12 months Reference Category Reference Category
Table 19 above outlines those variables that were significantly associated with prompted awareness of the text label:
• Time • Age • Those who earn:
o Between $20,000 and less than $40,000 o Between $40,000 and less than $60,000; o Between $80,000 and less than $100,000
• Those who had completed some high school • Those who, prior to taking the survey, had last consumed alcohol:
o 1 week or less o More than 1 week but less than 2 weeks o Between 2 weeks and less than 1 month o Between 3 months and less than 12 months
For women specifically, the following variables were found to be significantly associated with this outcome variable:
• Time • Those who earn:
o Between $20,000 and less than $40,000 o Between $40,000 and less than $60,000; o Between $80,000 and less than $100,000
• The target group of women planning to become pregnant
Alcohol and Pregnancy Labelling Evaluation - Appendices 28
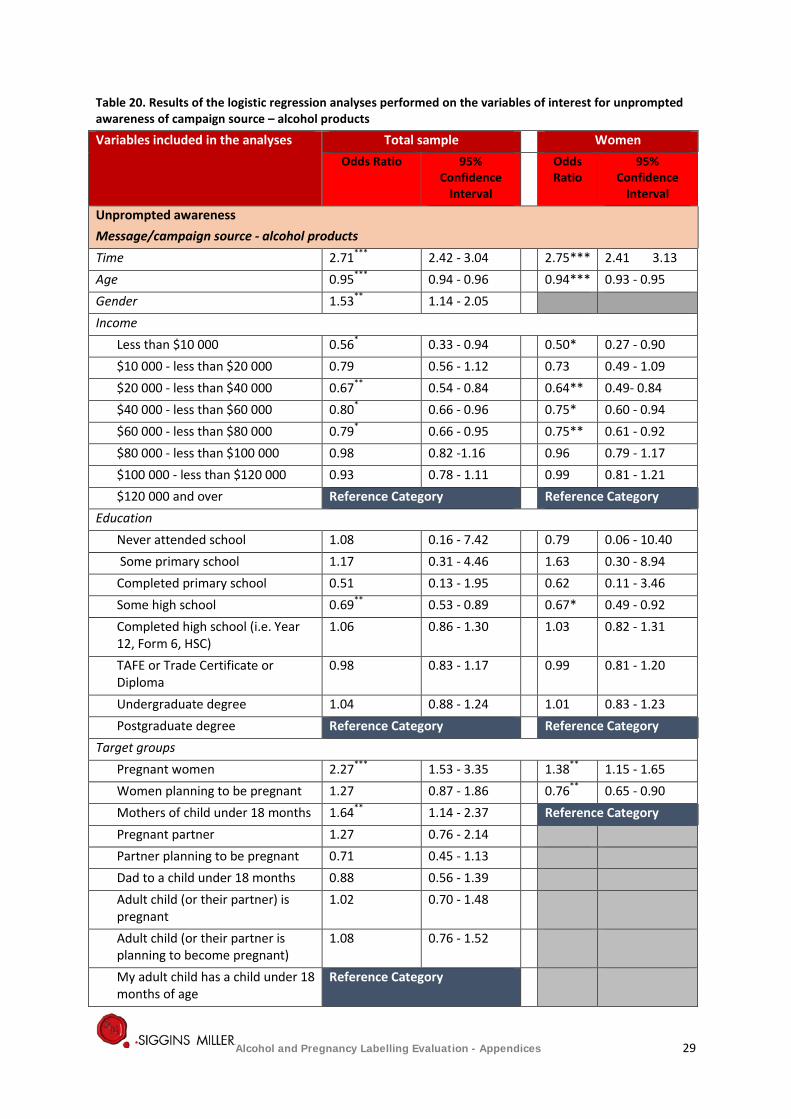
Table 20. Results of the logistic regression analyses performed on the variables of interest for unprompted awareness of campaign source – alcohol products
Variables included in the analyses Total sample Women Odds Ratio 95%
Confidence Interval
Odds Ratio
95% Confidence
Interval
Unprompted awareness Message/campaign source - alcohol products Time 2.71*** 2.42 - 3.04 2.75*** 2.41 3.13 Age 0.95*** 0.94 - 0.96 0.94*** 0.93 - 0.95 Gender 1.53** 1.14 - 2.05 Income
Less than $10 000 0.56* 0.33 - 0.94 0.50* 0.27 - 0.90 $10 000 - less than $20 000 0.79 0.56 - 1.12 0.73 0.49 - 1.09 $20 000 - less than $40 000 0.67** 0.54 - 0.84 0.64** 0.49- 0.84 $40 000 - less than $60 000 0.80* 0.66 - 0.96 0.75* 0.60 - 0.94 $60 000 - less than $80 000 0.79* 0.66 - 0.95 0.75** 0.61 - 0.92 $80 000 - less than $100 000 0.98 0.82 -1.16 0.96 0.79 - 1.17 $100 000 - less than $120 000 0.93 0.78 - 1.11 0.99 0.81 - 1.21 $120 000 and over Reference Category Reference Category
Education Never attended school 1.08 0.16 - 7.42 0.79 0.06 - 10.40 Some primary school 1.17 0.31 - 4.46 1.63 0.30 - 8.94 Completed primary school 0.51 0.13 - 1.95 0.62 0.11 - 3.46 Some high school 0.69** 0.53 - 0.89 0.67* 0.49 - 0.92 Completed high school (i.e. Year 12, Form 6, HSC)
1.06 0.86 - 1.30 1.03 0.82 - 1.31
TAFE or Trade Certificate or Diploma
0.98 0.83 - 1.17 0.99 0.81 - 1.20
Undergraduate degree 1.04 0.88 - 1.24 1.01 0.83 - 1.23 Postgraduate degree Reference Category Reference Category
Target groups Pregnant women 2.27*** 1.53 - 3.35 1.38** 1.15 - 1.65 Women planning to be pregnant 1.27 0.87 - 1.86 0.76** 0.65 - 0.90 Mothers of child under 18 months 1.64** 1.14 - 2.37 Reference Category Pregnant partner 1.27 0.76 - 2.14 Partner planning to be pregnant 0.71 0.45 - 1.13 Dad to a child under 18 months 0.88 0.56 - 1.39 Adult child (or their partner) is pregnant
1.02 0.70 - 1.48
Adult child (or their partner is planning to become pregnant)
1.08 0.76 - 1.52
My adult child has a child under 18 months of age
Reference Category
Alcohol and Pregnancy Labelling Evaluation - Appendices 29
Variables included in the analyses Total sample Women Odds Ratio 95%
Confidence Interval
Odds Ratio
95% Confidence
Interval
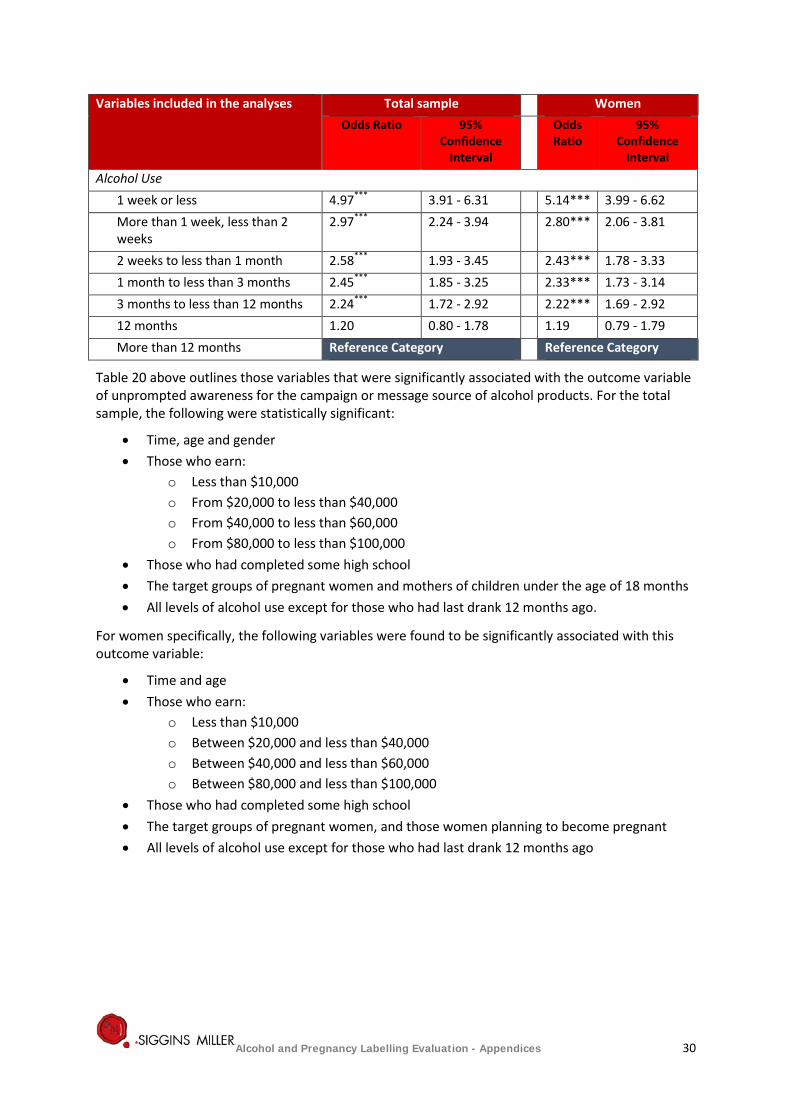
Alcohol Use 1 week or less 4.97*** 3.91 - 6.31 5.14*** 3.99 - 6.62 More than 1 week, less than 2 weeks
2.97*** 2.24 - 3.94 2.80*** 2.06 - 3.81
2 weeks to less than 1 month 2.58*** 1.93 - 3.45 2.43*** 1.78 - 3.33 1 month to less than 3 months 2.45*** 1.85 - 3.25 2.33*** 1.73 - 3.14 3 months to less than 12 months 2.24*** 1.72 - 2.92 2.22*** 1.69 - 2.92 12 months 1.20 0.80 - 1.78 1.19 0.79 - 1.79 More than 12 months Reference Category Reference Category
Table 20 above outlines those variables that were significantly associated with the outcome variable of unprompted awareness for the campaign or message source of alcohol products. For the total sample, the following were statistically significant:
• Time, age and gender • Those who earn:
o Less than $10,000 o From $20,000 to less than $40,000 o From $40,000 to less than $60,000 o From $80,000 to less than $100,000
• Those who had completed some high school • The target groups of pregnant women and mothers of children under the age of 18 months • All levels of alcohol use except for those who had last drank 12 months ago.
For women specifically, the following variables were found to be significantly associated with this outcome variable:
• Time and age • Those who earn:
o Less than $10,000 o Between $20,000 and less than $40,000 o Between $40,000 and less than $60,000 o Between $80,000 and less than $100,000
• Those who had completed some high school • The target groups of pregnant women, and those women planning to become pregnant • All levels of alcohol use except for those who had last drank 12 months ago
Alcohol and Pregnancy Labelling Evaluation - Appendices 30
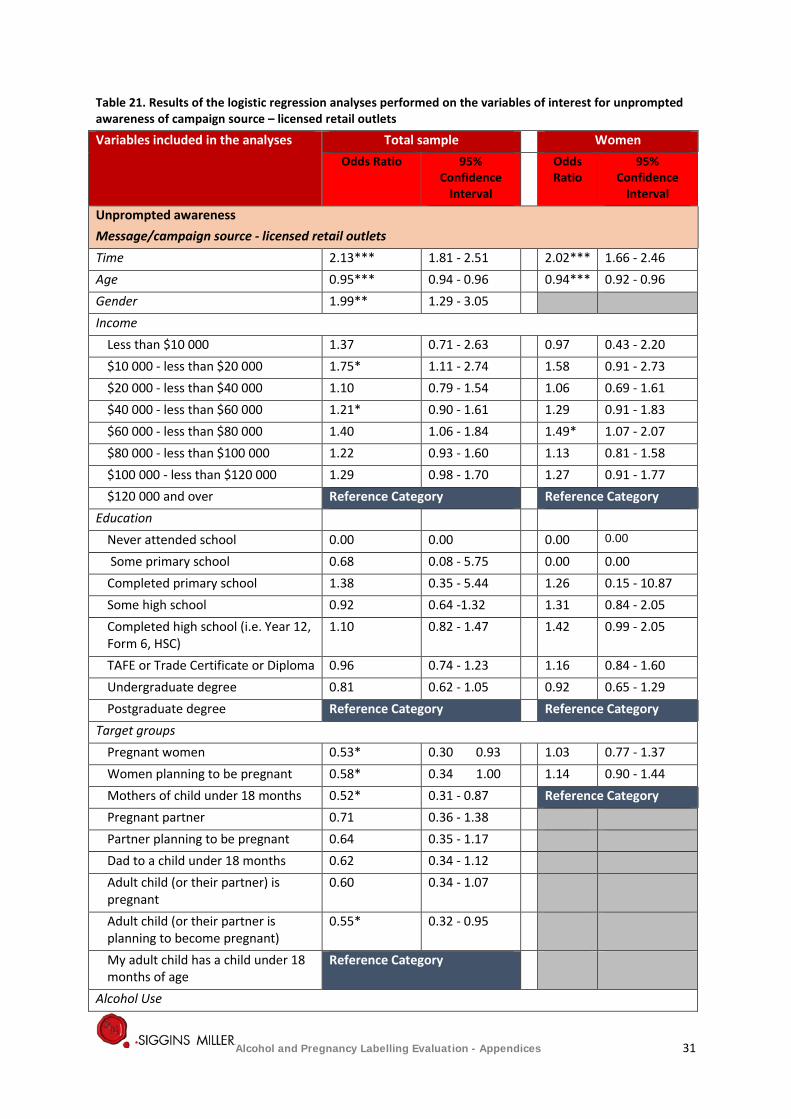
Table 21. Results of the logistic regression analyses performed on the variables of interest for unprompted awareness of campaign source – licensed retail outlets
Variables included in the analyses Total sample Women Odds Ratio 95%
Confidence Interval
Odds Ratio
95% Confidence
Interval
Unprompted awareness Message/campaign source - licensed retail outlets Time 2.13*** 1.81 - 2.51 2.02*** 1.66 - 2.46 Age 0.95*** 0.94 - 0.96 0.94*** 0.92 - 0.96 Gender 1.99** 1.29 - 3.05 Income
Less than $10 000 1.37 0.71 - 2.63 0.97 0.43 - 2.20 $10 000 - less than $20 000 1.75* 1.11 - 2.74 1.58 0.91 - 2.73 $20 000 - less than $40 000 1.10 0.79 - 1.54 1.06 0.69 - 1.61 $40 000 - less than $60 000 1.21* 0.90 - 1.61 1.29 0.91 - 1.83 $60 000 - less than $80 000 1.40 1.06 - 1.84 1.49* 1.07 - 2.07 $80 000 - less than $100 000 1.22 0.93 - 1.60 1.13 0.81 - 1.58 $100 000 - less than $120 000 1.29 0.98 - 1.70 1.27 0.91 - 1.77 $120 000 and over Reference Category Reference Category
Education Never attended school 0.00 0.00 0.00 0.00
Some primary school 0.68 0.08 - 5.75 0.00 0.00 Completed primary school 1.38 0.35 - 5.44 1.26 0.15 - 10.87 Some high school 0.92 0.64 -1.32 1.31 0.84 - 2.05 Completed high school (i.e. Year 12, Form 6, HSC)
1.10 0.82 - 1.47 1.42 0.99 - 2.05
TAFE or Trade Certificate or Diploma 0.96 0.74 - 1.23 1.16 0.84 - 1.60 Undergraduate degree 0.81 0.62 - 1.05 0.92 0.65 - 1.29 Postgraduate degree Reference Category Reference Category
Target groups Pregnant women 0.53* 0.30 0.93 1.03 0.77 - 1.37 Women planning to be pregnant 0.58* 0.34 1.00 1.14 0.90 - 1.44 Mothers of child under 18 months 0.52* 0.31 - 0.87 Reference Category Pregnant partner 0.71 0.36 - 1.38 Partner planning to be pregnant 0.64 0.35 - 1.17 Dad to a child under 18 months 0.62 0.34 - 1.12 Adult child (or their partner) is pregnant
0.60 0.34 - 1.07
Adult child (or their partner is planning to become pregnant)
0.55* 0.32 - 0.95
My adult child has a child under 18 months of age
Reference Category
Alcohol Use
Alcohol and Pregnancy Labelling Evaluation - Appendices 31
Variables included in the analyses Total sample Women Odds Ratio 95%
Confidence Interval
Odds Ratio
95% Confidence
Interval
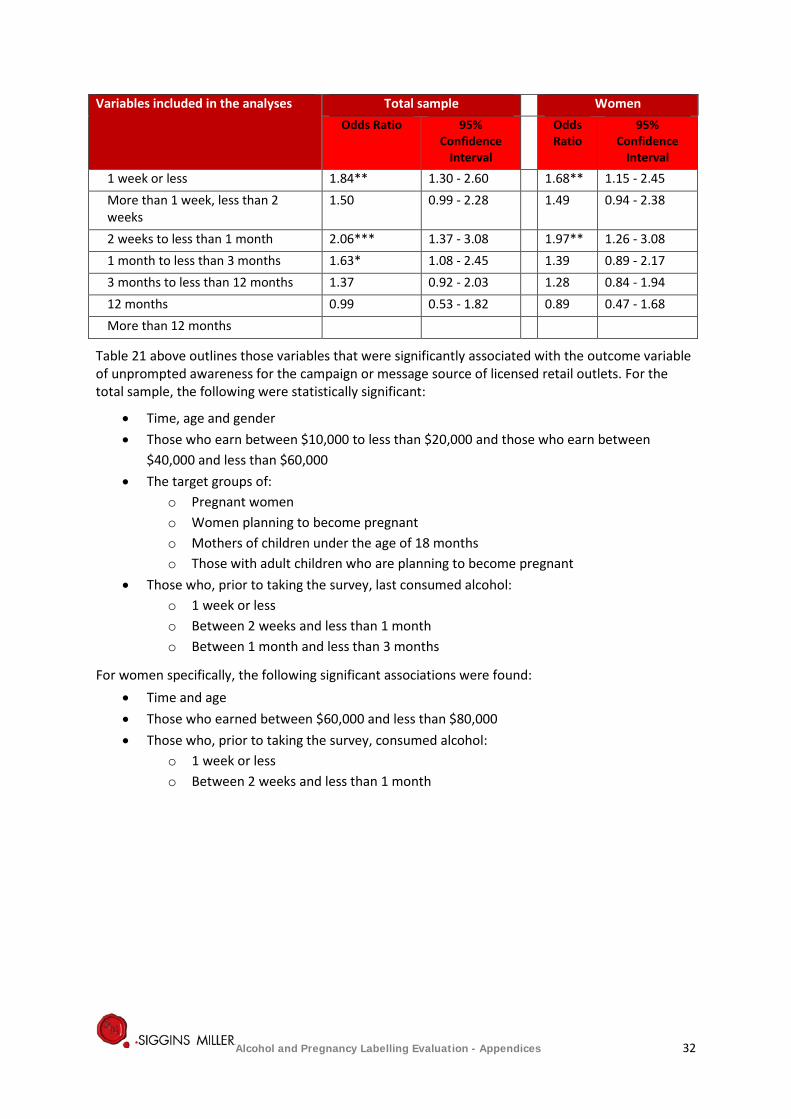
1 week or less 1.84** 1.30 - 2.60 1.68** 1.15 - 2.45 More than 1 week, less than 2 weeks
1.50 0.99 - 2.28 1.49 0.94 - 2.38
2 weeks to less than 1 month 2.06*** 1.37 - 3.08 1.97** 1.26 - 3.08 1 month to less than 3 months 1.63* 1.08 - 2.45 1.39 0.89 - 2.17 3 months to less than 12 months 1.37 0.92 - 2.03 1.28 0.84 - 1.94 12 months 0.99 0.53 - 1.82 0.89 0.47 - 1.68 More than 12 months
Table 21 above outlines those variables that were significantly associated with the outcome variable of unprompted awareness for the campaign or message source of licensed retail outlets. For the total sample, the following were statistically significant:
• Time, age and gender • Those who earn between $10,000 to less than $20,000 and those who earn between
$40,000 and less than $60,000 • The target groups of:
o Pregnant women o Women planning to become pregnant o Mothers of children under the age of 18 months o Those with adult children who are planning to become pregnant
• Those who, prior to taking the survey, last consumed alcohol: o 1 week or less o Between 2 weeks and less than 1 month o Between 1 month and less than 3 months
For women specifically, the following significant associations were found: • Time and age • Those who earned between $60,000 and less than $80,000 • Those who, prior to taking the survey, consumed alcohol:
o 1 week or less o Between 2 weeks and less than 1 month
Alcohol and Pregnancy Labelling Evaluation - Appendices 32
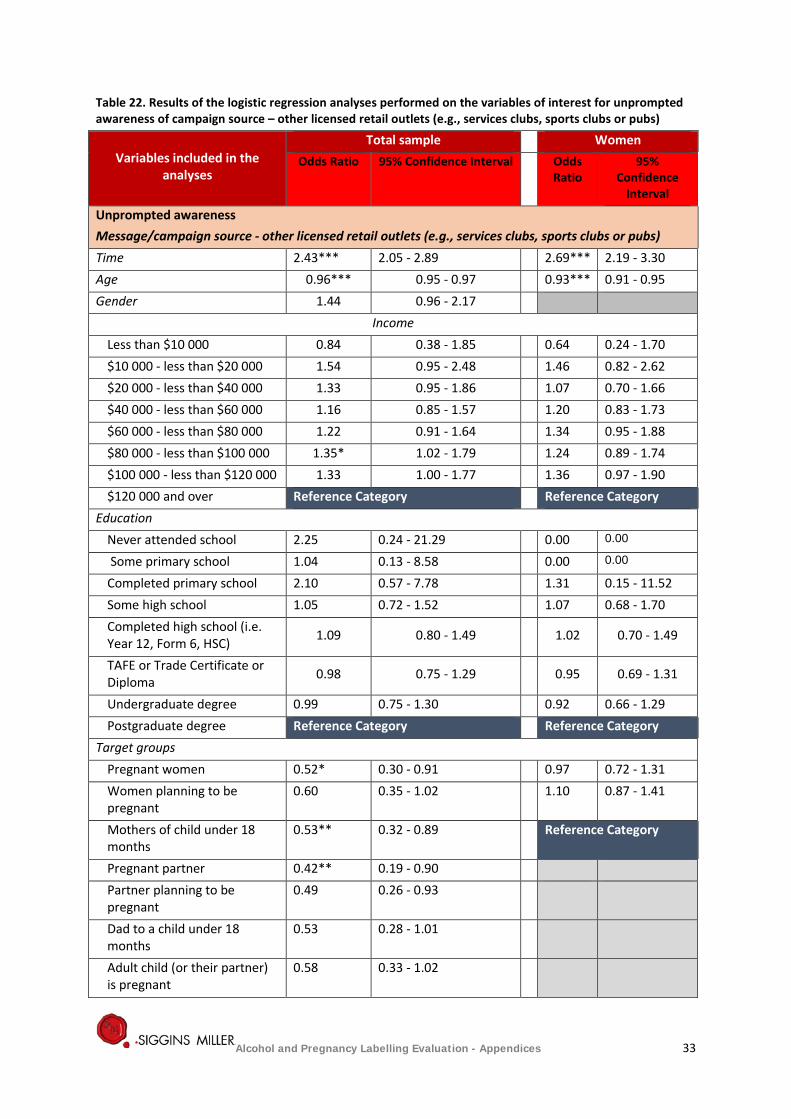
Table 22. Results of the logistic regression analyses performed on the variables of interest for unprompted awareness of campaign source – other licensed retail outlets (e.g., services clubs, sports clubs or pubs)
Variables included in the analyses
Total sample Women Odds Ratio 95% Confidence Interval Odds
Ratio 95%
Confidence Interval
Unprompted awareness Message/campaign source - other licensed retail outlets (e.g., services clubs, sports clubs or pubs) Time 2.43*** 2.05 - 2.89 2.69*** 2.19 - 3.30 Age 0.96*** 0.95 - 0.97 0.93*** 0.91 - 0.95 Gender 1.44 0.96 - 2.17
Income Less than $10 000 0.84 0.38 - 1.85 0.64 0.24 - 1.70 $10 000 - less than $20 000 1.54 0.95 - 2.48 1.46 0.82 - 2.62 $20 000 - less than $40 000 1.33 0.95 - 1.86 1.07 0.70 - 1.66 $40 000 - less than $60 000 1.16 0.85 - 1.57 1.20 0.83 - 1.73 $60 000 - less than $80 000 1.22 0.91 - 1.64 1.34 0.95 - 1.88 $80 000 - less than $100 000 1.35* 1.02 - 1.79 1.24 0.89 - 1.74 $100 000 - less than $120 000 1.33 1.00 - 1.77 1.36 0.97 - 1.90 $120 000 and over Reference Category Reference Category
Education Never attended school 2.25 0.24 - 21.29 0.00 0.00
Some primary school 1.04 0.13 - 8.58 0.00 0.00
Completed primary school 2.10 0.57 - 7.78 1.31 0.15 - 11.52 Some high school 1.05 0.72 - 1.52 1.07 0.68 - 1.70 Completed high school (i.e. Year 12, Form 6, HSC) 1.09 0.80 - 1.49 1.02 0.70 - 1.49
TAFE or Trade Certificate or Diploma 0.98 0.75 - 1.29 0.95 0.69 - 1.31
Undergraduate degree 0.99 0.75 - 1.30 0.92 0.66 - 1.29 Postgraduate degree Reference Category Reference Category
Target groups Pregnant women 0.52* 0.30 - 0.91 0.97 0.72 - 1.31 Women planning to be pregnant
0.60 0.35 - 1.02 1.10 0.87 - 1.41
Mothers of child under 18 months
0.53** 0.32 - 0.89 Reference Category
Pregnant partner 0.42** 0.19 - 0.90 Partner planning to be pregnant
0.49 0.26 - 0.93
Dad to a child under 18 months
0.53 0.28 - 1.01
Adult child (or their partner) is pregnant
0.58 0.33 - 1.02
Alcohol and Pregnancy Labelling Evaluation - Appendices 33
Variables included in the analyses
Total sample Women Odds Ratio 95% Confidence Interval Odds
Ratio 95%
Confidence Interval
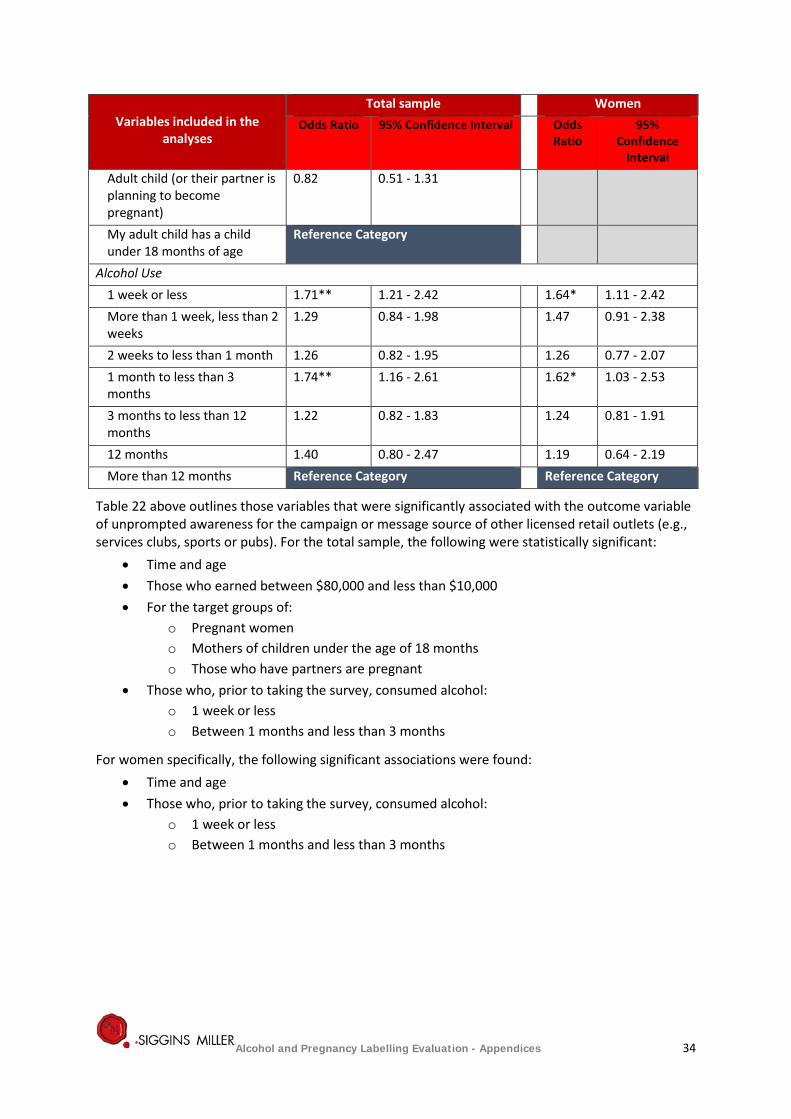
Adult child (or their partner is planning to become pregnant)
0.82 0.51 - 1.31
My adult child has a child under 18 months of age
Reference Category
Alcohol Use 1 week or less 1.71** 1.21 - 2.42 1.64* 1.11 - 2.42 More than 1 week, less than 2 weeks
1.29 0.84 - 1.98 1.47 0.91 - 2.38
2 weeks to less than 1 month 1.26 0.82 - 1.95 1.26 0.77 - 2.07 1 month to less than 3 months
1.74** 1.16 - 2.61 1.62* 1.03 - 2.53
3 months to less than 12 months
1.22 0.82 - 1.83 1.24 0.81 - 1.91
12 months 1.40 0.80 - 2.47 1.19 0.64 - 2.19 More than 12 months Reference Category Reference Category
Table 22 above outlines those variables that were significantly associated with the outcome variable of unprompted awareness for the campaign or message source of other licensed retail outlets (e.g., services clubs, sports or pubs). For the total sample, the following were statistically significant:
• Time and age • Those who earned between $80,000 and less than $10,000 • For the target groups of:
o Pregnant women o Mothers of children under the age of 18 months o Those who have partners are pregnant
• Those who, prior to taking the survey, consumed alcohol: o 1 week or less o Between 1 months and less than 3 months
For women specifically, the following significant associations were found: • Time and age • Those who, prior to taking the survey, consumed alcohol:
o 1 week or less o Between 1 months and less than 3 months
Alcohol and Pregnancy Labelling Evaluation - Appendices 34
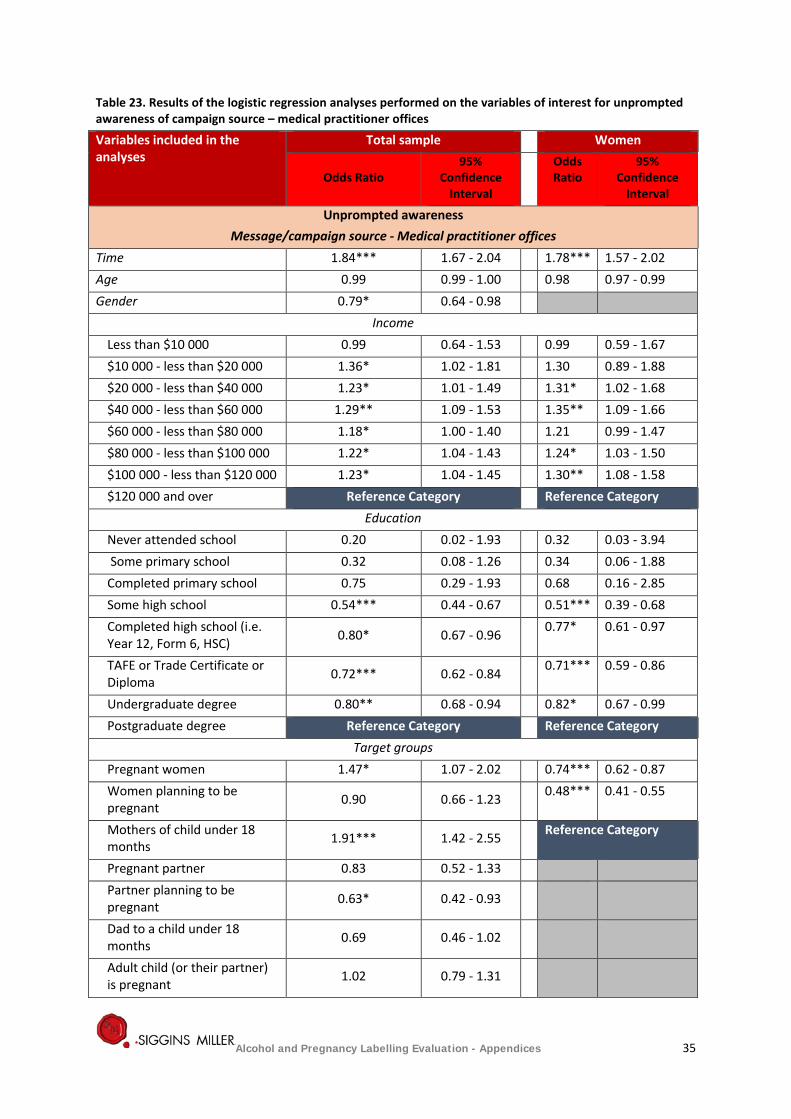
Table 23. Results of the logistic regression analyses performed on the variables of interest for unprompted awareness of campaign source – medical practitioner offices
Variables included in the analyses
Total sample Women
Odds Ratio 95%
Confidence Interval
Odds Ratio
95% Confidence
Interval
Unprompted awareness Message/campaign source - Medical practitioner offices
Time 1.84*** 1.67 - 2.04 1.78*** 1.57 - 2.02 Age 0.99 0.99 - 1.00 0.98 0.97 - 0.99 Gender 0.79* 0.64 - 0.98
Income Less than $10 000 0.99 0.64 - 1.53 0.99 0.59 - 1.67 $10 000 - less than $20 000 1.36* 1.02 - 1.81 1.30 0.89 - 1.88 $20 000 - less than $40 000 1.23* 1.01 - 1.49 1.31* 1.02 - 1.68 $40 000 - less than $60 000 1.29** 1.09 - 1.53 1.35** 1.09 - 1.66 $60 000 - less than $80 000 1.18* 1.00 - 1.40 1.21 0.99 - 1.47 $80 000 - less than $100 000 1.22* 1.04 - 1.43 1.24* 1.03 - 1.50 $100 000 - less than $120 000 1.23* 1.04 - 1.45 1.30** 1.08 - 1.58 $120 000 and over Reference Category Reference Category
Education Never attended school 0.20 0.02 - 1.93 0.32 0.03 - 3.94 Some primary school 0.32 0.08 - 1.26 0.34 0.06 - 1.88 Completed primary school 0.75 0.29 - 1.93 0.68 0.16 - 2.85 Some high school 0.54*** 0.44 - 0.67 0.51*** 0.39 - 0.68 Completed high school (i.e. Year 12, Form 6, HSC) 0.80* 0.67 - 0.96 0.77* 0.61 - 0.97
TAFE or Trade Certificate or Diploma 0.72*** 0.62 - 0.84 0.71*** 0.59 - 0.86
Undergraduate degree 0.80** 0.68 - 0.94 0.82* 0.67 - 0.99 Postgraduate degree Reference Category Reference Category
Target groups Pregnant women 1.47* 1.07 - 2.02 0.74*** 0.62 - 0.87 Women planning to be pregnant 0.90 0.66 - 1.23 0.48*** 0.41 - 0.55
Mothers of child under 18 months 1.91*** 1.42 - 2.55 Reference Category
Pregnant partner 0.83 0.52 - 1.33 Partner planning to be pregnant 0.63* 0.42 - 0.93
Dad to a child under 18 months 0.69 0.46 - 1.02
Adult child (or their partner) is pregnant 1.02 0.79 - 1.31
Alcohol and Pregnancy Labelling Evaluation - Appendices 35
Variables included in the analyses
Total sample Women
Odds Ratio 95%
Confidence Interval
Odds Ratio
95% Confidence
Interval
Adult child (or their partner is planning to become pregnant)
1.14 0.89 - 1.44
My adult child has a child under 18 months of age Reference Category
Alcohol Use 1 week or less 1.15 0.96 - 1.38 1.08 0.88 - 1.33 More than 1 week, less than 2 weeks 1.04 0.83 - 1.30 1.08 0.83 - 1.41
2 weeks to less than 1 month 1.13 0.90 - 1.43 1.23 0.94 - 1.61 1 month to less than 3 months 0.83 0.67 - 1.05 0.86 0.67 - 1.11
3 months to less than 12 months 1.21 0.98 - 1.49 1.29* 1.03 - 1.63
12 months 1.20 0.87 - 1.66 1.15 0.82 - 1.62 More than 12 months Reference Category Reference Category
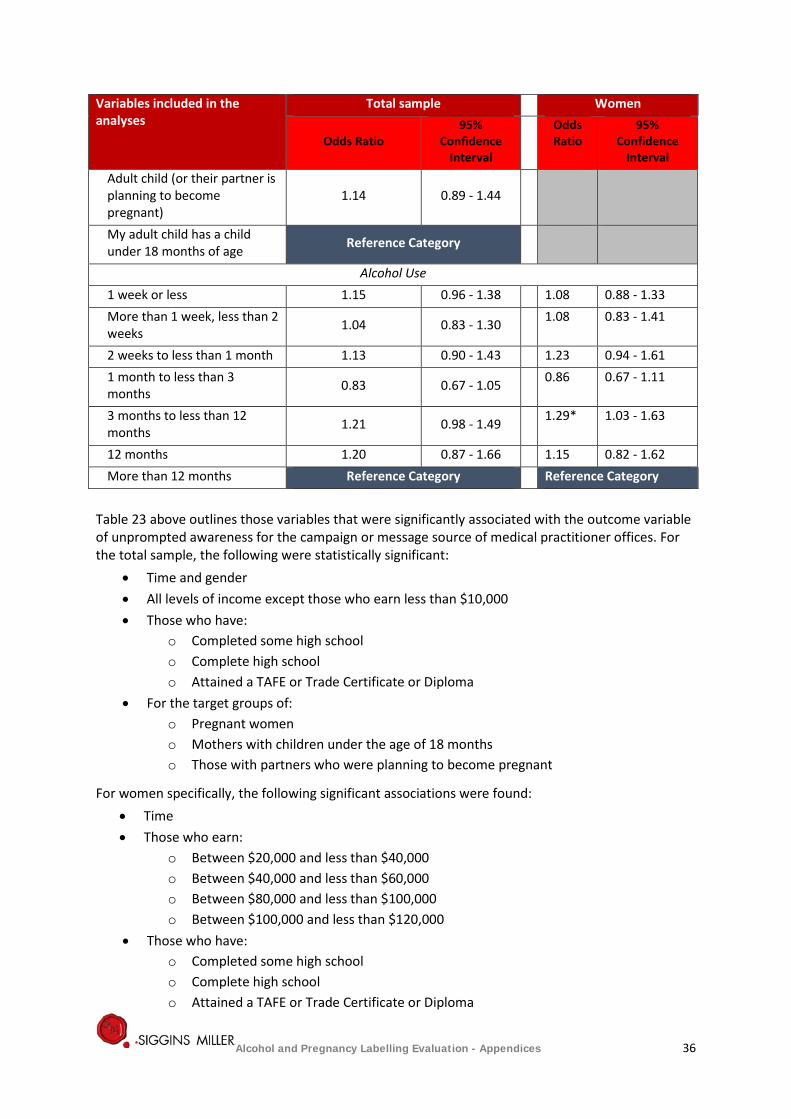
Table 23 above outlines those variables that were significantly associated with the outcome variable of unprompted awareness for the campaign or message source of medical practitioner offices. For the total sample, the following were statistically significant:
• Time and gender • All levels of income except those who earn less than $10,000 • Those who have:
o Completed some high school o Complete high school o Attained a TAFE or Trade Certificate or Diploma
• For the target groups of: o Pregnant women o Mothers with children under the age of 18 months o Those with partners who were planning to become pregnant
For women specifically, the following significant associations were found: • Time • Those who earn:
o Between $20,000 and less than $40,000 o Between $40,000 and less than $60,000 o Between $80,000 and less than $100,000 o Between $100,000 and less than $120,000
• Those who have: o Completed some high school o Complete high school o Attained a TAFE or Trade Certificate or Diploma
Alcohol and Pregnancy Labelling Evaluation - Appendices 36
• Those who have: o Completed some high school o Complete high school o Attained a TAFE or Trade Certificate or Diploma
• For the target groups of pregnant women and women planning to become pregnant • Those who, prior to taking the survey, had last consumed alcohol between 3 months and
less than 12 months
Alcohol and Pregnancy Labelling Evaluation - Appendices 37

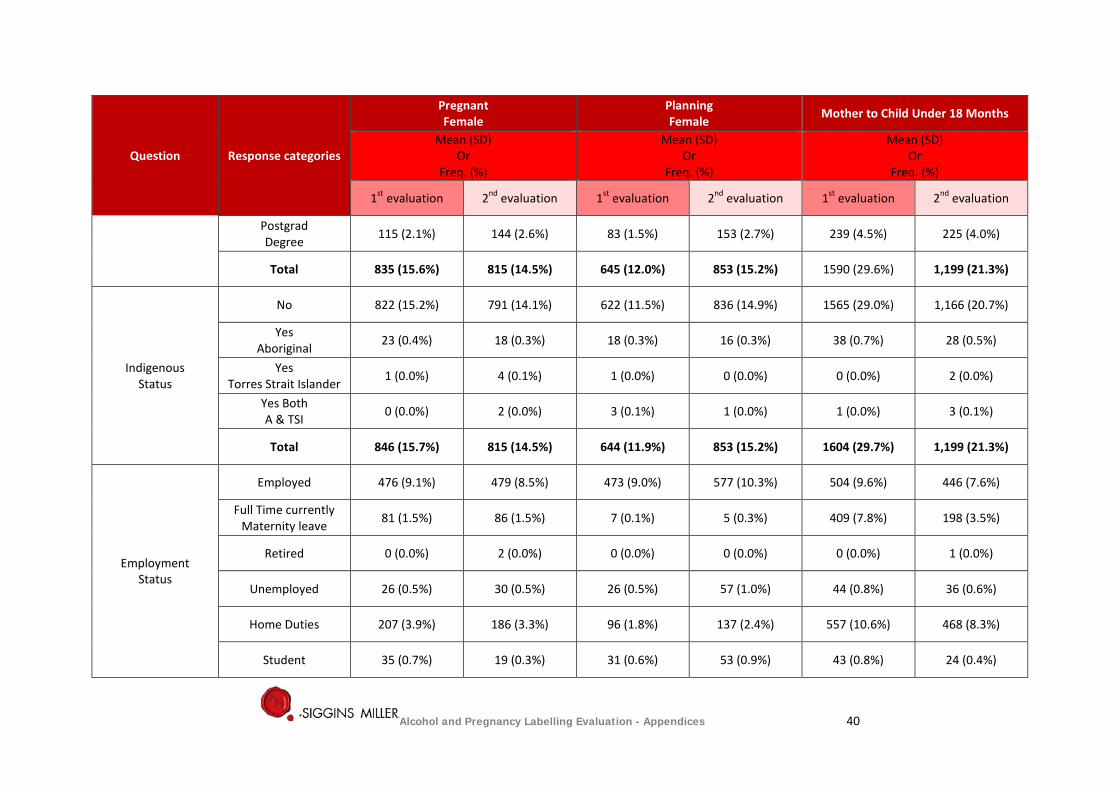
Table 24. Detailed analyses of quantitative responses by target group of women for the first and second evaluation
Question Response categories
Pregnant Female
Planning Female Mother to Child Under 18 Months
Mean (SD) Or
Freq. (%)
Mean (SD) Or
Freq. (%)
Mean (SD) Or
Freq. (%)
1st evaluation 2nd evaluation 1st evaluation 2nd evaluation 1st evaluation 2nd evaluation
Pregnant? How many weeks
pregnant? N/A 21.9 (10.4)
N=848 23.2 (10.1)
N=815 N/A N/A N/A N/A
Age What was your age at
your last birthday? N/A 29.1 (4.7)
N=848 31.2 (5.1)
N=815 29.9 (5.7)
N=648 31.3 (5.8)
N=853 29.7 (4.6) N=1606
32.3 (5.5) N=1,199
Household How many people
live in your household?
N/A 3.1 (1.3) N=843
3.0 (1.1) N=815
2.9 (1.3) N=646
2.9 (1.2) N=853
3.9 (1.1) N=1590
4.0 (1.1) N=1,199
Children 2 How many children
do you have? N/A 1.6 (1.2)
N=521 1.6 (0.9) N=466
1.6 (1.1) N=300
1.6 (0.8) N=359
1.8 (1.0) N=1575
2.0 (1.0) N=1,199
Children 4 How old is your
youngest child in months?
N/A 13.1 (4.6) N=129
13.0 (5.8) N=100
10.5 (6.2) N=57
13.6 (5.2) N=64
8.8 (5.2) N=1531
9.7 (5.2) N=1,105
Alcohol and Pregnancy Labelling Evaluation - Appendices 38

Question Response categories
Pregnant Female
Planning Female Mother to Child Under 18 Months
Mean (SD) Or
Freq. (%)
Mean (SD) Or
Freq. (%)
Mean (SD) Or
Freq. (%)
1st evaluation 2nd evaluation 1st evaluation 2nd evaluation 1st evaluation 2nd evaluation
Relationship Status
Single 32 (0.6%) 39 (0.7%) 43 (0.8%) 123 (2.2%) 66 (1.2%) 45 (0.8%)
Married/ De Facto 807 (14.9%) 764 (14.4%) 598 (11.0%) 720 (13.5%) 1507 (27.8%) 1,128 (21.2%)
Separated 6 (0.1%) 9 (0.2%) 4 (0.1%) 4 (0.1%) 29 (0.5%) 24 (0.4%)
Divorced 3 (0.1%) 3 (0.1%) 3 (0.1%) 5 (0.1%) 4 (0.1%) 1 (0.0%)
Widowed 0 (0.0%) 0 (0.0%) 0 (0.0%) 1 (0.0%) 0 (0.0%) 1 (0.0%)
Total 848 (15.6%) 815 (14.5%) 648 (11.9%) 853 (15.2%) 1606 (29.6%) 1,199 (21.3%)
Education Level
Never Attended 1 (0.0%) 0 (0.0%) 1 (0.0%) 0 (0.0%) 0 (0.0%) 2 (0.0%)
Some Primary 3 (0.1%) 3 (0.1%) 1 (0.0%) 1 (0.0%) 1 (0.0%) 0 (0.0%)
Completed Primary 1 (0.0%) 1 (0.0%) 2 (0.0%) 1 (0.0%) 1 (0.0%) 3 (0.1%)
Some High School 52 (1.0%) 45 (0.8%) 43 (0.8%) 45 (0.8%) 147 (2.7%) 79 (1.4%)
Completed High School 140 (2.6%) 120 (216%) 100 (1.9%) 108 (1.9%) 222 (4.1%) 150 (2.7%)
TAFE or Trade Cert 316 (5.9%) 281 (5.0%) 233 (4.3%) 255 (4.5%) 541 (10.1%) 395(7.0%)
Undergrad Degree 207 (3.9%) 216 (3.8%) 182 (3.4%) 284 (5.1%) 439 (8.2%) 340 (6.0%)
Alcohol and Pregnancy Labelling Evaluation - Appendices 39
Question Response categories
Pregnant Female
Planning Female Mother to Child Under 18 Months
Mean (SD) Or
Freq. (%)
Mean (SD) Or
Freq. (%)
Mean (SD) Or
Freq. (%)
1st evaluation 2nd evaluation 1st evaluation 2nd evaluation 1st evaluation 2nd evaluation
Postgrad Degree 115 (2.1%) 144 (2.6%) 83 (1.5%) 153 (2.7%) 239 (4.5%) 225 (4.0%)
Total 835 (15.6%) 815 (14.5%) 645 (12.0%) 853 (15.2%) 1590 (29.6%) 1,199 (21.3%)
Indigenous Status
No 822 (15.2%) 791 (14.1%) 622 (11.5%) 836 (14.9%) 1565 (29.0%) 1,166 (20.7%)
Yes Aboriginal 23 (0.4%) 18 (0.3%) 18 (0.3%) 16 (0.3%) 38 (0.7%) 28 (0.5%)
Yes Torres Strait Islander 1 (0.0%) 4 (0.1%) 1 (0.0%) 0 (0.0%) 0 (0.0%) 2 (0.0%)
Yes Both A & TSI 0 (0.0%) 2 (0.0%) 3 (0.1%) 1 (0.0%) 1 (0.0%) 3 (0.1%)
Total 846 (15.7%) 815 (14.5%) 644 (11.9%) 853 (15.2%) 1604 (29.7%) 1,199 (21.3%)
Employment Status
Employed 476 (9.1%) 479 (8.5%) 473 (9.0%) 577 (10.3%) 504 (9.6%) 446 (7.6%)
Full Time currently Maternity leave 81 (1.5%) 86 (1.5%) 7 (0.1%) 5 (0.3%) 409 (7.8%) 198 (3.5%)
Retired 0 (0.0%) 2 (0.0%) 0 (0.0%) 0 (0.0%) 0 (0.0%) 1 (0.0%)
Unemployed 26 (0.5%) 30 (0.5%) 26 (0.5%) 57 (1.0%) 44 (0.8%) 36 (0.6%)
Home Duties 207 (3.9%) 186 (3.3%) 96 (1.8%) 137 (2.4%) 557 (10.6%) 468 (8.3%)
Student 35 (0.7%) 19 (0.3%) 31 (0.6%) 53 (0.9%) 43 (0.8%) 24 (0.4%)
Alcohol and Pregnancy Labelling Evaluation - Appendices 40
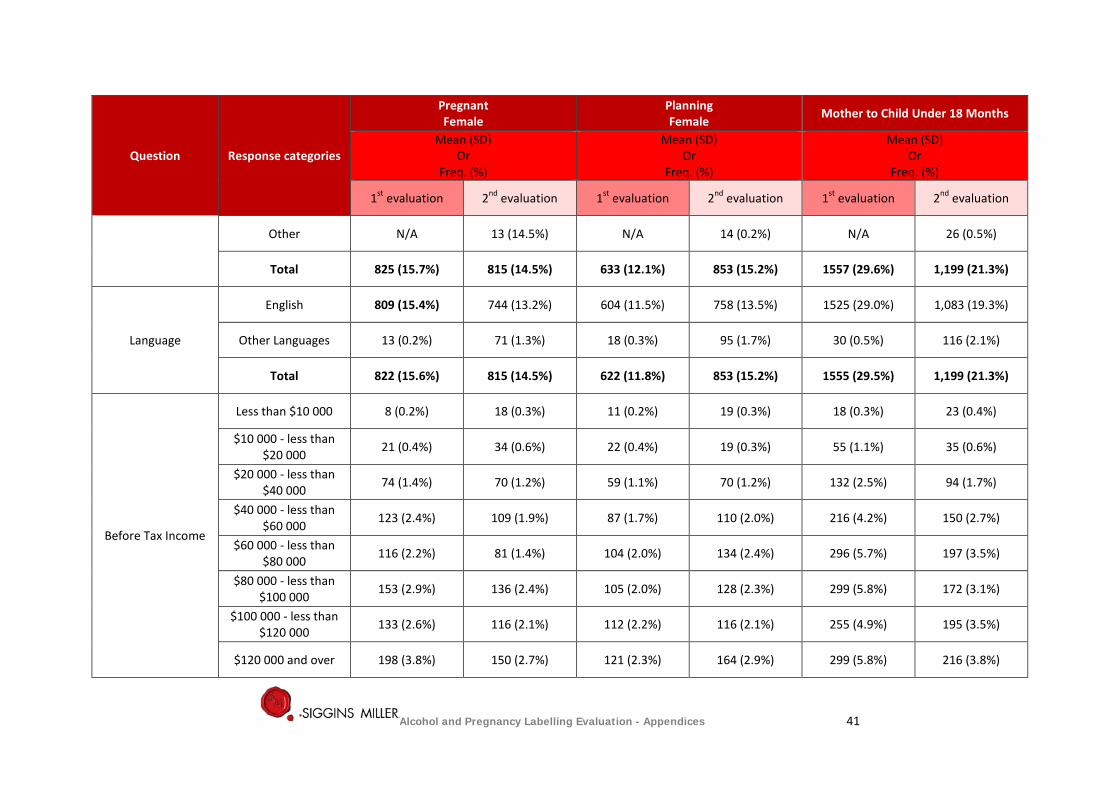
Question Response categories
Pregnant Female
Planning Female Mother to Child Under 18 Months
Mean (SD) Or
Freq. (%)
Mean (SD) Or
Freq. (%)
Mean (SD) Or
Freq. (%)
1st evaluation 2nd evaluation 1st evaluation 2nd evaluation 1st evaluation 2nd evaluation
Other N/A 13 (14.5%) N/A 14 (0.2%) N/A 26 (0.5%)
Total 825 (15.7%) 815 (14.5%) 633 (12.1%) 853 (15.2%) 1557 (29.6%) 1,199 (21.3%)
Language
English 809 (15.4%) 744 (13.2%) 604 (11.5%) 758 (13.5%) 1525 (29.0%) 1,083 (19.3%)
Other Languages 13 (0.2%) 71 (1.3%) 18 (0.3%) 95 (1.7%) 30 (0.5%) 116 (2.1%)
Total 822 (15.6%) 815 (14.5%) 622 (11.8%) 853 (15.2%) 1555 (29.5%) 1,199 (21.3%)
Before Tax Income
Less than $10 000 8 (0.2%) 18 (0.3%) 11 (0.2%) 19 (0.3%) 18 (0.3%) 23 (0.4%)
$10 000 - less than $20 000 21 (0.4%) 34 (0.6%) 22 (0.4%) 19 (0.3%) 55 (1.1%) 35 (0.6%)
$20 000 - less than $40 000 74 (1.4%) 70 (1.2%) 59 (1.1%) 70 (1.2%) 132 (2.5%) 94 (1.7%)
$40 000 - less than $60 000 123 (2.4%) 109 (1.9%) 87 (1.7%) 110 (2.0%) 216 (4.2%) 150 (2.7%)
$60 000 - less than $80 000 116 (2.2%) 81 (1.4%) 104 (2.0%) 134 (2.4%) 296 (5.7%) 197 (3.5%)
$80 000 - less than $100 000 153 (2.9%) 136 (2.4%) 105 (2.0%) 128 (2.3%) 299 (5.8%) 172 (3.1%)
$100 000 - less than $120 000 133 (2.6%) 116 (2.1%) 112 (2.2%) 116 (2.1%) 255 (4.9%) 195 (3.5%)
$120 000 and over 198 (3.8%) 150 (2.7%) 121 (2.3%) 164 (2.9%) 299 (5.8%) 216 (3.8%)
Alcohol and Pregnancy Labelling Evaluation - Appendices 41
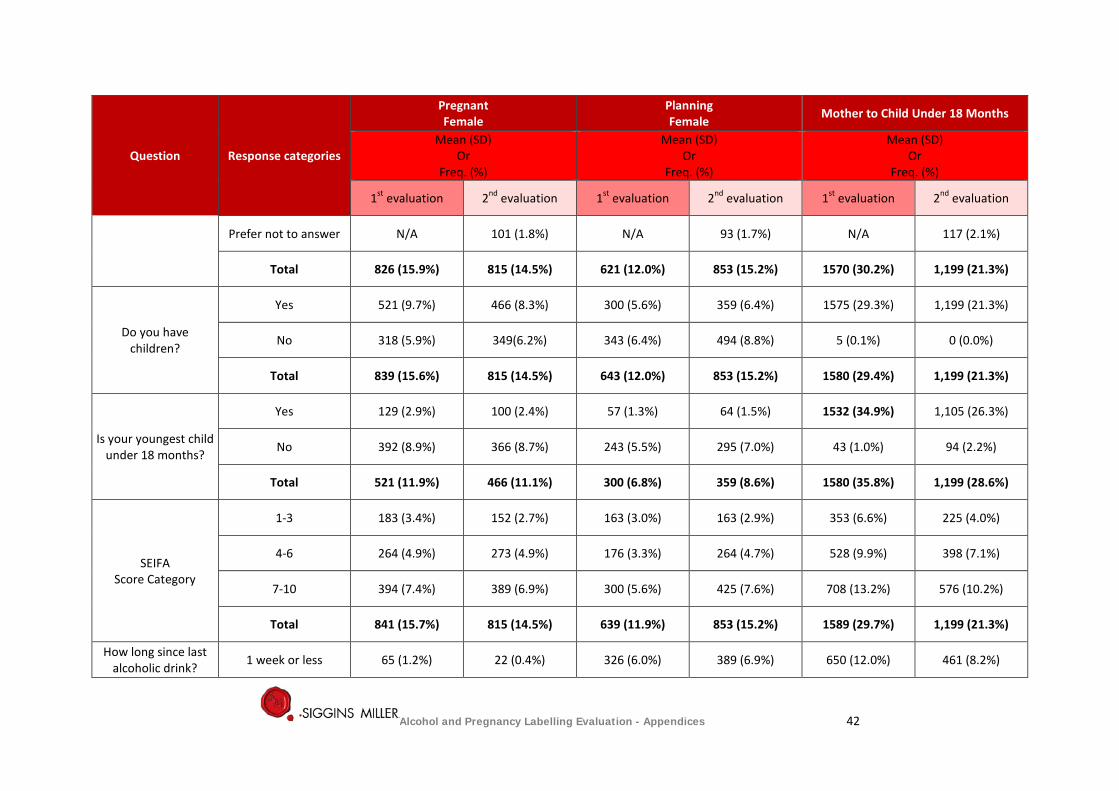
Question Response categories
Pregnant Female
Planning Female Mother to Child Under 18 Months
Mean (SD) Or
Freq. (%)
Mean (SD) Or
Freq. (%)
Mean (SD) Or
Freq. (%)
1st evaluation 2nd evaluation 1st evaluation 2nd evaluation 1st evaluation 2nd evaluation
Prefer not to answer N/A 101 (1.8%) N/A 93 (1.7%) N/A 117 (2.1%)
Total 826 (15.9%) 815 (14.5%) 621 (12.0%) 853 (15.2%) 1570 (30.2%) 1,199 (21.3%)
Do you have children?
Yes 521 (9.7%) 466 (8.3%) 300 (5.6%) 359 (6.4%) 1575 (29.3%) 1,199 (21.3%)
No 318 (5.9%) 349(6.2%) 343 (6.4%) 494 (8.8%) 5 (0.1%) 0 (0.0%)
Total 839 (15.6%) 815 (14.5%) 643 (12.0%) 853 (15.2%) 1580 (29.4%) 1,199 (21.3%)
Is your youngest child under 18 months?
Yes 129 (2.9%) 100 (2.4%) 57 (1.3%) 64 (1.5%) 1532 (34.9%) 1,105 (26.3%)
No 392 (8.9%) 366 (8.7%) 243 (5.5%) 295 (7.0%) 43 (1.0%) 94 (2.2%)
Total 521 (11.9%) 466 (11.1%) 300 (6.8%) 359 (8.6%) 1580 (35.8%) 1,199 (28.6%)
SEIFA Score Category
1-3 183 (3.4%) 152 (2.7%) 163 (3.0%) 163 (2.9%) 353 (6.6%) 225 (4.0%)
4-6 264 (4.9%) 273 (4.9%) 176 (3.3%) 264 (4.7%) 528 (9.9%) 398 (7.1%)
7-10 394 (7.4%) 389 (6.9%) 300 (5.6%) 425 (7.6%) 708 (13.2%) 576 (10.2%)
Total 841 (15.7%) 815 (14.5%) 639 (11.9%) 853 (15.2%) 1589 (29.7%) 1,199 (21.3%)
How long since last alcoholic drink? 1 week or less 65 (1.2%) 22 (0.4%) 326 (6.0%) 389 (6.9%) 650 (12.0%) 461 (8.2%)
Alcohol and Pregnancy Labelling Evaluation - Appendices 42
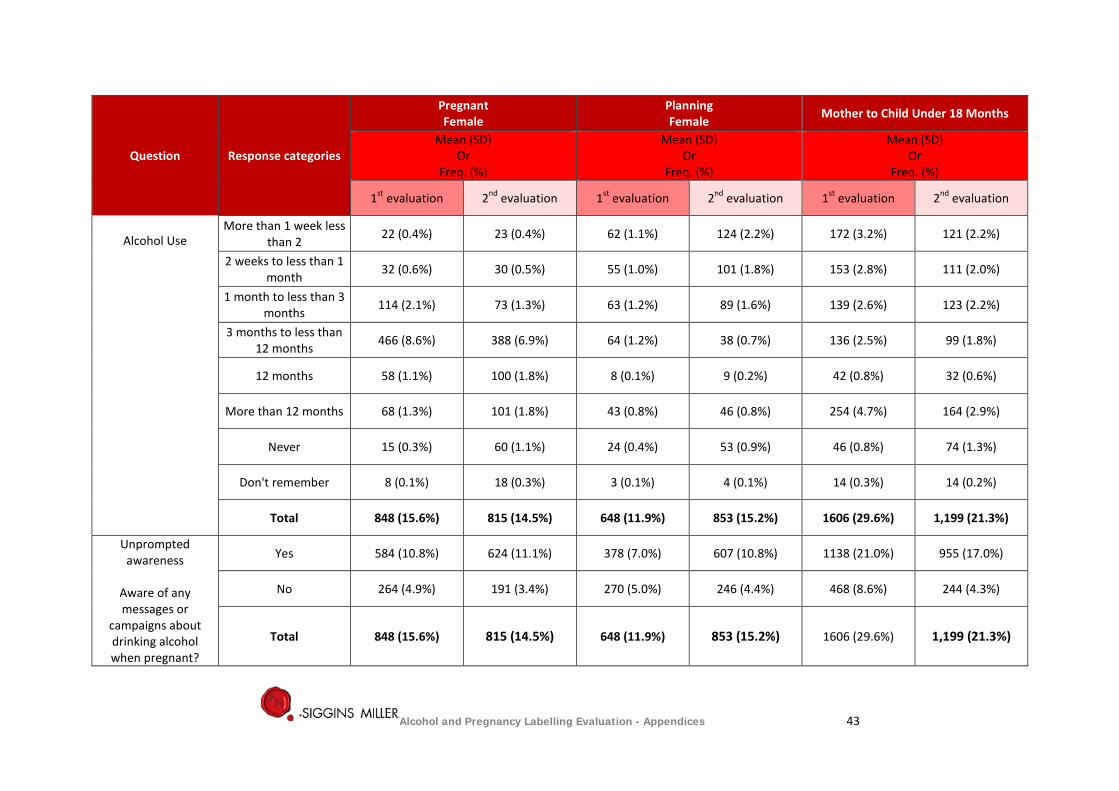
Question Response categories
Pregnant Female
Planning Female Mother to Child Under 18 Months
Mean (SD) Or
Freq. (%)
Mean (SD) Or
Freq. (%)
Mean (SD) Or
Freq. (%)
1st evaluation 2nd evaluation 1st evaluation 2nd evaluation 1st evaluation 2nd evaluation
Alcohol Use
More than 1 week less than 2 22 (0.4%) 23 (0.4%) 62 (1.1%) 124 (2.2%) 172 (3.2%) 121 (2.2%)
2 weeks to less than 1 month 32 (0.6%) 30 (0.5%) 55 (1.0%) 101 (1.8%) 153 (2.8%) 111 (2.0%)
1 month to less than 3 months 114 (2.1%) 73 (1.3%) 63 (1.2%) 89 (1.6%) 139 (2.6%) 123 (2.2%)
3 months to less than 12 months 466 (8.6%) 388 (6.9%) 64 (1.2%) 38 (0.7%) 136 (2.5%) 99 (1.8%)
12 months 58 (1.1%) 100 (1.8%) 8 (0.1%) 9 (0.2%) 42 (0.8%) 32 (0.6%)
More than 12 months 68 (1.3%) 101 (1.8%) 43 (0.8%) 46 (0.8%) 254 (4.7%) 164 (2.9%)
Never 15 (0.3%) 60 (1.1%) 24 (0.4%) 53 (0.9%) 46 (0.8%) 74 (1.3%)
Don't remember 8 (0.1%) 18 (0.3%) 3 (0.1%) 4 (0.1%) 14 (0.3%) 14 (0.2%)
Total 848 (15.6%) 815 (14.5%) 648 (11.9%) 853 (15.2%) 1606 (29.6%) 1,199 (21.3%)
Unprompted awareness
Aware of any messages or
campaigns about drinking alcohol when pregnant?
Yes 584 (10.8%) 624 (11.1%) 378 (7.0%) 607 (10.8%) 1138 (21.0%) 955 (17.0%)
No 264 (4.9%) 191 (3.4%) 270 (5.0%) 246 (4.4%) 468 (8.6%) 244 (4.3%)
Total 848 (15.6%) 815 (14.5%) 648 (11.9%) 853 (15.2%) 1606 (29.6%) 1,199 (21.3%)
Alcohol and Pregnancy Labelling Evaluation - Appendices 43

Question Response categories
Pregnant Female
Planning Female Mother to Child Under 18 Months
Mean (SD) Or
Freq. (%)
Mean (SD) Or
Freq. (%)
Mean (SD) Or
Freq. (%)
1st evaluation 2nd evaluation 1st evaluation 2nd evaluation 1st evaluation 2nd evaluation
Where have you seen these messages or
campaigns?
On alcohol products
Not Selected 597 (11.0%) 330 (8.3%) 469 (8.6%) 320 (8.0%) 1125 (20.7%) 506 (12.7%)
Yes 251 (4.6%) 294 (7.4%) 179 (3.3%) 287 (7.2%) 481 (8.9%) 449 (11.2%)
Total 848 (15.6%) 624 (15.6%) 648 (11.9%) 607 (15.2%) 1606 (29.6%) 955 (23.9%)
Where have you seen these messages or
campaigns?
In licensed retail outlets
Not Selected 792 (14.6%) 544 (13.6%) 586 (10.8%) 518 (13.8%) 1475 (27.2%) 839 (21.0%)
Yes 56 (1.0%) 80 (2.0%) 62 (1.1%) 89 (2.2%) 131 (2.4%) 116 (2.9%)
Total 848 (15.6%) 624 (15.6%) 648 (11.9%) 607 (15.2%) 1606 (29.6%) 955 (23.9%)
Where have you seen these messages or
campaigns?
Other licensed outlets such as
services clubs, sports clubs etc.
Not Selected 802 (14.8%) 546 (13.7%) 599 (11.0%) 521 (13.0%) 1502 (27.7%) 834 (20.9%)
Yes 46 (0.8%) 78 (2.0%) 49 (0.9%) 86 (2.2%) 104 (1.9%) 121 (3.0%)
Total 848 (15.6%) 624 (15.6%) 648 (11.9%) 607 (15.2%) 1606 (29.6%) 955 (23.9%)
Where have you seen these messages or
campaigns?
Medical Practitioner Offices
Not Selected 433 (8.0%) 233 (5.6%) 403 (7.4%) 303 (7.6%) 729 (13.4%) 314 (7.9%)
Yes 415 (7.6%) 401 (10.0%) 245 (4.5%) 304 (7.6%) 877 (16.2%) 641 (16.0%)
Total 848 (15.6%) 624 (15.6%) 648 (11.9%) 607 (15.2%) 1606 (29.6%) 955 (23.9%)
Alcohol and Pregnancy Labelling Evaluation - Appendices 44
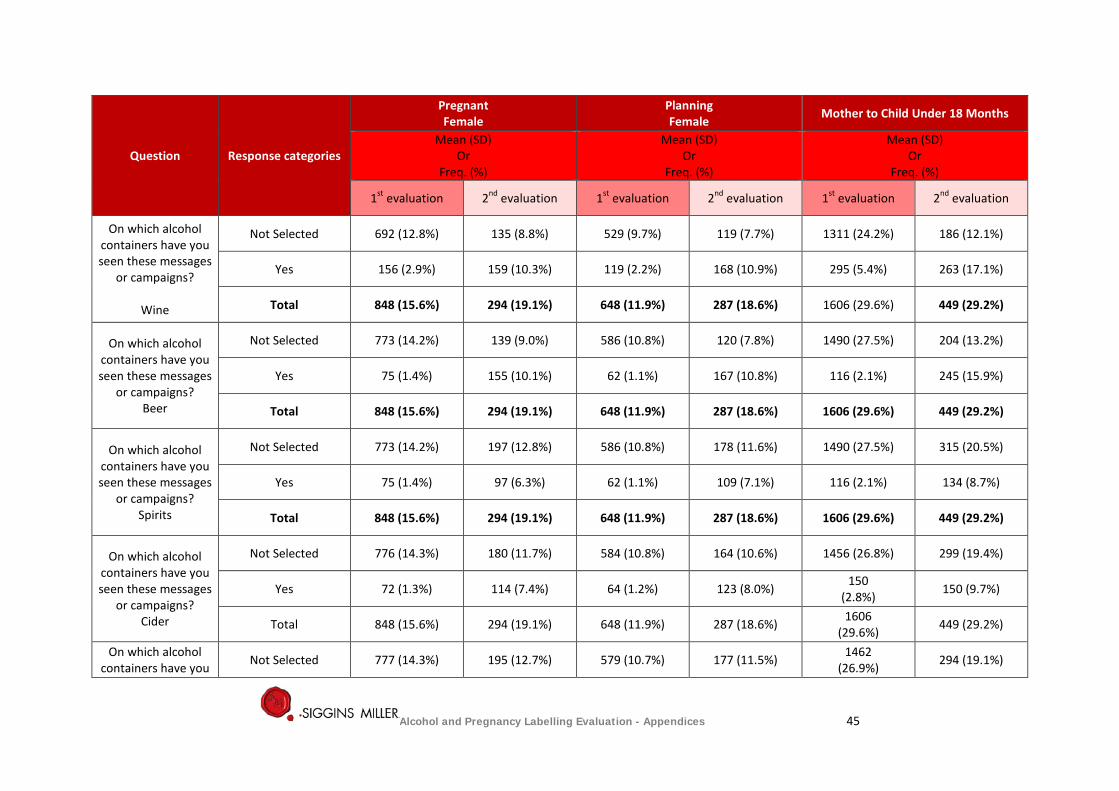
Question Response categories
Pregnant Female
Planning Female Mother to Child Under 18 Months
Mean (SD) Or
Freq. (%)
Mean (SD) Or
Freq. (%)
Mean (SD) Or
Freq. (%)
1st evaluation 2nd evaluation 1st evaluation 2nd evaluation 1st evaluation 2nd evaluation
On which alcohol containers have you seen these messages
or campaigns?
Wine
Not Selected 692 (12.8%) 135 (8.8%) 529 (9.7%) 119 (7.7%) 1311 (24.2%) 186 (12.1%)
Yes 156 (2.9%) 159 (10.3%) 119 (2.2%) 168 (10.9%) 295 (5.4%) 263 (17.1%)
Total 848 (15.6%) 294 (19.1%) 648 (11.9%) 287 (18.6%) 1606 (29.6%) 449 (29.2%)
On which alcohol containers have you seen these messages
or campaigns? Beer
Not Selected 773 (14.2%) 139 (9.0%) 586 (10.8%) 120 (7.8%) 1490 (27.5%) 204 (13.2%)
Yes 75 (1.4%) 155 (10.1%) 62 (1.1%) 167 (10.8%) 116 (2.1%) 245 (15.9%)
Total 848 (15.6%) 294 (19.1%) 648 (11.9%) 287 (18.6%) 1606 (29.6%) 449 (29.2%)
On which alcohol containers have you seen these messages
or campaigns? Spirits
Not Selected 773 (14.2%) 197 (12.8%) 586 (10.8%) 178 (11.6%) 1490 (27.5%) 315 (20.5%)
Yes 75 (1.4%) 97 (6.3%) 62 (1.1%) 109 (7.1%) 116 (2.1%) 134 (8.7%)
Total 848 (15.6%) 294 (19.1%) 648 (11.9%) 287 (18.6%) 1606 (29.6%) 449 (29.2%)
On which alcohol containers have you seen these messages
or campaigns? Cider
Not Selected 776 (14.3%) 180 (11.7%) 584 (10.8%) 164 (10.6%) 1456 (26.8%) 299 (19.4%)
Yes 72 (1.3%) 114 (7.4%) 64 (1.2%) 123 (8.0%) 150 (2.8%) 150 (9.7%)
Total 848 (15.6%) 294 (19.1%) 648 (11.9%) 287 (18.6%) 1606 (29.6%) 449 (29.2%)
On which alcohol containers have you Not Selected 777 (14.3%) 195 (12.7%) 579 (10.7%) 177 (11.5%) 1462
(26.9%) 294 (19.1%)
Alcohol and Pregnancy Labelling Evaluation - Appendices 45
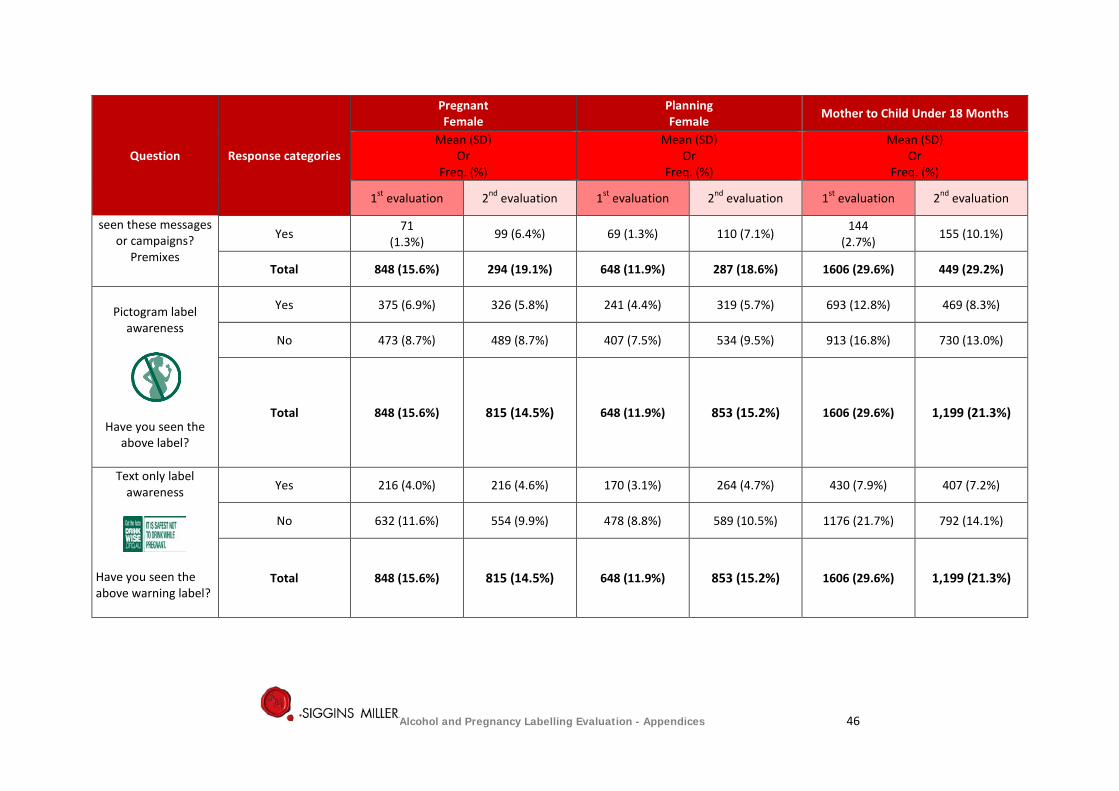
Question Response categories
Pregnant Female
Planning Female Mother to Child Under 18 Months
Mean (SD) Or
Freq. (%)
Mean (SD) Or
Freq. (%)
Mean (SD) Or
Freq. (%)
1st evaluation 2nd evaluation 1st evaluation 2nd evaluation 1st evaluation 2nd evaluation
seen these messages or campaigns?
Premixes
Yes 71 (1.3%) 99 (6.4%) 69 (1.3%) 110 (7.1%) 144
(2.7%) 155 (10.1%)
Total 848 (15.6%) 294 (19.1%) 648 (11.9%) 287 (18.6%) 1606 (29.6%) 449 (29.2%)
Pictogram label
awareness
Have you seen the above label?
Yes 375 (6.9%) 326 (5.8%) 241 (4.4%) 319 (5.7%) 693 (12.8%) 469 (8.3%)
No 473 (8.7%) 489 (8.7%) 407 (7.5%) 534 (9.5%) 913 (16.8%) 730 (13.0%)
Total 848 (15.6%) 815 (14.5%) 648 (11.9%) 853 (15.2%) 1606 (29.6%) 1,199 (21.3%)
Text only label awareness
Have you seen the above warning label?
Yes 216 (4.0%) 216 (4.6%) 170 (3.1%) 264 (4.7%) 430 (7.9%) 407 (7.2%)
No 632 (11.6%) 554 (9.9%) 478 (8.8%) 589 (10.5%) 1176 (21.7%) 792 (14.1%)
Total 848 (15.6%) 815 (14.5%) 648 (11.9%) 853 (15.2%) 1606 (29.6%) 1,199 (21.3%)
Alcohol and Pregnancy Labelling Evaluation - Appendices 46
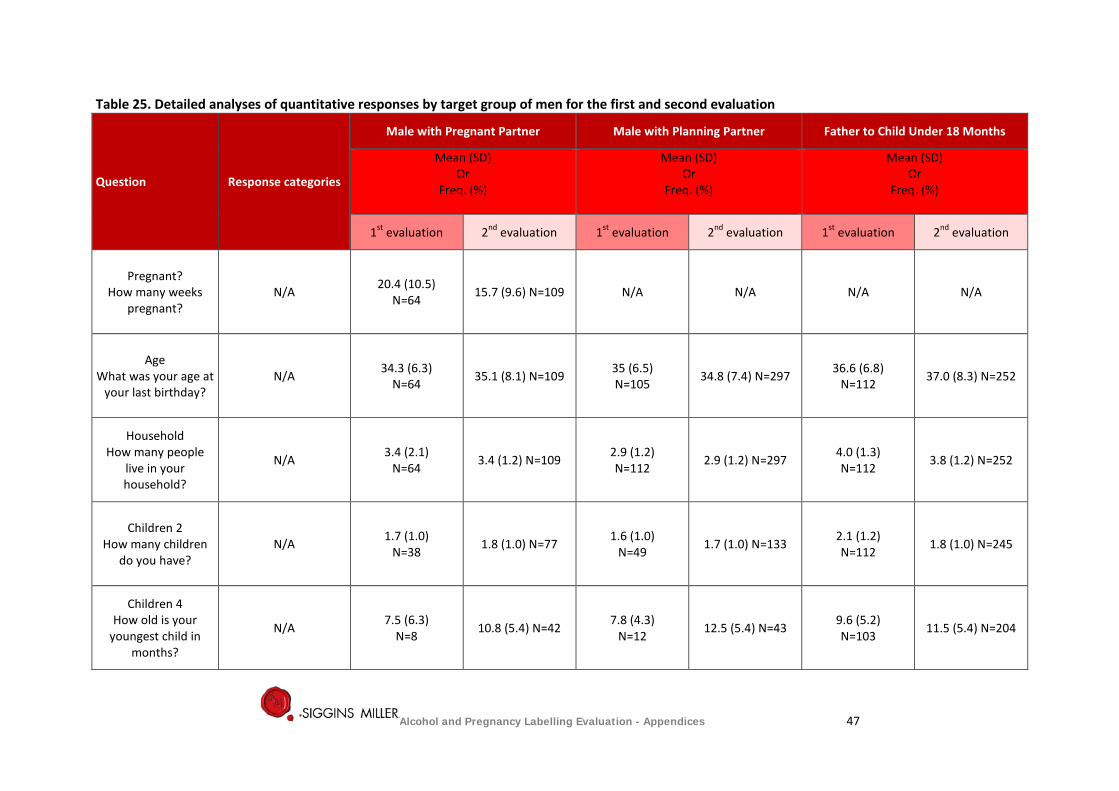
Table 25. Detailed analyses of quantitative responses by target group of men for the first and second evaluation
Question Response categories
Male with Pregnant Partner Male with Planning Partner Father to Child Under 18 Months
Mean (SD) Or
Freq. (%)
Mean (SD) Or
Freq. (%)
Mean (SD) Or
Freq. (%)
1st evaluation 2nd evaluation 1st evaluation 2nd evaluation 1st evaluation 2nd evaluation
Pregnant? How many weeks
pregnant? N/A 20.4 (10.5)
N=64 15.7 (9.6) N=109 N/A N/A N/A N/A
Age What was your age at
your last birthday? N/A 34.3 (6.3)
N=64 35.1 (8.1) N=109 35 (6.5) N=105 34.8 (7.4) N=297 36.6 (6.8)
N=112 37.0 (8.3) N=252
Household How many people
live in your household?
N/A 3.4 (2.1) N=64 3.4 (1.2) N=109 2.9 (1.2)
N=112 2.9 (1.2) N=297 4.0 (1.3) N=112 3.8 (1.2) N=252
Children 2 How many children
do you have? N/A 1.7 (1.0)
N=38 1.8 (1.0) N=77 1.6 (1.0) N=49 1.7 (1.0) N=133 2.1 (1.2)
N=112 1.8 (1.0) N=245
Children 4 How old is your
youngest child in months?
N/A 7.5 (6.3) N=8 10.8 (5.4) N=42 7.8 (4.3)
N=12 12.5 (5.4) N=43 9.6 (5.2) N=103 11.5 (5.4) N=204
Alcohol and Pregnancy Labelling Evaluation - Appendices 47
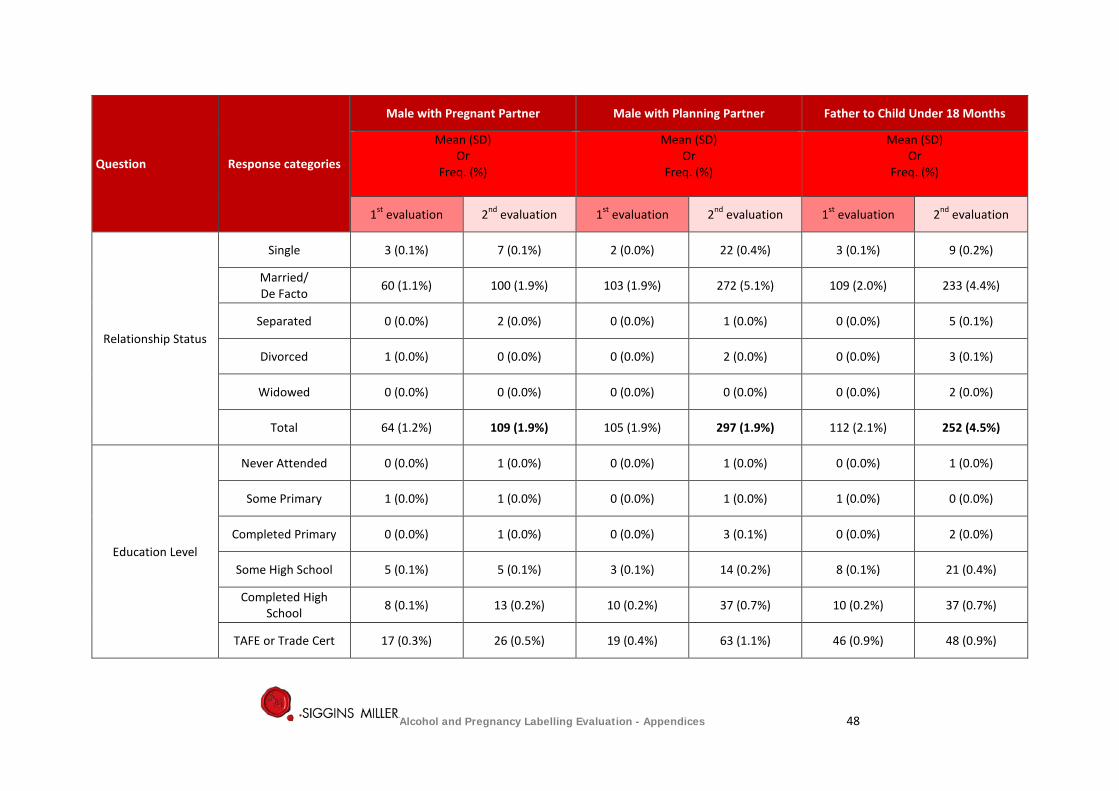
Question Response categories
Male with Pregnant Partner Male with Planning Partner Father to Child Under 18 Months
Mean (SD) Or
Freq. (%)
Mean (SD) Or
Freq. (%)
Mean (SD) Or
Freq. (%)
1st evaluation 2nd evaluation 1st evaluation 2nd evaluation 1st evaluation 2nd evaluation
Relationship Status
Single 3 (0.1%) 7 (0.1%) 2 (0.0%) 22 (0.4%) 3 (0.1%) 9 (0.2%)
Married/ De Facto 60 (1.1%) 100 (1.9%) 103 (1.9%) 272 (5.1%) 109 (2.0%) 233 (4.4%)
Separated 0 (0.0%) 2 (0.0%) 0 (0.0%) 1 (0.0%) 0 (0.0%) 5 (0.1%)
Divorced 1 (0.0%) 0 (0.0%) 0 (0.0%) 2 (0.0%) 0 (0.0%) 3 (0.1%)
Widowed 0 (0.0%) 0 (0.0%) 0 (0.0%) 0 (0.0%) 0 (0.0%) 2 (0.0%)
Total 64 (1.2%) 109 (1.9%) 105 (1.9%) 297 (1.9%) 112 (2.1%) 252 (4.5%)
Education Level
Never Attended 0 (0.0%) 1 (0.0%) 0 (0.0%) 1 (0.0%) 0 (0.0%) 1 (0.0%)
Some Primary 1 (0.0%) 1 (0.0%) 0 (0.0%) 1 (0.0%) 1 (0.0%) 0 (0.0%)
Completed Primary 0 (0.0%) 1 (0.0%) 0 (0.0%) 3 (0.1%) 0 (0.0%) 2 (0.0%)
Some High School 5 (0.1%) 5 (0.1%) 3 (0.1%) 14 (0.2%) 8 (0.1%) 21 (0.4%)
Completed High School 8 (0.1%) 13 (0.2%) 10 (0.2%) 37 (0.7%) 10 (0.2%) 37 (0.7%)
TAFE or Trade Cert 17 (0.3%) 26 (0.5%) 19 (0.4%) 63 (1.1%) 46 (0.9%) 48 (0.9%)
Alcohol and Pregnancy Labelling Evaluation - Appendices 48
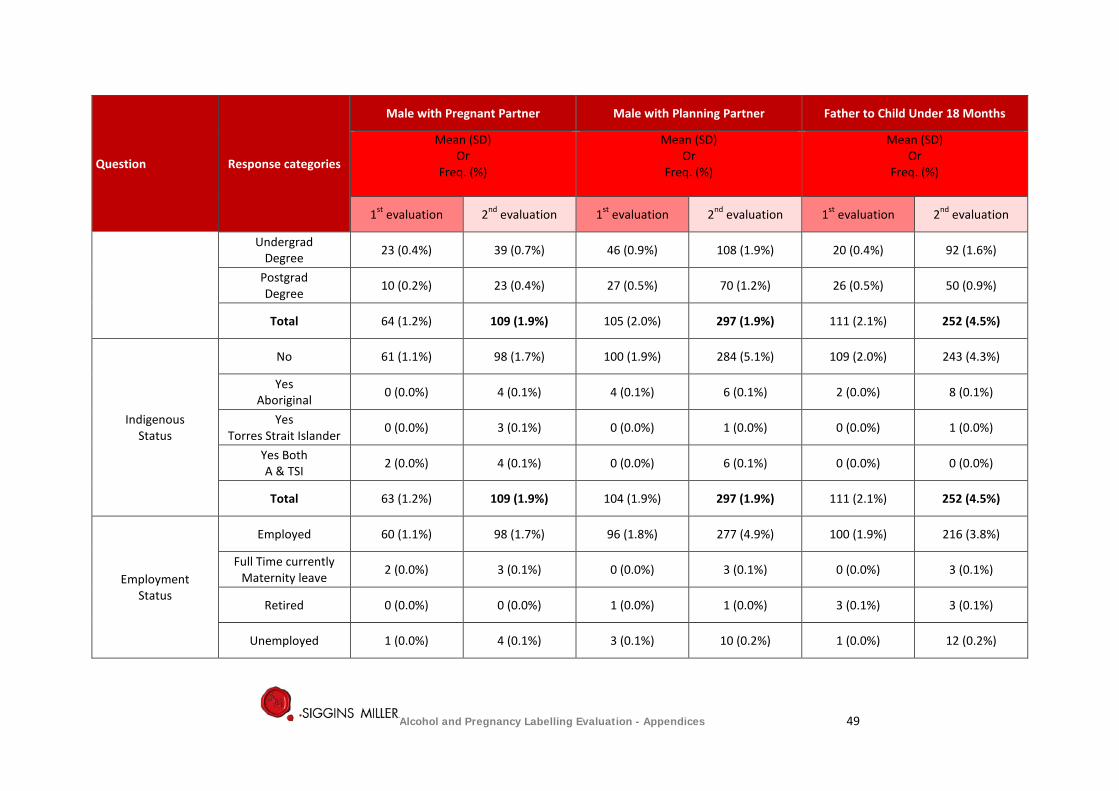
Question Response categories
Male with Pregnant Partner Male with Planning Partner Father to Child Under 18 Months
Mean (SD) Or
Freq. (%)
Mean (SD) Or
Freq. (%)
Mean (SD) Or
Freq. (%)
1st evaluation 2nd evaluation 1st evaluation 2nd evaluation 1st evaluation 2nd evaluation
Undergrad Degree 23 (0.4%) 39 (0.7%) 46 (0.9%) 108 (1.9%) 20 (0.4%) 92 (1.6%)
Postgrad Degree 10 (0.2%) 23 (0.4%) 27 (0.5%) 70 (1.2%) 26 (0.5%) 50 (0.9%)
Total 64 (1.2%) 109 (1.9%) 105 (2.0%) 297 (1.9%) 111 (2.1%) 252 (4.5%)
Indigenous Status
No 61 (1.1%) 98 (1.7%) 100 (1.9%) 284 (5.1%) 109 (2.0%) 243 (4.3%)
Yes Aboriginal 0 (0.0%) 4 (0.1%) 4 (0.1%) 6 (0.1%) 2 (0.0%) 8 (0.1%)
Yes Torres Strait Islander 0 (0.0%) 3 (0.1%) 0 (0.0%) 1 (0.0%) 0 (0.0%) 1 (0.0%)
Yes Both A & TSI 2 (0.0%) 4 (0.1%) 0 (0.0%) 6 (0.1%) 0 (0.0%) 0 (0.0%)
Total 63 (1.2%) 109 (1.9%) 104 (1.9%) 297 (1.9%) 111 (2.1%) 252 (4.5%)
Employment Status
Employed 60 (1.1%) 98 (1.7%) 96 (1.8%) 277 (4.9%) 100 (1.9%) 216 (3.8%)
Full Time currently Maternity leave 2 (0.0%) 3 (0.1%) 0 (0.0%) 3 (0.1%) 0 (0.0%) 3 (0.1%)
Retired 0 (0.0%) 0 (0.0%) 1 (0.0%) 1 (0.0%) 3 (0.1%) 3 (0.1%)
Unemployed 1 (0.0%) 4 (0.1%) 3 (0.1%) 10 (0.2%) 1 (0.0%) 12 (0.2%)
Alcohol and Pregnancy Labelling Evaluation - Appendices 49
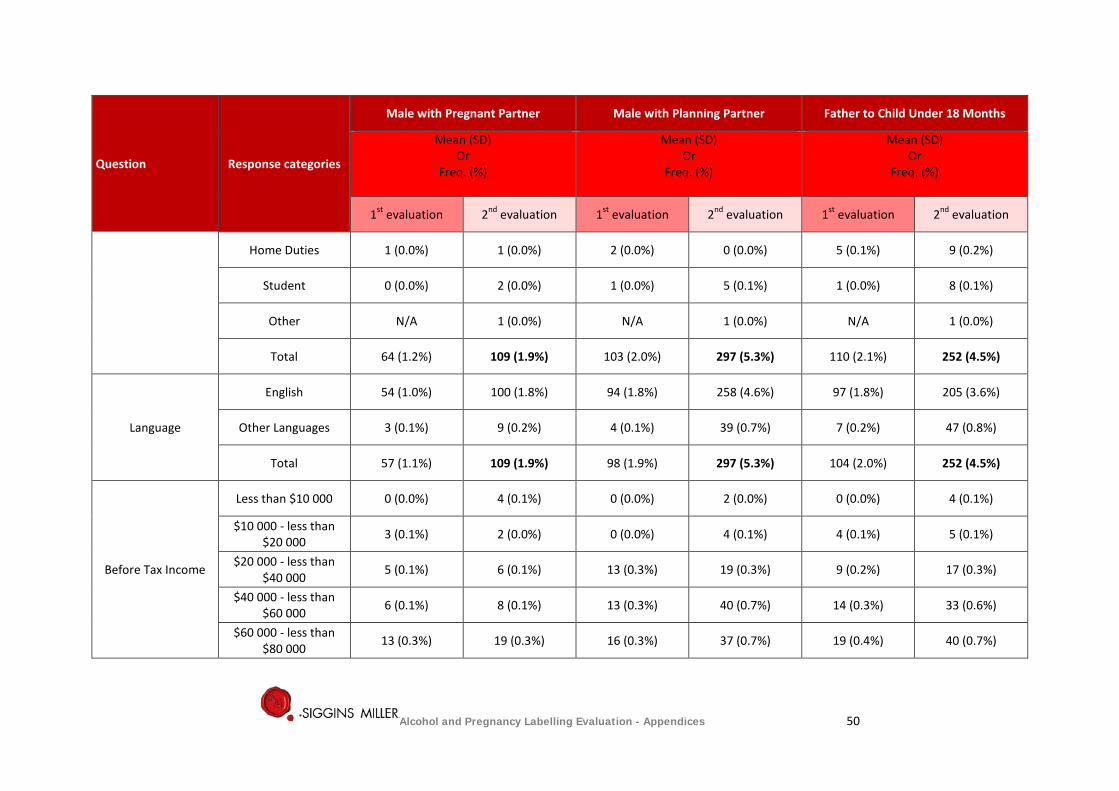
Question Response categories
Male with Pregnant Partner Male with Planning Partner Father to Child Under 18 Months
Mean (SD) Or
Freq. (%)
Mean (SD) Or
Freq. (%)
Mean (SD) Or
Freq. (%)
1st evaluation 2nd evaluation 1st evaluation 2nd evaluation 1st evaluation 2nd evaluation
Home Duties 1 (0.0%) 1 (0.0%) 2 (0.0%) 0 (0.0%) 5 (0.1%) 9 (0.2%)
Student 0 (0.0%) 2 (0.0%) 1 (0.0%) 5 (0.1%) 1 (0.0%) 8 (0.1%)
Other N/A 1 (0.0%) N/A 1 (0.0%) N/A 1 (0.0%)
Total 64 (1.2%) 109 (1.9%) 103 (2.0%) 297 (5.3%) 110 (2.1%) 252 (4.5%)
Language
English 54 (1.0%) 100 (1.8%) 94 (1.8%) 258 (4.6%) 97 (1.8%) 205 (3.6%)
Other Languages 3 (0.1%) 9 (0.2%) 4 (0.1%) 39 (0.7%) 7 (0.2%) 47 (0.8%)
Total 57 (1.1%) 109 (1.9%) 98 (1.9%) 297 (5.3%) 104 (2.0%) 252 (4.5%)
Before Tax Income
Less than $10 000 0 (0.0%) 4 (0.1%) 0 (0.0%) 2 (0.0%) 0 (0.0%) 4 (0.1%)
$10 000 - less than $20 000 3 (0.1%) 2 (0.0%) 0 (0.0%) 4 (0.1%) 4 (0.1%) 5 (0.1%)
$20 000 - less than $40 000 5 (0.1%) 6 (0.1%) 13 (0.3%) 19 (0.3%) 9 (0.2%) 17 (0.3%)
$40 000 - less than $60 000 6 (0.1%) 8 (0.1%) 13 (0.3%) 40 (0.7%) 14 (0.3%) 33 (0.6%)
$60 000 - less than $80 000 13 (0.3%) 19 (0.3%) 16 (0.3%) 37 (0.7%) 19 (0.4%) 40 (0.7%)
Alcohol and Pregnancy Labelling Evaluation - Appendices 50
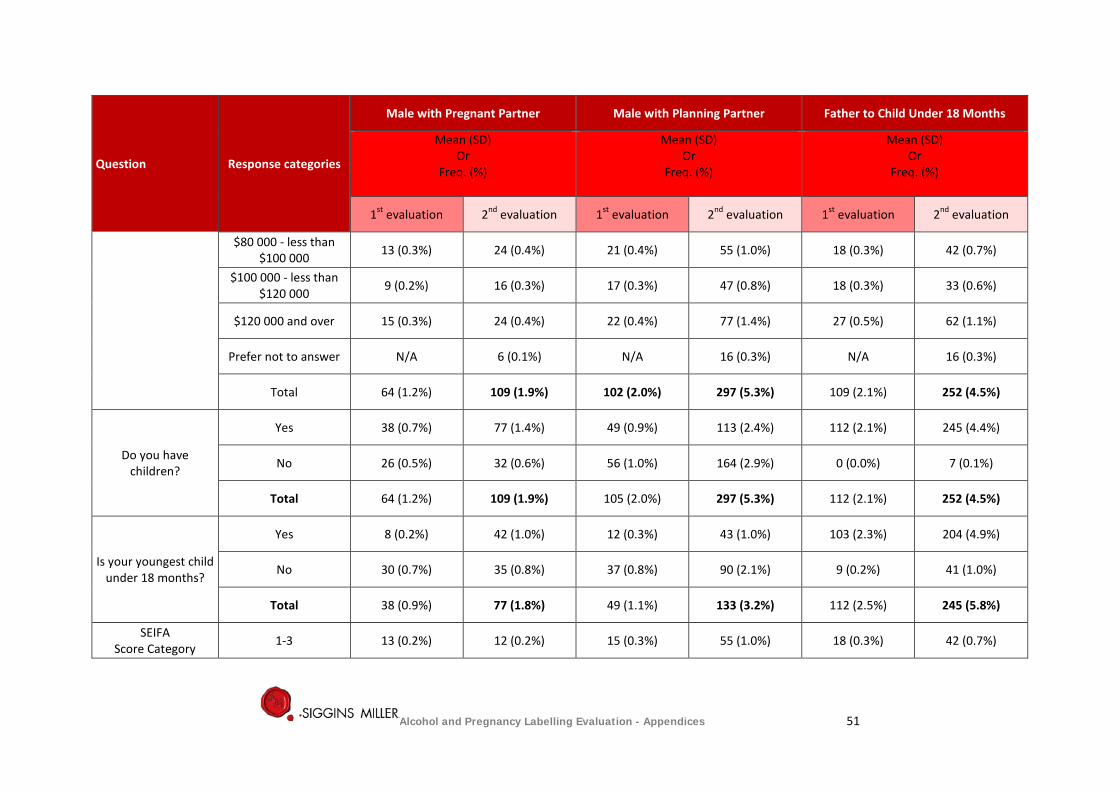
Question Response categories
Male with Pregnant Partner Male with Planning Partner Father to Child Under 18 Months
Mean (SD) Or
Freq. (%)
Mean (SD) Or
Freq. (%)
Mean (SD) Or
Freq. (%)
1st evaluation 2nd evaluation 1st evaluation 2nd evaluation 1st evaluation 2nd evaluation
$80 000 - less than $100 000 13 (0.3%) 24 (0.4%) 21 (0.4%) 55 (1.0%) 18 (0.3%) 42 (0.7%)
$100 000 - less than $120 000 9 (0.2%) 16 (0.3%) 17 (0.3%) 47 (0.8%) 18 (0.3%) 33 (0.6%)
$120 000 and over 15 (0.3%) 24 (0.4%) 22 (0.4%) 77 (1.4%) 27 (0.5%) 62 (1.1%)
Prefer not to answer N/A 6 (0.1%) N/A 16 (0.3%) N/A 16 (0.3%)
Total 64 (1.2%) 109 (1.9%) 102 (2.0%) 297 (5.3%) 109 (2.1%) 252 (4.5%)
Do you have children?
Yes 38 (0.7%) 77 (1.4%) 49 (0.9%) 113 (2.4%) 112 (2.1%) 245 (4.4%)
No 26 (0.5%) 32 (0.6%) 56 (1.0%) 164 (2.9%) 0 (0.0%) 7 (0.1%)
Total 64 (1.2%) 109 (1.9%) 105 (2.0%) 297 (5.3%) 112 (2.1%) 252 (4.5%)
Is your youngest child under 18 months?
Yes 8 (0.2%) 42 (1.0%) 12 (0.3%) 43 (1.0%) 103 (2.3%) 204 (4.9%)
No 30 (0.7%) 35 (0.8%) 37 (0.8%) 90 (2.1%) 9 (0.2%) 41 (1.0%)
Total 38 (0.9%) 77 (1.8%) 49 (1.1%) 133 (3.2%) 112 (2.5%) 245 (5.8%)
SEIFA Score Category 1-3 13 (0.2%) 12 (0.2%) 15 (0.3%) 55 (1.0%) 18 (0.3%) 42 (0.7%)
Alcohol and Pregnancy Labelling Evaluation - Appendices 51
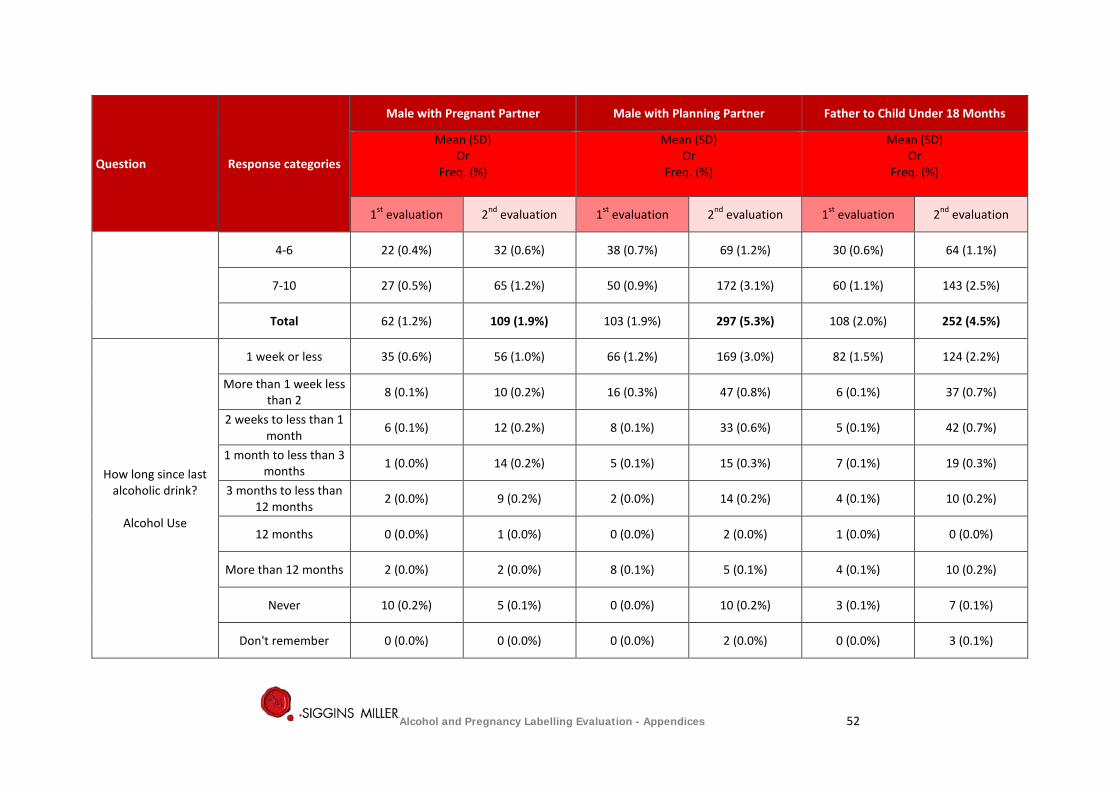
Question Response categories
Male with Pregnant Partner Male with Planning Partner Father to Child Under 18 Months
Mean (SD) Or
Freq. (%)
Mean (SD) Or
Freq. (%)
Mean (SD) Or
Freq. (%)
1st evaluation 2nd evaluation 1st evaluation 2nd evaluation 1st evaluation 2nd evaluation
4-6 22 (0.4%) 32 (0.6%) 38 (0.7%) 69 (1.2%) 30 (0.6%) 64 (1.1%)
7-10 27 (0.5%) 65 (1.2%) 50 (0.9%) 172 (3.1%) 60 (1.1%) 143 (2.5%)
Total 62 (1.2%) 109 (1.9%) 103 (1.9%) 297 (5.3%) 108 (2.0%) 252 (4.5%)
How long since last alcoholic drink?
Alcohol Use
1 week or less 35 (0.6%) 56 (1.0%) 66 (1.2%) 169 (3.0%) 82 (1.5%) 124 (2.2%)
More than 1 week less than 2 8 (0.1%) 10 (0.2%) 16 (0.3%) 47 (0.8%) 6 (0.1%) 37 (0.7%)
2 weeks to less than 1 month 6 (0.1%) 12 (0.2%) 8 (0.1%) 33 (0.6%) 5 (0.1%) 42 (0.7%)
1 month to less than 3 months 1 (0.0%) 14 (0.2%) 5 (0.1%) 15 (0.3%) 7 (0.1%) 19 (0.3%)
3 months to less than 12 months 2 (0.0%) 9 (0.2%) 2 (0.0%) 14 (0.2%) 4 (0.1%) 10 (0.2%)
12 months 0 (0.0%) 1 (0.0%) 0 (0.0%) 2 (0.0%) 1 (0.0%) 0 (0.0%)
More than 12 months 2 (0.0%) 2 (0.0%) 8 (0.1%) 5 (0.1%) 4 (0.1%) 10 (0.2%)
Never 10 (0.2%) 5 (0.1%) 0 (0.0%) 10 (0.2%) 3 (0.1%) 7 (0.1%)
Don't remember 0 (0.0%) 0 (0.0%) 0 (0.0%) 2 (0.0%) 0 (0.0%) 3 (0.1%)
Alcohol and Pregnancy Labelling Evaluation - Appendices 52
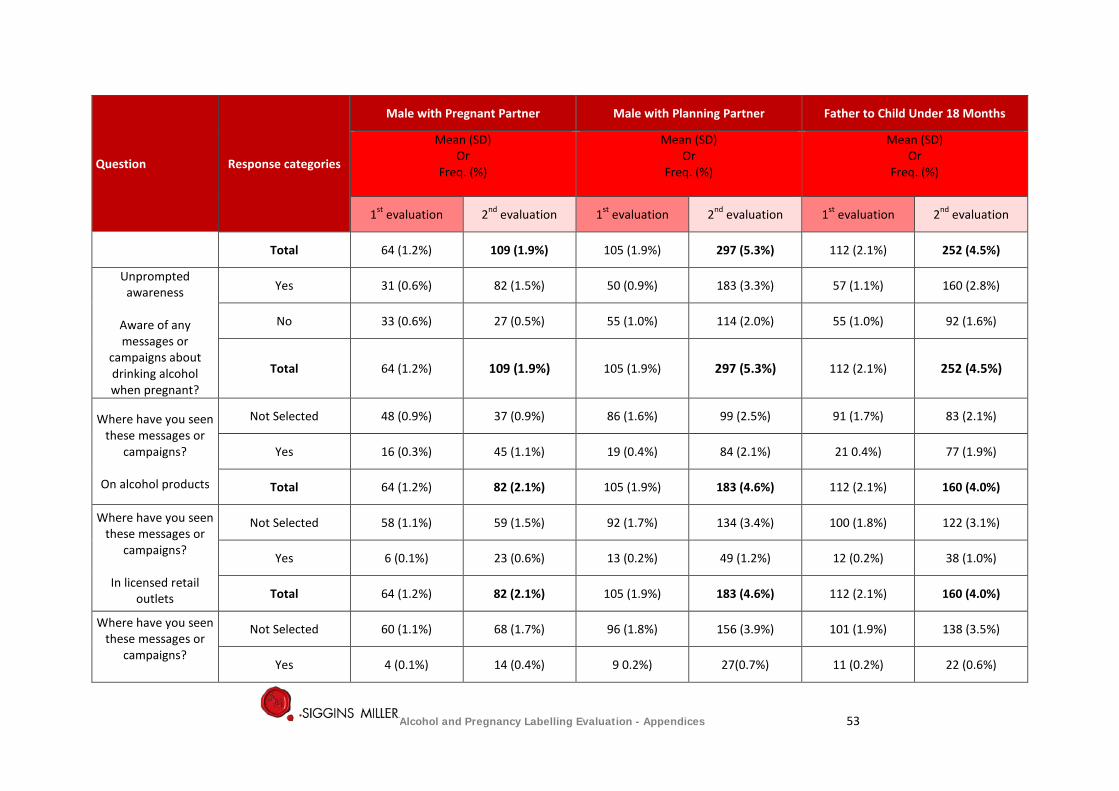
Question Response categories
Male with Pregnant Partner Male with Planning Partner Father to Child Under 18 Months
Mean (SD) Or
Freq. (%)
Mean (SD) Or
Freq. (%)
Mean (SD) Or
Freq. (%)
1st evaluation 2nd evaluation 1st evaluation 2nd evaluation 1st evaluation 2nd evaluation
Total 64 (1.2%) 109 (1.9%) 105 (1.9%) 297 (5.3%) 112 (2.1%) 252 (4.5%)
Unprompted awareness
Aware of any messages or
campaigns about drinking alcohol when pregnant?
Yes 31 (0.6%) 82 (1.5%) 50 (0.9%) 183 (3.3%) 57 (1.1%) 160 (2.8%)
No 33 (0.6%) 27 (0.5%) 55 (1.0%) 114 (2.0%) 55 (1.0%) 92 (1.6%)
Total 64 (1.2%) 109 (1.9%) 105 (1.9%) 297 (5.3%) 112 (2.1%) 252 (4.5%)
Where have you seen these messages or
campaigns?
On alcohol products
Not Selected 48 (0.9%) 37 (0.9%) 86 (1.6%) 99 (2.5%) 91 (1.7%) 83 (2.1%)
Yes 16 (0.3%) 45 (1.1%) 19 (0.4%) 84 (2.1%) 21 0.4%) 77 (1.9%)
Total 64 (1.2%) 82 (2.1%) 105 (1.9%) 183 (4.6%) 112 (2.1%) 160 (4.0%)
Where have you seen these messages or
campaigns?
In licensed retail outlets
Not Selected 58 (1.1%) 59 (1.5%) 92 (1.7%) 134 (3.4%) 100 (1.8%) 122 (3.1%)
Yes 6 (0.1%) 23 (0.6%) 13 (0.2%) 49 (1.2%) 12 (0.2%) 38 (1.0%)
Total 64 (1.2%) 82 (2.1%) 105 (1.9%) 183 (4.6%) 112 (2.1%) 160 (4.0%)
Where have you seen these messages or
campaigns?
Not Selected 60 (1.1%) 68 (1.7%) 96 (1.8%) 156 (3.9%) 101 (1.9%) 138 (3.5%)
Yes 4 (0.1%) 14 (0.4%) 9 0.2%) 27(0.7%) 11 (0.2%) 22 (0.6%)
Alcohol and Pregnancy Labelling Evaluation - Appendices 53
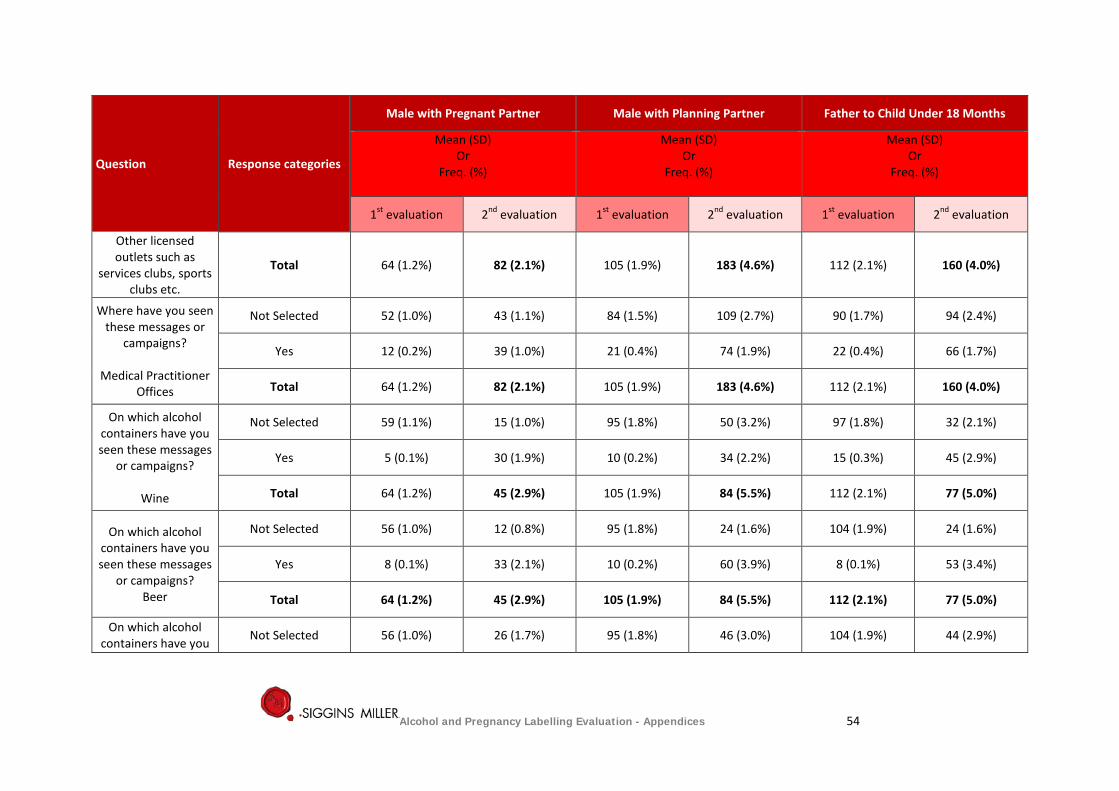
Question Response categories
Male with Pregnant Partner Male with Planning Partner Father to Child Under 18 Months
Mean (SD) Or
Freq. (%)
Mean (SD) Or
Freq. (%)
Mean (SD) Or
Freq. (%)
1st evaluation 2nd evaluation 1st evaluation 2nd evaluation 1st evaluation 2nd evaluation
Other licensed outlets such as
services clubs, sports clubs etc.
Total 64 (1.2%) 82 (2.1%) 105 (1.9%) 183 (4.6%) 112 (2.1%) 160 (4.0%)
Where have you seen these messages or
campaigns?
Medical Practitioner Offices
Not Selected 52 (1.0%) 43 (1.1%) 84 (1.5%) 109 (2.7%) 90 (1.7%) 94 (2.4%)
Yes 12 (0.2%) 39 (1.0%) 21 (0.4%) 74 (1.9%) 22 (0.4%) 66 (1.7%)
Total 64 (1.2%) 82 (2.1%) 105 (1.9%) 183 (4.6%) 112 (2.1%) 160 (4.0%)
On which alcohol containers have you seen these messages
or campaigns?
Wine
Not Selected 59 (1.1%) 15 (1.0%) 95 (1.8%) 50 (3.2%) 97 (1.8%) 32 (2.1%)
Yes 5 (0.1%) 30 (1.9%) 10 (0.2%) 34 (2.2%) 15 (0.3%) 45 (2.9%)
Total 64 (1.2%) 45 (2.9%) 105 (1.9%) 84 (5.5%) 112 (2.1%) 77 (5.0%)
On which alcohol containers have you seen these messages
or campaigns? Beer
Not Selected 56 (1.0%) 12 (0.8%) 95 (1.8%) 24 (1.6%) 104 (1.9%) 24 (1.6%)
Yes 8 (0.1%) 33 (2.1%) 10 (0.2%) 60 (3.9%) 8 (0.1%) 53 (3.4%)
Total 64 (1.2%) 45 (2.9%) 105 (1.9%) 84 (5.5%) 112 (2.1%) 77 (5.0%)
On which alcohol containers have you Not Selected 56 (1.0%) 26 (1.7%) 95 (1.8%) 46 (3.0%) 104 (1.9%) 44 (2.9%)
Alcohol and Pregnancy Labelling Evaluation - Appendices 54
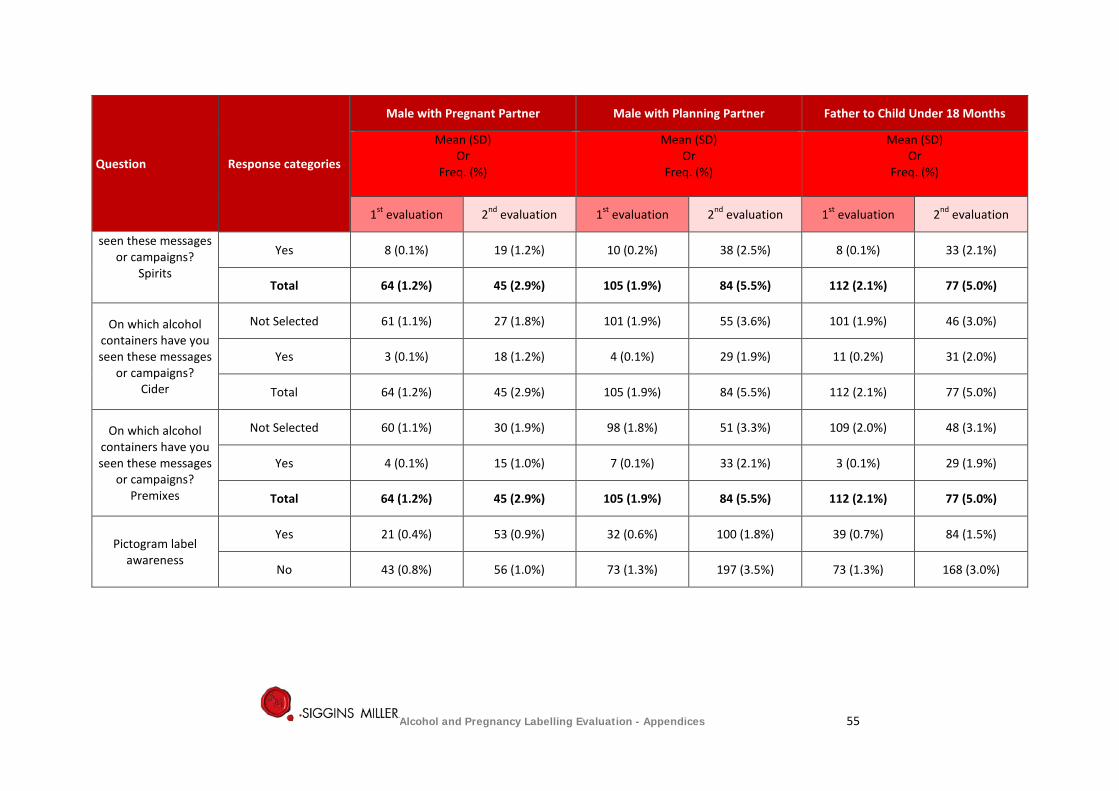
Question Response categories
Male with Pregnant Partner Male with Planning Partner Father to Child Under 18 Months
Mean (SD) Or
Freq. (%)
Mean (SD) Or
Freq. (%)
Mean (SD) Or
Freq. (%)
1st evaluation 2nd evaluation 1st evaluation 2nd evaluation 1st evaluation 2nd evaluation
seen these messages or campaigns?
Spirits
Yes 8 (0.1%) 19 (1.2%) 10 (0.2%) 38 (2.5%) 8 (0.1%) 33 (2.1%)
Total 64 (1.2%) 45 (2.9%) 105 (1.9%) 84 (5.5%) 112 (2.1%) 77 (5.0%)
On which alcohol containers have you seen these messages
or campaigns? Cider
Not Selected 61 (1.1%) 27 (1.8%) 101 (1.9%) 55 (3.6%) 101 (1.9%) 46 (3.0%)
Yes 3 (0.1%) 18 (1.2%) 4 (0.1%) 29 (1.9%) 11 (0.2%) 31 (2.0%)
Total 64 (1.2%) 45 (2.9%) 105 (1.9%) 84 (5.5%) 112 (2.1%) 77 (5.0%)
On which alcohol containers have you seen these messages
or campaigns? Premixes
Not Selected 60 (1.1%) 30 (1.9%) 98 (1.8%) 51 (3.3%) 109 (2.0%) 48 (3.1%)
Yes 4 (0.1%) 15 (1.0%) 7 (0.1%) 33 (2.1%) 3 (0.1%) 29 (1.9%)
Total 64 (1.2%) 45 (2.9%) 105 (1.9%) 84 (5.5%) 112 (2.1%) 77 (5.0%)
Pictogram label
awareness
Yes 21 (0.4%) 53 (0.9%) 32 (0.6%) 100 (1.8%) 39 (0.7%) 84 (1.5%)
No 43 (0.8%) 56 (1.0%) 73 (1.3%) 197 (3.5%) 73 (1.3%) 168 (3.0%)
Alcohol and Pregnancy Labelling Evaluation - Appendices 55

Question Response categories
Male with Pregnant Partner Male with Planning Partner Father to Child Under 18 Months
Mean (SD) Or
Freq. (%)
Mean (SD) Or
Freq. (%)
Mean (SD) Or
Freq. (%)
1st evaluation 2nd evaluation 1st evaluation 2nd evaluation 1st evaluation 2nd evaluation
Have you seen the above label?
Total 64 (1.2%) 109 (1.9%) 105 (1.9%) 297 (5.3%) 112 (2.1%) 252 (4.5%)
Text only label
awareness
Have you seen the above warning label?
Yes 15 (0.3%) 50 (0.9%) 21 (0.4%) 98 (1.7%) 28 (0.5%) 87 (1.5%)
No 49 (0.9%) 59 (1.0%) 84 (1.5%) 199 (3.5%) 84 (1.5%) 165 (2.9%)
Total 64 (1.2%) 109 (1.9%) 105 (1.9%) 297 (5.3%) 112 (2.1%) 252 (4.5%)
Alcohol and Pregnancy Labelling Evaluation - Appendices 56
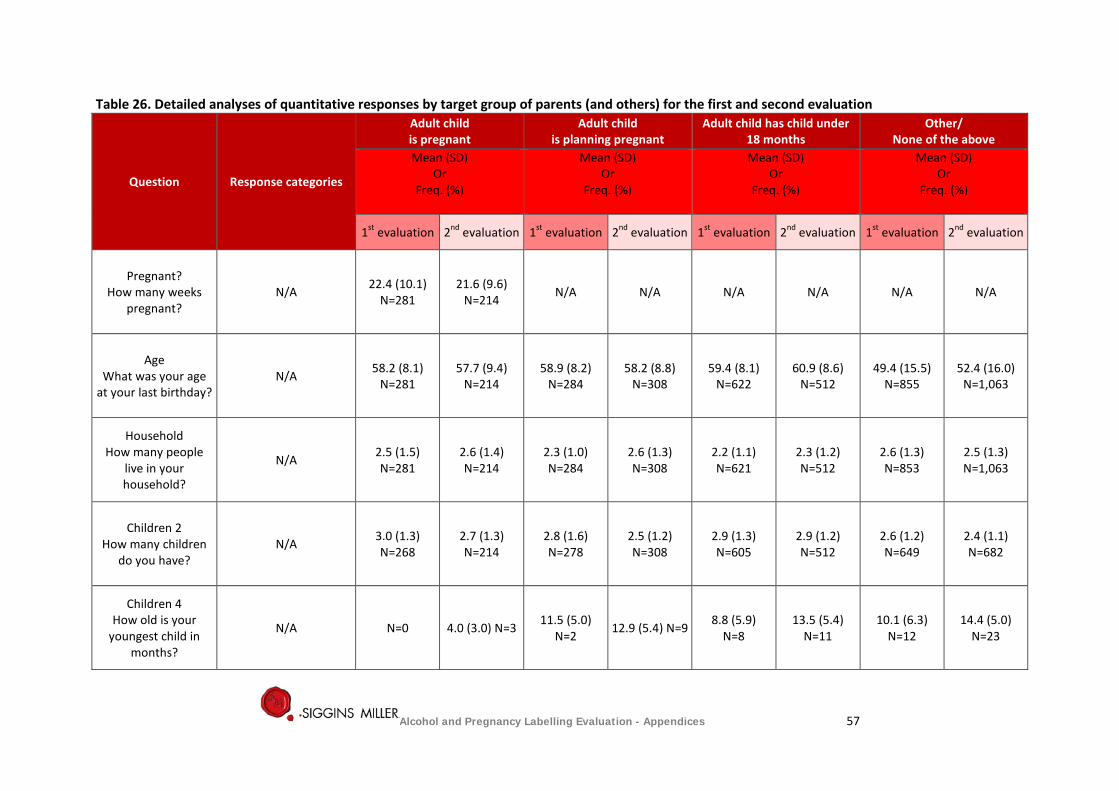
Table 26. Detailed analyses of quantitative responses by target group of parents (and others) for the first and second evaluation
Question Response categories
Adult child is pregnant
Adult child is planning pregnant
Adult child has child under 18 months
Other/ None of the above
Mean (SD) Or
Freq. (%)
Mean (SD) Or
Freq. (%)
Mean (SD) Or
Freq. (%)
Mean (SD) Or
Freq. (%)
1st evaluation 2nd evaluation 1st evaluation 2nd evaluation 1st evaluation 2nd evaluation 1st evaluation 2nd evaluation
Pregnant? How many weeks
pregnant? N/A 22.4 (10.1)
N=281 21.6 (9.6)
N=214 N/A N/A N/A N/A N/A N/A
Age What was your age
at your last birthday? N/A 58.2 (8.1)
N=281 57.7 (9.4)
N=214 58.9 (8.2)
N=284 58.2 (8.8)
N=308 59.4 (8.1)
N=622 60.9 (8.6)
N=512 49.4 (15.5)
N=855 52.4 (16.0)
N=1,063
Household How many people
live in your household?
N/A 2.5 (1.5) N=281
2.6 (1.4) N=214
2.3 (1.0) N=284
2.6 (1.3) N=308
2.2 (1.1) N=621
2.3 (1.2) N=512
2.6 (1.3) N=853
2.5 (1.3) N=1,063
Children 2 How many children
do you have? N/A 3.0 (1.3)
N=268 2.7 (1.3) N=214
2.8 (1.6) N=278
2.5 (1.2) N=308
2.9 (1.3) N=605
2.9 (1.2) N=512
2.6 (1.2) N=649
2.4 (1.1) N=682
Children 4 How old is your
youngest child in months?
N/A N=0 4.0 (3.0) N=3 11.5 (5.0) N=2 12.9 (5.4) N=9 8.8 (5.9)
N=8 13.5 (5.4)
N=11 10.1 (6.3)
N=12 14.4 (5.0)
N=23
Alcohol and Pregnancy Labelling Evaluation - Appendices 57
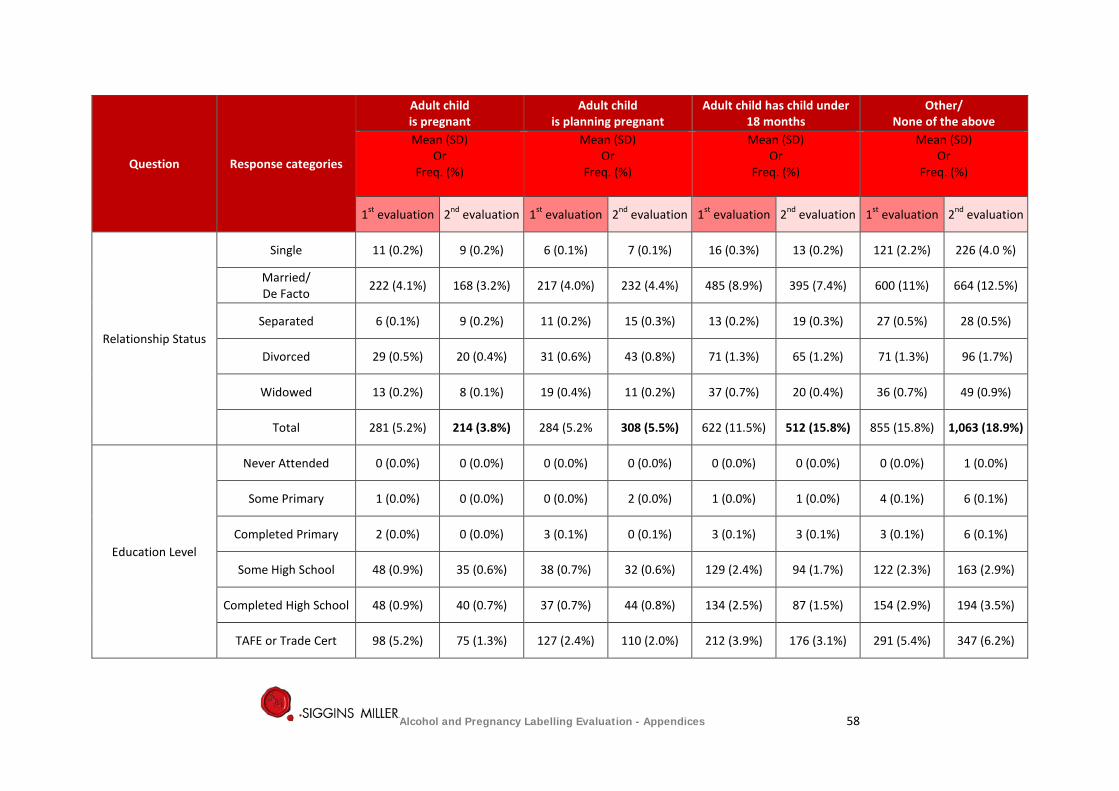
Question Response categories
Adult child is pregnant
Adult child is planning pregnant
Adult child has child under 18 months
Other/ None of the above
Mean (SD) Or
Freq. (%)
Mean (SD) Or
Freq. (%)
Mean (SD) Or
Freq. (%)
Mean (SD) Or
Freq. (%)
1st evaluation 2nd evaluation 1st evaluation 2nd evaluation 1st evaluation 2nd evaluation 1st evaluation 2nd evaluation
Relationship Status
Single 11 (0.2%) 9 (0.2%) 6 (0.1%) 7 (0.1%) 16 (0.3%) 13 (0.2%) 121 (2.2%) 226 (4.0 %)
Married/ De Facto 222 (4.1%) 168 (3.2%) 217 (4.0%) 232 (4.4%) 485 (8.9%) 395 (7.4%) 600 (11%) 664 (12.5%)
Separated 6 (0.1%) 9 (0.2%) 11 (0.2%) 15 (0.3%) 13 (0.2%) 19 (0.3%) 27 (0.5%) 28 (0.5%)
Divorced 29 (0.5%) 20 (0.4%) 31 (0.6%) 43 (0.8%) 71 (1.3%) 65 (1.2%) 71 (1.3%) 96 (1.7%)
Widowed 13 (0.2%) 8 (0.1%) 19 (0.4%) 11 (0.2%) 37 (0.7%) 20 (0.4%) 36 (0.7%) 49 (0.9%)
Total 281 (5.2%) 214 (3.8%) 284 (5.2% 308 (5.5%) 622 (11.5%) 512 (15.8%) 855 (15.8%) 1,063 (18.9%)
Education Level
Never Attended 0 (0.0%) 0 (0.0%) 0 (0.0%) 0 (0.0%) 0 (0.0%) 0 (0.0%) 0 (0.0%) 1 (0.0%)
Some Primary 1 (0.0%) 0 (0.0%) 0 (0.0%) 2 (0.0%) 1 (0.0%) 1 (0.0%) 4 (0.1%) 6 (0.1%)
Completed Primary 2 (0.0%) 0 (0.0%) 3 (0.1%) 0 (0.1%) 3 (0.1%) 3 (0.1%) 3 (0.1%) 6 (0.1%)
Some High School 48 (0.9%) 35 (0.6%) 38 (0.7%) 32 (0.6%) 129 (2.4%) 94 (1.7%) 122 (2.3%) 163 (2.9%)
Completed High School 48 (0.9%) 40 (0.7%) 37 (0.7%) 44 (0.8%) 134 (2.5%) 87 (1.5%) 154 (2.9%) 194 (3.5%)
TAFE or Trade Cert 98 (5.2%) 75 (1.3%) 127 (2.4%) 110 (2.0%) 212 (3.9%) 176 (3.1%) 291 (5.4%) 347 (6.2%)
Alcohol and Pregnancy Labelling Evaluation - Appendices 58
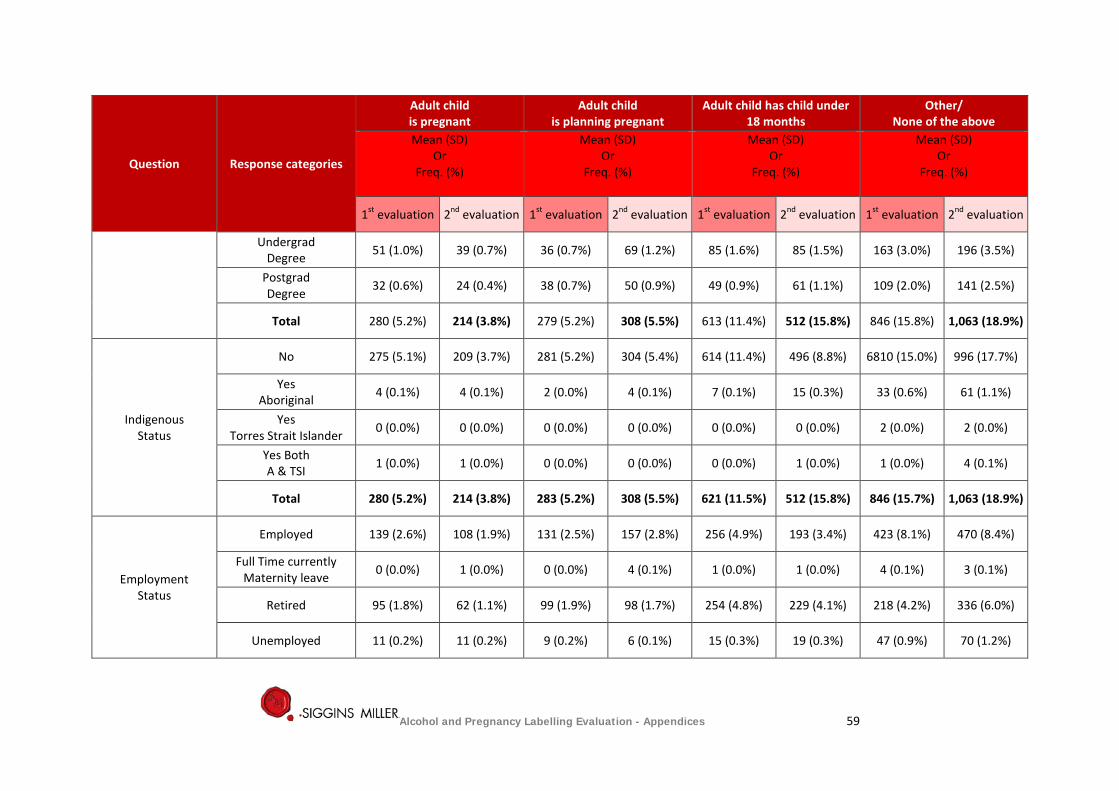
Question Response categories
Adult child is pregnant
Adult child is planning pregnant
Adult child has child under 18 months
Other/ None of the above
Mean (SD) Or
Freq. (%)
Mean (SD) Or
Freq. (%)
Mean (SD) Or
Freq. (%)
Mean (SD) Or
Freq. (%)
1st evaluation 2nd evaluation 1st evaluation 2nd evaluation 1st evaluation 2nd evaluation 1st evaluation 2nd evaluation
Undergrad Degree 51 (1.0%) 39 (0.7%) 36 (0.7%) 69 (1.2%) 85 (1.6%) 85 (1.5%) 163 (3.0%) 196 (3.5%)
Postgrad Degree 32 (0.6%) 24 (0.4%) 38 (0.7%) 50 (0.9%) 49 (0.9%) 61 (1.1%) 109 (2.0%) 141 (2.5%)
Total 280 (5.2%) 214 (3.8%) 279 (5.2%) 308 (5.5%) 613 (11.4%) 512 (15.8%) 846 (15.8%) 1,063 (18.9%)
Indigenous Status
No 275 (5.1%) 209 (3.7%) 281 (5.2%) 304 (5.4%) 614 (11.4%) 496 (8.8%) 6810 (15.0%) 996 (17.7%)
Yes Aboriginal 4 (0.1%) 4 (0.1%) 2 (0.0%) 4 (0.1%) 7 (0.1%) 15 (0.3%) 33 (0.6%) 61 (1.1%)
Yes Torres Strait Islander 0 (0.0%) 0 (0.0%) 0 (0.0%) 0 (0.0%) 0 (0.0%) 0 (0.0%) 2 (0.0%) 2 (0.0%)
Yes Both A & TSI 1 (0.0%) 1 (0.0%) 0 (0.0%) 0 (0.0%) 0 (0.0%) 1 (0.0%) 1 (0.0%) 4 (0.1%)
Total 280 (5.2%) 214 (3.8%) 283 (5.2%) 308 (5.5%) 621 (11.5%) 512 (15.8%) 846 (15.7%) 1,063 (18.9%)
Employment Status
Employed 139 (2.6%) 108 (1.9%) 131 (2.5%) 157 (2.8%) 256 (4.9%) 193 (3.4%) 423 (8.1%) 470 (8.4%)
Full Time currently Maternity leave 0 (0.0%) 1 (0.0%) 0 (0.0%) 4 (0.1%) 1 (0.0%) 1 (0.0%) 4 (0.1%) 3 (0.1%)
Retired 95 (1.8%) 62 (1.1%) 99 (1.9%) 98 (1.7%) 254 (4.8%) 229 (4.1%) 218 (4.2%) 336 (6.0%)
Unemployed 11 (0.2%) 11 (0.2%) 9 (0.2%) 6 (0.1%) 15 (0.3%) 19 (0.3%) 47 (0.9%) 70 (1.2%)
Alcohol and Pregnancy Labelling Evaluation - Appendices 59

Question Response categories
Adult child is pregnant
Adult child is planning pregnant
Adult child has child under 18 months
Other/ None of the above
Mean (SD) Or
Freq. (%)
Mean (SD) Or
Freq. (%)
Mean (SD) Or
Freq. (%)
Mean (SD) Or
Freq. (%)
1st evaluation 2nd evaluation 1st evaluation 2nd evaluation 1st evaluation 2nd evaluation 1st evaluation 2nd evaluation
Home Duties 28 (0.5%) 25 (0.4%) 31 (0.6%) 29 (0.5%) 71 (1.4%) 45 (0.8%) 90 (1.7%) 109 (1.9%)
Student 0 (0.0%) 1 (0.0%) 2 (0.0%) 1 (0.0%) 2 (0.0%) 5 (0.1%) 34 (0.6%) 43 (0.8%)
Other N/A 6 (0.1%) N/A 13 (0.2%) N/A 20 (0.4%) N/A 32 (0.6%)
Total 273 (5.2%) 214 (3.8%) 272 (5.2%) 308 (5.5%) 599 (11.4%) 512 (9.1%) 816 (15.5%) 1,063 (18.9%)
Language
English 275 (5.2%) 212 (3.8%) 278 (5.3%) 294 (5.2%) 612 (11.6%) 500 (8.9%) 815 (15.5%) 1,017 (18.1%)
Other Languages 3 (0.1%) 2 (0.0%) 2 (0.0%) 14 (0.2%) 4 (0.1%) 12 (0.2%) 20 (0.4%) 46 (0.8%)
Total 278 (5.3%) 214 (3.8%) 280 (5.3%) 308 (5.5%) 616 (11.7%) 512 (9.1%) 835 (15.9%) 1,063 (18.9%)
Before Tax Income
Less than $10 000 2 (0.0%) 3 (0.1%) 3 (0.1%) 3 (0.1%) 15 (0.3%) 5 (0.1%) 29 (0.6%) 28 (0.5%)
$10 000 - less than $20 000 15 (0.3%) 11 (0.2%) 18 (0.3%) 6 (0.1%) 37 (0.7%) 27 (0.5%) 63 (1.2%) 74 (1.3%)
$20 000 - less than $40 000 64 (1.2%) 36 (0.6%) 46 (0.9%) 49 (0.9%) 149 (2.9%) 106 (1.9%) 141 (2.7%) 229 (4.1%)
$40 000 - less than $60 000 46 (0.9%) 32 (0.6%) 50 (1.0%) 50 (0.9%) 127 (2.4%) 84 (1.5%) 167 (3.2%) 148 (2.6%)
$60 000 - less than $80 000 43 (0.8%) 28 (0.5%) 49 (0.9%) 32 (0.6%) 97 (1.9%) 68 (1.2%) 119 (2.3%) 113 (2.0%)
Alcohol and Pregnancy Labelling Evaluation - Appendices 60
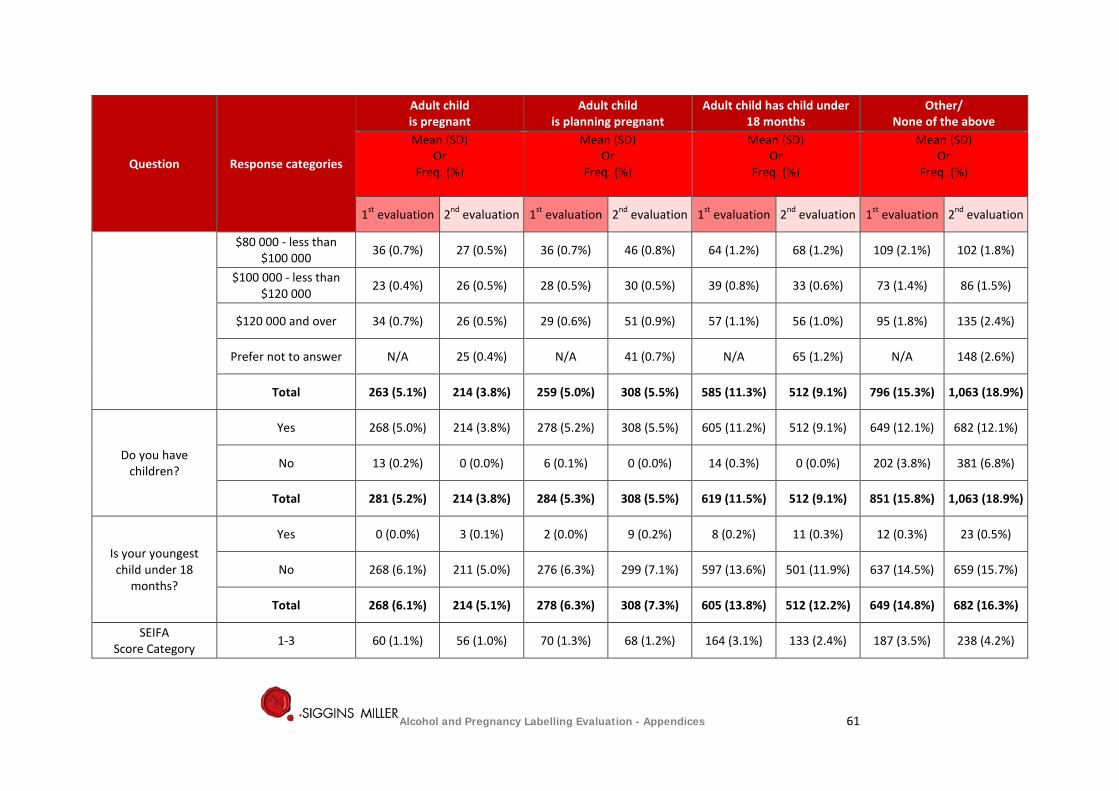
Question Response categories
Adult child is pregnant
Adult child is planning pregnant
Adult child has child under 18 months
Other/ None of the above
Mean (SD) Or
Freq. (%)
Mean (SD) Or
Freq. (%)
Mean (SD) Or
Freq. (%)
Mean (SD) Or
Freq. (%)
1st evaluation 2nd evaluation 1st evaluation 2nd evaluation 1st evaluation 2nd evaluation 1st evaluation 2nd evaluation
$80 000 - less than $100 000 36 (0.7%) 27 (0.5%) 36 (0.7%) 46 (0.8%) 64 (1.2%) 68 (1.2%) 109 (2.1%) 102 (1.8%)
$100 000 - less than $120 000 23 (0.4%) 26 (0.5%) 28 (0.5%) 30 (0.5%) 39 (0.8%) 33 (0.6%) 73 (1.4%) 86 (1.5%)
$120 000 and over 34 (0.7%) 26 (0.5%) 29 (0.6%) 51 (0.9%) 57 (1.1%) 56 (1.0%) 95 (1.8%) 135 (2.4%)
Prefer not to answer N/A 25 (0.4%) N/A 41 (0.7%) N/A 65 (1.2%) N/A 148 (2.6%)
Total 263 (5.1%) 214 (3.8%) 259 (5.0%) 308 (5.5%) 585 (11.3%) 512 (9.1%) 796 (15.3%) 1,063 (18.9%)
Do you have children?
Yes 268 (5.0%) 214 (3.8%) 278 (5.2%) 308 (5.5%) 605 (11.2%) 512 (9.1%) 649 (12.1%) 682 (12.1%)
No 13 (0.2%) 0 (0.0%) 6 (0.1%) 0 (0.0%) 14 (0.3%) 0 (0.0%) 202 (3.8%) 381 (6.8%)
Total 281 (5.2%) 214 (3.8%) 284 (5.3%) 308 (5.5%) 619 (11.5%) 512 (9.1%) 851 (15.8%) 1,063 (18.9%)
Is your youngest child under 18
months?
Yes 0 (0.0%) 3 (0.1%) 2 (0.0%) 9 (0.2%) 8 (0.2%) 11 (0.3%) 12 (0.3%) 23 (0.5%)
No 268 (6.1%) 211 (5.0%) 276 (6.3%) 299 (7.1%) 597 (13.6%) 501 (11.9%) 637 (14.5%) 659 (15.7%)
Total 268 (6.1%) 214 (5.1%) 278 (6.3%) 308 (7.3%) 605 (13.8%) 512 (12.2%) 649 (14.8%) 682 (16.3%)
SEIFA Score Category 1-3 60 (1.1%) 56 (1.0%) 70 (1.3%) 68 (1.2%) 164 (3.1%) 133 (2.4%) 187 (3.5%) 238 (4.2%)
Alcohol and Pregnancy Labelling Evaluation - Appendices 61
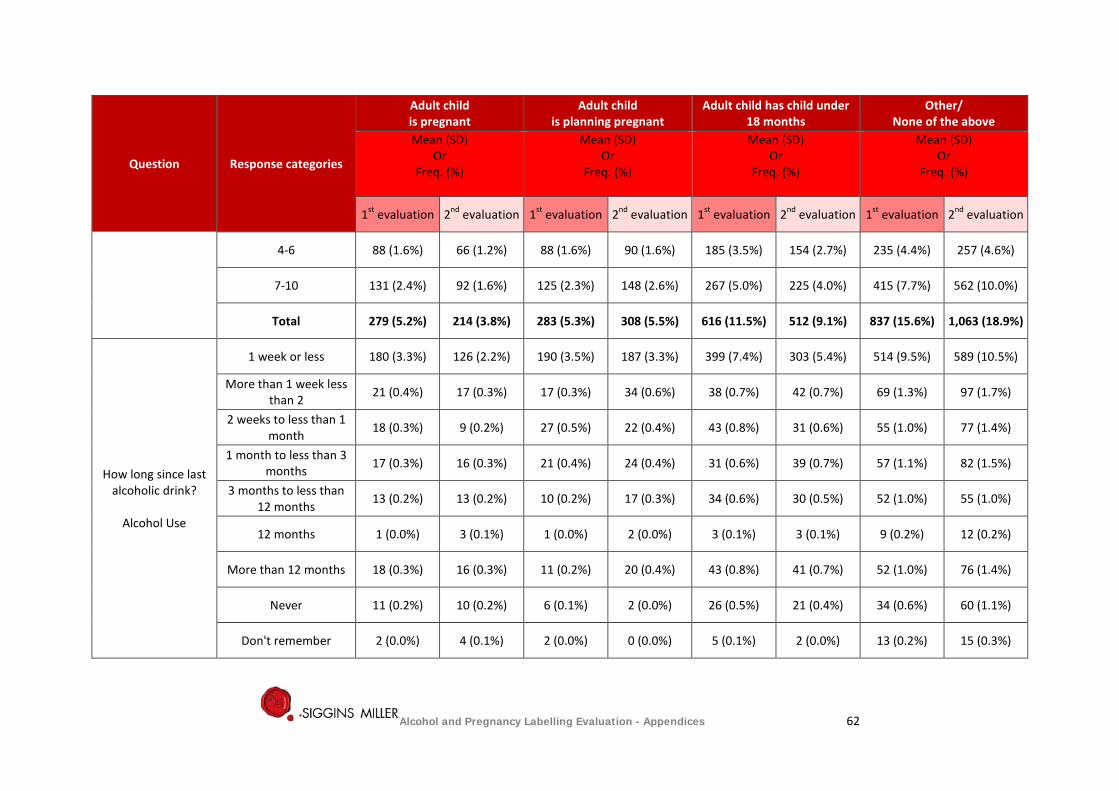
Question Response categories
Adult child is pregnant
Adult child is planning pregnant
Adult child has child under 18 months
Other/ None of the above
Mean (SD) Or
Freq. (%)
Mean (SD) Or
Freq. (%)
Mean (SD) Or
Freq. (%)
Mean (SD) Or
Freq. (%)
1st evaluation 2nd evaluation 1st evaluation 2nd evaluation 1st evaluation 2nd evaluation 1st evaluation 2nd evaluation
4-6 88 (1.6%) 66 (1.2%) 88 (1.6%) 90 (1.6%) 185 (3.5%) 154 (2.7%) 235 (4.4%) 257 (4.6%)
7-10 131 (2.4%) 92 (1.6%) 125 (2.3%) 148 (2.6%) 267 (5.0%) 225 (4.0%) 415 (7.7%) 562 (10.0%)
Total 279 (5.2%) 214 (3.8%) 283 (5.3%) 308 (5.5%) 616 (11.5%) 512 (9.1%) 837 (15.6%) 1,063 (18.9%)
How long since last alcoholic drink?
Alcohol Use
1 week or less 180 (3.3%) 126 (2.2%) 190 (3.5%) 187 (3.3%) 399 (7.4%) 303 (5.4%) 514 (9.5%) 589 (10.5%)
More than 1 week less than 2 21 (0.4%) 17 (0.3%) 17 (0.3%) 34 (0.6%) 38 (0.7%) 42 (0.7%) 69 (1.3%) 97 (1.7%)
2 weeks to less than 1 month 18 (0.3%) 9 (0.2%) 27 (0.5%) 22 (0.4%) 43 (0.8%) 31 (0.6%) 55 (1.0%) 77 (1.4%)
1 month to less than 3 months 17 (0.3%) 16 (0.3%) 21 (0.4%) 24 (0.4%) 31 (0.6%) 39 (0.7%) 57 (1.1%) 82 (1.5%)
3 months to less than 12 months 13 (0.2%) 13 (0.2%) 10 (0.2%) 17 (0.3%) 34 (0.6%) 30 (0.5%) 52 (1.0%) 55 (1.0%)
12 months 1 (0.0%) 3 (0.1%) 1 (0.0%) 2 (0.0%) 3 (0.1%) 3 (0.1%) 9 (0.2%) 12 (0.2%)
More than 12 months 18 (0.3%) 16 (0.3%) 11 (0.2%) 20 (0.4%) 43 (0.8%) 41 (0.7%) 52 (1.0%) 76 (1.4%)
Never 11 (0.2%) 10 (0.2%) 6 (0.1%) 2 (0.0%) 26 (0.5%) 21 (0.4%) 34 (0.6%) 60 (1.1%)
Don't remember 2 (0.0%) 4 (0.1%) 2 (0.0%) 0 (0.0%) 5 (0.1%) 2 (0.0%) 13 (0.2%) 15 (0.3%)
Alcohol and Pregnancy Labelling Evaluation - Appendices 62
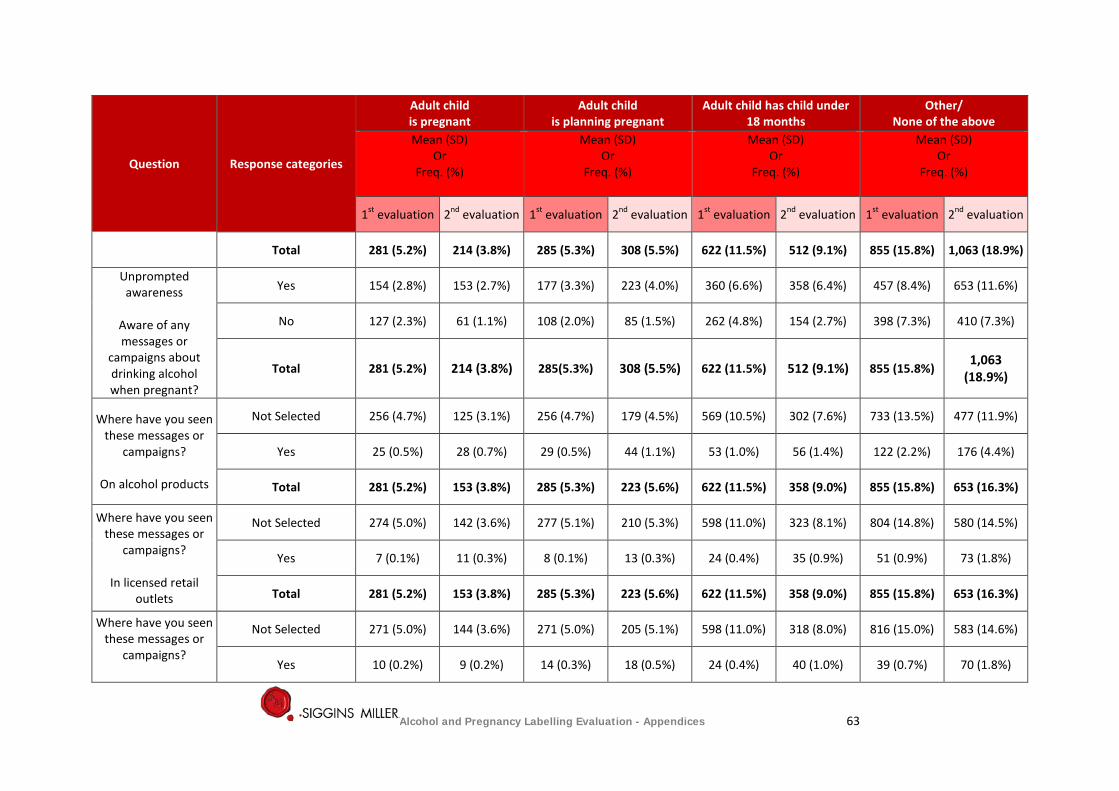
Question Response categories
Adult child is pregnant
Adult child is planning pregnant
Adult child has child under 18 months
Other/ None of the above
Mean (SD) Or
Freq. (%)
Mean (SD) Or
Freq. (%)
Mean (SD) Or
Freq. (%)
Mean (SD) Or
Freq. (%)
1st evaluation 2nd evaluation 1st evaluation 2nd evaluation 1st evaluation 2nd evaluation 1st evaluation 2nd evaluation
Total 281 (5.2%) 214 (3.8%) 285 (5.3%) 308 (5.5%) 622 (11.5%) 512 (9.1%) 855 (15.8%) 1,063 (18.9%)
Unprompted awareness
Aware of any messages or
campaigns about drinking alcohol when pregnant?
Yes 154 (2.8%) 153 (2.7%) 177 (3.3%) 223 (4.0%) 360 (6.6%) 358 (6.4%) 457 (8.4%) 653 (11.6%)
No 127 (2.3%) 61 (1.1%) 108 (2.0%) 85 (1.5%) 262 (4.8%) 154 (2.7%) 398 (7.3%) 410 (7.3%)
Total 281 (5.2%) 214 (3.8%) 285(5.3%) 308 (5.5%) 622 (11.5%) 512 (9.1%) 855 (15.8%) 1,063
(18.9%)
Where have you seen these messages or
campaigns?
On alcohol products
Not Selected 256 (4.7%) 125 (3.1%) 256 (4.7%) 179 (4.5%) 569 (10.5%) 302 (7.6%) 733 (13.5%) 477 (11.9%)
Yes 25 (0.5%) 28 (0.7%) 29 (0.5%) 44 (1.1%) 53 (1.0%) 56 (1.4%) 122 (2.2%) 176 (4.4%)
Total 281 (5.2%) 153 (3.8%) 285 (5.3%) 223 (5.6%) 622 (11.5%) 358 (9.0%) 855 (15.8%) 653 (16.3%)
Where have you seen these messages or
campaigns?
In licensed retail outlets
Not Selected 274 (5.0%) 142 (3.6%) 277 (5.1%) 210 (5.3%) 598 (11.0%) 323 (8.1%) 804 (14.8%) 580 (14.5%)
Yes 7 (0.1%) 11 (0.3%) 8 (0.1%) 13 (0.3%) 24 (0.4%) 35 (0.9%) 51 (0.9%) 73 (1.8%)
Total 281 (5.2%) 153 (3.8%) 285 (5.3%) 223 (5.6%) 622 (11.5%) 358 (9.0%) 855 (15.8%) 653 (16.3%)
Where have you seen these messages or
campaigns?
Not Selected 271 (5.0%) 144 (3.6%) 271 (5.0%) 205 (5.1%) 598 (11.0%) 318 (8.0%) 816 (15.0%) 583 (14.6%)
Yes 10 (0.2%) 9 (0.2%) 14 (0.3%) 18 (0.5%) 24 (0.4%) 40 (1.0%) 39 (0.7%) 70 (1.8%)
Alcohol and Pregnancy Labelling Evaluation - Appendices 63
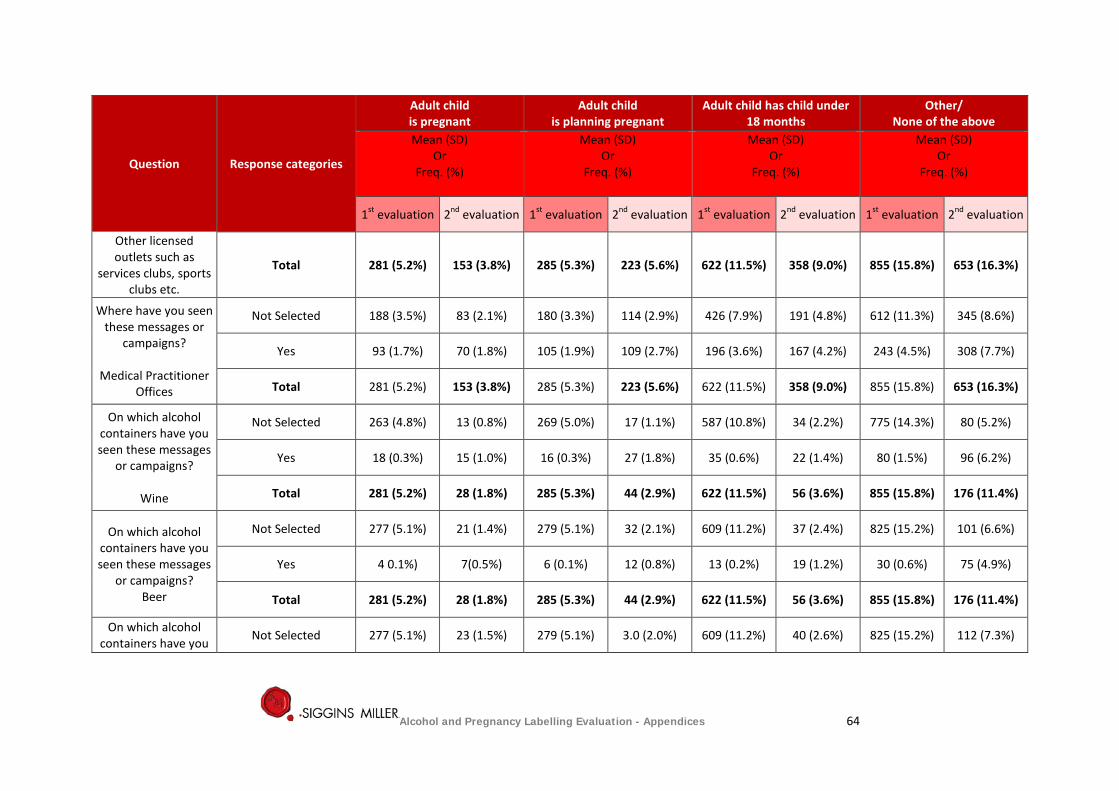
Question Response categories
Adult child is pregnant
Adult child is planning pregnant
Adult child has child under 18 months
Other/ None of the above
Mean (SD) Or
Freq. (%)
Mean (SD) Or
Freq. (%)
Mean (SD) Or
Freq. (%)
Mean (SD) Or
Freq. (%)
1st evaluation 2nd evaluation 1st evaluation 2nd evaluation 1st evaluation 2nd evaluation 1st evaluation 2nd evaluation
Other licensed outlets such as
services clubs, sports clubs etc.
Total 281 (5.2%) 153 (3.8%) 285 (5.3%) 223 (5.6%) 622 (11.5%) 358 (9.0%) 855 (15.8%) 653 (16.3%)
Where have you seen these messages or
campaigns?
Medical Practitioner Offices
Not Selected 188 (3.5%) 83 (2.1%) 180 (3.3%) 114 (2.9%) 426 (7.9%) 191 (4.8%) 612 (11.3%) 345 (8.6%)
Yes 93 (1.7%) 70 (1.8%) 105 (1.9%) 109 (2.7%) 196 (3.6%) 167 (4.2%) 243 (4.5%) 308 (7.7%)
Total 281 (5.2%) 153 (3.8%) 285 (5.3%) 223 (5.6%) 622 (11.5%) 358 (9.0%) 855 (15.8%) 653 (16.3%)
On which alcohol containers have you seen these messages
or campaigns?
Wine
Not Selected 263 (4.8%) 13 (0.8%) 269 (5.0%) 17 (1.1%) 587 (10.8%) 34 (2.2%) 775 (14.3%) 80 (5.2%)
Yes 18 (0.3%) 15 (1.0%) 16 (0.3%) 27 (1.8%) 35 (0.6%) 22 (1.4%) 80 (1.5%) 96 (6.2%)
Total 281 (5.2%) 28 (1.8%) 285 (5.3%) 44 (2.9%) 622 (11.5%) 56 (3.6%) 855 (15.8%) 176 (11.4%)
On which alcohol containers have you seen these messages
or campaigns? Beer
Not Selected 277 (5.1%) 21 (1.4%) 279 (5.1%) 32 (2.1%) 609 (11.2%) 37 (2.4%) 825 (15.2%) 101 (6.6%)
Yes 4 0.1%) 7(0.5%) 6 (0.1%) 12 (0.8%) 13 (0.2%) 19 (1.2%) 30 (0.6%) 75 (4.9%)
Total 281 (5.2%) 28 (1.8%) 285 (5.3%) 44 (2.9%) 622 (11.5%) 56 (3.6%) 855 (15.8%) 176 (11.4%)
On which alcohol containers have you Not Selected 277 (5.1%) 23 (1.5%) 279 (5.1%) 3.0 (2.0%) 609 (11.2%) 40 (2.6%) 825 (15.2%) 112 (7.3%)
Alcohol and Pregnancy Labelling Evaluation - Appendices 64
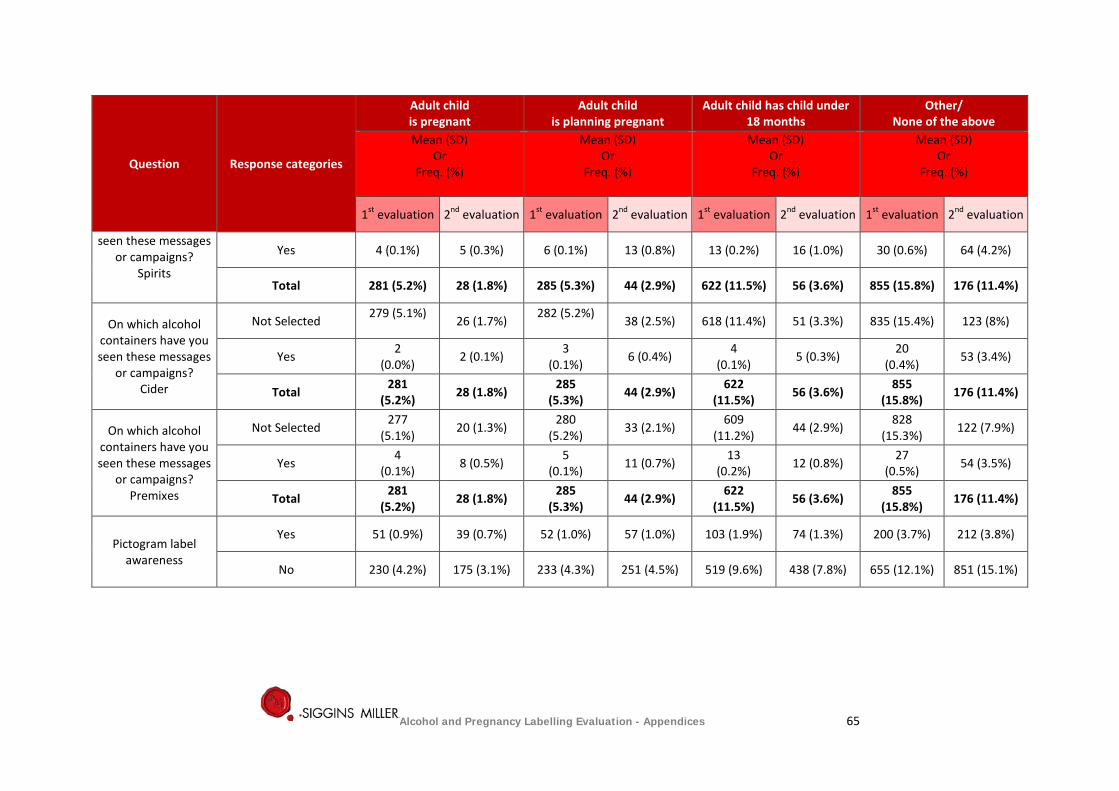
Question Response categories
Adult child is pregnant
Adult child is planning pregnant
Adult child has child under 18 months
Other/ None of the above
Mean (SD) Or
Freq. (%)
Mean (SD) Or
Freq. (%)
Mean (SD) Or
Freq. (%)
Mean (SD) Or
Freq. (%)
1st evaluation 2nd evaluation 1st evaluation 2nd evaluation 1st evaluation 2nd evaluation 1st evaluation 2nd evaluation
seen these messages or campaigns?
Spirits
Yes 4 (0.1%) 5 (0.3%) 6 (0.1%) 13 (0.8%) 13 (0.2%) 16 (1.0%) 30 (0.6%) 64 (4.2%)
Total 281 (5.2%) 28 (1.8%) 285 (5.3%) 44 (2.9%) 622 (11.5%) 56 (3.6%) 855 (15.8%) 176 (11.4%)
On which alcohol containers have you seen these messages
or campaigns? Cider
Not Selected 279 (5.1%) 26 (1.7%) 282 (5.2%)
38 (2.5%) 618 (11.4%) 51 (3.3%) 835 (15.4%) 123 (8%)
Yes 2 (0.0%) 2 (0.1%) 3
(0.1%) 6 (0.4%) 4 (0.1%) 5 (0.3%) 20
(0.4%) 53 (3.4%)
Total 281 (5.2%) 28 (1.8%) 285
(5.3%) 44 (2.9%) 622 (11.5%) 56 (3.6%) 855
(15.8%) 176 (11.4%)
On which alcohol containers have you seen these messages
or campaigns? Premixes
Not Selected 277 (5.1%) 20 (1.3%) 280
(5.2%) 33 (2.1%) 609 (11.2%) 44 (2.9%) 828
(15.3%) 122 (7.9%)
Yes 4 (0.1%) 8 (0.5%) 5
(0.1%) 11 (0.7%) 13 (0.2%) 12 (0.8%) 27
(0.5%) 54 (3.5%)
Total 281 (5.2%) 28 (1.8%) 285
(5.3%) 44 (2.9%) 622 (11.5%) 56 (3.6%) 855
(15.8%) 176 (11.4%)
Pictogram label
awareness
Yes 51 (0.9%) 39 (0.7%) 52 (1.0%) 57 (1.0%) 103 (1.9%) 74 (1.3%) 200 (3.7%) 212 (3.8%)
No 230 (4.2%) 175 (3.1%) 233 (4.3%) 251 (4.5%) 519 (9.6%) 438 (7.8%) 655 (12.1%) 851 (15.1%)
Alcohol and Pregnancy Labelling Evaluation - Appendices 65
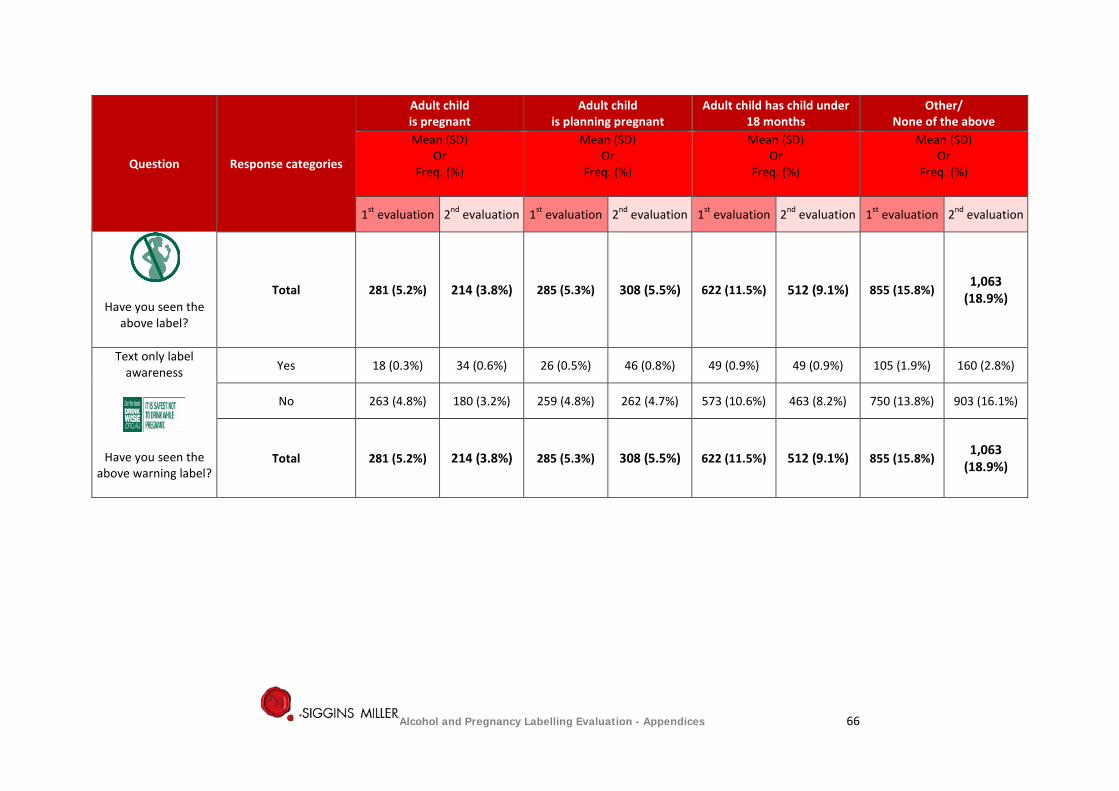
Question Response categories
Adult child is pregnant
Adult child is planning pregnant
Adult child has child under 18 months
Other/ None of the above
Mean (SD) Or
Freq. (%)
Mean (SD) Or
Freq. (%)
Mean (SD) Or
Freq. (%)
Mean (SD) Or
Freq. (%)
1st evaluation 2nd evaluation 1st evaluation 2nd evaluation 1st evaluation 2nd evaluation 1st evaluation 2nd evaluation
Have you seen the above label?
Total 281 (5.2%) 214 (3.8%) 285 (5.3%) 308 (5.5%) 622 (11.5%) 512 (9.1%) 855 (15.8%) 1,063
(18.9%)
Text only label awareness
Have you seen the above warning label?
Yes 18 (0.3%) 34 (0.6%) 26 (0.5%) 46 (0.8%) 49 (0.9%) 49 (0.9%) 105 (1.9%) 160 (2.8%)
No 263 (4.8%) 180 (3.2%) 259 (4.8%) 262 (4.7%) 573 (10.6%) 463 (8.2%) 750 (13.8%) 903 (16.1%)
Total 281 (5.2%) 214 (3.8%) 285 (5.3%) 308 (5.5%) 622 (11.5%) 512 (9.1%) 855 (15.8%) 1,063
(18.9%)
Alcohol and Pregnancy Labelling Evaluation - Appendices 66
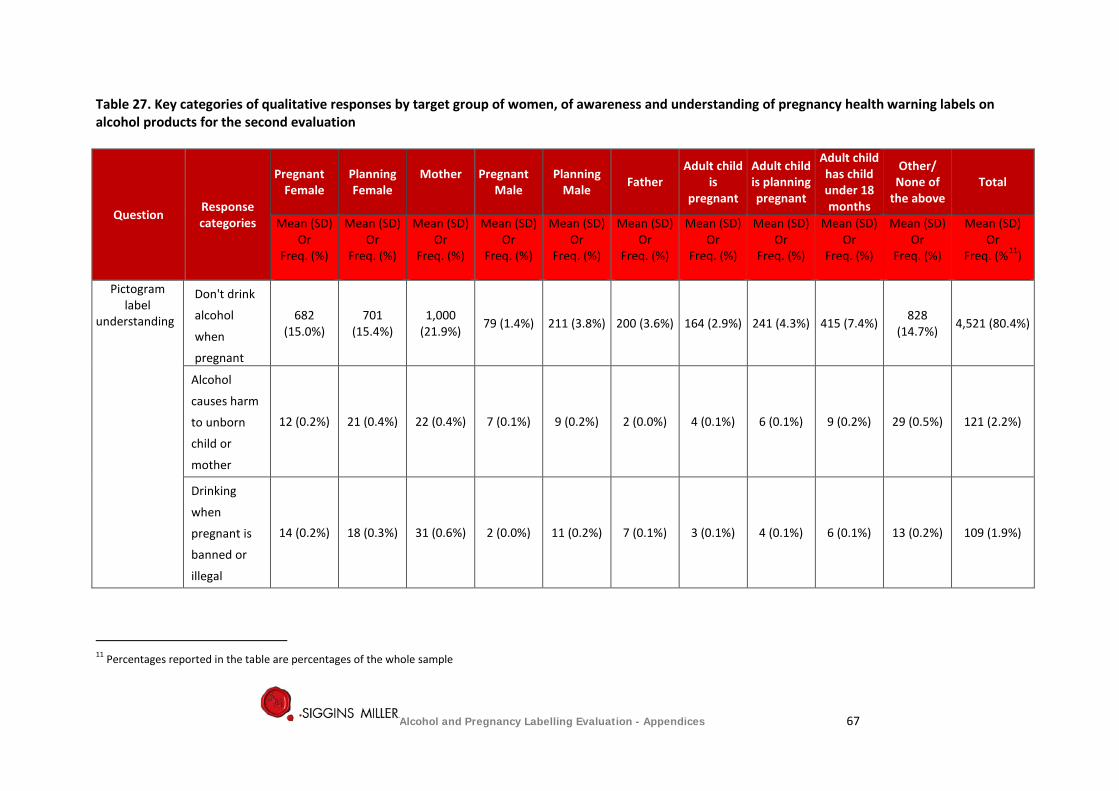
Table 27. Key categories of qualitative responses by target group of women, of awareness and understanding of pregnancy health warning labels on alcohol products for the second evaluation
Question Response categories
Pregnant Female
Planning Female
Mother
Pregnant Male
Planning Male Father
Adult child is
pregnant
Adult child is planning pregnant
Adult child has child under 18 months
Other/ None of
the above Total
Mean (SD) Or
Freq. (%)
Mean (SD) Or
Freq. (%)
Mean (SD) Or
Freq. (%)
Mean (SD) Or
Freq. (%)
Mean (SD) Or
Freq. (%)
Mean (SD) Or
Freq. (%)
Mean (SD) Or
Freq. (%)
Mean (SD) Or
Freq. (%)
Mean (SD) Or
Freq. (%)
Mean (SD) Or
Freq. (%)
Mean (SD) Or
Freq. (%11)
Pictogram label
understanding
Don't drink
alcohol
when
pregnant
682 (15.0%)
701 (15.4%)
1,000 (21.9%) 79 (1.4%) 211 (3.8%) 200 (3.6%) 164 (2.9%) 241 (4.3%) 415 (7.4%) 828
(14.7%) 4,521 (80.4%)
Alcohol
causes harm
to unborn
child or
mother
12 (0.2%) 21 (0.4%) 22 (0.4%) 7 (0.1%) 9 (0.2%) 2 (0.0%) 4 (0.1%) 6 (0.1%) 9 (0.2%) 29 (0.5%) 121 (2.2%)
Drinking
when
pregnant is
banned or
illegal
14 (0.2%) 18 (0.3%) 31 (0.6%) 2 (0.0%) 11 (0.2%) 7 (0.1%) 3 (0.1%) 4 (0.1%) 6 (0.1%) 13 (0.2%) 109 (1.9%)
11 Percentages reported in the table are percentages of the whole sample
Alcohol and Pregnancy Labelling Evaluation - Appendices 67
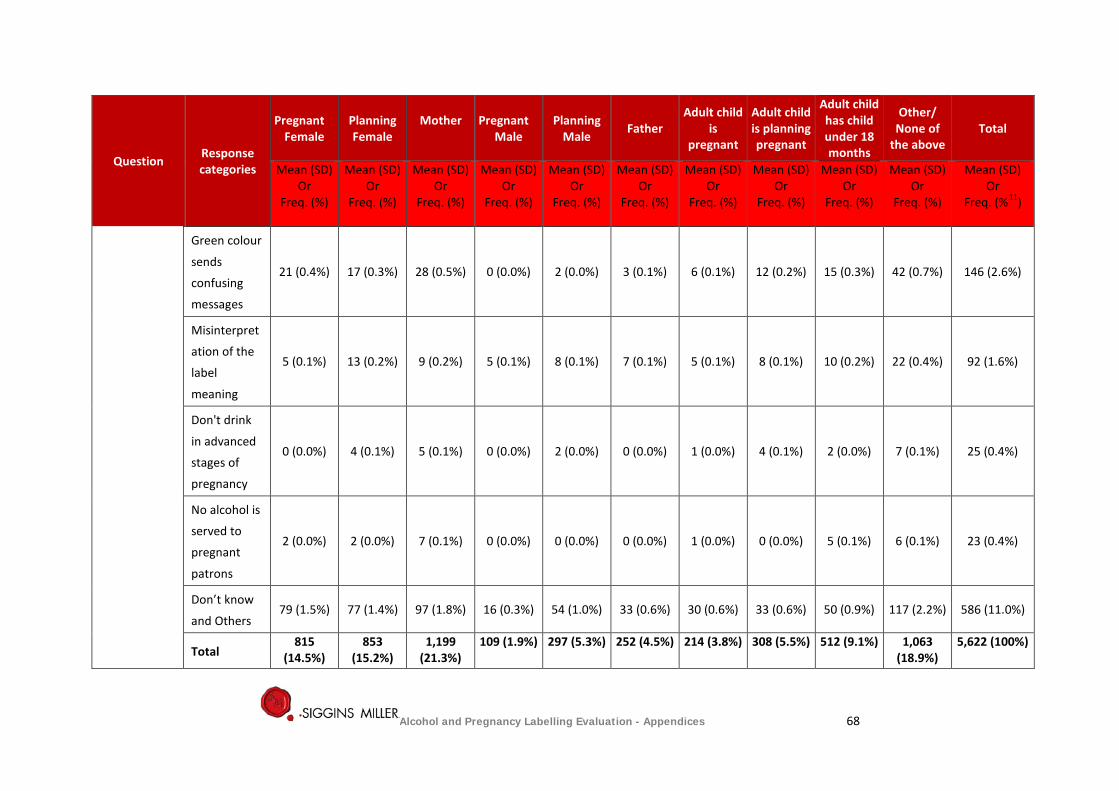
Question Response categories
Pregnant Female
Planning Female
Mother
Pregnant Male
Planning Male Father
Adult child is
pregnant
Adult child is planning pregnant
Adult child has child under 18 months
Other/ None of
the above Total
Mean (SD) Or
Freq. (%)
Mean (SD) Or
Freq. (%)
Mean (SD) Or
Freq. (%)
Mean (SD) Or
Freq. (%)
Mean (SD) Or
Freq. (%)
Mean (SD) Or
Freq. (%)
Mean (SD) Or
Freq. (%)
Mean (SD) Or
Freq. (%)
Mean (SD) Or
Freq. (%)
Mean (SD) Or
Freq. (%)
Mean (SD) Or
Freq. (%11)
Green colour
sends
confusing
messages
21 (0.4%) 17 (0.3%) 28 (0.5%) 0 (0.0%) 2 (0.0%) 3 (0.1%) 6 (0.1%) 12 (0.2%) 15 (0.3%) 42 (0.7%) 146 (2.6%)
Misinterpret
ation of the
label
meaning
5 (0.1%) 13 (0.2%) 9 (0.2%) 5 (0.1%) 8 (0.1%) 7 (0.1%) 5 (0.1%) 8 (0.1%) 10 (0.2%) 22 (0.4%) 92 (1.6%)
Don't drink
in advanced
stages of
pregnancy
0 (0.0%) 4 (0.1%) 5 (0.1%) 0 (0.0%) 2 (0.0%) 0 (0.0%) 1 (0.0%) 4 (0.1%) 2 (0.0%) 7 (0.1%) 25 (0.4%)
No alcohol is
served to
pregnant
patrons
2 (0.0%) 2 (0.0%) 7 (0.1%) 0 (0.0%) 0 (0.0%) 0 (0.0%) 1 (0.0%) 0 (0.0%) 5 (0.1%) 6 (0.1%) 23 (0.4%)
Don’t know
and Others 79 (1.5%) 77 (1.4%) 97 (1.8%) 16 (0.3%) 54 (1.0%) 33 (0.6%) 30 (0.6%) 33 (0.6%) 50 (0.9%) 117 (2.2%) 586 (11.0%)
Total 815
(14.5%) 853
(15.2%) 1,199
(21.3%) 109 (1.9%) 297 (5.3%) 252 (4.5%) 214 (3.8%) 308 (5.5%) 512 (9.1%) 1,063
(18.9%) 5,622 (100%)
Alcohol and Pregnancy Labelling Evaluation - Appendices 68
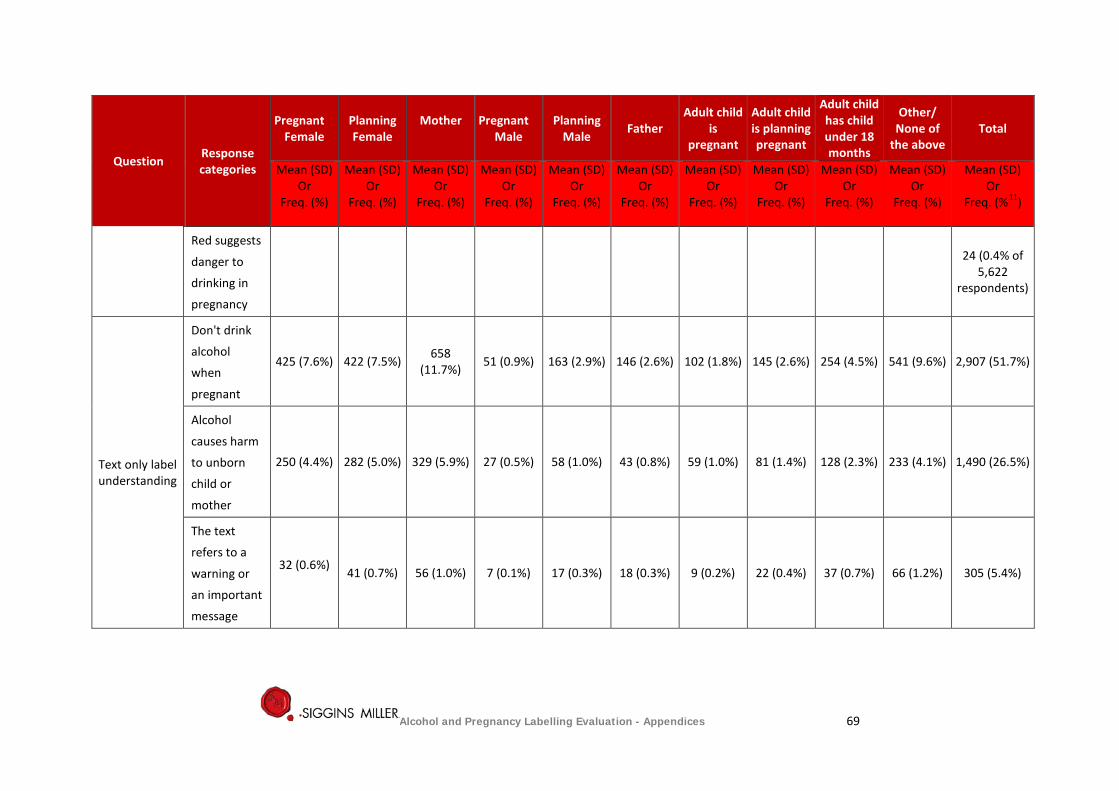
Question Response categories
Pregnant Female
Planning Female
Mother
Pregnant Male
Planning Male Father
Adult child is
pregnant
Adult child is planning pregnant
Adult child has child under 18 months
Other/ None of
the above Total
Mean (SD) Or
Freq. (%)
Mean (SD) Or
Freq. (%)
Mean (SD) Or
Freq. (%)
Mean (SD) Or
Freq. (%)
Mean (SD) Or
Freq. (%)
Mean (SD) Or
Freq. (%)
Mean (SD) Or
Freq. (%)
Mean (SD) Or
Freq. (%)
Mean (SD) Or
Freq. (%)
Mean (SD) Or
Freq. (%)
Mean (SD) Or
Freq. (%11)
Red suggests
danger to
drinking in
pregnancy
24 (0.4% of
5,622 respondents)
Text only label understanding
Don't drink
alcohol
when
pregnant
425 (7.6%) 422 (7.5%) 658 (11.7%) 51 (0.9%) 163 (2.9%) 146 (2.6%) 102 (1.8%) 145 (2.6%) 254 (4.5%) 541 (9.6%) 2,907 (51.7%)
Alcohol
causes harm
to unborn
child or
mother
250 (4.4%) 282 (5.0%) 329 (5.9%) 27 (0.5%) 58 (1.0%) 43 (0.8%) 59 (1.0%) 81 (1.4%) 128 (2.3%) 233 (4.1%) 1,490 (26.5%)
The text
refers to a
warning or
an important
message
32 (0.6%) 41 (0.7%) 56 (1.0%) 7 (0.1%) 17 (0.3%) 18 (0.3%) 9 (0.2%) 22 (0.4%) 37 (0.7%) 66 (1.2%) 305 (5.4%)
Alcohol and Pregnancy Labelling Evaluation - Appendices 69
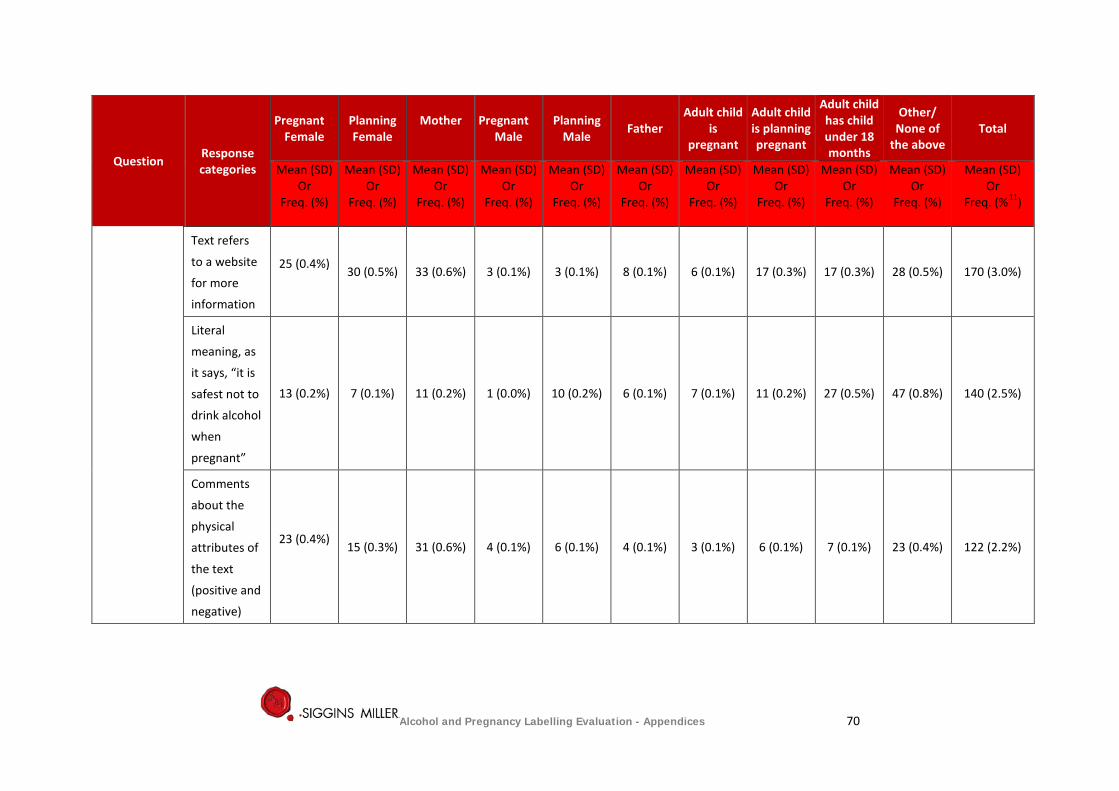
Question Response categories
Pregnant Female
Planning Female
Mother
Pregnant Male
Planning Male Father
Adult child is
pregnant
Adult child is planning pregnant
Adult child has child under 18 months
Other/ None of
the above Total
Mean (SD) Or
Freq. (%)
Mean (SD) Or
Freq. (%)
Mean (SD) Or
Freq. (%)
Mean (SD) Or
Freq. (%)
Mean (SD) Or
Freq. (%)
Mean (SD) Or
Freq. (%)
Mean (SD) Or
Freq. (%)
Mean (SD) Or
Freq. (%)
Mean (SD) Or
Freq. (%)
Mean (SD) Or
Freq. (%)
Mean (SD) Or
Freq. (%11)
Text refers
to a website
for more
information
25 (0.4%) 30 (0.5%) 33 (0.6%) 3 (0.1%) 3 (0.1%) 8 (0.1%) 6 (0.1%) 17 (0.3%) 17 (0.3%) 28 (0.5%) 170 (3.0%)
Literal
meaning, as
it says, “it is
safest not to
drink alcohol
when
pregnant”
13 (0.2%) 7 (0.1%) 11 (0.2%) 1 (0.0%) 10 (0.2%) 6 (0.1%) 7 (0.1%) 11 (0.2%) 27 (0.5%) 47 (0.8%) 140 (2.5%)
Comments
about the
physical
attributes of
the text
(positive and
negative)
23 (0.4%) 15 (0.3%) 31 (0.6%) 4 (0.1%) 6 (0.1%) 4 (0.1%) 3 (0.1%) 6 (0.1%) 7 (0.1%) 23 (0.4%) 122 (2.2%)
Alcohol and Pregnancy Labelling Evaluation - Appendices 70
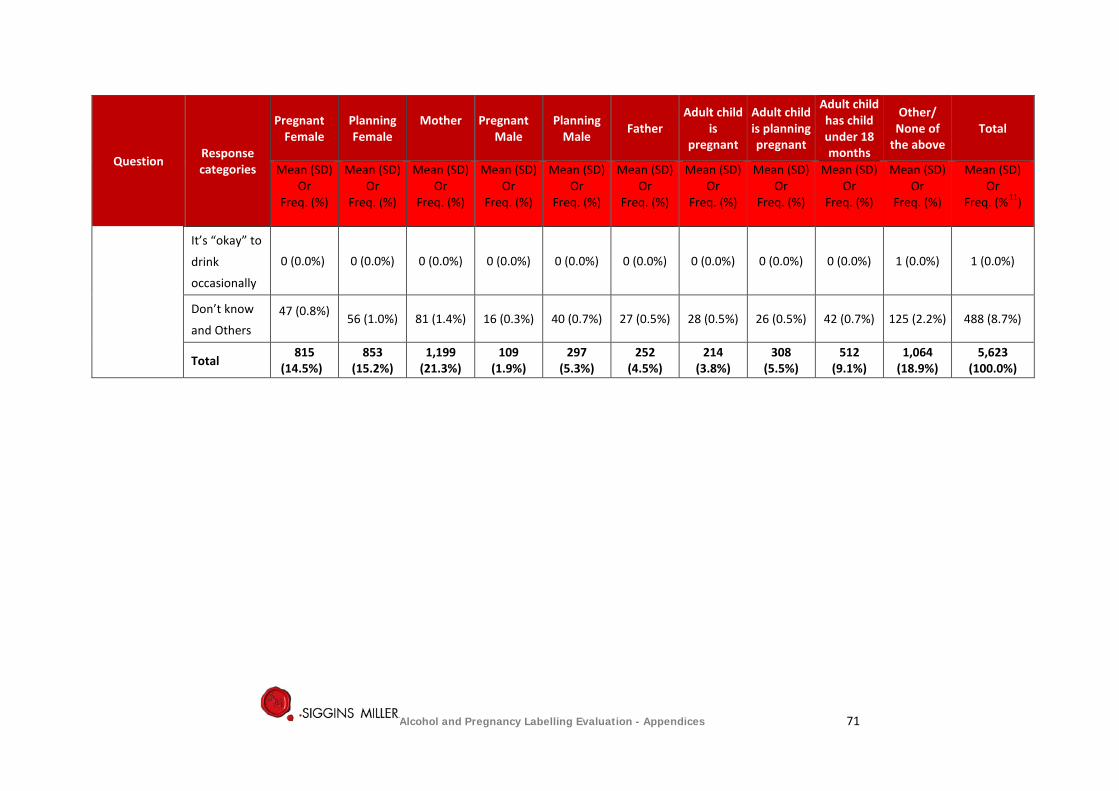
Question Response categories
Pregnant Female
Planning Female
Mother
Pregnant Male
Planning Male Father
Adult child is
pregnant
Adult child is planning pregnant
Adult child has child under 18 months
Other/ None of
the above Total
Mean (SD) Or
Freq. (%)
Mean (SD) Or
Freq. (%)
Mean (SD) Or
Freq. (%)
Mean (SD) Or
Freq. (%)
Mean (SD) Or
Freq. (%)
Mean (SD) Or
Freq. (%)
Mean (SD) Or
Freq. (%)
Mean (SD) Or
Freq. (%)
Mean (SD) Or
Freq. (%)
Mean (SD) Or
Freq. (%)
Mean (SD) Or
Freq. (%11)
It’s “okay” to
drink
occasionally
0 (0.0%) 0 (0.0%) 0 (0.0%) 0 (0.0%) 0 (0.0%) 0 (0.0%) 0 (0.0%) 0 (0.0%) 0 (0.0%) 1 (0.0%) 1 (0.0%)
Don’t know
and Others 47 (0.8%)
56 (1.0%) 81 (1.4%) 16 (0.3%) 40 (0.7%) 27 (0.5%) 28 (0.5%) 26 (0.5%) 42 (0.7%) 125 (2.2%) 488 (8.7%)
Total 815
(14.5%) 853
(15.2%) 1,199
(21.3%) 109
(1.9%) 297
(5.3%) 252
(4.5%) 214
(3.8%) 308
(5.5%) 512
(9.1%) 1,064
(18.9%) 5,623
(100.0%)
Alcohol and Pregnancy Labelling Evaluation - Appendices 71
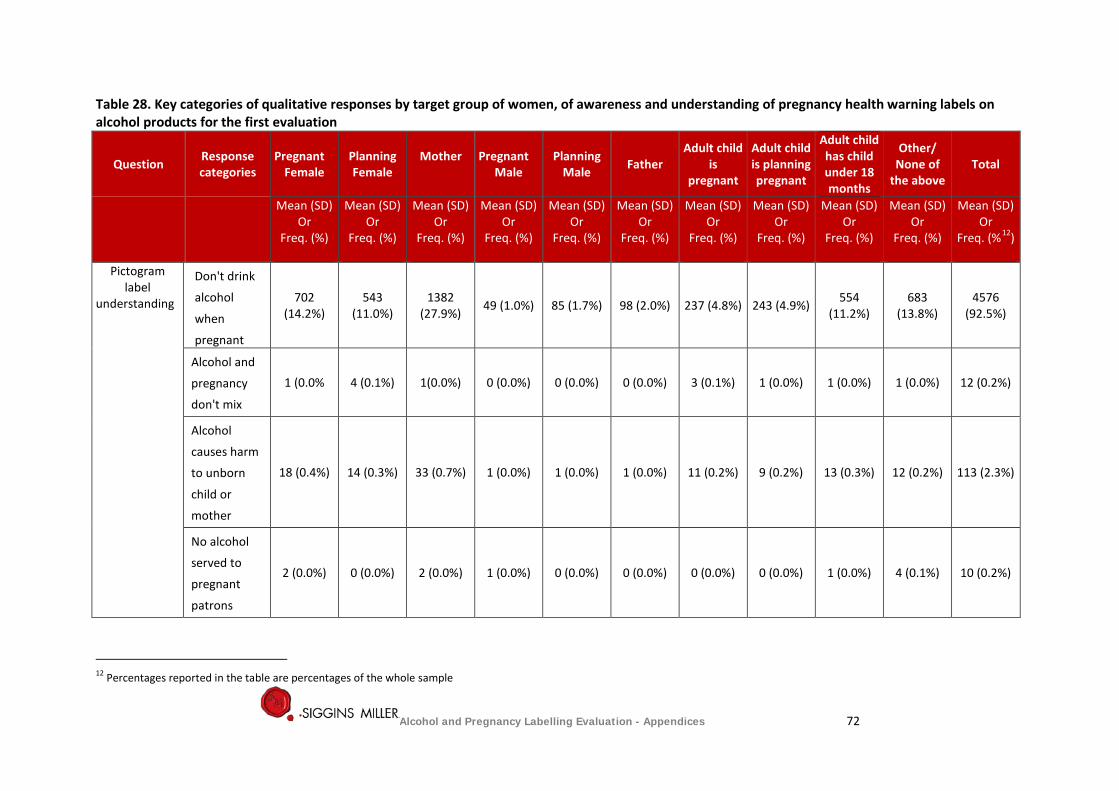
Table 28. Key categories of qualitative responses by target group of women, of awareness and understanding of pregnancy health warning labels on alcohol products for the first evaluation
Question Response categories
Pregnant Female
Planning Female
Mother
Pregnant Male
Planning Male Father
Adult child is
pregnant
Adult child is planning pregnant
Adult child has child under 18 months
Other/ None of
the above Total
Mean (SD) Or
Freq. (%)
Mean (SD) Or
Freq. (%)
Mean (SD) Or
Freq. (%)
Mean (SD) Or
Freq. (%)
Mean (SD) Or
Freq. (%)
Mean (SD) Or
Freq. (%)
Mean (SD) Or
Freq. (%)
Mean (SD) Or
Freq. (%)
Mean (SD) Or
Freq. (%)
Mean (SD) Or
Freq. (%)
Mean (SD) Or
Freq. (%12)
Pictogram label
understanding
Don't drink
alcohol
when
pregnant
702 (14.2%)
543 (11.0%)
1382 (27.9%) 49 (1.0%) 85 (1.7%) 98 (2.0%) 237 (4.8%) 243 (4.9%) 554
(11.2%) 683
(13.8%) 4576
(92.5%)
Alcohol and
pregnancy
don't mix
1 (0.0% 4 (0.1%) 1(0.0%) 0 (0.0%) 0 (0.0%) 0 (0.0%) 3 (0.1%) 1 (0.0%) 1 (0.0%) 1 (0.0%) 12 (0.2%)
Alcohol
causes harm
to unborn
child or
mother
18 (0.4%) 14 (0.3%) 33 (0.7%) 1 (0.0%) 1 (0.0%) 1 (0.0%) 11 (0.2%) 9 (0.2%) 13 (0.3%) 12 (0.2%) 113 (2.3%)
No alcohol
served to
pregnant
patrons
2 (0.0%) 0 (0.0%) 2 (0.0%) 1 (0.0%) 0 (0.0%) 0 (0.0%) 0 (0.0%) 0 (0.0%) 1 (0.0%) 4 (0.1%) 10 (0.2%)
12 Percentages reported in the table are percentages of the whole sample
Alcohol and Pregnancy Labelling Evaluation - Appendices 72
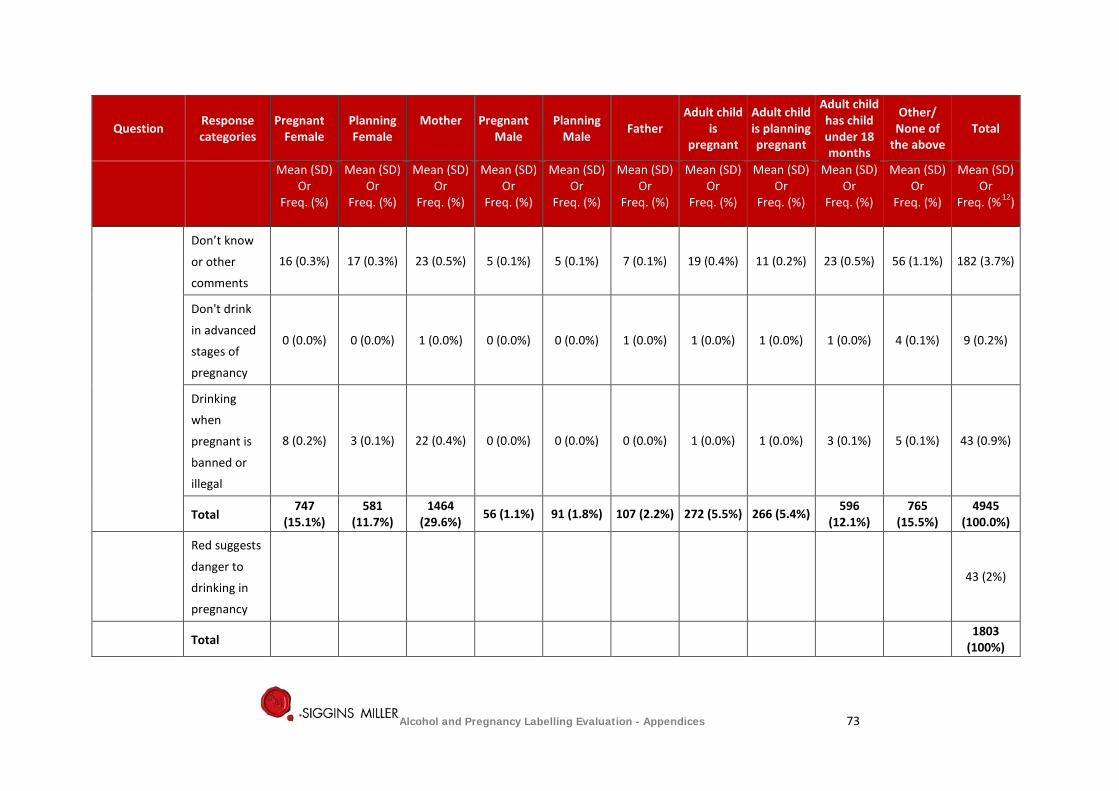
Question Response categories
Pregnant Female
Planning Female
Mother
Pregnant Male
Planning Male Father
Adult child is
pregnant
Adult child is planning pregnant
Adult child has child under 18 months
Other/ None of
the above Total
Mean (SD) Or
Freq. (%)
Mean (SD) Or
Freq. (%)
Mean (SD) Or
Freq. (%)
Mean (SD) Or
Freq. (%)
Mean (SD) Or
Freq. (%)
Mean (SD) Or
Freq. (%)
Mean (SD) Or
Freq. (%)
Mean (SD) Or
Freq. (%)
Mean (SD) Or
Freq. (%)
Mean (SD) Or
Freq. (%)
Mean (SD) Or
Freq. (%12)
Don’t know
or other
comments
16 (0.3%) 17 (0.3%) 23 (0.5%) 5 (0.1%) 5 (0.1%) 7 (0.1%) 19 (0.4%) 11 (0.2%) 23 (0.5%) 56 (1.1%) 182 (3.7%)
Don't drink
in advanced
stages of
pregnancy
0 (0.0%) 0 (0.0%) 1 (0.0%) 0 (0.0%) 0 (0.0%) 1 (0.0%) 1 (0.0%) 1 (0.0%) 1 (0.0%) 4 (0.1%) 9 (0.2%)
Drinking
when
pregnant is
banned or
illegal
8 (0.2%) 3 (0.1%) 22 (0.4%) 0 (0.0%) 0 (0.0%) 0 (0.0%) 1 (0.0%) 1 (0.0%) 3 (0.1%) 5 (0.1%) 43 (0.9%)
Total 747
(15.1%) 581
(11.7%) 1464
(29.6%) 56 (1.1%) 91 (1.8%) 107 (2.2%) 272 (5.5%) 266 (5.4%) 596 (12.1%)
765 (15.5%)
4945 (100.0%)
Red suggests
danger to
drinking in
pregnancy
43 (2%)
Total 1803 (100%)
Alcohol and Pregnancy Labelling Evaluation - Appendices 73
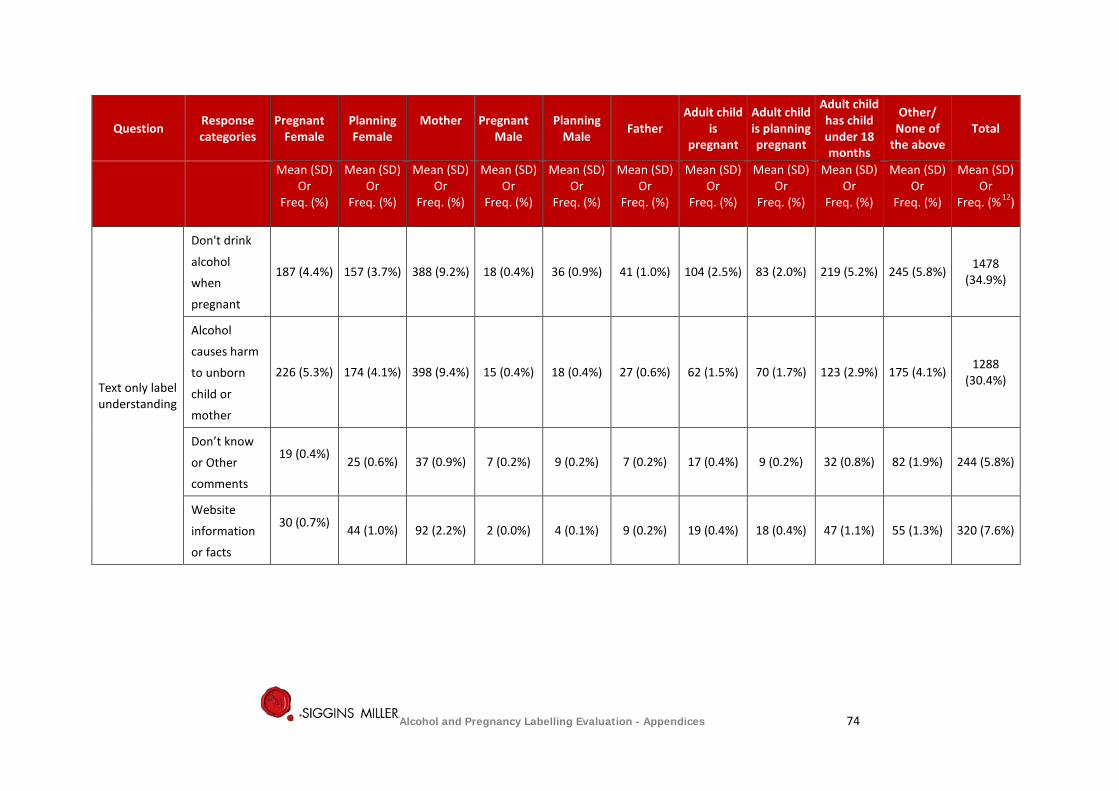
Question Response categories
Pregnant Female
Planning Female
Mother
Pregnant Male
Planning Male Father
Adult child is
pregnant
Adult child is planning pregnant
Adult child has child under 18 months
Other/ None of
the above Total
Mean (SD) Or
Freq. (%)
Mean (SD) Or
Freq. (%)
Mean (SD) Or
Freq. (%)
Mean (SD) Or
Freq. (%)
Mean (SD) Or
Freq. (%)
Mean (SD) Or
Freq. (%)
Mean (SD) Or
Freq. (%)
Mean (SD) Or
Freq. (%)
Mean (SD) Or
Freq. (%)
Mean (SD) Or
Freq. (%)
Mean (SD) Or
Freq. (%12)
Text only label understanding
Don't drink
alcohol
when
pregnant
187 (4.4%) 157 (3.7%) 388 (9.2%) 18 (0.4%) 36 (0.9%) 41 (1.0%) 104 (2.5%) 83 (2.0%) 219 (5.2%) 245 (5.8%) 1478 (34.9%)
Alcohol
causes harm
to unborn
child or
mother
226 (5.3%) 174 (4.1%) 398 (9.4%) 15 (0.4%) 18 (0.4%) 27 (0.6%) 62 (1.5%) 70 (1.7%) 123 (2.9%) 175 (4.1%) 1288 (30.4%)
Don’t know
or Other
comments
19 (0.4%) 25 (0.6%) 37 (0.9%) 7 (0.2%) 9 (0.2%) 7 (0.2%) 17 (0.4%) 9 (0.2%) 32 (0.8%) 82 (1.9%) 244 (5.8%)
Website
information
or facts
30 (0.7%) 44 (1.0%) 92 (2.2%) 2 (0.0%) 4 (0.1%) 9 (0.2%) 19 (0.4%) 18 (0.4%) 47 (1.1%) 55 (1.3%) 320 (7.6%)
Alcohol and Pregnancy Labelling Evaluation - Appendices 74

Question Response categories
Pregnant Female
Planning Female
Mother
Pregnant Male
Planning Male Father
Adult child is
pregnant
Adult child is planning pregnant
Adult child has child under 18 months
Other/ None of
the above Total
Mean (SD) Or
Freq. (%)
Mean (SD) Or
Freq. (%)
Mean (SD) Or
Freq. (%)
Mean (SD) Or
Freq. (%)
Mean (SD) Or
Freq. (%)
Mean (SD) Or
Freq. (%)
Mean (SD) Or
Freq. (%)
Mean (SD) Or
Freq. (%)
Mean (SD) Or
Freq. (%)
Mean (SD) Or
Freq. (%)
Mean (SD) Or
Freq. (%12)
DrinkWise
recommend
ations
information
suggestion
or warnings
77 (1.8%) 74 (1.7%) 189 (4.5%) 5 (0.1%) 10 (0.2%) 8 (0.2%) 35 (0.8%) 48 (1.1%) 82 (1.9%) 80 (1.9%) 608 (14.4%)
Literal
meaning, as
it says, “it is
safest not to
drink alcohol
when
pregnant”
39 (0.9%) 17 (0.4%) 57 (1.3%) 2 (0.0%) 6 (0.1%) 7 (0.2%) 12 (0.3%) 20 (0.5%) 42 (1.0%) 46 (1.1%) 248 (5.9%)
Occasional
drink ok 5 (0.1%) 2 (0.0%) 7 (0.2%) 0 (0.0%) 0 (0.0%) 0 (0.0%) 3 (0.1%) 2 (0.0%) 1 (0.0%) 2 (0.0%) 22 (0.5%)
Confusing
message 5 (0.1%) 2 (0.0%) 7 (0.2%) 0 (0.0%) 0 (0.0%) 0 (0.0%) 4 (0.1%) 1 (0.0%) 2 (0.0%) 1 (0.0%) 22 (0.5%)
Pregnancy
and alcohol
don’t mix
0(0.0%) 0(0.0%) 0(0.0%) 0(0.0%) 1(0.0) 0(0.0%) 1(0.0%) 1(0.0%) 0(0.0%) 0(0.0%) 3(0.1%)
Alcohol and Pregnancy Labelling Evaluation - Appendices 75
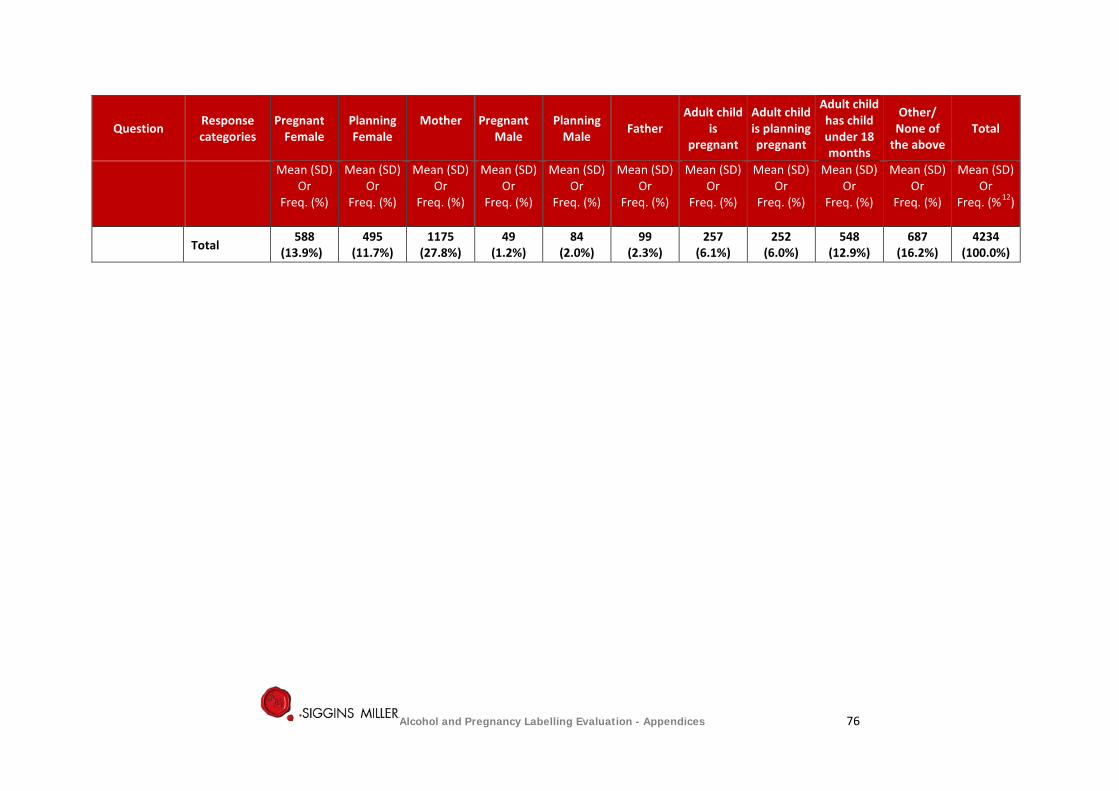
Question Response categories
Pregnant Female
Planning Female
Mother
Pregnant Male
Planning Male Father
Adult child is
pregnant
Adult child is planning pregnant
Adult child has child under 18 months
Other/ None of
the above Total
Mean (SD) Or
Freq. (%)
Mean (SD) Or
Freq. (%)
Mean (SD) Or
Freq. (%)
Mean (SD) Or
Freq. (%)
Mean (SD) Or
Freq. (%)
Mean (SD) Or
Freq. (%)
Mean (SD) Or
Freq. (%)
Mean (SD) Or
Freq. (%)
Mean (SD) Or
Freq. (%)
Mean (SD) Or
Freq. (%)
Mean (SD) Or
Freq. (%12)
Total 588
(13.9%) 495
(11.7%) 1175
(27.8%) 49
(1.2%) 84
(2.0%) 99
(2.3%) 257
(6.1%) 252
(6.0%) 548
(12.9%) 687
(16.2%) 4234
(100.0%)
Alcohol and Pregnancy Labelling Evaluation - Appendices 76
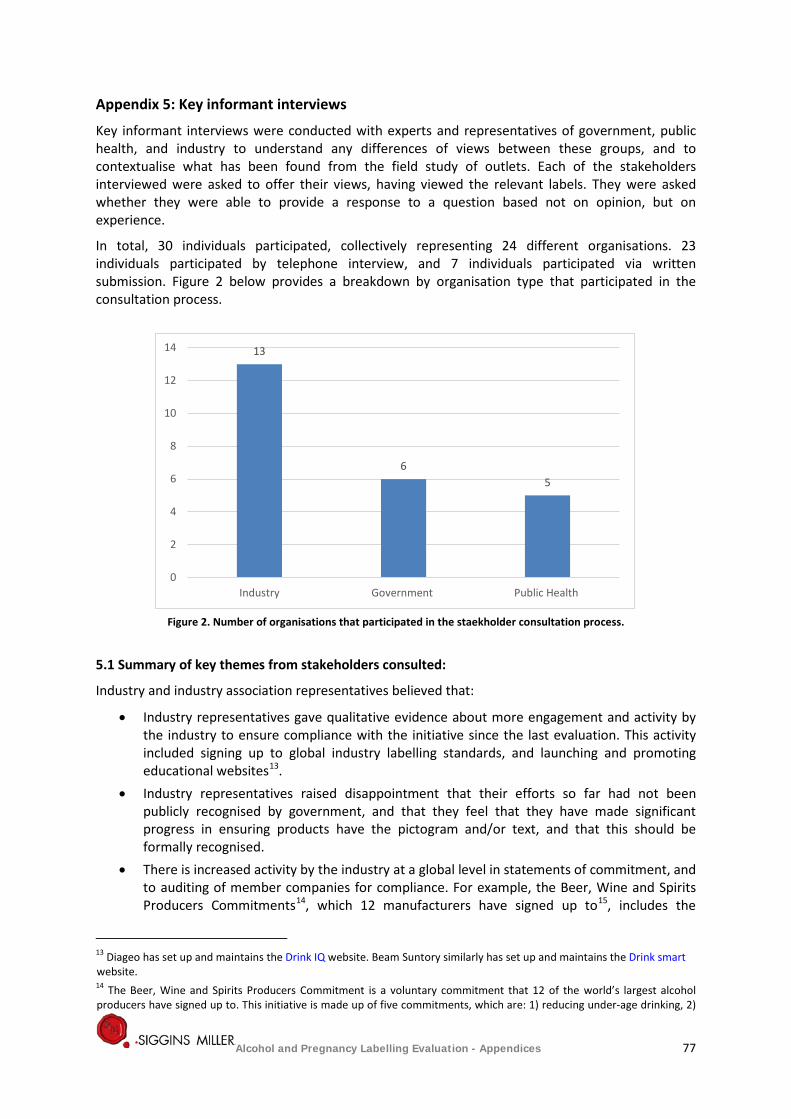
Appendix 5: Key informant interviews
Key informant interviews were conducted with experts and representatives of government, public health, and industry to understand any differences of views between these groups, and to contextualise what has been found from the field study of outlets. Each of the stakeholders interviewed were asked to offer their views, having viewed the relevant labels. They were asked whether they were able to provide a response to a question based not on opinion, but on experience.
In total, 30 individuals participated, collectively representing 24 different organisations. 23 individuals participated by telephone interview, and 7 individuals participated via written submission. Figure 2 below provides a breakdown by organisation type that participated in the consultation process.
Figure 2. Number of organisations that participated in the staekholder consultation process.
5.1 Summary of key themes from stakeholders consulted:
Industry and industry association representatives believed that:
• Industry representatives gave qualitative evidence about more engagement and activity by the industry to ensure compliance with the initiative since the last evaluation. This activity included signing up to global industry labelling standards, and launching and promoting educational websites13.
• Industry representatives raised disappointment that their efforts so far had not been publicly recognised by government, and that they feel that they have made significant progress in ensuring products have the pictogram and/or text, and that this should be formally recognised.
• There is increased activity by the industry at a global level in statements of commitment, and to auditing of member companies for compliance. For example, the Beer, Wine and Spirits Producers Commitments14, which 12 manufacturers have signed up to15, includes the
13 Diageo has set up and maintains the Drink IQ website. Beam Suntory similarly has set up and maintains the Drink smart website. 14 The Beer, Wine and Spirits Producers Commitment is a voluntary commitment that 12 of the world’s largest alcohol producers have signed up to. This initiative is made up of five commitments, which are: 1) reducing under-age drinking, 2)
13
6 5
0
2
4
6
8
10
12
14
Industry Government Public Health
Alcohol and Pregnancy Labelling Evaluation - Appendices 77
voluntary placement of pregnancy labels on alcohol packaging among other commitments to reduce harms caused by alcohol. This initiative also involves an auditing process, where key performance indicators (KPIs) were developed for each of the five commitments, and progress towards these KPIs is measured against these KPI’s by a third party16
• Industry sources interviewed strongly expressed the view that the provision of resources from DrinkWise has been a significant enabler to implementing the label, and that the resources and guidelines have been provided in a straightforward and easy to implement manner.
• DrinkWise advised that in 2016, it completed the redesign of its Logo and suite of consumer information messages for alcohol products and packaging. All DrinkWise registered portal users were advised of these updates and encouraged to use the redesigned suite during November 2016. DrinkWise also advised that they are undertaking a point of sale campaign in April and May 2017 which includes displaying pregnancy information messages and logos in the retail outlets.
• Winemakers expressed concern about the DrinkWise point of sale campaign material not fitting the look, feel and overall design of cellar door outlets. The winemakers advised that they requested DrinkWise consider making materials suitable for display within the cellar door aesthetic.
• Costs of having to re-label products, should there be changes to the pictogram or guidelines, are likely to be high. They may also entail the wastage of a large volume of raw materials. Industry representatives agreed that the sources of the costs are likely to be:
o Redesigning the labels – which requires the input of many departments within manufacterer’s organisation, and likely to involve the services of other third parties, such as creative design agencies.
o The costs of creating new printing plates for each product, and likley reduction in printing efficiencies (such as the number of labels they can produce per sheet)
• Since the first review in 2014, there has been an apparent turnover of the personnel responsible for health warnings on alcohol. Industry stakeholders reported a significantly increased overt commitment to corporate social responsibility in relation to the promotion of the responsible consumption of alcohol; but still observed resistance to mandatory labelling requirements.
• Some parts of the industry report the implementation of other health related messages on labels on a voluntary basis, in particular, nutritional information panels and links to websites with more in-depth information.
• At both timepoints (2014 and 2017) there was general agreement that the flexibility allowed for under the voluntary labelling agreement is appreciated by the industry and has supported peak industry body’s capacity to influence both small and large manufacturers’ compliance with the code.
• There is a recognition by the industry that some small producers are still in the process of understanding the requirements of the voluntary code; and that the peak bodies and larger
strengthening and expanding marketing codes of practice, 3) providing consumer information and responsible product innovation, 4) reducing drinking and driving and 5) enlisting the support of retailers to reduce harmful drinking. The overall aim of the initiative is to achieve “at least a 10% relative reduction in the harmful use of alcohol” by 2025. 15 The manufacturers who have signed up to this initiative are: AB InBev, Molson Coors, Beam Suntory, Asahi, Bacardi Limited, Pernod Ricard, Carlsberg Group, SAB Miller, Diageo, Brown-Forman, Heineken Group and Kirin. 16 A progress report was released in 2015, and included an audit of the manufacturer’s progress against their key performance indicators. The report can be found here: Beer Wine Spirits Producers' Commitments
Alcohol and Pregnancy Labelling Evaluation - Appendices 78
companies who purchase from them are continuously in the process of working with these smaller producers to achieve compliance.
• It was agreed that supplementary activities, such as a communication and awareness raising campaign, were critical to increasing awareness and understanding of drinking while pregnant.
• Concerns were raised about the demand for space on labels being high and potentially unrealistic. There are already several mandatory labelling requirements (number of standard drinks etc.) and that there is only so much that can be put on a label.
• Industry stakeholders also raised concerns that having a large number of mandatory labelling requirements will cause consumers to become ‘sign-blind’ and ignore the warnings all together.
Public health and government representatives reported that:
• Responses to questions about visibility and readability largely relied on their own personal observation of products in outlets.
• For industry, there are issues that can stem from balancing commercial realities with initiatives that are designed to reduce consumption. However, public health representatives believe that alcohol manufacturers could off-set any costs by providing alcohol free alternatives – such as ‘mocktails’.
• In July 2017, a significant study funded by the NHMRC and conducted by the Cancer Council Victoria will begin. The study aims to assess the content and design of alcohol warning labels with the greatest potential to encourage drinkers to reduce their alcohol-related risk. Findings from the study are likely to be published in early 2020.
• Along with mandatory pregnancy warning labels on alcohol products, labels should also contain nutritional information like many other food and beverage products are already mandated to do so.
• There are some concerns about the design of the message and labels. These stakeholders believe that the labels are too small, have poor colour contrast with the rest of the packaging, and are placed in locations that consumers are not likely to view. These issues were consistent with the comments they made in the first evaluation.
• Even well-designed mass media campaigns are unlikely to be as powerful as interpersonal communication from trusted sources, such as healthcare professionals. The similar range of structural and legislative changes that have supported anti-smoking campaigns such as price increases and marketing bans/restrictions were suggested as affective.
• For some, the most effective way to achieve consistency of the message would be to make the labelling mandatory. However, it was recognised that there may be costs, both upfront and ongoing of implementing a mandatory labelling initiative.
Collectively, all stakeholder groups: • All stakeholders agreed that healthcare professionals (particularly general practitioners)
need to be more involved in education and awareness of the risks and dangers of drinking while pregnant.
• All stakeholder groups stated, at both evaluation timepoints, that labelling would only have an impact if it were part of ongoing multifaceted education, communication and awareness raising campaigns linking alcohol consumption to harm. They also believe that labels alone are likely not effective at either raising awareness of the risks of drinking while pregnant, or getting individuals to change their behaviour.
Alcohol and Pregnancy Labelling Evaluation - Appendices 79
• Are not convinced that the initiative is being delivered in the most efficient and effective way to its target audience. The key concerns they raised included: − not targeting the demographic effectively, and that the wider community needs to be
made aware of the risks of drinking while pregnant − a need for a more collaborative and supportive approach between government,
industry, public health professionals and frontline health care providers − a greater emphasis on educating front line healthcare providers as a key source of
credible information and to provide consistent messages about drinking while being pregnant to individuals
− messages need to be directed to the community as a whole, not only pregnant women but also to their friends and families
− the pictogram by itself is not going to convey the full message, as a symbol can only convey simple information. The pictogram should serve as a reminder or prompt of information that is provided in full elsewhere (such as from healthcare providers, or from public health campaigns).
Alcohol and Pregnancy Labelling Evaluation - Appendices 80
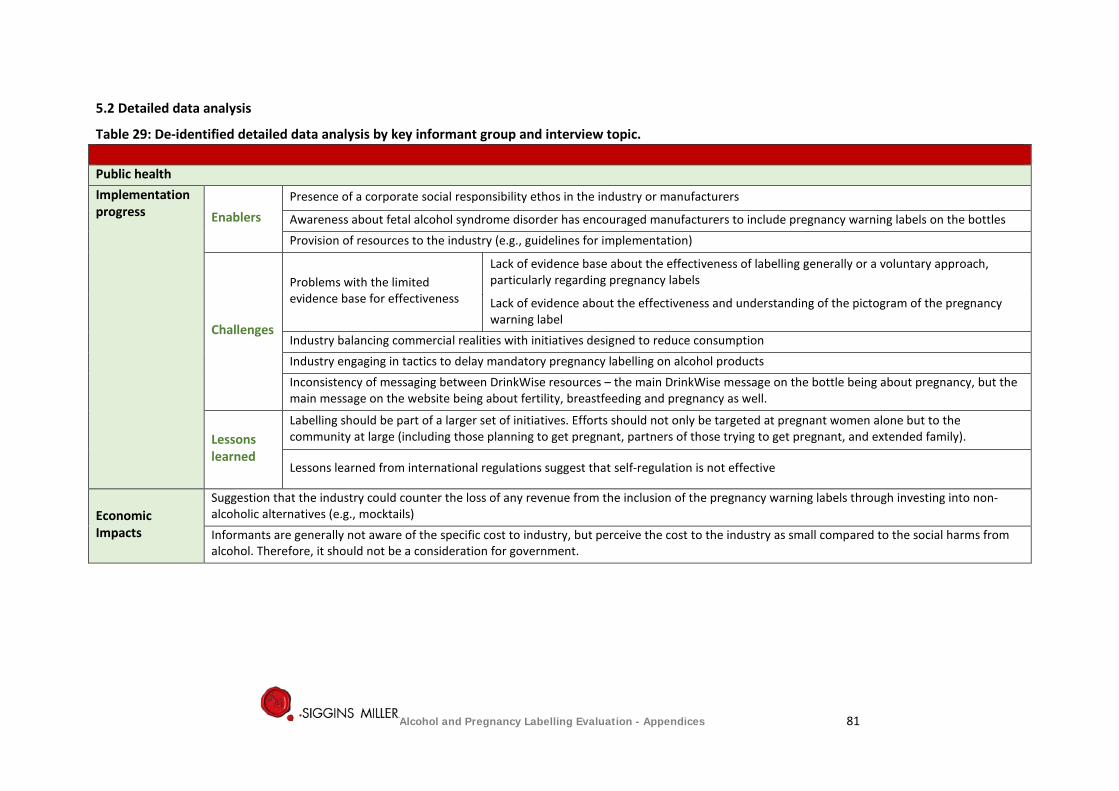
5.2 Detailed data analysis
Table 29: De-identified detailed data analysis by key informant group and interview topic. Public health Implementation progress Enablers
Presence of a corporate social responsibility ethos in the industry or manufacturers
Awareness about fetal alcohol syndrome disorder has encouraged manufacturers to include pregnancy warning labels on the bottles Provision of resources to the industry (e.g., guidelines for implementation)
Challenges
Problems with the limited evidence base for effectiveness
Lack of evidence base about the effectiveness of labelling generally or a voluntary approach, particularly regarding pregnancy labels
Lack of evidence about the effectiveness and understanding of the pictogram of the pregnancy warning label
Industry balancing commercial realities with initiatives designed to reduce consumption Industry engaging in tactics to delay mandatory pregnancy labelling on alcohol products Inconsistency of messaging between DrinkWise resources – the main DrinkWise message on the bottle being about pregnancy, but the main message on the website being about fertility, breastfeeding and pregnancy as well.
Lessons learned
Labelling should be part of a larger set of initiatives. Efforts should not only be targeted at pregnant women alone but to the community at large (including those planning to get pregnant, partners of those trying to get pregnant, and extended family).
Lessons learned from international regulations suggest that self-regulation is not effective
Economic Impacts
Suggestion that the industry could counter the loss of any revenue from the inclusion of the pregnancy warning labels through investing into non-alcoholic alternatives (e.g., mocktails) Informants are generally not aware of the specific cost to industry, but perceive the cost to the industry as small compared to the social harms from alcohol. Therefore, it should not be a consideration for government.
Alcohol and Pregnancy Labelling Evaluation - Appendices 81
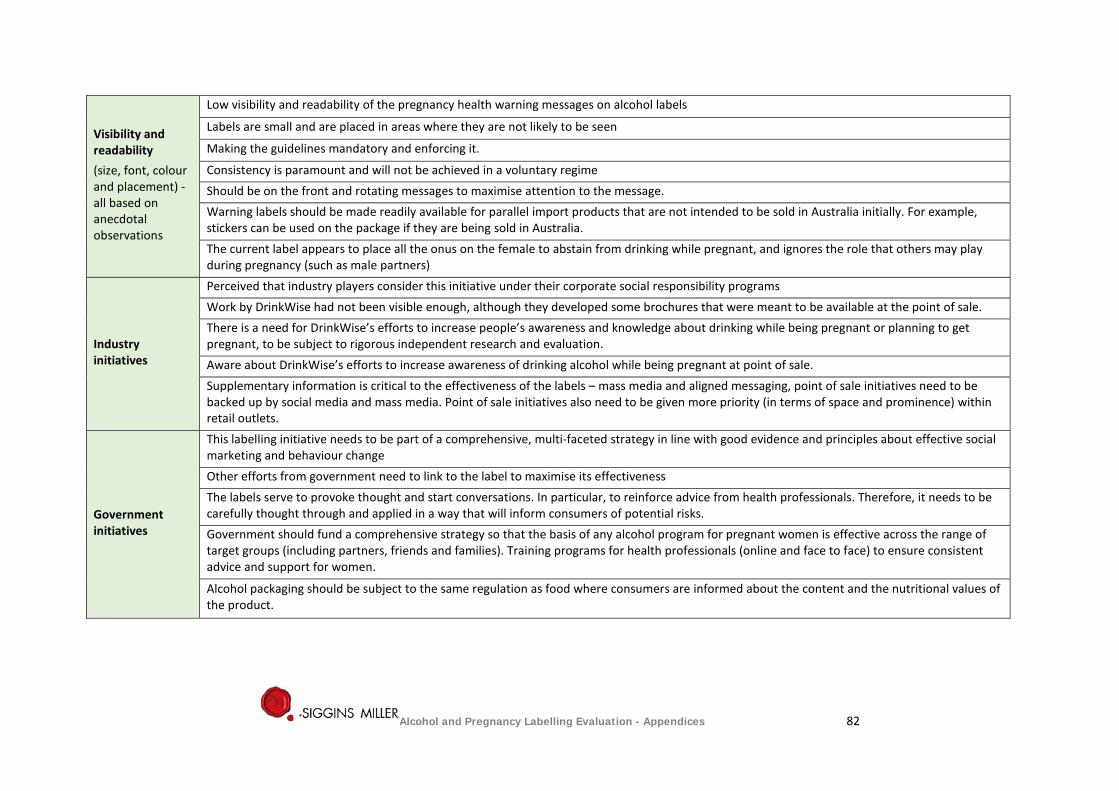
Visibility and readability (size, font, colour and placement) - all based on anecdotal observations
Low visibility and readability of the pregnancy health warning messages on alcohol labels
Labels are small and are placed in areas where they are not likely to be seen
Making the guidelines mandatory and enforcing it.
Consistency is paramount and will not be achieved in a voluntary regime Should be on the front and rotating messages to maximise attention to the message. Warning labels should be made readily available for parallel import products that are not intended to be sold in Australia initially. For example, stickers can be used on the package if they are being sold in Australia. The current label appears to place all the onus on the female to abstain from drinking while pregnant, and ignores the role that others may play during pregnancy (such as male partners)
Industry initiatives
Perceived that industry players consider this initiative under their corporate social responsibility programs Work by DrinkWise had not been visible enough, although they developed some brochures that were meant to be available at the point of sale. There is a need for DrinkWise’s efforts to increase people’s awareness and knowledge about drinking while being pregnant or planning to get pregnant, to be subject to rigorous independent research and evaluation. Aware about DrinkWise’s efforts to increase awareness of drinking alcohol while being pregnant at point of sale. Supplementary information is critical to the effectiveness of the labels – mass media and aligned messaging, point of sale initiatives need to be backed up by social media and mass media. Point of sale initiatives also need to be given more priority (in terms of space and prominence) within retail outlets.
Government initiatives
This labelling initiative needs to be part of a comprehensive, multi-faceted strategy in line with good evidence and principles about effective social marketing and behaviour change Other efforts from government need to link to the label to maximise its effectiveness The labels serve to provoke thought and start conversations. In particular, to reinforce advice from health professionals. Therefore, it needs to be carefully thought through and applied in a way that will inform consumers of potential risks. Government should fund a comprehensive strategy so that the basis of any alcohol program for pregnant women is effective across the range of target groups (including partners, friends and families). Training programs for health professionals (online and face to face) to ensure consistent advice and support for women.
Alcohol packaging should be subject to the same regulation as food where consumers are informed about the content and the nutritional values of the product.
Alcohol and Pregnancy Labelling Evaluation - Appendices 82
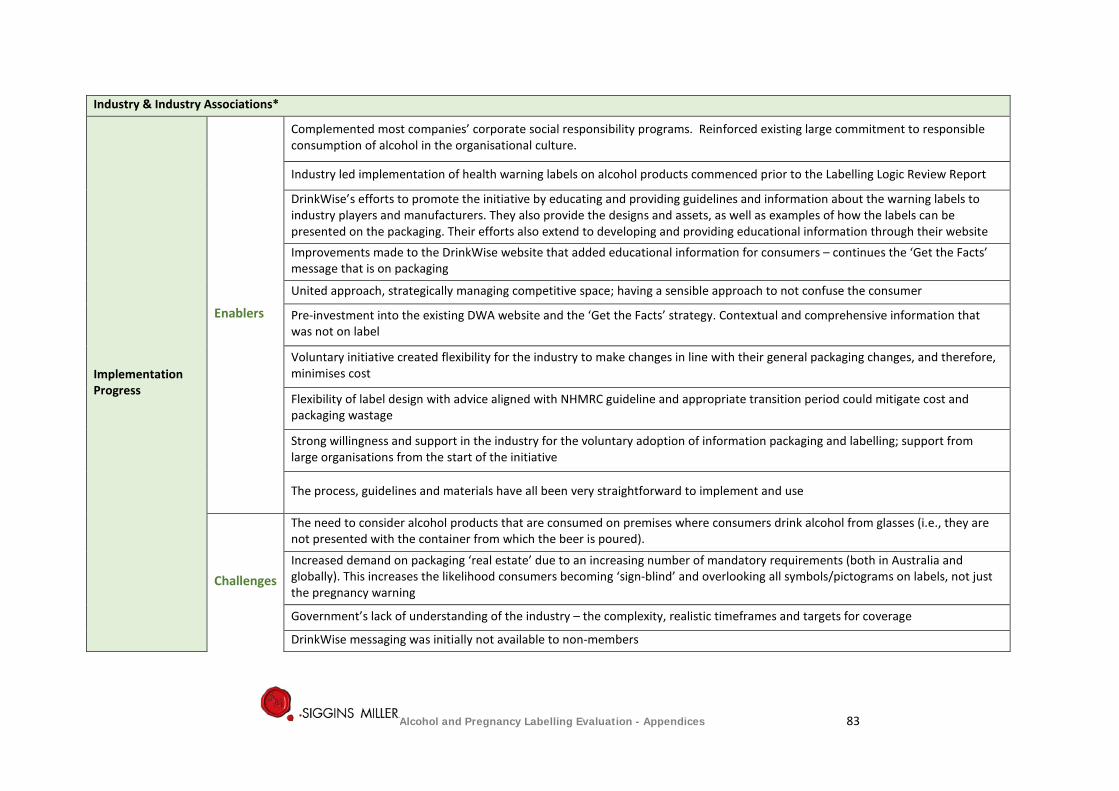
Industry & Industry Associations*
Implementation Progress
Enablers
Complemented most companies’ corporate social responsibility programs. Reinforced existing large commitment to responsible consumption of alcohol in the organisational culture.
Industry led implementation of health warning labels on alcohol products commenced prior to the Labelling Logic Review Report
DrinkWise’s efforts to promote the initiative by educating and providing guidelines and information about the warning labels to industry players and manufacturers. They also provide the designs and assets, as well as examples of how the labels can be presented on the packaging. Their efforts also extend to developing and providing educational information through their website Improvements made to the DrinkWise website that added educational information for consumers – continues the ‘Get the Facts’ message that is on packaging
United approach, strategically managing competitive space; having a sensible approach to not confuse the consumer
Pre-investment into the existing DWA website and the ‘Get the Facts’ strategy. Contextual and comprehensive information that was not on label
Voluntary initiative created flexibility for the industry to make changes in line with their general packaging changes, and therefore, minimises cost
Flexibility of label design with advice aligned with NHMRC guideline and appropriate transition period could mitigate cost and packaging wastage
Strong willingness and support in the industry for the voluntary adoption of information packaging and labelling; support from large organisations from the start of the initiative
The process, guidelines and materials have all been very straightforward to implement and use
Challenges
The need to consider alcohol products that are consumed on premises where consumers drink alcohol from glasses (i.e., they are not presented with the container from which the beer is poured).
Increased demand on packaging ‘real estate’ due to an increasing number of mandatory requirements (both in Australia and globally). This increases the likelihood consumers becoming ‘sign-blind’ and overlooking all symbols/pictograms on labels, not just the pregnancy warning
Government’s lack of understanding of the industry – the complexity, realistic timeframes and targets for coverage
DrinkWise messaging was initially not available to non-members
Alcohol and Pregnancy Labelling Evaluation - Appendices 83
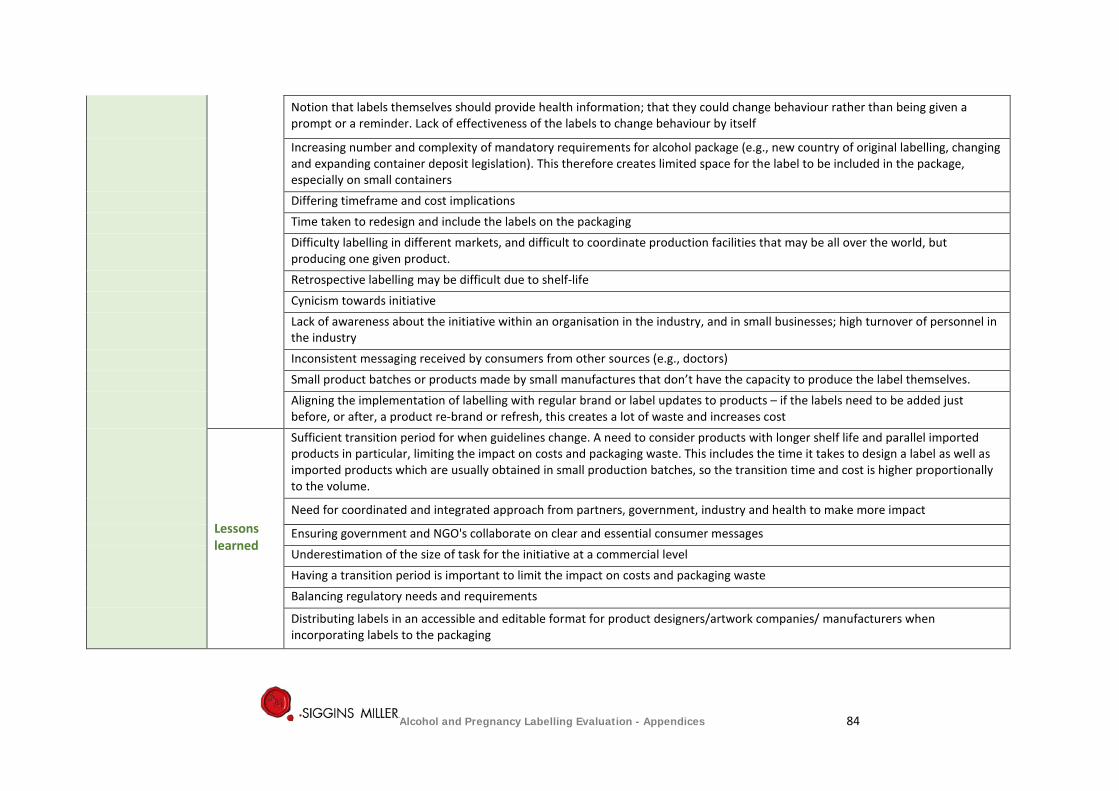
Notion that labels themselves should provide health information; that they could change behaviour rather than being given a prompt or a reminder. Lack of effectiveness of the labels to change behaviour by itself
Increasing number and complexity of mandatory requirements for alcohol package (e.g., new country of original labelling, changing and expanding container deposit legislation). This therefore creates limited space for the label to be included in the package, especially on small containers Differing timeframe and cost implications Time taken to redesign and include the labels on the packaging Difficulty labelling in different markets, and difficult to coordinate production facilities that may be all over the world, but producing one given product. Retrospective labelling may be difficult due to shelf-life Cynicism towards initiative Lack of awareness about the initiative within an organisation in the industry, and in small businesses; high turnover of personnel in the industry Inconsistent messaging received by consumers from other sources (e.g., doctors) Small product batches or products made by small manufactures that don’t have the capacity to produce the label themselves. Aligning the implementation of labelling with regular brand or label updates to products – if the labels need to be added just before, or after, a product re-brand or refresh, this creates a lot of waste and increases cost
Lessons learned
Sufficient transition period for when guidelines change. A need to consider products with longer shelf life and parallel imported products in particular, limiting the impact on costs and packaging waste. This includes the time it takes to design a label as well as imported products which are usually obtained in small production batches, so the transition time and cost is higher proportionally to the volume.
Need for coordinated and integrated approach from partners, government, industry and health to make more impact
Ensuring government and NGO's collaborate on clear and essential consumer messages Underestimation of the size of task for the initiative at a commercial level Having a transition period is important to limit the impact on costs and packaging waste Balancing regulatory needs and requirements
Distributing labels in an accessible and editable format for product designers/artwork companies/ manufacturers when incorporating labels to the packaging
Alcohol and Pregnancy Labelling Evaluation - Appendices 84
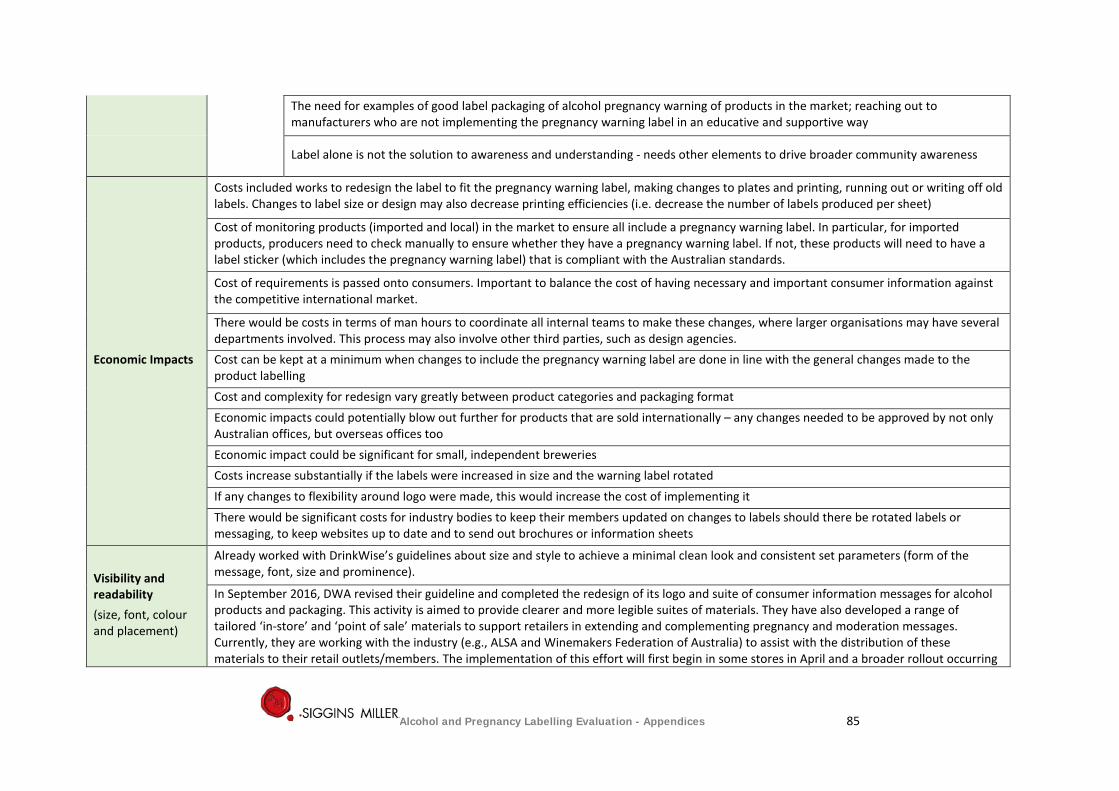
The need for examples of good label packaging of alcohol pregnancy warning of products in the market; reaching out to manufacturers who are not implementing the pregnancy warning label in an educative and supportive way
Label alone is not the solution to awareness and understanding - needs other elements to drive broader community awareness
Economic Impacts
Costs included works to redesign the label to fit the pregnancy warning label, making changes to plates and printing, running out or writing off old labels. Changes to label size or design may also decrease printing efficiencies (i.e. decrease the number of labels produced per sheet)
Cost of monitoring products (imported and local) in the market to ensure all include a pregnancy warning label. In particular, for imported products, producers need to check manually to ensure whether they have a pregnancy warning label. If not, these products will need to have a label sticker (which includes the pregnancy warning label) that is compliant with the Australian standards.
Cost of requirements is passed onto consumers. Important to balance the cost of having necessary and important consumer information against the competitive international market.
There would be costs in terms of man hours to coordinate all internal teams to make these changes, where larger organisations may have several departments involved. This process may also involve other third parties, such as design agencies. Cost can be kept at a minimum when changes to include the pregnancy warning label are done in line with the general changes made to the product labelling Cost and complexity for redesign vary greatly between product categories and packaging format Economic impacts could potentially blow out further for products that are sold internationally – any changes needed to be approved by not only Australian offices, but overseas offices too Economic impact could be significant for small, independent breweries Costs increase substantially if the labels were increased in size and the warning label rotated If any changes to flexibility around logo were made, this would increase the cost of implementing it There would be significant costs for industry bodies to keep their members updated on changes to labels should there be rotated labels or messaging, to keep websites up to date and to send out brochures or information sheets
Visibility and readability (size, font, colour and placement)
Already worked with DrinkWise’s guidelines about size and style to achieve a minimal clean look and consistent set parameters (form of the message, font, size and prominence).
In September 2016, DWA revised their guideline and completed the redesign of its logo and suite of consumer information messages for alcohol products and packaging. This activity is aimed to provide clearer and more legible suites of materials. They have also developed a range of tailored ‘in-store’ and ‘point of sale’ materials to support retailers in extending and complementing pregnancy and moderation messages. Currently, they are working with the industry (e.g., ALSA and Winemakers Federation of Australia) to assist with the distribution of these materials to their retail outlets/members. The implementation of this effort will first begin in some stores in April and a broader rollout occurring
Alcohol and Pregnancy Labelling Evaluation - Appendices 85
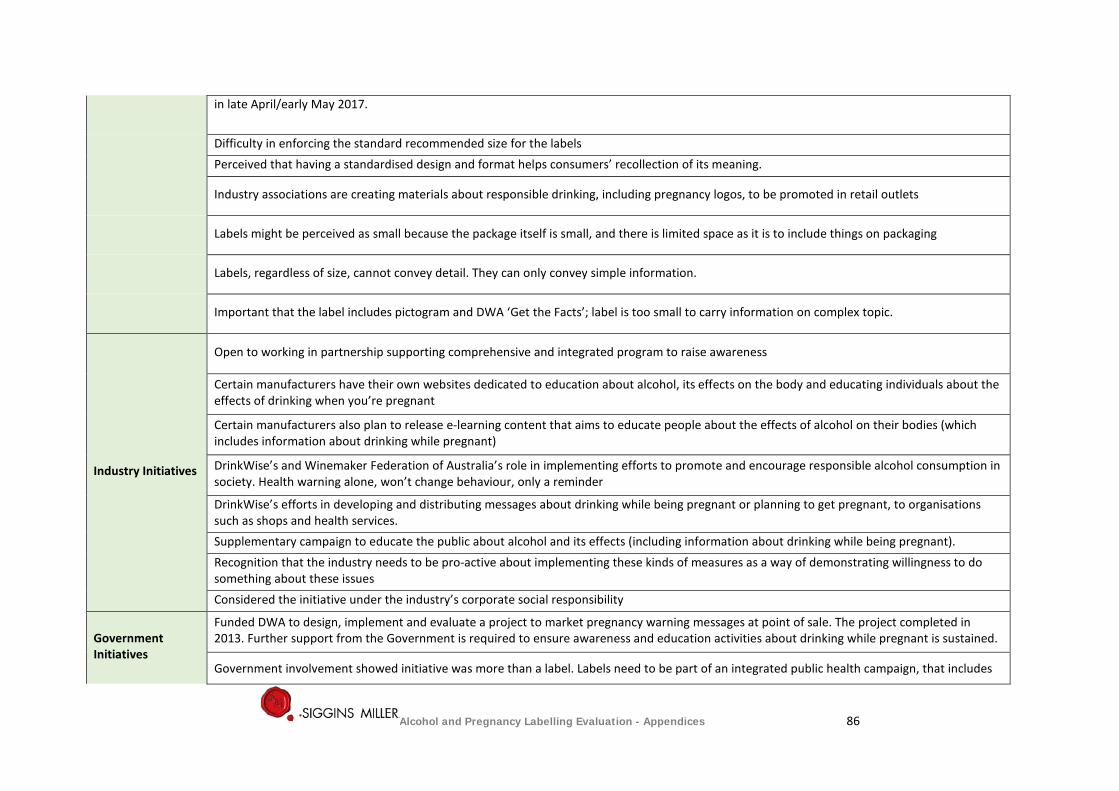
in late April/early May 2017.
Difficulty in enforcing the standard recommended size for the labels Perceived that having a standardised design and format helps consumers’ recollection of its meaning.
Industry associations are creating materials about responsible drinking, including pregnancy logos, to be promoted in retail outlets
Labels might be perceived as small because the package itself is small, and there is limited space as it is to include things on packaging
Labels, regardless of size, cannot convey detail. They can only convey simple information.
Important that the label includes pictogram and DWA ‘Get the Facts’; label is too small to carry information on complex topic.
Industry Initiatives
Open to working in partnership supporting comprehensive and integrated program to raise awareness
Certain manufacturers have their own websites dedicated to education about alcohol, its effects on the body and educating individuals about the effects of drinking when you’re pregnant
Certain manufacturers also plan to release e-learning content that aims to educate people about the effects of alcohol on their bodies (which includes information about drinking while pregnant)
DrinkWise’s and Winemaker Federation of Australia’s role in implementing efforts to promote and encourage responsible alcohol consumption in society. Health warning alone, won’t change behaviour, only a reminder
DrinkWise’s efforts in developing and distributing messages about drinking while being pregnant or planning to get pregnant, to organisations such as shops and health services. Supplementary campaign to educate the public about alcohol and its effects (including information about drinking while being pregnant). Recognition that the industry needs to be pro-active about implementing these kinds of measures as a way of demonstrating willingness to do something about these issues Considered the initiative under the industry’s corporate social responsibility
Government Initiatives
Funded DWA to design, implement and evaluate a project to market pregnancy warning messages at point of sale. The project completed in 2013. Further support from the Government is required to ensure awareness and education activities about drinking while pregnant is sustained.
Government involvement showed initiative was more than a label. Labels need to be part of an integrated public health campaign, that includes
Alcohol and Pregnancy Labelling Evaluation - Appendices 86
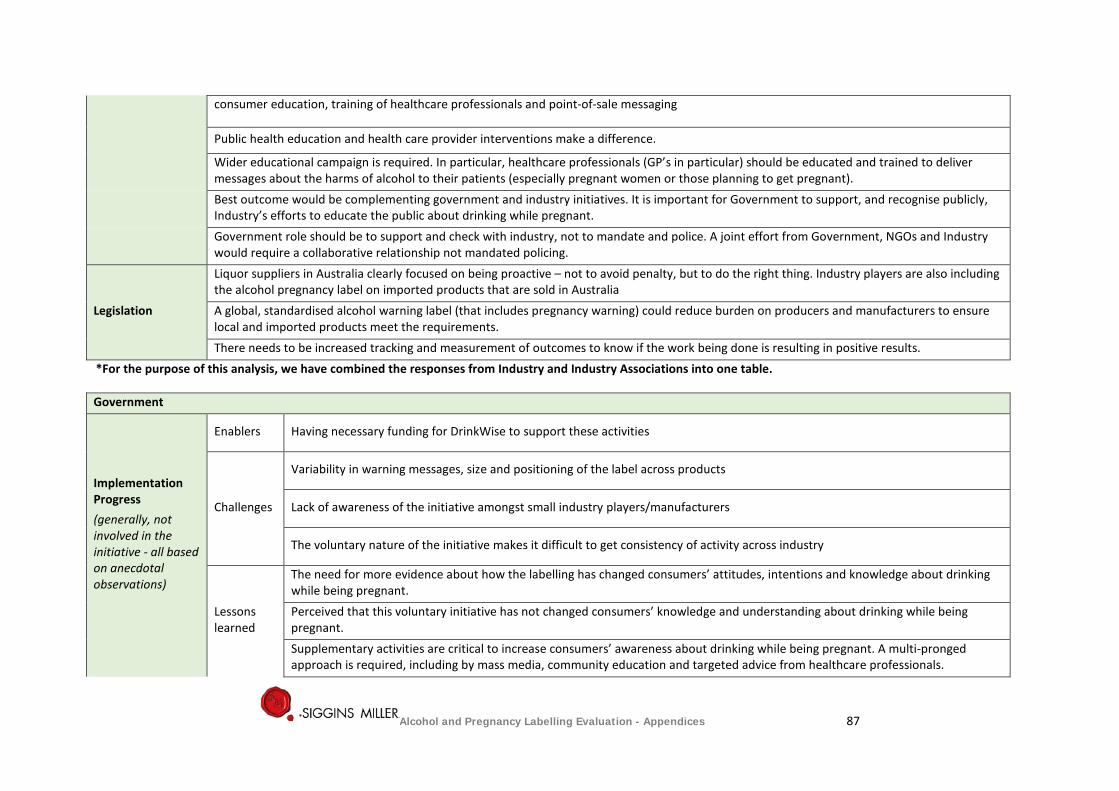
consumer education, training of healthcare professionals and point-of-sale messaging
Public health education and health care provider interventions make a difference.
Wider educational campaign is required. In particular, healthcare professionals (GP’s in particular) should be educated and trained to deliver messages about the harms of alcohol to their patients (especially pregnant women or those planning to get pregnant). Best outcome would be complementing government and industry initiatives. It is important for Government to support, and recognise publicly, Industry’s efforts to educate the public about drinking while pregnant. Government role should be to support and check with industry, not to mandate and police. A joint effort from Government, NGOs and Industry would require a collaborative relationship not mandated policing.
Legislation
Liquor suppliers in Australia clearly focused on being proactive – not to avoid penalty, but to do the right thing. Industry players are also including the alcohol pregnancy label on imported products that are sold in Australia A global, standardised alcohol warning label (that includes pregnancy warning) could reduce burden on producers and manufacturers to ensure local and imported products meet the requirements. There needs to be increased tracking and measurement of outcomes to know if the work being done is resulting in positive results.
*For the purpose of this analysis, we have combined the responses from Industry and Industry Associations into one table. Government
Implementation Progress (generally, not involved in the initiative - all based on anecdotal observations)
Enablers Having necessary funding for DrinkWise to support these activities
Challenges
Variability in warning messages, size and positioning of the label across products
Lack of awareness of the initiative amongst small industry players/manufacturers
The voluntary nature of the initiative makes it difficult to get consistency of activity across industry
Lessons learned
The need for more evidence about how the labelling has changed consumers’ attitudes, intentions and knowledge about drinking while being pregnant. Perceived that this voluntary initiative has not changed consumers’ knowledge and understanding about drinking while being pregnant. Supplementary activities are critical to increase consumers’ awareness about drinking while being pregnant. A multi-pronged approach is required, including by mass media, community education and targeted advice from healthcare professionals.
Alcohol and Pregnancy Labelling Evaluation - Appendices 87
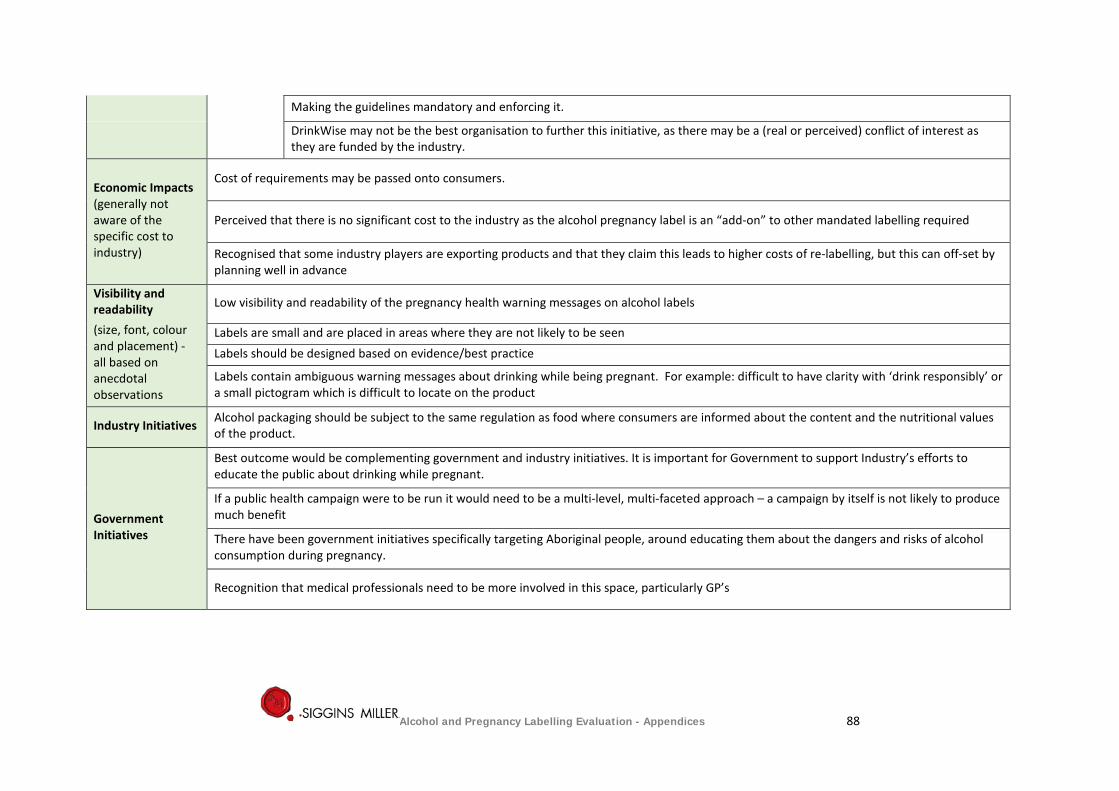
Making the guidelines mandatory and enforcing it.
DrinkWise may not be the best organisation to further this initiative, as there may be a (real or perceived) conflict of interest as they are funded by the industry.
Economic Impacts (generally not aware of the specific cost to industry)
Cost of requirements may be passed onto consumers.
Perceived that there is no significant cost to the industry as the alcohol pregnancy label is an “add-on” to other mandated labelling required
Recognised that some industry players are exporting products and that they claim this leads to higher costs of re-labelling, but this can off-set by planning well in advance
Visibility and readability (size, font, colour and placement) - all based on anecdotal observations
Low visibility and readability of the pregnancy health warning messages on alcohol labels
Labels are small and are placed in areas where they are not likely to be seen Labels should be designed based on evidence/best practice
Labels contain ambiguous warning messages about drinking while being pregnant. For example: difficult to have clarity with ‘drink responsibly’ or a small pictogram which is difficult to locate on the product
Industry Initiatives Alcohol packaging should be subject to the same regulation as food where consumers are informed about the content and the nutritional values of the product.
Government Initiatives
Best outcome would be complementing government and industry initiatives. It is important for Government to support Industry’s efforts to educate the public about drinking while pregnant.
If a public health campaign were to be run it would need to be a multi-level, multi-faceted approach – a campaign by itself is not likely to produce much benefit
There have been government initiatives specifically targeting Aboriginal people, around educating them about the dangers and risks of alcohol consumption during pregnancy.
Recognition that medical professionals need to be more involved in this space, particularly GP’s
Alcohol and Pregnancy Labelling Evaluation - Appendices 88
Appendix 6: Updated literature and document review
6.1 Purpose of the literature and document review
This review briefly documents the context in which the alcohol industry is implementing the voluntary pregnancy health labelling initiative, and reviews key factors affecting implementation, including:
1. Drinking patterns of pregnant women
2. Exposure to alcohol in pregnancy, and Fetal Alcohol Spectrum Disorder (FASD)
3. Awareness and knowledge of the risks associated with drinking alcohol while pregnant
4. Effective reduction of risks to the unborn child arising from drinking alcohol during pregnancy
5. Consumer knowledge about the risks associated with alcohol consumption
6. Implementation of the pregnancy labelling voluntary initiative
7. National and international context of pregnancy warnings
8. Should this labelling be voluntary or mandatory?
9. Visibility and legibility issues of pregnancy health warning labels
10. Reviews of evidence of the effectiveness of health warning labelling of alcohol products
11. The effectiveness of pregnancy health warning labels on alcohol products
6.1.1 Method
This paper revises and updates an earlier literature review prepared during the first phase evaluation of the industry response to the initiative, and it adds selected recent studies to 2016. Relevant reviews of evidence, opinion, and regulation were identified chiefly through Google Scholar, CINHAL, PubMed, Scopus, and references and bibliographies in seminal articles and reports. Search terms included alcohol in pregnancy, alcohol and health, alcohol harms, alcohol-related harm, harmful use of alcohol, labels on alcohol products, labelling alcohol products, drinking by pregnant women food and beverage labelling regulation and policy, mandatory health warning labels, voluntary health warnings/consumer information labelling. A bibliography of references for this review is appended In the two years since we completed the first literature review, a considerable number of pertinent studies has been published, particularly on FASD, and this recent literature is detailed in this updated review. Some significant earlier studies have also been added. There have been some small changes in the results of the 2013 National Household Survey, but in general there have not been any major developments to report on the key factors affecting implementation.
6.2 Drinking patterns of pregnant women in Australia
Despite potential dangers to children’s health, drinking by pregnant women is fairly common in Anglo-Saxon countries such as Australia.17 18 Approximately half of pregnant women self-report drinking alcohol during their pregnancy (see Table 30 below). In Australia, the percentage of women who report drinking during their pregnancy appears to have decreased over time (60% in 2007 to 51% in 2010) and, as shown in Table 30, the proportion of women who report that they reduced the amount they drank while pregnant also appears to have decreased over time (57% in 2007 to 49% in 2010).19 20 21
17 World Health Organisation (2012). Addressing the harmful use of alcohol: a guide to developing effective alcohol legislation. Geneva: World Health Organisation (WHO)
18 World Health Organisation (2010). Global strategy to reduce the harmful use of alcohol. Geneva: World Health Organisation (WHO)
19 Callinan S, Room R (2012). Alcohol consumption during pregnancy: results from the 2010 National Drug Strategy Household Survey. Canberra: Foundation for Alcohol Education and Research (FARE), p21
Alcohol industry voluntary labelling - literature 89
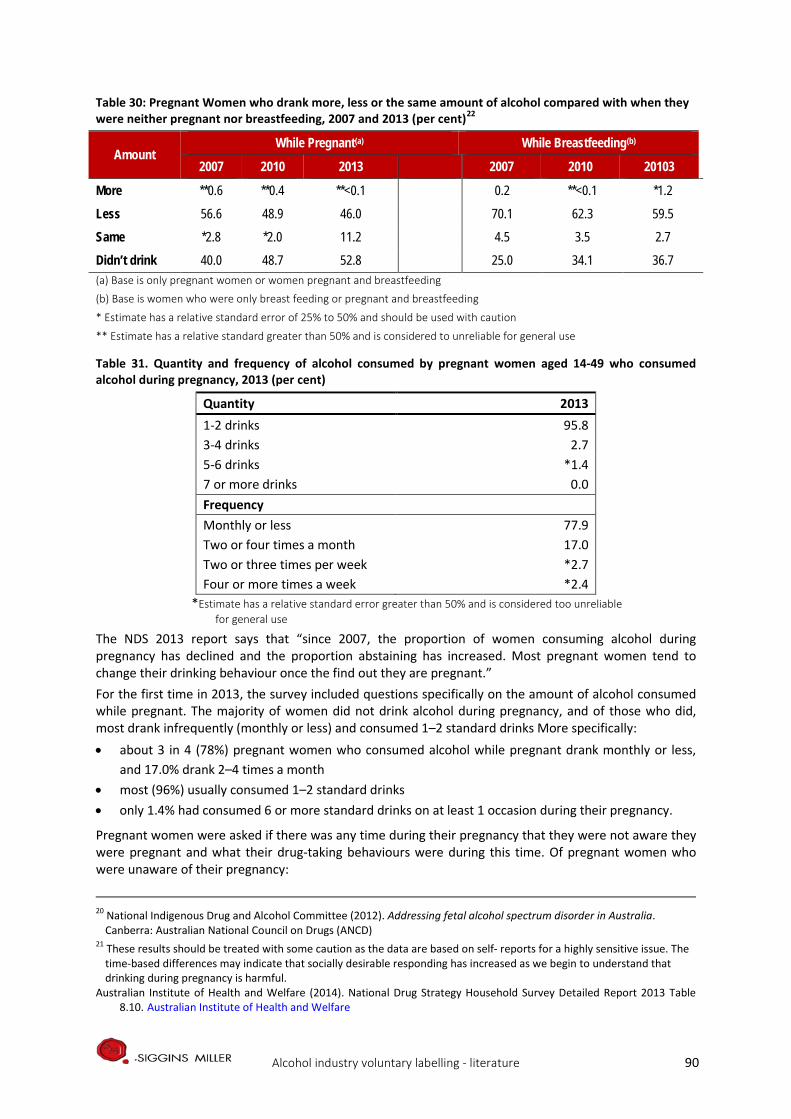
Table 30: Pregnant Women who drank more, less or the same amount of alcohol compared with when they were neither pregnant nor breastfeeding, 2007 and 2013 (per cent)22
Amount While Pregnant(a) While Breastfeeding(b)
2007 2010 2013 2007 2010 20103
More **0.6 **0.4 **<0.1 0.2 **<0.1 *1.2
Less 56.6 48.9 46.0 70.1 62.3 59.5
Same *2.8 *2.0 11.2 4.5 3.5 2.7
Didn’t drink 40.0 48.7 52.8 25.0 34.1 36.7 (a) Base is only pregnant women or women pregnant and breastfeeding
(b) Base is women who were only breast feeding or pregnant and breastfeeding
* Estimate has a relative standard error of 25% to 50% and should be used with caution
** Estimate has a relative standard greater than 50% and is considered to unreliable for general use
Table 31. Quantity and frequency of alcohol consumed by pregnant women aged 14-49 who consumed alcohol during pregnancy, 2013 (per cent)
Quantity 2013 1-2 drinks 95.8 3-4 drinks 2.7 5-6 drinks *1.4 7 or more drinks 0.0 Frequency Monthly or less 77.9 Two or four times a month 17.0 Two or three times per week *2.7 Four or more times a week *2.4
*Estimate has a relative standard error greater than 50% and is considered too unreliable for general use
The NDS 2013 report says that “since 2007, the proportion of women consuming alcohol during pregnancy has declined and the proportion abstaining has increased. Most pregnant women tend to change their drinking behaviour once the find out they are pregnant.” For the first time in 2013, the survey included questions specifically on the amount of alcohol consumed while pregnant. The majority of women did not drink alcohol during pregnancy, and of those who did, most drank infrequently (monthly or less) and consumed 1–2 standard drinks More specifically: • about 3 in 4 (78%) pregnant women who consumed alcohol while pregnant drank monthly or less,
and 17.0% drank 2–4 times a month • most (96%) usually consumed 1–2 standard drinks • only 1.4% had consumed 6 or more standard drinks on at least 1 occasion during their pregnancy.
Pregnant women were asked if there was any time during their pregnancy that they were not aware they were pregnant and what their drug-taking behaviours were during this time. Of pregnant women who were unaware of their pregnancy:
20 National Indigenous Drug and Alcohol Committee (2012). Addressing fetal alcohol spectrum disorder in Australia. Canberra: Australian National Council on Drugs (ANCD)
21 These results should be treated with some caution as the data are based on self- reports for a highly sensitive issue. The time-based differences may indicate that socially desirable responding has increased as we begin to understand that drinking during pregnancy is harmful.
Australian Institute of Health and Welfare (2014). National Drug Strategy Household Survey Detailed Report 2013 Table 8.10. Australian Institute of Health and Welfare
Alcohol industry voluntary labelling - literature 90
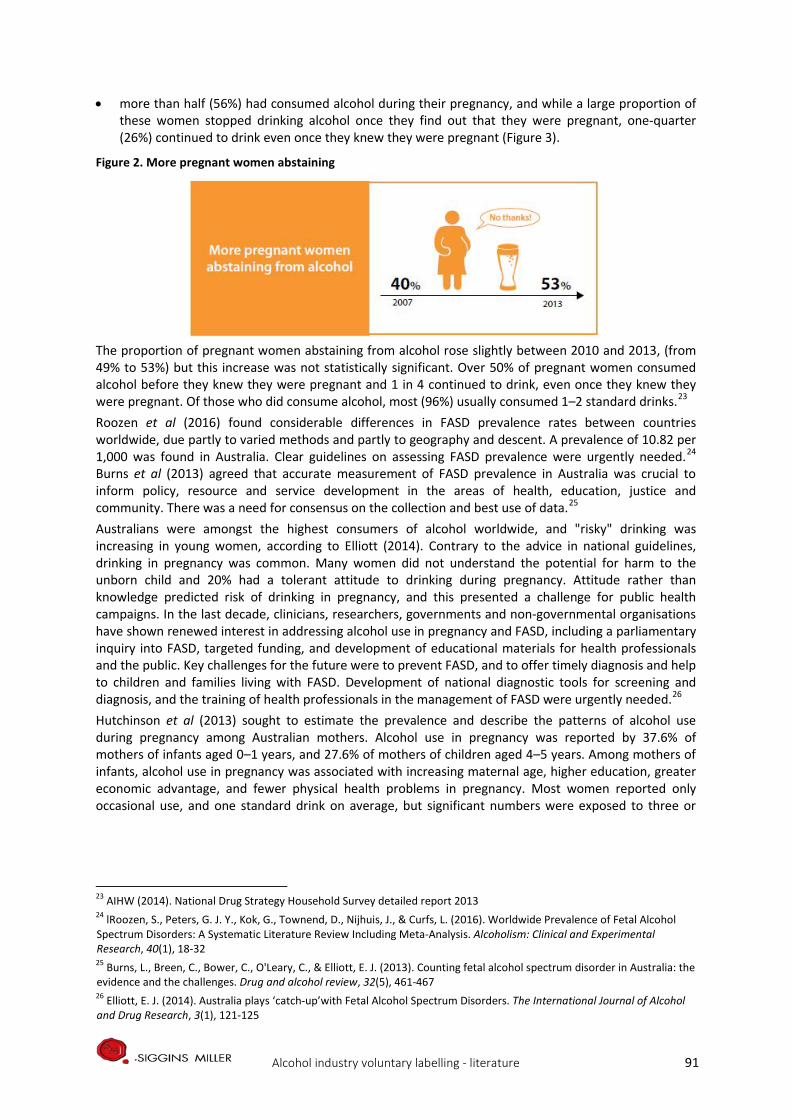
• more than half (56%) had consumed alcohol during their pregnancy, and while a large proportion of these women stopped drinking alcohol once they find out that they were pregnant, one-quarter (26%) continued to drink even once they knew they were pregnant (Figure 3).
Figure 2. More pregnant women abstaining
The proportion of pregnant women abstaining from alcohol rose slightly between 2010 and 2013, (from 49% to 53%) but this increase was not statistically significant. Over 50% of pregnant women consumed alcohol before they knew they were pregnant and 1 in 4 continued to drink, even once they knew they were pregnant. Of those who did consume alcohol, most (96%) usually consumed 1–2 standard drinks.23 Roozen et al (2016) found considerable differences in FASD prevalence rates between countries worldwide, due partly to varied methods and partly to geography and descent. A prevalence of 10.82 per 1,000 was found in Australia. Clear guidelines on assessing FASD prevalence were urgently needed.24 Burns et al (2013) agreed that accurate measurement of FASD prevalence in Australia was crucial to inform policy, resource and service development in the areas of health, education, justice and community. There was a need for consensus on the collection and best use of data.25 Australians were amongst the highest consumers of alcohol worldwide, and "risky" drinking was increasing in young women, according to Elliott (2014). Contrary to the advice in national guidelines, drinking in pregnancy was common. Many women did not understand the potential for harm to the unborn child and 20% had a tolerant attitude to drinking during pregnancy. Attitude rather than knowledge predicted risk of drinking in pregnancy, and this presented a challenge for public health campaigns. In the last decade, clinicians, researchers, governments and non-governmental organisations have shown renewed interest in addressing alcohol use in pregnancy and FASD, including a parliamentary inquiry into FASD, targeted funding, and development of educational materials for health professionals and the public. Key challenges for the future were to prevent FASD, and to offer timely diagnosis and help to children and families living with FASD. Development of national diagnostic tools for screening and diagnosis, and the training of health professionals in the management of FASD were urgently needed.26 Hutchinson et al (2013) sought to estimate the prevalence and describe the patterns of alcohol use during pregnancy among Australian mothers. Alcohol use in pregnancy was reported by 37.6% of mothers of infants aged 0–1 years, and 27.6% of mothers of children aged 4–5 years. Among mothers of infants, alcohol use in pregnancy was associated with increasing maternal age, higher education, greater economic advantage, and fewer physical health problems in pregnancy. Most women reported only occasional use, and one standard drink on average, but significant numbers were exposed to three or
23 AIHW (2014). National Drug Strategy Household Survey detailed report 2013 24 lRoozen, S., Peters, G. J. Y., Kok, G., Townend, D., Nijhuis, J., & Curfs, L. (2016). Worldwide Prevalence of Fetal Alcohol Spectrum Disorders: A Systematic Literature Review Including Meta-Analysis. Alcoholism: Clinical and Experimental Research, 40(1), 18-32 25 Burns, L., Breen, C., Bower, C., O'Leary, C., & Elliott, E. J. (2013). Counting fetal alcohol spectrum disorder in Australia: the evidence and the challenges. Drug and alcohol review, 32(5), 461-467 26 Elliott, E. J. (2014). Australia plays ‘catch-up’with Fetal Alcohol Spectrum Disorders. The International Journal of Alcohol and Drug Research, 3(1), 121-125
Alcohol industry voluntary labelling - literature 91
more drinks on most days while in utero. Public health campaigns were needed to educate pregnant women about the national guidelines27.
6.3 Exposure to alcohol during pregnancy
The term “fetal alcohol syndrome” (FAS) was first used to describe the cluster of birth defects due to prenatal alcohol exposure with lifetime consequences including growth restriction, craniofacial abnormalities and intellectual disabilities. The term “fetal alcohol spectrum disorder” (FASD) has since been adopted to describe the broader spectrum of presentations and disabilities resulting from alcohol exposure in utero.28 Campo and Jones (2017) said many different diagnostic guidelines were used for the diagnosis of FASD. Specific physical features were necessary for the diagnosis of FASD, but were considered differently in various clinical criteria for the diagnosis of FASD.29 The 2016 Australian Guide to the diagnosis of FASD says a diagnosis can be divided into one of two sub-categories: FASD with three sentinel facial features, and FASD with less than three sentinel facial features.30 The influential 2016 Canadian guideline made recommendations on the screening, referral and support for pregnant or postpartum women and for individuals at risk of FASD; medical assessment, including family history, maternal alcohol history, physical examination and differential diagnosis; the sentinel facial features; the neurodevelopmental assessment; nomenclature and diagnostic criteria; and the diagnostic team and special considerations in the neurodevelopmental assessment of infants and young children.31 Increased fetal exposure to alcohol and sustained alcohol intake during any trimester of pregnancy is associated with an increased risk of FAS (Gupta et al 2016).32
Maternal alcohol consumption during pregnancy is known to produce a spectrum of morphological and neurocognitive outcomes in the offspring (Kodituwakku 2013).
Many studies showed that alcohol could cause more defects in a fetus than heroin, cocaine and marijuana Mohammadzadeh and Farhat (2014) suggested FAS was more common than Down syndrome. The possible defects caused by alcohol included physical, mental and behavioural retardation, learning deficits, growth restriction, and some social problems. 33 Children with FAS had quite diverse psychosocial outcomes in adulthood, considerably worse than for majority population peers (Hangmar et al (2015).34 Measures of drinking, especially binge drinking, correlated significantly with increased child dysmorphology, say May et al (2013). First trimester drinking (vs no drinking) elevated FASD likelihood 12 times; first and second trimester drinking increased FASD outcomes 61 times; and drinking in all
27 Hutchinson, D., Moore, E. A., Breen, C., Burns, L., & Mattick, R. P. (2013). Alcohol use in pregnancy: Prevalence and predictors in the Longitudinal Study of Australian Children. Drug and alcohol review, 32(5), 475-482 28 Cook, J. L., Green, C. R., Lilley, C. M., Anderson, S. M., Baldwin, M. E., Chudley, A. E., ... & Mallon, B. F. (2016). Fetal alcohol spectrum disorder: a guideline for diagnosis across the lifespan. Canadian Medical Association Journal, 188(3), 191-197 29 del Campo, M., & Jones, K. L. (2017). A review of the physical features of the fetal alcohol spectrum disorders. European journal of medical genetics, 60(1), 55-64 30 Bower, C,, Elliott, E.J. (2016) on behalf of the Steering Group. Report to the Australian Government Department of Health: “Australian Guide to the diagnosis of Fetal Alcohol Spectrum Disorder (FASD)”. The Australian Paediatric Surveillance Unit 31 Cook et al (2016) 32 Gupta, K. K., Gupta, V. K., & Shirasaka, T. (2016). An Update on Fetal Alcohol Syndrome—Pathogenesis, Risks, and Treatment. Alcoholism: Clinical and Experimental Research, 40(8), 1594-1602 33 Mohammadzadeh, A., & Farhat, A. (2014). Fetal Alcohol Syndrome. Asia Pacific Journal of Medical Toxicology, 3, 10-10 34 Rangmar, J., Hjern, A., Vinnerljung, B., Strömland, K., Aronson, M., & Fahlke, C. (2015). Psychosocial outcomes of fetal alcohol syndrome in adulthood. Pediatrics, 135(1), e52-e58
Alcohol industry voluntary labelling - literature 92
trimesters 65 times.35 Alcohol was a well-established teratogen that could cause variable physical and behavioral effects on the fetus. The most severe condition in this spectrum of diseases was fetal alcohol syndrome (Gupta et al 2016). A random sample in WA of women with one infant found that alcohol intake at higher levels, particularly heavy and binge drinking patterns, was associated with increased risk of preterm birth, even when drinking ceased before the second trimester. .36
6.4 Awareness and knowledge of the risks associated with drinking alcohol while pregnant
Phone interviews in 2010 with over a thousand Australian women of childbearing age found they had poor knowledge of the specific effects of alcohol in pregnancy on the unborn child, and one in five women had a neutral or positive attitude towards alcohol consumption in pregnancy. There was a disjunction between the women's knowledge and their attitudes: 97% of the women agreed that alcohol could affect the unborn child, but their awareness of the specific risks to was poor.37 Since 2011, the FARE has conducted annual polling on awareness of the harms caused by drinking alcohol, including drinking while pregnant or breastfeeding. In 2014 a Galaxy Research questionnaire was designed in consultation with FARE and presented in an online survey to collect data from 1,545 respondents over the age of 18 years across Australia. It found that:
• 78% (65% in 2013) of Australians believed that pregnant women should not consume any alcohol in order to avoid harm to the fetus38
• 50% (47% in 2013) were aware of FAS and related disorders • 15% (15% in 2013) believed that pregnant women can drink in moderation (safely drink small
amounts of alcohol without harming their baby).39
Health, social policy and specialist review databases between 2002 and 2016 were searched for systematic studies of the effectiveness of population-level alcohol interventions on consumption or alcohol-related health outcomes. It identified support from the evidence for regulatory or statutory enforcement interventions over local, non-regulatory approaches targeting specific groups.40 A 2016 paper on alcohol advertising and public health said advertising aimed to influence not just consumption, but also to influence awareness, attitudes and social norms. Advertising was a system-level intervention with multiple objectives, hence assessments of the health effects of advertising restrictions which focused only on sales or consumption may be misleading. Systems problems required systems perspectives.41 A small online survey to assess consumers’, awareness of the ‘Get the facts’ logo and warning labels found that none of the participants recalled the ‘Get the facts’ logo; recall of the current, voluntary warning labels was non-existent; overall awareness was low; and current warning labels failed to effectively transmit health messages to the public.42 A New Zealand survey said label development was
35 May, P. A., Blankenship, J., Marais, A. S., Gossage, J. P., Kalberg, W. O., Joubert, B., ... & Robinson, L. K. (2013). Maternal alcohol consumption producing fetal alcohol spectrum disorders (FASD): quantity, frequency, and timing of drinking. Drug and alcohol dependence, 133(2), 502-512 36 National Health and Medical and Medical Research Council (2009). Australian guidelines to reduce health risks from
drinking alcohol. Canberra: Commonwealth of Australia. 37 Peadon E, Payne J, Henley N, D’Antoine H, Bartu A, O’leary C, Bower C, Elliot EJ (2010). Women's knowledge and
attitudes regarding alcohol consumption in pregnancy: a national survey. BMC Public Health. 10: 510 38 This result is similar to that in FARE polls carried out in 2011 and 2012 39 Foundation for Alcohol Research and Education (2014). Annual Alcohol Poll: Attitudes and behaviours. Canberra: FARE 40 Martineau, F., Tyner, E., Lorenc, T., Petticrew, M., & Lock, K. (2013). Population-level interventions to reduce alcohol-related harm: an overview of systematic reviews. Preventive medicine, 57(4), 278-296 41 Petticrew, M., Shemilt, I., Lorenc, T., Marteau, T. M., Melendez-Torres, G. J., O'Mara-Eves, A., ... & Thomas, J. (2016). Alcohol advertising and public health: systems perspectives versus narrow perspectives. Journal of epidemiology and community health, jech-2016 42 Coomber, K., Martino, F., Barbour, I. R., Mayshak, R., & Miller, P. G. (2015). Do consumers ‘Get the facts’? A survey of alcohol warning label recognition in Australia. BMC public health, 15(1), 1
Alcohol industry voluntary labelling - literature 93
currently limited to generic labels, even though research showed that targeted messages were more effective. Heavy drinkers and young adults were more concerned about self-harm (e.g. liver damage); lighter drinkers and older adults were more concerned about potential harm to others (e.g. violence); and women were more concerned than men with most such concerns. Alcohol warning label development should be systematically informed by identifying such drinkers’ concerns.43 Elliott (2015) said early recognition and support for individuals with FASD was crucial to prevent adverse secondary outcomes; but primary prevention of alcohol use in pregnancy, and hence FASD, should be the future goal. The causal pathway to drinking in pregnancy is complex and requires a broad social ecological approach. Prevention would take time, must involve all government sectors, and should incorporate primary, secondary and tertiary strategies to target both the broader community and populations at high risk of alcohol use during pregnancy.44 Fetal alcohol syndrome, Burton (2015) said, was entirely preventable if mothers-to-be don't drink, but do prospective parents know that? Do they know that FASD exists at all? A recent study reported its prevalence among the people of Fitzroy Valley in remote northwestern Australia - the highest prevalence ever recorded in the country and among the highest in the world- made all too clear the need for adequate messaging about the dangers of drinking alcohol during pregnancy.45 Eguiagaray et al (2016) said there was a lack of public understanding about FASD, and they claim that news media portrayals of the syndrome can reproduce stigmatising and isolating discourses which imply frames of sympathy and shame to picture various parties as responsible for FASD. Such emotive framing could add to stigma and confusion for pregnant women. Clinicians should be aware of the way in which women may have internalised such stigma, and media guidelines should encourage reporting of informed and consistent messages. Media portrayals that encouraged women to refrain from alcohol consumption during pregnancy might be more useful than stigmatising and isolating those who do. Practitioners should be aware that conflicting messages about alcohol consumption during pregnancy might lead to shame and confusion, and should encourage openness with mothers to challenge such stigma.46 Most consumers lacked a sufficient understanding of the potential consequences of alcohol use, according to Coomber et al (2017). Particular subgroups of drinkers may not equate drinking with negative consequences. Front-of-label alcohol warnings on all products and public health and education campaigns presenting messages targeting subgroups of drinkers could increase awareness of short- and long-term negative health and social effects of alcohol use.47
6.5 Effective reduction of risks to the unborn child arising from drinking alcohol during pregnancy
A guidance label on all alcohol products was a WHO target action to be implemented by the industry by 2020 (Anderson and Rehm 2015). It included increasing alcohol health literacy by 2025, since more than guidance labels alone is needed to increase alcohol health literacy. Better labelling information, including health warnings, on alcohol containers might increase awareness of the risks and content of products, though it might not reduce harmful consumption. Such labelling had public support, and could play a role in shifting social norms to reduce harmful alcohol use when integrated with other broader social messaging campaigns, and when implemented within broader alcohol policies. To avoid short comings of industry-designed labels, content of beverage products, including information on numbers of grams of alcohol, calorie content and the presence of other health-important ingredients, should be set by an
43 Robertson, K., Thyne, M., & Hibbert, S. (2016). Drinkers ‘perceived negative alcohol-related expectancies: Informing alcohol warning messages. Drugs: Education, Prevention and Policy, 1-9 44 Elliott, E. J. (2015). Fetal alcohol spectrum disorders in Australia--the future is prevention. Public Health Res Pract, 25(2), e2521516 45 Burton, A. (2015). Message on a bottle. The Lancet Neurology, 14(4), 354-355.See also Fitzpatrick, J. P., Latimer, J., Carter, M., Oscar, J., Ferreira, M. L., Carmichael Olson, H., ... & Hawkes, G. (2015). Prevalence of fetal alcohol syndrome in a population-based sample of children living in remote Australia: The Lililwan Project. Journal of paediatrics and child health, 51(4), 450-457. 46 Eguiagaray, I., Scholz, B., & Giorgi, C. (2016). Sympathy, shame, and few solutions: News media portrayals of fetal alcohol spectrum disorders. Midwifery, 40, 49-54 47 Coomber, K., Mayshak, R., Curtis, A., & Miller, P. G. (2017). Awareness and correlates of short-term and long-term consequences of alcohol use among Australian drinkers. Australian and New Zealand journal of public health
Alcohol industry voluntary labelling - literature 94
independent panel of health communication and labelling experts and epidemiologists. Industry implemented labelling should be evaluated in three ways:
1. Verification of the presence of the label, based on a published protocol set-up in advance, comprising checks on random samples of beer products chosen from random samples of small-, medium- and large-size retail outlets.
2. Verification of the fidelity of the label in terms of format, text and alcohol content and other health-related information as judged against recommendations set by the independent panel.
3. Consumer awareness and understanding of the content of labels, based on principles of health literacy should be collected through the cohort surveys of drinkers.48
Rich & Riley (2016) argued that that manufacturers and distributors of alcohol should participate in and be responsible for the health and human costs of neurodevelopmental disorder associated with prenatal alcohol exposure. Alcohol was a drug, and should be subject to regulation like pharmaceuticals and tobacco.49 Many national and international guidelines about drinking during pregnancy have been developed because rates of drinking before and during pregnancy are high. The guidelines are based on evidence for alcohol-related harms summarised in existing systematic reviews of the literature, and single studies and data reports, including research on risks and harms arising from drinking during pregnancy. Except for the UK, the guidelines indicate an international consensus that, for women who are pregnant, the safest option is abstinence from alcohol.50 The relevant guideline (Guideline 4A) in the NHMRC Australian guidelines to reduce health risks from drinking alcohol, states that “For women who are pregnant or planning a pregnancy, not drinking is the safest option.” This guideline is based on systematic reviews of the literature including seminal studies and prospective cohort studies. The NHMRC Australian guidelines present a review of the evidence on risks associated with alcohol drinking patterns (amount and frequency) during pregnancy. The guidelines note the limitations of the studies and the difficulty in determining effects on pregnancy outcomes of low to moderate levels of alcohol consumption, but the available evidence does not warrant a “conclusion that drinking alcohol at low-moderate levels during pregnancy is safe.” In 2012, the Inquiry into the prevention, diagnosis and management of Fetal Alcohol Spectrum Disorders conducted by the Parliament of the Commonwealth of Australia, House of Representatives Standing
48 Anderson, P., & Rehm, J. (2016). Evaluating Alcohol Industry Action to Reduce the Harmful Use of Alcohol. Alcohol and Alcoholism, agv139
49 Rich, S. D., & Riley, L. J. (2016). Neurodevelopmental Disorder Associated with Prenatal Alcohol Exposure: Consumer Protection and the Industry’s Duty to Warn. In Fetal Alcohol Spectrum Disorders in Adults: Ethical and Legal Perspectives (pp. 39-47). Springer International Publishing
50 Such guidelines include: National Institute for Health and Clinical Experience (NICE) (2008). Antenatal Care: Routine Care for the Healthy Pregnant
Woman. London: National Institute for Health and Clinical Experience (NICE) National Health and Medical and Medical Research Council (2009) The Danish National Board of Health (2010). Healthy Habits – before during and after pregnancy. 1st English edition
(translated from the 2nd Danish edition). The Danish National Board of Health and The Danish Committee for Health Education
New Zealand Ministry of Health (2006). Food and Nutrition Guidelines for Healthy Pregnant and Breastfeeding Women: A background paper. Wellington: New Zealand Ministry of Health
International Centre for Alcohol Policies (ICAP) (2011). International Drinking Guidelines. Online text at International Centre for Alcohol Policies
Public Health Agency of Canada (2011). The Sensible Guide to a Healthy Pregnancy. Ottawa: PHAC World Health Organisation (2010) U.S. Surgeon General (2005). U.S. Surgeon General Releases Advisory on Alcohol Use in Pregnancy [press release].
United States Department of Health and Human Services. Online text at: U.S Surgeon General Releases. Australian Health Ministers’ Advisory Council 2012, Clinical Practice Guidelines: Antenatal Care – Module 1. Canberra:
Australian Government Department of Health and Ageing
Alcohol industry voluntary labelling - literature 95
Committee on Social Policy and Legal Affairs drew together the reviews of evidence and recommended that FASD should be addressed by “ensuring that every woman knows the risk [of drinking alcohol during pregnancy] through providing accurate health information and advice, and fostering a changed attitude to alcohol consumption during pregnancy and across the wider community”.51 Australian reports recommend that action to reduce risks and harm to the unborn child arising from drinking alcohol during pregnancy should seek to:
• increase awareness and knowledge of the advice not to drink alcohol during pregnancy. • change attitudes to drinking alcohol among women who are pregnant or planning a pregnancy • change alcohol drinking behaviour among women who are pregnant or planning a pregnancy • change family and community attitudes to drinking alcohol during pregnancy.
To achieve these goals the range of prevention measures should include: • whole of population awareness and education campaigns including options such as publication
of data on the rates of alcohol consumption during pregnancy and data on the rates of alcohol-related pregnancy and birth outcomes in the Australian population
• social marketing initiatives which include the warnings in broader alcohol advertising (including health warnings on alcohol products, at the point of sale, on billboards and websites), and broadcast and social media campaigns
• increased healthcare professional screening and advice to women about alcohol during pregnancy
• other mechanisms to raise awareness of the harmful nature of alcohol consumption during pregnancy. 52 53
6.6 Increasing consumer knowledge about the risks associated with alcohol consumption
Health warning labels on alcohol products are just one mechanism for raising awareness and increasing consumer knowledge of the risks associated with alcohol consumption. Of themselves they do not change drinking behaviours. Evidence from the literature suggests that consideration of a variety of strategies will enhance the likelihood that social marketing campaigns will be effective in increasing awareness and knowledge of health risk behaviours and changing health behaviours. Evidence based social marketing uses multiple strategies including advertising, public relations, printed materials, promotional items, signage, special events and displays, face-to-face selling and entertainment media to communicate with the target audience. 54 A recent Cancer Council publication said a public health intervention could be justified only if there was good reason to believe it would contribute to improving health, but one could not assume that knowledge of risks alone was enough to change health-related behaviours. Yet many accounts in the academic literature and industry statements used this argument for warning labels on alcohol, reflecting a prevailing liberalism that assumed that knowledge usually led to right action, and placed the right to choose and responsibility for consequences with the individual. The pro-label advocacy literature presented a more nuanced justification for warning labels, acknowledging that a range of modifiable factors affect drinking choices and behaviour, and labels must be considered as part of a suite of interventions collectively aimed at effecting change at a population-level.55 A recent paper asked whether consumers in the US and Europe wanted more nutritional and health Information on wine labels. The global strategy to reduce the harmful use of alcohol, launched in 2010 by the WHO, recommended providing consumer information about alcohol-related harm, and labelling
51 Parliament of the Commonwealth of Australia (2012) 52 Foundation for Alcohol Research and Education (2012); National Indigenous Drug and Alcohol Committee (2012) 53 Grier S, Bryant C (2005). Social marketing in public health. Annual Review of Public Health. 26(1). 319. 53 Muhlack, E., Eliott, J., Carter, D., & Braunack-Mayer, A. (2016). Ethical justifications in alcohol-related health. In Cancer Forum (Vol. 40, No. 2, p. 97). The Cancer Council Australia 54 Grier S, Bryant C (2005). Social marketing in public health. Annual Review of Public Health. 26(1). 319. 55 Muhlack, Eliott, Carter, Braunack-Mayer, (2016) op cit
Alcohol industry voluntary labelling - literature 96
alcoholic beverages to indicate it. But worldwide labelling requirements for alcoholic drinks were currently quite diverse and limited. Analysis showed significant differences in preferences for modes of information delivery in different countries, and significant differences between consumer groups on their interest in additional information on wine labels, in part related to wine consumption habits, attitudes towards nutritional information, and the degree of involvement with wine. This heterogeneity indicated a need for a careful consideration of labelling regulations and further investigation to identify labelling guidelines in the message content and presentation method used. 56 The effectiveness of a message can be determined by a number of factors associated with the person presenting the message, including the credibility (expertise, trustworthiness), attractiveness (familiarity/similarity, likeability) and power (perceived control over reinforcements, concerns about compliance) of the source. According to the research, the use of an influential individual (i.e. an ‘opinion leader’) early in the dissemination process can be useful in helping the target audience to successfully move through the change process, from awareness and understanding though to attitude change and ultimately behaviour change.57 Evidence suggests that an integrated marketing mix is essential in social marketing campaigns. A well-considered promotional strategy that encompasses and addresses the four P’s (product, price, place and promotion). Communication variables are fundamental in developing effective persuasive messages in social marketing campaigns. The effectiveness of a persuasive message is determined by a number of communication variables such as, source variables, message variables, channel variables, receiver variables and target variables. The content of the message being delivered to the target audience should be carefully considered to determine:
• what is included or not included in the message • the organisation of the content in the message • the extremity of the message • the motivational strategies utilised to persuade the target audience.58 59 60
Motivation among the target audience to change their behaviour can be increased by emphasising high benefits and low costs of the behaviour change.61 62 Research also suggests that formative research to gain a deep understanding of the target audience, specifically what motivates and deters individuals from changing their behaviour is important. According to Miller and Ware (1989) and McGuire (1974), it is important to understand what and how personal characteristics affect how a message is received; these include gender, age, experience feelings of vulnerability and whether they have previously been predisposed to the message. Finally, continuous monitoring and revision of a social marketing campaign is necessary, to maintain the interest and motivation of the target audience.
6.7 Implementation of the pregnancy labelling voluntary initiative
A communiqué of the Legislative and Governance Forum on Food Regulation (9 December 2011) announced Ministers’ agreements about initiatives in response to the recommendations of Labelling Logic. The relevant recommendation about pregnancy labelling said: “Warnings about the risks of
56 Annunziata, A., Pomarici, E., Vecchio, R., & Mariani, A. (2016). Do Consumers Want More Nutritional and Health Information on Wine Labels? Insights from the EU and USA. Nutrients, 8(7), 416 57 Lefebvre & Flora (1988). Social Marketing and Public Health Intervention. Health Education and Behaviour. 15. 299 58 McGuire WJ (1974). Communication-persuasion models for drug education. In M Goodstadt (ed), Research on Methods
and Programs for Drug Education, Addiction Research Foundation: Toronto. 59 McGuire WJ (1985). Attitudes and attitude change. In G Lindsay G & E Aronson (eds), Handbook of Social Psychology, 2. p
283. 60 McGuire WJ (1969). The Nature of Attitudes and Attitude Change . In G Lindsay G & E Aronson (eds), Handbook of Social
Psychology, Addison-Wesley: Boston 61 Anderson AR (2002). Marketing social marketing in the social change marketplace. Journal of Public Policy and
Marketing, 12(1) 62 Miller ME, Ware J (1989). Mass-media alcohol and drug campaigns: A consideration of relevant issues. National
Campaign Against Drug Abuse. MS-9. Canberra. Australian Government
Alcohol industry voluntary labelling - literature 97
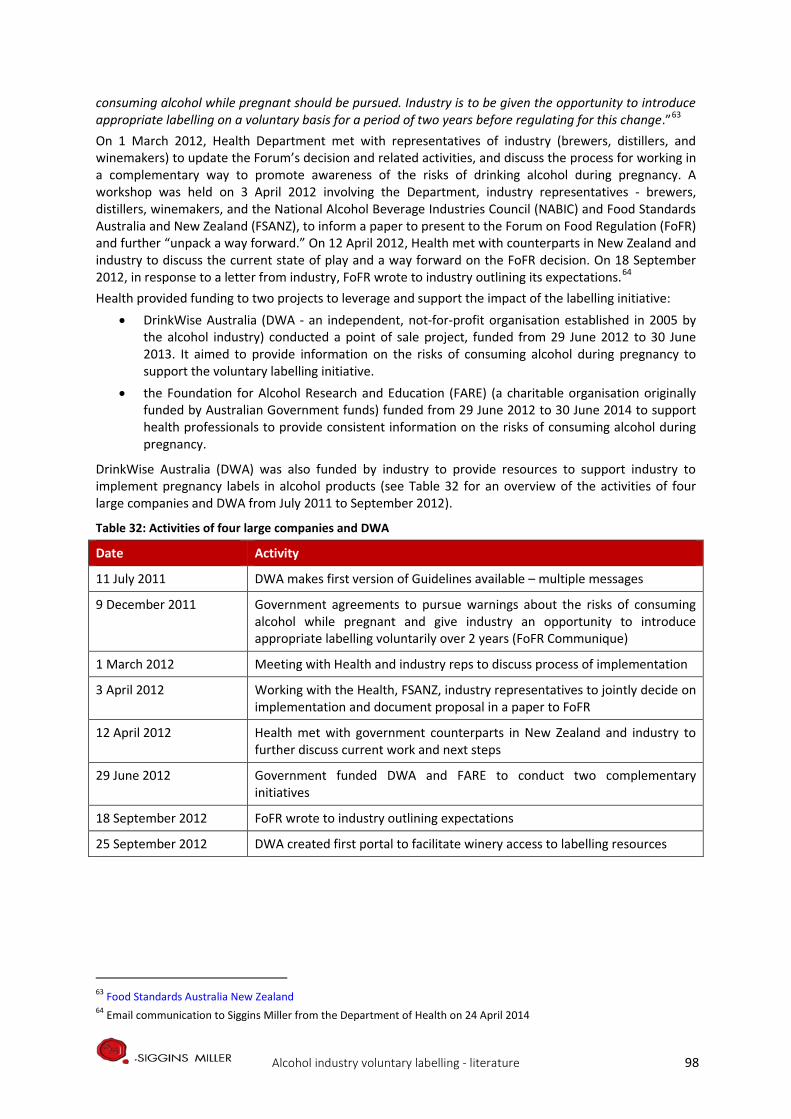
consuming alcohol while pregnant should be pursued. Industry is to be given the opportunity to introduce appropriate labelling on a voluntary basis for a period of two years before regulating for this change.”63 On 1 March 2012, Health Department met with representatives of industry (brewers, distillers, and winemakers) to update the Forum’s decision and related activities, and discuss the process for working in a complementary way to promote awareness of the risks of drinking alcohol during pregnancy. A workshop was held on 3 April 2012 involving the Department, industry representatives - brewers, distillers, winemakers, and the National Alcohol Beverage Industries Council (NABIC) and Food Standards Australia and New Zealand (FSANZ), to inform a paper to present to the Forum on Food Regulation (FoFR) and further “unpack a way forward.” On 12 April 2012, Health met with counterparts in New Zealand and industry to discuss the current state of play and a way forward on the FoFR decision. On 18 September 2012, in response to a letter from industry, FoFR wrote to industry outlining its expectations.64 Health provided funding to two projects to leverage and support the impact of the labelling initiative:
• DrinkWise Australia (DWA - an independent, not-for-profit organisation established in 2005 by the alcohol industry) conducted a point of sale project, funded from 29 June 2012 to 30 June 2013. It aimed to provide information on the risks of consuming alcohol during pregnancy to support the voluntary labelling initiative.
• the Foundation for Alcohol Research and Education (FARE) (a charitable organisation originally funded by Australian Government funds) funded from 29 June 2012 to 30 June 2014 to support health professionals to provide consistent information on the risks of consuming alcohol during pregnancy.
DrinkWise Australia (DWA) was also funded by industry to provide resources to support industry to implement pregnancy labels in alcohol products (see Table 32 for an overview of the activities of four large companies and DWA from July 2011 to September 2012).
Table 32: Activities of four large companies and DWA
Date Activity
11 July 2011 DWA makes first version of Guidelines available – multiple messages
9 December 2011 Government agreements to pursue warnings about the risks of consuming alcohol while pregnant and give industry an opportunity to introduce appropriate labelling voluntarily over 2 years (FoFR Communique)
1 March 2012 Meeting with Health and industry reps to discuss process of implementation
3 April 2012 Working with the Health, FSANZ, industry representatives to jointly decide on implementation and document proposal in a paper to FoFR
12 April 2012 Health met with government counterparts in New Zealand and industry to further discuss current work and next steps
29 June 2012 Government funded DWA and FARE to conduct two complementary initiatives
18 September 2012 FoFR wrote to industry outlining expectations
25 September 2012 DWA created first portal to facilitate winery access to labelling resources
63 Food Standards Australia New Zealand 64 Email communication to Siggins Miller from the Department of Health on 24 April 2014
Alcohol industry voluntary labelling - literature 98
6.7.1 Activities implemented in parallel with the pregnancy labelling voluntary initiative
Activities to leverage and support the uptake and impact of pregnancy labelling of alcohol These projects included the following complementary activities conducted nationally from 30 September 2012 to 30 June 2014: • The Point of Sale Project: The Australian Government Department of Health provided funding to
DWA specifically to support and leverage the impact of the voluntary pregnancy labelling initiative. DWA worked with industry to develop ‘point of sale’ information (a brochure and two A4 size convenience advertising posters) for consumers at major liquor retailers, clubs, pubs and hotels. The brochure was adapted to credit card size and supplied to licensed venues and shopping centres frequented by target audiences to be provided with convenience advertising posters. The project was designed to engage retailers and producers in providing responsible messages to consumers about reducing harmful drinking, particularly during pregnancy and to promote and explain the new pregnancy health warning labels. The target audience for the campaign was women of child bearing age (18 to 40 years) and their partners as influencers and providers of support. During development, the materials and their messages were focus tested with the target audiences.
In total 1,134,000 brochures were produced and distributed nationally to 3,537 stores (Aldi, Coles, Metcash, Woolworths), and Winemakers Federation of Australia’s (WFA) members’ cellar doors. Distribution commenced on 29 October 2012. Gender specific advertising posters were placed in bathrooms in licensed venues and shopping centres in 2,623 display points and 1,070 takeaway card holders across 467 venues and 54 shopping centres in metropolitan and regional locations between 1 December 2012 and 28 February 2013. The project was supported by a Vox Pops video hosted on the DrinkWise website and media publicity about not drinking alcohol while pregnant in the form of media releases, audio news releases, five public information messages from experts and celebrities and 29 radio interviews with DWA representatives which were broadcast on radio 116 times over two days in regional and metropolitan Australia in late 2012. In addition, DWA resources developed for the initiative were uploaded to the WFA microsite housed on the DWA website to provide WFA members with free access to the site, brochures and posters. A pregnancy specific URL for the DrinkWise website was included on all collateral material to help drive traffic to the website where more detailed information was provided in the form of videos of medical experts, sports and media personalities and everyday Australians. 65 In addition to this specific project, the alcohol industry peak bodies WFA and Wine Australia promoted the voluntary labelling initiative to members via their websites.66 67 68 Although the evidence base for these activities, and their impact in reducing rates of drinking while pregnant, is unclear, some specific examples are: • In 2012, WFA entered a partnership with DWA to ensure that all wineries had access to the
pregnancy warning logos, whether or not they were members of DWA. WFA also sent a letter to members with a joint message from DWA highlighting the need for the wine industry to “not only meet government and community expectations, but also to demonstrate its genuine commitment to support initiatives that promote appropriate alcohol consumption.” The letter announced the core DWA campaign message “Get the Facts” and the DWA logo and website for use on labels in tandem
65 DrinkWise Australia (2013). It’s safest not to drink while pregnant: Information to support the voluntary labelling initiatives on the risks of consuming alcohol during pregnancy. Final Report. Provided to the evaluators by DrinkWise Australia with permission to use it solely for the purpose of the Evaluation
66 Winemakers' Federation of Australia 67 Brewers Association 68 Wine Australia 2013 Compliance Guide for Australian Wine Producers Accessed 17 April 2014 at: Wine Australia
Alcohol industry voluntary labelling - literature 99
with either the pregnant lady pictogram or the text message, “It’s safest not to drink while pregnant” and the focus on pregnancy warnings.
• WFA conducted a survey of the locally produced domestic sales market in late 2013 and disseminated the results to its members.69
• In July 2011, Lion joined DrinkWise in the launch of consumer information messages including “It’s safest not to drink while pregnant”, explaining the initiative and Lion’s commitment to implement it and directing the reader to the DrinkWise website.70
• In addition to using the DWA pregnancy pictogram and the DWA “Get the Facts” badge on their primary packaging, some distributors also presented the link to the DWA pregnancy web page on their websites, incorporated the DWA label into their secondary packaging, point of sale product brochures and catalogue materials, and promoted it at their cellar doors and with their retailers. More recently some distributers have incorporated it into their websites and marketing materials.
• Some in the alcohol industry were also promoting the pregnancy message and uptake of labels as part of their existing responsible drinking activities and programs. For example:
- Diageo had a history of partnering with the public health sector to promote responsible drinking for example through the DRINKIQ.com initiative in the United Kingdom71
- Lion also had a history of investing in health education programs for young people in New Zealand, and funding a program developed by the Fetal Alcohol Support Trust (FAST) to educate young people about drinking while pregnant72
- The Pernod Ricard Australia website also provides links to the DWA and WFA websites, among others as part of its page on responsible consumption, and as part of its sustainability commitment.
• Since late 2012, global producers of beer, wine and spirits have been working on ten targeted actions which will continue to 2017 to build on efforts to discourage harmful drinking through international initiatives and partnerships on the industry actions in support of the World Health Organization (WHO) Global Strategy to Reduce the Harmful Use of Alcohol.73 The action areas include:
- continuing to strengthen and expand marketing codes of practice [reflective of] [the] resolve not to engage in marketing that could encourage excessive and irresponsible consumption, with a focus on digital marketing
- making responsible product innovations and developing easily understood symbols or equivalent words to discourage drinking and driving and consumption by pregnant women and underage youth
- reducing drinking and driving by collaborating with governments and non-governmental organizations to educate and enforce existing laws
- enlisting the support of retailers to reduce harmful drinking and create “guiding principles of responsible beverage alcohol retailing.”74
69 Personal communication WFA email to Siggins Miller 17 April 2014. Used for the purpose of the Evaluation with permission.
70 LionCo 71 Wilkinson C, Allsop S, Cail D, Chikritzhs T, Daube M, Kirby G, Mattick R (2009). Report 1 Alcohol Warning Labels: Evidence
of effectiveness on risky alcohol consumption and short term outcomes. Prepared for Food Standards Australia New Zealand.
72 Wilkinson et al (2009) 73 15 World Health Organisation (2010) 74 Diageo
Alcohol industry voluntary labelling - literature 100
Concurrent prevention initiatives to promote the 2009 NHMRC Australian guidelines A number of prevention initiatives designed to reduce risks and harm to the unborn child arising from drinking alcohol during pregnancy were implemented in parallel with the two-year implementation of the voluntary labelling initiative to place pregnancy health warning labels on alcohol products. They were implemented in Australia in the public health, advocacy, academic, not-for-profit community and the industry sectors to inform and educate the community and health care providers and to raise awareness and increase knowledge in the Australian population of the 2009 NHMRC guideline that “For women who are pregnant or planning a pregnancy, not drinking is the safest option.”75 76 Some were designed to help health care professionals and communities to engage with best practice approaches to healthy pregnancy and translate the NHMRC guidelines into practice. Three projects entailed the production and dissemination of alcohol and pregnancy resource development for health professionals: 1. The Health Professionals Project: Health funded the Foundation for Alcohol Research and Education
(FARE) to work with health professionals to further promote the messages in the Alcohol Guidelines on safe consumption. This project is designed to assist health professionals to raise awareness with their patients of the risks of harmful drinking and in particular the risk of drinking alcohol if pregnant or planning a pregnancy..
2. The National Indigenous Fetal Alcohol Spectrum Disorders (FASD) Resource project aimed to develop culturally appropriate resources to assist health professionals in Aboriginal and Torres Strait health care settings to address the issues of alcohol and pregnancy and FASD. The National Drug Research Institute (NDRI) developed the FASD PosterMaker application (app), a tool which enables Indigenous communities across Australia to produce their own locally relevant and culturally appropriate resources that reflect the shared issues but local differences in addressing alcohol, pregnancy and FASD around the country.
The iPad/Web FASD PosterMaker app is aimed primarily at helping health professionals; however, it can also be used by others working with Aboriginal and Torres Strait Islander communities – for example, youth workers, teachers, alcohol and other drug workers – as an educational tool with the young people with whom they are working. Community members can collaborate with local health professionals to create their own posters to suit their needs around alcohol, pregnancy and FASD in their local communities. The FASD Poster Maker app has a range of pre-loaded culturally relevant images as well as evidence-based messages, which include messaging from the 2009 NHMRC guidelines that “For women who are pregnant or planning a pregnancy, not drinking is the safest option.” The FASD Poster Maker is available for download in the Apple Store, or at fasd poster maker. 3. The National Antenatal Guidelines (Module 1) reflect the 2009 NHMRC guideline evidence and
recommendations about alcohol and pregnancy for health care practitioners.77 Currently the Department of Health is managing the development of antenatal guidelines on behalf of all Australian governments. The National Antenatal Guidelines publicly released in March 2013. They include guidance on a wide range of care including routine physical examinations, screening tests and social and lifestyle advice for women with an uncomplicated pregnancy. The Antenatal Guidelines are designed to complement the Australian Dietary Guidelines, the Australian Guidelines to Reduce Health Risks from Drinking Alcohol, the National Perinatal Depression Initiative and the Australian National Breastfeeding Strategy 2010-2015.78
A further two activities target individuals:
7 Parliament of the Commonwealth of Australia (2012) 76 Foundation for Alcohol Research and Education (2012) 77 Module 1 addresses the first trimester of pregnancy; Module 2 is currently under development- it addresses the second
and third trimesters of pregnancy. Module 1 was approved by the NHMRC in December 2011 and endorsed by health ministers in August 2012 and released in December 2012.
78 Australian Health Ministers Advisory Council (2012)
Alcohol industry voluntary labelling - literature 101
1. The Australian Government Pregnancy Birth and Baby website (last updated in July 2013) provides advice about alcohol during pregnancy and its effects on unborn children through links to resources on alcohol and the Pregnancy, Birth and Baby Helpline and Healthdirect Australia.
2. Two part-time specialist FASD clinics
In addition to these projects, state and territory governments have developed FASD prevention strategies, including population and community approaches to reducing harms caused by alcohol use during pregnancy. For example: • Department of Health, Western Australia Fetal Alcohol Spectrum Disorders Model of Care (2010),
followed by the ‘No alcohol while pregnant’ (Western Australian Government) campaign launched in September 2011 to promote the message that the safest option is to not drink alcohol during pregnancy, and when planning pregnancy and breastfeeding.
• Review of the results of the first 12 months of the Ord Valley Aboriginal Health Service’s fetal alcohol spectrum disorders program, 201179.
• Western Australia’s Drug and Alcohol Office has also received funding to develop a suite of indigenous focused FASD prevention initiatives. The Lililwan Project is a FASD prevalence study of children born in born in 2002 and 2003 in the Fitzroy Crossing Valley in the Kimberley region of Western Australia. It is the first population based study on the use of alcohol during pregnancy and FASD in Australia, and more specifically in Aboriginal communities. The study brings together allied health professionals, social workers, paediatricians and Aboriginal community navigators to review the medical and developmental history of Indigenous children in the Fitzroy Valley and provides treatment and referrals for children diagnosed with FASD. It was implemented through a partnership with Nindilingarri Cultural Health Services, Marninwarntikura Women’s Resource Centre, The Gorge Institute for Global health and the Discipline of Paediatrics and Child Health at the University of Sydney Medical School.80
Research and advocacy activities have been conducted in the two-year implementation period of the alcohol industry voluntary pregnancy labelling initiative. Surveys, forums, inquiries, social and news media activities, research and the development and dissemination of results of research and position papers on alcohol product labelling. Examples have included: • NHMRC funding of $2m to two projects:
- Pregnancy in the Aboriginal and Torres Strait Islander Community of Cherbourg in Queensland - Screening of Juvenile Justice Clients for FASD in Western Australia
• Submissions from government, community public health and healthcare professionals, industry and researchers to the 2011 House of Representatives Standing Committee on Social Policy and Legal Affairs’ Inquiry into Fetal Alcohol Spectrum Disorders: strategies to inform the community about the risk to the fetus of drinking alcohol during pregnancy and the dissemination of the 2009 NHMRC guideline: “For women who are pregnant or planning a pregnancy, not drinking is the safest option.”
• ongoing work by FARE, NOFASD and NAAA to conduct or support research; and provide submissions to inquiries to inform FASD and alcohol labelling policy, including surveys and studies of alcohol labelling uptake and economic analyses81 82 83 84
79 Bridge P (2011). Ord valley Aboriginal Health Service’s fetal alcohol spectrum disorders program: Big steps, solid outcome. Australian Indigenous HealthBulletin 11(4) 80 Gorge Institute 81 IPSOS Social Research Institute (2012). Alcohol Education and Research Foundation policy position paper. Alcohol
product labelling: Health warning labels and consumer information fare.org.au 82 IPSOS Social Research Institute (2012). Alcohol label audit. Report prepared for the Foundation for Alcohol Research and
Education (FARE): fare.org.au 83 FARE Annual Alcohol Polls 2011, 2012, 2013 on attitudes and behaviours (including awareness of the risks of drinking
alcohol) and dissemination of the results fare.org.au
Alcohol industry voluntary labelling - literature 102
• publication by the Australian National Council on Drugs (ANCD) of the National Indigenous Drug and Alcohol Committee (NIDAC) paper: Addressing fetal alcohol spectrum disorder in Australia85
• survey on food and alcohol during pregnancy86 • publication of data on the rates of alcohol consumption during pregnancy in the Australian
population87 88 89 • publication of analyses of data on alcohol use and alcohol related pregnancy and birth
outcomes.90 91 92 93
6.8 National and international context of pregnancy warnings
6.8.1 Health warning labels on alcohol products
Health oriented warnings on alcoholic beverages can include content about: • number of standard drinks
• advice about certain ingredients (e.g. non-alcoholic ingredients, caffeine, sulphites)
• advice about how to use the beverage
• advice about potential adverse consequences of drinking.94 95 96 97 98 The governments of 18 countries require producer/manufacturers to provide a specific health warning on the labels on alcoholic beverages. The rationale behind locating health warning messages on alcohol containers is that in so doing, the message will reach the majority of drinkers and more frequently expose more frequent drinkers to it. 99 Other locations are:
• at the point of sale
• in schoolrooms
• in alcohol advertising media (billboards, websites, television, newspapers, magazines, and electronic media)
• in editorial promoting the sale of alcoholic beverages.
Alcohol labelling regulation nationally and internationally is expressed though one or more of food standards laws and codes; industry initiatives to promote healthy use of alcohol through labelling or
84 Breen C, Burns L (2012) Improving services to families affected by FASD. Canberra: FARE 85 National Organisation for Fetal Alcohol Spectrum Disorders Australia (2017). Alcohol Product Labelling. No FASD 86 Flinders University survey into the eating and drinking habits of pregnant women. Pregnancy Birth Baby 87 Callinan & Room (2012) 88 Australian Institute of Health and Welfare (2008). 2007 National drug strategy household survey report. 89 Australian Institute of Health and Welfare (2011). 2010 National drug strategy household survey report. 90 National Indigenous Drug and Alcohol Committee (2012) 91 FARE (2012) 92 Parliament of the Commonwealth of Australia (2012) 93 Wilson M, Stearne, Gray D, Saggers S (2010). The Harmful Use of Alcohol amongst indigenous Australians. Online
publication at: Australian Indigenous Alcohol and Other Drugs Knowledge Centre 94 Food Labelling Law and Policy Review Panel (2011). Labelling Logic. Food labelling review 95 Wilkinson & Room (2009). Warnings on alcohol containers and advertisements: international experience and evidence
on effects. Drug and Alcohol Review, 28(4): 426-435 96 International Centre for Alcohol Policies (ICAP) (2011). Health warning labels (ICAP Policy Tables) Accessed 4 March 2014
at International Centre for Alcohol Policies. 97 Farke W (2011). Consumer labelling of alcohol beverages – a review of practices in Europe. Paper presented at the
European Alcohol and Health Forum. Brussels EAHF 98 Food Standards Australia New Zealand (FSANZ) (2013).Australia and New Zealand Food Standards Code (Standard 2.7.1 –
Labelling of Alcoholic Beverages and Food Containing alcohol; Standard 1.2.9 Legibility Requirements 99 Wilkinson & Room (2009)
Alcohol industry voluntary labelling - literature 103
point-of-sale advertising; voluntary agreements reached between industry and government in relation to alcohol and labelling.100 6.8.2 Types of consumer information
Consumer information about beverage alcohol products (primary packaging containers, such as bottles cans and casks and/or secondary packaging such as boxes, cartons and shrink wrap, or both). The products may contain information about the beverage or the container (such as alcohol volume, standard drinks, method of production, country of production, ingredients) or directional information, such as health warnings or recycling prompts/reminders.101 102 Information requirements are regulated through international trade agreements, industry commitments to codes of good practice as well as food standards laws and codes of practice.103 104 Since 1995, the FSANZ105 Code has required labels on beverage alcohol containers to legibly display: • the alcohol content • standard drinks in line with the NHMRC Australian guidelines (which define 1 standard drink as
equivalent to 10g of alcohol) • certain ingredients (e.g. caffeine, sulphates).
The Code does not require that alcohol product labels display information about safe consumption or warnings about health risks associated with drinking alcohol. After a period from 2009 to 2010 during which industry in Australia initiated the introduction of safe or responsible consumption of alcohol messages on alcohol products, the Commonwealth of Australia responded to the recommendation of the Labelling Logic Review report by allowing industry to voluntarily implement pregnancy health warnings on alcohol product labels in the period from December 2011 – 2013.106 In the European Union, all producers are legally obliged to provide “safety” warnings on product labels if the product has potentially negative side effects. Chapter III Article 5 of Directive 2001/195/EC of the European Parliament states that “producers shall provide consumers with relevant information to enable them to assess risks inherent in a product.” Other trade and industry agreements require producers to display information such as country of origin.107
6.8.3 Rationales for health warning labelling of alcohol products
The rationale for requiring health warnings on alcohol products is to raise awareness of the potential adverse consequences of harmful levels and patterns of use. In a number of countries health warning labels are used to offer directional information about drinking behavior. They tend to take the form of reminders about: • general and specific health risks associated with alcohol consumption (e.g. in El Salvador, the
government requires alcohol product labels to display the message: “The excessive consumption of this product is harmful to health and creates addiction. Its sale is banned to those under 18 years of age.”)
100 Stockwell T (2006). A review of research into the impacts of alcohol warning labels on attitudes and behaviour. British Columbia, Canada: University of Victoria, Centre for Addictions Research of BC
101 Wilkinson & Room (2009) 102 International Centre for Alcohol Policies (2013).Health Warning Labels. ICAP Policy Tools Series – Issues Briefings.
Washington DC: ICAP 103 World Wine Trade Group (2007). Agreement on Requirements for Wine Labelling. Canberra: World Wine Trade Group 104 Global Alcohol Producers Group (GAPG) (2012). Reducing Harmful Use of Alcohol: Beer Wine and Spirits Producers
Commitments. Accessed 17 April 2014 at: Beer Wine Spirits Producers' Commitments 105 FSANZ is the a statutory authority under the Food Standards Australia New Zealand Act 1991 to work with governments
in Australia and New Zealand to develop and maintain the Australia New Zealand Food Standards Code which regulates the labelling and composition of food including beverage alcohol.
106 Food Labelling Law and Policy Review Panel (2011). Labelling Logic 107 World Wine Trade Group (2007). Agreement on Requirements for Wine Labelling. Canberra: World Wine Trade Group
Alcohol industry voluntary labelling - literature 104
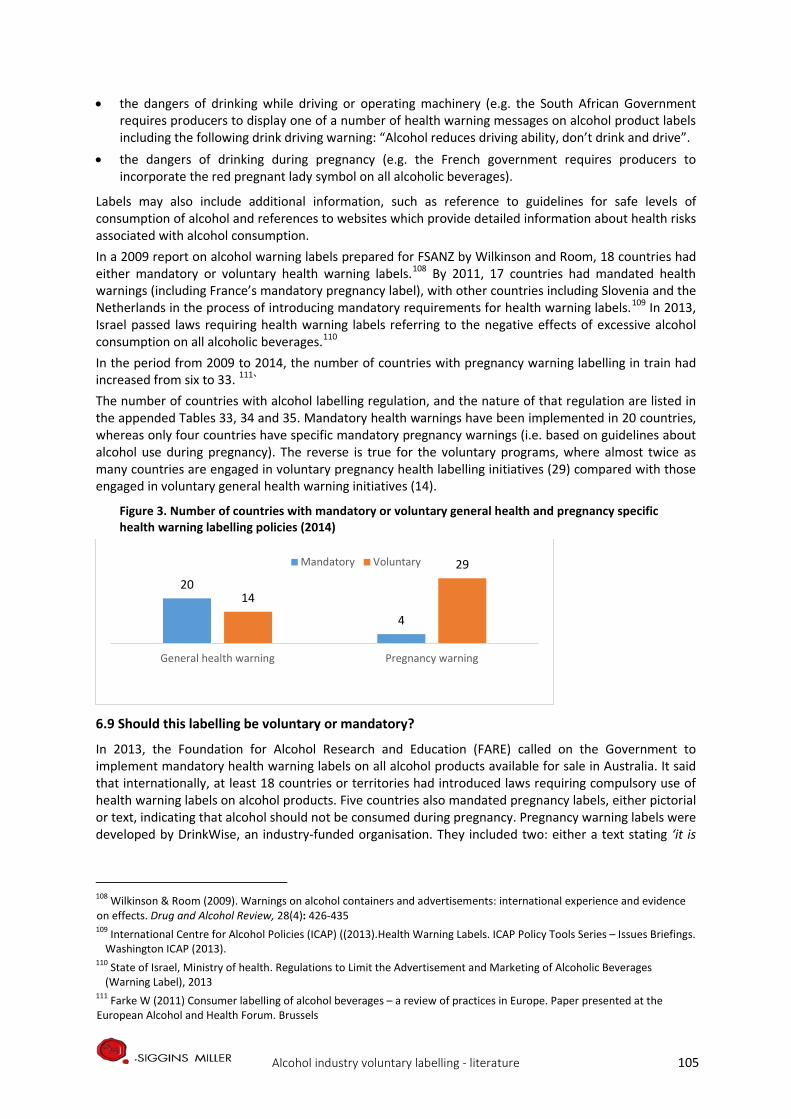
• the dangers of drinking while driving or operating machinery (e.g. the South African Government requires producers to display one of a number of health warning messages on alcohol product labels including the following drink driving warning: “Alcohol reduces driving ability, don’t drink and drive”.
• the dangers of drinking during pregnancy (e.g. the French government requires producers to incorporate the red pregnant lady symbol on all alcoholic beverages).
Labels may also include additional information, such as reference to guidelines for safe levels of consumption of alcohol and references to websites which provide detailed information about health risks associated with alcohol consumption. In a 2009 report on alcohol warning labels prepared for FSANZ by Wilkinson and Room, 18 countries had either mandatory or voluntary health warning labels.108 By 2011, 17 countries had mandated health warnings (including France’s mandatory pregnancy label), with other countries including Slovenia and the Netherlands in the process of introducing mandatory requirements for health warning labels.109 In 2013, Israel passed laws requiring health warning labels referring to the negative effects of excessive alcohol consumption on all alcoholic beverages.110 In the period from 2009 to 2014, the number of countries with pregnancy warning labelling in train had increased from six to 33. 111` The number of countries with alcohol labelling regulation, and the nature of that regulation are listed in the appended Tables 33, 34 and 35. Mandatory health warnings have been implemented in 20 countries, whereas only four countries have specific mandatory pregnancy warnings (i.e. based on guidelines about alcohol use during pregnancy). The reverse is true for the voluntary programs, where almost twice as many countries are engaged in voluntary pregnancy health labelling initiatives (29) compared with those engaged in voluntary general health warning initiatives (14).
Figure 3. Number of countries with mandatory or voluntary general health and pregnancy specific health warning labelling policies (2014)
6.9 Should this labelling be voluntary or mandatory?
In 2013, the Foundation for Alcohol Research and Education (FARE) called on the Government to implement mandatory health warning labels on all alcohol products available for sale in Australia. It said that internationally, at least 18 countries or territories had introduced laws requiring compulsory use of health warning labels on alcohol products. Five countries also mandated pregnancy labels, either pictorial or text, indicating that alcohol should not be consumed during pregnancy. Pregnancy warning labels were developed by DrinkWise, an industry-funded organisation. They included two: either a text stating ‘it is
108 Wilkinson & Room (2009). Warnings on alcohol containers and advertisements: international experience and evidence on effects. Drug and Alcohol Review, 28(4): 426-435 109 International Centre for Alcohol Policies (ICAP) ((2013).Health Warning Labels. ICAP Policy Tools Series – Issues Briefings.
Washington ICAP (2013). 110 State of Israel, Ministry of health. Regulations to Limit the Advertisement and Marketing of Alcoholic Beverages
(Warning Label), 2013 111 Farke W (2011) Consumer labelling of alcohol beverages – a review of practices in Europe. Paper presented at the European Alcohol and Health Forum. Brussels
20
4
14
29
General health warning Pregnancy warning
Mandatory Voluntary
Alcohol industry voluntary labelling - literature 105
safest not to drink while pregnant’, or a pictorial silhouette of a woman drinking alcohol with a line through it. 112 FARE argued that, to contribute to awareness raising and changing behaviours, an evidence-based alcohol warning label regime was needed in Australia. The labelling regime should be:
• mandatory so the label appeared on all products • applied consistently across all products so they were visible and recognisable • include a number of rotating messages focussing on different social and health harms • developed by health behaviour and public health experts • regulated and enforced by government, and • accompanied by a national public education campaign.
FARE quoted a 2009 FSANZ report into ‘Alcohol warning labels: evidence of impact on alcohol consumption amongst women of childbearing age.’ The report tentatively estimated that if labels were adopted in Australia, they would have the following potential impacts:
• the majority of female drinkers would have noticed the warnings within two to three years • younger women and heavier drinkers might notice the warnings more • of those who noticed the labels, about half would recall the message • conversations about the risks of alcohol use during pregnancy would increase, and • behaviour might change if the labels were complemented at point of sale and other sources. 113
Public health professionals in Australia and the European Union are urging a standard, mandatory approach to pregnancy health warning labelling (much like the approach France has adopted). Currently there is no legislation requiring producers in Australia or the European Union Member States to provide pregnancy health warning labels on alcohol beverage containers. Since 2009, industry peak bodies have been assisting industry with labels and working with government to provide media campaign resources and websites material covering the issue (e.g. Eurocare, the International Centre for Alcohol Policies [ICAP] and DWA).114 Of the 33 countries with pregnancy health warning labels, 29 are implementing voluntary pregnancy warning labelling initiatives. South Africa, the Russian Federation and the United States are the only countries with both mandatory health warning labels and prescribed pregnancy health warning labels. The only other country to have mandatory pregnancy health warning labels is France, where it is the only mandatory health warning label. Twenty five of the 29 countries with voluntary pregnancy labelling initiatives currently use the red pregnant lady pictogram mandated in France (see Table 34). Publicly available information reviewed does not specify the type of voluntary arrangement in progress – that is, whether the arrangement is industry led or based on an agreement between government and industry. There are some indications that voluntary implementation of pregnancy health warning labelling has been largely industry led and includes adoption of the French pictogram. Sweden provides an interesting example because government regulation requires a health warning on alcohol advertising (such as billboards or television commercials) but not on alcohol product labels or packages. Nevertheless, Swedish manufacturers are voluntarily producing labels with the French pregnant lady pictogram.115 Governments typically require that factual statements are accurate but might not otherwise regulate them. In the case of pregnancy warning labels, the health information presented varies. Some countries provide directive information and then refer to guidelines or (as is the case in Australia) to a website
112 Foundation for Alcohol Research and Education (FARE) (2013). Foundation for Alcohol Research & Education Spectrum Disorders Action Plan 2013-2016. Fare.org.au 113 Wilkinson, C., Allsop, S., Cail, D., Chikritzhs, T., Daube, M., Kirby, G., & Mattick, R. (2009). Alcohol warning labels: Evidence of impact on alcohol consumption amongst women of childbearing age. Food Standards Australia New Zealand, Canberra. 114 ICAP (2013).Health Warning Labels. 115 Farke (2011)
Alcohol industry voluntary labelling - literature 106
where explanatory information can be found. In some countries, messages have been developed and updated based on contemporary evidence for what works to make the label directive and prominent.116 Some countries advise that it is best to rotate health warning messages. Evidence for effectiveness of poster, billboard and television advertising, and tobacco packaging suggests that, rotation of multiple warnings is a more effective way to maintain the interest and attention of the viewer.117 118 Interestingly, these studies looked at the label in isolation, and did not take into account the possible impact of rotating alcohol product labels on the effectiveness of parallel initiatives and integrated public health campaigns.
6.10 Visibility and legibility issues of pregnancy health warning labels
A 2016 review of the UK alcohol industry's pledge to improve labelling found that labelling information often fell short of best practice, with font and logos smaller than would be accepted on other products with health effects.119 Al-Hamdani (2014) said studies on alcohol health warnings showed they did not have a strong effect on influencing recall, perceptions, and behaviours. Poorly visible and ambiguous health warnings plus the absence of pictorial warnings had muddied research. He recommended developing direct health warnings; increased visibility of the warnings; pictorial health warnings; and plain packaging for alcohol products.120 In light of what they regarded as a dearth of research on the effectiveness of stringent alcohol warning labels, Al-Hamdani, and Smith (2016) tested whether increasing the size of an alcohol health warning lowered product-based ratings. They believed that, compared with branded packaging, plain packaging lowered consumer ratings of alcohol products, and increased the likelihood of recognising the health warnings.121 NOFASD Australia believes that, for alcohol product health warning labels to be effective, they must include the following evidence-based parameters:
• Text and a symbol • Text to be proceeded with the words “Health Warning” • Label to be demarcated by a prominent black border • Size of the label should ensure clear visibility • The size of the health warning label should be a specific percentage determined by the size of
the container and the size of the alcohol product label • Placed in a prominent position on the alcohol product container, preferably on the front of the
product container or package • Size, font and application of health warning labels should be consistent across all products 122
Internationally, legibility requirements and guidance specify various formats and locations for pregnancy health warning messages on alcoholic beverage containers.123 124 125 Reviewers of the evidence for
116 Wilkinson & Room (2009) 117 Wogalter & Brelsford (1994). Incidental Exposure to Rotating Warnings on Alcoholic Beverage Labels. Proceedings of the
Human Factors and Ergonomics society 38th Annual Meeting. 118 Wogalter MS, Laughery KR (1996). Warning! Sign and label effectiveness. Current Directions in Psychological Science. 119 Petticrew, M., Douglas, N., Knai, C., Durand, M. A., Eastmure, E., & Mays, N. (2016). Health information on alcoholic beverage containers: has the alcohol industry's pledge in England to improve labelling been met? Addiction, 111(1), 51-55. 120 Al-hamdani, M. (2014). The case for stringent alcohol warning labels: lessons from the tobacco control experience. Journal of public health policy, 35(1), 65-74 121 Al-Hamdani, M., & Smith, S. M. (2016). Alcohol warning label perceptions: do warning sizes and plain packaging matter? Journal of Studies on Alcohol and Drugs, 78(1), 79-87 122 NOFASD (2017) Alcohol Product Labelling 123 Eurocare (2011) 124 Wilkinson & Room (2009) 125 1ood Standards Australia New Zealand (FSANZ) (2013)
Alcohol industry voluntary labelling - literature 107
effectiveness of labelling approaches, and public health advocates have consistently critiqued the inconsistent placement, poor legibility and small dimensions of messages.126 Different countries’ labelling legibility requirements and guidance are outlined in Table 33 and Table 35 below. The tables present two matrices which summarise, by country, publicly available information describing the extent and nature of regulation of health warnings on alcohol products. Table 33 lists both government-mandated and voluntary general health warning (excluding pregnancy warnings) label requirements for different countries, with examples of text and graphics used and links to supplementary guidelines and advice. Table 34 outlines similar information specific to pregnancy warning labels on alcohol products. In summary legibility requirements and guidance address:
• font type and size (Germany, Japan, Thailand, United States) • clarity and contrast (Costa Rica, France, Japan, South Africa, United States) • colours (Costa Rica, Ecuador, South Africa, Thailand) • placement (France, Germany, Japan, Thailand, United States) • size and proportions (Costa Rica, Ecuador, South Africa, Thailand, Uzbekistan).
In addition, pictorials, colour, and signal icons can increase the noticeability of warning information on alcohol containers.127 Notably, Thailand is the only country that mandates the use of both pictures and text. In Australia, several sources of guidance have been developed in recent years. The Victorian Health Promotion Foundation provided guidance on alcohol warning labels in 2009 following its research into labelling of alcohol products. Before the voluntary labelling initiative began in December 2011, DWA provided industry with guidance and resources on label content design format size etc. FARE produced principles and recommended label formats in 2011/12. In Australia, the voluntary initiative is led by DWA. In the scheme, producers who subscribe to the program may choose between several combinations of the DWA logo, ‘Get the Facts’ and a pregnant woman pictogram similar to the one used in France, but coloured green instead of red and holding a glass with a stem instead of a beaker. The DWA guidelines also include recommendations on minimum size and exclusion area, colour and placement. FSANZ have mandatory warning and advisory statements and declarations guidelines which advise on legibility, prominence and contrast.
6.11 Reviews of evidence of the effectiveness of health warning labelling of alcohol products
Studies of the effectiveness of health warning labels on alcohol products have been reviewed by Stockwell (2006)128, Wilkinson and Room, the WHO, Anderson, and Jones and Gordon129. Each of these reviewers focussed on international experience and evaluations of warning labels on alcohol products, and noted some or all of the following limitations of the published research:
• difficulty in comparing studies from different countries because of differences in contexts, what is measured, and how it is measured
• lack of baseline measures • the lack of control groups • small sample sizes • a d difficulty in determining the contribution of labelling interventions to increase awareness and
understanding of health risks and behaviour change in the context of other interventions with the same aims.
126 Wilkinson & Room (2009) 127 Laughery KR, Young SL., Vaubel KP, Brelsford JW, Rowe AL (1993). Explicitness of consequence information in warnings.
Safety Science 16: 5-6 128 Stockwell (2006); Wilkinson & Room (2009); WHO (2010); Anderson (2012); 129 Jones S, Gordon R (2013). Alcohol warning labels: are they effective? Deeble Institute Evidence Brief, Australian
Healthcare and Hospitals Association, no: 6
Alcohol industry voluntary labelling - literature 108
A review of a decade of relevant English studies concluded that alcohol labelling was likely to have limited effect on consumption. Alcohol unit content labels could help consumers assess the alcohol content of drinks, but labels promoting drinking guidelines and pregnancy warning labels were unlikely to influence drinking behaviour.130 The reviews noted that, in general, information and education on the risks of alcohol and how to reduce harm increased awareness and knowledge. Health warning labels on alcohol products were one vehicle for raising awareness and increasing knowledge of the risks associated with alcohol consumption, including alcohol consumption during pregnancy. Some reviewers suggested that effective methods of advertising and product labelling to warn the population about the risks of smoking and drink driving could usefully inform efforts to implement other health warning labelling initiatives. Labelling has been one part of a wide-range strategy on smoking, and part of integrated public health campaigns (including multi media campaigns) on drink driving. Mandatory tobacco labelling prescribed how to display health warning information to ensure that it is more graphic, coloured and larger design factors. Tobacco labels were rotated over time to maximise their impact. However, the impact of the drink driving campaign might be different from drinking while pregnant because it was illegal and had legal consequences. But community support existed for health warnings and information on alcohol product labels131 132 Stockwell’s 2006 review of mandatory pregnancy health warning labelling of alcoholic beverages in the US found that labelling had minimal or no effects on drinking behaviour. However, in relation to recall of messages Stockwell (2006) found evidence that the “…highest risk groups of drinkers (including young people, pregnant women and heavy drinkers) are particularly likely to recall the messages.” 133 Wilkinson & Room thought warning labels were important in helping to establish a social understanding that alcohol is a special and hazardous commodity.134 In spite of the methodological difficulties, some evidence indicated that, while health warnings on alcoholic beverage containers “…do not lead to changes in drinking behaviour, they do impact on intentions to change drinking patterns and remind consumers about the risks associated with alcohol consumption.”135 A 2012 review of literature on the impact of alcohol warning labels on adolescent drinking, knowledge and behaviour found that much of the literature was by the same group of authors, using samples from a single region, which limited the generalisablity of the findings. The introduction of alcohol warning labels might increase awareness about the risks of alcohol consumption among adolescents., but appeared unlikely to change adolescent drinking behaviours or beliefs about alcohol-related risks. Further research in multiple cultural contexts was required, but warning labels should be considered as only one of a range of other proven strategies to change attitudes and behaviour.136 Other sources thought there was no evidence that health warning labels on alcohol products affected drinking behaviour (including heavy drinkers, pregnant women and young people), but high risk drinkers were more likely than others to recall the health warning message. A 2013 review of the literature by the International Centre for Alcohol Policy found that “…while consumers are generally aware of the existence of health warning labels on alcohol products, comprehension and recall of the messages is
130 Knai, C., Petticrew, M., Durand, M. A., Eastmure, E., & Mays, N. (2015). Are the Public Health Responsibility Deal alcohol pledges likely to improve public health? An evidence synthesis. Addiction, 110(8), 1232-1246 131 Wilkinson & Room (2009) 132 Thompson LM, Vandenberg B, Fitzgerald JM (2012). An exploratory study of drinkers’ views of health information and
warning labels on alcohol containers. Drug and Alcohol Review, 31: 240-247 133 Stockwell (2006) 134 Wilkinson & Room (2009) 135 World Health Organisation (2010) 136 Scholes-Balog, K. E., Heerde, J. A., & Hemphill, S. A. (2012). Alcohol warning labels: Unlikely to affect alcohol-related beliefs and behaviours in adolescents. Australian and New Zealand journal of public health, 36(6), 524-529
Alcohol industry voluntary labelling - literature 109
low.”137 Also in 2013, a German study compared the effectiveness of warning labels among a college-aged sample. This first test of warning labels provided promising results, and warning labels could be considered as means to influence college-aged people.138 An online study examined awareness of standard drink labelling and safe drinking guidelines among Australian adult drinkers. It found that 80% of the respondents had seen standard drink labels on alcohol products, and were aware of the guidelines. Younger drinkers, those from a regional or rural location, and high-risk drinkers were significantly more likely to have seen the labelling. Just under three-quarters of respondents supported the inclusion of more information on labels about the guidelines to reduce negative health effects. The authors concluded that the current standard drink labelling approach failed to address high-risk drinkers. Inclusion of information about NHMRC guidelines on alcohol labels, and placing standard drink labelling on the front of products could improve awareness of what constitutes a standard drink and safe levels of consumption among Australian drinkers.139 Kersbergen and Field (2017) used eye tracking to study alcohol consumers’ attention to warning labels. They found that warning labels had limited effect on drinking behaviour, potentially because people devoted minimal attention to them, even if their attention was directed to the warning labels, and with no impact on their drinking intentions. The lack of attention to warning labels, even among people who actively wanted to cut down, suggested that there was room for improvement in the content of health warnings on alcohol packaging.140 Most evaluation studies have focussed on how the use of health warning labels on alcohol products is accepted and supported by the public. Use of standard drink labels on alcohol containers was supported by 69% of respondents in the 2004 National Drug Strategy Household Survey. It remained strong but decreased to 65.8% in the 2007 survey, 61.9% in the 2010 survey, and 60.7% in the 2013 survey.141 There is limited evidence on the effectiveness of alcohol warning labels and pregnancy warning labels specifically. Reviewers conclude that there is scope for further research about:
• Drinkers’ interactions with different label displays presented in differing contexts (e.g. effects of seeing the labels in the context of other visual material on alcohol containers)
• The impact of format and wording • If labels should be rotated and updated periodically.
6.12 The effectiveness of pregnancy health warning labels on alcohol products
Pregnancy health warnings on alcoholic beverages were mandated in France in 2007 to promote abstinence during pregnancy. The labels were introduced with a one year transition period. Implementation was accompanied by an extensive media campaign. Anderson reviewed the study conducted by Guillemont and Leon (2008) who conducted two phone surveys, each with 1,000 respondents over the age of 15 - one in 2004 and one in 2007. They found evidence for increasing awareness and recall of the messages especially among teenagers and pregnant women. The survey results showed that:
…the recommendation that pregnant women should not drink alcohol was better known after the introduction of the health warning (87% of the respondents) than before (82%). After the introduction
137 International Centre for Alcohol Policy (2013). Health warning labelling of alcohol products. ICAP Policy Tools Issues Briefing Series. Washington DC: ICAP
138 Glock, S., & Krolak-Schwerdt, S. (2013). Changing outcome expectancies, drinking intentions, and implicit attitudes toward alcohol: a comparison of positive expectancy-related and health-related alcohol warning labels. Applied Psychology: Health and Well-Being, 5(3), 332-347 139 Coomber, K., Jones, S. C., Martino, F., & Miller, P. G. (2016). Predictors of awareness of standard drink labelling and drinking guidelines to reduce negative health effects among Australian drinkers. Drug and alcohol review 140 Kersbergen, I., & Field, M. (2017). Alcohol consumers’ attention to warning labels and brand information on alcohol packaging: Findings from cross-sectional and experimental studies. BMC public health, 17(1), 123 141 Australian Institute of Health and Welfare (2016) Australian Institute of Health and Welfare
Alcohol industry voluntary labelling - literature 110
of the label, 30% thought that the risk for the foetus started after the first glass compared with 25% in 2004. 142, 143
A scoping review of the literature on the effectiveness of warning labels in preventing FASD in 2014 concluded that while the labels were popular with the public, their effectiveness for changing drinking behaviour was limited, and multiple measures were needed to increase awareness of the risks of drinking in pregnancy and influence consumption by pregnant women.144 A 2016 study examined the effects of novel health warning messages on alcohol beverages and whether such messages could influence the speed of alcohol consumption using four prompts: no health warning, text-only warning, pictorial warning, and no health warning. Participants in the Pictorial group had higher ratings of fear and intentions to reduce alcohol consumption. Participants in both text-only and pictorial groups consumed drink at a slower rate compared to the no health warning group.145, A parallel survey of whether a “message on a bottle” was appropriately conveyed the link between alcohol consumption and various cancers suggested that detailed warnings on alcohol products was a viable way to increase public awareness, but further research was needed on the ability of such warnings to influence actual drinking.146 Deshpande and Rundle-Thiele (2012) said some women said they had experienced peer pressure to drink alcohol during pregnancy from partners, parents and friends.147 Reviewers noted that there was no evidence that would support an expectation that pregnancy health warning labels in and of themselves would cause attitudinal or behaviour change. Research showed that awareness of the pregnancy messages on the labels in the whole population can lead to conversations about not drinking alcohol during pregnancy; and may contribute to change in attitudes and behaviours which may in turn lead to reductions in alcohol consumption and risk of poor pregnancy and childhood outcomes.148 149 Reviewers note that there is no evidence that would support an expectation that pregnancy health warning labels themselves would cause attitudinal or behaviour change. Research shows that awareness of the pregnancy messages on the labels in the whole population can lead to conversations about not drinking alcohol during pregnancy; and may contribute to change in attitudes and behaviours which may in turn lead to reductions in alcohol consumption and risk of poor pregnancy and childhood outcomes.150 151 In summary, the available evidence suggests: • There is some evidence to suggest that health warning labels are important in helping to establish a
social understanding that alcohol is a special and hazardous commodity.
• Reviews of the available evidence on the effectiveness of health warning labels on alcohol products have found that health warning labels can raise awareness of harmful use of alcohol.
142 Anderson, P (2012). The impact of alcohol on health. In P Anderson, L Møller & G Galea (eds) Alcohol in the European Union. Copenhagen, Denmark: World Health Organization (WHO)
143 Guillemont, J., & Léon, C. (2008). Alcool et grossesse: connaissances du grand public en 2007 et évolutions en trois ans. Inpes, Évolutions, 15, 1-6. 144 Thomas, G., Gonneau, G., Poole, N., & Cook, J. (2014). The effectiveness of alcohol warning labels in the prevention of Fetal Alcohol Spectrum Disorder: A brief review. The International Journal of Alcohol and Drug Research, 3(1), 91-103 145 Stafford, L. D., Wigg, S., & Salmon, J. (2016). How do influence agents successfully promote health behaviours? Abstracts/Appetite, 107(677e694), 692; Wigg, S., & Stafford, L. D. (2016). Health warnings on alcoholic beverages: perceptions of the health risks and intentions towards alcohol consumption. PloS one, 11(4), e0153027 146 Miller, E. R., Ramsey, I. J., Baratiny, G. Y., & Olver, I. N. (2016). Message on a bottle: are alcohol warning labels about cancer appropriate? BMC public health, 16(1), 1 147 Deshpande S, Rundle-Thiele SR (2012). Segmenting and Targeting American University Students to Promote Responsible
Alcohol Use: A Case for Applying Social Marketing Principles. Health Marketing Quarterly, 28(4): 287-303 148 Wilkinson & Room (2009) 149 Anderson (2012) The impact of alcohol on health 150 Wilkinson & Room (2009) 151 Anderson (2012) The impact of alcohol on health
Alcohol industry voluntary labelling - literature 111
• Currently no evidence exists to support that either health warnings more broadly nor pregnancy health warnings on labels can by themselves cause behaviour change.
• When pregnancy warnings on alcohol products are supported by broader health promotion strategies (e.g. integrated mass and social media campaigns as well as and advertising to promote interpersonal communication) awareness and recall of messages about the potential for alcohol related harm can increase over time.
Alcohol industry voluntary labelling - literature 112
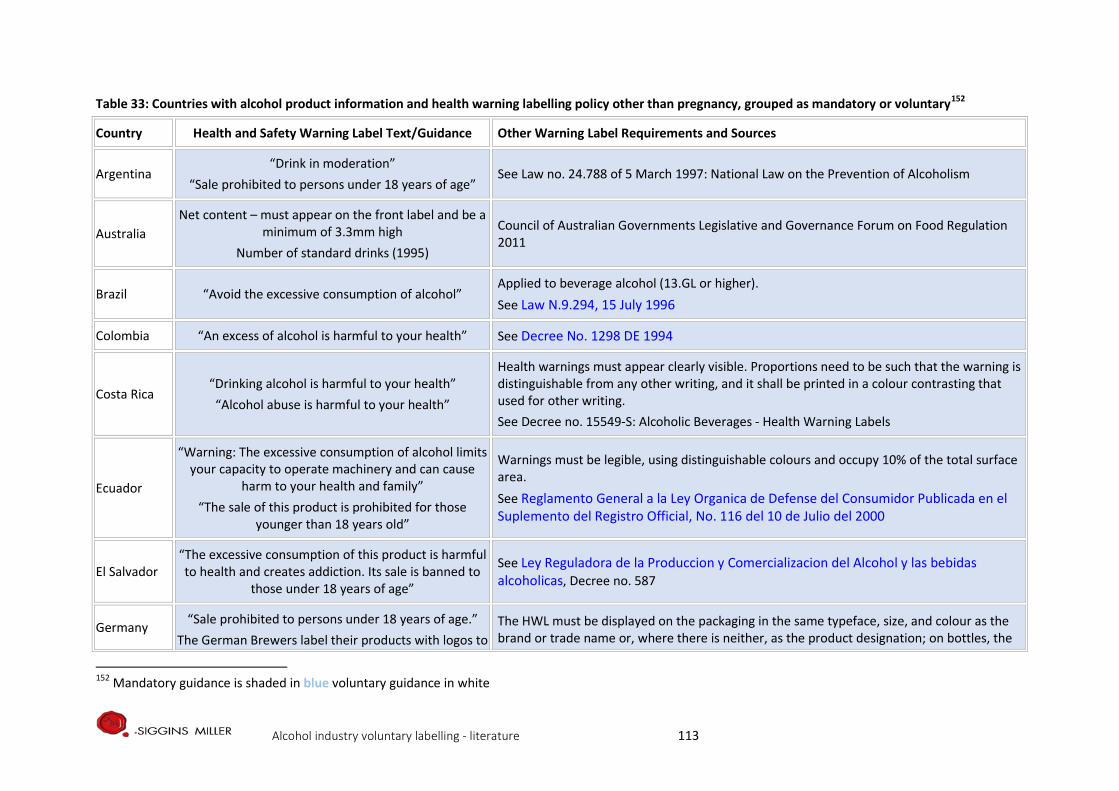
Table 33: Countries with alcohol product information and health warning labelling policy other than pregnancy, grouped as mandatory or voluntary152
Country Health and Safety Warning Label Text/Guidance Other Warning Label Requirements and Sources
Argentina “Drink in moderation”
“Sale prohibited to persons under 18 years of age” See Law no. 24.788 of 5 March 1997: National Law on the Prevention of Alcoholism
Australia Net content – must appear on the front label and be a
minimum of 3.3mm high Number of standard drinks (1995)
Council of Australian Governments Legislative and Governance Forum on Food Regulation 2011
Brazil “Avoid the excessive consumption of alcohol” Applied to beverage alcohol (13.GL or higher). See Law N.9.294, 15 July 1996
Colombia “An excess of alcohol is harmful to your health” See Decree No. 1298 DE 1994
Costa Rica “Drinking alcohol is harmful to your health” “Alcohol abuse is harmful to your health”
Health warnings must appear clearly visible. Proportions need to be such that the warning is distinguishable from any other writing, and it shall be printed in a colour contrasting that used for other writing. See Decree no. 15549-S: Alcoholic Beverages - Health Warning Labels
Ecuador
“Warning: The excessive consumption of alcohol limits your capacity to operate machinery and can cause
harm to your health and family” “The sale of this product is prohibited for those
younger than 18 years old”
Warnings must be legible, using distinguishable colours and occupy 10% of the total surface area. See Reglamento General a la Ley Organica de Defense del Consumidor Publicada en el Suplemento del Registro Official, No. 116 del 10 de Julio del 2000
El Salvador “The excessive consumption of this product is harmful to health and creates addiction. Its sale is banned to
those under 18 years of age”
See Ley Reguladora de la Produccion y Comercializacion del Alcohol y las bebidas alcoholicas, Decree no. 587
Germany “Sale prohibited to persons under 18 years of age.” The German Brewers label their products with logos to
The HWL must be displayed on the packaging in the same typeface, size, and colour as the brand or trade name or, where there is neither, as the product designation; on bottles, the
152 Mandatory guidance is shaded in blue voluntary guidance in white
Alcohol industry voluntary labelling - literature 113
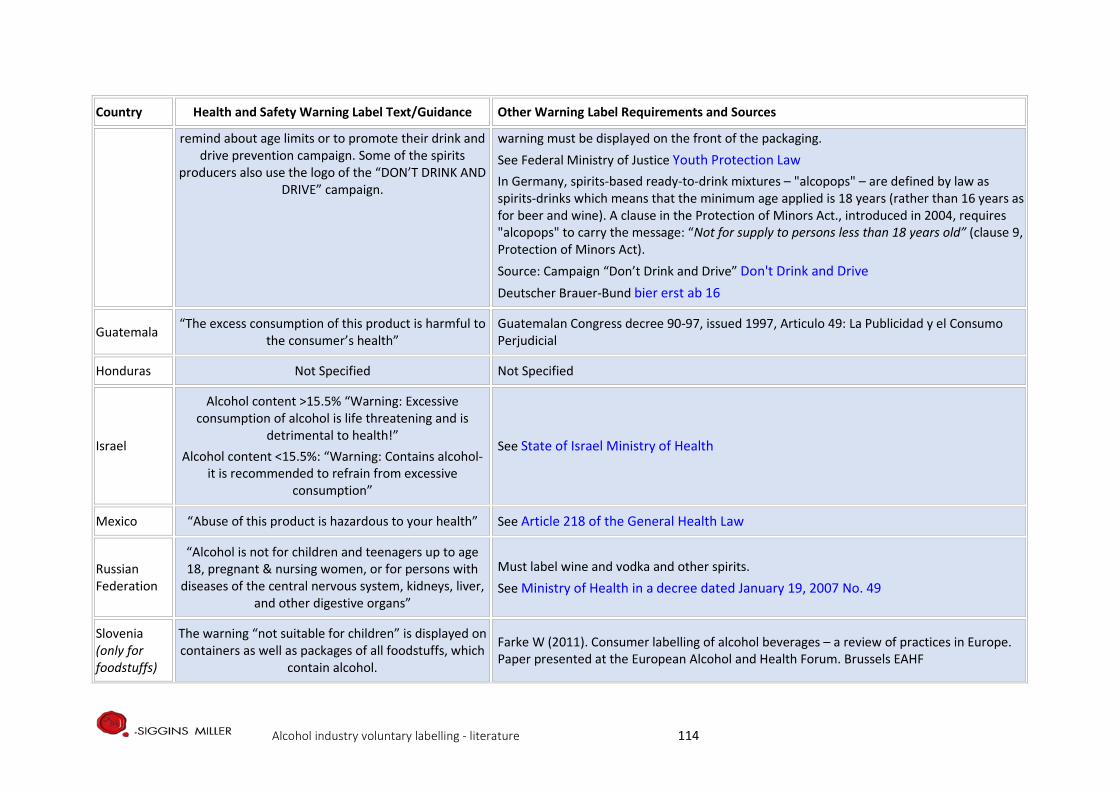
Country Health and Safety Warning Label Text/Guidance Other Warning Label Requirements and Sources
remind about age limits or to promote their drink and drive prevention campaign. Some of the spirits
producers also use the logo of the “DON’T DRINK AND DRIVE” campaign.
warning must be displayed on the front of the packaging. See Federal Ministry of Justice Youth Protection Law In Germany, spirits-based ready-to-drink mixtures – "alcopops" – are defined by law as spirits-drinks which means that the minimum age applied is 18 years (rather than 16 years as for beer and wine). A clause in the Protection of Minors Act., introduced in 2004, requires "alcopops" to carry the message: “Not for supply to persons less than 18 years old” (clause 9, Protection of Minors Act). Source: Campaign “Don’t Drink and Drive” Don't Drink and Drive Deutscher Brauer-Bund bier erst ab 16
Guatemala “The excess consumption of this product is harmful to the consumer’s health”
Guatemalan Congress decree 90-97, issued 1997, Articulo 49: La Publicidad y el Consumo Perjudicial
Honduras Not Specified Not Specified
Israel
Alcohol content >15.5% “Warning: Excessive consumption of alcohol is life threatening and is
detrimental to health!” Alcohol content <15.5%: “Warning: Contains alcohol-
it is recommended to refrain from excessive consumption”
See State of Israel Ministry of Health
Mexico “Abuse of this product is hazardous to your health” See Article 218 of the General Health Law
Russian Federation
“Alcohol is not for children and teenagers up to age 18, pregnant & nursing women, or for persons with
diseases of the central nervous system, kidneys, liver, and other digestive organs”
Must label wine and vodka and other spirits. See Ministry of Health in a decree dated January 19, 2007 No. 49
Slovenia (only for foodstuffs)
The warning “not suitable for children” is displayed on containers as well as packages of all foodstuffs, which
contain alcohol.
Farke W (2011). Consumer labelling of alcohol beverages – a review of practices in Europe. Paper presented at the European Alcohol and Health Forum. Brussels EAHF
Alcohol industry voluntary labelling - literature 114
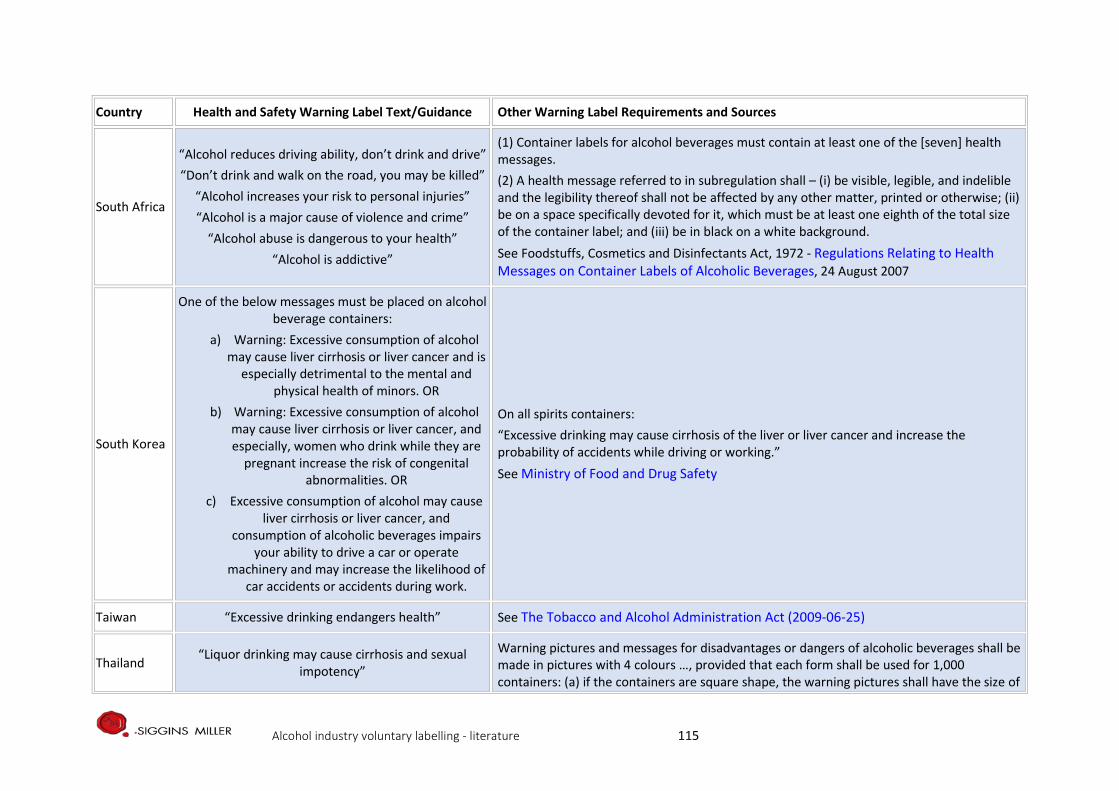
Country Health and Safety Warning Label Text/Guidance Other Warning Label Requirements and Sources
South Africa
“Alcohol reduces driving ability, don’t drink and drive” “Don’t drink and walk on the road, you may be killed”
“Alcohol increases your risk to personal injuries” “Alcohol is a major cause of violence and crime”
“Alcohol abuse is dangerous to your health” “Alcohol is addictive”
(1) Container labels for alcohol beverages must contain at least one of the [seven] health messages. (2) A health message referred to in subregulation shall – (i) be visible, legible, and indelible and the legibility thereof shall not be affected by any other matter, printed or otherwise; (ii) be on a space specifically devoted for it, which must be at least one eighth of the total size of the container label; and (iii) be in black on a white background. See Foodstuffs, Cosmetics and Disinfectants Act, 1972 - Regulations Relating to Health Messages on Container Labels of Alcoholic Beverages, 24 August 2007
South Korea
One of the below messages must be placed on alcohol beverage containers:
a) Warning: Excessive consumption of alcohol may cause liver cirrhosis or liver cancer and is
especially detrimental to the mental and physical health of minors. OR
b) Warning: Excessive consumption of alcohol may cause liver cirrhosis or liver cancer, and especially, women who drink while they are
pregnant increase the risk of congenital abnormalities. OR
c) Excessive consumption of alcohol may cause liver cirrhosis or liver cancer, and
consumption of alcoholic beverages impairs your ability to drive a car or operate
machinery and may increase the likelihood of car accidents or accidents during work.
On all spirits containers: “Excessive drinking may cause cirrhosis of the liver or liver cancer and increase the probability of accidents while driving or working.” See Ministry of Food and Drug Safety
Taiwan “Excessive drinking endangers health” See The Tobacco and Alcohol Administration Act (2009-06-25)
Thailand “Liquor drinking may cause cirrhosis and sexual impotency”
Warning pictures and messages for disadvantages or dangers of alcoholic beverages shall be made in pictures with 4 colours …, provided that each form shall be used for 1,000 containers: (a) if the containers are square shape, the warning pictures shall have the size of
Alcohol industry voluntary labelling - literature 115
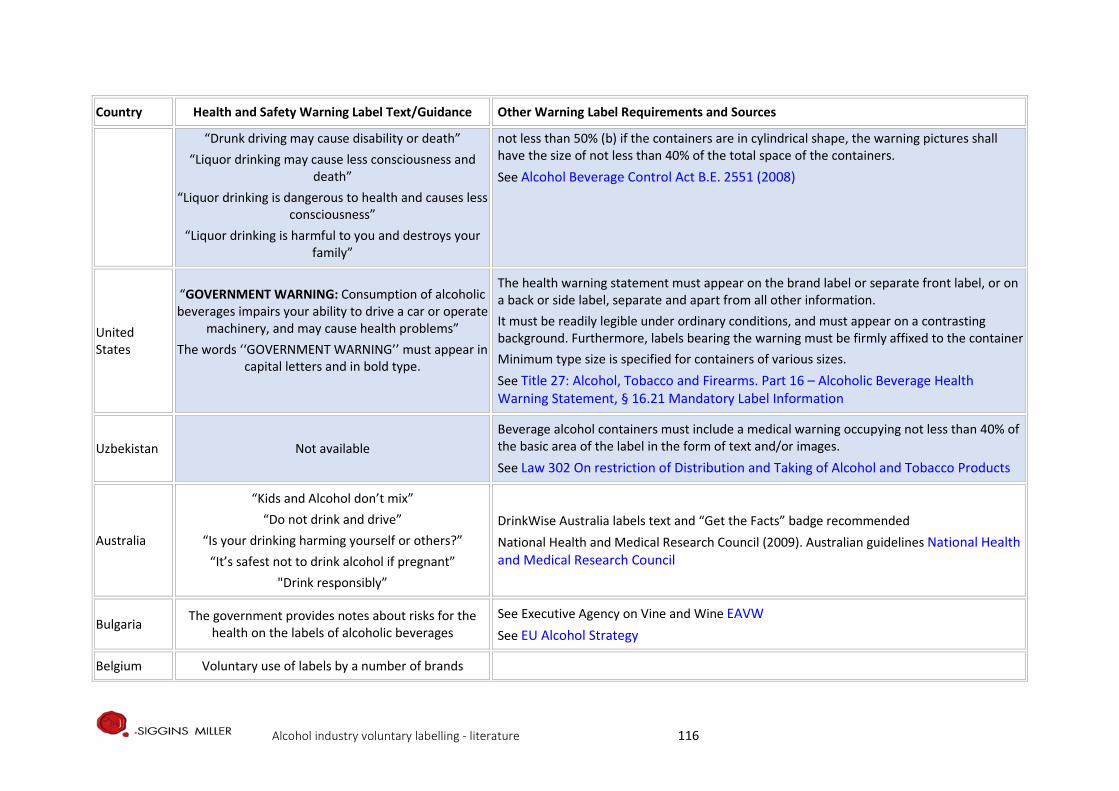
Country Health and Safety Warning Label Text/Guidance Other Warning Label Requirements and Sources
“Drunk driving may cause disability or death” “Liquor drinking may cause less consciousness and
death” “Liquor drinking is dangerous to health and causes less
consciousness” “Liquor drinking is harmful to you and destroys your
family”
not less than 50% (b) if the containers are in cylindrical shape, the warning pictures shall have the size of not less than 40% of the total space of the containers. See Alcohol Beverage Control Act B.E. 2551 (2008)
United States
“GOVERNMENT WARNING: Consumption of alcoholic beverages impairs your ability to drive a car or operate
machinery, and may cause health problems” The words ‘‘GOVERNMENT WARNING’’ must appear in
capital letters and in bold type.
The health warning statement must appear on the brand label or separate front label, or on a back or side label, separate and apart from all other information. It must be readily legible under ordinary conditions, and must appear on a contrasting background. Furthermore, labels bearing the warning must be firmly affixed to the container Minimum type size is specified for containers of various sizes. See Title 27: Alcohol, Tobacco and Firearms. Part 16 – Alcoholic Beverage Health Warning Statement, § 16.21 Mandatory Label Information
Uzbekistan Not available Beverage alcohol containers must include a medical warning occupying not less than 40% of the basic area of the label in the form of text and/or images. See Law 302 On restriction of Distribution and Taking of Alcohol and Tobacco Products
Australia
“Kids and Alcohol don’t mix” “Do not drink and drive”
“Is your drinking harming yourself or others?” “It’s safest not to drink alcohol if pregnant”
"Drink responsibly”
DrinkWise Australia labels text and “Get the Facts” badge recommended National Health and Medical Research Council (2009). Australian guidelines National Health and Medical Research Council
Bulgaria The government provides notes about risks for the health on the labels of alcoholic beverages
See Executive Agency on Vine and Wine EAVW See EU Alcohol Strategy
Belgium Voluntary use of labels by a number of brands
Alcohol industry voluntary labelling - literature 116
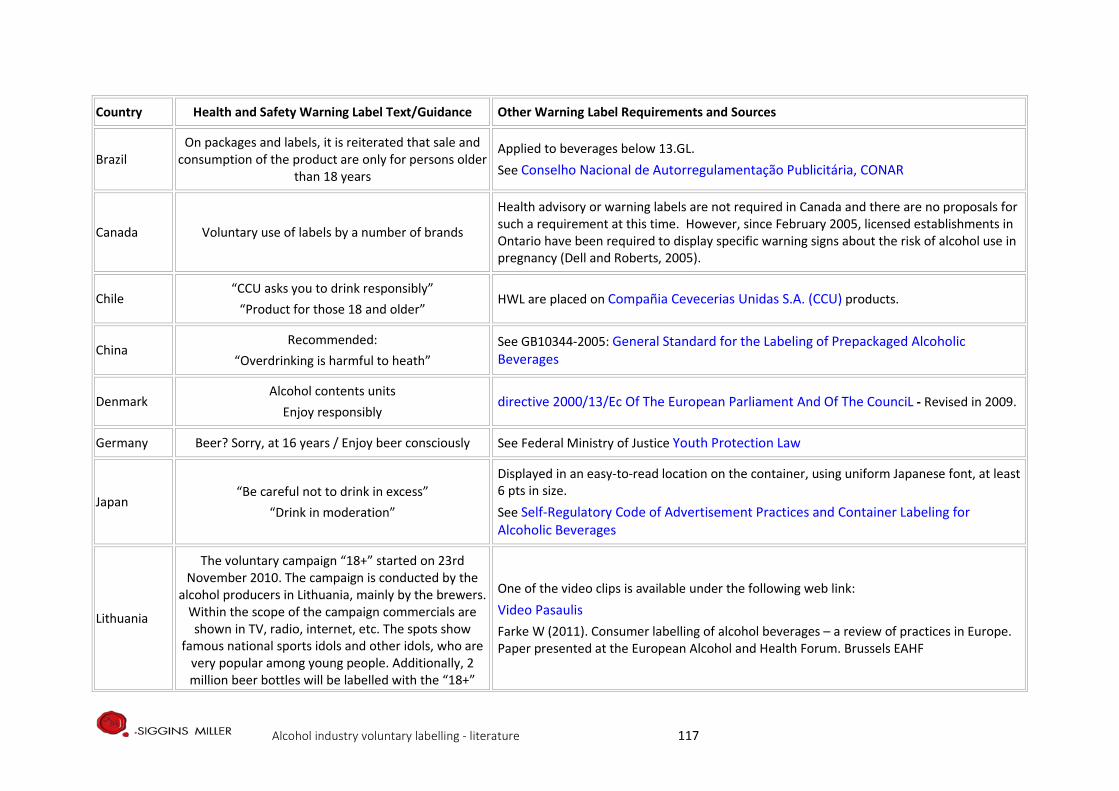
Country Health and Safety Warning Label Text/Guidance Other Warning Label Requirements and Sources
Brazil On packages and labels, it is reiterated that sale and
consumption of the product are only for persons older than 18 years
Applied to beverages below 13.GL. See Conselho Nacional de Autorregulamentação Publicitária, CONAR
Canada Voluntary use of labels by a number of brands
Health advisory or warning labels are not required in Canada and there are no proposals for such a requirement at this time. However, since February 2005, licensed establishments in Ontario have been required to display specific warning signs about the risk of alcohol use in pregnancy (Dell and Roberts, 2005).
Chile “CCU asks you to drink responsibly”
“Product for those 18 and older” HWL are placed on Compañia Cevecerias Unidas S.A. (CCU) products.
China Recommended:
“Overdrinking is harmful to heath” See GB10344-2005: General Standard for the Labeling of Prepackaged Alcoholic Beverages
Denmark Alcohol contents units
Enjoy responsibly directive 2000/13/Ec Of The European Parliament And Of The CounciL - Revised in 2009.
Germany Beer? Sorry, at 16 years / Enjoy beer consciously See Federal Ministry of Justice Youth Protection Law
Japan “Be careful not to drink in excess”
“Drink in moderation”
Displayed in an easy-to-read location on the container, using uniform Japanese font, at least 6 pts in size. See Self-Regulatory Code of Advertisement Practices and Container Labeling for Alcoholic Beverages
Lithuania
The voluntary campaign “18+” started on 23rd November 2010. The campaign is conducted by the
alcohol producers in Lithuania, mainly by the brewers. Within the scope of the campaign commercials are shown in TV, radio, internet, etc. The spots show
famous national sports idols and other idols, who are very popular among young people. Additionally, 2 million beer bottles will be labelled with the “18+”
One of the video clips is available under the following web link: Video Pasaulis Farke W (2011). Consumer labelling of alcohol beverages – a review of practices in Europe. Paper presented at the European Alcohol and Health Forum. Brussels EAHF
Alcohol industry voluntary labelling - literature 117
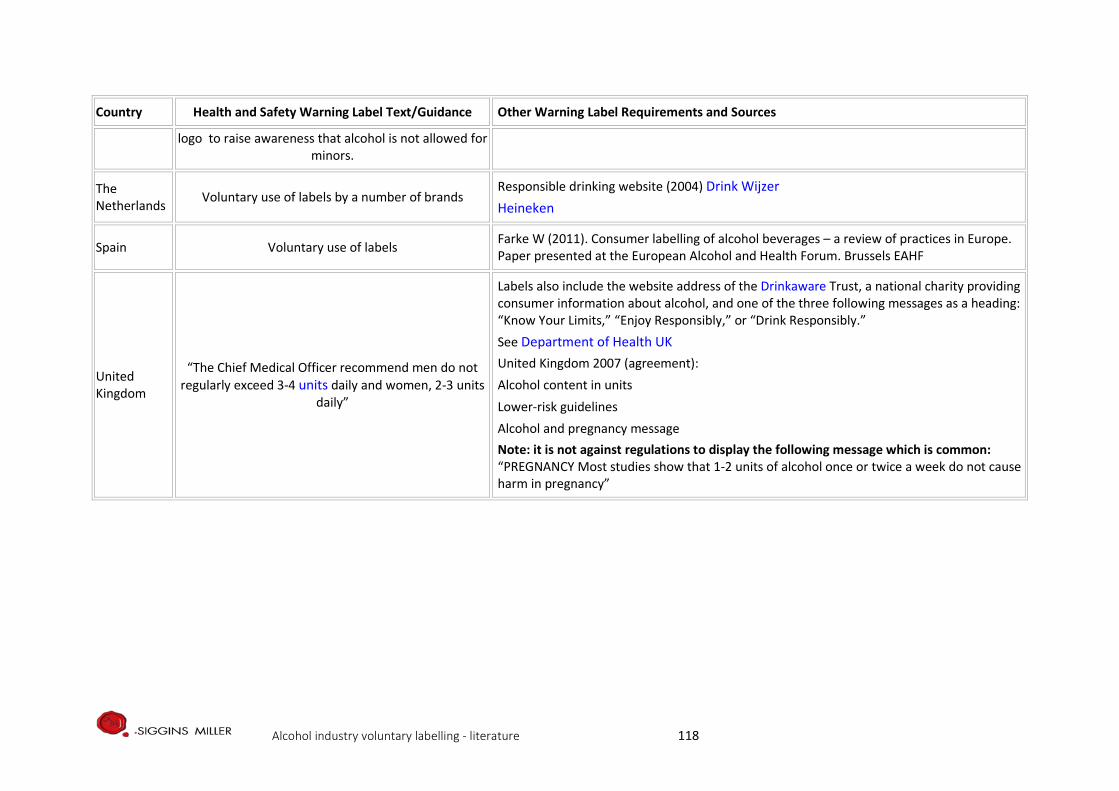
Country Health and Safety Warning Label Text/Guidance Other Warning Label Requirements and Sources
logo to raise awareness that alcohol is not allowed for minors.
The Netherlands Voluntary use of labels by a number of brands
Responsible drinking website (2004) Drink Wijzer Heineken
Spain Voluntary use of labels Farke W (2011). Consumer labelling of alcohol beverages – a review of practices in Europe. Paper presented at the European Alcohol and Health Forum. Brussels EAHF
United Kingdom
“The Chief Medical Officer recommend men do not regularly exceed 3-4 units daily and women, 2-3 units
daily”
Labels also include the website address of the Drinkaware Trust, a national charity providing consumer information about alcohol, and one of the three following messages as a heading: “Know Your Limits,” “Enjoy Responsibly,” or “Drink Responsibly.” See Department of Health UK United Kingdom 2007 (agreement):
Alcohol content in units Lower-risk guidelines Alcohol and pregnancy message
Note: it is not against regulations to display the following message which is common: “PREGNANCY Most studies show that 1-2 units of alcohol once or twice a week do not cause harm in pregnancy”
Alcohol industry voluntary labelling - literature 118
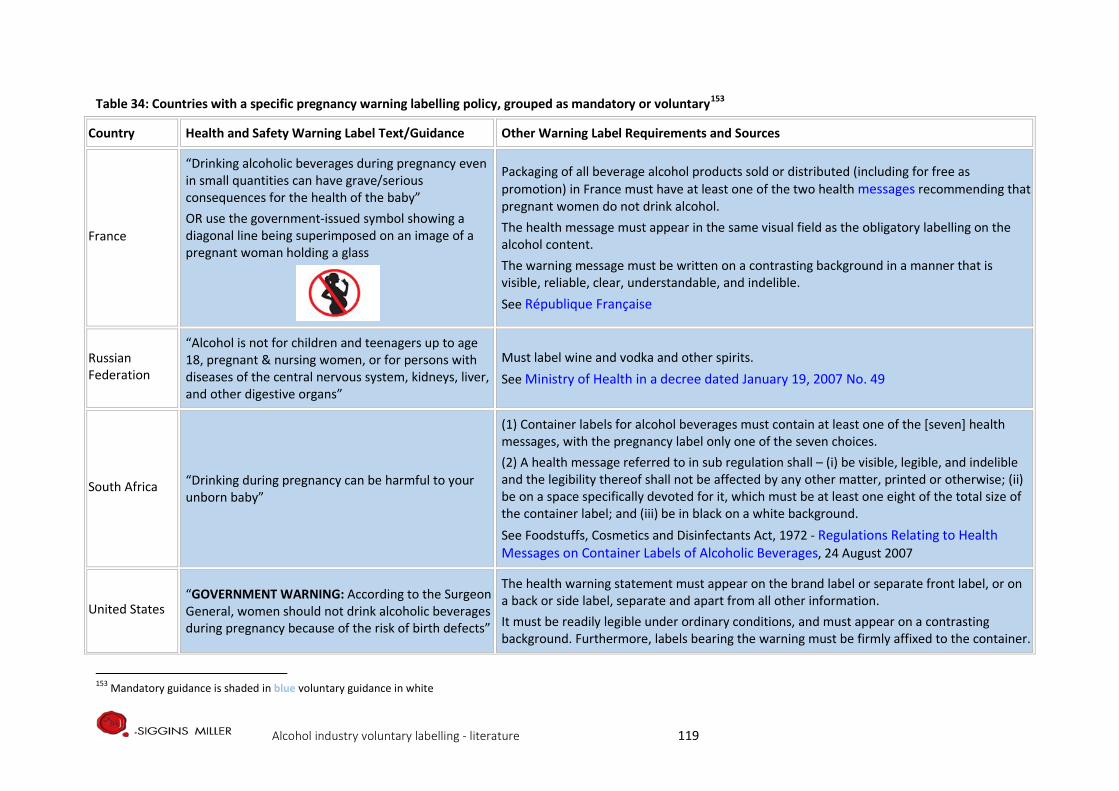
Table 34: Countries with a specific pregnancy warning labelling policy, grouped as mandatory or voluntary153
Country Health and Safety Warning Label Text/Guidance Other Warning Label Requirements and Sources
France
“Drinking alcoholic beverages during pregnancy even in small quantities can have grave/serious consequences for the health of the baby” OR use the government-issued symbol showing a diagonal line being superimposed on an image of a pregnant woman holding a glass
Packaging of all beverage alcohol products sold or distributed (including for free as promotion) in France must have at least one of the two health messages recommending that pregnant women do not drink alcohol. The health message must appear in the same visual field as the obligatory labelling on the alcohol content. The warning message must be written on a contrasting background in a manner that is visible, reliable, clear, understandable, and indelible. See République Française
Russian Federation
“Alcohol is not for children and teenagers up to age 18, pregnant & nursing women, or for persons with diseases of the central nervous system, kidneys, liver, and other digestive organs”
Must label wine and vodka and other spirits. See Ministry of Health in a decree dated January 19, 2007 No. 49
South Africa “Drinking during pregnancy can be harmful to your unborn baby”
(1) Container labels for alcohol beverages must contain at least one of the [seven] health messages, with the pregnancy label only one of the seven choices. (2) A health message referred to in sub regulation shall – (i) be visible, legible, and indelible and the legibility thereof shall not be affected by any other matter, printed or otherwise; (ii) be on a space specifically devoted for it, which must be at least one eight of the total size of the container label; and (iii) be in black on a white background. See Foodstuffs, Cosmetics and Disinfectants Act, 1972 - Regulations Relating to Health Messages on Container Labels of Alcoholic Beverages, 24 August 2007
United States “GOVERNMENT WARNING: According to the Surgeon General, women should not drink alcoholic beverages during pregnancy because of the risk of birth defects”
The health warning statement must appear on the brand label or separate front label, or on a back or side label, separate and apart from all other information. It must be readily legible under ordinary conditions, and must appear on a contrasting background. Furthermore, labels bearing the warning must be firmly affixed to the container.
153 Mandatory guidance is shaded in blue voluntary guidance in white
Alcohol industry voluntary labelling - literature 119
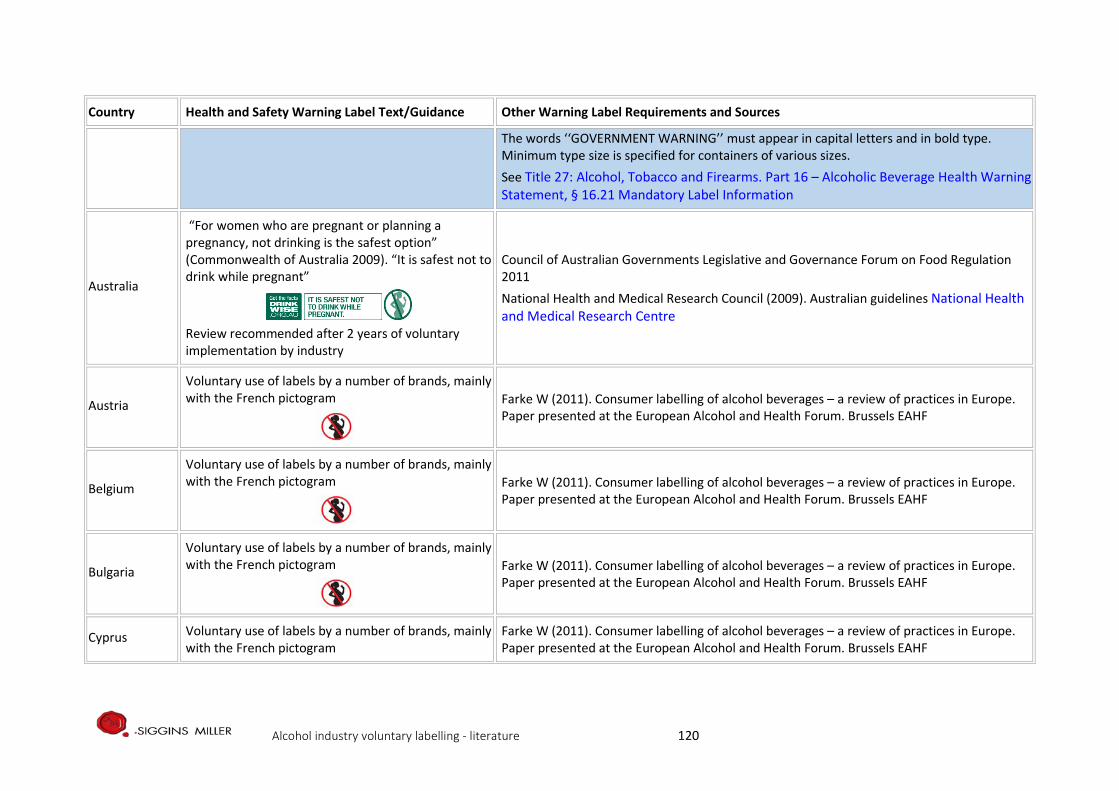
Country Health and Safety Warning Label Text/Guidance Other Warning Label Requirements and Sources
The words ‘‘GOVERNMENT WARNING’’ must appear in capital letters and in bold type. Minimum type size is specified for containers of various sizes. See Title 27: Alcohol, Tobacco and Firearms. Part 16 – Alcoholic Beverage Health Warning Statement, § 16.21 Mandatory Label Information
Australia
“For women who are pregnant or planning a pregnancy, not drinking is the safest option” (Commonwealth of Australia 2009). “It is safest not to drink while pregnant”
Review recommended after 2 years of voluntary implementation by industry
Council of Australian Governments Legislative and Governance Forum on Food Regulation 2011 National Health and Medical Research Council (2009). Australian guidelines National Health and Medical Research Centre
Austria
Voluntary use of labels by a number of brands, mainly with the French pictogram
Farke W (2011). Consumer labelling of alcohol beverages – a review of practices in Europe. Paper presented at the European Alcohol and Health Forum. Brussels EAHF
Belgium
Voluntary use of labels by a number of brands, mainly with the French pictogram
Farke W (2011). Consumer labelling of alcohol beverages – a review of practices in Europe. Paper presented at the European Alcohol and Health Forum. Brussels EAHF
Bulgaria
Voluntary use of labels by a number of brands, mainly with the French pictogram
Farke W (2011). Consumer labelling of alcohol beverages – a review of practices in Europe. Paper presented at the European Alcohol and Health Forum. Brussels EAHF
Cyprus Voluntary use of labels by a number of brands, mainly with the French pictogram
Farke W (2011). Consumer labelling of alcohol beverages – a review of practices in Europe. Paper presented at the European Alcohol and Health Forum. Brussels EAHF
Alcohol industry voluntary labelling - literature 120
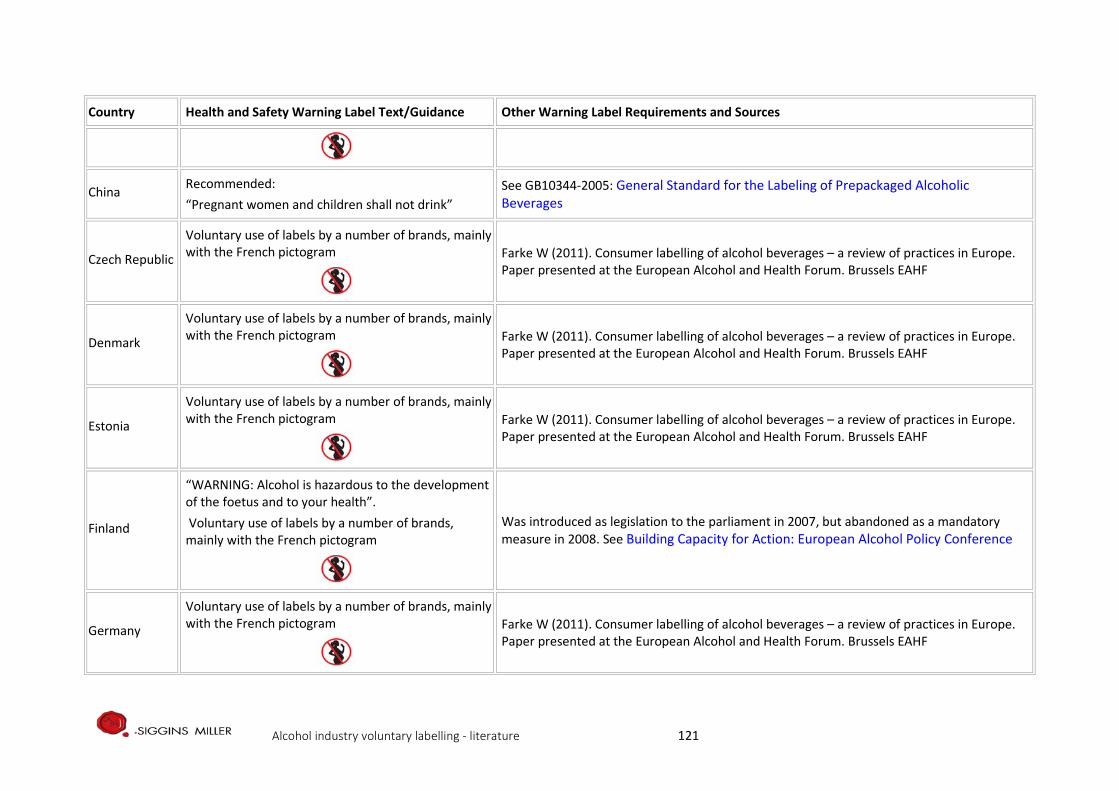
Country Health and Safety Warning Label Text/Guidance Other Warning Label Requirements and Sources
China Recommended: “Pregnant women and children shall not drink”
See GB10344-2005: General Standard for the Labeling of Prepackaged Alcoholic Beverages
Czech Republic
Voluntary use of labels by a number of brands, mainly with the French pictogram
Farke W (2011). Consumer labelling of alcohol beverages – a review of practices in Europe. Paper presented at the European Alcohol and Health Forum. Brussels EAHF
Denmark
Voluntary use of labels by a number of brands, mainly with the French pictogram
Farke W (2011). Consumer labelling of alcohol beverages – a review of practices in Europe. Paper presented at the European Alcohol and Health Forum. Brussels EAHF
Estonia
Voluntary use of labels by a number of brands, mainly with the French pictogram
Farke W (2011). Consumer labelling of alcohol beverages – a review of practices in Europe. Paper presented at the European Alcohol and Health Forum. Brussels EAHF
Finland
“WARNING: Alcohol is hazardous to the development of the foetus and to your health”. Voluntary use of labels by a number of brands, mainly with the French pictogram
Was introduced as legislation to the parliament in 2007, but abandoned as a mandatory measure in 2008. See Building Capacity for Action: European Alcohol Policy Conference
Germany
Voluntary use of labels by a number of brands, mainly with the French pictogram
Farke W (2011). Consumer labelling of alcohol beverages – a review of practices in Europe. Paper presented at the European Alcohol and Health Forum. Brussels EAHF
Alcohol industry voluntary labelling - literature 121
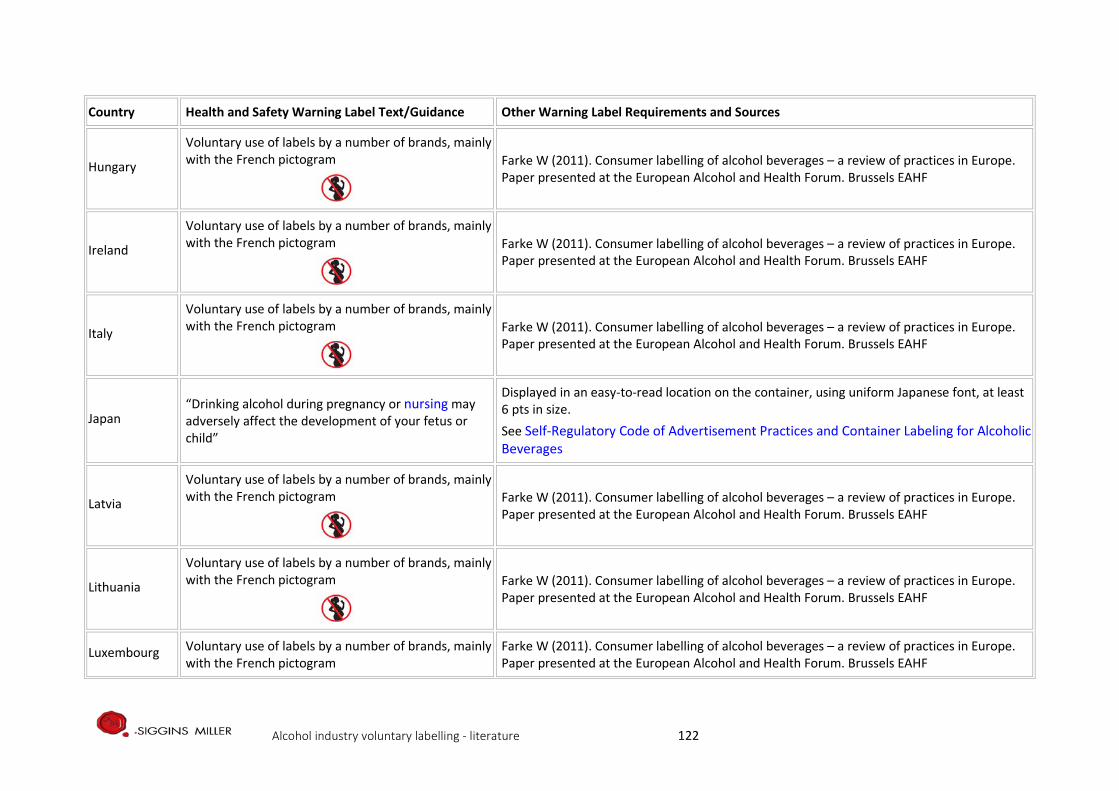
Country Health and Safety Warning Label Text/Guidance Other Warning Label Requirements and Sources
Hungary
Voluntary use of labels by a number of brands, mainly with the French pictogram
Farke W (2011). Consumer labelling of alcohol beverages – a review of practices in Europe. Paper presented at the European Alcohol and Health Forum. Brussels EAHF
Ireland
Voluntary use of labels by a number of brands, mainly with the French pictogram
Farke W (2011). Consumer labelling of alcohol beverages – a review of practices in Europe. Paper presented at the European Alcohol and Health Forum. Brussels EAHF
Italy
Voluntary use of labels by a number of brands, mainly with the French pictogram
Farke W (2011). Consumer labelling of alcohol beverages – a review of practices in Europe. Paper presented at the European Alcohol and Health Forum. Brussels EAHF
Japan “Drinking alcohol during pregnancy or nursing may adversely affect the development of your fetus or child”
Displayed in an easy-to-read location on the container, using uniform Japanese font, at least 6 pts in size. See Self-Regulatory Code of Advertisement Practices and Container Labeling for Alcoholic Beverages
Latvia
Voluntary use of labels by a number of brands, mainly with the French pictogram
Farke W (2011). Consumer labelling of alcohol beverages – a review of practices in Europe. Paper presented at the European Alcohol and Health Forum. Brussels EAHF
Lithuania
Voluntary use of labels by a number of brands, mainly with the French pictogram
Farke W (2011). Consumer labelling of alcohol beverages – a review of practices in Europe. Paper presented at the European Alcohol and Health Forum. Brussels EAHF
Luxembourg Voluntary use of labels by a number of brands, mainly with the French pictogram
Farke W (2011). Consumer labelling of alcohol beverages – a review of practices in Europe. Paper presented at the European Alcohol and Health Forum. Brussels EAHF
Alcohol industry voluntary labelling - literature 122
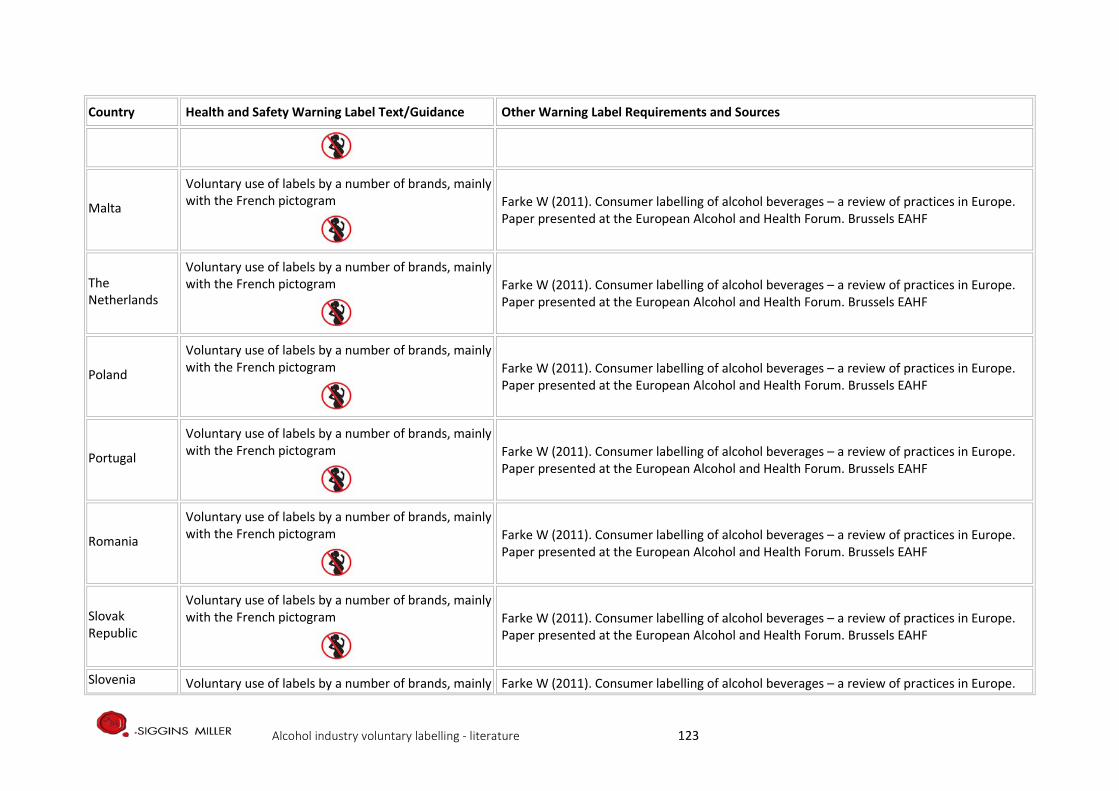
Country Health and Safety Warning Label Text/Guidance Other Warning Label Requirements and Sources
Malta
Voluntary use of labels by a number of brands, mainly with the French pictogram
Farke W (2011). Consumer labelling of alcohol beverages – a review of practices in Europe. Paper presented at the European Alcohol and Health Forum. Brussels EAHF
The Netherlands
Voluntary use of labels by a number of brands, mainly with the French pictogram
Farke W (2011). Consumer labelling of alcohol beverages – a review of practices in Europe. Paper presented at the European Alcohol and Health Forum. Brussels EAHF
Poland
Voluntary use of labels by a number of brands, mainly with the French pictogram
Farke W (2011). Consumer labelling of alcohol beverages – a review of practices in Europe. Paper presented at the European Alcohol and Health Forum. Brussels EAHF
Portugal
Voluntary use of labels by a number of brands, mainly with the French pictogram
Farke W (2011). Consumer labelling of alcohol beverages – a review of practices in Europe. Paper presented at the European Alcohol and Health Forum. Brussels EAHF
Romania
Voluntary use of labels by a number of brands, mainly with the French pictogram
Farke W (2011). Consumer labelling of alcohol beverages – a review of practices in Europe. Paper presented at the European Alcohol and Health Forum. Brussels EAHF
Slovak Republic
Voluntary use of labels by a number of brands, mainly with the French pictogram
Farke W (2011). Consumer labelling of alcohol beverages – a review of practices in Europe. Paper presented at the European Alcohol and Health Forum. Brussels EAHF
Slovenia Voluntary use of labels by a number of brands, mainly Farke W (2011). Consumer labelling of alcohol beverages – a review of practices in Europe.
Alcohol industry voluntary labelling - literature 123
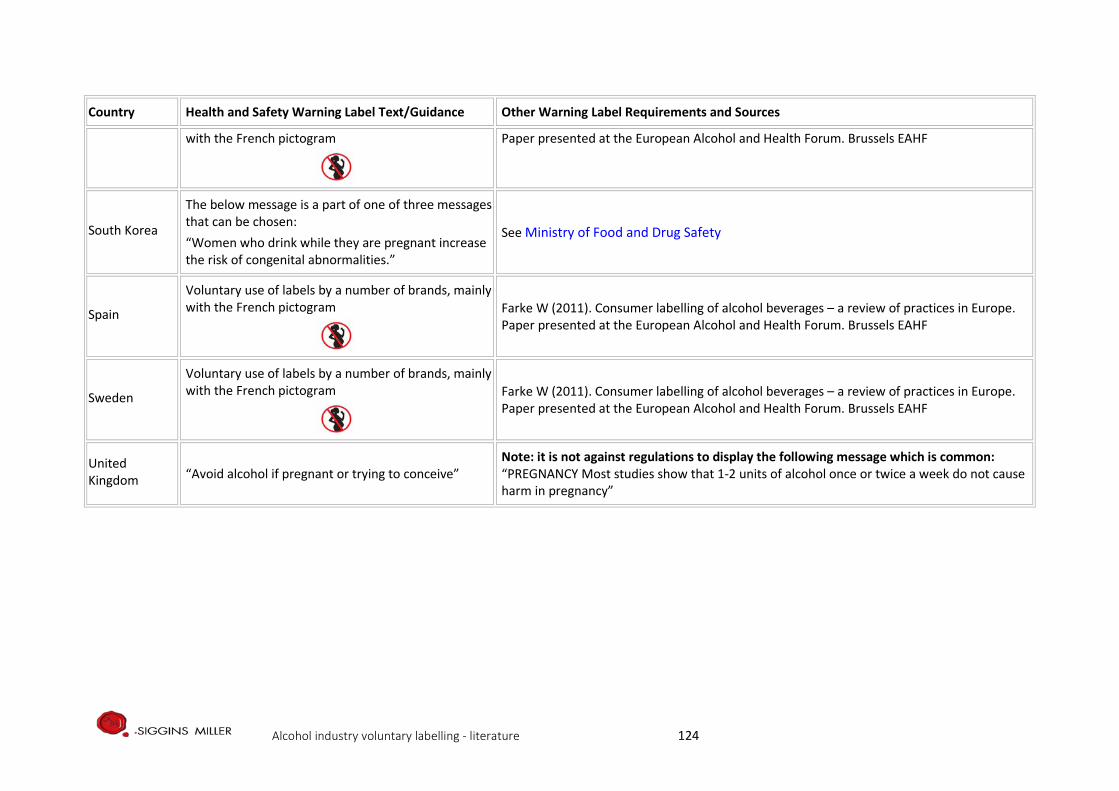
Country Health and Safety Warning Label Text/Guidance Other Warning Label Requirements and Sources
with the French pictogram
Paper presented at the European Alcohol and Health Forum. Brussels EAHF
South Korea
The below message is a part of one of three messages that can be chosen: “Women who drink while they are pregnant increase the risk of congenital abnormalities.”
See Ministry of Food and Drug Safety
Spain
Voluntary use of labels by a number of brands, mainly with the French pictogram
Farke W (2011). Consumer labelling of alcohol beverages – a review of practices in Europe. Paper presented at the European Alcohol and Health Forum. Brussels EAHF
Sweden
Voluntary use of labels by a number of brands, mainly with the French pictogram
Farke W (2011). Consumer labelling of alcohol beverages – a review of practices in Europe. Paper presented at the European Alcohol and Health Forum. Brussels EAHF
United Kingdom “Avoid alcohol if pregnant or trying to conceive”
Note: it is not against regulations to display the following message which is common: “PREGNANCY Most studies show that 1-2 units of alcohol once or twice a week do not cause harm in pregnancy”
Alcohol industry voluntary labelling - literature 124
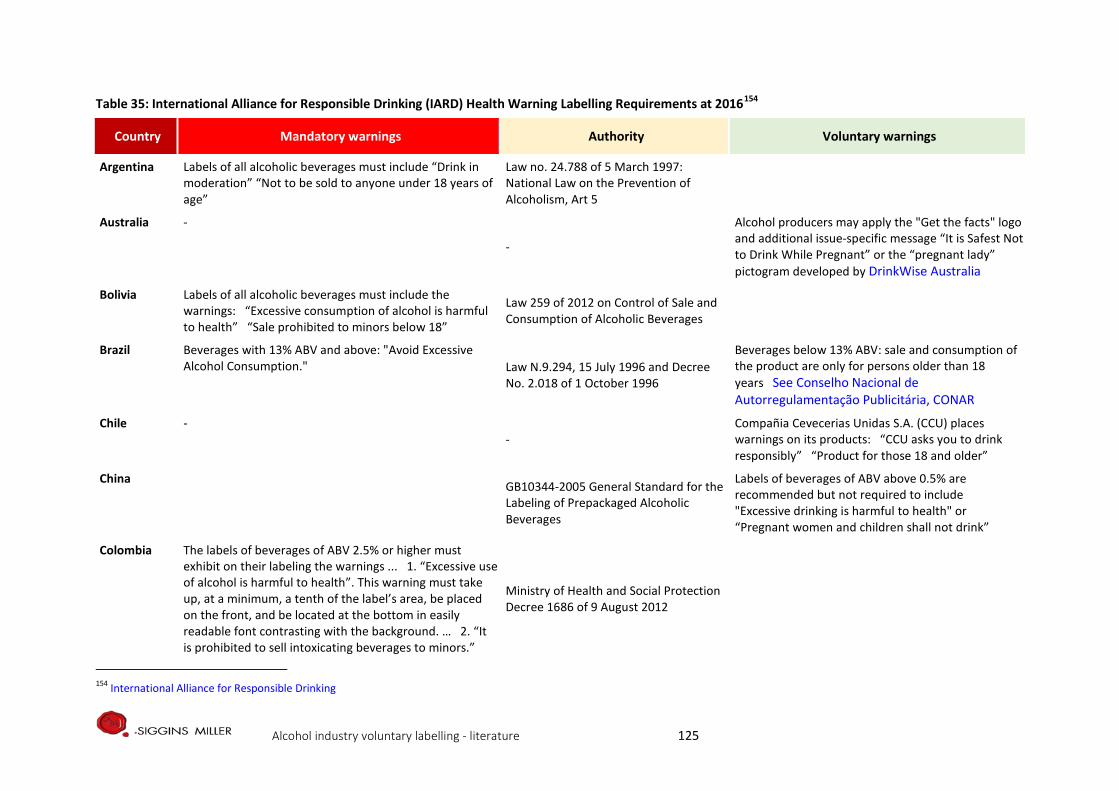
Table 35: International Alliance for Responsible Drinking (IARD) Health Warning Labelling Requirements at 2016154
Country Mandatory warnings Authority Voluntary warnings
Argentina Labels of all alcoholic beverages must include “Drink in moderation” “Not to be sold to anyone under 18 years of age”
Law no. 24.788 of 5 March 1997: National Law on the Prevention of Alcoholism, Art 5
Australia -
-
Alcohol producers may apply the "Get the facts" logo and additional issue-specific message “It is Safest Not to Drink While Pregnant” or the “pregnant lady” pictogram developed by DrinkWise Australia
Bolivia Labels of all alcoholic beverages must include the warnings: “Excessive consumption of alcohol is harmful to health” “Sale prohibited to minors below 18”
Law 259 of 2012 on Control of Sale and Consumption of Alcoholic Beverages
Brazil Beverages with 13% ABV and above: "Avoid Excessive Alcohol Consumption." Law N.9.294, 15 July 1996 and Decree
No. 2.018 of 1 October 1996
Beverages below 13% ABV: sale and consumption of the product are only for persons older than 18 years See Conselho Nacional de Autorregulamentação Publicitária, CONAR
Chile - -
Compañia Cevecerias Unidas S.A. (CCU) places warnings on its products: “CCU asks you to drink responsibly” “Product for those 18 and older”
China GB10344-2005 General Standard for the Labeling of Prepackaged Alcoholic Beverages
Labels of beverages of ABV above 0.5% are recommended but not required to include "Excessive drinking is harmful to health" or “Pregnant women and children shall not drink”
Colombia The labels of beverages of ABV 2.5% or higher must exhibit on their labeling the warnings ... 1. “Excessive use of alcohol is harmful to health”. This warning must take up, at a minimum, a tenth of the label’s area, be placed on the front, and be located at the bottom in easily readable font contrasting with the background. … 2. “It is prohibited to sell intoxicating beverages to minors.”
Ministry of Health and Social Protection Decree 1686 of 9 August 2012
154 International Alliance for Responsible Drinking
Alcohol industry voluntary labelling - literature 125
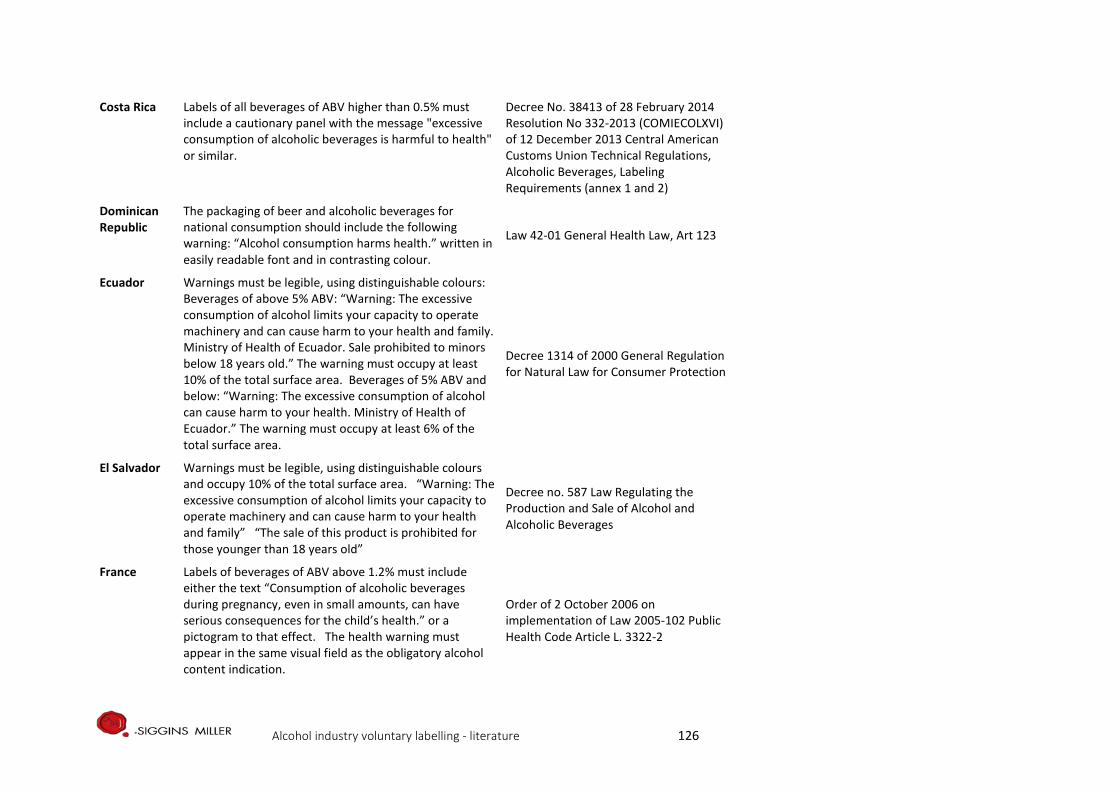
Costa Rica Labels of all beverages of ABV higher than 0.5% must include a cautionary panel with the message "excessive consumption of alcoholic beverages is harmful to health" or similar.
Decree No. 38413 of 28 February 2014 Resolution No 332-2013 (COMIECOLXVI) of 12 December 2013 Central American Customs Union Technical Regulations, Alcoholic Beverages, Labeling Requirements (annex 1 and 2)
Dominican Republic
The packaging of beer and alcoholic beverages for national consumption should include the following warning: “Alcohol consumption harms health.” written in easily readable font and in contrasting colour.
Law 42-01 General Health Law, Art 123
Ecuador Warnings must be legible, using distinguishable colours: Beverages of above 5% ABV: “Warning: The excessive consumption of alcohol limits your capacity to operate machinery and can cause harm to your health and family. Ministry of Health of Ecuador. Sale prohibited to minors below 18 years old.” The warning must occupy at least 10% of the total surface area. Beverages of 5% ABV and below: “Warning: The excessive consumption of alcohol can cause harm to your health. Ministry of Health of Ecuador.” The warning must occupy at least 6% of the total surface area.
Decree 1314 of 2000 General Regulation for Natural Law for Consumer Protection
El Salvador Warnings must be legible, using distinguishable colours and occupy 10% of the total surface area. “Warning: The excessive consumption of alcohol limits your capacity to operate machinery and can cause harm to your health and family” “The sale of this product is prohibited for those younger than 18 years old”
Decree no. 587 Law Regulating the Production and Sale of Alcohol and Alcoholic Beverages
France Labels of beverages of ABV above 1.2% must include either the text “Consumption of alcoholic beverages during pregnancy, even in small amounts, can have serious consequences for the child’s health.” or a pictogram to that effect. The health warning must appear in the same visual field as the obligatory alcohol content indication.
Order of 2 October 2006 on implementation of Law 2005-102 Public Health Code Article L. 3322-2
Alcohol industry voluntary labelling - literature 126
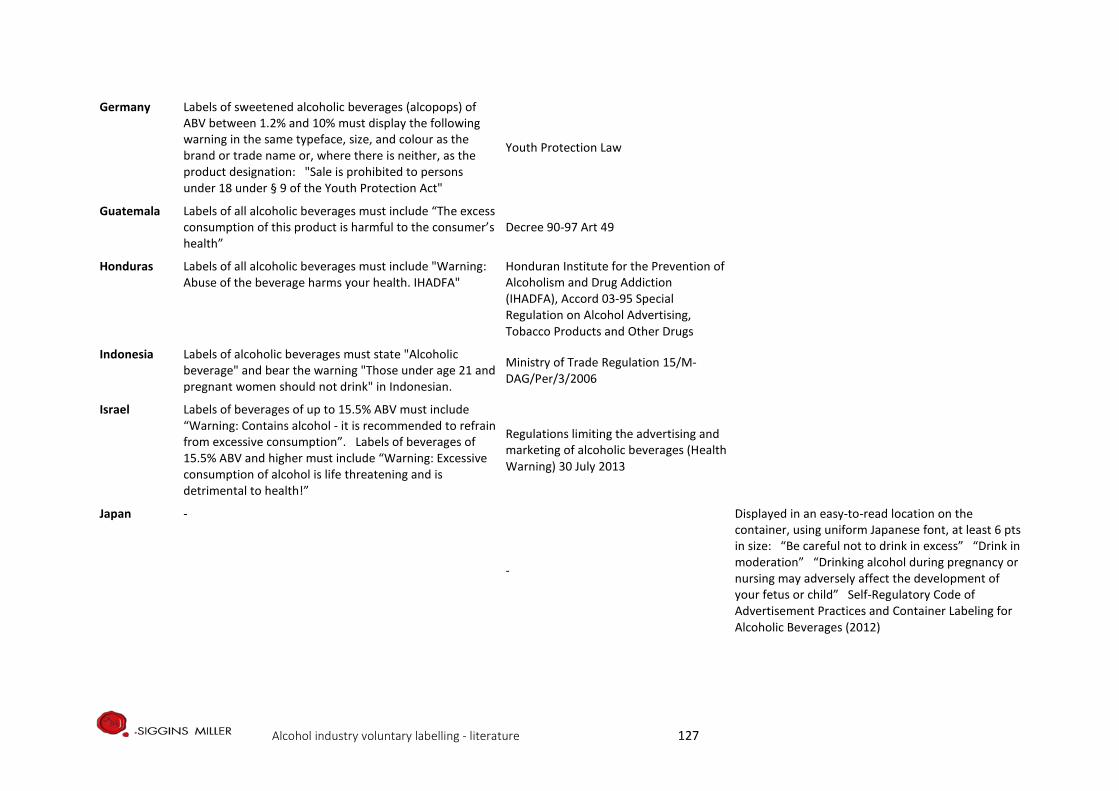
Germany Labels of sweetened alcoholic beverages (alcopops) of ABV between 1.2% and 10% must display the following warning in the same typeface, size, and colour as the brand or trade name or, where there is neither, as the product designation: "Sale is prohibited to persons under 18 under § 9 of the Youth Protection Act"
Youth Protection Law
Guatemala Labels of all alcoholic beverages must include “The excess consumption of this product is harmful to the consumer’s health”
Decree 90-97 Art 49
Honduras Labels of all alcoholic beverages must include "Warning: Abuse of the beverage harms your health. IHADFA"
Honduran Institute for the Prevention of Alcoholism and Drug Addiction (IHADFA), Accord 03-95 Special Regulation on Alcohol Advertising, Tobacco Products and Other Drugs
Indonesia Labels of alcoholic beverages must state "Alcoholic beverage" and bear the warning "Those under age 21 and pregnant women should not drink" in Indonesian.
Ministry of Trade Regulation 15/M-DAG/Per/3/2006
Israel Labels of beverages of up to 15.5% ABV must include “Warning: Contains alcohol - it is recommended to refrain from excessive consumption”. Labels of beverages of 15.5% ABV and higher must include “Warning: Excessive consumption of alcohol is life threatening and is detrimental to health!”
Regulations limiting the advertising and marketing of alcoholic beverages (Health Warning) 30 July 2013
Japan -
-
Displayed in an easy-to-read location on the container, using uniform Japanese font, at least 6 pts in size: “Be careful not to drink in excess” “Drink in moderation” “Drinking alcohol during pregnancy or nursing may adversely affect the development of your fetus or child” Self-Regulatory Code of Advertisement Practices and Container Labeling for Alcoholic Beverages (2012)
Alcohol industry voluntary labelling - literature 127
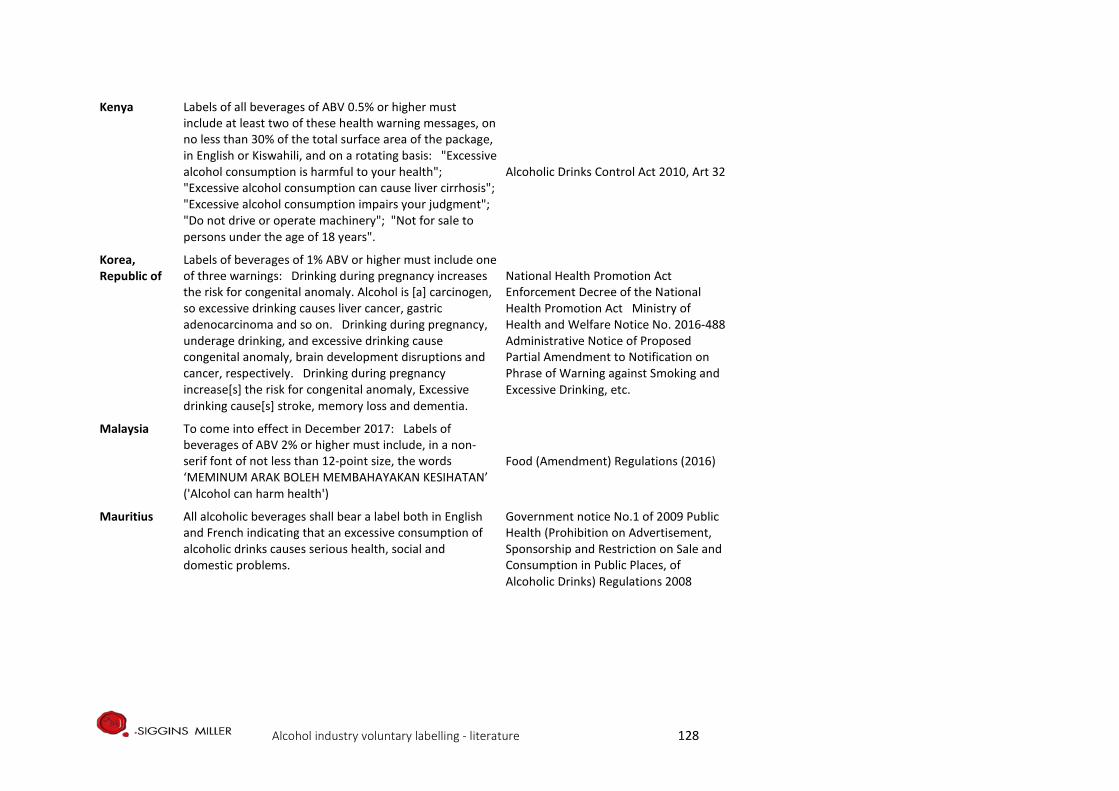
Kenya Labels of all beverages of ABV 0.5% or higher must include at least two of these health warning messages, on no less than 30% of the total surface area of the package, in English or Kiswahili, and on a rotating basis: "Excessive alcohol consumption is harmful to your health"; "Excessive alcohol consumption can cause liver cirrhosis"; "Excessive alcohol consumption impairs your judgment"; "Do not drive or operate machinery"; "Not for sale to persons under the age of 18 years".
Alcoholic Drinks Control Act 2010, Art 32
Korea, Republic of
Labels of beverages of 1% ABV or higher must include one of three warnings: Drinking during pregnancy increases the risk for congenital anomaly. Alcohol is [a] carcinogen, so excessive drinking causes liver cancer, gastric adenocarcinoma and so on. Drinking during pregnancy, underage drinking, and excessive drinking cause congenital anomaly, brain development disruptions and cancer, respectively. Drinking during pregnancy increase[s] the risk for congenital anomaly, Excessive drinking cause[s] stroke, memory loss and dementia.
National Health Promotion Act Enforcement Decree of the National Health Promotion Act Ministry of Health and Welfare Notice No. 2016-488 Administrative Notice of Proposed Partial Amendment to Notification on Phrase of Warning against Smoking and Excessive Drinking, etc.
Malaysia To come into effect in December 2017: Labels of beverages of ABV 2% or higher must include, in a non-serif font of not less than 12-point size, the words ‘MEMINUM ARAK BOLEH MEMBAHAYAKAN KESIHATAN’ ('Alcohol can harm health')
Food (Amendment) Regulations (2016)
Mauritius All alcoholic beverages shall bear a label both in English and French indicating that an excessive consumption of alcoholic drinks causes serious health, social and domestic problems.
Government notice No.1 of 2009 Public Health (Prohibition on Advertisement, Sponsorship and Restriction on Sale and Consumption in Public Places, of Alcoholic Drinks) Regulations 2008
Alcohol industry voluntary labelling - literature 128
Mexico Labels of alcoholic beverages of 2.0% to 55%ABV must include "The abuse of the consumption of this product is harmful to health." The warning must be in uppercase and in a contrasting colour. The required size of lettering varies by beverage ABV. Labels of alcoholic beverages of higher than 6.0%ABV: Of three pictogram warnings (against consumption by minors aged under 18 and by pregnant women and against driving under the influence of alcohol), either all three must be included simultaneously, or a single one may be included in which case the pictogram chosen must be changed on a rotating principle every four months. Labels of alcoholic beverages with ABV 2.0-6.0% must display a modified pictogram warning against consumption by minors aged under 18. Labels may voluntarily include the statement "For more information visit the page: www.conadic.salud.gob.mx, where there is information on the harmful use of alcohol". Labels of alcoholic beverages of ABV below 2.0% must include “This product contains % of alcohol. Not recommended for children.”
Mexican Official Standard NOM-142-SSA1 / SCFI-2014 Alcoholic beverages, Sanitary specifications, Sanitary and commercial labeling, 9.7.2 Regulation on Sanitary Control of Products and Services, Appendix
Mozambique Labels of all alcoholic beverages must contain the following phrase in upper case, easily readable letters: "Sale to and consumption by persons under 18 years of age is prohibited."
Decree No 54/2013 Regulation on the control of the production, marketing and consumption of alcoholic beverages
Nicaragua Labels of all beverages of ABV higher than 0.5% must include a cautionary panel with the message "excessive consumption of alcoholic beverages is harmful to health" or similar.
Official Gazette No.163 of 28 August 2014 transposing Central American Technical Regulation RTCA 67.01.05:11 Alcoholic Beverages Labelling Requirements
Peru Labels of all fermented and distilled beverages must contain, on an area no smaller than 10% of the packaging, in easily readable capital letters, the phrase “Excessive drinking of alcoholic beverages is harmful.”
Law 28681 Regulating the Marketing, Consumption and Advertising of Alcoholic Beverages 2006
Alcohol industry voluntary labelling - literature 129
Russian Federation
Labels of wine and spirits, including vodka, must contain the message “Alcohol is not for children and teenagers up to age 18, pregnant and nursing women, or for persons with diseases of the central nervous system, kidneys, liver, and other digestive organs.”
Ministry of Health Decree No. 49 of 19 January 2007
Slovenia Labels of alcoholic beverages must include a warning that they are not suitable for children, printed in capital letters that are clearly visible, readable and are a distinctly different colour from the background.
Act Restricting the Use of Alcohol 2003 Art 6
South Africa (1) Container labels for alcohol beverages must contain at least one of the [seven] health messages. (2) A health message referred to in subregulation shall – (i) be visible, legible, and indelible and the legibility thereof shall not be affected by any other matter, printed or otherwise; (ii) be on a space specifically devoted for it, which must be at least one eight of the total size of the container label; and (iii) be in black on a white background. “Alcohol abuse is dangerous to your health” “Alcohol is addictive” “Alcohol increases your risk to personal injuries” “Alcohol is a major cause of violence and crime” “Drinking during pregnancy can be harmful to your unborn baby” “Don’t drink and walk on the road, you may be killed” “Alcohol reduces driving ability, don’t drink and drive”
Regulations Relating to Health Messages on Container Labels of Alcoholic Beverages, 24 August 2007 for the Foodstuffs, Cosmetics and Disinfectants Act 1972
Alcohol industry voluntary labelling - literature 130
Thailand Warning pictures and messages for disadvantages or dangers of alcoholic beverages shall be made in pictures with 4 colours, provided that each form shall be used for 1,000 containers: (a) if the containers are square shape, the warning pictures shall have the size of not less than 50% (b) if the containers are in cylindrical shape, the warning pictures shall have the size of not less than 40% of the total space of the containers. “Liquor drinking may cause cirrhosis and sexual impotency” “Liquor drinking may cause less consciousness and death” “Liquor drinking is dangerous to health and causes less consciousness” “Liquor drinking is harmful to you and destroys your family” “Drunk driving may cause disability or death”
Alcohol Beverage Control Act B.E. 2551 (2008)
Togo Packaging of alcoholic beverages must bear the warning "seriously damages health" and the ABV of the beverage. Law 2009-007 Health Code Art 91
Turkey Labels of all alcoholic beverages must include the text "Alcohol is not your friend." and three pictograms: against drinking by minors aged below 18, against drinking by pregnant women, and against driving under the influence of alcohol.
Tobacco and Alcohol Regulatory Authority, Communique on warning messages to be affixed on the packaging of alcoholic beverages per Law No. 6487 of 11/06/2013
United Kingdom
-
-
“The Chief Medical Officer recommends men do not regularly exceed 3-4 units daily and women, 2-3 units daily” Labels also include the website address of the Drinkaware Trust, a national charity providing consumer information about alcohol, and one of the three following messages as a heading: “Know Your Limits,” “Enjoy Responsibly,” or “Drink Responsibly.”" UK Department of Health and private partners, Public Health Responsibility Deal (2011)
Alcohol industry voluntary labelling - literature 131
United States The health warning statement must appear on the brand label or separate front label, or on a back or side label, separate and apart from all other information. It must be readily legible under ordinary conditions, and must appear on a contrasting background. Labels bearing the warning must be firmly affixed to the container. Minimum type size is specified for containers of various sizes. “GOVERNMENT WARNING: (1) According to the Surgeon General, women should not drink alcoholic beverages during pregnancy because of the risk of birth defects. (2) Consumption of alcoholic beverages impairs your ability to drive a car or operate machinery, and may cause health problems”
Title 27: Alcohol, Tobacco and Firearms. Part 16 – Alcoholic Beverage Health Warning Statement, § 16.21 Mandatory Label Information
Uzbekistan Labels of all alcoholic beverages of greater than 1.5% ABV must include the following warning, occupying not less than 40% of the label area: "The excessive consumption of alcoholic beverages leads to severe diseases of the human nervous system and internal organs.” The content of the warning shall be reviewed every five years.
Law 302 On restriction of Distribution and Taking of Alcohol and Tobacco Products and Ministry of Health Regulation No. 311 of 17 November 2011
Zimbabwe Labels of all alcoholic beverages of 0.2% ABV or higher must bear two warnings: "Alcohol may be hazardous to health if consumed to excess, the operation of machinery or driving after the consumption of alcohol is not advisable." "Not for sale to persons under the age of 18 years."
Statutory Instrument 25 of 2001 Food and Food Standards (Alcoholic Beverages) Regulations
Alcohol industry voluntary labelling - literature 132
Bibliography
Alcohol Education and Rehabilitation Foundation (now FARE) (2011). AER, AER Foundation Policy Position Paper. Alcohol Product Labelling: Health Warning Labels and Consumer Information Fare.org.au
Al-hamdani, M. (2014). The case for stringent alcohol warning labels: lessons from the tobacco control experience. Journal of public health policy, 35(1), 65-74
Al-Hamdani, M., & Smith, S. M. (2016). Alcohol warning label perceptions: do warning sizes and plain packaging matter? Journal of Studies on Alcohol and Drugs, 78(1), 79-87
Anderson AR (2002). Marketing social marketing in the social change marketplace. Journal of Public Policy and Marketing, 12(1)
Anderson, P (2012). The impact of alcohol on health. In P Anderson, L Møller & G Galea (eds) Alcohol in the European Union. Copenhagen, Denmark: World Health Organization
Anderson, P., & Rehm, J. (2016). Evaluating alcohol industry action to reduce the harmful use of alcohol. Alcohol and Alcoholism, 51(4), 383-387.
Annunziata, A., Pomarici, E., Vecchio, R., & Mariani, A. (2016). Do Consumers Want More Nutritional and Health Information on Wine Labels? Insights from the EU and USA. Nutrients, 8(7), 416
Australian Health Ministers’ Advisory Council 2012, Clinical Practice Guidelines: Antenatal Care – Module 1. Canberra: Australian Government Department of Health and Ageing
Australian Institute of Health and Welfare (2014). National Drug Strategy Household Survey Detailed Report 2013. Australian Institute of Health and Welfare
Avery, M. R., Droste, N., Giorgi, C., Ferguson, A., Martino, F., Coomber, K., & Miller, P. (2016). Mechanisms of influence: Alcohol industry submissions to the inquiry into fetal alcohol spectrum disorders. Drug and alcohol review.
Bower, C., Elliott, E.J. (2016) on behalf of the Steering Group. Report to the Australian Government Department of Health: “Australian Guide to the diagnosis of Fetal Alcohol Spectrum Disorder (FASD)”. Australian Guide to the Diagnosis of FASD
Breen C, Burns L (2012) Improving services to families affected by FASD. Canberra: FARE Bridge P (2011). Ord valley Aboriginal Health Service’s fetal alcohol spectrum disorders program: Big
steps, solid outcome. Australian Indigenous HealthBulletin 11(4) Burns, L., Breen, C., Bower, C., O'Leary, C., & Elliott, E. J. (2013). Counting fetal alcohol spectrum disorder
in Australia: the evidence and the challenges. Drug and alcohol review, 32(5), 461-467 Burton, A. (2015). Message on a bottle. The Lancet Neurology, 14(4), 354-355. Callinan S, Room R (2012). Alcohol consumption during pregnancy: results from the 2010 National Drug
Strategy Household Survey. Canberra: Foundation for Alcohol Education and Research (FARE), p21 Cook, J. L., Green, C. R., Lilley, C. M., Anderson, S. M., Baldwin, M. E., Chudley, A. E., ... & Mallon, B. F.
(2016). Fetal alcohol spectrum disorder: a guideline for diagnosis across the lifespan. Canadian Medical Association Journal, 188(3), 191-197
Coomber, K., Martino, F., Barbour, I. R., Mayshak, R., & Miller, P. G. (2015). Do consumers ‘Get the facts’? A survey of alcohol warning label recognition in Australia. BMC public health, 15(1), 1
Coomber, K., Mayshak, R., Curtis, A., & Miller, P. G. (2017). Awareness and correlates of short-term and long-term consequences of alcohol use among Australian drinkers. Australian and New Zealand journal of public health
Danish National Board of Health (2010). Healthy Habits – before during and after pregnancy. 1st English edition (translated from the 2nd Danish edition). The Danish National Board of Health and The Danish Committee for Health Education
del Campo, M., & Jones, K. L. (2017). A review of the physical features of the fetal alcohol spectrum disorders. European journal of medical genetics, 60(1), 55-64
Alcohol industry voluntary labelling - literature 133
Deshpande S, Rundle-Thiele SR (2012). Segmenting and Targeting American University Students to Promote Responsible Alcohol Use: A Case for Applying Social Marketing Principles. Health Marketing Quarterly, 28(4): 287-303
Doran, C., Vos, T., Cobiac, L., Hall, W., Asamoah, I., Wallace, A., ... & Arnett, K. (2008). Identifying cost-effective interventions to reduce the burden of harm associated with alcohol misuse in Australia. Fare.org.au
Drinkwise Australia (2010). Get the Facts: labeling on alcohol products and packaging Drinkwise.org.au Eguiagaray, I., Scholz, B., & Giorgi, C. (2016). Sympathy, shame, and few solutions: News media portrayals
of fetal alcohol spectrum disorders. Midwifery, 40, 49-54 Elliott, E. J. (2014). Australia plays ‘catch-up’with Fetal Alcohol Spectrum Disorders. The International
Elliott, E. J. (2015). Fetal alcohol spectrum disorders in Australia--the future is prevention. Public Health Res Pract, 25(2), e2521516Journal of Alcohol and Drug Research, 3(1), 121-125
Farke W (2011). Consumer labelling of alcohol beverages – a review of practices in Europe. Paper presented at the European Alcohol and Health Forum. Brussels
Fitzpatrick, J. P., Latimer, J., Carter, M., Oscar, J., Ferreira, M. L., Carmichael Olson, H., ... & Hawkes, G. (2015). Prevalence of fetal alcohol syndrome in a population-based sample of children living in remote Australia: The Lililwan Project. Journal of paediatrics and child health, 51(4), 450-457.
Foundation for Alcohol Research and Education (2011) Alcohol warning labels: attitudes and perceptions. Canberra: Foundation for Alcohol Research and Education (FARE)
Foundation for Alcohol Research and Education FARE (2013) Australian Fetal Alcohol Spectrum Disorders Action Plan 2013-2016. Fare.org.au
Foundation for Alcohol Research and Education (2014). Annual Alcohol Poll: Attitudes and behaviours. Canberra: FARE
Foundation for Alcohol Research and Education FARE (2013) Australian Fetal Alcohol Spectrum Disorders Action Plan 2013-2016. Fare.org.au
Global Alcohol Producers Group (GAPG) (2012). Reducing Harmful Use of Alcohol: Beer Wine and Spirits Producers Commitments. Beer Wine Spirits Producers' Commitments
Glock, S., & Krolak-Schwerdt, S. (2013). Changing outcome expectancies, drinking intentions, and implicit attitudes toward alcohol: a comparison of positive expectancy-related and health-related alcohol warning labels. Applied Psychology: Health and Well-Being, 5(3), 332-347
Grier S, Bryant C (2005). Social marketing in public health. Annual Review of Public Health. 26(1). 319. Lefebvre & Flora (1988). Social Marketing and Public Health Intervention. Health Education and Behaviour. 15. 299
Grier S, Bryant C (2005). Social marketing in public health. Annual Review of Public Health. 26(1). p319-339.
Guillemont, J., & Léon, C. (2008). Alcool et grossesse: connaissances du grand public en 2007 et évolutions en trois ans. Inpes, Évolutions, 15, 1-6.
Gupta, K. K., Gupta, V. K., & Shirasaka, T. (2016). An Update on Fetal Alcohol Syndrome—Pathogenesis, Risks, and Treatment. Alcoholism: Clinical and Experimental Research, 40(8), 1594-1602
Hutchinson, D., Moore, E. A., Breen, C., Burns, L., & Mattick, R. P. (2013). Alcohol use in pregnancy: Prevalence and predictors in the Longitudinal Study of Australian Children. Drug and alcohol review, 32(5), 475-482
International Centre for Alcohol Policies (2013). Health Warning Labels. ICAP Policy Tools Series – Issues Briefings. Washington DC: ICAP
International Centre for Alcohol Policies (ICAP) ((2013). Health Warning Labels. ICAP Policy Tools Series – Issues Briefings. Washington ICAP (2013).
International Centre for Alcohol Policies (ICAP) (2011). International Drinking Guidelines. Online text at International Centre for Alcohol Policies
Alcohol industry voluntary labelling - literature 134
IPSOS Social Research Institute (2012). Alcohol Education and Research Foundation policy position paper. Alcohol product labelling: Health warning labels and consumer information.
IPSOS Social Research Institute (2012). Alcohol label audit. Report prepared for the Foundation for Alcohol Research and Education (FARE).
Jones S, Gordon R (2013). Alcohol warning labels: are they effective? Deeble Institute Evidence Brief, Australian Healthcare and Hospitals Association, no: 6
Kersbergen, I., & Field, M. (2017). Alcohol consumers’ attention to warning labels and brand information on alcohol packaging: Findings from cross-sectional and experimental studies. BMC public health, 17(1), 123
Knai, C., Petticrew, M., Durand, M. A., Eastmure, E., & Mays, N. (2015). Are the Public Health Responsibility Deal alcohol pledges likely to improve public health? An evidence synthesis. Addiction, 110(8), 1232-1246
Kodituwakku, P., & Kodituwakku, E. L. (2013). Fetal alcohol syndrome. In Neuroscience in the 21st Century (pp. 2411-2430). Springer New York.
Laughery KR, Young SL., Vaubel KP, Brelsford J.W., Rowe A.L. (1993). Explicitness of consequence information in warnings. Safety Science 16: 5-6
lRoozen, S., Peters, G. J. Y., Kok, G., Townend, D., Nijhuis, J., & Curfs, L. (2016). Worldwide Prevalence of Fetal Alcohol Spectrum Disorders: A Systematic Literature Review Including Meta-Analysis. Alcoholism: Clinical and Experimental Research, 40(1), 18-32
Martineau, F., Tyner, E., Lorenc, T., Petticrew, M., & Lock, K. (2013). Population-level interventions to reduce alcohol-related harm: an overview of systematic reviews. Preventive medicine, 57(4), 278-296
Martin-Moreno, J. M., Harris, M. E., Breda, J., Møller, L., Alfonso-Sanchez, J. L., & Gorgojo, L. (2013). Enhanced labelling on alcoholic drinks: reviewing the evidence to guide alcohol policy. The European Journal of Public Health, 23(6), 1082-1087
May, P. A., Blankenship, J., Marais, A. S., Gossage, J. P., Kalberg, W. O., Joubert, B., ... & Robinson, L. K. (2013). Maternal alcohol consumption producing fetal alcohol spectrum disorders (FASD): quantity, frequency, and timing of drinking. Drug and alcohol dependence, 133(2), 502-512
McGuire WJ (1969). The Nature of Attitudes and Attitude Change. In G Lindsay G & E Aronson (eds), Handbook of Social Psychology, Addison-Wesley: Boston
McGuire WJ (1974). Communication-persuasion models for drug education. In M Goodstadt (ed), Research on Methods and Programs for Drug Education, Addiction Research Foundation: Toronto.
McGuire WJ (1985). Attitudes and attitude change. In G Lindsay G & E Aronson (eds), Handbook of Social Psychology, 2. p 283.
Miller M-E, Ware J (1989). Mass-media alcohol and drug campaigns: A consideration of relevant issues. National Campaign Against Drug Abuse. MS-9. Canberra. Australian Government
Miller, E. R., Ramsey, I. J., Baratiny, G. Y., & Olver, I. N. (2016). Message on a bottle: are alcohol warning labels about cancer appropriate? BMC public health, 16(1), 1
Mohammadzadeh, A., & Farhat, A. (2014). Fetal Alcohol Syndrome. Asia Pacific Journal of Medical Toxicology, 3, 10-10
Muhlack, E., Eliott, J., Carter, D., & Braunack-Mayer, A. (2016, August). Ethical justifications in alcohol-related health warning discourses. In Cancer Forum (Vol. 40, No. 2, p. 97). The Cancer Council Australia.
National Health and Medical and Medical Research Council (2009). Australian guidelines to reduce health risks from drinking alcohol. Canberra: Commonwealth of Australia.
National Indigenous Drug and Alcohol Committee (2012). Addressing fetal alcohol spectrum disorder in Australia. Canberra: Australian National Council on Drugs (ANCD)
National Institute for Health and Clinical Experience (NICE) (2008). Antenatal Care: Routine Care for the Healthy Pregnant Woman. London: National Institute for Health and Clinical Experience (NICE)
Alcohol industry voluntary labelling - literature 135
National Organisation for Fetal Alcohol Spectrum Disorders Australia (2017). Alcohol Product Labelling. Nofasd.org.au
New Zealand Ministry of Health (2006). Food and Nutrition Guidelines for Healthy Pregnant and Breastfeeding Women: A background paper. Wellington: New Zealand Ministry of Health
O'Brien, P. (2014). The contest over'valuable label real estate': Public health reforms to the laws on alcohol beverage labelling in Australia. University of New South Wales Law Journal, 37(2)
Peadon, E., Payne, J., Henley, N., D'antoine, H., Bartu, A., O'Leary, C., & Elliott, E. J. (2010). Women's knowledge and attitudes regarding alcohol consumption in pregnancy: a national survey. BMC Public Health, 10(1), 510.
Petticrew, M., Douglas, N., Knai, C., Durand, M. A., Eastmure, E., & Mays, N. (2016). Health information on alcoholic beverage containers: has the alcohol industry's pledge in England to improve labelling been met? Addiction, 111(1), 51-55.
Petticrew, M., Shemilt, I., Lorenc, T., Marteau, T. M., Melendez-Torres, G. J., O'Mara-Eves, A., ... & Thomas, J. (2016). Alcohol advertising and public health: systems perspectives versus narrow perspectives. Journal of epidemiology and community health, jech-2016
Public Health Agency of Canada (2011). The Sensible Guide to a Healthy Pregnancy. Ottawa: PHAC. Public Health Agency of Canada
Rangmar, J., Hjern, A., Vinnerljung, B., Strömland, K., Aronson, M., & Fahlke, C. (2015). Psychosocial outcomes of fetal alcohol syndrome in adulthood. Pediatrics, 135(1), e52-e58
Rich, S. D., & Riley, L. J. (2016). Neurodevelopmental Disorder Associated with Prenatal Alcohol Exposure: Consumer Protection and the Industry’s Duty to Warn. In Fetal Alcohol Spectrum Disorders in Adults: Ethical and Legal Perspectives (pp. 39-47). Springer International Publishing
Robertson, K., Thyne, M., & Hibbert, S. (2016). Drinkers ‘perceived negative alcohol-related expectancies: Informing alcohol warning messages. Drugs: Education, Prevention and Policy, 1-9
Scholes-Balog, K. E., Heerde, J. A., & Hemphill, S. A. (2012). Alcohol warning labels: Unlikely to affect alcohol-related beliefs and behaviours in adolescents. Australian and New Zealand journal of public health, 36(6), 524-529
Stafford, L. D., Wigg, S., & Salmon, J. (2016). How do influence agents successfully promote health behaviours? Abstracts/Appetite, 107(677e694), 692
State of Israel, Ministry of health. Regulations to Limit the Advertisement and Marketing of Alcoholic Beverages (Warning Label), 2013
Stockwell T (2006). A review of research into the impacts of alcohol warning labels on attitudes and behaviour. British Columbia, Canada: University of Victoria, Centre for Addictions Research of BC
Thomas, G., Gonneau, G., Poole, N., & Cook, J. (2014). The effectiveness of alcohol warning labels in the prevention of Fetal Alcohol Spectrum Disorder: A brief review. The International Journal of Alcohol and Drug Research, 3(1), 91-103
Thompson LM, Vandenberg B, Fitzgerald JM (2012). An exploratory study of drinkers’ views of health information and warning labels on alcohol containers. Drug and Alcohol Review, 31: 240-247 Australian Institute of Health and Welfare (2016) Australian Institute of Health and Welfare
U.S. Surgeon General (2005). U.S. Surgeon General Releases Advisory on Alcohol Use in Pregnancy [press release]. United States Department of Health and Human Services. Online text at: U.S. Surgeon General Releases.
Wigg, S., & Stafford, L. D. (2016). Health warnings on alcoholic beverages: perceptions of the health risks and intentions towards alcohol consumption. PloS one, 11(4), e0153027
Wilkinson C, Allsop S, Cail D, Chikritzhs T, Daube M, Kirby G, Mattick R (2009). Report 1 Alcohol Warning Labels: Evidence of effectiveness on risky alcohol consumption and short term outcomes. Prepared for Food Standards Australia New Zealand.
Wilkinson, C., Allsop, S., Cail, D., Chikritzhs, T., Daube, M., Kirby, G., & Mattick, R. (2009). Alcohol warning labels: Evidence of impact on alcohol consumption amongst women of childbearing age. Food Standards Australia New Zealand, Canberra.
Alcohol industry voluntary labelling - literature 136
Wilson M, Stearne, Gray D, Saggers S (2010). The Harmful Use of Alcohol amongst indigenous Australians. Online publication at: Australian Indigenous Alcohol and Other Drugs Knowledge Centre Food Labelling Law and Policy Review Panel (2011). Labelling Logic. Food Labelling Review
1World Health Organisation (2010). Global strategy to reduce the harmful use of alcohol. Geneva: World Health Organisation (WHO)
World Health Organisation (2012). Addressing the harmful use of alcohol: a guide to developing effective alcohol legislation. Geneva: World Health Organisation (WHO)
Alcohol industry voluntary labelling - literature 137