Embed Size (px)
Citation preview
SECOND NATIONAL COMMUNICATION OF TUVALU
TO THE UNITED NATIONS FRAMEWORK CONVENTION ON CLIMATE CHANGE
Government of Tuvalu December 2015
i
Acknowledgements
The Government of Tuvalu gratefully acknowledges the financial support given by the Global
Environment Facility (GEF) through its implementing agency, the United Nations Development
Programme (UNDP) Fiji Multi-Country Office (MCO) for supporting this Second National
Communication (SNC).
The Government would also like to thank the National Communication Support Programme
(NCSP) and the Global Support Program (GSP) for the technical assistance given towards the
preparation and production of this communication, including the section on the Green House
Gas Inventory.
We also acknowledge the inputs made from the various government departments and non-
government agencies towards the production of this document and not forgetting the
important role played by participants from all the island communities including island councils
(Kaupule) and traditional Chiefs and Elders (Falekaupule) during the consultation visits and
workshops.
Our gratitude also extends to the Director of Environment, Mr Mataio Tekinene and the Acting
Director, Ms Pepetua Latasi, the Climate Change Coordinator of the Tuvalu SNC project, and
Mr Melton Tauetia and Assistant Coordinator Mr Salemona Tefana on the coordination of the
project. Dr. Carlos Lopez, Consultant in National GHG Inventories, and member of the NCSP's
roster of experts, who assumed the preparation of this second GHG inventory with support of
the project staff and specialists from the NCSP, especially for the collection of data and other
necessary information. This consultancy also resolved the problems occurred with the
inventory software.
The contribution of the Climate Change Policy and Disaster Coordination Unit under the Office
of the Prime Minister for editing and finalizing the SNC is also acknowledged.
Last but not least, our appreciation to SNC committee members, for the collaborative effort in
steering the project from the beginning to the end of the SNC journey. Your guidance and
dedication is gratefully acknowledged.
ii
iii
Acronyms
ADB Asian Development Bank
APEC Asia Pacific Economic Cooperation
BAP Biodiversity Action Plan
BAU Business-as-Usual
BD Biological Diversity
Cap Capita
C02 Carbon dioxide
CH4 Methane
CO Carbon Monoxide
CO2 Carbon Dioxide
COP Conference of Parties
ᵒC Degree Celsius
CSIRO Commonwealth Scientific and Industrial Research Organisation
DoA Department of Agriculture
DOC Degradable Organic Carbon
EEA European Environment Agency
EEZ Exclusive Economic Zone
EIA Environment Impact Assessment
ENSO El Niño Southern Oscillation
EU European Union
FAO Food and Agriculture Organization
FTF Falekaupule Trust Fund
FSPI Foundation of the Peoples of the South Pacific International
GCCA Global Climate Change Alliance
GCM General Circulation Model
GDP Gross Domestic Product
GEF Global Environment Facility
GEIC Gilbert and Ellice Islands Colony
Gg Gigagram
GHG Greenhouse Gas
GIZ German Development Agency
GSP Global Support Programme
GWP Global Warming Potential
HCFC Hydrochlorofluorocarbons
HFCs Hydrofluorocarbons
IFRC International Federation of Red Cross and Red Crescent Societies
ILO International Labour Organization
INC Initial National Communication
IPCC Intergovernmental Panel on Climate
Change
IUNC International Union for the Conservation of Nature
IWRM Integrated Water Resource Management
JICA Japan International Cooperation Agency
Kg Kilogram
Km Kilometres
KWp Kilowatt peak
LDC Least Developed Country
LED Light Emitting Diodes
LUCF Land Use Change and Forestry
LULUCF Land Use Land Use Change and Forestry
Management
mt Million Tonnes
MWh Megawatt hours
NO2 Nitrogen Oxide
N2O Nitrous Oxide
NACCC National Advisory Council on Climate Change
NAP National Adaptation Program of Action
NCSP National Communication Support Programme
NGO Non-Governmental Organization
NIA National Inventory Arrangements
NMVOC Non-Methane Volatile Organic Compound
NOAA National Oceanic and Atmospheric Administration
NOx Nitrogen Oxides
OECD Organization for Economic Cooperation and Development
iv
PAC Pacific Access Category
PACC Pacific Adaptation to Climate Change
PDFs Probability Distribution Functions
PFCs Perfluorocarbons
PV Photo Voltaic
R&D Research and Development
REP Renewable Energy Policy
SA Sectoral Approach
SF6 Sulphur Hexafluoride
SNC Second National Communication
SPC Secretariat of the Pacific Community
SOPAC South Pacific Applied Geoscience Commission
SPREP South Pacific Regional Environmental Programme
SO2 Sulphur Dioxide SWAT Solid Waste Agency of Tuvalu t tonne TEC Tuvalu Electric Corporation TTF Tuvalu Trust Fund UNCBD United Nations Convention on
Biological Diversity UNDP United Nations Development Programme UNEP United Nations Environment
Programme UNESCAP United Nations Economic and Social
Commission for Asia and the Pacific
UNFCCC United Nations Framework
Convention on Climate Change
USAID United States Agency for International Development
USP University of the South Pacific
WB World Bank
WHO World Health Organization
WWF World Wildlife Fund
VDS Vessel Day Scheme
v
TABLE OF CONTENTS
EXECUTIVE SUMMARY........................................................ viii CHAPTER 1. NATIONAL CIRCUMSTANCES ............................... 1
1.1 Geographic Setting .................................................... 1
1.2 History ...................................................................... 2
1.3 Climate ...................................................................... 3
1.3.1 Temperature ........................................................... 4
1.3.2 Rainfall ................................................................... 4
1.3.3 Tropical Cyclones .................................................... 5
1.3.4 Sea Level Rise ......................................................... 6
1.4 Population ................................................................. 6
1.5 Economy ................................................................... 8
1.6 Land Ownership and Tenure ................................... 10
1.7 Agriculture .............................................................. 10
1.8 Fisheries .................................................................. 11
1.9 Biodiversity ............................................................. 13
1.10 Energy ................................................................... 13
CHAPTER 2. NATIONAL GREENHOUSE GAS INVENTORY ........ 16 2.1 Methodology ........................................................... 16
2.1.1 Key Category Analysis ........................................... 16
2.1.2 Data Collection ..................................................... 17
2.1.3 Uncertainty........................................................... 17
2.1.4 Data Reporting and Interpretation ........................ 18
2.2 Institutional Arrangements ...................................... 18
2.3 Tuvalu GHG Emissions 2014 ..................................... 18
2.3.1 Energy .................................................................. 20
2.3.2 Transport .............................................................. 24
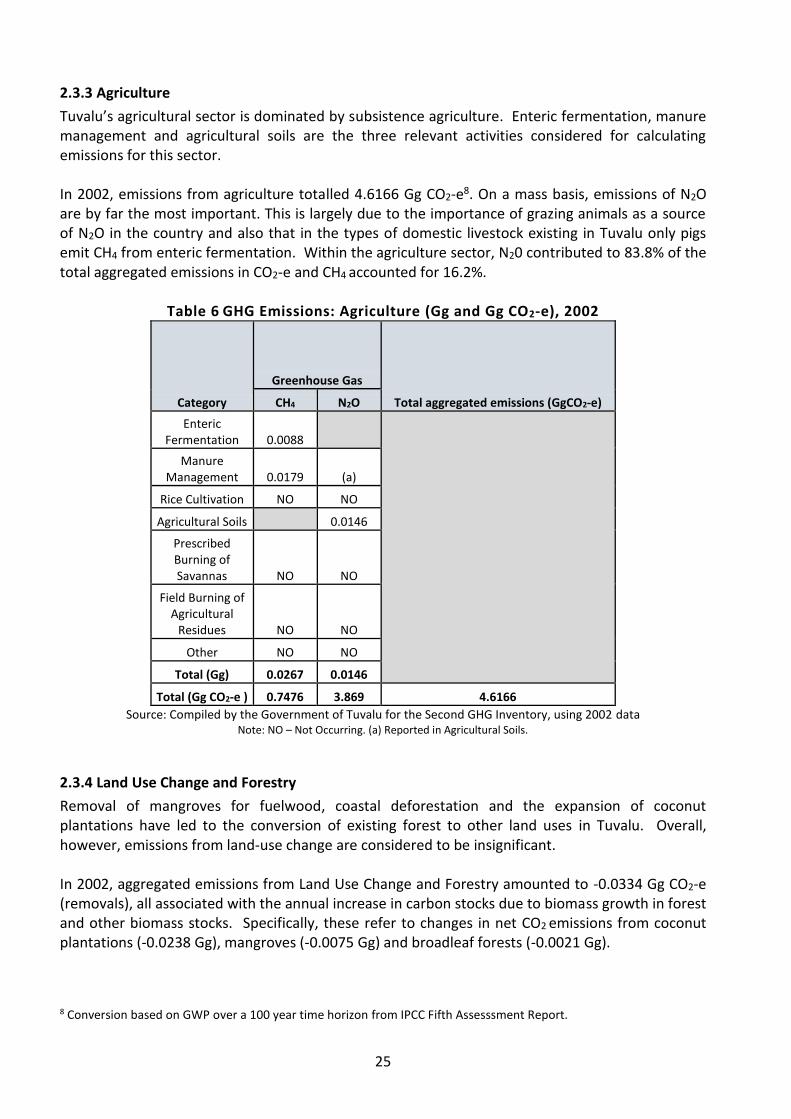
2.3.3 Agriculture ............................................................ 25
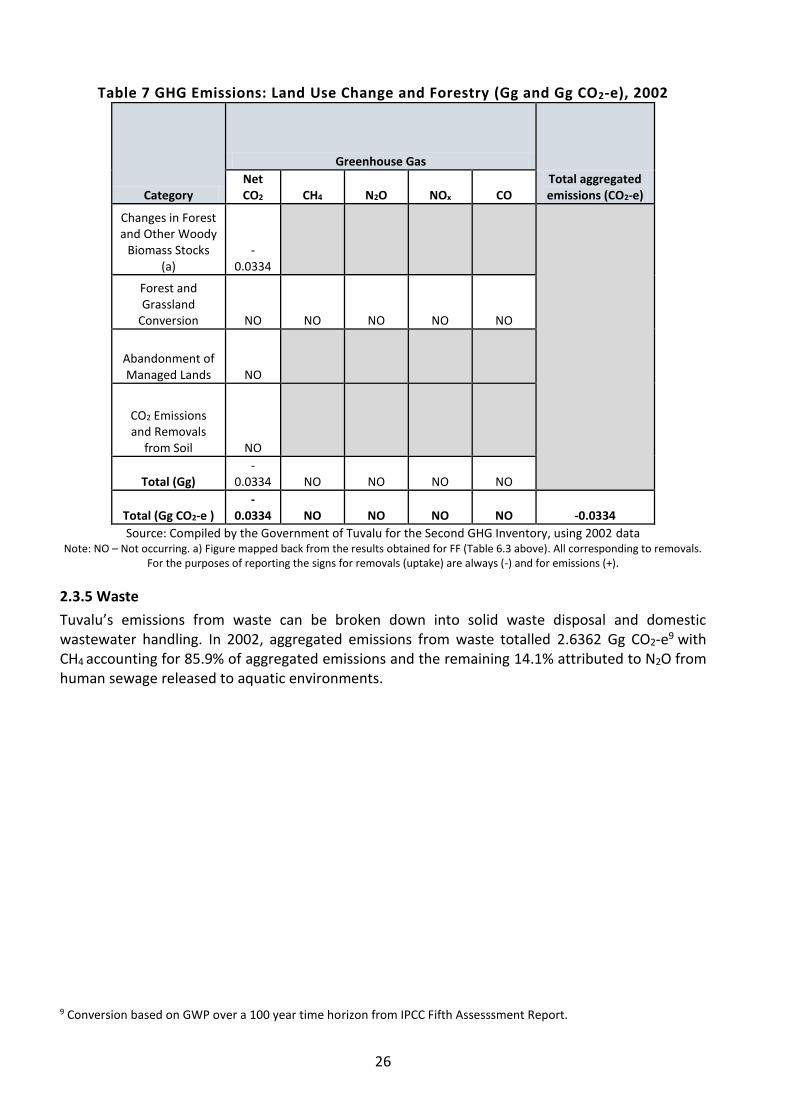
2.3.4 Land Use Change and Forestry .............................. 25
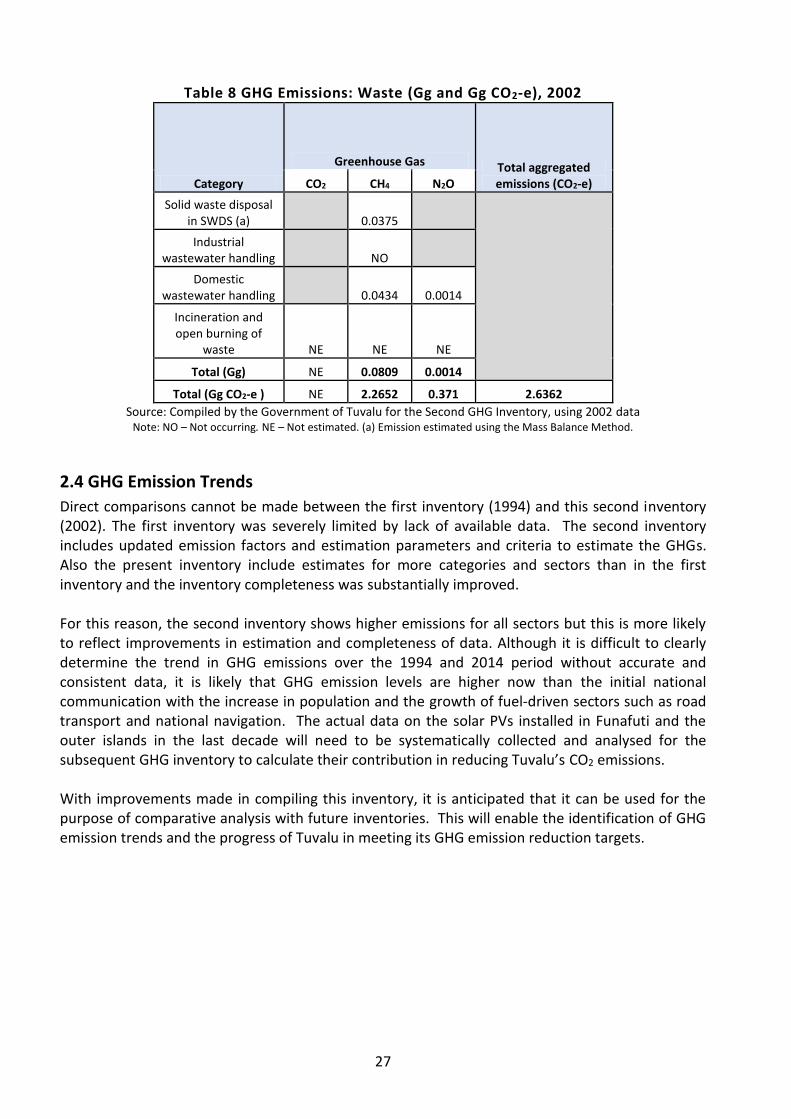
2.3.5 Waste ................................................................... 26
2.4 GHG Emission Trends ............................................... 27
CHAPTER 3. VULNERABILITY AND ADAPTATION ASSESSMENT28 3.1 Coastal Protection ................................................... 28
3.2 Water Resources ..................................................... 31
3.3 Coral Reefs and Fisheries ......................................... 33
vi
3.4 Food Security ........................................................... 34
3.5 Human Health ......................................................... 35
3.6 Waste Management ................................................ 35
CHAPTER 4. MITIGATION ANALYSIS ..................................... 38 4.1 Institutional Arrangements ...................................... 38
4.2 Energy Policy ........................................................... 38
4.3 Renewable Energy ................................................... 39
4.4 Mitigation Measures for Consideration .................... 40
CHAPTER 5. OTHER INFORMATION ...................................... 42 5.1 Technology Transfer ................................................ 42
5.2 Climate Change Research ......................................... 43
5.3 Education, Training and Public Awareness ............... 44
5.4 Capacity Building ..................................................... 44
5.5 Data Availability and Gaps ....................................... 45
BIBLIOGRAPHY .................................................................... 47 APPENDIX A. GHG INVENTORY 2014 .................................... 52 APPENDIX B. LIST OF CLIMATE CHANGE PROJECTS ............... 55
vii
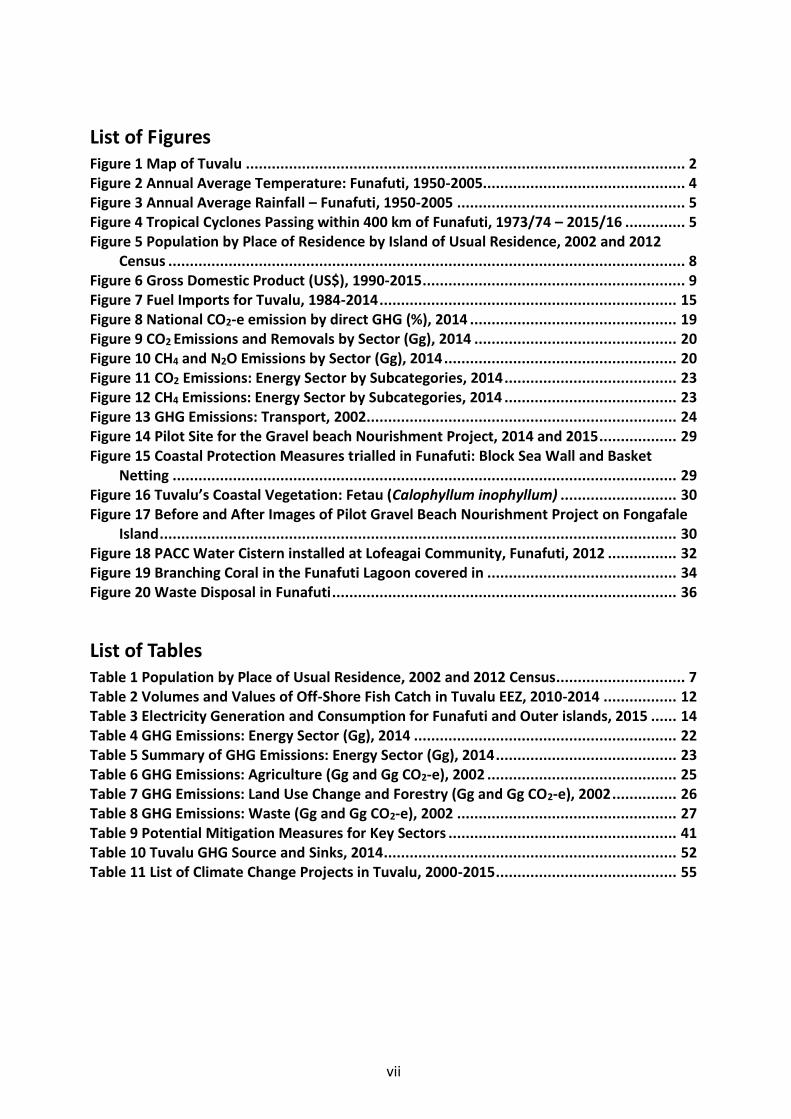
List of Figures Figure 1 Map of Tuvalu ...................................................................................................... 2 Figure 2 Annual Average Temperature: Funafuti, 1950-2005............................................... 4 Figure 3 Annual Average Rainfall – Funafuti, 1950-2005 ..................................................... 5 Figure 4 Tropical Cyclones Passing within 400 km of Funafuti, 1973/74 – 2015/16 .............. 5 Figure 5 Population by Place of Residence by Island of Usual Residence, 2002 and 2012
Census ........................................................................................................................ 8 Figure 6 Gross Domestic Product (US$), 1990-2015 ............................................................. 9 Figure 7 Fuel Imports for Tuvalu, 1984-2014 ..................................................................... 15 Figure 8 National CO2-e emission by direct GHG (%), 2014 ................................................ 19 Figure 9 CO2 Emissions and Removals by Sector (Gg), 2014 ............................................... 20 Figure 10 CH4 and N2O Emissions by Sector (Gg), 2014 ...................................................... 20 Figure 11 CO2 Emissions: Energy Sector by Subcategories, 2014 ........................................ 23 Figure 12 CH4 Emissions: Energy Sector by Subcategories, 2014 ........................................ 23 Figure 13 GHG Emissions: Transport, 2002 ........................................................................ 24 Figure 14 Pilot Site for the Gravel beach Nourishment Project, 2014 and 2015 .................. 29 Figure 15 Coastal Protection Measures trialled in Funafuti: Block Sea Wall and Basket
Netting ..................................................................................................................... 29 Figure 16 Tuvalu’s Coastal Vegetation: Fetau (Calophyllum inophyllum) ........................... 30 Figure 17 Before and After Images of Pilot Gravel Beach Nourishment Project on Fongafale
Island ........................................................................................................................ 30 Figure 18 PACC Water Cistern installed at Lofeagai Community, Funafuti, 2012 ................ 32 Figure 19 Branching Coral in the Funafuti Lagoon covered in ............................................ 34 Figure 20 Waste Disposal in Funafuti ................................................................................ 36
List of Tables Table 1 Population by Place of Usual Residence, 2002 and 2012 Census .............................. 7 Table 2 Volumes and Values of Off-Shore Fish Catch in Tuvalu EEZ, 2010-2014 ................. 12 Table 3 Electricity Generation and Consumption for Funafuti and Outer islands, 2015 ...... 14 Table 4 GHG Emissions: Energy Sector (Gg), 2014 ............................................................. 22 Table 5 Summary of GHG Emissions: Energy Sector (Gg), 2014 .......................................... 23 Table 6 GHG Emissions: Agriculture (Gg and Gg CO2-e), 2002 ............................................ 25 Table 7 GHG Emissions: Land Use Change and Forestry (Gg and Gg CO2-e), 2002 ............... 26 Table 8 GHG Emissions: Waste (Gg and Gg CO2-e), 2002 ................................................... 27 Table 9 Potential Mitigation Measures for Key Sectors ..................................................... 41 Table 10 Tuvalu GHG Source and Sinks, 2014 .................................................................... 52 Table 11 List of Climate Change Projects in Tuvalu, 2000-2015 .......................................... 55
viii
EXECUTIVE SUMMARY
This Second National Communication (SNC) provides information on the progress made by Tuvalu in implementing the United Nations Framework Convention on Climate Change (UNFCCC) and includes the national inventory of anthropogenic emissions by sources and removals by sinks of all greenhouse gases (GHG) not controlled by the Montreal Protocol. In contrast with the initial national communication submitted in 1999, the SNC has achieved considerable progress in documenting Tuvalu’s vulnerability assessment, adaptation measures and sectoral analyses of GHG emissions. The SNC consists of five main chapters:
1. National Circumstances 2. GHG Inventory 3. Vulnerability and Adaptation
Assessment 4. Mitigation Analysis 5. Other Information including
technology transfer, public awareness, capacity building, and data availability and gaps.
National Circumstances
The nine islands of Tuvalu are situated in the South Pacific Ocean with a combined land area of 26 km2. It has a total population of 10,782 persons with just over half of the population residing in the country’s capital of Funafuti. The average height above sea level is less than 3 m with the maximum height above sea level being 4.6 m. The islands were separated from the former Gilbert and Ellice Islands Protectorate in 1974 and gained independence from Britain in 1975. Tuvalu
is a democratic country with a Westminster system of government consisting of 15 elected members. At the island-level, a contemporary form of traditional governance is exercised through the Falekaupule and Kaupule. Tuvalu has a tropical climate and it is characterized by two distinct seasons, a wet season from November to April and a dry season from May to October. This seasonal cycle is strongly influenced by the South Pacific Convergence. The mean annual rainfall in the southern islands of Tuvalu is 3,400 mm while in the north is it 2,900 mm. Temperature ranges from 25°C to 30°C all year around. The tropical cyclone season is from November to April. Tuvalu is particularly vulnerable to cyclone-generated winds, storm surges and swells, as well as spring tides. Since 1993, Tuvalu’s sea level has been rising by approximately 5 mm per year. Tuvalu’s gross domestic product (GDP) was US$32.7 million in 2013. The dispersed nature of the islands, isolation from key international and regional markets, tiny land mass and small population, and narrow natural resource base make Tuvalu dependent on foreign aid. Fisheries is the major source of the national economy. Subsistence agriculture and fisheries are predominant activities. Traditional farming and fishing practices are still used. The outer island population is engaged in subsistence activities more so than in Funafuti. The land tenure system in Tuvalu is customary, passed down through patrilineal and matrilineal lines. Tuvalu has diverse terrestrial and marine species. Of the 356 species of terrestrial vascular plants, 18% are possibly indigenous to the islands. Among the 1,453 marine species found in Tuvalu,
ix
green turtles, humphead wrasses and whale sharks are on the list of endangered species. Electricity generation through diesel-based generators is the main source of energy in Tuvalu. In Funafuti and some inhabited islets of the Funafuti atoll, continue to have no power or are served by solar home systems (Funafala Islet) or stand-alone diesel power (Amatuku Islet). In 2001, diesel electrification was completed for the outer islands and by 2015 solar PVs had been installed. National GHG Inventory
The GHG Inventory of Tuvalu was prepared for the year 2014 using the Tier 1 approach from 1996 IPCC Guidelines. For electricity generation, 2014 data was used whereas all other sectors were limited to 2002 data. The key categories for the second GHG inventory includes: Energy (including Transport); Agriculture; Land Use Change and Forestry; and Waste. The main GHG emissions reported in the inventory are CO2, CH4 and N2O. The total emission in 2014 is 18.467 Gg CO2-e, of which 11.214 Gg CO2-e is attributed to the Energy sector. CO2 accounts for 60.4% of the total GHG emissions for Tuvalu, followed by N2O which comprises 23.1% and CH4 contributes around 16.4%. Climate Change Vulnerability and Adaptation
Tuvalu has placed considerable emphasis on addressing climate change vulnerabilities and implementing measures that enhance adaptive capacities in coastal protection, water resources, biodiversity, agriculture, energy, waste management and human health.
Coastal Protection
There are 82 km of inhabited coastline in
Tuvalu which has undergone rapid changes
due to a combination of climate change
and anthropogenic modification.
Extraction of aggregates such as beach
sand and reef coral, and blasting of reef
passages for boat channels, severe
cyclonic winds and storm surges, have
contributed to coastal instability and
beach erosion. Coastal protection
measures appropriate for the atoll island
context are needed to provide long term
solutions in reducing vulnerability of
human settlements and infrastructure.
Water Resources
With climate variability and the effects of climate change, water security will continue to be an issue for Tuvalu. With limited groundwater resources, rainfall is the main source of fresh drinking water. Over the years, groundwater has become brackish as a result of rising sea level and flooding. Adapting to the changing climatic conditions involves a variety of measures that focus on both supply and demand for precious water resources.
Coral Reefs and Fisheries
Coral reefs form the foundation for Tuvalu’s islands. However, human interference, namely urban development, habitat fragmentation, dredging and extraction of coastal aggregates have led to the destruction of coral reef systems. The vulnerability of the coral reefs is further exacerbated by ocean acidification and coral bleaching. There is high level of confidence that ocean acidification will continue in parallel with the rising CO2 concentrations in the atmosphere, reducing the strength of corals and increasing their vulnerability to severe weather events. There is also evidence of coral bleaching in Tuvalu. Even a 1°C
x
increase in average water temperature could result in permanent loss of corals which have negative flow-on impacts on the marine food web.
Food Security
With many Tuvaluans dependent on subsistence agriculture and fisheries, climate change also poses great risks to food security. Coastal flooding and erosion are expected to exacerbate the situation, with traditional crops already being spoiled by saltwater intrusion. Terrestrial and marine ecosystems will also modify in response to changes in climate, which places food security at risk. With climate change likely to make climatic conditions more unpredictable, together with the growth of the cash economy and access to global markets, the Tuvaluan diet will continue to shift from traditional and locally harvested food to one that is based on imported food products. This is a major concern to population health (in particular Non Communicable Diseases) and nutrition over the years to come.
Human Health
An increase in temperature and rainfall, as predicted by various climate change models, is likely to favour conditions for breeding of mosquitoes which could lead to greater numbers of people being exposed to mosquito bites. There is also heightened risk of water-borne diseases associated with increased temperature and rainfall. Women and children are particularly susceptible to vector- and water-borne diseases. More comprehensive research on the health impacts of climate change is needed to identify vulnerable populations and to determine interventions for disease prevention and management.
Waste Management
The volume of waste generated combined with limited land for waste disposal and lack of recycling technology present serious challenges for Tuvalu. The improper management of solid waste has caused the rapid proliferation of sargassum algae, as observed during the post-drought period in 2011. Without intervention, the continued practice of waste management will have adverse impacts on the fragile island ecosystem already under threat by climate change. There is a need for an integrated approach that takes into account the management of waste for all development sectors and addresses the environmental, social and economic costs of poor waste management.
Climate Change Mitigation
Tuvalu’s miniscule share of the global GHG emissions is reflective of Tuvalu’s small population as well as its concerted efforts in achieving the objective of the UNFCCC by moving away from fossil fuels and investing in renewable energy. Tuvalu seeks to achieve 100% renewable energy in electricity generation by 2020. Various mitigation measures in electricity, transport, renewable energy, energy efficiency and waste sectors have been identified. All measures are dependent on international assistance; technological, financial and technical support from development partners is needed for Tuvalu to realize its mitigation targets.
Other Information
Tuvalu has undertaken other efforts at the national level to address the impacts of climate change. Despite this, constraints exist in the areas of technology transfer, climate change research, education,
xi
training and public awareness, capacity building, and data availability and gaps. Technology Transfer For technology transfer, barriers include high upfront capital costs, lack of investment capital and financing instruments, shortage of land (for infrastructure development), absence of scientific research and information relevant to Tuvalu’s context, and the inability to recover costs for the operation of such technologies due to its small population and limited national revenue. Lack of technical know-how in installing, maintaining and repairing technologies is also an important factor to be considered for the technology transfer. Priority areas for technology transfer include electricity generation, coastal engineering and waste management. Climate Change Research Limited donor and national funding dedicated to scientific research, lack of research equipment and facilities, and lack of locally-based qualified research professionals are constraints to climate change research in Tuvalu. Some of the major climate change-related research undertaken in Tuvalu includes climate science programs funded by the governments of Australia and Japan. However, existing and past climate change research are Funafuti-centric, with significant gaps in scientific data (including longitudinal data) that are sector-, island- and site-specific. Education, Training and Public Awareness Enhancing awareness among Tuvaluans about the causes and implications of climate change is a challenge, especially
for the outer islands due to limited transport and media channels. While consultations have been carried out on the outer islands by different projects at different points in time, the information on climate change has not always been consistent and in the absence of correct translation, it is difficult to communicate climate change concepts to communities. For climate change education, steps have been taken to incorporate climate change into the school curriculum however more work is needed on this front. Government departments, donor partners, academia, faith-based organisations and civil society will all play a leading role in educating the wider public about climate change. Capacity Building Between 2000 and 2015, more than 30 climate change projects have been initiated or implemented in Tuvalu. These have included capacity building components. An area requiring further strengthening is technical capacity in climate change science, adaptation and mitigation. Limited pool of qualified and trained professionals in Tuvalu, shortage of staff within government departments and high turnover of staff (mainly due to duty travel or overseas training and education) are some constraints associated with lack of technical capacity within the country. Data Availability and Gaps Preparing this SNC was a challenging process for Tuvalu. Data required for the compilation of SNC was scarce and out-dated. Lack of systematic documentation, information sharing and knowledge management was a common hurdle faced when completing all sections of the SNC and in particular, the GHG Inventory.
1
CHAPTER 1. NATIONAL CIRCUMSTANCES Tuvalu, a Non-Annex I Party to the United Nations Framework Convention on Climate Change (UNFCCC), submitted its first national communication to the UNFCCC Secretariat on 30 October 1999. This Second National Communication (SNC) was prepared with financial assistance provided by the Global Environment Facility (GEF) through the United Nations Development Programme (UNDP) in accordance with the UNFCCC revised guidelines for the preparation of national communication.1 This report is structured into five sections, beginning with background context of the geographic, climatic, economic and social circumstances of Tuvalu (Chapter 1). Chapter 2 presents the GHG Inventory for major sectors based on available data. Tuvalu’s vulnerability to climate change and adaptation measures being piloted, undertaken and proposed are outlined in Chapter 3, which is then followed by Chapter 4 on analysis of mitigation actions. Chapter 5 presents information on technology transfer, education, training and public awareness, capacity building, and data availability and gaps.
1.1 Geographic Setting
The archipelago of Tuvalu lies between latitude of 50 to 110 south and between longitude of 1760 and 1800 east of Greenwich. It is located approximately 1,100 kilometres (km) north of Fiji and 1,400 km south of the Republic of Kiribati. The island archipelago is situated in the South Pacific Ocean consisting of nine islands that stretch 579 km in length. The islands have a combined land area of 26 km2 and are surrounded by 1.3 million km2 of ocean, including an Exclusive Economic Zone of 719,174 km2. The average height above sea level is less than 3 metres (m) with the highest point above sea level being 4.6 m in Niulakita (Government of Tuvalu, 2012). The islands include (from north to south) Nanumea, Niutao, Nanumaga, Nui, Vaitupu, Nukufetau, Funafuti, Nukulaelae and Niulakita. The islands of Nanumea, Nui, Vaitupu, Nukufetau, Funafuti and Nukulaelae are atolls with enclosed lagoons and the remaining three islands of Nanumaga, Niutao and Niulakita are raised limestone coral reef islands on the outer arc of ridges formed by pressure from the Central Pacific against the ancient Australian landmass. Only two of the islands, Funafuti and Nukufetau, have natural harbours for oceangoing ships. There are no rivers on the islands and groundwater is extremely limited.
1 COP 2 in 1996 adopted the Guidelines for the preparation of initial national communications from non-Annex I Parties. The review of the guidelines was initiated at COP 5 in 1999 and the revised guidelines were adopted at COP 8 in 2002.
2
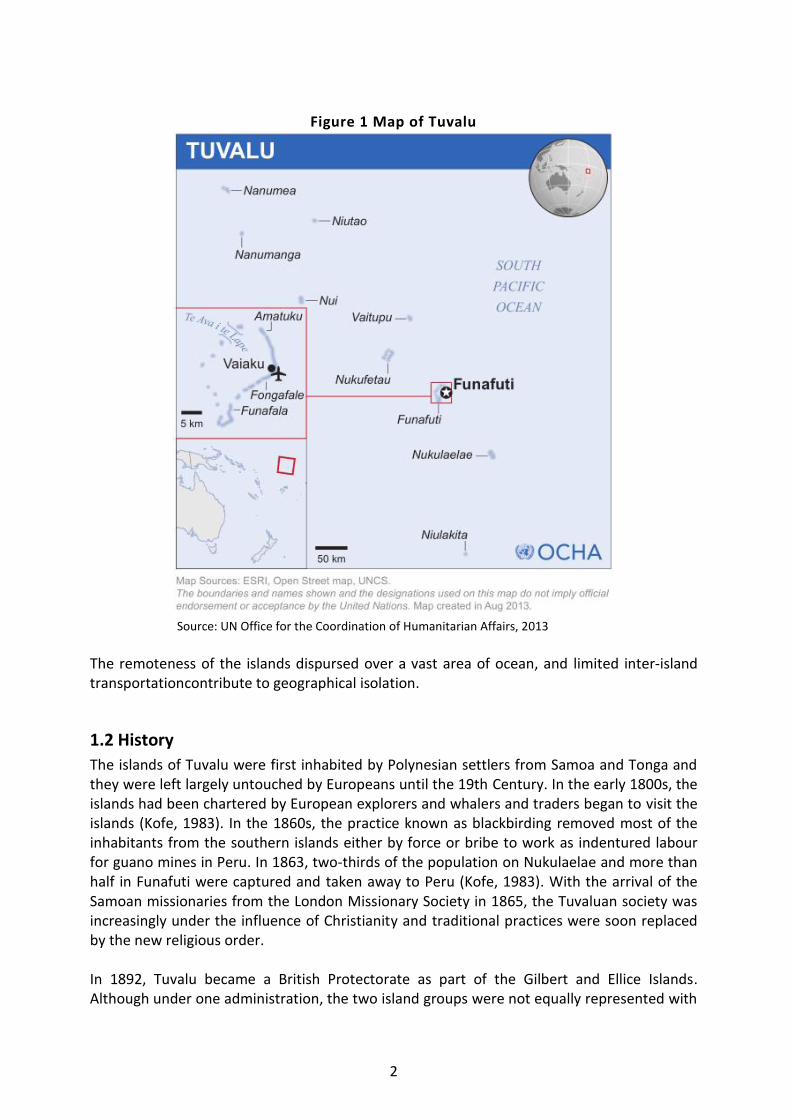
Figure 1 Map of Tuvalu
Source: UN Office for the Coordination of Humanitarian Affairs, 2013
The remoteness of the islands dispursed over a vast area of ocean, and limited inter-island transportationcontribute to geographical isolation.
1.2 History
The islands of Tuvalu were first inhabited by Polynesian settlers from Samoa and Tonga and they were left largely untouched by Europeans until the 19th Century. In the early 1800s, the islands had been chartered by European explorers and whalers and traders began to visit the islands (Kofe, 1983). In the 1860s, the practice known as blackbirding removed most of the inhabitants from the southern islands either by force or bribe to work as indentured labour for guano mines in Peru. In 1863, two-thirds of the population on Nukulaelae and more than half in Funafuti were captured and taken away to Peru (Kofe, 1983). With the arrival of the Samoan missionaries from the London Missionary Society in 1865, the Tuvaluan society was increasingly under the influence of Christianity and traditional practices were soon replaced by the new religious order. In 1892, Tuvalu became a British Protectorate as part of the Gilbert and Ellice Islands. Although under one administration, the two island groups were not equally represented with
3
the Ellice Islands population being outnumbered by the Gilbert Islands. This eventually led to the 1974 referendum, which resulted in the separation of the two island groups. During the Second World War, the islands of Kiribati were claimed by the Japanese. In response, 6,000 American troops were stationed in Tuvalu (Telavi, 1983). The American forces set up base in Funafuti and built airfields on Nukufetau and Nanumea. The population of Fongafale (the islet where Funafuti is situated) was evacuated to Funafala and Papa Elise islets for the period of the war. Funafuti was attacked by numerous air raids in 1943, killing one Tuvaluan and a dozen Americans (Telavi, 1983).
Following the UN administered referendum in 1974, the Ellice Islands were separated from
the Gilbert Islands to form the separate British dependency of Tuvalu on 1 October 1975
(Isala, 1983). The name Tuvalu means "eight islands in unity" and although there are nine
islands comprising the country today, only eight were initially inhabited so the ninth
(Niulakita) is not included in its name. Tuvalu gained political independence from Britain on 1
October 1978. The Independence Constitution adopted a Westminster system of government
with the British monarch as Head of State who appoints a Governor General who must be a
Tuvaluan citizen (Isala, 1983).
The Parliament comprises of 15 elected members serving a four-year term. Each island elects
two members with the exception of Nukulaelae, which is represented by one member due to
its small size and Niulakita is represented by Members for Niutao as it falls under the Niutao
Island administration. The Prime Minister and Speaker of the Parliament are elected by the
Members of Parliament.
On 12 December 1997, the Falekaupule Act was passed by the Parliament to devolve
administrative authority of the islands to the Falekaupule and Kaupule. The Falekaupule is
the product of the fusion of the traditional leadership and the introduced governing system.
It functions as the decision making body on the island. The Kaupule is the executive arm of
the Falekaupule.
1.3 Climate Tuvalu has a tropical climate and it is characterized by two distinct seasons, a wet season from November to April and a dry season from May to October. This seasonal cycle is strongly influenced by the South Pacific Convergence Zone (Australian Bureau of Meteorology and CSIRO, 2011). The mean annual rainfall in the southern islands of Tuvalu is 3,400 mm while in the north is it 2,900 mm. Temperature ranges from 25 degrees Celsius (°C) to 30°C all year around. The tropical cyclone season is from November to April. Tuvalu is particularly vulnerable to cyclone-generated winds, storm surges and swells. In March 2015, Tropical Cyclone Pam devastated the islands of Tuvalu, damaging houses, infrastructure, food gardens, graves and coastlines. Nearly half of the country’s population was temporarily displaced. Several islets in Funafuti also disappeared as a result of the cyclone (Government of Tuvalu, 2015).
4
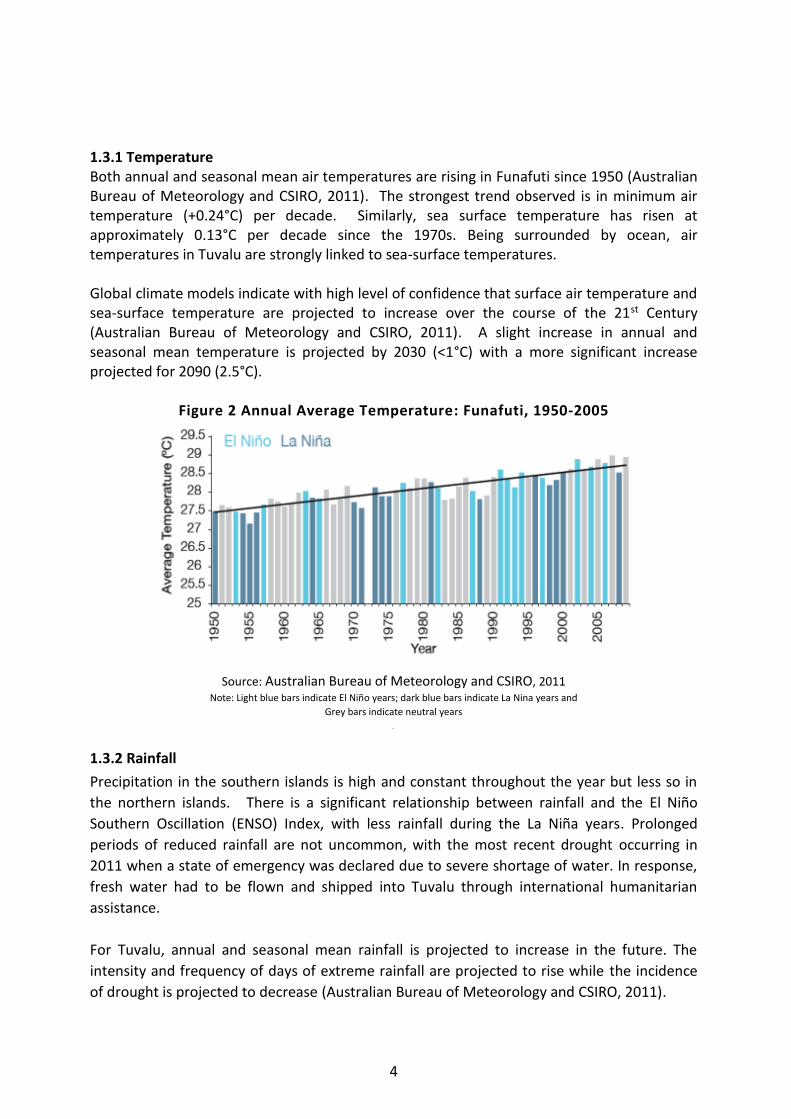
1.3.1 Temperature Both annual and seasonal mean air temperatures are rising in Funafuti since 1950 (Australian Bureau of Meteorology and CSIRO, 2011). The strongest trend observed is in minimum air temperature (+0.24°C) per decade. Similarly, sea surface temperature has risen at approximately 0.13°C per decade since the 1970s. Being surrounded by ocean, air temperatures in Tuvalu are strongly linked to sea-surface temperatures. Global climate models indicate with high level of confidence that surface air temperature and sea-surface temperature are projected to increase over the course of the 21st Century (Australian Bureau of Meteorology and CSIRO, 2011). A slight increase in annual and seasonal mean temperature is projected by 2030 (<1°C) with a more significant increase projected for 2090 (2.5°C).
Figure 2 Annual Average Temperature: Funafuti, 1950-2005
Source: Australian Bureau of Meteorology and CSIRO, 2011 Note: Light blue bars indicate El Niño years; dark blue bars indicate La Nina years and
Grey bars indicate neutral years
.
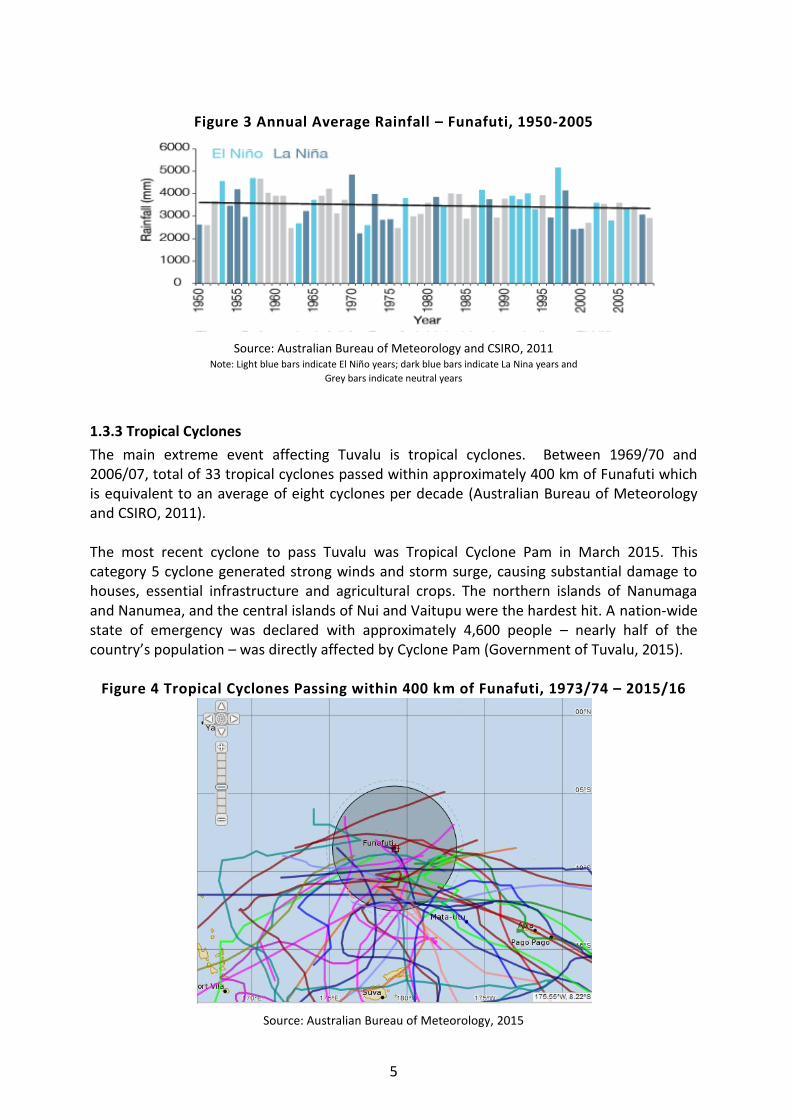
1.3.2 Rainfall
Precipitation in the southern islands is high and constant throughout the year but less so in
the northern islands. There is a significant relationship between rainfall and the El Niño
Southern Oscillation (ENSO) Index, with less rainfall during the La Niña years. Prolonged
periods of reduced rainfall are not uncommon, with the most recent drought occurring in
2011 when a state of emergency was declared due to severe shortage of water. In response,
fresh water had to be flown and shipped into Tuvalu through international humanitarian
assistance.
For Tuvalu, annual and seasonal mean rainfall is projected to increase in the future. The
intensity and frequency of days of extreme rainfall are projected to rise while the incidence
of drought is projected to decrease (Australian Bureau of Meteorology and CSIRO, 2011).
5
Figure 3 Annual Average Rainfall – Funafuti, 1950-2005
Source: Australian Bureau of Meteorology and CSIRO, 2011 Note: Light blue bars indicate El Niño years; dark blue bars indicate La Nina years and
Grey bars indicate neutral years
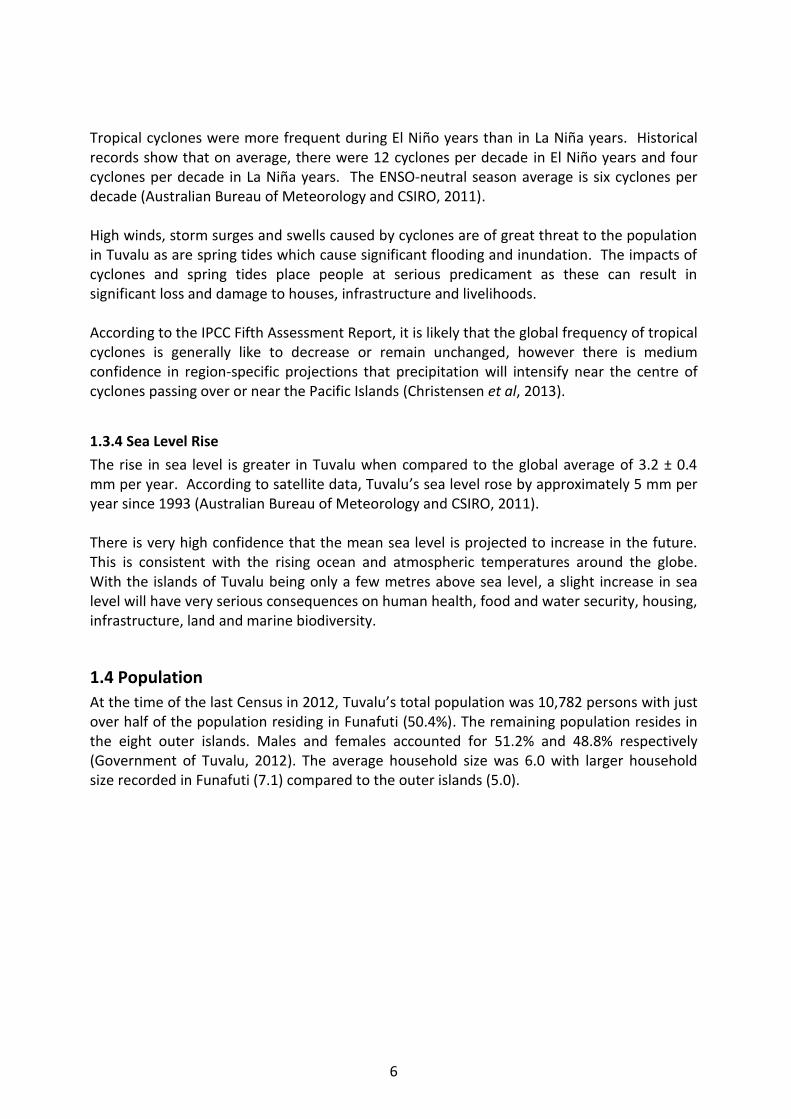
1.3.3 Tropical Cyclones
The main extreme event affecting Tuvalu is tropical cyclones. Between 1969/70 and 2006/07, total of 33 tropical cyclones passed within approximately 400 km of Funafuti which is equivalent to an average of eight cyclones per decade (Australian Bureau of Meteorology and CSIRO, 2011). The most recent cyclone to pass Tuvalu was Tropical Cyclone Pam in March 2015. This category 5 cyclone generated strong winds and storm surge, causing substantial damage to houses, essential infrastructure and agricultural crops. The northern islands of Nanumaga and Nanumea, and the central islands of Nui and Vaitupu were the hardest hit. A nation-wide state of emergency was declared with approximately 4,600 people – nearly half of the country’s population – was directly affected by Cyclone Pam (Government of Tuvalu, 2015).
Figure 4 Tropical Cyclones Passing within 400 km of Funafuti, 1973/74 – 2015/16
Source: Australian Bureau of Meteorology, 2015
6
Tropical cyclones were more frequent during El Niño years than in La Niña years. Historical records show that on average, there were 12 cyclones per decade in El Niño years and four cyclones per decade in La Niña years. The ENSO-neutral season average is six cyclones per decade (Australian Bureau of Meteorology and CSIRO, 2011). High winds, storm surges and swells caused by cyclones are of great threat to the population in Tuvalu as are spring tides which cause significant flooding and inundation. The impacts of cyclones and spring tides place people at serious predicament as these can result in significant loss and damage to houses, infrastructure and livelihoods. According to the IPCC Fifth Assessment Report, it is likely that the global frequency of tropical cyclones is generally like to decrease or remain unchanged, however there is medium confidence in region-specific projections that precipitation will intensify near the centre of cyclones passing over or near the Pacific Islands (Christensen et al, 2013).
1.3.4 Sea Level Rise
The rise in sea level is greater in Tuvalu when compared to the global average of 3.2 ± 0.4 mm per year. According to satellite data, Tuvalu’s sea level rose by approximately 5 mm per year since 1993 (Australian Bureau of Meteorology and CSIRO, 2011). There is very high confidence that the mean sea level is projected to increase in the future. This is consistent with the rising ocean and atmospheric temperatures around the globe. With the islands of Tuvalu being only a few metres above sea level, a slight increase in sea level will have very serious consequences on human health, food and water security, housing, infrastructure, land and marine biodiversity.
1.4 Population
At the time of the last Census in 2012, Tuvalu’s total population was 10,782 persons with just over half of the population residing in Funafuti (50.4%). The remaining population resides in the eight outer islands. Males and females accounted for 51.2% and 48.8% respectively (Government of Tuvalu, 2012). The average household size was 6.0 with larger household size recorded in Funafuti (7.1) compared to the outer islands (5.0).
7
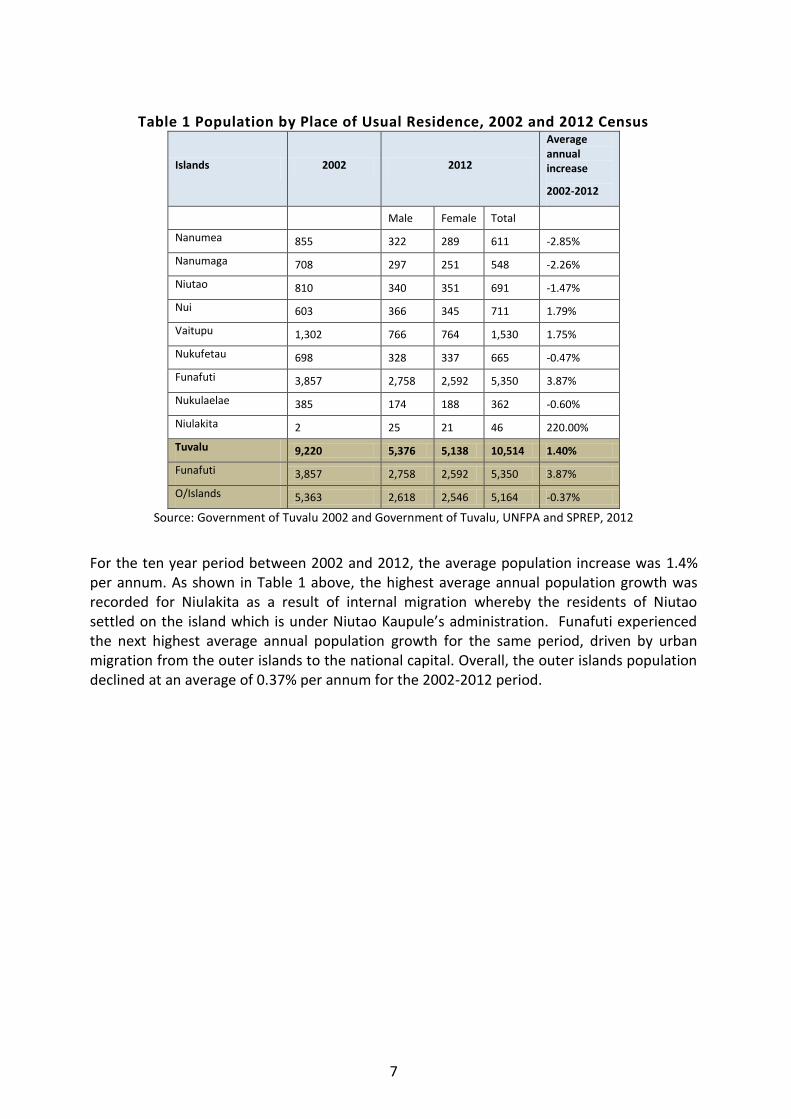
Table 1 Population by Place of Usual Residence, 2002 and 2012 Census
Islands 2002 2012
Average annual increase
2002-2012
Male Female Total
Nanumea 855 322 289 611 -2.85%
Nanumaga 708 297 251 548 -2.26%
Niutao 810 340 351 691 -1.47%
Nui 603 366 345 711 1.79%
Vaitupu 1,302 766 764 1,530 1.75%
Nukufetau 698 328 337 665 -0.47%
Funafuti 3,857 2,758 2,592 5,350 3.87%
Nukulaelae 385 174 188 362 -0.60%
Niulakita 2 25 21 46 220.00%
Tuvalu 9,220 5,376 5,138 10,514 1.40%
Funafuti 3,857 2,758 2,592 5,350 3.87%
O/Islands 5,363 2,618 2,546 5,164 -0.37%
Source: Government of Tuvalu 2002 and Government of Tuvalu, UNFPA and SPREP, 2012
For the ten year period between 2002 and 2012, the average population increase was 1.4% per annum. As shown in Table 1 above, the highest average annual population growth was recorded for Niulakita as a result of internal migration whereby the residents of Niutao settled on the island which is under Niutao Kaupule’s administration. Funafuti experienced the next highest average annual population growth for the same period, driven by urban migration from the outer islands to the national capital. Overall, the outer islands population declined at an average of 0.37% per annum for the 2002-2012 period.
8
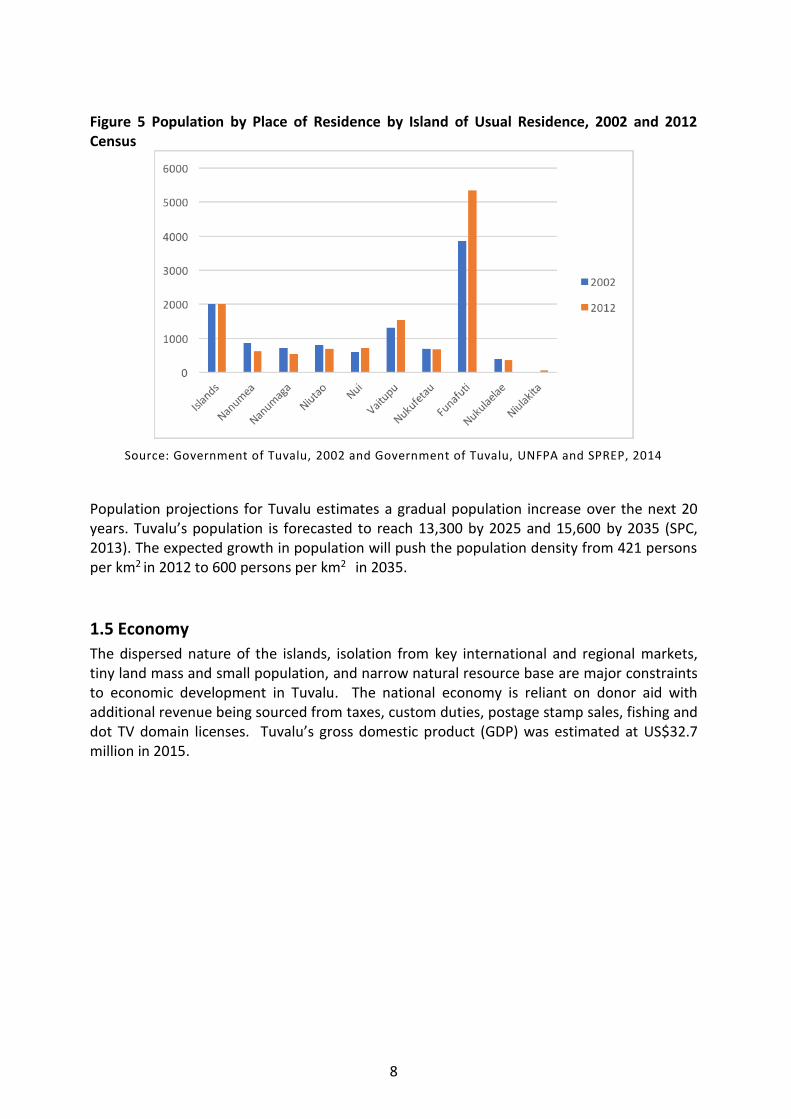
Figure 5 Population by Place of Residence by Island of Usual Residence, 2002 and 2012 Census
Source: Government of Tuvalu, 2002 and Government of Tuvalu, UNFPA and SPREP, 2014
Population projections for Tuvalu estimates a gradual population increase over the next 20 years. Tuvalu’s population is forecasted to reach 13,300 by 2025 and 15,600 by 2035 (SPC, 2013). The expected growth in population will push the population density from 421 persons per km2 in 2012 to 600 persons per km2 in 2035.
1.5 Economy
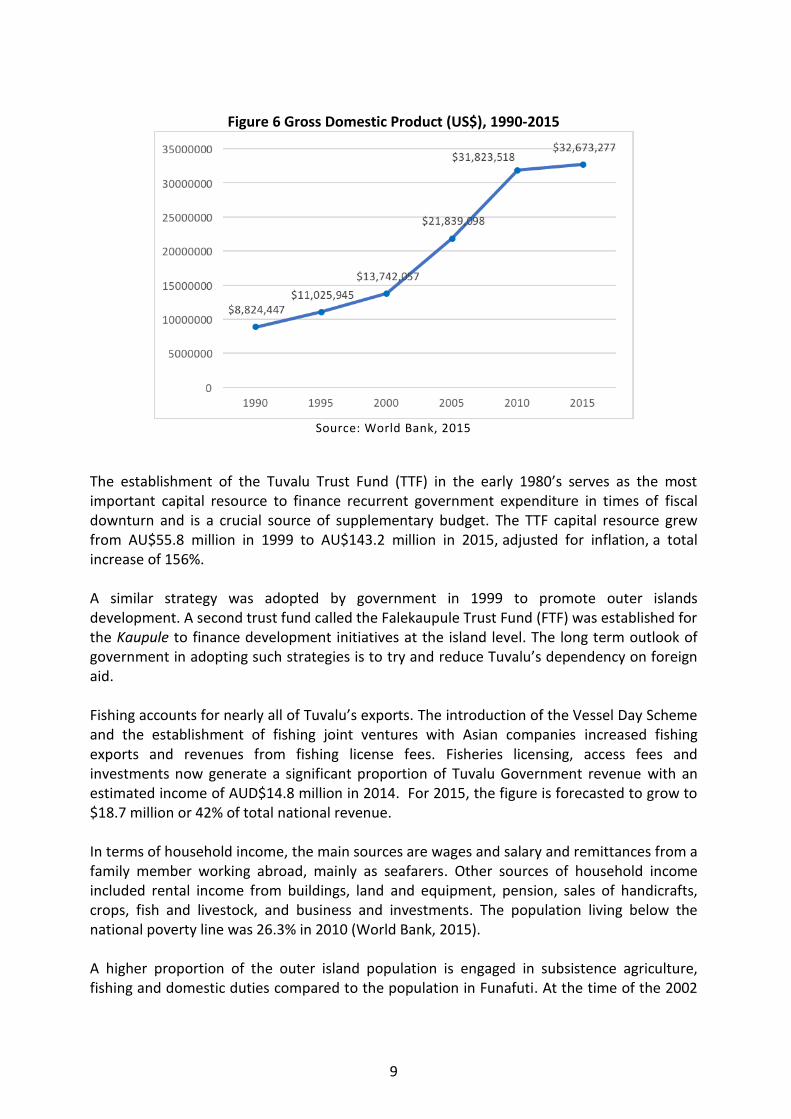
The dispersed nature of the islands, isolation from key international and regional markets, tiny land mass and small population, and narrow natural resource base are major constraints to economic development in Tuvalu. The national economy is reliant on donor aid with additional revenue being sourced from taxes, custom duties, postage stamp sales, fishing and dot TV domain licenses. Tuvalu’s gross domestic product (GDP) was estimated at US$32.7 million in 2015.
9
Figure 6 Gross Domestic Product (US$), 1990-2015
Source: World Bank, 2015
The establishment of the Tuvalu Trust Fund (TTF) in the early 1980’s serves as the most important capital resource to finance recurrent government expenditure in times of fiscal downturn and is a crucial source of supplementary budget. The TTF capital resource grew from AU$55.8 million in 1999 to AU$143.2 million in 2015, adjusted for inflation, a total increase of 156%. A similar strategy was adopted by government in 1999 to promote outer islands development. A second trust fund called the Falekaupule Trust Fund (FTF) was established for the Kaupule to finance development initiatives at the island level. The long term outlook of government in adopting such strategies is to try and reduce Tuvalu’s dependency on foreign aid. Fishing accounts for nearly all of Tuvalu’s exports. The introduction of the Vessel Day Scheme and the establishment of fishing joint ventures with Asian companies increased fishing exports and revenues from fishing license fees. Fisheries licensing, access fees and investments now generate a significant proportion of Tuvalu Government revenue with an estimated income of AUD$14.8 million in 2014. For 2015, the figure is forecasted to grow to $18.7 million or 42% of total national revenue. In terms of household income, the main sources are wages and salary and remittances from a family member working abroad, mainly as seafarers. Other sources of household income included rental income from buildings, land and equipment, pension, sales of handicrafts, crops, fish and livestock, and business and investments. The population living below the national poverty line was 26.3% in 2010 (World Bank, 2015). A higher proportion of the outer island population is engaged in subsistence agriculture, fishing and domestic duties compared to the population in Funafuti. At the time of the 2002
10
Census, approximately 60.9% of the labour force was involved in subsistence activities in the outer islands, compared to 10.8% in Funafuti (Government of Tuvalu, 2002). The participation rate in the labour force remains low at 59.4% with higher participation rate among men than women (67.6% and 51.1% respectively). Employment opportunities in Tuvalu are extremely limited. By far the public sector is the main source of formal employment in the country, employing 19.3% of all people in the labour force. In comparison, the proportion of people employed in the private sector was substantially lower at 7.9% (Government of Tuvalu, 2012). While in the past, seafaring and jobs in phosphate mining provided ample opportunities for some Tuvaluans, the situation is changing due to competitiveness of the international job market, demand for more skilled and qualified labour and economic downturn in these sectors.
1.6 Land Ownership and Tenure
One of the main obstacles hindering the development of Tuvalu is the system of land ownership. The increasing population density in the capital is driven by urban migration from the outer islands. The limited supply of land in Funafuti affects housing shortages and rental increase. The Tuvaluan land tenure system is based on the principle of land inheritance (land passed down from father or mother) to sons/daughters and subdivision of land between the landowners themselves. This system has advantages and disadvantages, like fragmentation of land plots through continual subdivision that may be inconsistent with pattern of growth. Disputes over land boundaries and multiple ownership of land are prevalent due to limitations with land registration. In the past and even today, these problems have acted as barriers to various economic developments and investments, such as commercial agriculture, infrastructure and building developments, leasing of land to others and in particular, the exchange of land between indigenous Tuvaluans. Building a house in Funafuti is a long process even to the landowners. The landowners have the right to build their house, but the final approval has to come from the Kaupule (in collaboration with resolution that passed from the Falekaupule.
1.7 Agriculture Subsistence agriculture is the predominant form of economic activity in Tuvalu. The use of pesticides and fertilizers is minimal. Similarly, livestock production is of subsistence nature, with swine, free-range chicken and ducks being the main livestock kept by households. Compared to other countries in the Pacific region, agricultural productivity in Tuvalu is low due to poor soil and water retention capacity, low levels of organic material, scarcity of arable land and fresh water, and lack of agricultural technology. Barriers such as the lack of
11
access to credit, limited agricultural extension services, under-utilization of local agricultural markets and unreliable inter-island transport also stifle agricultural development beyond subsistence farming. Despite the challenges, Tuvaluans have developed a highly sustainable farming system for the production of pulaka (swamp taro) (Cytrosperma chamissonis) and taro (Colocasia esculenta) which involves an extensive composting technique using pits dug to a depth of between 1-4 m and then filled with compost. By far the coconut is widely produced for household consumption and as a cash crop. Groves of coconut trees are grown with various layers of crops inter-planted between the trees. Copra export traditionally provided a significant proportion of the country’s export earnings and livelihoods of the population. However due to major marketing difficulties, the export of copra ceased in 2000. Other crops grown in Tuvalu include breadfruit, pandanus, fig, banana, and pawpaw. The bird nest fern (Asplenium nidus) or known locally as laulu, is the only leafy vegetable grown in the wild which is consumed as a local delicacy. Vegetables such as tomato, cucumber, cabbage, sweet potato and pumpkin are grown in some home gardens, while these are grown at a larger scale in the Taiwanese Government supported vegetable farm in Funafuti and Vaitupu. As part of the European Union (EU), Secretariat of the Pacific Community (SPC) and the Global Climate Change Alliance (GCCA) supported project, Improving Agroforestry Systems to Enhance Food Security and Build Resilience to Climate Change in Tuvalu, intercropping has been introduced in coconut woodlands this year (2015). Two sites in Funafuti and one site in Nukufetau have been selected for the coconut-based agroforestry. The project is being implemented by the Department of Agriculture.
1.8 Fisheries Subsistence fishing is very much part of the Tuvaluan way of life, providing essential source of protein as well as a means of livelihoods for households on all islands. Handline, gill netting and trawling are common methods used (Government of Tuvalu, 2014). All fish, regardless of the size, are caught and consumed. The annual fish catch from artisanal fisheries amounted to 245.96 tonnes in 2014 with nearly two thirds of the catch being skipjack tune (Fisheries Department, 2015). Compared to 2013, there was more than 150% increase in the total catch from artisanal fisheries in 2014. Traditionally, canoes dug out of Fetau (Calophyllum inophyllum) and Puka (Hernandia nymphaeifolia) were used by artisanal fishermen which are now increasingly being replaced by modern timber-constructed boats with outboard motors. Lobsters, shellfish and molluscs including giant clams are also caught in reefs but the population of these species are on the decline, especially in Funafuti (Lovell et al, 2004). Inshore fisheries are managed and controlled by Kaupule which has powers to regulate fishing and related industries and to enforce the conservation of fish on their respective islands as stipulated in the 2008 Falekaupule Act. The Government, through the Coastal
12
Fisheries Division, works closely with Kaupule and fishermen on each island to collect data on fish catch, undertake sampling for water quality and ciguatera, and to promote sustainable use of marine resources. To address the issue of over-fishing, 10 marine conservation areas were established on eight islands. The Funafuti Conservation Area was the first conservation area to be established in 1997 and the Funafuti Conservation Area Act came into force on 1 December 1999. The Funafuti Conservation Area is a marine protected area covering 33 km2 of the western reef margin including six small islets. All conservation areas are managed by the Kaupule however it is not completely effective as poaching has been reported on some islands (Government of Tuvalu, 2014). While further efforts are needed in the areas of enforcement and management, marine conservation areas play a vital role in biodiversity conservation and sustainable fisheries management in Tuvalu. Off-shore fisheries, in the form of purse seine and longline vessels operate within the Exclusive Economic Zones (EEZ) of Tuvalu with skipjack being the main catch. These include but are not limited to foreign fishing vessels from Japan, Korea, New Zealand, Taiwan and the United States.
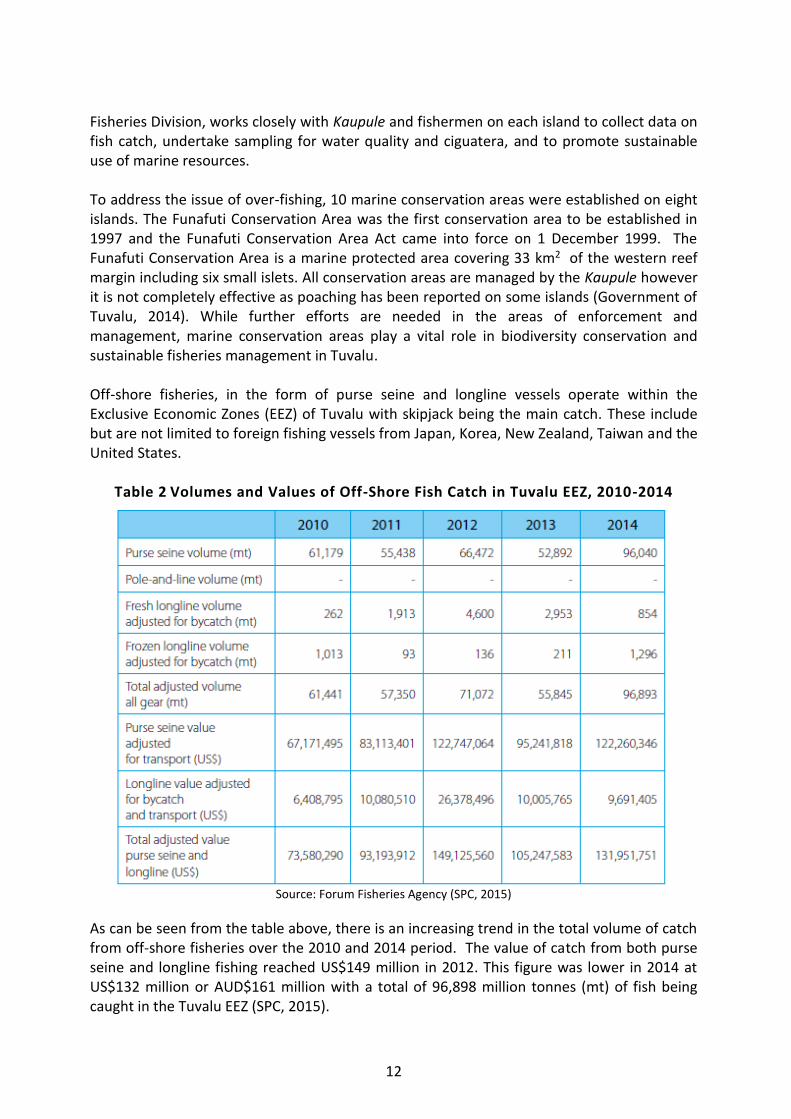
Table 2 Volumes and Values of Off-Shore Fish Catch in Tuvalu EEZ, 2010-2014
Source: Forum Fisheries Agency (SPC, 2015)
As can be seen from the table above, there is an increasing trend in the total volume of catch from off-shore fisheries over the 2010 and 2014 period. The value of catch from both purse seine and longline fishing reached US$149 million in 2012. This figure was lower in 2014 at US$132 million or AUD$161 million with a total of 96,898 million tonnes (mt) of fish being caught in the Tuvalu EEZ (SPC, 2015).
13
The Oceanic Division of the Tuvalu Government’s Fisheries Department manages the Vessel Day Scheme (VDS). As part of the VDS, trained observers are deployed to ensure the catch for each foreign vessel complies with the licence and access agreements. The Tuvalu Police Service also conducts regular patrols of Tuvalu’s maritime boundaries to detect any illegal fishing.
1.9 Biodiversity
The importance of the marine environment remains a top priority in the lives of Tuvaluan people. Conservation of biodiversity in Tuvalu is not a new concept as it has been part of the traditional system of natural resource management. With the gradual growth in population and the transition from subsistence to semi-commercial economy, traditional biodiversity conservation practices are diminishing. Key environmental challenges for Tuvalu include overfishing, land clearing, overexploitation of natural resources, poor waste and pollution management and sea level rise (Government of Tuvalu, 2005). Despite being small in size, the islands of Tuvalu are characterised by a variety of vegetation types. These include inland broadleaf forest and woodland, coastal littoral forest and scrub, mangroves and wetlands, coconut woodland and agroforest, excavated taro pits, home and urban gardens, intensive vegetable and food gardens and ruderal vegetation (Thaman, Fihaki and Fong, 2012). Terrestrial vascular plants reported for Tuvalu reaches 356 species of which only 18% are possibly indigenous to the island (Thaman et al, 2012). All the other species are introduced species. According to Thaman et al (2012), there are no endemic species in Tuvalu. The majority of species are ornamentals and shrubs. For marine species, there are 1,453 different species including 532 species of fish, 411 species of macro-invertebrates, 379 species of cnidarians, 59 species of marine algae, 41 species of residential and migratory birds, 21 mammals, 4 species of sponges, 4 species of reptiles and 2 species of mangroves (Job, 2009). According to the IUCN (International Union for the Conservation of Nature) Red List of Threatened Species list, 8 animal species are considered to be endangered in Tuvalu, among them are humphead wrasses (Cheilinus undulates), whale sharks (Rhincodon typus) and green turtles (Chelonian mydas). Environmental management at the national level falls under the responsibility of the Government’s Department of Environment. This Department is tasked to oversee the development and implementation of policies and programs concerning environmental protection and sustainable development. Its function is guided by national legal and regulatory instruments such as the 2008 Environmental Protection Act, the 2014 Environmental Impact Assessment Regulations, the 2008 Conservation Areas Act and the 2008 Wildlife Conservation Act.
1.10 Energy
The energy sector in Tuvalu is predominantly attributed to electricity generation using diesel-based generators. In Funafuti and some separate islets of the Funafuti atoll, have small
14
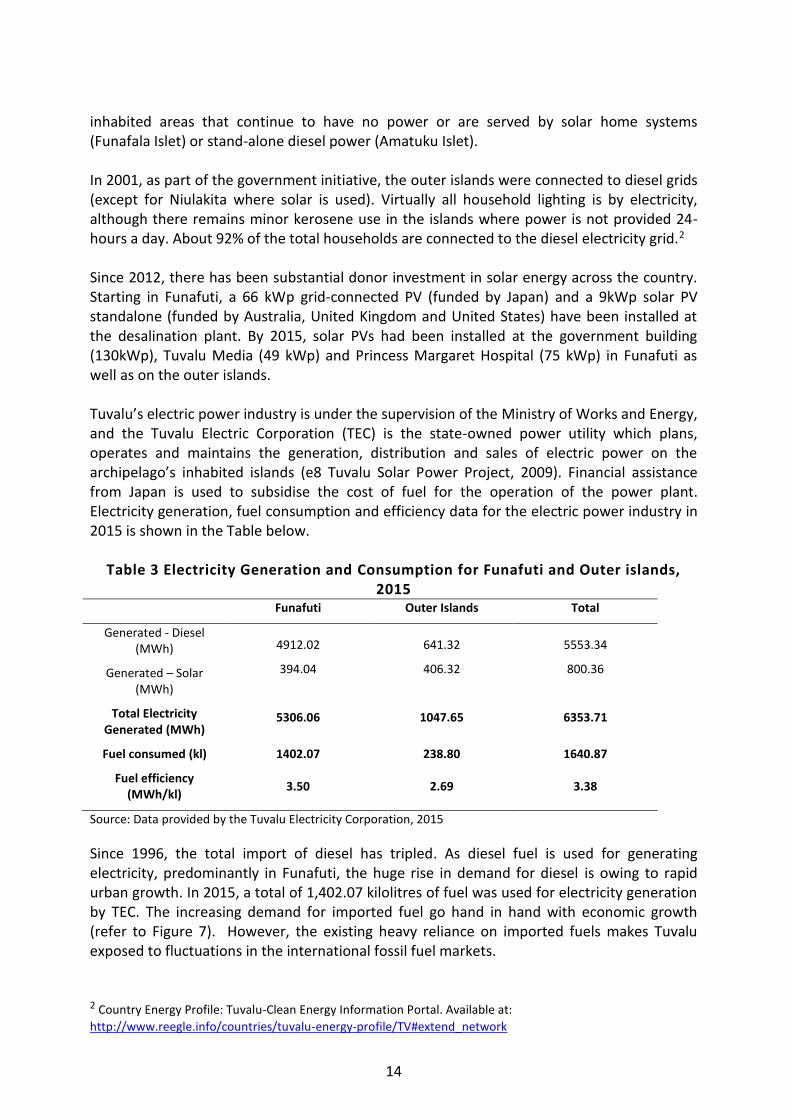
inhabited areas that continue to have no power or are served by solar home systems (Funafala Islet) or stand-alone diesel power (Amatuku Islet). In 2001, as part of the government initiative, the outer islands were connected to diesel grids (except for Niulakita where solar is used). Virtually all household lighting is by electricity, although there remains minor kerosene use in the islands where power is not provided 24- hours a day. About 92% of the total households are connected to the diesel electricity grid.2 Since 2012, there has been substantial donor investment in solar energy across the country. Starting in Funafuti, a 66 kWp grid-connected PV (funded by Japan) and a 9kWp solar PV standalone (funded by Australia, United Kingdom and United States) have been installed at the desalination plant. By 2015, solar PVs had been installed at the government building (130kWp), Tuvalu Media (49 kWp) and Princess Margaret Hospital (75 kWp) in Funafuti as well as on the outer islands. Tuvalu’s electric power industry is under the supervision of the Ministry of Works and Energy, and the Tuvalu Electric Corporation (TEC) is the state-owned power utility which plans, operates and maintains the generation, distribution and sales of electric power on the archipelago’s inhabited islands (e8 Tuvalu Solar Power Project, 2009). Financial assistance from Japan is used to subsidise the cost of fuel for the operation of the power plant. Electricity generation, fuel consumption and efficiency data for the electric power industry in 2015 is shown in the Table below.
Table 3 Electricity Generation and Consumption for Funafuti and Outer islands, 2015
Funafuti Outer Islands Total
Generated - Diesel (MWh)
Generated – Solar (MWh)
Total Electricity Generated (MWh)
4912.02
394.04
5306.06
641.32
406.32
1047.65
5553.34
800.36
6353.71
Fuel consumed (kl) 1402.07 238.80 1640.87
Fuel efficiency (MWh/kl)
3.50 2.69 3.38
Source: Data provided by the Tuvalu Electricity Corporation, 2015
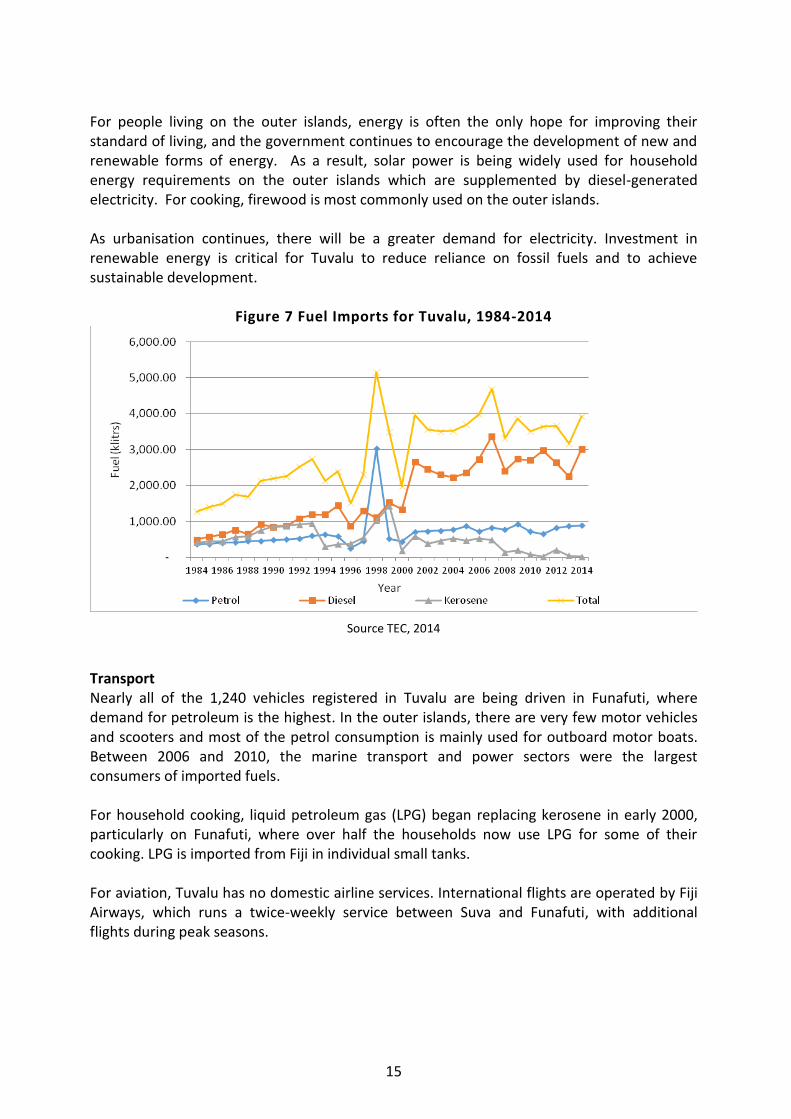
Since 1996, the total import of diesel has tripled. As diesel fuel is used for generating electricity, predominantly in Funafuti, the huge rise in demand for diesel is owing to rapid urban growth. In 2015, a total of 1,402.07 kilolitres of fuel was used for electricity generation by TEC. The increasing demand for imported fuel go hand in hand with economic growth (refer to Figure 7). However, the existing heavy reliance on imported fuels makes Tuvalu exposed to fluctuations in the international fossil fuel markets.
2 Country Energy Profile: Tuvalu-Clean Energy Information Portal. Available at:
http://www.reegle.info/countries/tuvalu-energy-profile/TV#extend_network
15
For people living on the outer islands, energy is often the only hope for improving their standard of living, and the government continues to encourage the development of new and renewable forms of energy. As a result, solar power is being widely used for household energy requirements on the outer islands which are supplemented by diesel-generated electricity. For cooking, firewood is most commonly used on the outer islands. As urbanisation continues, there will be a greater demand for electricity. Investment in renewable energy is critical for Tuvalu to reduce reliance on fossil fuels and to achieve sustainable development.
Figure 7 Fuel Imports for Tuvalu, 1984-2014
Source TEC, 2014
Transport Nearly all of the 1,240 vehicles registered in Tuvalu are being driven in Funafuti, where demand for petroleum is the highest. In the outer islands, there are very few motor vehicles and scooters and most of the petrol consumption is mainly used for outboard motor boats. Between 2006 and 2010, the marine transport and power sectors were the largest consumers of imported fuels. For household cooking, liquid petroleum gas (LPG) began replacing kerosene in early 2000, particularly on Funafuti, where over half the households now use LPG for some of their cooking. LPG is imported from Fiji in individual small tanks. For aviation, Tuvalu has no domestic airline services. International flights are operated by Fiji Airways, which runs a twice-weekly service between Suva and Funafuti, with additional flights during peak seasons.
16
CHAPTER 2. NATIONAL GREENHOUSE GAS INVENTORY
The provisions of the UNFCCC (Articles 4 and 12) require all Parties need to report to the COP through national communications, which includes a national inventory of anthropogenic emissions by sources and removals by sinks of all greenhouse gases not controlled by the Montreal Protocol. Tuvalu is a non - Annex I Party to the UNFCCC and also a Least Developed Country (LDC) Party. In October 1999, Tuvalu submitted its first inventory as part of the Initial National Communication to the UNFCCC Secretariat. The first GHG inventory was prepared for the reference year 1994 while this second GHG inventory is compiled for the year 2014 taking into account the availability of data3 and the option of Tuvalu as a LDC to select the inventory year at discretion.
2.1 Methodology
The Tier 1 method from the revised 1996 Intergovernmental Panel on Climate Change (IPCC) Guidelines for National Greenhouse Gas Inventories (hereafter referred to as the 1996 IPCC Revised Guidelines) was used for the GHG emissions. The IPCC Good Practice Guidance and Uncertainty Management in National Greenhouse Gas Inventories 2000 and the IPCC Good Practice Guidance for Land Use, Land Use Change and Forestry 2003 (also referred to as the IPCC Good Practice Guidance on LULUCF)4 were also used to guide the estimation. Where appropriate, some methods and updated emission factors and parameters for direct GHG taken from the 2006 IPCC Guidelines for National Greenhouse Gas Inventories were also used. For the indirect GHG/precursors gases, default emission factors from EMEP/CORINAIR Emission Inventory Guidebook 2007 (EEA, 2007) were applied. For calculating and reporting the emissions, the UNFCCC NAI Software version 1.3.2 was utilized which is consistent with the methodology of the Common Reporting Framework of the 1996 IPCC Guidelines.
2.1.1 Key Category Analysis The sectors included in the second GHG inventory includes: Energy; Agriculture; Land Use Change and Forestry; and Waste for the categories that occur in the country and for which information was available. Transport is included in the Energy sector but where possible, it has been reported separately. The emissions from the Industrial Processes sector mostly do not occur in the country, and the emissions from the solvent and other product use sector were not estimated due the unavailability of data. The GHG emissions reported in the inventory include the direct greenhouse gases carbon dioxide (CO2), methane (CH4), and nitrous oxide (N2O) and the indirect GHG/precursor gases carbon monoxide (CO), nitrogen oxides (NOx), non-methane volatile organic compounds (NMVOC) and sulphur dioxide (SO2).
3 For energy industries, 2014 data was used. For all other sectors, complete datasets were only available for 2002. 4 This guidance was used specifically to assess emissions and removals from Forests Lands.
17
Non-Annex I Parties are encouraged, as appropriate, to provide information on anthropogenic emissions by sources of hydrofluorocarbons (HFCs), perfluorocarbons (PFCs) and Sulphur hexafluoride (SF6). However, emissions derived from the productions of those gases do not occur in Tuvalu and were reported using the notation key NO (not – occurring) in the sectoral and inventory tables, and the emissions derived from the consumption of halocarbons were not estimated because activity data is not available and were reported using the notation key NE (not-estimated) and additionally are considered insignificant in the inventory. Compared to the first GHG inventory, emission estimates were performed for more sectors and categories, and the inventory completeness, transparency and reporting were also improved.
2.1.2 Data Collection The activity data used to develop the inventory estimates were obtained both from national sources and from recognized international data sources (e.g. from FAO in the Agriculture and LULUCF sectors). These include the last national census (2012), electricity data from TEC (2014), other sectoral datasets (2002), project and research reports, and other available literature.5 Due to lack of adequate data, some categories and subcategories were estimated using the methods provided in the IPCC Good Practice Guidance, in particular the surrogate method. It was also necessary to use expert judgment, for instance in the Energy sector, the aggregated fuel consumption data was split into specific subcategories or activities without affecting the total emissions for the category assessed. The implications of the latest methods (surrogate and expert judgment) were considered in the uncertainty assessment performed to the national emissions estimates. Emission factors and parameters applied were basically IPCC default values from the 2006 IPCC Guidelines and EMEP/CORINAIR 2007. Every effort was made to ensure their applicability and relevance to Tuvalu’s national circumstances.
2.1.3 Uncertainty Uncertainty estimates are an essential element of a complete emissions inventory. Uncertainty information is not intended to dispute the validity of the inventory estimates, rather, to help prioritize efforts to improve the accuracy of inventories in the future and guide decisions on methodological choice. Tier 1 approach is based upon error propagation and is used to estimate uncertainty in individual categories, in the inventory as a whole, and in trends between a year of interest and a base year. The analysis uses the 95 percent confidence interval of the emissions and removals estimates for individual categories and for the total inventory. As part of this inventory compilation an uncertainty analysis (Tier 1) was undertaken for the year 2002 following the advice of the IPCC Good Practice Guidance and the IPCC Good Practice Guidance on LULUCF for this objective. Uncertainties for individual variables were determined and the default uncertainty estimates for emission factors, estimation parameters and activity data provided in the 2006 IPCC Guidelines were used for the calculations based on the assumption that the corresponding probability distribution functions (PDFs) to be normal. For some activity data, it
5 Secondary data sources refer to reference sources for inventory data that are not designed for the express purpose of inventory development. Typically include national statistical databases, scientific literature, and other studies produced by agencies or organizations not associated with the inventory development (IPCC, 2000).
18
was considered that default uncertainty values were not representative of national circumstances and were selected using expert judgment. The inventory only calculated uncertainties by source categories and by direct GHG. Uncertainty in the trend for the 1994 and 2002 (or 1994 and 2014) period was not determined due to the lack of data for the base year 1994. CO2 inventory emissions estimates have low level of uncertainty (5.7%) while the CH4 and N2O emissions are more uncertain (41.7% and 56.3% respectively).
2.1.4 Data Reporting and Interpretation Considering the extremely low level of GHG emissions in Tuvalu, calculations were initially done in tonnes (t) and for reporting purposes were after converted to Gigagrams (Gg). Notation keys ‘NO’ is used when emissions do not occur and ‘NE’ for emissions not estimated or considered insignificant. Although Tuvalu’s GHG emissions are clearly negligible in a global context, an emission was classified to be ‘insignificant’ if the likely level of emissions is below 0.05 per cent of the national total GHG emissions and does not exceed 500 kt CO2. In addition, emission was insignificant when the total national aggregate of estimate emission for all gases and categories considered insignificant remained below 0.1 per cent of the national total GHG emissions.
2.2 Institutional Arrangements One fundamental part of the inventory process is the institutional arrangements that the Party should have put in place to perform the planning, preparation, and management of the GHG inventory on a permanent basis. The National Inventory Arrangements (NIA) refer to the institutional as well as legal and procedural arrangements for estimating the GHG emissions and removals and for reporting and archiving inventory information. Tuvalu has not yet established a NIA to properly estimate and report GHG emissions and removals from all sources and sink categories that occur in the country. Although this second inventory has improved compared to the first, there are still difficulties with data availability. Further advances are necessary to improve the planning, preparation, and management of subsequent inventories and cover other activities including estimations of GHG emissions and removals, quality assurance and quality control activities, reporting, archiving and documenting inventory information, and verification procedures.
2.3 Tuvalu GHG Emissions 2014
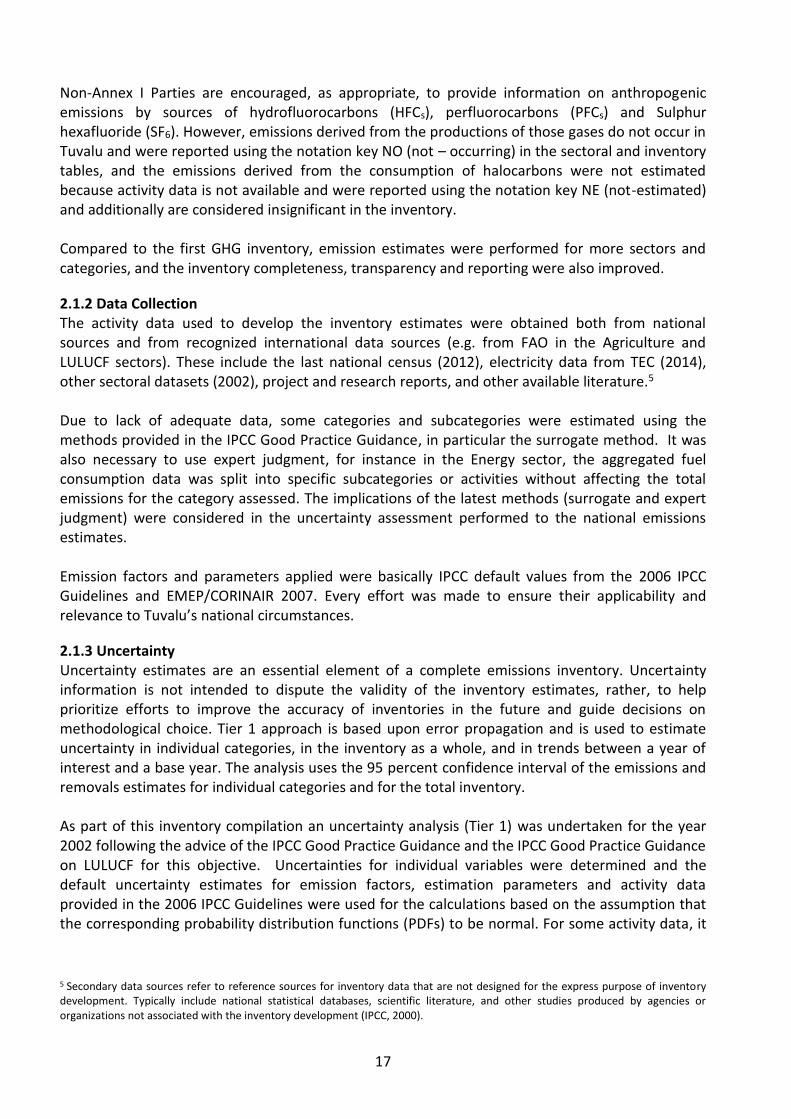
The main GHG emissions reported in the inventory are CO2, CH4 and N2O. Converting these three main gases into a common unit using their Global Warming Potentials (GWP) over a 100-year time horizon6 indicates Tuvalu’s total emission in 2014 is 18.467 Gg CO2-e, of which 11.214 Gg CO2-e is from the Energy Sector. Carbon dioxide is the major contributor with a share of 60.4% of the total GHG emissions, followed by N2O which comprises 23.1% and CH4 comprises 16.4%.
6 Conversion based on GWP from IPCC Fifth Assesssment Report.
19
Figure 8 National CO2-e emission by direct GHG (%), 2014
Source: Compiled by the Government of Tuvalu for the Second GHG Inventory, using 2014 and 2002 data
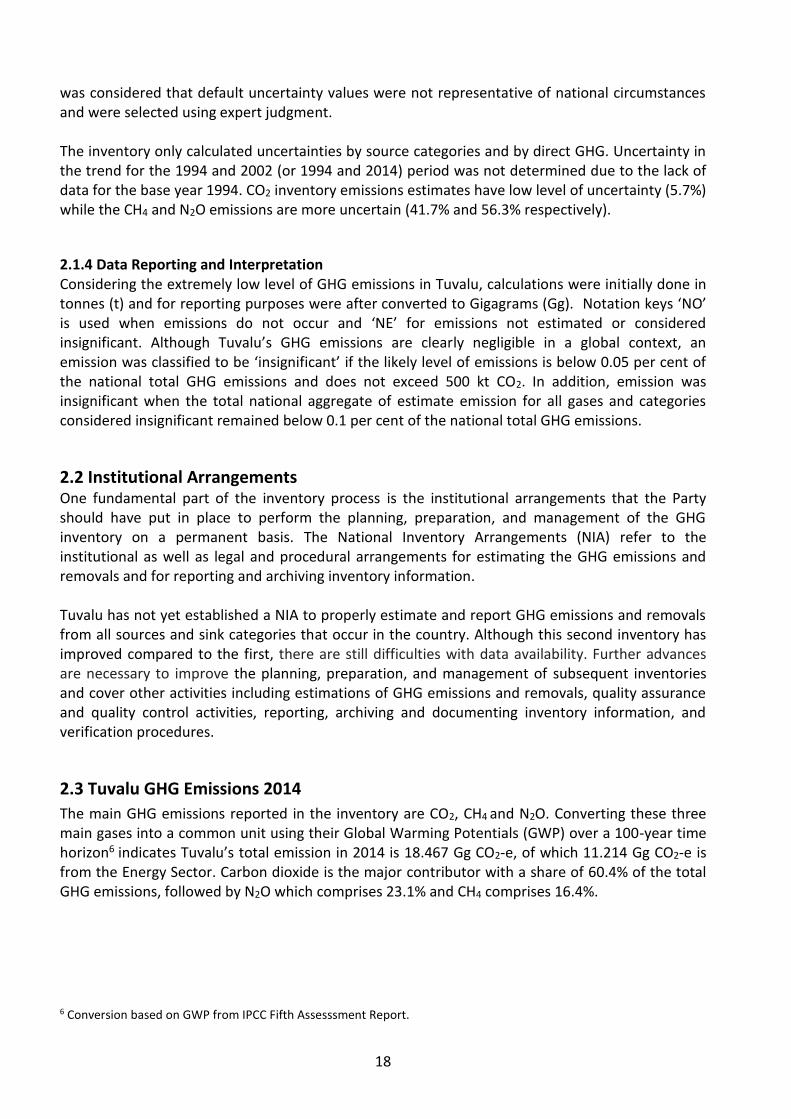
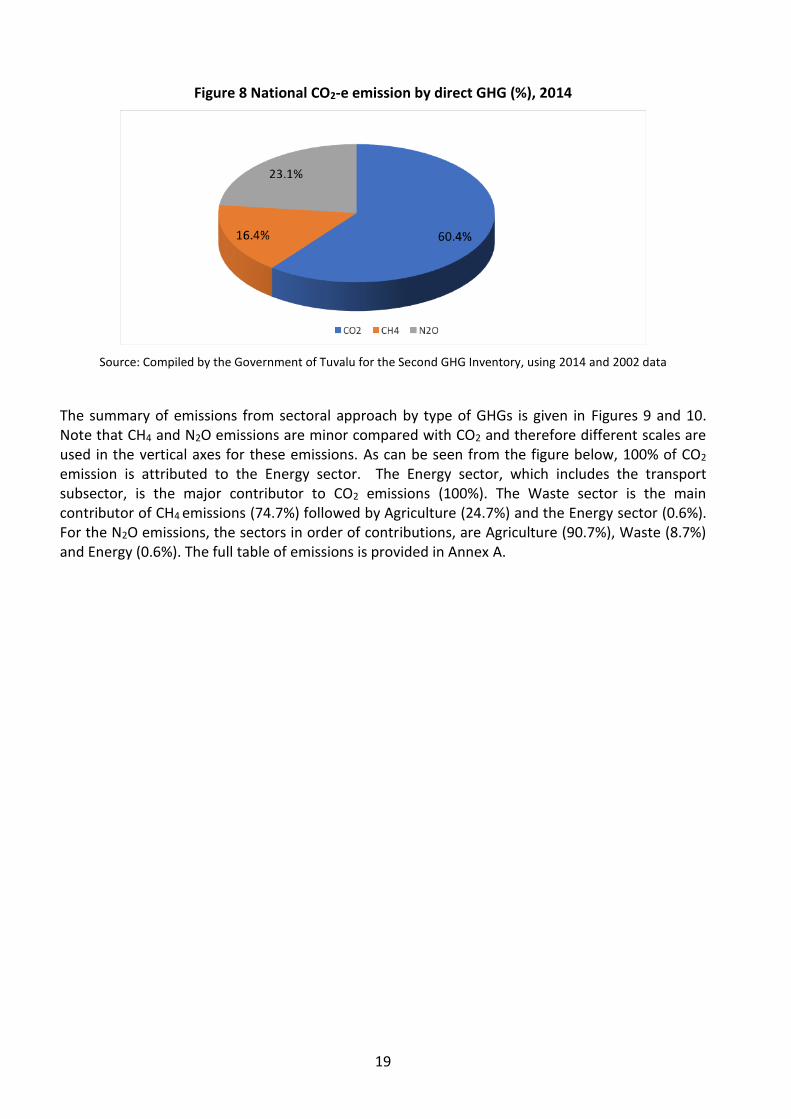
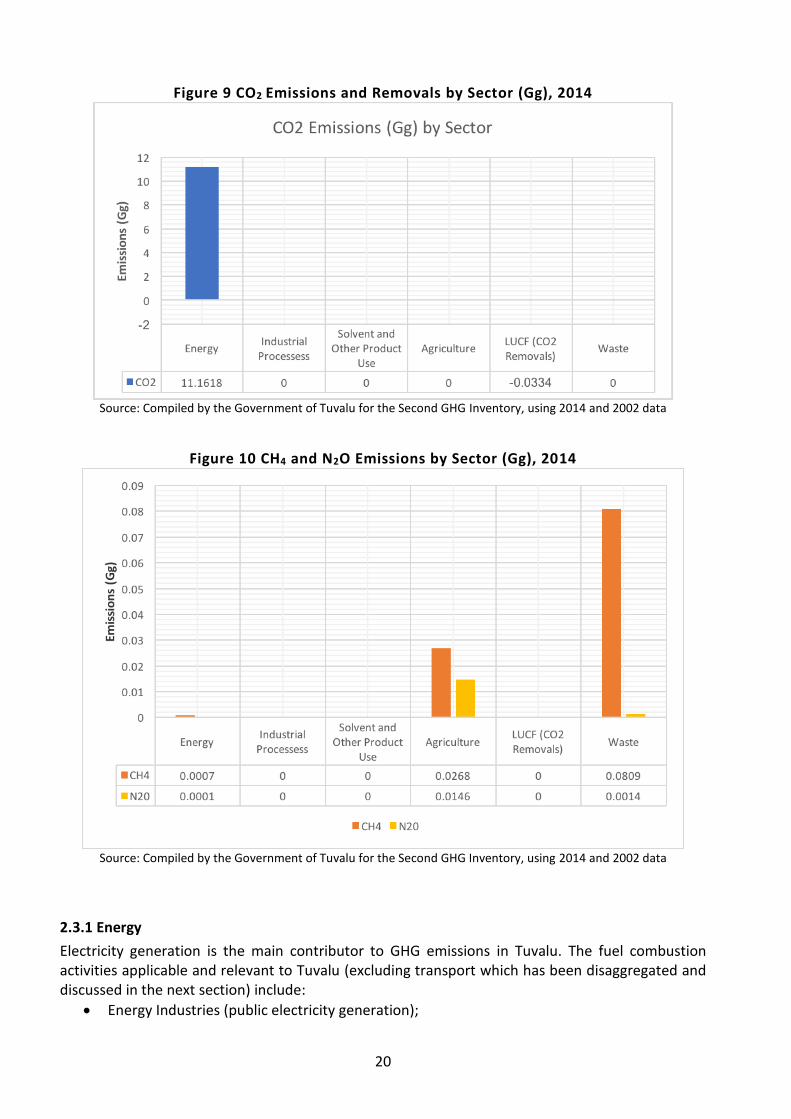
The summary of emissions from sectoral approach by type of GHGs is given in Figures 9 and 10. Note that CH4 and N2O emissions are minor compared with CO2 and therefore different scales are used in the vertical axes for these emissions. As can be seen from the figure below, 100% of CO2 emission is attributed to the Energy sector. The Energy sector, which includes the transport subsector, is the major contributor to CO2 emissions (100%). The Waste sector is the main contributor of CH4 emissions (74.7%) followed by Agriculture (24.7%) and the Energy sector (0.6%). For the N2O emissions, the sectors in order of contributions, are Agriculture (90.7%), Waste (8.7%) and Energy (0.6%). The full table of emissions is provided in Annex A.
20
Figure 9 CO2 Emissions and Removals by Sector (Gg), 2014
Source: Compiled by the Government of Tuvalu for the Second GHG Inventory, using 2014 and 2002 data
Figure 10 CH4 and N2O Emissions by Sector (Gg), 2014
Source: Compiled by the Government of Tuvalu for the Second GHG Inventory, using 2014 and 2002 data
2.3.1 Energy
Electricity generation is the main contributor to GHG emissions in Tuvalu. The fuel combustion activities applicable and relevant to Tuvalu (excluding transport which has been disaggregated and discussed in the next section) include:
Energy Industries (public electricity generation);
21
Residential (fuel combustion in households, mainly for cooking); and
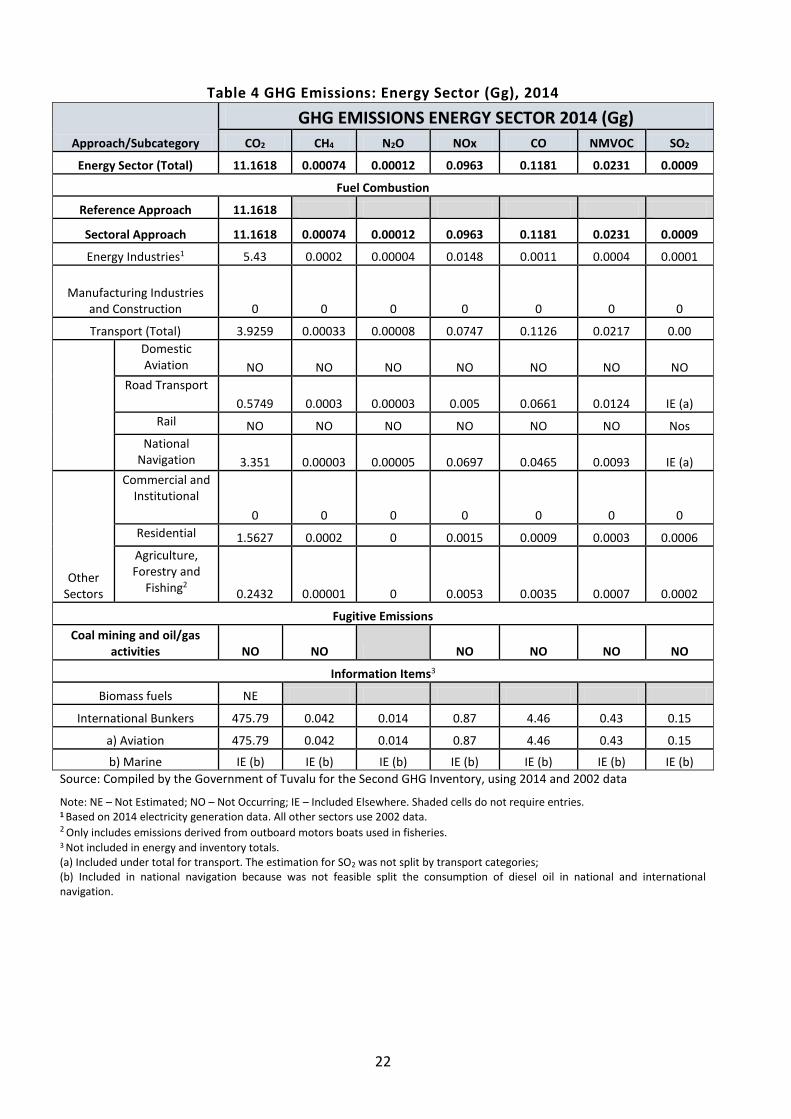
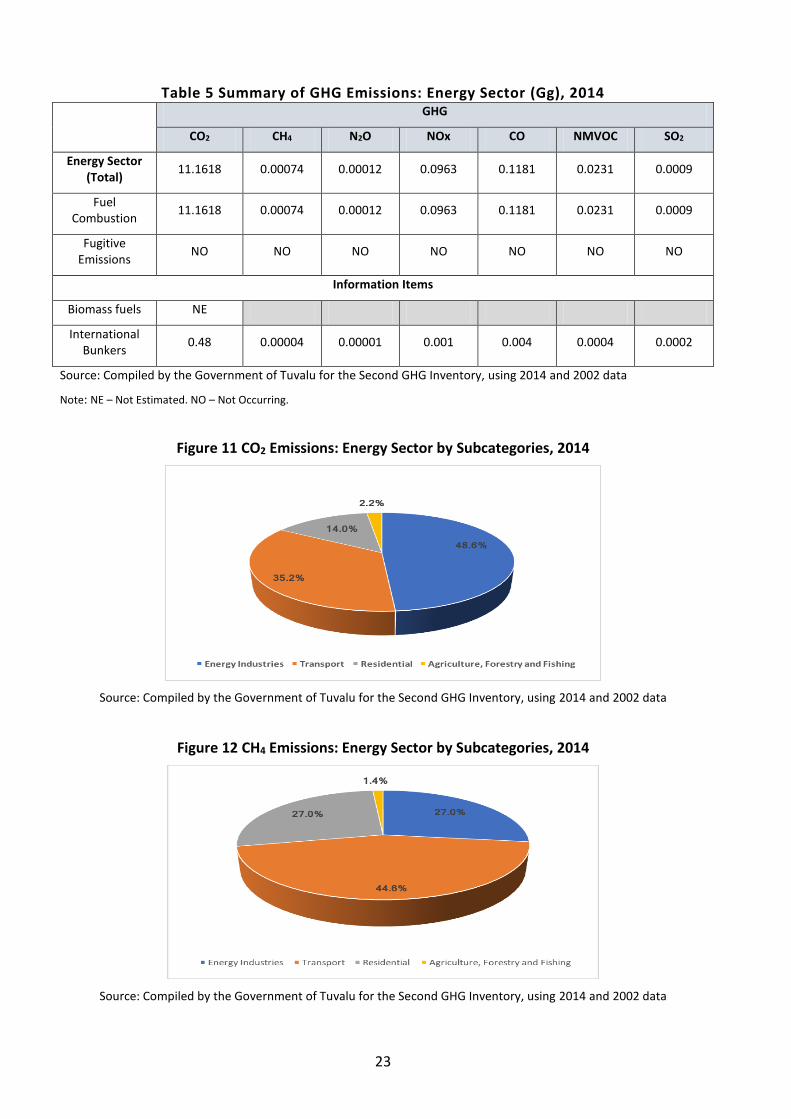
Agriculture/Forestry/Fishing. Tuvalu is dependent on importation of petroleum products for commercial and household services. Diesel is imported for electricity generation; kerosene and LPG are imported for residential use, and lubricants for electricity generation. For the inventory year concerned, (2002) there were no production and exports of fossil fuels in Tuvalu. For the inventory, the CO2 emissions from fuel combustion were estimated using both Reference and Sectoral approaches. The two approaches compare reasonably well (difference 0.05%) though this result is derived from using the same fuel consumption data for both approaches. In 2014, CO2 emissions from the Energy Sector amounted to 11.161 Gg derived mainly from fuel combustion in Energy Industries for electricity generation7 (48.6%) and Transport (35.2%) followed by Residential (14.0%) and Agriculture, Forestry, and Fishing (2.2%) activities. On the other hand, CH4 emissions were very low (0.00074 Gg) with Transport (mainly road transport) accounting for 44.6% of sectoral emissions from this GHG. This was followed by Residential and Energy Industries (both 27.0 %), and Agriculture, Forestry and Fishing (1.4%).
7 Note: 2014 data was used for electricity generation however for all other sectors, only 2002 data was available.
22
Table 4 GHG Emissions: Energy Sector (Gg), 2014
Approach/Subcategory
GHG EMISSIONS ENERGY SECTOR 2014 (Gg)
CO2 CH4 N2O NOx CO NMVOC SO2
Energy Sector (Total) 11.1618 0.00074 0.00012 0.0963 0.1181 0.0231 0.0009
Fuel Combustion
Reference Approach 11.1618
Sectoral Approach 11.1618 0.00074 0.00012 0.0963 0.1181 0.0231 0.0009
Energy Industries1 5.43 0.0002 0.00004 0.0148 0.0011 0.0004 0.0001
Manufacturing Industries and Construction 0 0 0 0 0 0 0
Transport (Total) 3.9259 0.00033 0.00008 0.0747 0.1126 0.0217 0.00
Domestic Aviation NO NO NO NO NO NO NO
Road Transport
0.5749 0.0003 0.00003 0.005 0.0661 0.0124 IE (a)
Rail NO NO NO NO NO NO Nos
National Navigation 3.351 0.00003 0.00005 0.0697 0.0465 0.0093 IE (a)
Other Sectors
Commercial and Institutional
0 0 0 0 0 0 0
Residential 1.5627 0.0002 0 0.0015 0.0009 0.0003 0.0006
Agriculture, Forestry and
Fishing2 0.2432 0.00001 0 0.0053 0.0035 0.0007 0.0002
Fugitive Emissions
Coal mining and oil/gas activities NO NO NO NO NO NO
Information Items3
Biomass fuels NE
International Bunkers 475.79 0.042 0.014 0.87 4.46 0.43 0.15
a) Aviation 475.79 0.042 0.014 0.87 4.46 0.43 0.15
b) Marine IE (b) IE (b) IE (b) IE (b) IE (b) IE (b) IE (b)
Source: Compiled by the Government of Tuvalu for the Second GHG Inventory, using 2014 and 2002 data
Note: NE – Not Estimated; NO – Not Occurring; IE – Included Elsewhere. Shaded cells do not require entries. 1 Based on 2014 electricity generation data. All other sectors use 2002 data.
2 Only includes emissions derived from outboard motors boats used in fisheries. 3 Not included in energy and inventory totals. (a) Included under total for transport. The estimation for SO2 was not split by transport categories; (b) Included in national navigation because was not feasible split the consumption of diesel oil in national and international navigation.
23
Table 5 Summary of GHG Emissions: Energy Sector (Gg), 2014
GHG
CO2 CH4 N2O NOx CO NMVOC SO2
Energy Sector (Total)
11.1618 0.00074 0.00012 0.0963 0.1181 0.0231 0.0009
Fuel Combustion
11.1618 0.00074 0.00012 0.0963 0.1181 0.0231 0.0009
Fugitive Emissions
NO NO NO NO NO NO NO
Information Items
Biomass fuels NE
International Bunkers
0.48 0.00004 0.00001 0.001 0.004 0.0004 0.0002
Source: Compiled by the Government of Tuvalu for the Second GHG Inventory, using 2014 and 2002 data
Note: NE – Not Estimated. NO – Not Occurring.
Figure 11 CO2 Emissions: Energy Sector by Subcategories, 2014
Source: Compiled by the Government of Tuvalu for the Second GHG Inventory, using 2014 and 2002 data
Figure 12 CH4 Emissions: Energy Sector by Subcategories, 2014
Source: Compiled by the Government of Tuvalu for the Second GHG Inventory, using 2014 and 2002 data
24
2.3.2 Transport
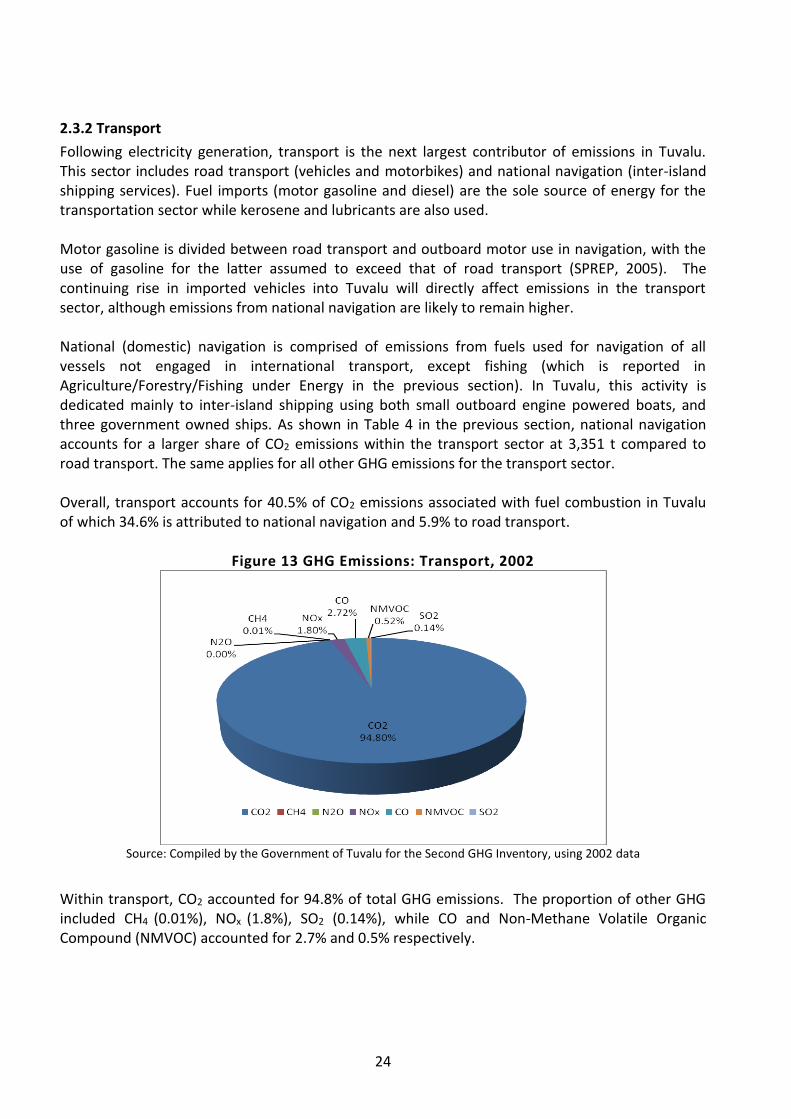
Following electricity generation, transport is the next largest contributor of emissions in Tuvalu. This sector includes road transport (vehicles and motorbikes) and national navigation (inter-island shipping services). Fuel imports (motor gasoline and diesel) are the sole source of energy for the transportation sector while kerosene and lubricants are also used. Motor gasoline is divided between road transport and outboard motor use in navigation, with the use of gasoline for the latter assumed to exceed that of road transport (SPREP, 2005). The continuing rise in imported vehicles into Tuvalu will directly affect emissions in the transport sector, although emissions from national navigation are likely to remain higher. National (domestic) navigation is comprised of emissions from fuels used for navigation of all vessels not engaged in international transport, except fishing (which is reported in Agriculture/Forestry/Fishing under Energy in the previous section). In Tuvalu, this activity is dedicated mainly to inter-island shipping using both small outboard engine powered boats, and three government owned ships. As shown in Table 4 in the previous section, national navigation accounts for a larger share of CO2 emissions within the transport sector at 3,351 t compared to road transport. The same applies for all other GHG emissions for the transport sector. Overall, transport accounts for 40.5% of CO2 emissions associated with fuel combustion in Tuvalu of which 34.6% is attributed to national navigation and 5.9% to road transport.
Figure 13 GHG Emissions: Transport, 2002
Source: Compiled by the Government of Tuvalu for the Second GHG Inventory, using 2002 data
Within transport, CO2 accounted for 94.8% of total GHG emissions. The proportion of other GHG included CH4 (0.01%), NOx (1.8%), SO2 (0.14%), while CO and Non-Methane Volatile Organic Compound (NMVOC) accounted for 2.7% and 0.5% respectively.
25
2.3.3 Agriculture
Tuvalu’s agricultural sector is dominated by subsistence agriculture. Enteric fermentation, manure management and agricultural soils are the three relevant activities considered for calculating emissions for this sector. In 2002, emissions from agriculture totalled 4.6166 Gg CO2-e8. On a mass basis, emissions of N2O are by far the most important. This is largely due to the importance of grazing animals as a source of N2O in the country and also that in the types of domestic livestock existing in Tuvalu only pigs emit CH4 from enteric fermentation. Within the agriculture sector, N20 contributed to 83.8% of the total aggregated emissions in CO2-e and CH4 accounted for 16.2%.
Table 6 GHG Emissions: Agriculture (Gg and Gg CO2-e), 2002
Category
Greenhouse Gas
Total aggregated emissions (GgCO2-e) CH4 N2O
Enteric Fermentation 0.0088
Manure Management 0.0179 (a)
Rice Cultivation NO NO
Agricultural Soils
0.0146
Prescribed Burning of Savannas NO NO
Field Burning of Agricultural
Residues NO NO
Other NO NO
Total (Gg) 0.0267 0.0146
Total (Gg CO2-e ) 0.7476 3.869 4.6166
Source: Compiled by the Government of Tuvalu for the Second GHG Inventory, using 2002 data Note: NO – Not Occurring. (a) Reported in Agricultural Soils.
2.3.4 Land Use Change and Forestry
Removal of mangroves for fuelwood, coastal deforestation and the expansion of coconut plantations have led to the conversion of existing forest to other land uses in Tuvalu. Overall, however, emissions from land-use change are considered to be insignificant. In 2002, aggregated emissions from Land Use Change and Forestry amounted to -0.0334 Gg CO2-e (removals), all associated with the annual increase in carbon stocks due to biomass growth in forest and other biomass stocks. Specifically, these refer to changes in net CO2 emissions from coconut plantations (-0.0238 Gg), mangroves (-0.0075 Gg) and broadleaf forests (-0.0021 Gg).
8 Conversion based on GWP over a 100 year time horizon from IPCC Fifth Assesssment Report.
26
Table 7 GHG Emissions: Land Use Change and Forestry (Gg and Gg CO2-e), 2002
Category
Greenhouse Gas
Total aggregated emissions (CO2-e)
Net CO2 CH4 N2O NOx CO
Changes in Forest and Other Woody
Biomass Stocks (a)
-0.0334
Forest and Grassland
Conversion NO NO NO NO NO
Abandonment of Managed Lands NO
CO2 Emissions and Removals
from Soil NO
Total (Gg) -
0.0334 NO NO NO NO
Total (Gg CO2-e ) -
0.0334 NO NO NO NO -0.0334
Source: Compiled by the Government of Tuvalu for the Second GHG Inventory, using 2002 data Note: NO – Not occurring. a) Figure mapped back from the results obtained for FF (Table 6.3 above). All corresponding to removals.
For the purposes of reporting the signs for removals (uptake) are always (-) and for emissions (+).
2.3.5 Waste
Tuvalu’s emissions from waste can be broken down into solid waste disposal and domestic wastewater handling. In 2002, aggregated emissions from waste totalled 2.6362 Gg CO2-e9 with CH4 accounting for 85.9% of aggregated emissions and the remaining 14.1% attributed to N2O from human sewage released to aquatic environments.
9 Conversion based on GWP over a 100 year time horizon from IPCC Fifth Assesssment Report.
27
Table 8 GHG Emissions: Waste (Gg and Gg CO2-e), 2002
Category
Greenhouse Gas Total aggregated emissions (CO2-e) CO2 CH4 N2O
Solid waste disposal in SWDS (a)
0.0375
Industrial wastewater handling
NO
Domestic wastewater handling
0.0434 0.0014
Incineration and open burning of
waste NE NE NE
Total (Gg) NE 0.0809 0.0014
Total (Gg CO2-e ) NE 2.2652 0.371 2.6362
Source: Compiled by the Government of Tuvalu for the Second GHG Inventory, using 2002 data Note: NO – Not occurring. NE – Not estimated. (a) Emission estimated using the Mass Balance Method.
2.4 GHG Emission Trends
Direct comparisons cannot be made between the first inventory (1994) and this second inventory (2002). The first inventory was severely limited by lack of available data. The second inventory includes updated emission factors and estimation parameters and criteria to estimate the GHGs. Also the present inventory include estimates for more categories and sectors than in the first inventory and the inventory completeness was substantially improved. For this reason, the second inventory shows higher emissions for all sectors but this is more likely to reflect improvements in estimation and completeness of data. Although it is difficult to clearly determine the trend in GHG emissions over the 1994 and 2014 period without accurate and consistent data, it is likely that GHG emission levels are higher now than the initial national communication with the increase in population and the growth of fuel-driven sectors such as road transport and national navigation. The actual data on the solar PVs installed in Funafuti and the outer islands in the last decade will need to be systematically collected and analysed for the subsequent GHG inventory to calculate their contribution in reducing Tuvalu’s CO2 emissions. With improvements made in compiling this inventory, it is anticipated that it can be used for the purpose of comparative analysis with future inventories. This will enable the identification of GHG emission trends and the progress of Tuvalu in meeting its GHG emission reduction targets.
28
CHAPTER 3. VULNERABILITY AND ADAPTATION ASSESSMENT The Intergovernmental Panel on Climate Change (IPCC) in its Second, Third, Fourth and Fifth Assessment Reports indicate that low lying countries such as Tuvalu are likely to be among the most vulnerable to the adverse impacts of climate change. The IPCC and other similar reports point to a number of vulnerabilities that low-lying countries face in regards to climate change and variability, including their size and limited resource base, vulnerability to existing weather events such as heavy tropical rainfall, dry-season drought, tropical storms such as cyclones, and restricted economic opportunities that are being exacerbated by globalization and trade barriers. Since the first National Communication, Tuvalu has placed considerable emphasis on addressing climate change vulnerabilities and implementing measures that enhance adaptive capacities by collaborating with different development partners in key sectors including coastal protection, water resources, biodiversity, agriculture, energy, waste management and human health. While more action is needed, Tuvalu is taking proactive steps to pilot and implement projects that respond to its specific needs and concerns relating to vulnerability and adaptation to climate change.
3.1 Coastal Protection
Tuvalu’s inhabited coastline of 82 km has undergone rapid changes due to exploitation of
aggregates such as beach sand and reef coral, and blasting of reef passages or boat channels,
predominantly during WWII. Over time, these have contributed to coastal instability and beach
erosion, which is exacerbated by urbanisation.
In the 1940s, the US forces dredged shipping channels to enable access to Funafuti, Nukufetau and
Nanumea. They also extracted large volumes of sand on Fongafale islet to reclaim land for the
airstrip, leaving massive borrow pits scattered across the islet. In-filling of these pits has been a
priority of the Tuvaluan Government in order to provide additional land and to prevent health and
sanitation issues arising from borrow pits being used for domestic waste disposal. However, the
borrow pits remain unfilled and used as rubbish dumps and as breeding ground for mosquitoes.
Another factor contributing to coastal degradation is the extraction of sand aggregates for
construction activities. Even though mining of sand from beaches is banned, insufficient
enforcement of laws has allowed the practice to continue on some islands. Unmanaged sand
mining has led to beach erosion, which in turn has affected the health of the marine ecosystem.
These factors are being compounded by coastal hazards and the impacts of climate change, with
strong winds, storm surges and king tides further eroding Tuvalu’s coastal zones. Historical
episodes of such coastal hazards have resulted in substantial damage to the government building,
airport and utility infrastructure as evidenced during the King Tides of 2013. The lagoon side of
Funafuti is particularly vulnerable to cyclonic winds and overtopping from storm surges during the
cyclone season between November and April of each year. It is in this area that most of the
country’s critical infrastructure is located, including the government building, hospital, wharf, hotel,
church and primary school.
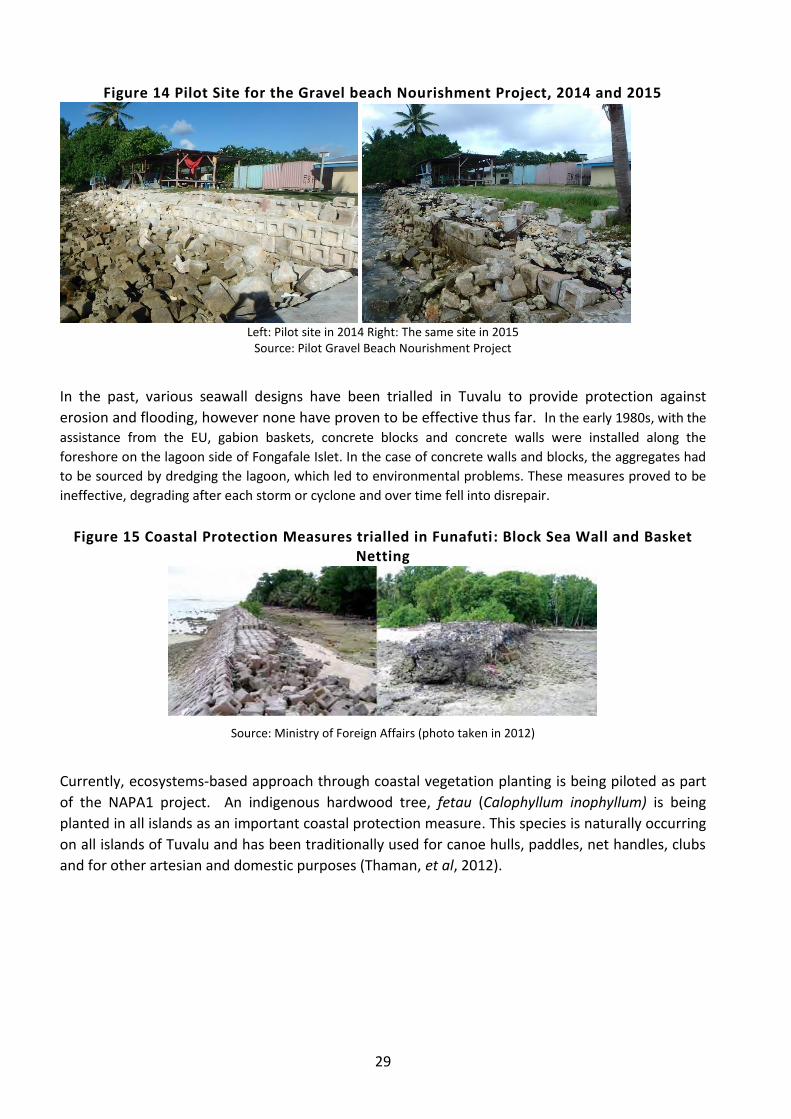
29
Figure 14 Pilot Site for the Gravel beach Nourishment Project, 2014 and 2015
Left: Pilot site in 2014 Right: The same site in 2015
Source: Pilot Gravel Beach Nourishment Project
In the past, various seawall designs have been trialled in Tuvalu to provide protection against
erosion and flooding, however none have proven to be effective thus far. In the early 1980s, with the
assistance from the EU, gabion baskets, concrete blocks and concrete walls were installed along the
foreshore on the lagoon side of Fongafale Islet. In the case of concrete walls and blocks, the aggregates had
to be sourced by dredging the lagoon, which led to environmental problems. These measures proved to be
ineffective, degrading after each storm or cyclone and over time fell into disrepair.
Figure 15 Coastal Protection Measures trialled in Funafuti: Block Sea Wall and Basket Netting
Source: Ministry of Foreign Affairs (photo taken in 2012)
Currently, ecosystems-based approach through coastal vegetation planting is being piloted as part
of the NAPA1 project. An indigenous hardwood tree, fetau (Calophyllum inophyllum) is being
planted in all islands as an important coastal protection measure. This species is naturally occurring
on all islands of Tuvalu and has been traditionally used for canoe hulls, paddles, net handles, clubs
and for other artesian and domestic purposes (Thaman, et al, 2012).
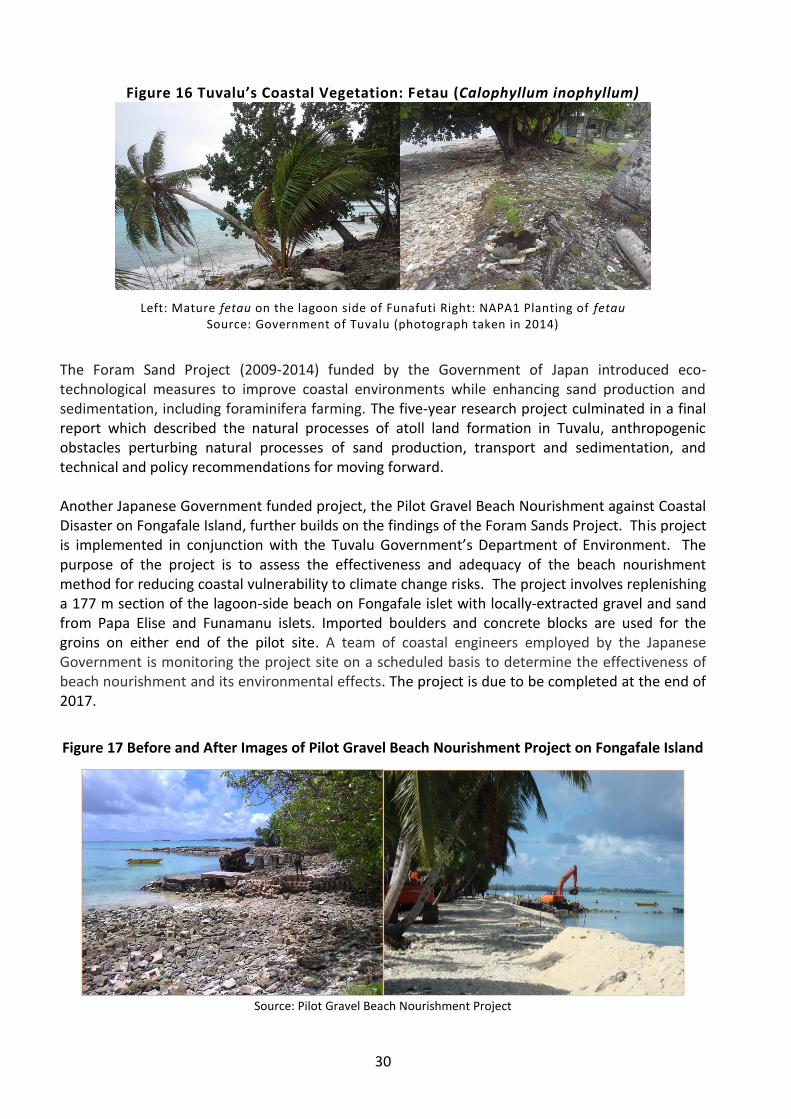
30
Figure 16 Tuvalu’s Coastal Vegetation: Fetau (Calophyllum inophyllum)
Left: Mature fetau on the lagoon side of Funafuti Right: NAPA1 Planting of fetau Source: Government of Tuvalu (photograph taken in 2014)
The Foram Sand Project (2009-2014) funded by the Government of Japan introduced eco-technological measures to improve coastal environments while enhancing sand production and sedimentation, including foraminifera farming. The five-year research project culminated in a final report which described the natural processes of atoll land formation in Tuvalu, anthropogenic obstacles perturbing natural processes of sand production, transport and sedimentation, and technical and policy recommendations for moving forward. Another Japanese Government funded project, the Pilot Gravel Beach Nourishment against Coastal Disaster on Fongafale Island, further builds on the findings of the Foram Sands Project. This project is implemented in conjunction with the Tuvalu Government’s Department of Environment. The purpose of the project is to assess the effectiveness and adequacy of the beach nourishment method for reducing coastal vulnerability to climate change risks. The project involves replenishing a 177 m section of the lagoon-side beach on Fongafale islet with locally-extracted gravel and sand from Papa Elise and Funamanu islets. Imported boulders and concrete blocks are used for the groins on either end of the pilot site. A team of coastal engineers employed by the Japanese Government is monitoring the project site on a scheduled basis to determine the effectiveness of beach nourishment and its environmental effects. The project is due to be completed at the end of 2017.
Figure 17 Before and After Images of Pilot Gravel Beach Nourishment Project on Fongafale Island
Source: Pilot Gravel Beach Nourishment Project
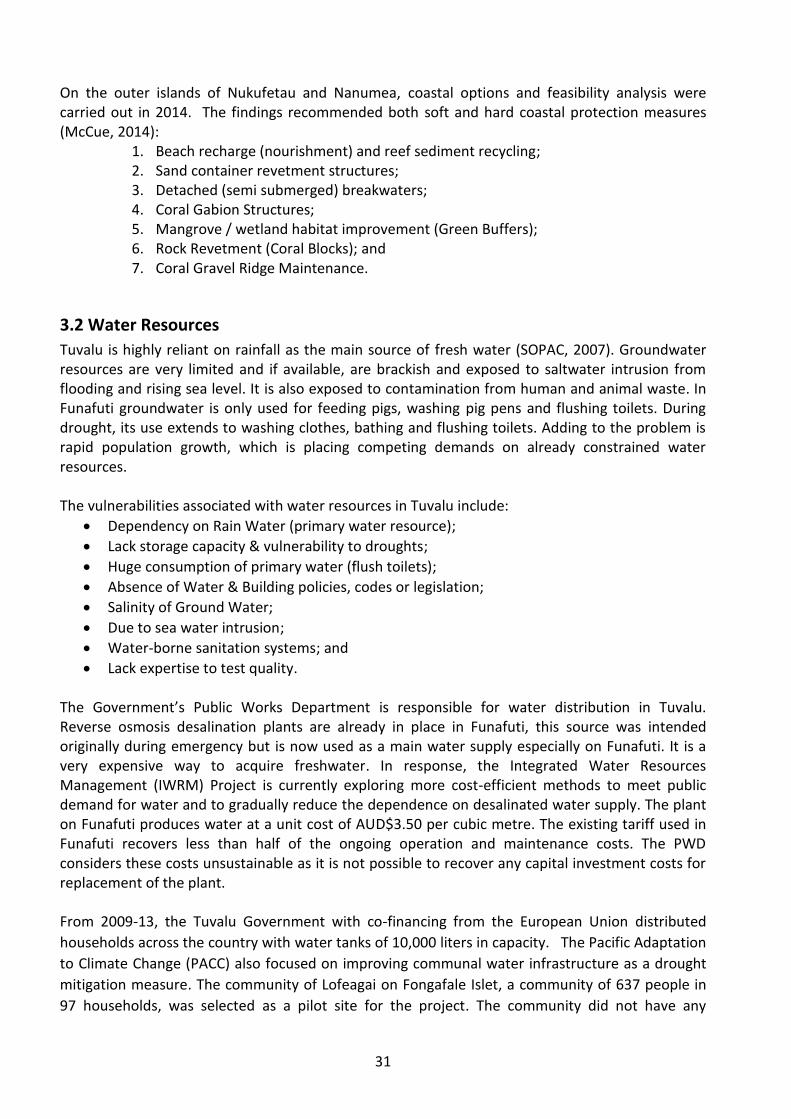
31
On the outer islands of Nukufetau and Nanumea, coastal options and feasibility analysis were carried out in 2014. The findings recommended both soft and hard coastal protection measures (McCue, 2014):
1. Beach recharge (nourishment) and reef sediment recycling; 2. Sand container revetment structures; 3. Detached (semi submerged) breakwaters; 4. Coral Gabion Structures; 5. Mangrove / wetland habitat improvement (Green Buffers); 6. Rock Revetment (Coral Blocks); and 7. Coral Gravel Ridge Maintenance.
3.2 Water Resources
Tuvalu is highly reliant on rainfall as the main source of fresh water (SOPAC, 2007). Groundwater resources are very limited and if available, are brackish and exposed to saltwater intrusion from flooding and rising sea level. It is also exposed to contamination from human and animal waste. In Funafuti groundwater is only used for feeding pigs, washing pig pens and flushing toilets. During drought, its use extends to washing clothes, bathing and flushing toilets. Adding to the problem is rapid population growth, which is placing competing demands on already constrained water resources. The vulnerabilities associated with water resources in Tuvalu include:
Dependency on Rain Water (primary water resource);
Lack storage capacity & vulnerability to droughts;
Huge consumption of primary water (flush toilets);
Absence of Water & Building policies, codes or legislation;
Salinity of Ground Water;
Due to sea water intrusion;
Water-borne sanitation systems; and
Lack expertise to test quality. The Government’s Public Works Department is responsible for water distribution in Tuvalu. Reverse osmosis desalination plants are already in place in Funafuti, this source was intended originally during emergency but is now used as a main water supply especially on Funafuti. It is a very expensive way to acquire freshwater. In response, the Integrated Water Resources Management (IWRM) Project is currently exploring more cost-efficient methods to meet public demand for water and to gradually reduce the dependence on desalinated water supply. The plant on Funafuti produces water at a unit cost of AUD$3.50 per cubic metre. The existing tariff used in Funafuti recovers less than half of the ongoing operation and maintenance costs. The PWD considers these costs unsustainable as it is not possible to recover any capital investment costs for replacement of the plant. From 2009-13, the Tuvalu Government with co-financing from the European Union distributed
households across the country with water tanks of 10,000 liters in capacity. The Pacific Adaptation
to Climate Change (PACC) also focused on improving communal water infrastructure as a drought
mitigation measure. The community of Lofeagai on Fongafale Islet, a community of 637 people in
97 households, was selected as a pilot site for the project. The community did not have any
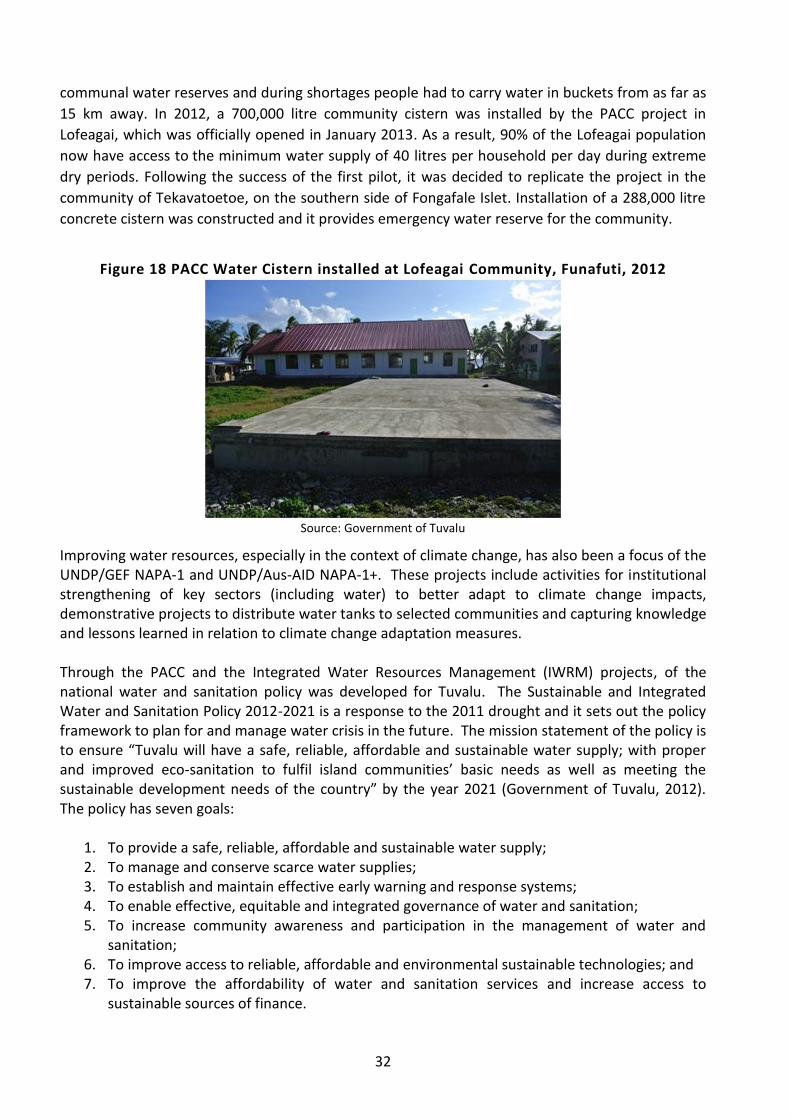
32
communal water reserves and during shortages people had to carry water in buckets from as far as
15 km away. In 2012, a 700,000 litre community cistern was installed by the PACC project in
Lofeagai, which was officially opened in January 2013. As a result, 90% of the Lofeagai population
now have access to the minimum water supply of 40 litres per household per day during extreme
dry periods. Following the success of the first pilot, it was decided to replicate the project in the
community of Tekavatoetoe, on the southern side of Fongafale Islet. Installation of a 288,000 litre
concrete cistern was constructed and it provides emergency water reserve for the community.
Figure 18 PACC Water Cistern installed at Lofeagai Community, Funafuti, 2012
Source: Government of Tuvalu
Improving water resources, especially in the context of climate change, has also been a focus of the UNDP/GEF NAPA-1 and UNDP/Aus-AID NAPA-1+. These projects include activities for institutional strengthening of key sectors (including water) to better adapt to climate change impacts, demonstrative projects to distribute water tanks to selected communities and capturing knowledge and lessons learned in relation to climate change adaptation measures. Through the PACC and the Integrated Water Resources Management (IWRM) projects, of the national water and sanitation policy was developed for Tuvalu. The Sustainable and Integrated Water and Sanitation Policy 2012-2021 is a response to the 2011 drought and it sets out the policy framework to plan for and manage water crisis in the future. The mission statement of the policy is to ensure “Tuvalu will have a safe, reliable, affordable and sustainable water supply; with proper and improved eco-sanitation to fulfil island communities’ basic needs as well as meeting the sustainable development needs of the country” by the year 2021 (Government of Tuvalu, 2012). The policy has seven goals:
1. To provide a safe, reliable, affordable and sustainable water supply; 2. To manage and conserve scarce water supplies; 3. To establish and maintain effective early warning and response systems; 4. To enable effective, equitable and integrated governance of water and sanitation; 5. To increase community awareness and participation in the management of water and
sanitation; 6. To improve access to reliable, affordable and environmental sustainable technologies; and 7. To improve the affordability of water and sanitation services and increase access to
sustainable sources of finance.
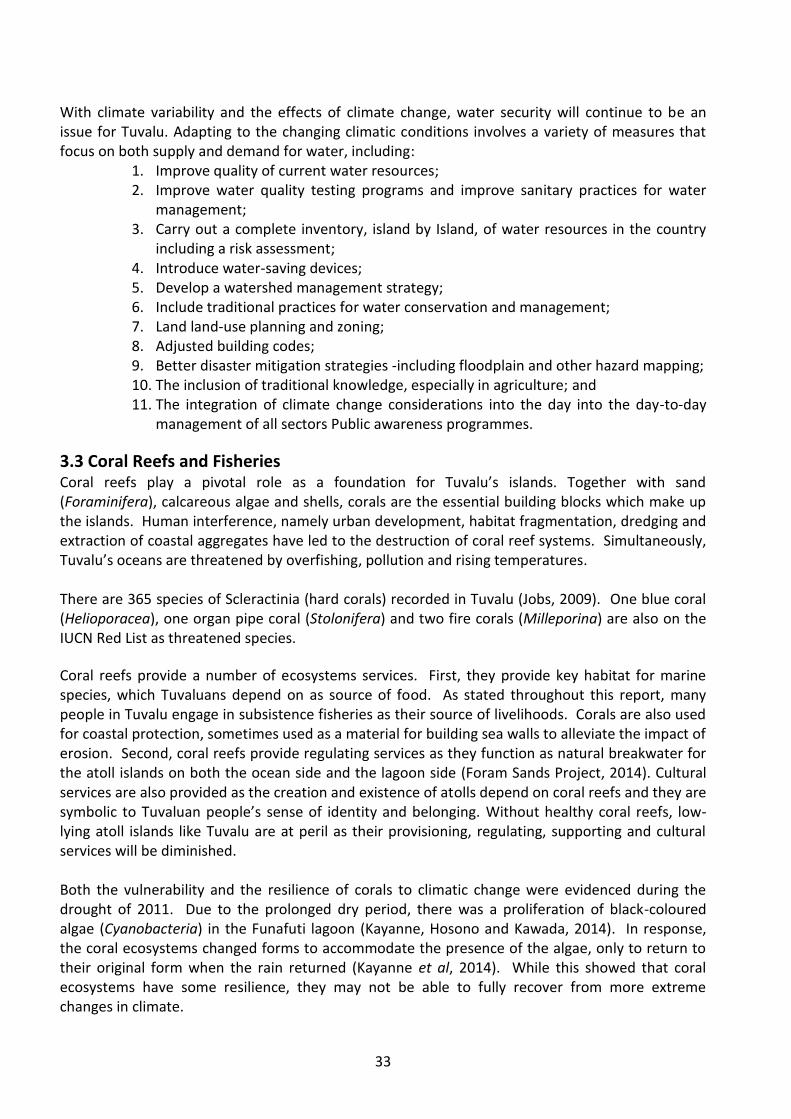
33
With climate variability and the effects of climate change, water security will continue to be an issue for Tuvalu. Adapting to the changing climatic conditions involves a variety of measures that focus on both supply and demand for water, including:
1. Improve quality of current water resources; 2. Improve water quality testing programs and improve sanitary practices for water
management; 3. Carry out a complete inventory, island by Island, of water resources in the country
including a risk assessment; 4. Introduce water-saving devices; 5. Develop a watershed management strategy; 6. Include traditional practices for water conservation and management; 7. Land land-use planning and zoning; 8. Adjusted building codes; 9. Better disaster mitigation strategies -including floodplain and other hazard mapping; 10. The inclusion of traditional knowledge, especially in agriculture; and 11. The integration of climate change considerations into the day into the day-to-day
management of all sectors Public awareness programmes.
3.3 Coral Reefs and Fisheries Coral reefs play a pivotal role as a foundation for Tuvalu’s islands. Together with sand (Foraminifera), calcareous algae and shells, corals are the essential building blocks which make up the islands. Human interference, namely urban development, habitat fragmentation, dredging and extraction of coastal aggregates have led to the destruction of coral reef systems. Simultaneously, Tuvalu’s oceans are threatened by overfishing, pollution and rising temperatures. There are 365 species of Scleractinia (hard corals) recorded in Tuvalu (Jobs, 2009). One blue coral (Helioporacea), one organ pipe coral (Stolonifera) and two fire corals (Milleporina) are also on the IUCN Red List as threatened species.
Coral reefs provide a number of ecosystems services. First, they provide key habitat for marine species, which Tuvaluans depend on as source of food. As stated throughout this report, many people in Tuvalu engage in subsistence fisheries as their source of livelihoods. Corals are also used for coastal protection, sometimes used as a material for building sea walls to alleviate the impact of erosion. Second, coral reefs provide regulating services as they function as natural breakwater for the atoll islands on both the ocean side and the lagoon side (Foram Sands Project, 2014). Cultural services are also provided as the creation and existence of atolls depend on coral reefs and they are symbolic to Tuvaluan people’s sense of identity and belonging. Without healthy coral reefs, low-lying atoll islands like Tuvalu are at peril as their provisioning, regulating, supporting and cultural services will be diminished. Both the vulnerability and the resilience of corals to climatic change were evidenced during the drought of 2011. Due to the prolonged dry period, there was a proliferation of black-coloured algae (Cyanobacteria) in the Funafuti lagoon (Kayanne, Hosono and Kawada, 2014). In response, the coral ecosystems changed forms to accommodate the presence of the algae, only to return to their original form when the rain returned (Kayanne et al, 2014). While this showed that coral ecosystems have some resilience, they may not be able to fully recover from more extreme changes in climate.
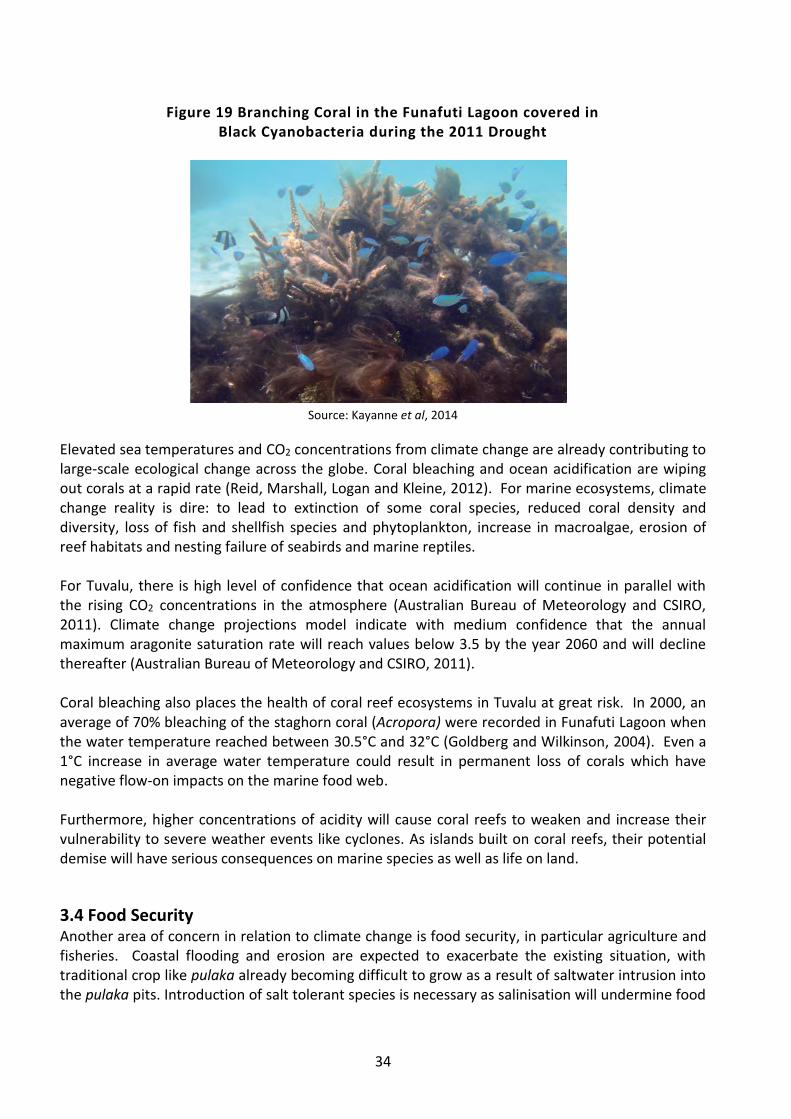
34
Figure 19 Branching Coral in the Funafuti Lagoon covered in
Black Cyanobacteria during the 2011 Drought
Source: Kayanne et al, 2014
Elevated sea temperatures and CO2 concentrations from climate change are already contributing to large-scale ecological change across the globe. Coral bleaching and ocean acidification are wiping out corals at a rapid rate (Reid, Marshall, Logan and Kleine, 2012). For marine ecosystems, climate change reality is dire: to lead to extinction of some coral species, reduced coral density and diversity, loss of fish and shellfish species and phytoplankton, increase in macroalgae, erosion of reef habitats and nesting failure of seabirds and marine reptiles. For Tuvalu, there is high level of confidence that ocean acidification will continue in parallel with the rising CO2 concentrations in the atmosphere (Australian Bureau of Meteorology and CSIRO, 2011). Climate change projections model indicate with medium confidence that the annual maximum aragonite saturation rate will reach values below 3.5 by the year 2060 and will decline thereafter (Australian Bureau of Meteorology and CSIRO, 2011). Coral bleaching also places the health of coral reef ecosystems in Tuvalu at great risk. In 2000, an average of 70% bleaching of the staghorn coral (Acropora) were recorded in Funafuti Lagoon when the water temperature reached between 30.5°C and 32°C (Goldberg and Wilkinson, 2004). Even a 1°C increase in average water temperature could result in permanent loss of corals which have negative flow-on impacts on the marine food web. Furthermore, higher concentrations of acidity will cause coral reefs to weaken and increase their vulnerability to severe weather events like cyclones. As islands built on coral reefs, their potential demise will have serious consequences on marine species as well as life on land.
3.4 Food Security Another area of concern in relation to climate change is food security, in particular agriculture and fisheries. Coastal flooding and erosion are expected to exacerbate the existing situation, with traditional crop like pulaka already becoming difficult to grow as a result of saltwater intrusion into the pulaka pits. Introduction of salt tolerant species is necessary as salinisation will undermine food
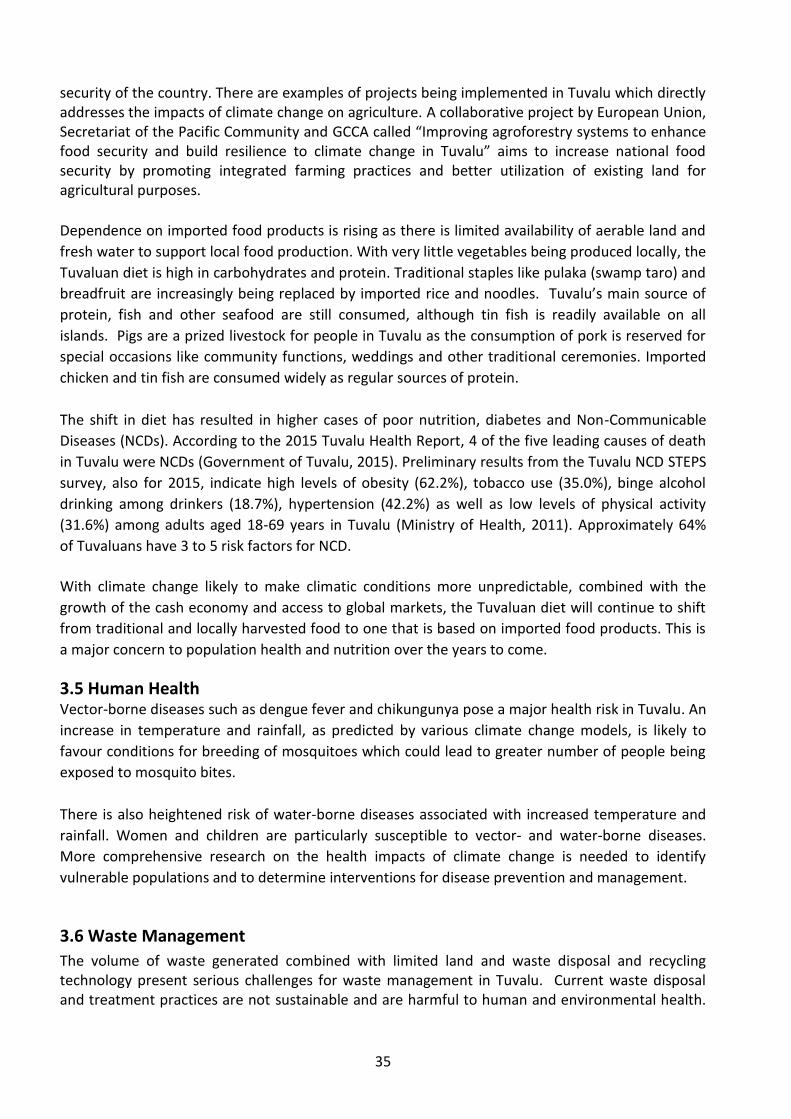
35
security of the country. There are examples of projects being implemented in Tuvalu which directly addresses the impacts of climate change on agriculture. A collaborative project by European Union, Secretariat of the Pacific Community and GCCA called “Improving agroforestry systems to enhance food security and build resilience to climate change in Tuvalu” aims to increase national food security by promoting integrated farming practices and better utilization of existing land for agricultural purposes.
Dependence on imported food products is rising as there is limited availability of aerable land and
fresh water to support local food production. With very little vegetables being produced locally, the
Tuvaluan diet is high in carbohydrates and protein. Traditional staples like pulaka (swamp taro) and
breadfruit are increasingly being replaced by imported rice and noodles. Tuvalu’s main source of
protein, fish and other seafood are still consumed, although tin fish is readily available on all
islands. Pigs are a prized livestock for people in Tuvalu as the consumption of pork is reserved for
special occasions like community functions, weddings and other traditional ceremonies. Imported
chicken and tin fish are consumed widely as regular sources of protein.
The shift in diet has resulted in higher cases of poor nutrition, diabetes and Non-Communicable
Diseases (NCDs). According to the 2015 Tuvalu Health Report, 4 of the five leading causes of death
in Tuvalu were NCDs (Government of Tuvalu, 2015). Preliminary results from the Tuvalu NCD STEPS
survey, also for 2015, indicate high levels of obesity (62.2%), tobacco use (35.0%), binge alcohol
drinking among drinkers (18.7%), hypertension (42.2%) as well as low levels of physical activity
(31.6%) among adults aged 18-69 years in Tuvalu (Ministry of Health, 2011). Approximately 64%
of Tuvaluans have 3 to 5 risk factors for NCD.
With climate change likely to make climatic conditions more unpredictable, combined with the
growth of the cash economy and access to global markets, the Tuvaluan diet will continue to shift
from traditional and locally harvested food to one that is based on imported food products. This is
a major concern to population health and nutrition over the years to come.
3.5 Human Health Vector-borne diseases such as dengue fever and chikungunya pose a major health risk in Tuvalu. An
increase in temperature and rainfall, as predicted by various climate change models, is likely to
favour conditions for breeding of mosquitoes which could lead to greater number of people being
exposed to mosquito bites.
There is also heightened risk of water-borne diseases associated with increased temperature and
rainfall. Women and children are particularly susceptible to vector- and water-borne diseases.
More comprehensive research on the health impacts of climate change is needed to identify
vulnerable populations and to determine interventions for disease prevention and management.
3.6 Waste Management
The volume of waste generated combined with limited land and waste disposal and recycling technology present serious challenges for waste management in Tuvalu. Current waste disposal and treatment practices are not sustainable and are harmful to human and environmental health.
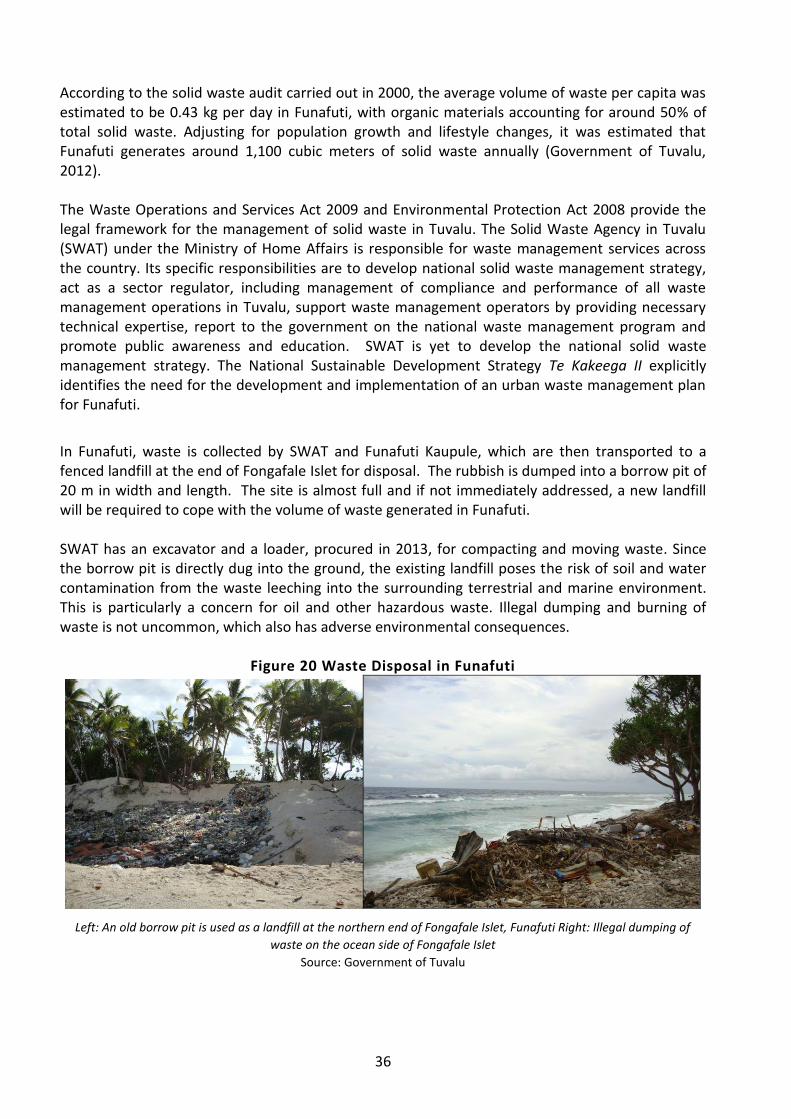
36
According to the solid waste audit carried out in 2000, the average volume of waste per capita was estimated to be 0.43 kg per day in Funafuti, with organic materials accounting for around 50% of total solid waste. Adjusting for population growth and lifestyle changes, it was estimated that Funafuti generates around 1,100 cubic meters of solid waste annually (Government of Tuvalu, 2012). The Waste Operations and Services Act 2009 and Environmental Protection Act 2008 provide the legal framework for the management of solid waste in Tuvalu. The Solid Waste Agency in Tuvalu (SWAT) under the Ministry of Home Affairs is responsible for waste management services across the country. Its specific responsibilities are to develop national solid waste management strategy, act as a sector regulator, including management of compliance and performance of all waste management operations in Tuvalu, support waste management operators by providing necessary technical expertise, report to the government on the national waste management program and promote public awareness and education. SWAT is yet to develop the national solid waste management strategy. The National Sustainable Development Strategy Te Kakeega II explicitly identifies the need for the development and implementation of an urban waste management plan for Funafuti.
In Funafuti, waste is collected by SWAT and Funafuti Kaupule, which are then transported to a fenced landfill at the end of Fongafale Islet for disposal. The rubbish is dumped into a borrow pit of 20 m in width and length. The site is almost full and if not immediately addressed, a new landfill will be required to cope with the volume of waste generated in Funafuti. SWAT has an excavator and a loader, procured in 2013, for compacting and moving waste. Since the borrow pit is directly dug into the ground, the existing landfill poses the risk of soil and water contamination from the waste leeching into the surrounding terrestrial and marine environment. This is particularly a concern for oil and other hazardous waste. Illegal dumping and burning of waste is not uncommon, which also has adverse environmental consequences.
Figure 20 Waste Disposal in Funafuti
Left: An old borrow pit is used as a landfill at the northern end of Fongafale Islet, Funafuti Right: Illegal dumping of
waste on the ocean side of Fongafale Islet
Source: Government of Tuvalu
37
Increasing ocean temperature and changes in ENSO patterns attributed to climate change further compound the stress on the island environment. In 2011 a team of experts conducted an investigation into the proliferation of Sargassum, a canopy-forming brown macroalga, in the nearshore areas of the lagoon coast in Funafuti. This brown algae thrives in areas of high nutrients and low fish grazing. The widespread distribution of Sargassum was found in proximity to densely populated areas on Fongafale Islet. The investigation was found that blooms have a positive correlation with high nitrate levels in the lagoon, opposite the borrow pits settlements, schools, the hospital and hotels (N’Yeart, Vilamu and Vilamu, 2013). These areas might have improper latrines, combined with leaking sewer systems, leaching nutrients into the lagoon and promoting rapid algal growth. Sargassum also prefer shallow areas less than 1 m deep, with hard substratum to attach to. The outbreak of this bloom appeared to also follow a period of drought in 2011, during a La Niña year (also refer to the earlier section on ‘Coral Reefs and Fisheries’). During this time, the residents of Funafuti used well water or lagoon water for washing to conserve the supply of fresh water. The waste water was discharged into the lagoon. Some also used the beach as a latrine which further contributed to high levels of nutrients in the Funafuti lagoon. Without intervention, the continued practice of waste management will have adverse impacts on the fragile island ecosystem already under threat by climate change. An integrated approach that takes into account the waste management needs of all development sectors and addresses the environmental, social and economic costs of poor waste management is critical for Tuvalu to address the issue of waste both now and into the future. This includes the need for improved waste collection services on all islands, regulatory control and enforcement of penalties for illegal dumping and burning of waste, greater public awareness about reducing waste production and the adverse environmental and health impacts of improper waste disposal and the adoption of waste minimization practices such as reducing, reusing and recycling of waste in all sectors which requires behavioural change and the use of new technologies.
38
CHAPTER 4. MITIGATION ANALYSIS The total GHG emission for Tuvalu for the year 2014 is 18.467 Gg CO2-e which contributes to an insignificant share of the global GHG emissions. This is reflective of Tuvalu’s small population as well as its concerted efforts in achieving the objective of the UNFCCC by moving away from fossil fuels and investing in renewable energy. As a small pacific island nation Tuvalu is heavily dependent on foreign oil for electricity production. The oil dependency makes Tuvalu and other Pacific Islands highly vulnerable to oil prices due to the constant oil prices variation, a factor that affects negatively on prices for transport and food and other commodities exported by the country. It is within the electricity sector that most of Tuvalu’s GHG emissions are generated and in response the government, with support from development partners, is undertaking initiatives which enhance the use and uptake of solar energy.
4.1 Institutional Arrangements The institutional arrangements for the energy sector in Tuvalu are divided into policy and program coordination, and service provision. The Department of Energy within the Ministry of Works and Energy is responsible for energy policy development and coordinates renewable energy projects. Established in 1991, the Tuvalu Electricity Corporation (TEC) is a 100% government-owned commercial utility charged with providing a cost-effective and reliable electricity supply to all of the islands of Tuvalu. In 2010, TEC became a fully state-owned enterprise (SOE), with the responsibility of managing and operating grid-connected systems on the eight islands. The ninth island, Niulakita, is not serviced by TEC and uses solar modules.
4.2 Energy Policy The Government’s Department of Energy within the Ministry of Works and Energy develops energy policy and administers renewable energy projects. The national electricity utility company, Tuvalu Electricity Corporation (TEC), is a 100% government-owned commercial utility charged with providing a cost-effective and reliable electricity supply to all of the islands of Tuvalu. The Tuvalu Energy Policy Framework 2007 articulates the strategic priorities for the nation’s energy sector. It states that “Tuvalu shall attain a prosperous living standard that is fostered through an energy policy that promotes the provision of socially, financially, economically, technically, politically, and environmentally sustainable energy systems within the framework of the Tuvalu Initial National Communication under the United Nations Framework on Climate Change” (Government of Tuvalu, 2007). As a successor to the Energy Policy Framework, the National Energy Policy 2009-2023 was endorsed by the Government in 2009. The goal of the policy is to promote the use of renewable energy resources and cost-effective, equitable, reliable, accessible, affordable, secure and environmentally sustainable energy systems to improve the well-being of the people of Tuvalu. The policy identifies 7 strategic areas for implementation:
1. Energy Sector Planning, Coordination and Management; 2. Electricity; 3. Petroleum; 4. Renewable Energy;
39
5. Transport; 6. Environment; and 7. Energy Conservation and Efficiency.
While some progress has been made, the policy is yet to be fully implemented and the institutional capacity and arrangements for the energy sector are still weak. A mid term review of the policy is required to ascertain the status of implementation activities and whether they are advancing towards the achievement of policy vision and goal.
4.3 Renewable Energy In response to the shortage of imported fuel and rising fuel prices, the government commissioned a study into renewable energy in 2006. The purpose of the study was to identify strategies for reducing Tuvalu’s dependence on fossil fuels both now and into the future. The findings of the study revealed the following (Hemstock and Radanne, 2006):
1. Tuvalu’s economy is almost totally dependent on oil; 2. The recent oil shock had particularly devastating effects: not only increases the costs of
imported oil but also the costs of all other imported products as well, including food, household equipment and building materials. These negative economic and social aspects are even more pronounced in the outer islands than on Funafuti;
3. It was clear that any actions aimed at reducing imported oil dependency will help decrease GHG emissions, reduce Tuvalu’s impact on global warming and put Tuvalu on the road of a sustainable and exemplary development, giving the nation a stronger bargaining position in international negotiations; and
4. Renewable energies can bring solutions to the problems highlighted above.
In 2012, the Tuvalu Master Plan for Renewable Energy Electricity and Energy Efficiency was developed and endorsed by the government. This initiative is part of the Tuvalu Energy Sector Development Project and is supported by investments from the World Bank. The objective of the Master Plan is to outline the path for achieving 100% renewable energy in electricity generation by 2020 and to increase energy efficiency on Funafuti by 30% (Government of Tuvalu, 2012). The Master Plan will be further supplemented by:
Pre-feasibility studies for reviewing the technical concepts and economic feasibility, and identify the least-cost options to achieve the stated goals of the plan; and
Feasibility Studies that fully evaluate and confirm the least-cost options identified in the pre-feasibility Studies - including economic feasibility and preparation of a detailed implementation program.
The key priorities for the electricity sector, as outlined in the Master Plan include:
To provide a reliable and affordable electricity supply to all the people of Tuvalu;
To safeguard Tuvalu from future diesel price shocks;
To improve the efficiency of electricity utilisation and further reduce the already low energy consumption per person and per GDP; and
To reduce Tuvalu’s “carbon footprint” and become an international role model with regard to climate change mitigation.
40
In 2008, an alliance of leading energy utilities from the G8 countries; called e8 and the Japanese government, through the Kansai Electric Company (Japan), established a grid-connected 40 kWp solar system on Fongafale. Donor-funded solar energy initiatives have expanded since then, with solar PVs now installed at the desalination plant, government building, Tuvalu Media and Princess Margaret Hospital in Funafuti (see Chapter 1.10 on ‘Energy’). Furthermore, New Zealand, Australia, the EU, Japan and the United Arab Emirates (UAE), have various activities underway to assist Tuvalu’s energy development plan.10 Most of these activities are focused on the replacement of diesel generation with renewable energy technologies. The New Zealand Government is providing funds for the installation of grid connected solar PV in Funafuti. The UAE, through their Masdar initiative, will finance the installation of one additional solar PV. Both projects are expected to be commissioned between mid- 2016 and 2020, TEC’s plan is to install up extra renewable generation capacity each year. The country is currently running a hybrid system: diesel and solar (PV). TEC is expecting that in 2017, 60 percent of the energy production will be generated by solar power. The World Bank is planning to finance a new project to generate electricity using wind power.
4.4 Mitigation Measures for Consideration For Tuvalu to realise its 2020 goal of 100% renewable energy in electricity generation and 30% increase in energy efficiency on Funafuti, there is a need for substantial investment in renewable energy technologies. The government is committed to reductions in GHG emissions despite Tuvalu’s contribution to the global GHG emissions being negligible. According to the Master Plan for Renewable Electricity and Energy Efficiency 2012-2020, an estimated finance of AUD$6.5 million per year from 2013 to 2020 is needed to implement the full package of measures needed to achieve the stated targets (Government of Tuvalu, 2012). The package includes two components: a renewable electricity programme and an energy efficiency programme. For the former, it involves a mix of solar and potentially wind-powered electricity with roof and ground mounted PV arrays for all islands and subject to feasibility studies, the installation of wind turbines in Funafuti (Government of Tuvalu, 2012). Standby diesel generation will still be needed as a back-up to the renewable energy when prolonged weather conditions limit renewable energy generation. Existing diesel generators will be converted or replaced by bio-diesel fuel. For the energy efficiency program, the focus will be on public education, energy audits and technology improvements for Funafuti given the higher energy demand in the capital (Government of Tuvalu, 2012). Table 9 presents potential mitigation measures identified in the Master Plan for Renewable Electricity and Energy Efficiency, the National Energy Policy and the National Sustainable Development Strategy Te Kakeega II and other relevant plans. As will be discussed in the next chapter, financial, technological and technical investment is needed to fully realize Tuvalu’s mitigation efforts.
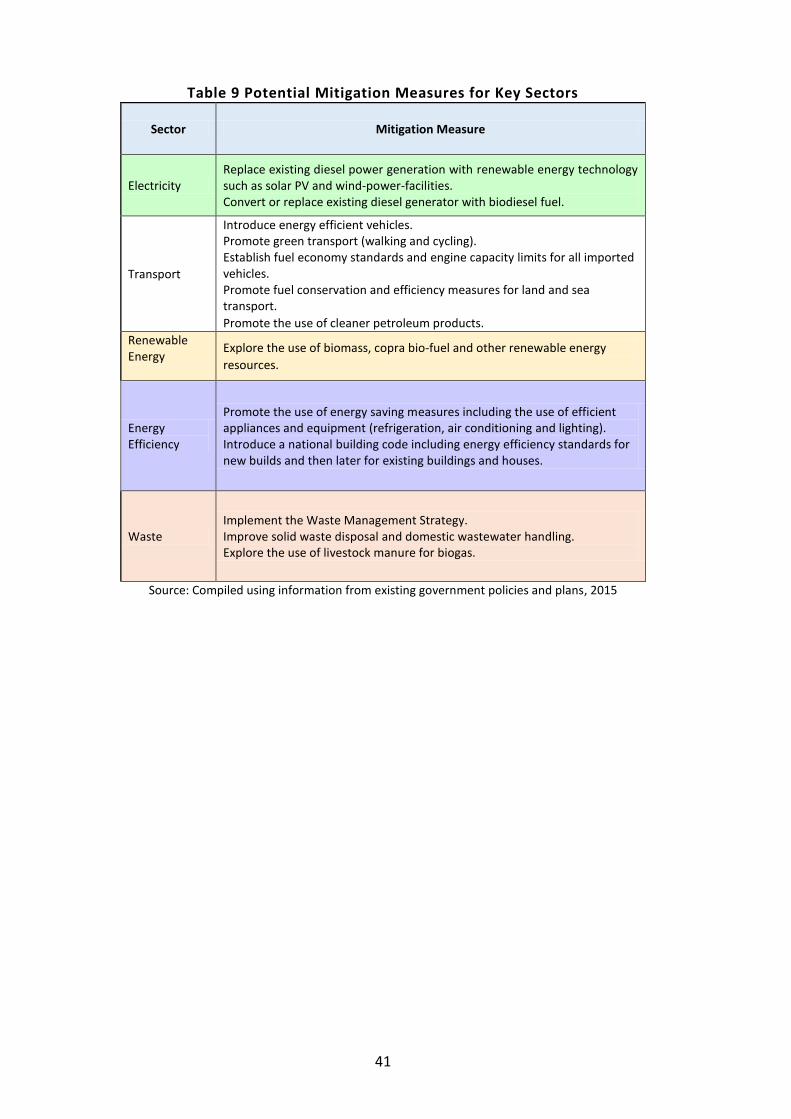
41
Table 9 Potential Mitigation Measures for Key Sectors
Sector Mitigation Measure
Electricity Replace existing diesel power generation with renewable energy technology such as solar PV and wind-power-facilities. Convert or replace existing diesel generator with biodiesel fuel.
Transport
Introduce energy efficient vehicles. Promote green transport (walking and cycling). Establish fuel economy standards and engine capacity limits for all imported vehicles. Promote fuel conservation and efficiency measures for land and sea transport.
Promote the use of cleaner petroleum products.
Renewable Energy
Explore the use of biomass, copra bio-fuel and other renewable energy
resources.
Energy Efficiency
Promote the use of energy saving measures including the use of efficient appliances and equipment (refrigeration, air conditioning and lighting). Introduce a national building code including energy efficiency standards for new builds and then later for existing buildings and houses.
Waste Implement the Waste Management Strategy. Improve solid waste disposal and domestic wastewater handling. Explore the use of livestock manure for biogas.
Source: Compiled using information from existing government policies and plans, 2015
42
CHAPTER 5. OTHER INFORMATION This chapter provides an overview of issues, challenges and priorities for technology transfer, climate change research, education, training and public awareness, capacity building, and data availability and gaps.
5.1 Technology Transfer Tuvalu has not submitted a Technology Needs Assessment to the UNFCCC. However, various studies and reports document electricity generation, coastal engineering and waste management as priorities for technology transfer. As stated in the earlier sections, Tuvalu is aiming to achieve 100% renewable energy in electricity generation by 2020. To date, donor funding from New Zealand, Australia, the EU, Japan and UAE have provided much needed support for Tuvalu to move away from diesel-based electricity generation and towards the use of renewable energy. The installation and operation of solar PV in Funafuti and the outer islands has been a major accomplishment through donor-assisted technology transfer. Further support for solar energy generation and storage, demand side management, co-generation as well as energy efficiency and conservation for both domestic and commercial sectors are needed to fully realize commitment to renewable energy and GHG emission reduction. Other renewable energy technologies, such as wind and wave energy generation also need to be examined for Tuvalu.
For coastal engineering, priority is placed on structural and ecological technologies to protect Tuvalu’s coastlines from erosion, flooding and sea level rise. The Japanese Government is currently supporting a beach nourishment project in Funafuti to pilot an ecological approach in reducing coastal erosion. The project will be completed in 2017 thus it is too premature to determine the effectiveness of this approach. Although different types of hard coastal protection measures have been trialled in the past, none have proven to be indisputably effective nor have they lasted enough to demonstrate their sustainability over the long term. A more site-specific measure that takes into account the geological foundations of atoll islands, natural sand movements and wave transformation patterns are needed for all islands. As discussed in earlier chapters, unsustainable waste management contributes towards many environmental and health problems in Tuvalu. Technologies for treatment of solid and liquid waste, and recycling are urgently needed to alleviate the stress on the environment and in turn enhance the ecosystems resilience to the impacts of climate change. On-site waste treatment technologies for solid and liquid waste, along with regional and international cooperation in reverse transfer of waste to the source of production and in accessing the global recycling market would assist Tuvalu deal with the challenges of waste. Without intervention, the ecological health of the island is at stake and the aggregated emissions from the waste sector (CH4 and N2O in particular) will unlikely to be curtailed. Tuvalu faces a number of barriers to access technology identified above. These barriers include high upfront capital costs, lack of investment capital and financing instruments, shortage of land (for infrastructure development), absence of scientific research and information relevant to Tuvalu’s context, and the inability to recover costs for the operation of such technologies due to its
43
small population and limited national revenue. Lack of technical know-how in installing, maintaining and repairing technologies is also an important factor to be considered for the technology transfer.
5.2 Climate Change Research
Scientific research on climate change in Tuvalu is extremely limited. Understanding climate change processes, trends and impacts requires accurate and reliable set of data, and evidence-based research. Without these, it is a challenge to make informed decisions about what courses of action should be taken to plan for, respond to and manage climate change and disaster risks. Some of the major climate change-related research undertaken in Tuvalu by donor agencies in partnership with the Tuvalu Government includes:
Pacific Climate Change Science Program 2009-2011. Funded by the Australian Government, the PCCSP is a research partnership between the Australian Government agencies, East Timor and 14 Pacific countries (Cook Islands, Federated States of Micronesia, Fiji, Kiribati, Marshall Islands, Nauru, Niue, Palau, Papua New Guinea, Samoa, Solomon Islands, Tonga, Tuvalu and Vanuatu). The program’s objectives were to provide in-depth information and research on past, present and future climate, build the capacity of national meteorological services and scientific organisations to undertake scientific research, disseminate climate information to stakeholders. In Tuvalu, the project was implemented through the Tuvalu Meteorological Service.
Pacific-Australia Climate Change Science Adaptation Planning Program 2011–14. Building on the PCCSP, the Australian Bureau of Meteorology and CSIRO conducted a variety of science, communication and capacity building activities to improve understanding of climate science. The project was implemented through the Tuvalu Meteorological Service.
Foram Sands Project 2009-2014. This research project was carried out by the University of Tokyo under the Science and Technology Research Partnership for Sustainable Development funded by the Japanese Government through JICA. The Department of Environment was the implementing partner for the project. The research focused on eco-technological management of sea level rise, through a scientific investigation of foram sands (Foraminifera) and its production, transport and sedimentation in Fongafale.
Existing and past climate change research concentrate on Funafuti and at the national level, with significant gaps in scientific data (including longitudinal data) that are sector-, island- and site-specific to build a more complete picture of climate change issues across the country and to inform policy and program development, climate change planning and decision making. Limited donor and national funding dedicated to scientific research, lack of research equipment and facilities, and lack of locally-based qualified research professionals are constraints to climate change research in Tuvalu.
44
5.3 Education, Training and Public Awareness
Tuvalu’s plight with climate change has received significant media attention from around the world. There are numerous documentaries, television programs and news articles on the climate change situation in Tuvalu. The challenge, however, remains at enhancing awareness among Tuvaluans about the causes and impacts of climate change, and to understand the implications of climate science on people’s lives now and into the future. With the islands being very spread out and infrequency of inter-island shipping services, communication and information sharing between the capital of Funafuti and the outer islands is a major challenge. The Tuvalu Media Department broadcasts daily news and weather bulletins to all islands. This is the only form of media which connects all outer islands with Funafuti. As such, the radio has been used by multiple agencies and projects to communicate information on climate change. Most radio programs have been project-specific thus intermittent, with no regular continual programs on climate change. Visits to the outer islands to conduct consultation and information sessions have been carried out by different projects at different points in time. The difficulty is to provide consistent information to all islands in order to avoid confusion or misinterpretation. Consistency also extends to using the correct translation of climate change terminology to ensure people understand what is being communicated. At present, there is no agreed Tuvaluan glossary of climate change concepts. For climate change education, steps have been taken to incorporate climate change into the school curriculum. Through the Climate Change Education for Sustainable Development program in 2014, the UN Educational, Scientific and Cultural Organization (UNESCO) worked with the Tuvalu Government’s Education Department to enhance capacity in the areas of: education policy and planning; curriculum development; teacher training; reforming and greening technical, vocational education and training (TVET) programmes; and developing education plans and programmes for disaster preparedness. The program is also integrating climate change and environmentally sustainable development principles into the curriculum by developing a culturally-relevant book of stories and reading toolkit that can be used in the classroom to engage and educate Tuvaluan children about climate change. Further work will be carried out by the Education Department to ascertain whether climate change should be made as a standalone subject for all levels.
Education, training and public awareness on climate change remain high on the national agenda. Greater understanding and awareness of climate change among communities in Tuvalu will be achieved through a broad range of mediums, including radio programs, publication of awareness materials, essay and poster competitions, national workshops and community outreach. Government departments, donor partners, academia, faith-based organisations and civil society will all play a leading role in educating the wider public about climate change.
5.4 Capacity Building The Tuvalu National Adaptation Programme of Action (NAPA) prepared in 2007 identifies lack of institutional capacity as a factor for Tuvalu’s vulnerability to adverse impacts of climate change
45
(Department of Environment, 2007). Through numerous climate change projects, institutional capacity has been strengthened across the development sector. Being a small country with an equally small civil service, coordination and collaboration between government agencies are more widely practiced than other larger countries. The establishment of the Climate Change Unit within the Office of the Prime Minister in May 2015 has also cemented the importance that the government places on national coordination and on climate change as a development priority. The Climate Change Unit provides secretariat support to the National Advisory Council on Climate Change (NACCC) which is guided by a Terms of Reference and provides strategic oversight for all climate change-related policies and projects at the national level. The membership of NACCC comprises of representatives from relevant government departments, private sector and civil society organisations. Between 2000 and 2015, more than 30 climate change projects have been initiated or implemented in Tuvalu. These can be found in Appendix B.
The area requiring further strengthening is technical capacity in climate change science, adaptation and mitigation. Limited pool of qualified and trained professionals in Tuvalu, shortage of staff within government departments and high turnover of staff (mainly due to duty travel or overseas training and education) are some constraints associated with lack of technical capacity within the country. Specific areas for capacity development include:
Technical assessment, reporting and proposal writing;
Climate change research for all sectors (i.e. agriculture, health, environment, fisheries, etc);
Meteorological observation including trend analysis, forecasting and interpretation of data;
Coastal protection, coastal zone management and erosion control;
Monitoring of coral ecosystems and water quality;
Spatial mapping of sea level rise, erosion, inundation and other climate change impacts;
Mitigation assessment, GHG accounting and energy efficiency analysis;
Climate-proofing design of coastal infrastructure;
Multi-hazard early warning systems;
Disaster risk management and disaster risk reduction;
Environmental and social impact assessments; and
Gender analysis of climate change adaptation and mitigation projects.
5.5 Data Availability and Gaps
Preparing this SNC was a challenging process for Tuvalu. Data required for the compilation of SNC was scarce and out-dated. Lack of systematic documentation, information sharing and knowledge management was a common hurdle faced when completing all sections of the SNC. This was especially the case for Chapter 2 on the GHG Inventory where complete and up-to-date data was not readily available. The gaps and constraints identified throughout the process in preparing the SNC include:
Accurate and reliable data is either absent or limited across all sectors;
Project reports and publications are not always available in-country due to documents not being saved in a central system and due to the high turnover of staff;
46
Data is not updated; and
Not all data and reports are available in e-copy to prevent them from being lost or recovered.
To improve subsequent communication reports, the following areas need specific attention:
Collation, analysis, storage and updating of all data necessary for reporting to the UNFCCC Secretariat;
Consistency and completeness of data, particularly for the GHG inventory to enable sufficient analysis and comparisons;
Centralised information management system for government departments to store and share climate change- related legislation, policies, projects and program documentation;
Promotion of information and knowledge sharing among relevant departments, donors and external organisations involved in climate change adaptation and mitigation;
Clear institutional arrangements, including defined roles and responsibilities for the national communication reports and other climate change related projects; and
The establishment of a nationally-led, inter-agency technical team to oversee the development of national communication reports.
47
BIBLIOGRAPHY Asian Development Bank. 2005. Effective Solid Waste Management & Recycling in Tuvalu. Australian Bureau of Meteorlogy and CSIRO. 2011. Climate Change in the Pacific: Scientific Assessment and New Research. Volume 1: Regional Overview. Volume 2: Country Reports. Melbourne, Australia: National Library of Australia.
Australian Bureau of Meteorology. 2015. ‘Southern Hemisphere Tropical Cyclone Data Portal: Funafuti, Tuvalu’. Available at: http://www.bom.gov.au/cyclone/history/tracks/ Binger, A. 2003. Exploratory Report Preliminary Assessment of Capacity Building Needs for Sustainable Development/Vulnerability Reduction in Tuvalu. Final Draft, Ministry of Finance, Government of Tuvalu. Christensen, J.H., K. Krishna Kumar, E. Aldrian, S.-I. An, I.F.A. Cavalcanti, M. de Castro, W. Dong, P. Goswami, A. Hall, J.K. Kanyanga, A. Kitoh, J. Kossin, N.-C. Lau, J. Renwick, D.B. Stephenson, S.-P. Xie and T. Zhou. 2013. Climate Phenomena and their Relevance for Future Regional Climate Change. In Stocker, T.F., D. Qin, G.-K. Plattner, M. Tignor, S.K. Allen, J. Boschung, A. Nauels, Y. Xia, V. Bex and P.M. Midgley (eds). Climate Change 2013: The Physical Science Basis. Contribution of Working Group I to the Fifth Assessment Report of the Intergovernmental Panel on Climate Change. Cambridge, United Kingdom: Cambridge University Press. CITES. 2014. Checklist of Convention on International Trade in Endangered Species of Wild Fauna and Flora (CITES) species. Available at: www.checklist.cites.org De Ramon, N., Viliamu, A. and Viliamu, I. 2013. Assessment of a seaweed bloom issue on Funafuti atoll and associated solutions: conducting awareness sessions for the local communities. Professional and Technical Reports. (Unpublished). Department of Environment. 2007. Tuvalu’s National Adaptation Programme of Action. e8 Tuvalu Solar Power Project. 2009. Decreasing Reliance on Fuel and Enhancing Renewable Energy-Based Electrification in the Small Island State of Tuvalu The Tuvalu Solar Power Project. EEA. 2007. EMEP/CORINAIR Emission Inventory Guidebook. EEA Technical report No 12/2013, European Environment Agency. FAO. 2010. Global Forest Resources Assessment: Country Reports, Tuvalu. Rome: Forestry Department, Food and Agriculture Organization of the United Nations. FAO. 2011. Selected Indicator of Food and Agricultural Development in the Asia-Pacific Region 2000-2010. RAP Publication. Bangkok: Food and Agriculture Organization of the United Nations. Fisheries Department. 2015. Annual Report to the Commission Part 1: Information on Fisheries, Research and Statistics. Report submitted to the Western and Central Pacific Fisheries Commission.
48
Available from: https://www.wcpfc.int/system/files/AR-CCM-26%20Tuvalu%20AR%20Part%201%20Rev%201.pdf Foram Sands Project. 2014. Final Report of Eco-Technological Management of Tuvalu against Sea Level Rise. Goldberg, J. and Wilkinson, C. ‘Global Threats to Coral Reefs: Coral Bleaching, Global Climate Change, Disease, Predator Plagues and Invasive Species,’ pp.67-92. In C. Wilkinson (ed.). Status of coral reefs of the world: 2004. Volume 2. Townsville, Australia: Australian Institute of Marine Science. Government of Tuvalu. 1999. Tuvalu Initial National Communication. Government of Tuvalu. 2002. Tuvalu National Population and Housing Census 2002. Government of Tuvalu. 2005. Te Kakeega II: Tuvalu National Strategy for Sustainable Development 2005-2015. Government of Tuvalu. 2007. Tuvalu Energy Policy Framework. Government of Tuvalu. 2009. Tuvalu National Energy Policy 2009-2023. Government of Tuvalu. 2012. Sustainable and Integrated Water and Sanitation Policy 2012-2021. Government of Tuvalu. 2012. Tuvalu Infrastructure Strategy and Investment Plan. Government of Tuvalu. 2012. Te Kaniva: National Climate Change Policy 2012-2021. Government of Tuvalu. 2012. Enetise Tutumau 2012-2020. Master Plan for Renewable Electricity and Energy Efficiency in Tuvalu. Government of Tuvalu. 2014. Fifth National Report to the United Nations Convention on Biological Diversity (CBD). Government of Tuvalu. 2014. Tuvalu National Population and Housing Census 2012 Basic Tables. Government of Tuvalu. 2015. Tuvalu Health Report. Government of Tuvalu. 2015. Tuvalu Tropical Cyclone Pam Recovery and Vulnerability Reduction Plan. Hemstock, S., and Radanne, P. 2006. Tuvalu Renewable Energy Study: Final Report. ICEPT/EPMG. 2003. Individual Country Biomass Resource assessment Profiles for: Fiji, Kiribati, Samoa, Tonga and Tuvalu. London, UK: ICEPT/EPMG Imperial College London. International Union for the Conservation of Nature. 2015. Red List of Threatened Species. Available at: http://www.iucnredlist.org/
49
IPCC. 1997. Revised 1996 IPCC Guidelines for National Greenhouse Gas Inventories, Volumes 1–3. IPCC. 1999. Aviation and the Global Atmosphere. A Special Report of IPCC Working Groups I and III. Intergovernmental Panel on Climate Change. IPCC. 2000. Good Practice Guidance and Uncertainty Management in National Greenhouse Gas Inventories. IPCC. 2003. Good Practice Guidance for Land Use, Land Use Change and Forestry. IPCC. 2006. IPCC Guidelines for National Greenhouse Gas Inventories, Volumes I, II, III, IV, V. IPCC. 2014. Climate Change 2014: Synthesis Report. Contribution of Working Groups I, II and III to the Fifth Assessment Report of the Intergovernmental Panel on Climate Change [Core Writing Team, R.K. Pachauri and L.A. Meyer (eds.)]. IPCC, Geneva, Switzerland, 151 pp. Isala, T. ‘Secession and Independence’. In Laracy, H (ed). 1983. Tuvalu: A History. Suva, Fiji: Institute of Pacific Studies. Job, S. 2009. Tuvalu Marine Life Project. Phase 1: Literature Review. Available at: http://www.alofatuvalu.tv/US/05_a_tuvalu/05_sandr_juillet09.pdf Kayanne, H., Hosono, T. and Kawada, A. 2014. The Coastal Ecosystem in Tuvalu and Geo-ecological Management against Sea-Level Rise. Keener, V. 2012. Climate Change and Pacific Islands: Indicators and Impacts: Report for the 2012 Pacific Islands Regional Climate Assessment (PIRCA). Kofe, L. ‘Palagi and Pastors’. In Laracy, H (ed). 1983. Tuvalu: A History. Suva, Fiji: Institute of Pacific Studies. Lal, P., Saloa, K. and Uili, F. 2006. Economics of Liquid Waste Management in Funafuti. Tuvalu-IW Pacific Technical Report (International Waters Project). Laracy, H. 1983. Tuvalu: A History. Suva, Fiji: Institute of Pacific Studies. Lovell, E., Skyes, H., Deiye, M., Wantiez, L., Garrigue, C., Virly, S., Samuelu, J., Solofa, A., Poulasi, T., Pakoa, K., Sabetian. A., Afzal, D., Hughes, A., and Sulu, R. 2004. ‘ Status of Coral Reefs in the South West Pacific: Fiji, Nauru, New Caledonia, Samoa, Solomon Islands, Tuvalu and Vanuatu,’ pp.337-362. In C. Wilkinson (ed.). Status of coral reefs of the world: 2004. Volume 2. Townsville, Australia: Australian Institute of Marine Science. McCubbin, S. 2014. Where does-climate fit? Vulnerability to climate change in the context of multiple stressors in Funafuti, Tuvalu. McCue, J. 2014. Increasing Resilience of Coastal Areas and Community Settlements to Climate Change: Coastal Options and Feasibility Report – Nukufetau and Nanumea. Report prepared for
50
Sustainable Sea, Australian Aid, NAPA Tuvalu, United Nations Development Programme and the Government of Tuvalu. Ministry of Health. 2011. Tuvalu National Strategic Plan for Non Communicable Diseases 2011-2015. Reid, C., Marshall, J., Logan, D. and Kleine, D. 2012. Coral Reefs and Climate Change: The Guide for Eudcation and Awareness. Second edition.ed Angela Dean). Brisbane: Coral Watch, The University of Queensland. Rosillo, F. and Woods, J. 2003. Individual country biomass resource assessment profiles for: Fiji, Kiribaty, Samoa, Tonga, Tuvalu, Vanuatu, Prepared for SOPAC-South Pacific Applied Geoscience Commission. Secretariat of the Pacific Community. 2013. Pacific Island Populations Data. Secretariat of the Pacific Community. 2013. Stocktake of the Gender Mainstreaming Capacity of Pacific Island Governments Tuvalu. Secretariat of the Pacific Community, SPREP, GIZ, UN Women, PACC, Australian Aid, UNDP and Gender CC. 2015. Pacific Gender and Climate Change Toolkit: Tools for Practitioners. Secretariat of the Pacific Community. 2015. Tuvalu: Fisheries. Available at: www.spc.int/DigitalLibrary/Doc/FAME/.../Gillett_16_BenefishX_18_Tuvalu.pdf SPREP. 2005. Pacific Regional Energy Assessment 2004, Tuvalu National Report, Volume 15. The Pacific Islands Renewable Energy Project (PIREP). Stege. G. A, 2009. ‘Methane to Markets, Modelo Mexicano de Biogás – Versión 2’. SCS Engineers, Guadalajara, Jalisco, 26 de marzo de 2009, 35 pp. Telavi, M. (1983). ‘War’. In Laracy, H (ed). 1983. Tuvalu: A History. Suva, Fiji: Institute of Pacific Studies. Thaman, R., Fihaki, E. and Fong, T. 2012. Plants of Tuvalu. Lakau mo Mouku o Tuvalu: A Guide to Indigenous and Introduced Plants of Tuvalu. Suva, Fiji: The University of the South Pacific Press. UNFCCC. undated. Handbook on Building Sustainable National Greenhouse Gas Inventory Management Systems. Consultative Group of Experts on National Communications from Parties not included in Annex I to the Convention. UNFCCC. 2005. Key GHG Data. Greenhouse Gas Emissions Data 1990-2003. World Bank. 2014. International Development Association Project Appraisal Document On A Proposed Grant A Proposed Small Island Developing States Initiative Grant For An Energy Sector Development Project. Available at: http://documents.worldbank.org/curated/en/519561468102907968/pdf/PAD6620PAD0P140010Box385398B0OUO090.pdf

51
World Bank. 2015. ‘World Development Indicators: Tuvalu’. Available at: http://databank.worldbank.org/data/reports.aspx?source=2&country=TUV&series=&period=#
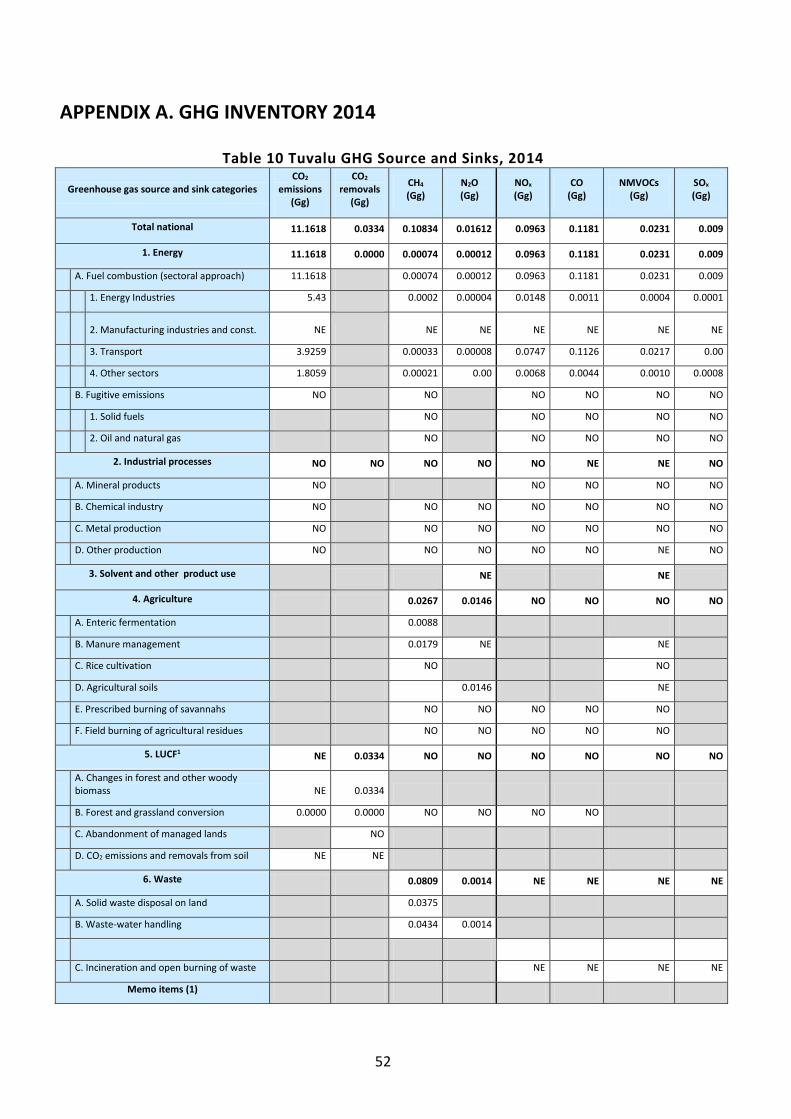
52
APPENDIX A. GHG INVENTORY 2014
Table 10 Tuvalu GHG Source and Sinks, 2014
Greenhouse gas source and sink categories CO2
emissions (Gg)
CO2 removals
(Gg)
CH4 (Gg)
N2O (Gg)
NOx (Gg)
CO (Gg)
NMVOCs (Gg)
SOx (Gg)
Total national 11.1618 0.0334 0.10834 0.01612 0.0963 0.1181 0.0231 0.009
1. Energy 11.1618 0.0000 0.00074 0.00012 0.0963 0.1181 0.0231 0.009
A. Fuel combustion (sectoral approach) 11.1618 0.00074 0.00012 0.0963 0.1181 0.0231 0.009
1. Energy Industries 5.43 0.0002 0.00004 0.0148 0.0011 0.0004 0.0001
2. Manufacturing industries and const. NE NE NE NE NE NE NE
3. Transport 3.9259 0.00033 0.00008 0.0747 0.1126 0.0217 0.00
4. Other sectors 1.8059 0.00021 0.00 0.0068 0.0044 0.0010 0.0008
B. Fugitive emissions NO NO NO NO NO NO
1. Solid fuels NO NO NO NO NO
2. Oil and natural gas NO NO NO NO NO
2. Industrial processes NO NO NO NO NO NE NE NO
A. Mineral products NO NO NO NO NO
B. Chemical industry NO NO NO NO NO NO NO
C. Metal production NO NO NO NO NO NO NO
D. Other production NO NO NO NO NO NE NO
3. Solvent and other product use
NE NE
4. Agriculture 0.0267 0.0146 NO NO NO NO
A. Enteric fermentation 0.0088
B. Manure management 0.0179 NE NE
C. Rice cultivation NO NO
D. Agricultural soils 0.0146 NE
E. Prescribed burning of savannahs NO NO NO NO NO
F. Field burning of agricultural residues NO NO NO NO NO
5. LUCF1 NE 0.0334 NO NO NO NO NO NO
A. Changes in forest and other woody biomass NE 0.0334
B. Forest and grassland conversion 0.0000 0.0000 NO NO NO NO
C. Abandonment of managed lands NO
D. CO2 emissions and removals from soil NE NE
6. Waste 0.0809 0.0014 NE NE NE NE
A. Solid waste disposal on land 0.0375
B. Waste-water handling 0.0434 0.0014
C. Incineration and open burning of waste NE NE NE NE
Memo items (1)
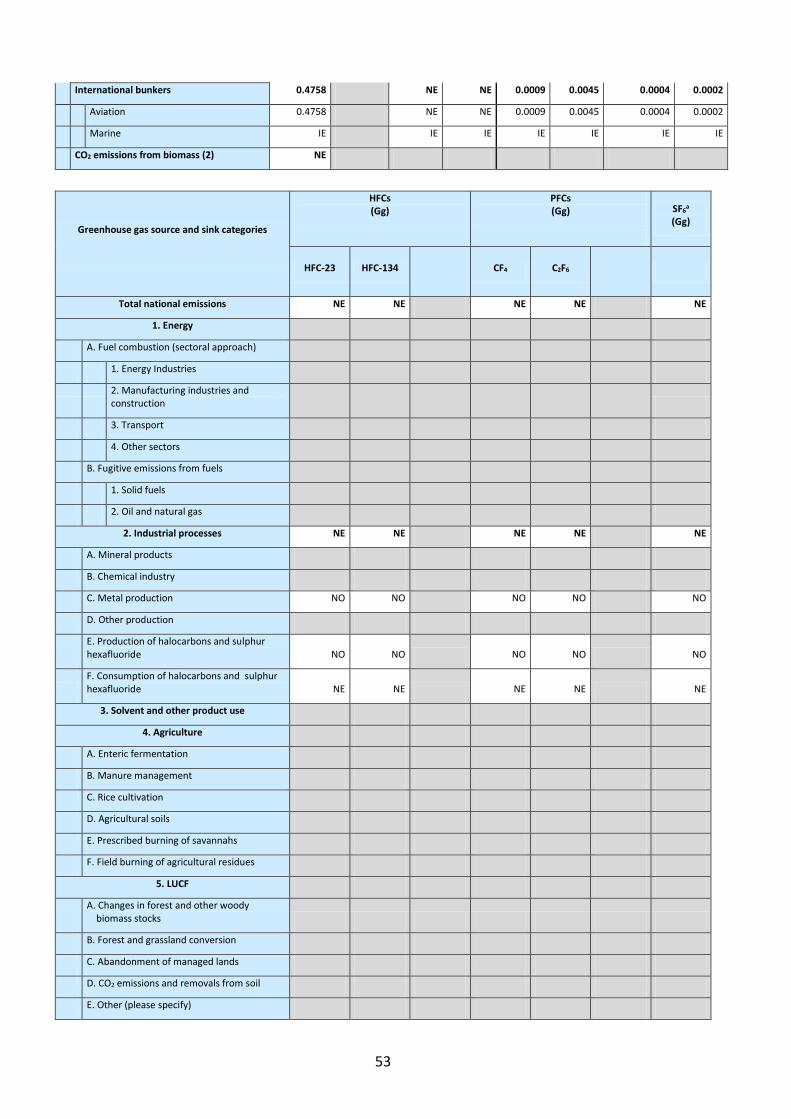
53
International bunkers 0.4758 NE NE 0.0009 0.0045 0.0004 0.0002
Aviation 0.4758 NE NE 0.0009 0.0045 0.0004 0.0002
Marine IE IE IE IE IE IE IE
CO2 emissions from biomass (2) NE
Greenhouse gas source and sink categories
HFCs (Gg)
PFCs (Gg)
SF6a
(Gg)
HFC-23 HFC-134
CF4 C2F6
Total national emissions NE NE NE NE NE
1. Energy
A. Fuel combustion (sectoral approach)
1. Energy Industries
2. Manufacturing industries and construction
3. Transport
4. Other sectors
B. Fugitive emissions from fuels
1. Solid fuels
2. Oil and natural gas
2. Industrial processes NE NE NE NE NE
A. Mineral products
B. Chemical industry
C. Metal production NO NO NO NO NO
D. Other production
E. Production of halocarbons and sulphur hexafluoride NO NO NO NO NO
F. Consumption of halocarbons and sulphur hexafluoride NE NE NE NE NE
3. Solvent and other product use
4. Agriculture
A. Enteric fermentation
B. Manure management
C. Rice cultivation
D. Agricultural soils
E. Prescribed burning of savannahs
F. Field burning of agricultural residues
5. LUCF
A. Changes in forest and other woody biomass stocks
B. Forest and grassland conversion
C. Abandonment of managed lands
D. CO2 emissions and removals from soil
E. Other (please specify)
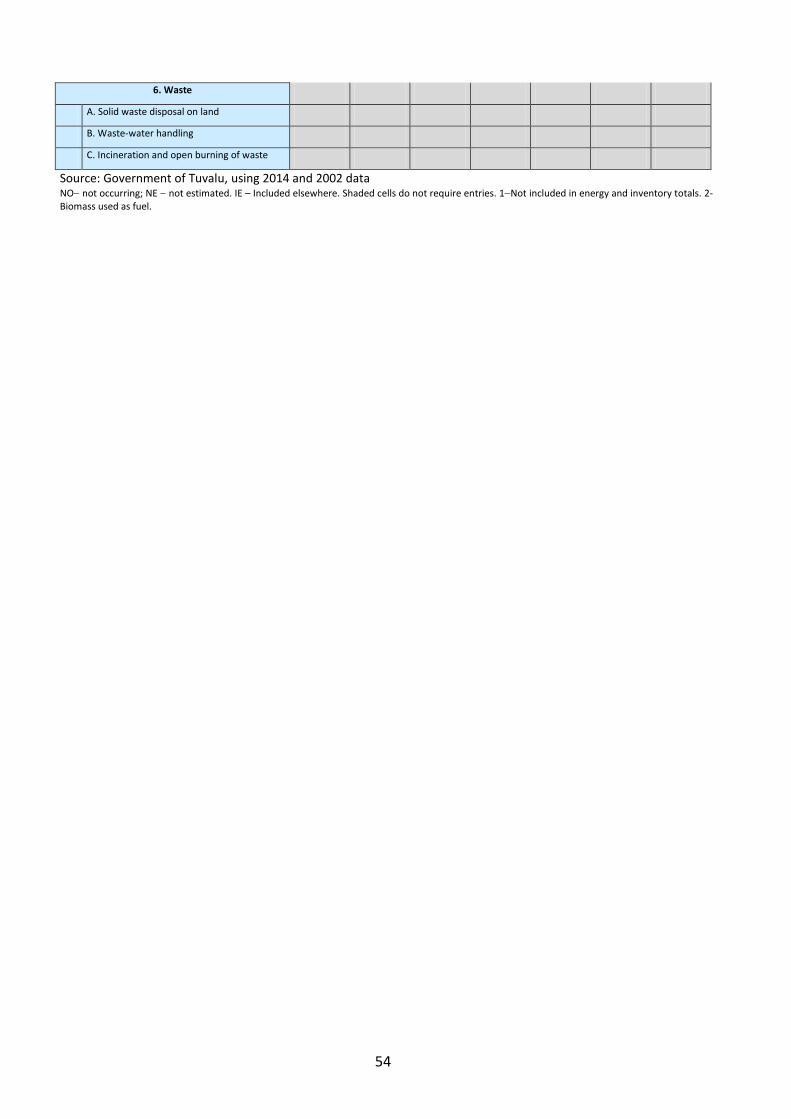
54
6. Waste
A. Solid waste disposal on land
B. Waste-water handling
C. Incineration and open burning of waste
Source: Government of Tuvalu, using 2014 and 2002 data NO not occurring; NE not estimated. IE – Included elsewhere. Shaded cells do not require entries. 1Not included in energy and inventory totals. 2- Biomass used as fuel.
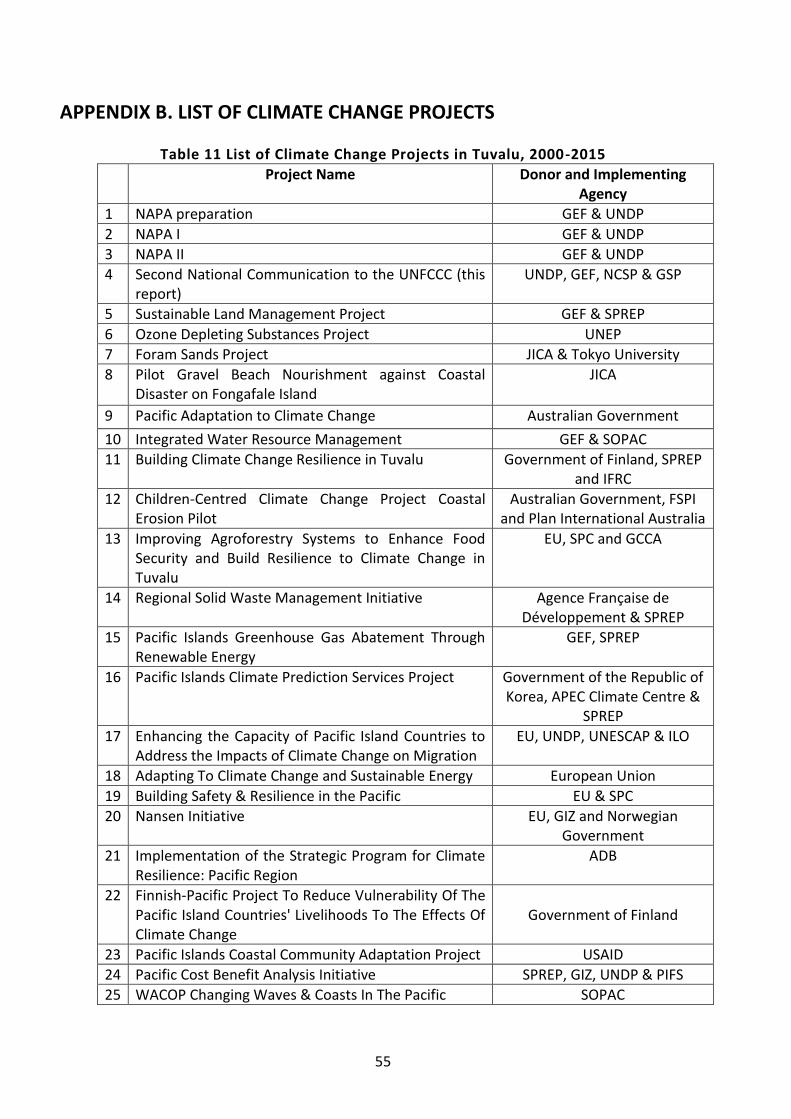
55
APPENDIX B. LIST OF CLIMATE CHANGE PROJECTS
Table 11 List of Climate Change Projects in Tuvalu, 2000-2015
Project Name Donor and Implementing Agency
1 NAPA preparation GEF & UNDP
2 NAPA I GEF & UNDP
3 NAPA II GEF & UNDP
4 Second National Communication to the UNFCCC (this report)
UNDP, GEF, NCSP & GSP
5 Sustainable Land Management Project GEF & SPREP
6 Ozone Depleting Substances Project UNEP
7 Foram Sands Project JICA & Tokyo University
8 Pilot Gravel Beach Nourishment against Coastal Disaster on Fongafale Island
JICA
9 Pacific Adaptation to Climate Change Australian Government
10 Integrated Water Resource Management GEF & SOPAC
11 Building Climate Change Resilience in Tuvalu Government of Finland, SPREP and IFRC
12 Children-Centred Climate Change Project Coastal Erosion Pilot
Australian Government, FSPI and Plan International Australia
13 Improving Agroforestry Systems to Enhance Food Security and Build Resilience to Climate Change in Tuvalu
EU, SPC and GCCA
14 Regional Solid Waste Management Initiative Agence Française de Développement & SPREP
15 Pacific Islands Greenhouse Gas Abatement Through Renewable Energy
GEF, SPREP
16 Pacific Islands Climate Prediction Services Project Government of the Republic of Korea, APEC Climate Centre &
SPREP
17 Enhancing the Capacity of Pacific Island Countries to Address the Impacts of Climate Change on Migration
EU, UNDP, UNESCAP & ILO
18 Adapting To Climate Change and Sustainable Energy European Union
19 Building Safety & Resilience in the Pacific EU & SPC
20 Nansen Initiative EU, GIZ and Norwegian Government
21 Implementation of the Strategic Program for Climate Resilience: Pacific Region
ADB
22 Finnish-Pacific Project To Reduce Vulnerability Of The Pacific Island Countries' Livelihoods To The Effects Of Climate Change
Government of Finland
23 Pacific Islands Coastal Community Adaptation Project USAID
24 Pacific Cost Benefit Analysis Initiative SPREP, GIZ, UNDP & PIFS
25 WACOP Changing Waves & Coasts In The Pacific SOPAC
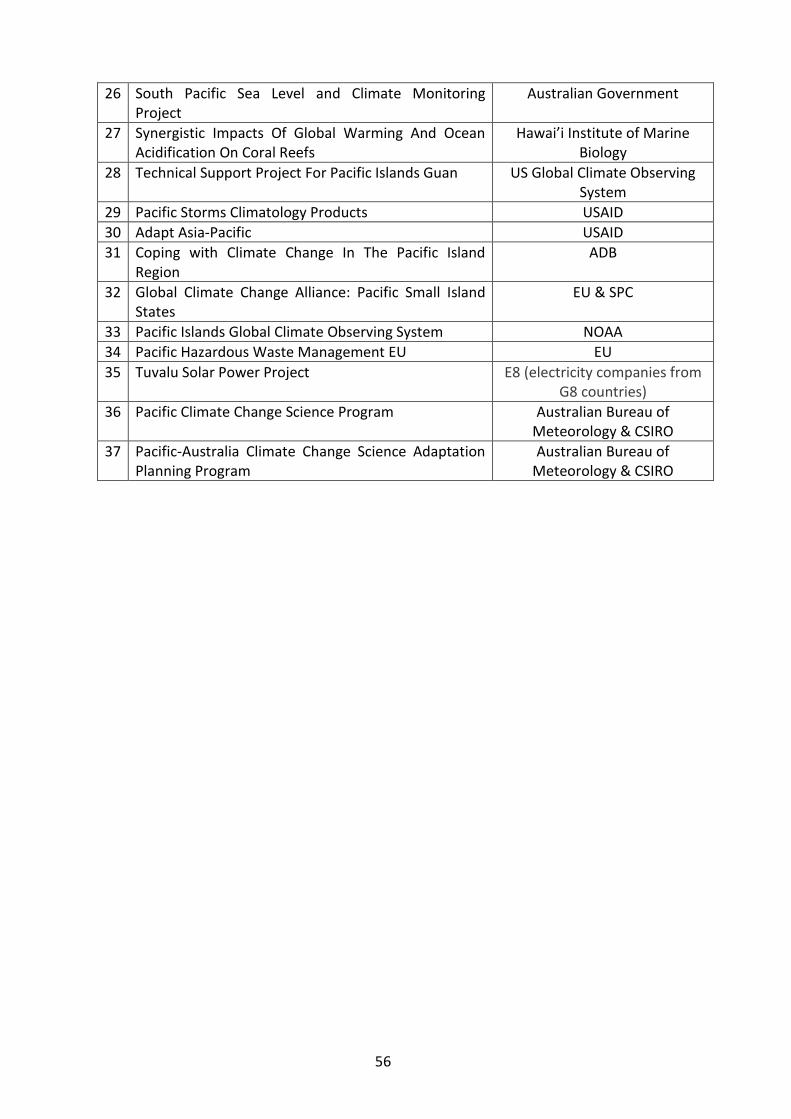
56
26 South Pacific Sea Level and Climate Monitoring Project
Australian Government
27 Synergistic Impacts Of Global Warming And Ocean Acidification On Coral Reefs
Hawai’i Institute of Marine Biology
28 Technical Support Project For Pacific Islands Guan US Global Climate Observing System
29 Pacific Storms Climatology Products USAID
30 Adapt Asia-Pacific USAID
31 Coping with Climate Change In The Pacific Island Region
ADB
32 Global Climate Change Alliance: Pacific Small Island States
EU & SPC
33 Pacific Islands Global Climate Observing System NOAA
34 Pacific Hazardous Waste Management EU EU
35 Tuvalu Solar Power Project E8 (electricity companies from G8 countries)
36 Pacific Climate Change Science Program Australian Bureau of Meteorology & CSIRO
37 Pacific-Australia Climate Change Science Adaptation Planning Program
Australian Bureau of Meteorology & CSIRO