Embed Size (px)
Citation preview
REPUBLIC OF GUINEA-BISSAU
Secretary of State for Environment and Sustainable Development
Environment Directoriat
Second National Communication on Climate
Changes in Guinea-Bissau
Final Report
Bissau, February 2011
1
PREFACE The Second National Communication of Guinea-Bissau, drafted under the UN Framework Convention on Climate Change (UNFCCC), provides useful information on: the national situation, the national inventory of Greenhouse Gases (GHG), the vulnerability of Guinea-Bissau faced with climate change, adaptation to address climate change, the measures taken to mitigate emissions of greenhouse gases, the socio-economic analysis of the impacts of climate change, the needs to strengthen national capabilities by means of training, communication, awareness and information on climate change, as well as other relevant information concerning budgetary constraints. After the First National Communication, Guinea-Bissau reiterates to the international community, (through this second statement), its message of solidarity, mutual trust, willingness and readiness to fight against climate change caused mainly by human activities. Since the ratification of the UNFCCC by Guinea-Bissau, through its legislature - the National Popular Assembly (ANP) on 27 October 1995, and based on Article 6 of the UNFCCC, the country has undertaken information and education campaigns, which has resulted in an awareness of the population of Guinea-Bissau towards safeguarding the global environment as a duty for all nations and peoples worldwide. Several reforestation activities, rehabilitation of degraded lands, management of natural resources were carried out in order to fight the effects of climate change. It is therefore in this line that the country continues to support the principle of joint responsibility, but differentiated by encouraging each part of this process to assume its historical responsibility with regard to GHG emissions. It worth mentioning that the country is in the process of integrating the issue of climate change into strategies and policies for national development, which is one of the steps towards achieving of the Millennium Development Objectives, which is a lever to ensure a sustainable progress.
2
EXECUTIVE SUMMARY For decades the international scientific community warned about the likely negative impacts of human activities on the equilibrium of ecosystems and global climate. Today it has been proved that the cause of global warming, which has been observed over the last fifty years, is anthropogenic, rather than natural. The weather events that occur (recurring droughts, frequent flooding, high winds, heat waves, rising sea levels, among others), initially predicted by scientists to occur at the end of the 21st century, is already becoming more frequent in several regions of the world with serious consequences for the survival of many societies. In summary, these phenomena are bringing untold consequences, such as hunger, diseases, the exodus and loss of thousands of human lives, especially for those countries, which have difficulties to cope with such obstacles because they have fewer resources.
Guinea-Bissau is a country with an extensive coastal area, all of which is lowland, with fragile ecological specificities in conjunction with a scenario of structural economic vulnerability, particularly food and energy dependence, which pose very serious challenges to our State. With an insular part (the Bijagos Archipelago), Guinea-Bissau is also part of the group of Small Island Developing States (SIDS). It is situated in the inter-tropical zone of intense solar radiation, i.e. it has intense infrared and ultraviolet rays. The coastal lowland area is exposed to increasing rising tides caused by the phenomenon of thermal expansion in the oceans. This exposes us to risks of flooding and coastal erosion, phenomenon that can potentially lead to the disappearance of fine sandy beaches, vegetation, road and touristic infrastructure, schools, homes, entire villages, in addition to important active biodiversity reserves on which the local economy is based.
The shortage of infrastructure and consequent deficient access to drinking water not only have negative consequences for populations that are more vulnerable to climate change, but also affects the economic and social development of the country. Thus, if climate change is not accompanied by proper and sustainable measures that objectively take into account its impacts on the welfare of the resident population and socio-economic development of the country, the populations of a particular region may be affected significantly.
The typical aspects of island ecosystems, such as fish stocks, corals and the high degree of endemism among the terrestrial species, are also directly threatened by climate change through extreme climatic events and unplanned economic growth. These phenomena can have tragic consequences for some economic sectors, including tourism, fisheries and agriculture, with direct or indirect potentially negative impacts on food security.
Agriculture - the base of our economy - is essentially traditional and dependent on rainfall. Rainfall is becoming increasingly irregular in space and time, a phenomenon accompanied by increase in temperature, thus causing low-yield agriculture, soil degradation by intensification of the phenomenon of evapo-transpiration.
Water resources show high vulnerability due to the irregularity of rainfall and high temperatures triggering decrease in river torrent, a significant decrease in groundwater level and the advancement of saline wedge. The current situation of the Geba River and adjacent aquifers sectors where this river maintains a hydraulic route serve as an example of this phenomenon.
In this context, Guinea-Bissau like other countries concerned with the negative impacts of the evolutionary trend of climate change and the protection of global environment in general, with a view to leave a habitable planet for future generations, ratified the UN Framework Convention on Climate Change on 27 October 1995. The ratification of this Convention, the efforts to conform

3
to its provisions, as well as the strategic actions outlined in this Second National Communication demonstrates the willingness of Guinea-Bissau to contribute effectively to the global effort to combat global warming.
Aware of the fragility of its ecosystems and the fact that its economy is heavily dependent on sectors sensitive to climate variability, Guinea-Bissau will multiply its efforts to face challenges that the struggle against global warming imposes. In this process, Guinea-Bissau needs financial and technical support from development partners in order to enable the country to adapt to global engagement, which is a paramount challenge of international cooperation.
4
INDEX
PREFACE 1
EXECUTIVE SUMMARY 2
ANALYTIC SUMMARY 11
INTRODUCTION 12
I- NATIONAL CIRCUMSTANCES 14
I. 1 – CHARASTERISTIC OF THE COUNTRY 14 I.1.1 - Geographic Location 14
I. 1.2 - CLIMATE 15
I.1.3 - GEOMORPHOLOGY 17
I.1.4 - Population 17
I.1.4 - Economy 19
I.1.5 - Energy 20
I.2 - NATURAL RESOURCES 21 I.2.1 – AGRARIAN RESOURCES 21
I.2.1.1 - Agriculture 22 I.2.1.2 - Forest 23 I.2.1.3 - Livestock 26
I.2.3 - FISHING RESOURCES 28
I.2.4 - BIODIVERSITY 29
1 - Soil types 30
2 - Plinth sols (Litolics and Entisoils) 30
3 - Sandy soils (Regosoils psamitics) 30
4 - Hydrometrics Soils: 30
4.1 - Gleisoils (Continental) 30
4.2 - Riverine (Derived from marine alluvium) 30
4.2.1 - Tropical polders 30
4.2.2 Halo-hydromorphics 30
Northern, Southern Regions and Bijagós Islands 31
I.2.6 - MINERAL RESOURCES 33 II.1 - INTRODUCTION 35
II.2 - DATA USED 35
5
II.2.1 - Energy 35 II.2.2.1 – Food production (bakery and cashew nuts processing) 36 II.2.2.2 - Production of alcoholic beverages (wine and brandy) 37
II.2.4.2 - Conversion of forests for other uses 41
II.2.4.5 - Emission and removal of CO 2 by soil 43
II.2.5 - Waste 43
II.2.5.1 - Solid Waste deposited at the dump 44
II.3 - METHODOLOGY 45
III - VULNERABILITY TO CLIMATE CHANGE 50
III.1 - CLIMATIC RISKS IN GUINEA-BISSAU 50
III.2 - CLIMATIC SCENARIOS 53
III 3 - METHODOLOGY 55
III.4 - ANALYSIS OF VULNERABILITY 57 IV - ADAPTATION TO CLIMATE CHANGE 61
IV.1 - ASSESSMENT OF ADAPTATION 61
IV.2 - STRATEGIES AND ADAPTATION MEASURES 61 V - MEASURES FOR EMISSIONS OF GHG MITIGATION 68
V.1-AGRARIAN SECTOR 68
V.1.2 - Forest 69
V.1.3 - Livestock 69
V.2 - ENERGY SECTOR 70 VI.1 – INITIAL MACROECONOMIC SITUATION 71
VIII.1 - PRIORITY NEEDS IN THE AREA OF ADAPTATION 73
VIII.1.1 - Selection and ranking of priority activities of PANA 73
VIII.2.1 – OBJECTIVE 75
VIII.2.2 - Identification of needs in the field of Technology Transfer 75
VIII.2.2.2. Energy 77
IX.1 - HUMAN LEVEL 79
IX.2 - MATERIAL AND TECHNICAL LEVEL 79
IX.3 - FINANCIAL LEVEL 79
REFERENCES 81
6
ACRONYMS
ANCR National Self Assessment Project for Capacity Reinforcement PNA (ANP) National Popular Assembly (Legislature) BO Official Bulletin Gazette CARBOVEG-GB Guinea-Bissau stored carbon quantification and vegetation forest sink capability CNI Initial National Communication CPDA Agricultural Development Policy Charter DENARP National Plan for Reduction of Poverty (NPSRP in English) DGA General Directorate for Environment FAO United Nations Fund for Agriculture and Food CFA Francs West African currency of the French African Community GAPLA Office of Agricultural Planning GEE Gas or GHG Greenhouse Gases GEF Global Environment Facility HDI Human Development Index INEC National Institute of Statistics and Census IUCN International Union for the Conservation of Nature IPCC Inter-governmental Panel on Climate Change PAFT Tropical Forest Action Plan PANA National Program of Action for Adaptation to Climate Change PDF Forestry Director Plan GDP Gross Domestic Product UNDP United Nations Development Program REDD Reducing Emissions from Deforestation and Degradation SEADD Secretary of State for Environment and Sustainable Development SIDS Small Island Developing States UEMOA West African Economic and Monetary Union UNFCCC United Nations Framework Convention on Climate Change EEZ Exclusive Economic Zone of Guinea-Bissau
7
TABLE OF CHEMICAL FORMULAE AND UNITS Al 2 O 3: Aluminum Oxide CaCO 3: Calcium Carbonate
CaO: Calcium Oxide
CH 4: Methane
CO 2: Carbon Dioxide
Fe2O 3: Iron Trioxide
HNO 3: Nitric Acid
N 2 O: Nitrogen Oxide
NH 3: Ammonia
NOx: Nitrous Oxide
SF6: Sulphur Hexafloreto
SiO 2: Silicon Dioxide
SO 2: Sulfur Dioxide
Eq-CO 2: CO 2 Equivalent
Gg: Giga gram
Kep: Kilogram of oil equivalent
toe: Ton of oil equivalent
ha: Hectare
mm: Millimeter
m / s Meter per second
m 2: Square meter
m 3: Cubic meter
km: Kilometer
km2: Square kilometer
° C: Degree Celsius
% : Percent
KW: Kilowatt
kW2: Kilowatt peak
W: Watt
MW: Mega Watt
Wh: watt hours
GWh: Giga Watt hour
kV: Kilovolt
KWh: Kilowatt hour
8
INDEX OF FIGURES
Figure 1: Map of Guinea-Bissau. Source: Cell SIG 13 Figure 2: Comparison of variation of Normal Rainfall values, 1961-1990 and 1971 - 2000 14 Figure 3: Average values of air temperature over the period of 1971-2000 15 Figure 4: Projection of effective livestock from 1991 to 2006 25 Figure 5: Guinea-Bissau hydrographic basin Network 26 Figure 6: Guinea-Bissau soils chart 29 Figure 7: - Composed Satellite image of Guinea-Bissau 40 Figure 8: Parameters variations (temperature, rainfall and river torrents) in Eastern country 50 Figure 9: Relation of rainfall-runoff 51
Figure 10: Climate change, temperature (° C) and precipitation (mm) projected for the period 2020 (2010-2039) 52
Figure 11: Climate change, temperature (° C) and precipitation (mm) projected for the period
2050 (204 52
Figure 12: Holdridge Life Zone Classification Model 53 Figure 13: Current distribution of Guinea-Bissau forests 54 Figure 14: Illustration of climate change impacts in the coastal zone 56
9
INDEX OF TABLES
Table 1: Average annual and monthly climatic parameters by climatic regions during the period of 1971-2000 15 Table 2: Data of some of the projected demographic indicators between1995-2025 17 Table 3: Source of GDP (2000-2005) by Sector of Economy 18 Table 4: Indicators of Saltinho River potential 19
Table 5: Applications of photo-voltaic technology in Guinea-Bissau 20 Table 6: Evolution of the gross output of grain, in tons 21
Table 7: Evolution of grain surface in ha 22
Table 8: Evolution of raw cashew nuts exports in nature 22 Table 9: Evolution of available agricultural area for cashew (ha) 22 Table 10: Evolution of forest areas from 1978 to 1985, adapted from the document Elements d'un Plan Directeur d'Aménagement et de Gestion de Ressources
Naturelles,1992 23 Table 11: Four types of forest vegetation Areas in Guinea-Bissau 23 Table 12: Estimated levels of timber production by forest type 24 Table 13: Representative flora species in Guinea-Bissau 28 Table 14: Types of soil, surface and % occupancy (adapted) 29 Table 15 - Data used to calculate the CO 2 emissions from the burning of
fossil fuels 33
Table 16: - Structure of petroleum consumption products by sectors of activities in tons, adapted from DGE, DEPPE, DGA 34
Table 17 - Data from the food sector and their emission factors 35 Table 18: - Data from the alcoholic beverages sector and their emission factors 35 Table 19 - Livestock and emission factor 36 Table 20 - Types of fertilizers used and their respective emission factors 36 Table 21 - Data from flooded rice fields and their respective factors
(emission, the correction of organic fertilizer and seasonal emission) 36
Table 22 - Data necessary for estimating GHG emissions from savannah burning for agricultural purposes 37
Table 23 - Data used to calculate GHG emissions from the burning in situ of agricultural wastes 37 Table 24 – Basic Data to support calculations 38
10
Table 25 - Data used to estimate the total annual loss of carbon from forests conversion for other uses 39 Table 26 - Reforested areas in the last 26 years 40 Table 27 - Ratios of emissions from open air burning of forests, adap. IPCC (1996) 40 Table 28 – Data of urban population depositing waste at the dump, production and per-capita fraction of solid waste deposited 41 Table 29 - Data used to estimate the emission of CH 4 from solid waste
deposited at the dump 42 Table 30 - Data used for estimation of CH 4 emitted by wastewater and sludge 42 Table 31 - Consumption of protein, total population and proportion of nitrogen in protein 42 Table 32 - Summary of GHG emissions in the Energy, Industry and Agriculture sectors, Change of land use, forestry and waste in the Republic of Guinea-Bissau during the year 2006 47
Table 33: - Living biomass above the ground and tons of carbon per hectare in forest vegetation classes considered 54 Table 34: Strategies and adaptation measures advocated 64 Table 35: Options from the analysis of multiple criteria 71 Table 36: As a result of exercises carried out, the following hierarchy of projects location and costs were obtained, which are presented in the table below 72
11
Executive Summary
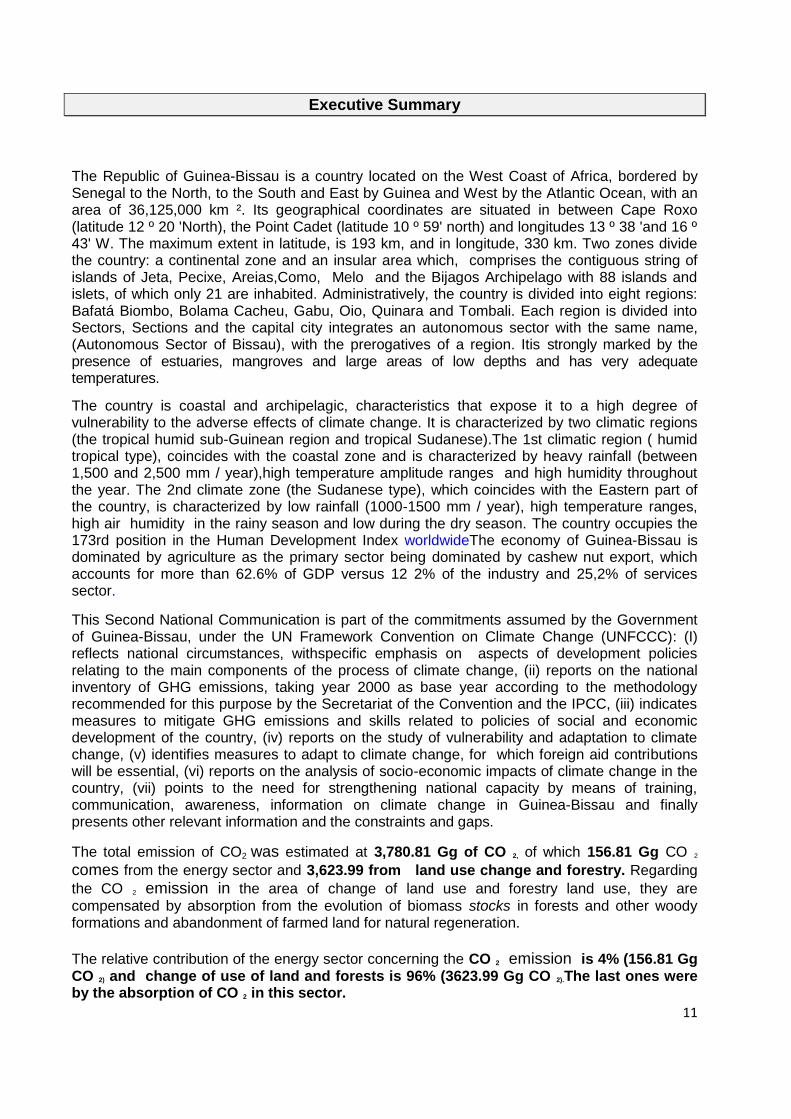
The Republic of Guinea-Bissau is a country located on the West Coast of Africa, bordered by Senegal to the North, to the South and East by Guinea and West by the Atlantic Ocean, with an area of 36,125,000 km ². Its geographical coordinates are situated in between Cape Roxo (latitude 12 º 20 'North), the Point Cadet (latitude 10 º 59' north) and longitudes 13 º 38 'and 16 º 43' W. The maximum extent in latitude, is 193 km, and in longitude, 330 km. Two zones divide the country: a continental zone and an insular area which, comprises the contiguous string of islands of Jeta, Pecixe, Areias,Como, Melo and the Bijagos Archipelago with 88 islands and islets, of which only 21 are inhabited. Administratively, the country is divided into eight regions: Bafatá Biombo, Bolama Cacheu, Gabu, Oio, Quinara and Tombali. Each region is divided into Sectors, Sections and the capital city integrates an autonomous sector with the same name, (Autonomous Sector of Bissau), with the prerogatives of a region. Itis strongly marked by the presence of estuaries, mangroves and large areas of low depths and has very adequate temperatures. The country is coastal and archipelagic, characteristics that expose it to a high degree of vulnerability to the adverse effects of climate change. It is characterized by two climatic regions (the tropical humid sub-Guinean region and tropical Sudanese).The 1st climatic region ( humid tropical type), coincides with the coastal zone and is characterized by heavy rainfall (between 1,500 and 2,500 mm / year),high temperature amplitude ranges and high humidity throughout the year. The 2nd climate zone (the Sudanese type), which coincides with the Eastern part of the country, is characterized by low rainfall (1000-1500 mm / year), high temperature ranges, high air humidity in the rainy season and low during the dry season. The country occupies the 173rd position in the Human Development Index worldwideThe economy of Guinea-Bissau is dominated by agriculture as the primary sector being dominated by cashew nut export, which accounts for more than 62.6% of GDP versus 12 2% of the industry and 25,2% of services sector. This Second National Communication is part of the commitments assumed by the Government of Guinea-Bissau, under the UN Framework Convention on Climate Change (UNFCCC): (I) reflects national circumstances, withspecific emphasis on aspects of development policies relating to the main components of the process of climate change, (ii) reports on the national inventory of GHG emissions, taking year 2000 as base year according to the methodology recommended for this purpose by the Secretariat of the Convention and the IPCC, (iii) indicates measures to mitigate GHG emissions and skills related to policies of social and economic development of the country, (iv) reports on the study of vulnerability and adaptation to climate change, (v) identifies measures to adapt to climate change, for which foreign aid contributions will be essential, (vi) reports on the analysis of socio-economic impacts of climate change in the country, (vii) points to the need for strengthening national capacity by means of training, communication, awareness, information on climate change in Guinea-Bissau and finally presents other relevant information and the constraints and gaps. The total emission of CO2 was estimated at 3,780.81 Gg of CO 2, of which 156.81 Gg CO 2 comes from the energy sector and 3,623.99 from land use change and forestry. Regarding
the CO 2 emission in the area of change of land use and forestry land use, they are
compensated by absorption from the evolution of biomass stocks in forests and other woody formations and abandonment of farmed land for natural regeneration.
The relative contribution of the energy sector concerning the CO 2 emission is 4% (156.81 Gg CO 2) and change of use of land and forests is 96% (3623.99 Gg CO 2).The last ones were by the absorption of CO 2 in this sector.

12
Being a non-Annex I country, it doesn’t have an obligation to provide policies and measures to mitigate GHG emissions, but has the obligation to participate in global efforts to stabilize emissions, in particular presenting the country's ability to reduce its emissions. These capabilities depend on the implementation of policies for sustainable development and integration of the issues of climate change into public policy. The last IPCC report concluded that Africa is the world's region that is most vulnerable to the adverse effects of climate change. The Sahel is recognized as the region that has suffered more with drought during the twentieth century. Therefore, Guinea-Bissau as a Sahelian country suffers the consequences of global warming, and is very vulnerable to these adverse effects. Regular reports testify to the change of parameters related to rainfall, temperature, relative humidity, average sea level and water resources. The population have noted (i) a late onset of the rainy season (mid-June) compared to the usual (early May), (ii) a less regular distribution of rainfall compared to the past, (iii) shortening of the period of mild temperatures, the so-called "cold weather season" from three months (December to February) to only two months (December to January), (iv) a warmer and drier environment, (v) occurrence of frequent dust clouds, ( vi) more frequent occurrence of high-tides of greater magnitude destroying rice fields and dikes, (vii) decreased water quality, due to saline water intrusion and infestation of water points by aquatic plants, (viii) reduction of wetland surfaces, by resettlement of sands due to drought. The evolution of rainfall over the period of 30 years (1961 - 1990) or even 45 years (1954-2000) shows a downward trend and irregular rainfall, based on observed variations: in the South, 2440-1800 mm; Mid-Country, 2,200 to 1,600 mm and the North, 1,600 to 1,200 mm (Silva C. quoted by Da Silva, A.O., 2001). For the period of 1953-1983, a study revealed that, while in the North, at the border with Senegal, in a period of over 70 days the average rainfall was 1,300 mm but for the extreme South it was more than 3,000 mm in more than 120 rainy days. The conclusions of the 4th IPCC Report and based on this National Communication leads us to conclude that adaptation to climate change is a priority for Guinea-Bissau. Efforts are been made to elaborate various strategies and adaptation measures for main sectors of national economy, accompanied by an awareness program for the actors on the negative impacts of climate change.The need to integrate the issue of climate change in public policy is evident. After the signature of the United Nations Framework Convention on Climate Change (UNFCCC) in 1992, and its ratification in 1995, the country developed several plans and strategies, emphasizing the DENARP1, 2 (National Strategy for Poverty Reduction), the National Program for Agricultural Investment (PNIA), the (PANA / NAPA) National Action Program for Adaptation to the adverse effects of climate change etc.. Based on the priority needs of the country to address the adverse effects of climate change, technology transfer for mitigation and adaptation to climate change must take into account the priorities of socio-economic development of the country and of the West Africa sub region . Regarding adaptation, Guinea-Bissau, as part of the Least Developed Countries (LDCs) in accordance with the Marrakesh Agreement, has also made the elaboration, validation and adoption of National Action Program for Adaptation (NAPA) with the support of UNDP / GEF. The needs for capacity building in terms of research and systematic observation, as well as financing, in terms of information, awareness, education and training, were expressed and presented in this document. The constraints and gaps that exist for the effective implementation of the Convention have been announced and operations were set to reduce these barriers.
13
INTRODUCTION
The Secretary of State of Environment was institutionalized in 1992, preceded by the creation of the National Environment Council (Organic Law), a body established by Decree No. 24/92, published in the Official Bulletin (BO) n.° 12/92 on 23 March in accordance with the commitments assumed in the Rio de Janeiro Summit, held in the same year. The institutional framework evolved and the 4th Constitutional Government of the Republic of Guinea-Bissau created the Secretary of State for Environment and Sustainable Development (SEADD) by Presidential Decree No. 2 / 2009 on 7 January 2009.It is a Government State Secretary whose overall mission is to establish, coordinate and implement the policy and environmental action and sustainable development at the national level. This State Secretary has a General Directorate for Environment (DGA) which serves as its executive service.
One of the main objectives of consecutive ministries in charge of the DGA, (as well as the one that is currently in charge), is the application of the provisions of the UN Framework Convention on Climate Change at the national level. It is also the one that prepared the First National Communication (INC). Thanks to the support of the GBS/97/G32/PNUD/GEF Project, on "Climate Change" funded by the Global Environment Facility (GEF), the National Program of Action for Adaptation to Climate Change (NAPA), which aims to help reduce the adverse effects of climate change on vulnerable populations, from the perspective of sustainable development and the fight against poverty, the National Self Assessment Project for Capacity Reinforcement, to manage the global environment, (ANCR), which aims to assess the needs for capacity building and to propose a strategy and action plan for implementing the capacity building activities in the Convention for Fighting Desertification, Biological Diversity and Climate Change.
The present document conforms to the commitments assumed by the Government of Guinea-Bissau, under the UN Framework Convention on Climate Change (UNFCCC), to prepare, discuss and approve a strategic document entitled "Second National Communication." Its content is defined by the provisions of Decision 17/CP.8, concerning the preparation of National Communications of Developing Countries - (non Annex I countries) subscribers of the Convention. Chapter I of the document deals with the presentation of national circumstances, with specific emphasis on aspects of development policies, linked to the main components of the process of climate change. Consecutively, Chapter II establishes the national inventory of GHG emissions, according to the methodology recommended by the Convention Secretariat and the IPCC. Chapter III deals with measures to mitigate greenhouse gas emissions. Chapter IV refers to the study of variation and vulnerability to climate change. The fifth chapter deals with measures to adapt to climate change, highlighting the importance of the contribution of foreign aid. In Chapter VI, a Socio-economic analysis of the impact of climate change is presented. The needs to strengthen national capacities by training, communication, awareness and information on climate change in Guinea-Bissau were addressed in Chapter VII. Other relevant information is presented in Chapter VIII. Finally, Chapter IX contains multiple constraints and gaps.
14
#
#
#
#
# #
#
#
#%
%
%
%
%
%
%
%
%
%
%
%
%
%
%
%
%
%
%
% %
%
%
%
%
%
%
%
%
%
%
%%
%
%
%
%
%
%
%
BOLAMA-BIJAGOS
BULA
CAIO
TITE
KOMO
FARIM
QUEBO
PRABIS
BIGENE
MANSOA
NHACRA
XITOLE
PIRADA
PITCHE
SONACO
EMPADA
CACINE
MANSABA
BUBAQUE
BETELLE
ETICOGA
GALOMARO
QUINHAMEL
CANCHUNGO
CONTUBOEL
GA-M AMUDO
FULACUNDA
CALEQUISSEBAMBADINCA
MADINA BOE
SAO DOMINGOS
BEDANDA
GABU
BUBA
CATIO
SAFIM
CACHEU
BAFATA
BOLAMA
SA BISSAU
BISSORA
N
EO
S
So urces : DGRH - CAAMI/Fév 09
11°
11°
12°
12°
16°
16°
15°
15°
14°
14°
REPUBLIQUE DE GUINEE BISSAU
CARTE ADMINISTRATIVE
30 0 30 60 Kilomètres
Régi ons de :
BAFA T A
BIOM B O
BO LAM A -B IJA G OS
C AC H E U
GA BU
OIO
QU IN AR A
SA B IS SA U
TO M B ALI
Lim ite d es sec teu rs
Résea u rou t ier
R oute r evêtue
R oute e n te rre m od ern e
Pis te
C hef lie u de r egi on#
C hef lie u de se c te ur%
Lég end e :
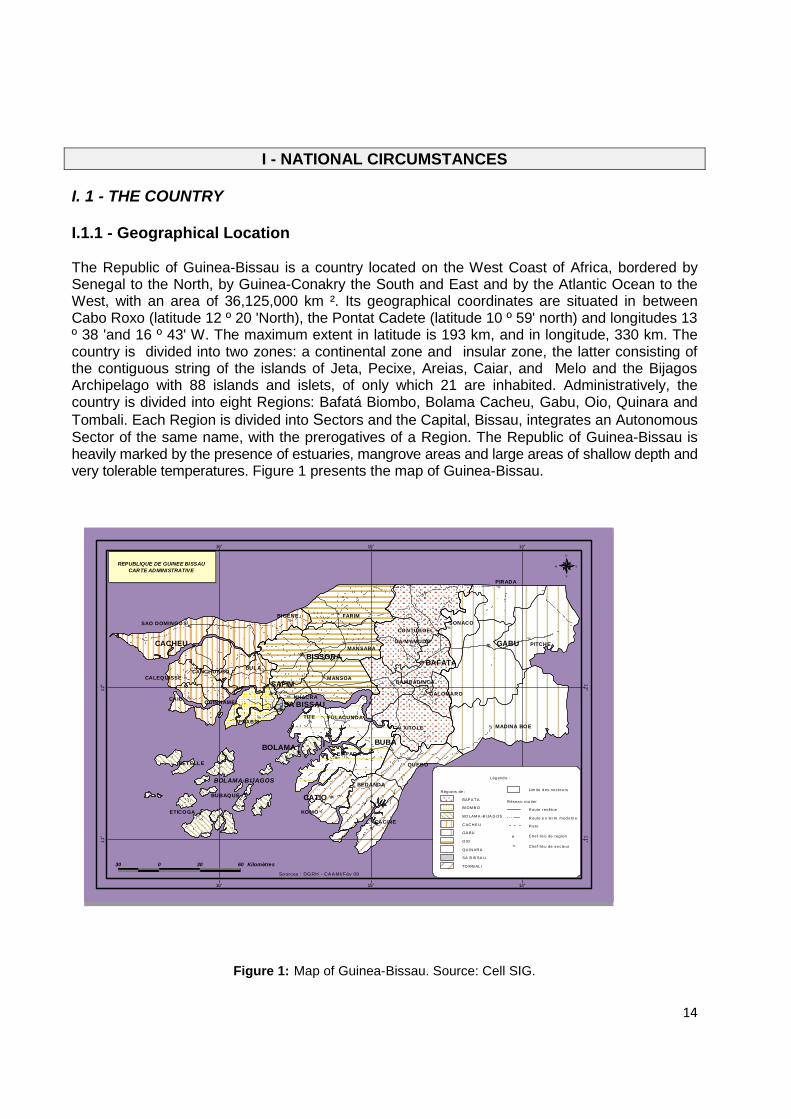
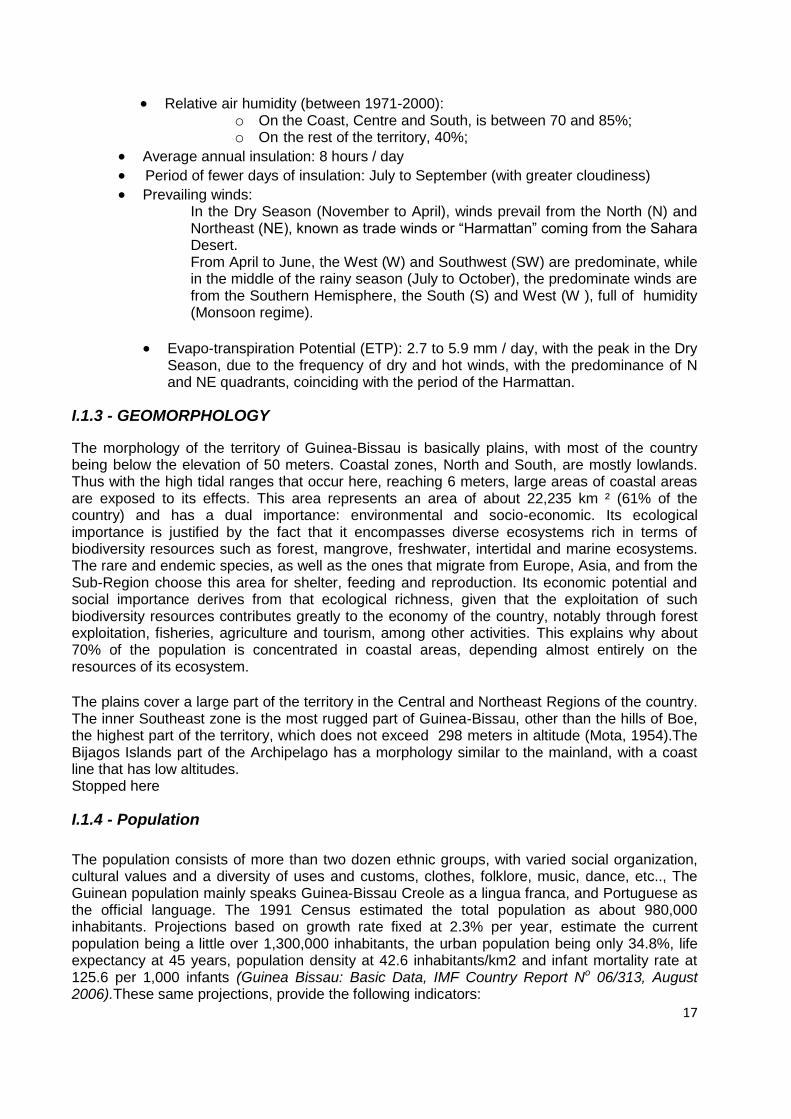
I - NATIONAL CIRCUMSTANCES I. 1 - THE COUNTRY I.1.1 - Geographical Location The Republic of Guinea-Bissau is a country located on the West Coast of Africa, bordered by Senegal to the North, by Guinea-Conakry the South and East and by the Atlantic Ocean to the West, with an area of 36,125,000 km ². Its geographical coordinates are situated in between Cabo Roxo (latitude 12 º 20 'North), the Pontat Cadete (latitude 10 º 59' north) and longitudes 13 º 38 'and 16 º 43' W. The maximum extent in latitude is 193 km, and in longitude, 330 km. The country is divided into two zones: a continental zone and insular zone, the latter consisting of the contiguous string of the islands of Jeta, Pecixe, Areias, Caiar, and Melo and the Bijagos Archipelago with 88 islands and islets, of only which 21 are inhabited. Administratively, the country is divided into eight Regions: Bafatá Biombo, Bolama Cacheu, Gabu, Oio, Quinara and
Tombali. Each Region is divided into Sectors and the Capital, Bissau, integrates an Autonomous
Sector of the same name, with the prerogatives of a Region. The Republic of Guinea-Bissau is heavily marked by the presence of estuaries, mangrove areas and large areas of shallow depth and very tolerable temperatures. Figure 1 presents the map of Guinea-Bissau.
Figure 1: Map of Guinea-Bissau. Source: Cell SIG.
15
I. 1.2 - CLIMATE
The Guinea-Bissau Climatologic Profile Report (Dias, Francisco et a l., 2007), states that the territory of Guinea-Bissau is inserted in the Inter-Tropical Front (ITF) field of action , characterized by the existence of a terrestrial mass, north of 5 ° N on the West African bulge - and an insular part in the Atlantic Ocean, with weather that is mainly conditioned by the situation of the territory in relation to the ITF and by the subsidiary actions of semi- permanent cells of high pressure, usually known as Azores Anticyclone, in the North Atlantic, and the Anticyclone of Santa Helena in the South Atlantic, and also the low summer heat that settles over the Sahara. According to this report:
ITF performs shifts to the North and South, tracking the country twice a year in periods of about six months. In May, it stands as a rule that in the Northern territory, the rainy season begins from June to October and ends in late October or early November as the passage to the South occurs. The dry season is from December to April. The months of May and November are transitional months. Given that Guinea-Bissau is crossed by the inter-tropical zone convergence, it suffers the influence of monsoon (hot and humid air from the Atlantic Ocean) during the rainy season and the harmattan (dry, hot air that comes from the Sahara) during the dry season. (Dias, Francisco et al. 2007)
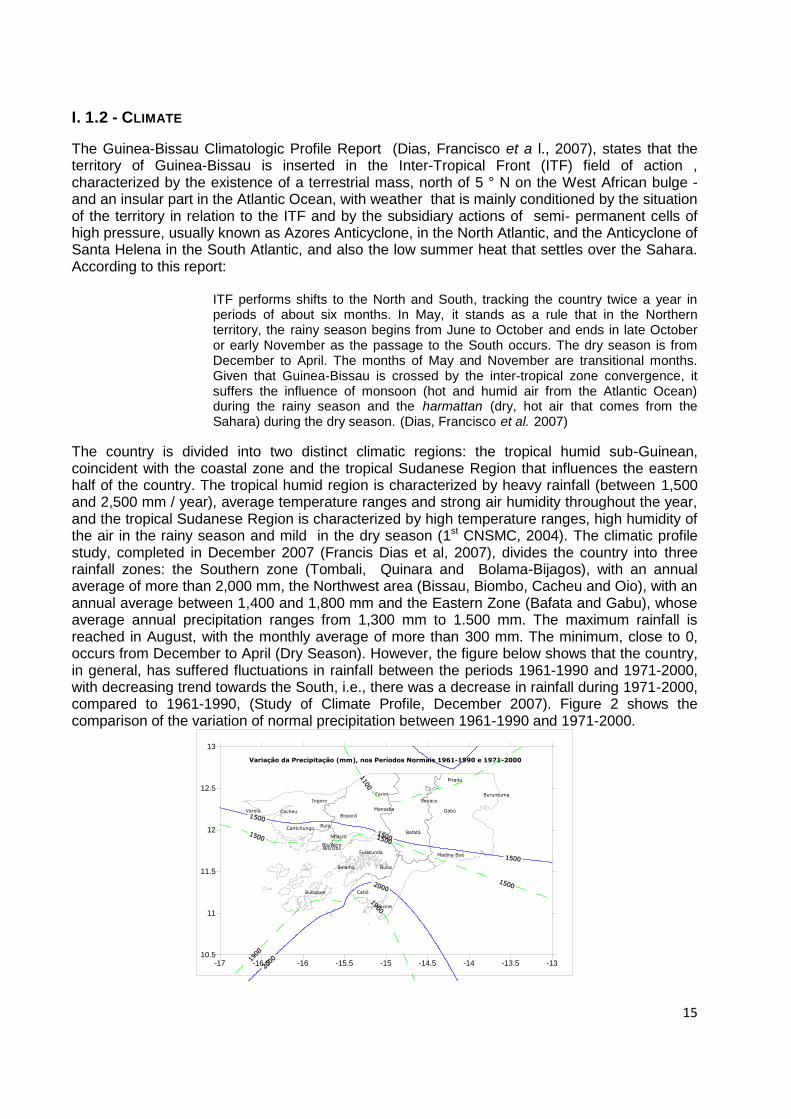
The country is divided into two distinct climatic regions: the tropical humid sub-Guinean, coincident with the coastal zone and the tropical Sudanese Region that influences the eastern half of the country. The tropical humid region is characterized by heavy rainfall (between 1,500 and 2,500 mm / year), average temperature ranges and strong air humidity throughout the year, and the tropical Sudanese Region is characterized by high temperature ranges, high humidity of the air in the rainy season and mild in the dry season (1st CNSMC, 2004). The climatic profile study, completed in December 2007 (Francis Dias et al, 2007), divides the country into three rainfall zones: the Southern zone (Tombali, Quinara and Bolama-Bijagos), with an annual average of more than 2,000 mm, the Northwest area (Bissau, Biombo, Cacheu and Oio), with an annual average between 1,400 and 1,800 mm and the Eastern Zone (Bafata and Gabu), whose average annual precipitation ranges from 1,300 mm to 1.500 mm. The maximum rainfall is reached in August, with the monthly average of more than 300 mm. The minimum, close to 0, occurs from December to April (Dry Season). However, the figure below shows that the country, in general, has suffered fluctuations in rainfall between the periods 1961-1990 and 1971-2000, with decreasing trend towards the South, i.e., there was a decrease in rainfall during 1971-2000, compared to 1961-1990, (Study of Climate Profile, December 2007). Figure 2 shows the comparison of the variation of normal precipitation between 1961-1990 and 1971-2000.
-17 -16.5 -16 -15.5 -15 -14.5 -14 -13.5 -1310.5
11
11.5
12
12.5
13
Bafatá
Bis/AeroBis/Obs
Bissorã
Bolama Buba
Bubaque
Bula
Buruntuma
Cacheu
Cacine
Cantchungo
Catió
Farim
Fulacunda
Gabú
Ingore
Madina Boé
Mansaba
Nhacra
Pirada
Sonaco
Varela
Variação da Precipitação (mm), nos Períodos Normais 1961-1990 e 1971-2000
16
Figure 2: Comparison of variation of normal rainfall between 1961-1990 and 1971-2000. Source: Climatological Profile, December 2007.
Some additional weather data
Annual average temperature: 26.8 ° C
Thermo amplitude : low, between 3-4 ° C
Temperatures in the warm period (March to May):
Highs 32 to 39 ° C
Minimum: 20 to 24 ° C.
In cooler periods (December to February) the maximum temperatures reaches 25 to 30 º C and minimums between 16 to 20 º C.
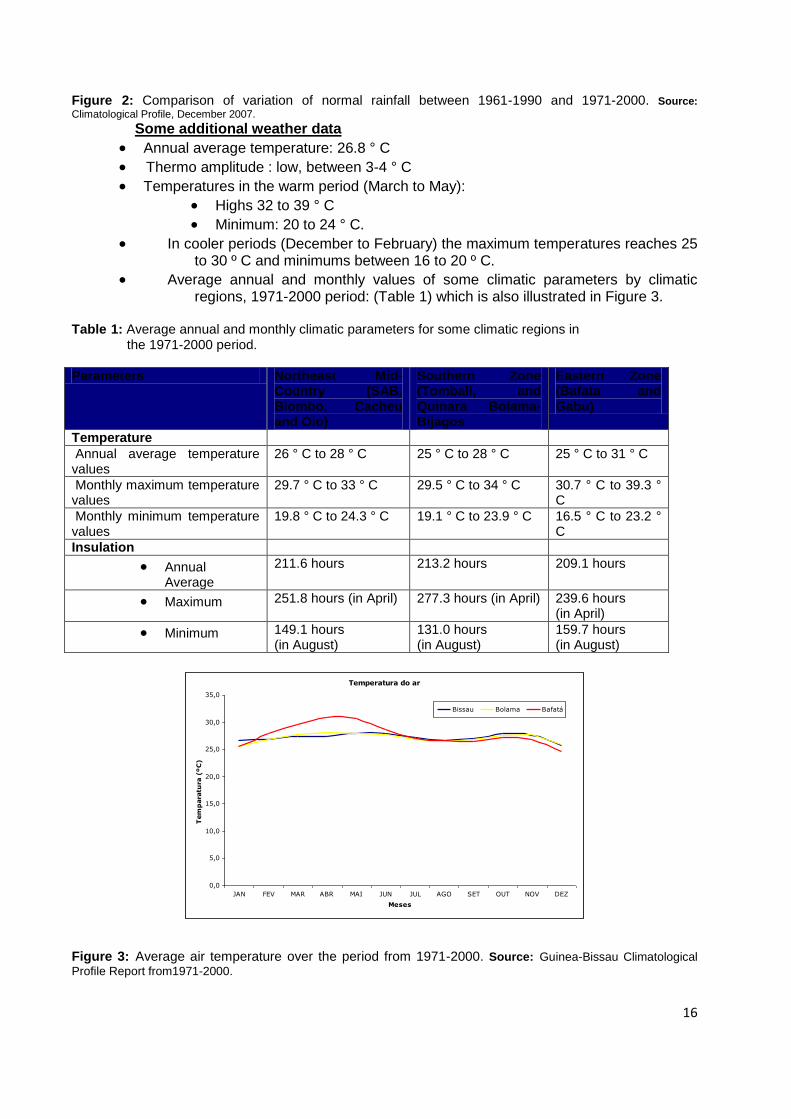
Average annual and monthly values of some climatic parameters by climatic regions, 1971-2000 period: (Table 1) which is also illustrated in Figure 3.
Table 1: Average annual and monthly climatic parameters for some climatic regions in the 1971-2000 period. Parameters Northeast Mid-
Country (SAB, Biombo, Cacheu and Oio)
Southern Zone (Tombali, and Quinara Bolama-Bijagos
Eastern Zone (Bafata and Gabu)
Temperature Annual average temperature values
26 ° C to 28 ° C 25 ° C to 28 ° C 25 ° C to 31 ° C
Monthly maximum temperature values
29.7 ° C to 33 ° C 29.5 ° C to 34 ° C 30.7 ° C to 39.3 ° C
Monthly minimum temperature values
19.8 ° C to 24.3 ° C 19.1 ° C to 23.9 ° C 16.5 ° C to 23.2 ° C
Insulation
Annual
Average
211.6 hours 213.2 hours 209.1 hours
Maximum 251.8 hours (in April) 277.3 hours (in April) 239.6 hours (in April)
Minimum 149.1 hours (in August)
131.0 hours (in August)
159.7 hours (in August)
Temperatura do ar
0,0
5,0
10,0
15,0
20,0
25,0
30,0
35,0
JAN FEV MAR ABR MAI JUN JUL AGO SET OUT NOV DEZ
Meses
Tem
para
tura
(ºC
)
Bissau Bolama Bafatá
Figure 3: Average air temperature over the period from 1971-2000. Source: Guinea-Bissau Climatological
Profile Report from1971-2000.
17
Relative air humidity (between 1971-2000): o On the Coast, Centre and South, is between 70 and 85%; o On the rest of the territory, 40%;
Average annual insulation: 8 hours / day
Period of fewer days of insulation: July to September (with greater cloudiness)
Prevailing winds: In the Dry Season (November to April), winds prevail from the North (N) and Northeast (NE), known as trade winds or “Harmattan” coming from the Sahara Desert. From April to June, the West (W) and Southwest (SW) are predominate, while in the middle of the rainy season (July to October), the predominate winds are from the Southern Hemisphere, the South (S) and West (W ), full of humidity (Monsoon regime).
Evapo-transpiration Potential (ETP): 2.7 to 5.9 mm / day, with the peak in the Dry Season, due to the frequency of dry and hot winds, with the predominance of N and NE quadrants, coinciding with the period of the Harmattan.
I.1.3 - GEOMORPHOLOGY The morphology of the territory of Guinea-Bissau is basically plains, with most of the country being below the elevation of 50 meters. Coastal zones, North and South, are mostly lowlands. Thus with the high tidal ranges that occur here, reaching 6 meters, large areas of coastal areas are exposed to its effects. This area represents an area of about 22,235 km ² (61% of the country) and has a dual importance: environmental and socio-economic. Its ecological importance is justified by the fact that it encompasses diverse ecosystems rich in terms of biodiversity resources such as forest, mangrove, freshwater, intertidal and marine ecosystems. The rare and endemic species, as well as the ones that migrate from Europe, Asia, and from the Sub-Region choose this area for shelter, feeding and reproduction. Its economic potential and social importance derives from that ecological richness, given that the exploitation of such biodiversity resources contributes greatly to the economy of the country, notably through forest exploitation, fisheries, agriculture and tourism, among other activities. This explains why about 70% of the population is concentrated in coastal areas, depending almost entirely on the resources of its ecosystem.
The plains cover a large part of the territory in the Central and Northeast Regions of the country. The inner Southeast zone is the most rugged part of Guinea-Bissau, other than the hills of Boe, the highest part of the territory, which does not exceed 298 meters in altitude (Mota, 1954).The Bijagos Islands part of the Archipelago has a morphology similar to the mainland, with a coast line that has low altitudes. Stopped here
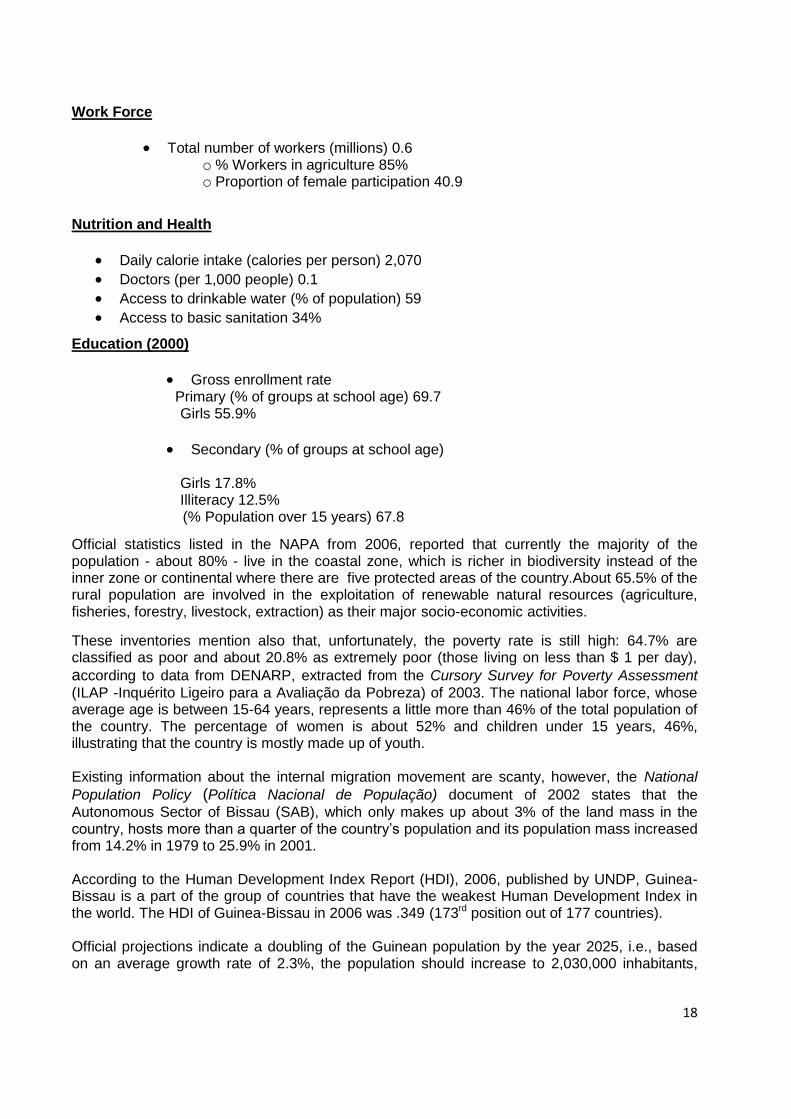
I.1.4 - Population The population consists of more than two dozen ethnic groups, with varied social organization, cultural values and a diversity of uses and customs, clothes, folklore, music, dance, etc.., The Guinean population mainly speaks Guinea-Bissau Creole as a lingua franca, and Portuguese as the official language. The 1991 Census estimated the total population as about 980,000 inhabitants. Projections based on growth rate fixed at 2.3% per year, estimate the current population being a little over 1,300,000 inhabitants, the urban population being only 34.8%, life expectancy at 45 years, population density at 42.6 inhabitants/km2 and infant mortality rate at 125.6 per 1,000 infants (Guinea Bissau: Basic Data, IMF Country Report No 06/313, August 2006).These same projections, provide the following indicators:
18
Work Force
Total number of workers (millions) 0.6 o % Workers in agriculture 85% o Proportion of female participation 40.9
Nutrition and Health
Daily calorie intake (calories per person) 2,070
Doctors (per 1,000 people) 0.1
Access to drinkable water (% of population) 59
Access to basic sanitation 34% Education (2000)
Gross enrollment rate Primary (% of groups at school age) 69.7 Girls 55.9%
Secondary (% of groups at school age)
Girls 17.8% Illiteracy 12.5% (% Population over 15 years) 67.8
Official statistics listed in the NAPA from 2006, reported that currently the majority of the population - about 80% - live in the coastal zone, which is richer in biodiversity instead of the inner zone or continental where there are five protected areas of the country.About 65.5% of the rural population are involved in the exploitation of renewable natural resources (agriculture, fisheries, forestry, livestock, extraction) as their major socio-economic activities. These inventories mention also that, unfortunately, the poverty rate is still high: 64.7% are classified as poor and about 20.8% as extremely poor (those living on less than $ 1 per day), according to data from DENARP, extracted from the Cursory Survey for Poverty Assessment
(ILAP -Inquérito Ligeiro para a Avaliação da Pobreza) of 2003. The national labor force, whose average age is between 15-64 years, represents a little more than 46% of the total population of the country. The percentage of women is about 52% and children under 15 years, 46%, illustrating that the country is mostly made up of youth. Existing information about the internal migration movement are scanty, however, the National
Population Policy (Política Nacional de População) document of 2002 states that the
Autonomous Sector of Bissau (SAB), which only makes up about 3% of the land mass in the country, hosts more than a quarter of the country’s population and its population mass increased from 14.2% in 1979 to 25.9% in 2001. According to the Human Development Index Report (HDI), 2006, published by UNDP, Guinea-Bissau is a part of the group of countries that have the weakest Human Development Index in the world. The HDI of Guinea-Bissau in 2006 was .349 (173rd position out of 177 countries). Official projections indicate a doubling of the Guinean population by the year 2025, i.e., based on an average growth rate of 2.3%, the population should increase to 2,030,000 inhabitants,
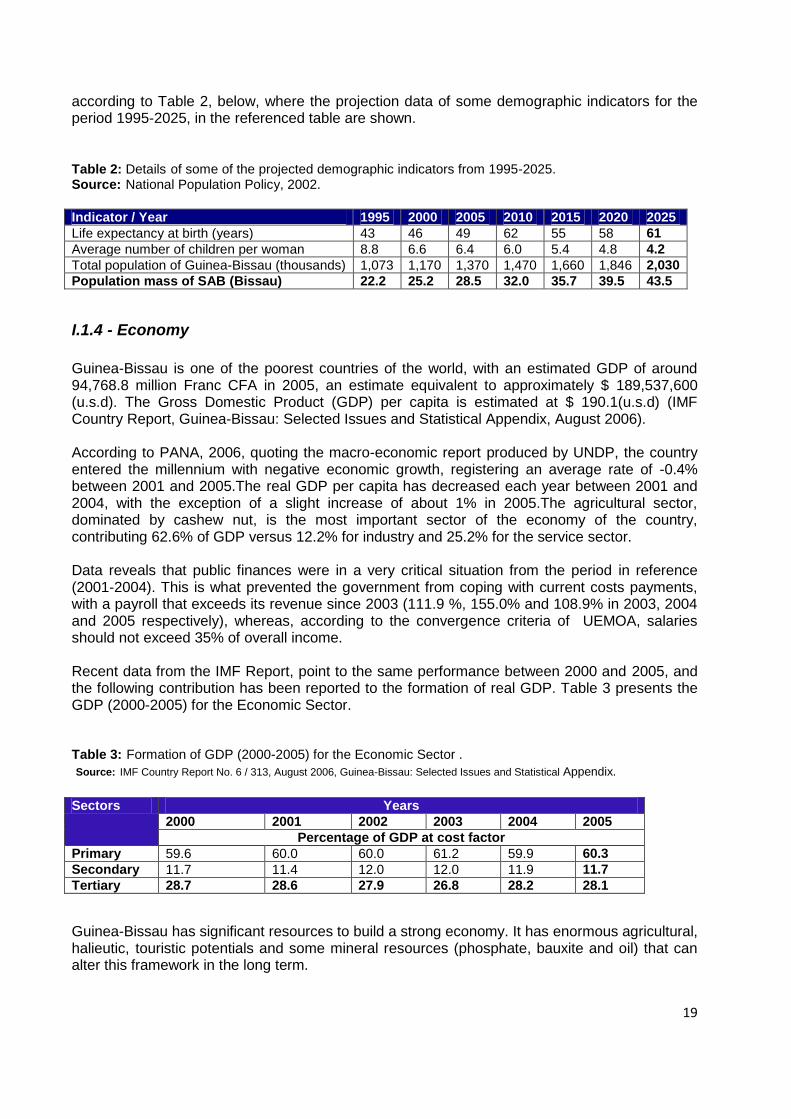
19
according to Table 2, below, where the projection data of some demographic indicators for the period 1995-2025, in the referenced table are shown. Table 2: Details of some of the projected demographic indicators from 1995-2025. Source: National Population Policy, 2002. Indicator / Year 1995 2000 2005 2010 2015 2020 2025 Life expectancy at birth (years) 43 46 49 62 55 58 61 Average number of children per woman 8.8 6.6 6.4 6.0 5.4 4.8 4.2 Total population of Guinea-Bissau (thousands) 1,073 1,170 1,370 1,470 1,660 1,846 2,030 Population mass of SAB (Bissau) 22.2 25.2 28.5 32.0 35.7 39.5 43.5
I.1.4 - Economy Guinea-Bissau is one of the poorest countries of the world, with an estimated GDP of around 94,768.8 million Franc CFA in 2005, an estimate equivalent to approximately $ 189,537,600 (u.s.d). The Gross Domestic Product (GDP) per capita is estimated at $ 190.1(u.s.d) (IMF Country Report, Guinea-Bissau: Selected Issues and Statistical Appendix, August 2006). According to PANA, 2006, quoting the macro-economic report produced by UNDP, the country entered the millennium with negative economic growth, registering an average rate of -0.4% between 2001 and 2005.The real GDP per capita has decreased each year between 2001 and 2004, with the exception of a slight increase of about 1% in 2005.The agricultural sector, dominated by cashew nut, is the most important sector of the economy of the country, contributing 62.6% of GDP versus 12.2% for industry and 25.2% for the service sector. Data reveals that public finances were in a very critical situation from the period in reference (2001-2004). This is what prevented the government from coping with current costs payments, with a payroll that exceeds its revenue since 2003 (111.9 %, 155.0% and 108.9% in 2003, 2004 and 2005 respectively), whereas, according to the convergence criteria of UEMOA, salaries should not exceed 35% of overall income. Recent data from the IMF Report, point to the same performance between 2000 and 2005, and the following contribution has been reported to the formation of real GDP. Table 3 presents the GDP (2000-2005) for the Economic Sector. Table 3: Formation of GDP (2000-2005) for the Economic Sector . Source: IMF Country Report No. 6 / 313, August 2006, Guinea-Bissau: Selected Issues and Statistical Appendix. Sectors Years
2000 2001 2002 2003 2004 2005 Percentage of GDP at cost factor
Primary 59.6 60.0 60.0 61.2 59.9 60.3 Secondary 11.7 11.4 12.0 12.0 11.9 11.7 Tertiary 28.7 28.6 27.9 26.8 28.2 28.1 Guinea-Bissau has significant resources to build a strong economy. It has enormous agricultural, halieutic, touristic potentials and some mineral resources (phosphate, bauxite and oil) that can alter this framework in the long term.
20
In the rural zones, financial systems (banking) are still very weak or non-existent in rural areas Energy and insurance, as well as communications are still less developed. In urban areas, these services are more developed. In short, the infrastructure and development are very limited in rural areas. The national challenge is to build a strong competitive economy in the international market, with particular emphasis on UEMOA and ECOWAS; an economy that generates jobs and opportunities for access to knowledge, know-how and technology , and forge a critical mass of well trained personnel to create wealth that helps to reduce poverty and unemployment, especially in rural areas and in areas critical to sustainable economic growth of the economy.
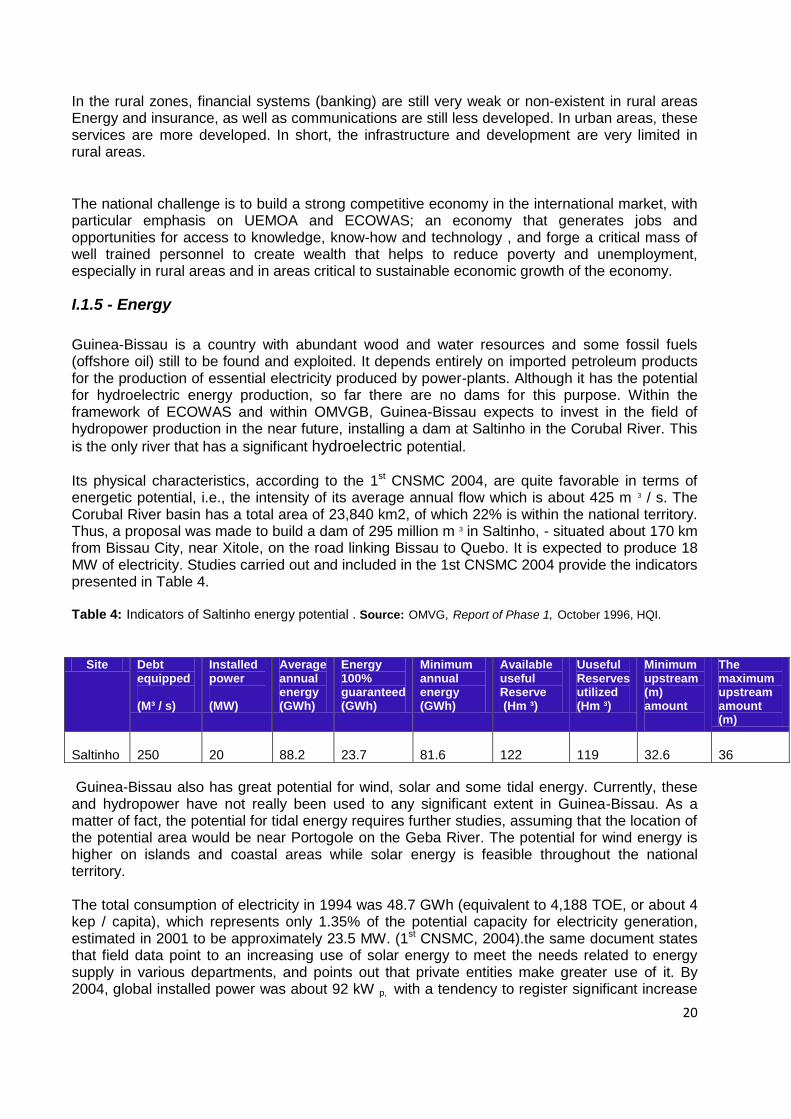
I.1.5 - Energy Guinea-Bissau is a country with abundant wood and water resources and some fossil fuels (offshore oil) still to be found and exploited. It depends entirely on imported petroleum products for the production of essential electricity produced by power-plants. Although it has the potential for hydroelectric energy production, so far there are no dams for this purpose. Within the framework of ECOWAS and within OMVGB, Guinea-Bissau expects to invest in the field of hydropower production in the near future, installing a dam at Saltinho in the Corubal River. This
is the only river that has a significant hydroelectric potential. Its physical characteristics, according to the 1st CNSMC 2004, are quite favorable in terms of energetic potential, i.e., the intensity of its average annual flow which is about 425 m 3 / s. The Corubal River basin has a total area of 23,840 km2, of which 22% is within the national territory. Thus, a proposal was made to build a dam of 295 million m 3 in Saltinho, - situated about 170 km from Bissau City, near Xitole, on the road linking Bissau to Quebo. It is expected to produce 18 MW of electricity. Studies carried out and included in the 1st CNSMC 2004 provide the indicators presented in Table 4. Table 4: Indicators of Saltinho energy potential . Source: OMVG, Report of Phase 1, October 1996, HQI.
Site Debt equipped (M³ / s)
Installed power (MW)
Average annual energy (GWh)
Energy 100% guaranteed (GWh)
Minimum annual energy (GWh)
Available useful Reserve (Hm ³)
Uuseful Reserves utilized (Hm ³)
Minimum upstream (m) amount
The maximum upstream amount (m)
Saltinho
250
20
88.2
23.7
81.6
122
119
32.6
36
Guinea-Bissau also has great potential for wind, solar and some tidal energy. Currently, these and hydropower have not really been used to any significant extent in Guinea-Bissau. As a matter of fact, the potential for tidal energy requires further studies, assuming that the location of the potential area would be near Portogole on the Geba River. The potential for wind energy is higher on islands and coastal areas while solar energy is feasible throughout the national territory. The total consumption of electricity in 1994 was 48.7 GWh (equivalent to 4,188 TOE, or about 4 kep / capita), which represents only 1.35% of the potential capacity for electricity generation, estimated in 2001 to be approximately 23.5 MW. (1st CNSMC, 2004).the same document states that field data point to an increasing use of solar energy to meet the needs related to energy supply in various departments, and points out that private entities make greater use of it. By 2004, global installed power was about 92 kW p, with a tendency to register significant increase
21
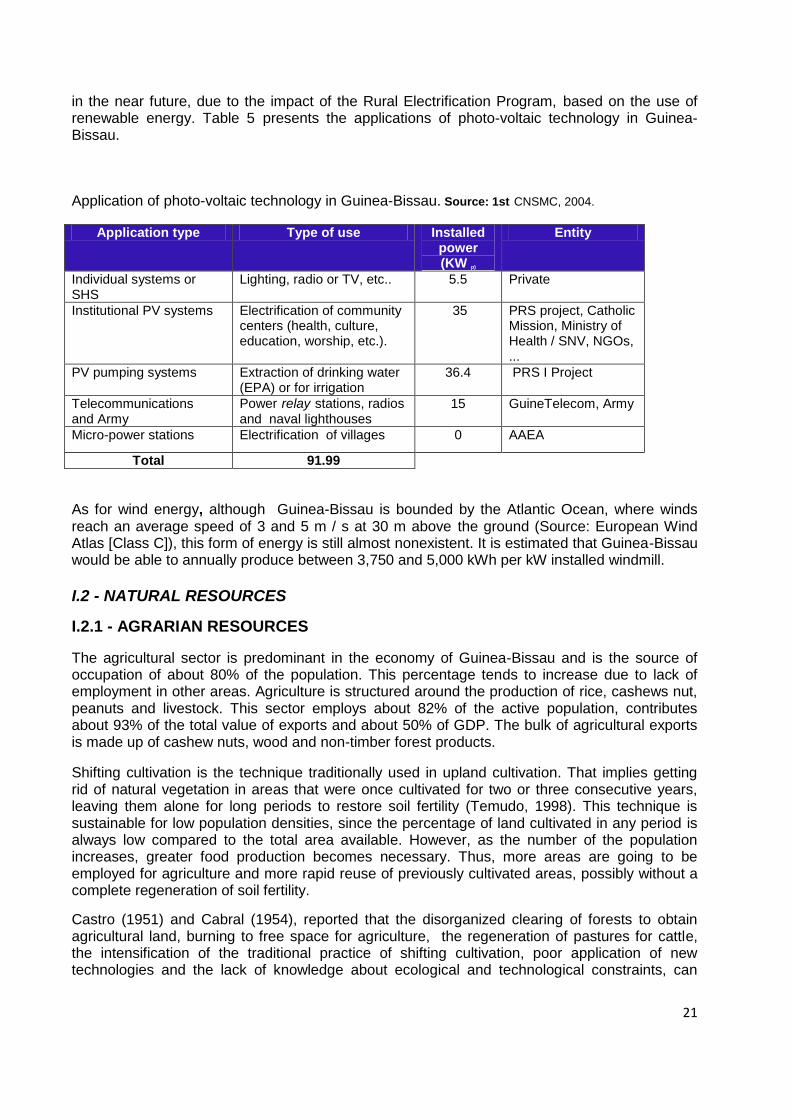
in the near future, due to the impact of the Rural Electrification Program, based on the use of renewable energy. Table 5 presents the applications of photo-voltaic technology in Guinea-Bissau.
Application of photo-voltaic technology in Guinea-Bissau. Source: 1st CNSMC, 2004.
Application type Type of use Installed
power (KW p)
Entity
Individual systems or SHS
Lighting, radio or TV, etc.. 5.5 Private
Institutional PV systems Electrification of community centers (health, culture, education, worship, etc.).
35 PRS project, Catholic Mission, Ministry of Health / SNV, NGOs, ...
PV pumping systems Extraction of drinking water (EPA) or for irrigation
36.4 PRS I Project
Telecommunications and Army
Power relay stations, radios and naval lighthouses
15 GuineTelecom, Army
Micro-power stations Electrification of villages 0 AAEA
Total 91.99 As for wind energy, although Guinea-Bissau is bounded by the Atlantic Ocean, where winds reach an average speed of 3 and 5 m / s at 30 m above the ground (Source: European Wind Atlas [Class C]), this form of energy is still almost nonexistent. It is estimated that Guinea-Bissau would be able to annually produce between 3,750 and 5,000 kWh per kW installed windmill. I.2 - NATURAL RESOURCES I.2.1 - AGRARIAN RESOURCES The agricultural sector is predominant in the economy of Guinea-Bissau and is the source of occupation of about 80% of the population. This percentage tends to increase due to lack of employment in other areas. Agriculture is structured around the production of rice, cashews nut, peanuts and livestock. This sector employs about 82% of the active population, contributes about 93% of the total value of exports and about 50% of GDP. The bulk of agricultural exports is made up of cashew nuts, wood and non-timber forest products. Shifting cultivation is the technique traditionally used in upland cultivation. That implies getting rid of natural vegetation in areas that were once cultivated for two or three consecutive years, leaving them alone for long periods to restore soil fertility (Temudo, 1998). This technique is sustainable for low population densities, since the percentage of land cultivated in any period is always low compared to the total area available. However, as the number of the population increases, greater food production becomes necessary. Thus, more areas are going to be employed for agriculture and more rapid reuse of previously cultivated areas, possibly without a complete regeneration of soil fertility. Castro (1951) and Cabral (1954), reported that the disorganized clearing of forests to obtain agricultural land, burning to free space for agriculture, the regeneration of pastures for cattle, the intensification of the traditional practice of shifting cultivation, poor application of new technologies and the lack of knowledge about ecological and technological constraints, can
22
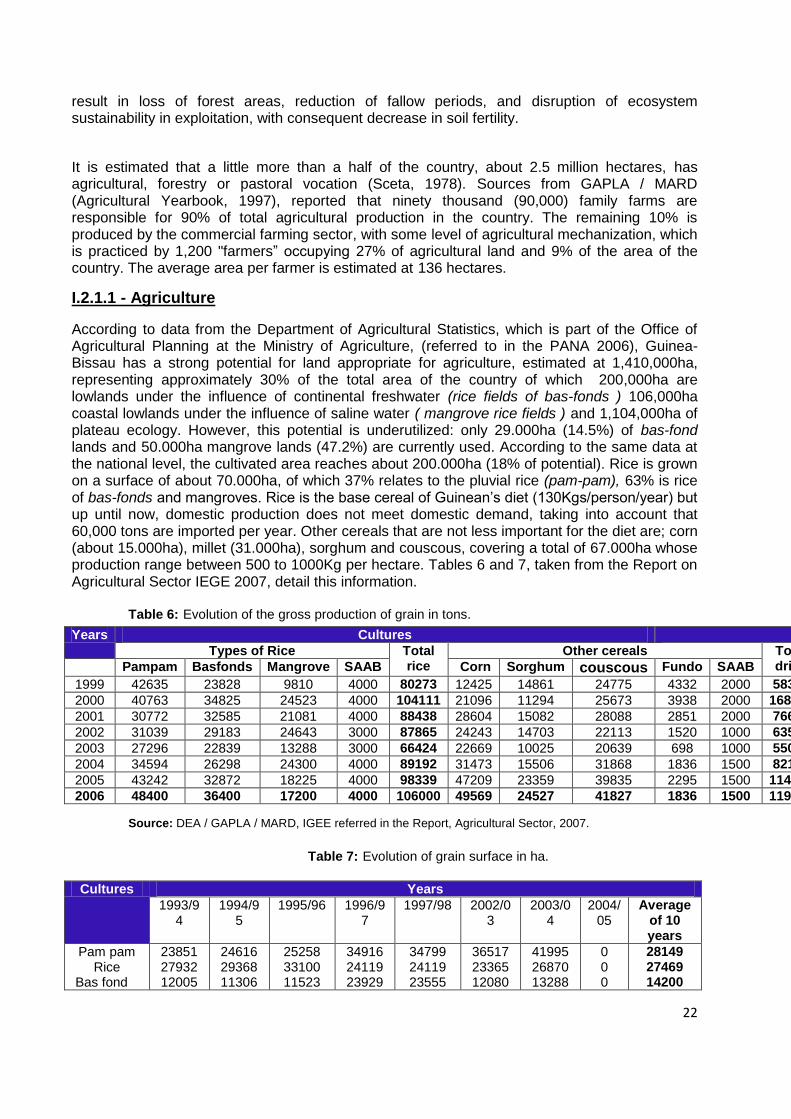
result in loss of forest areas, reduction of fallow periods, and disruption of ecosystem sustainability in exploitation, with consequent decrease in soil fertility. It is estimated that a little more than a half of the country, about 2.5 million hectares, has agricultural, forestry or pastoral vocation (Sceta, 1978). Sources from GAPLA / MARD (Agricultural Yearbook, 1997), reported that ninety thousand (90,000) family farms are responsible for 90% of total agricultural production in the country. The remaining 10% is produced by the commercial farming sector, with some level of agricultural mechanization, which is practiced by 1,200 "farmers” occupying 27% of agricultural land and 9% of the area of the country. The average area per farmer is estimated at 136 hectares. I.2.1.1 - Agriculture According to data from the Department of Agricultural Statistics, which is part of the Office of Agricultural Planning at the Ministry of Agriculture, (referred to in the PANA 2006), Guinea-Bissau has a strong potential for land appropriate for agriculture, estimated at 1,410,000ha, representing approximately 30% of the total area of the country of which 200,000ha are lowlands under the influence of continental freshwater (rice fields of bas-fonds ) 106,000ha coastal lowlands under the influence of saline water ( mangrove rice fields ) and 1,104,000ha of plateau ecology. However, this potential is underutilized: only 29.000ha (14.5%) of bas-fond lands and 50.000ha mangrove lands (47.2%) are currently used. According to the same data at the national level, the cultivated area reaches about 200.000ha (18% of potential). Rice is grown on a surface of about 70.000ha, of which 37% relates to the pluvial rice (pam-pam), 63% is rice of bas-fonds and mangroves. Rice is the base cereal of Guinean’s diet (130Kgs/person/year) but up until now, domestic production does not meet domestic demand, taking into account that 60,000 tons are imported per year. Other cereals that are not less important for the diet are; corn (about 15.000ha), millet (31.000ha), sorghum and couscous, covering a total of 67.000ha whose production range between 500 to 1000Kg per hectare. Tables 6 and 7, taken from the Report on Agricultural Sector IEGE 2007, detail this information.
Table 6: Evolution of the gross production of grain in tons. Years Cultures
Types of Rice Total rice
Other cereals Total dried
Total general Pampam Basfonds Mangrove SAAB Corn Sorghum couscous Fundo SAAB
1999 42635 23828 9810 4000 80273 12425 14861 24775 4332 2000 58393 138666 2000 40763 34825 24523 4000 104111 21096 11294 25673 3938 2000 168112 272223 2001 30772 32585 21081 4000 88438 28604 15082 28088 2851 2000 76625 165063 2002 31039 29183 24643 3000 87865 24243 14703 22113 1520 1000 63579 151444 2003 27296 22839 13288 3000 66424 22669 10025 20639 698 1000 55031 121455 2004 34594 26298 24300 4000 89192 31473 15506 31868 1836 1500 82183 171375 2005 43242 32872 18225 4000 98339 47209 23359 39835 2295 1500 114198 212537 2006 48400 36400 17200 4000 106000 49569 24527 41827 1836 1500 119259 225259
Source: DEA / GAPLA / MARD, IGEE referred in the Report, Agricultural Sector, 2007.
Table 7: Evolution of grain surface in ha.
Cultures Years
1993/94
1994/95
1995/96 1996/97
1997/98 2002/03
2003/04
2004/05
Average of 10 years
Pam pam Rice
Bas fond
23851 27932 12005
24616 29368 11306
25258 33100 11523
34916 24119 23929
34799 24119 23555
36517 23365 12080
41995 26870 13288
0 0 0
28149 27469 14200
23
Mangrove rice
Total rice 63788 65290 69881 82964 82473 71962 82153 0 69818 corn Millet
Sorghum Couscous
30754 13400 15456 2855
37205 14839 15427 3561
38086 15294 16751 2997
32602 9237
24455 4316
35656 9359 24780 4040
31485 24570 17822 3102
37782 29484 22278 2792
31355 15106 17532 3116
Total 126253 136322 143009 153574 156308 148941 174489 0 136927
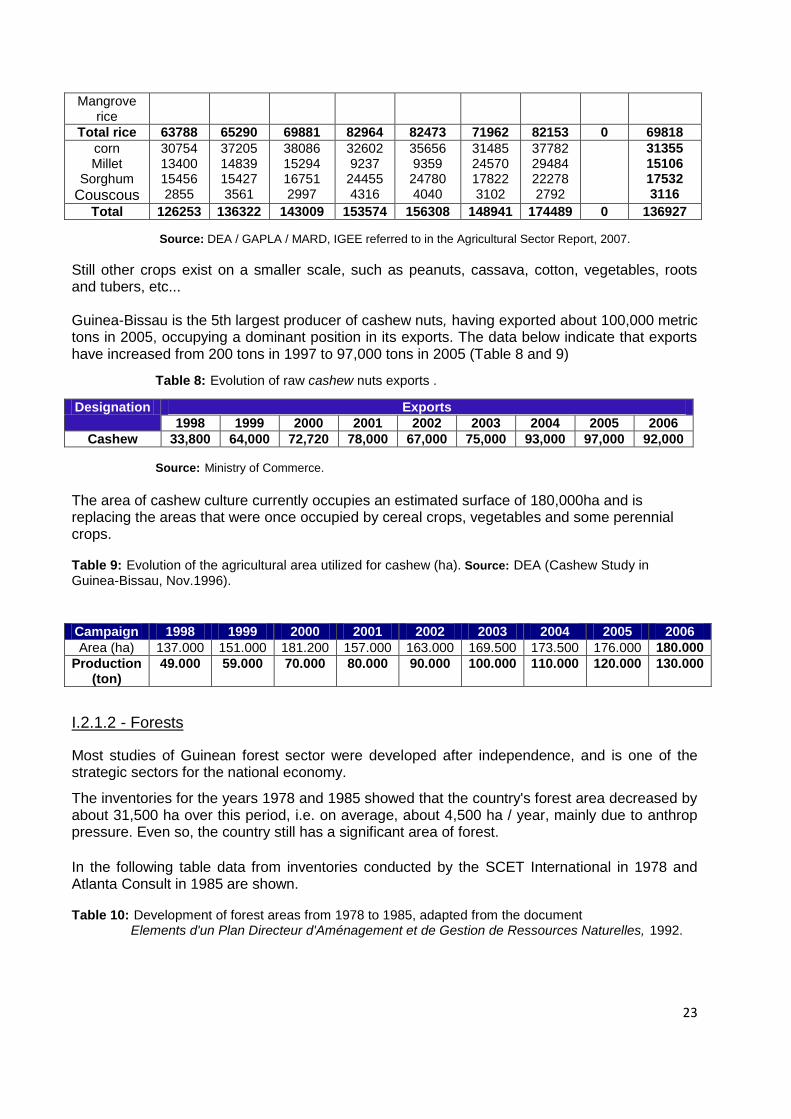
Source: DEA / GAPLA / MARD, IGEE referred to in the Agricultural Sector Report, 2007. Still other crops exist on a smaller scale, such as peanuts, cassava, cotton, vegetables, roots and tubers, etc... Guinea-Bissau is the 5th largest producer of cashew nuts, having exported about 100,000 metric tons in 2005, occupying a dominant position in its exports. The data below indicate that exports have increased from 200 tons in 1997 to 97,000 tons in 2005 (Table 8 and 9)
Table 8: Evolution of raw cashew nuts exports .
Designation Exports
1998 1999 2000 2001 2002 2003 2004 2005 2006 Cashew 33,800 64,000 72,720 78,000 67,000 75,000 93,000 97,000 92,000
Source: Ministry of Commerce.
The area of cashew culture currently occupies an estimated surface of 180,000ha and is replacing the areas that were once occupied by cereal crops, vegetables and some perennial crops. Table 9: Evolution of the agricultural area utilized for cashew (ha). Source: DEA (Cashew Study in Guinea-Bissau, Nov.1996). Campaign 1998 1999 2000 2001 2002 2003 2004 2005 2006 Area (ha) 137.000 151.000 181.200 157.000 163.000 169.500 173.500 176.000 180.000
Production (ton)
49.000 59.000 70.000 80.000 90.000 100.000 110.000 120.000 130.000
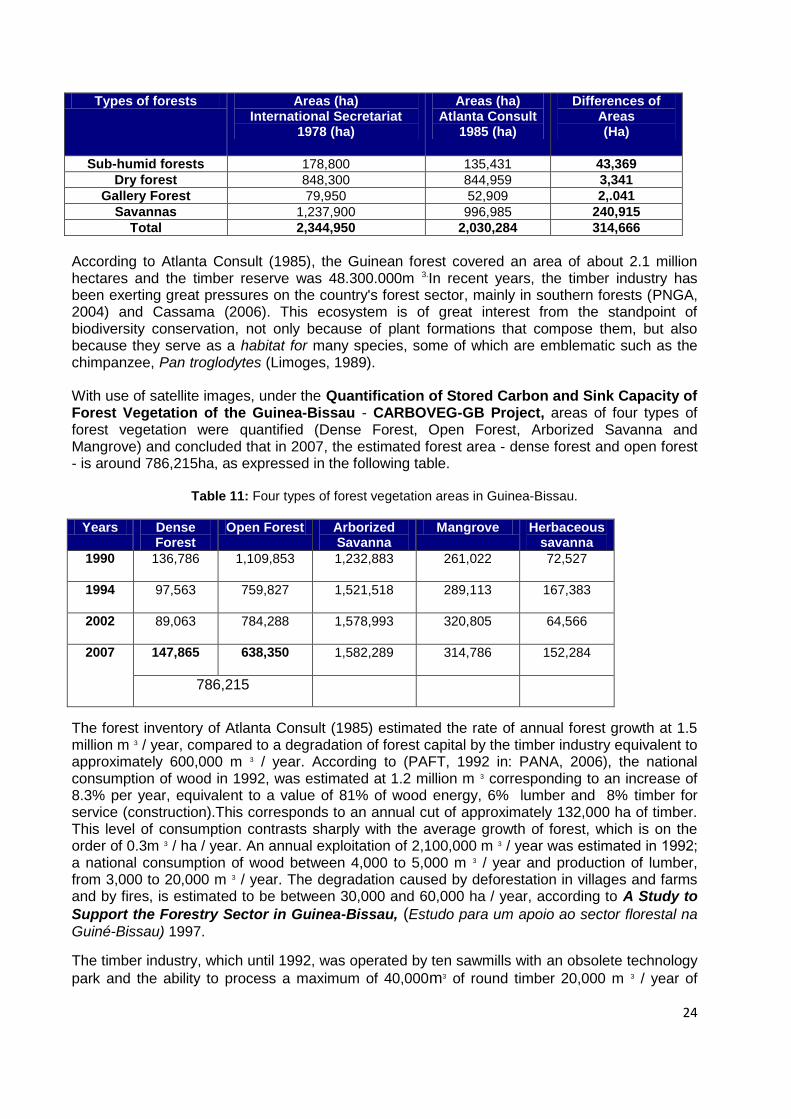
I.2.1.2 - Forests Most studies of Guinean forest sector were developed after independence, and is one of the strategic sectors for the national economy. The inventories for the years 1978 and 1985 showed that the country's forest area decreased by about 31,500 ha over this period, i.e. on average, about 4,500 ha / year, mainly due to anthrop pressure. Even so, the country still has a significant area of forest. In the following table data from inventories conducted by the SCET International in 1978 and Atlanta Consult in 1985 are shown. Table 10: Development of forest areas from 1978 to 1985, adapted from the document Elements d'un Plan Directeur d'Aménagement et de Gestion de Ressources Naturelles, 1992.
24
Types of forests Areas (ha) International Secretariat
1978 (ha)
Areas (ha) Atlanta Consult
1985 (ha)
Differences of Areas (Ha)
Sub-humid forests 178,800 135,431 43,369 Dry forest 848,300 844,959 3,341
Gallery Forest 79,950 52,909 2,.041 Savannas 1,237,900 996,985 240,915
Total 2,344,950 2,030,284 314,666 According to Atlanta Consult (1985), the Guinean forest covered an area of about 2.1 million hectares and the timber reserve was 48.300.000m 3.In recent years, the timber industry has been exerting great pressures on the country's forest sector, mainly in southern forests (PNGA, 2004) and Cassama (2006). This ecosystem is of great interest from the standpoint of biodiversity conservation, not only because of plant formations that compose them, but also because they serve as a habitat for many species, some of which are emblematic such as the chimpanzee, Pan troglodytes (Limoges, 1989). With use of satellite images, under the Quantification of Stored Carbon and Sink Capacity of Forest Vegetation of the Guinea-Bissau - CARBOVEG-GB Project, areas of four types of forest vegetation were quantified (Dense Forest, Open Forest, Arborized Savanna and Mangrove) and concluded that in 2007, the estimated forest area - dense forest and open forest - is around 786,215ha, as expressed in the following table.
Table 11: Four types of forest vegetation areas in Guinea-Bissau.
Years Dense Forest
Open Forest Arborized Savanna
Mangrove Herbaceous savanna
1990 136,786 1,109,853 1,232,883 261,022 72,527
1994 97,563 759,827 1,521,518 289,113 167,383
2002 89,063 784,288 1,578,993 320,805 64,566
2007 147,865 638,350 1,582,289 314,786 152,284
786,215
The forest inventory of Atlanta Consult (1985) estimated the rate of annual forest growth at 1.5 million m 3 / year, compared to a degradation of forest capital by the timber industry equivalent to approximately 600,000 m 3 / year. According to (PAFT, 1992 in: PANA, 2006), the national consumption of wood in 1992, was estimated at 1.2 million m 3 corresponding to an increase of 8.3% per year, equivalent to a value of 81% of wood energy, 6% lumber and 8% timber for service (construction).This corresponds to an annual cut of approximately 132,000 ha of timber. This level of consumption contrasts sharply with the average growth of forest, which is on the order of 0.3m 3 / ha / year. An annual exploitation of 2,100,000 m 3 / year was estimated in 1992; a national consumption of wood between 4,000 to 5,000 m 3 / year and production of lumber, from 3,000 to 20,000 m 3 / year. The degradation caused by deforestation in villages and farms and by fires, is estimated to be between 30,000 and 60,000 ha / year, according to A Study to
Support the Forestry Sector in Guinea-Bissau, (Estudo para um apoio ao sector florestal na
Guiné-Bissau) 1997. The timber industry, which until 1992, was operated by ten sawmills with an obsolete technology
park and the ability to process a maximum of 40,000m3 of round timber 20,000 m 3 / year of
25
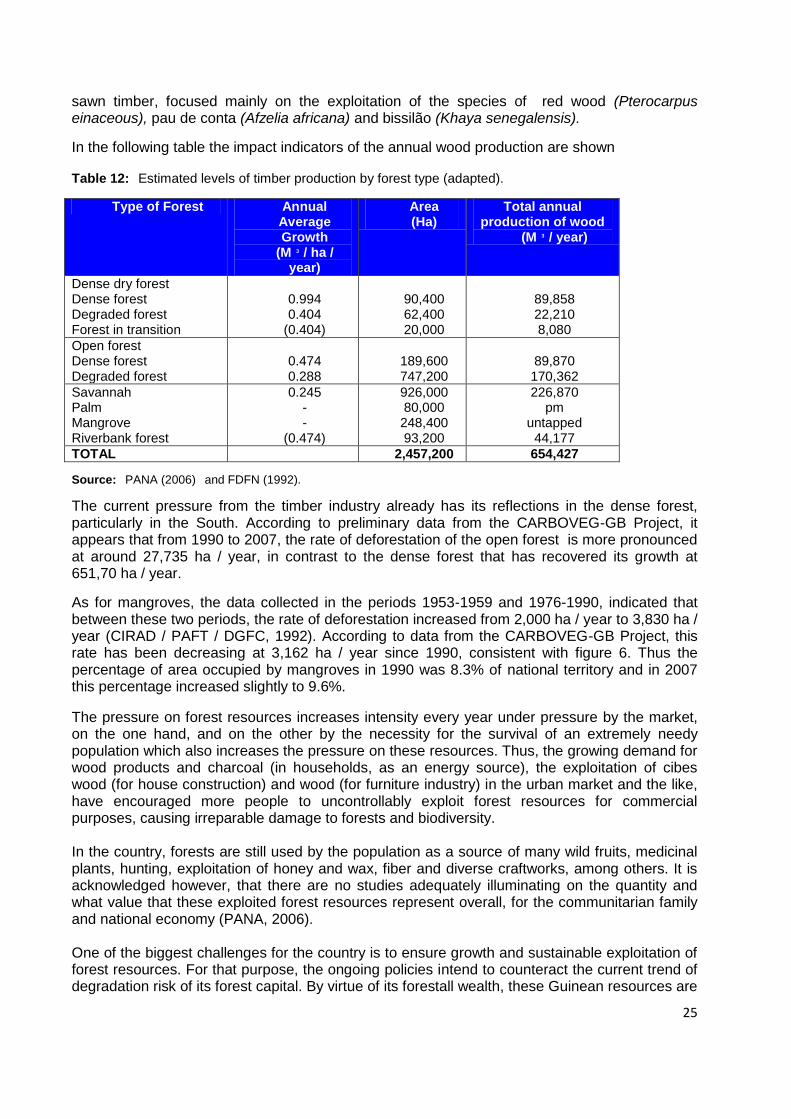
sawn timber, focused mainly on the exploitation of the species of red wood (Pterocarpus einaceous), pau de conta (Afzelia africana) and bissilão (Khaya senegalensis). In the following table the impact indicators of the annual wood production are shown
Table 12: Estimated levels of timber production by forest type (adapted).
Type of Forest Annual Average Growth
(M 3 / ha / year)
Area (Ha)
Total annual production of wood
(M 3 / year)
Dense dry forest Dense forest Degraded forest Forest in transition
0.994 0.404
(0.404)
90,400 62,400 20,000
89,858 22,210 8,080
Open forest Dense forest Degraded forest
0.474 0.288
189,600 747,200
89,870 170,362
Savannah Palm Mangrove Riverbank forest
0.245 - -
(0.474)
926,000 80,000 248,400 93,200
226,870 pm
untapped 44,177
TOTAL 2,457,200 654,427 Source: PANA (2006) and FDFN (1992). The current pressure from the timber industry already has its reflections in the dense forest, particularly in the South. According to preliminary data from the CARBOVEG-GB Project, it appears that from 1990 to 2007, the rate of deforestation of the open forest is more pronounced at around 27,735 ha / year, in contrast to the dense forest that has recovered its growth at 651,70 ha / year. As for mangroves, the data collected in the periods 1953-1959 and 1976-1990, indicated that between these two periods, the rate of deforestation increased from 2,000 ha / year to 3,830 ha / year (CIRAD / PAFT / DGFC, 1992). According to data from the CARBOVEG-GB Project, this rate has been decreasing at 3,162 ha / year since 1990, consistent with figure 6. Thus the percentage of area occupied by mangroves in 1990 was 8.3% of national territory and in 2007 this percentage increased slightly to 9.6%. The pressure on forest resources increases intensity every year under pressure by the market, on the one hand, and on the other by the necessity for the survival of an extremely needy population which also increases the pressure on these resources. Thus, the growing demand for wood products and charcoal (in households, as an energy source), the exploitation of cibes wood (for house construction) and wood (for furniture industry) in the urban market and the like, have encouraged more people to uncontrollably exploit forest resources for commercial purposes, causing irreparable damage to forests and biodiversity. In the country, forests are still used by the population as a source of many wild fruits, medicinal plants, hunting, exploitation of honey and wax, fiber and diverse craftworks, among others. It is acknowledged however, that there are no studies adequately illuminating on the quantity and what value that these exploited forest resources represent overall, for the communitarian family and national economy (PANA, 2006). One of the biggest challenges for the country is to ensure growth and sustainable exploitation of forest resources. For that purpose, the ongoing policies intend to counteract the current trend of degradation risk of its forest capital. By virtue of its forestall wealth, these Guinean resources are
26
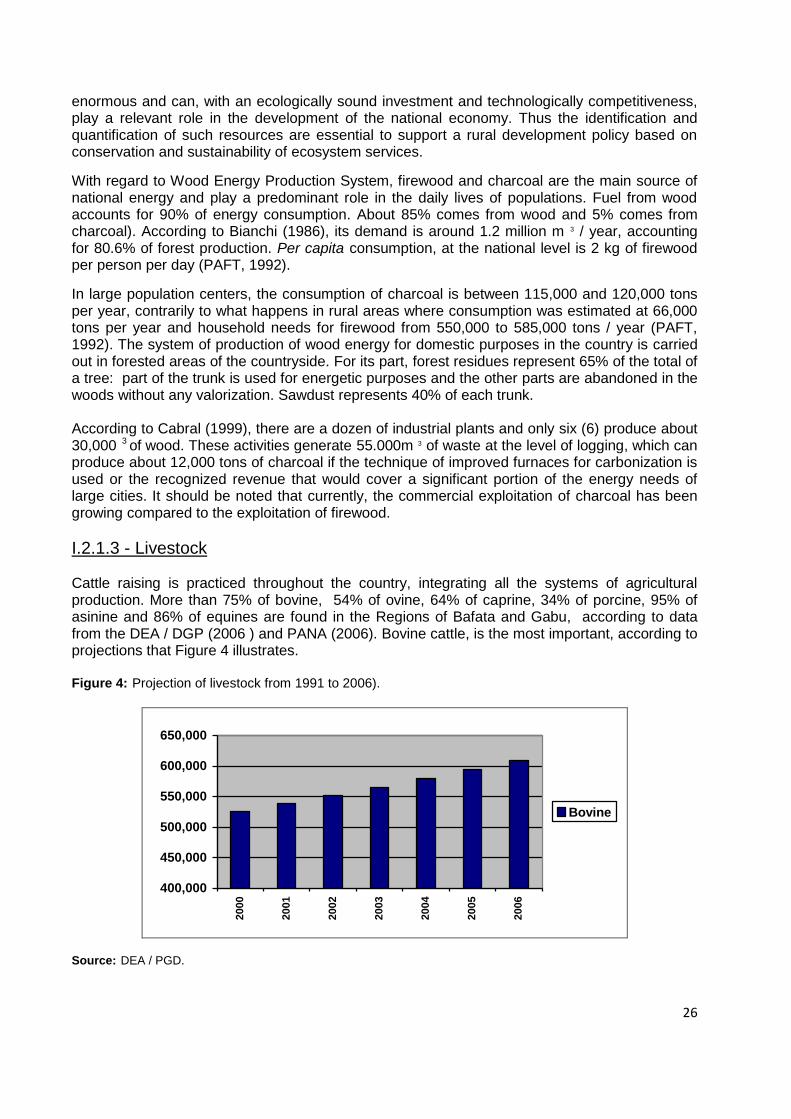
enormous and can, with an ecologically sound investment and technologically competitiveness, play a relevant role in the development of the national economy. Thus the identification and quantification of such resources are essential to support a rural development policy based on conservation and sustainability of ecosystem services. With regard to Wood Energy Production System, firewood and charcoal are the main source of national energy and play a predominant role in the daily lives of populations. Fuel from wood accounts for 90% of energy consumption. About 85% comes from wood and 5% comes from charcoal). According to Bianchi (1986), its demand is around 1.2 million m 3 / year, accounting for 80.6% of forest production. Per capita consumption, at the national level is 2 kg of firewood per person per day (PAFT, 1992). In large population centers, the consumption of charcoal is between 115,000 and 120,000 tons per year, contrarily to what happens in rural areas where consumption was estimated at 66,000 tons per year and household needs for firewood from 550,000 to 585,000 tons / year (PAFT, 1992). The system of production of wood energy for domestic purposes in the country is carried out in forested areas of the countryside. For its part, forest residues represent 65% of the total of a tree: part of the trunk is used for energetic purposes and the other parts are abandoned in the woods without any valorization. Sawdust represents 40% of each trunk. According to Cabral (1999), there are a dozen of industrial plants and only six (6) produce about 30,000 3 of wood. These activities generate 55.000m 3 of waste at the level of logging, which can produce about 12,000 tons of charcoal if the technique of improved furnaces for carbonization is used or the recognized revenue that would cover a significant portion of the energy needs of large cities. It should be noted that currently, the commercial exploitation of charcoal has been growing compared to the exploitation of firewood. I.2.1.3 - Livestock Cattle raising is practiced throughout the country, integrating all the systems of agricultural production. More than 75% of bovine, 54% of ovine, 64% of caprine, 34% of porcine, 95% of asinine and 86% of equines are found in the Regions of Bafata and Gabu, according to data from the DEA / DGP (2006 ) and PANA (2006). Bovine cattle, is the most important, according to projections that Figure 4 illustrates. Figure 4: Projection of livestock from 1991 to 2006).
400,000
450,000
500,000
550,000
600,000
650,000
2000
2001
2002
2003
2004
2005
2006
Bovine
Source: DEA / PGD.
27
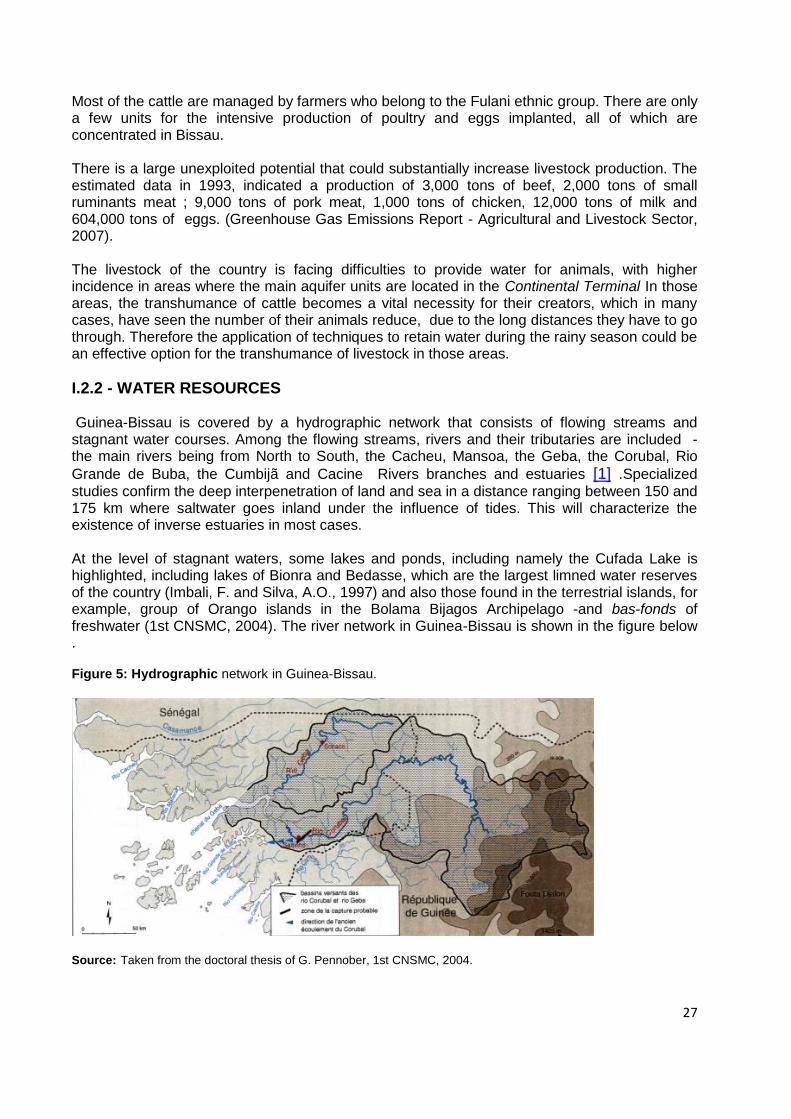
Most of the cattle are managed by farmers who belong to the Fulani ethnic group. There are only a few units for the intensive production of poultry and eggs implanted, all of which are concentrated in Bissau. There is a large unexploited potential that could substantially increase livestock production. The estimated data in 1993, indicated a production of 3,000 tons of beef, 2,000 tons of small ruminants meat ; 9,000 tons of pork meat, 1,000 tons of chicken, 12,000 tons of milk and 604,000 tons of eggs. (Greenhouse Gas Emissions Report - Agricultural and Livestock Sector, 2007). The livestock of the country is facing difficulties to provide water for animals, with higher incidence in areas where the main aquifer units are located in the Continental Terminal In those areas, the transhumance of cattle becomes a vital necessity for their creators, which in many cases, have seen the number of their animals reduce, due to the long distances they have to go through. Therefore the application of techniques to retain water during the rainy season could be an effective option for the transhumance of livestock in those areas. I.2.2 - WATER RESOURCES Guinea-Bissau is covered by a hydrographic network that consists of flowing streams and stagnant water courses. Among the flowing streams, rivers and their tributaries are included - the main rivers being from North to South, the Cacheu, Mansoa, the Geba, the Corubal, Rio
Grande de Buba, the Cumbijã and Cacine Rivers branches and estuaries [1] .Specialized
studies confirm the deep interpenetration of land and sea in a distance ranging between 150 and 175 km where saltwater goes inland under the influence of tides. This will characterize the existence of inverse estuaries in most cases. At the level of stagnant waters, some lakes and ponds, including namely the Cufada Lake is highlighted, including lakes of Bionra and Bedasse, which are the largest limned water reserves of the country (Imbali, F. and Silva, A.O., 1997) and also those found in the terrestrial islands, for example, group of Orango islands in the Bolama Bijagos Archipelago -and bas-fonds of freshwater (1st CNSMC, 2004). The river network in Guinea-Bissau is shown in the figure below . Figure 5: Hydrographic network in Guinea-Bissau.
Source: Taken from the doctoral thesis of G. Pennober, 1st CNSMC, 2004.
28
The Corubal River, with an average annual volume of 130,000 million m 3 and very significant flow rates, (11 m 3 / s on average), during the dry season, is the most important surface water resource in the country. The rocky side post of Cussilinta protects the resource from penetration of seawater. The current exploitation of the waters of Corubal is limited to some hydraulic equipment for hydro-agriculture. (1st CNSMC, 2004). According to data from this same source, the hydraulic contribution of the Geba River is more modest, and the average annual volume is estimated at Bafata as being 800 million m 3, and there are periods of drought at some of its tributaries, as is the case of Bidigor. The current volumes are only half of the amount mentioned, due to the combined effect of drought and volumes diverted for irrigation for agricultural lands of Anambé, Senegal. The flow volume of the Geba River is also affected by the construction of dams at Anambé and Kaleta. The decrease in flow rates and the weak slope of the river may have the effect of rising of salt water, imperiling the existing hydro-agricultural potential of Bafata’s upstream. Some non permanent communities extract from the standing water for irrigation.
[1] All of them except the Corubal River, lead to the Bijagós Delta (as is the case of Geba) or the Atlantic Ocean.
Both the Geba River as the Coruba River emerges from the Futa Djalon Mountains in Guinea-Conakry. The other that emerges in the Guinean inland are powered by the Continental terminal. In short, the country has significant water resources, according to the Headmaster Scheme DGRH 1997, estimated at 14 billion/ m3 per year, and renewable resources of the deep aquifers evaluated between 8 to 29 billion m3 per year and surface aquifers in the hundreds of billions of m3/year. In 1991, the exploitation of surface water from the Geba and Corubal Rivers was estimated at 1.5 million m 3. .According to PANA (2006), the rate of access to drinking water is only 45.3% for residents in rural areas, compared to 78.9% for the populations living in the Capital, Bissau City (Azinhaga et al. 2005 and 1st CNSMC, 2004).
I.2.3 - FISHING RESOURCES Guinea-Bissau is a country of vast coastal area, estimated at 22 235 km ² (equivalent to 61% of the country) and where 80% of its total population live. It has a coastline extension estimated at 170 kms. Fishing is exercised based on important production potential, favored by a low depth valued continental shelf, by the extension of the maritime front and the existence of the marine delta represented by the Bijagos Archipelago. Its EEZ has important high commercial value fishery resource, exploited by licensing for the practice of traditional and industrial fishery. The General Law on Fisheries and the Regulation of Traditional Fishing, revised in 2007, regulate the activity of this sector. Fishing activity focuses on certain species, which represent a biomass estimated at about 1,300,000 tons. The exploitable fraction of that biomass is fixed at 20%, according to the Plan for Sustainable Management of Fisheries Resources in force that is 200,000 tons of demersal and pelagic species of high commercial value and about 100,000 tons of "BALISTE species (species of low economic value and minimally exploited). It is noteworthy that studies of the sector indicate that only 20% that is exploitable is accessible to traditional fisheries at a potential of around 34,000 tons of demersal species of high commercial value and 110,000 tons of pelagic species (Lopes, 2001). Traditional fisheries, according to the author in reference, are dominated by the existence of non-motorized canoes, having increased between 1989 and 1995 at 300% both in the number of canoes and in number of fishermen. Consequently, catch levels have also increased by about 400%, i.e. 10,000 tons in 1989 compared to 52,000 tons in 1995.
29
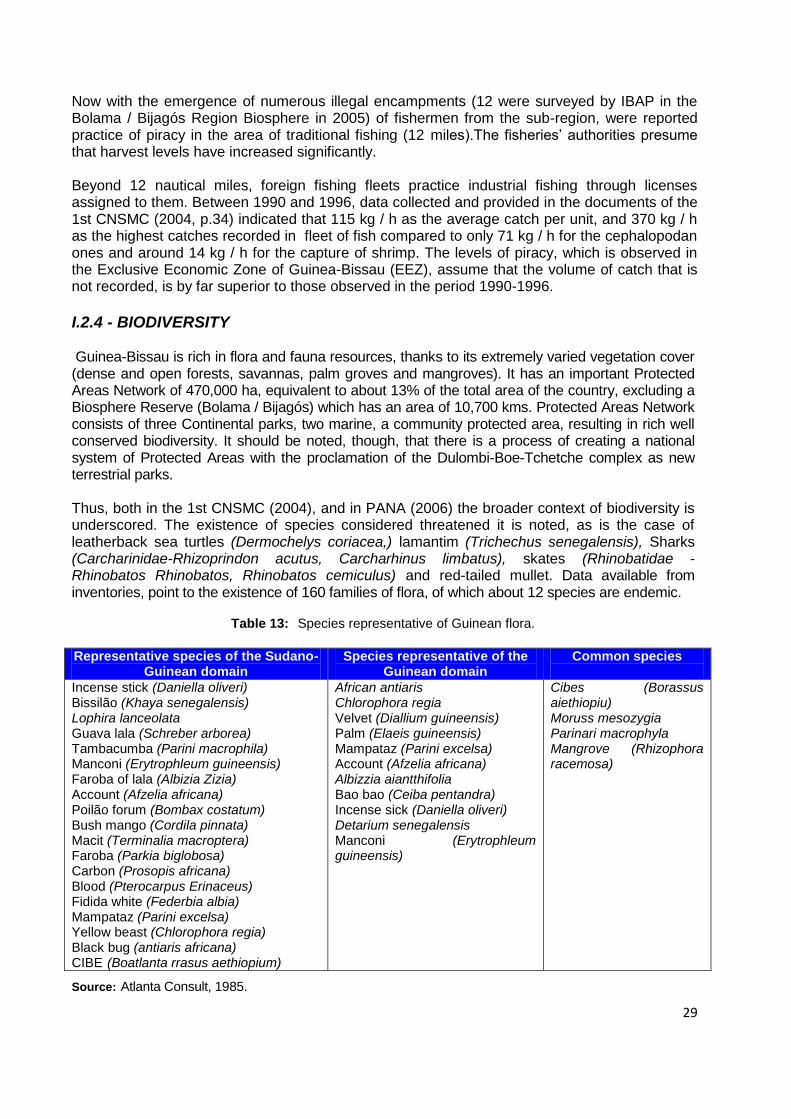
Now with the emergence of numerous illegal encampments (12 were surveyed by IBAP in the Bolama / Bijagós Region Biosphere in 2005) of fishermen from the sub-region, were reported practice of piracy in the area of traditional fishing (12 miles).The fisheries’ authorities presume that harvest levels have increased significantly. Beyond 12 nautical miles, foreign fishing fleets practice industrial fishing through licenses assigned to them. Between 1990 and 1996, data collected and provided in the documents of the 1st CNSMC (2004, p.34) indicated that 115 kg / h as the average catch per unit, and 370 kg / h as the highest catches recorded in fleet of fish compared to only 71 kg / h for the cephalopodan ones and around 14 kg / h for the capture of shrimp. The levels of piracy, which is observed in the Exclusive Economic Zone of Guinea-Bissau (EEZ), assume that the volume of catch that is not recorded, is by far superior to those observed in the period 1990-1996. I.2.4 - BIODIVERSITY Guinea-Bissau is rich in flora and fauna resources, thanks to its extremely varied vegetation cover (dense and open forests, savannas, palm groves and mangroves). It has an important Protected Areas Network of 470,000 ha, equivalent to about 13% of the total area of the country, excluding a Biosphere Reserve (Bolama / Bijagós) which has an area of 10,700 kms. Protected Areas Network consists of three Continental parks, two marine, a community protected area, resulting in rich well conserved biodiversity. It should be noted, though, that there is a process of creating a national system of Protected Areas with the proclamation of the Dulombi-Boe-Tchetche complex as new terrestrial parks. Thus, both in the 1st CNSMC (2004), and in PANA (2006) the broader context of biodiversity is underscored. The existence of species considered threatened it is noted, as is the case of leatherback sea turtles (Dermochelys coriacea,) lamantim (Trichechus senegalensis), Sharks (Carcharinidae-Rhizoprindon acutus, Carcharhinus limbatus), skates (Rhinobatidae - Rhinobatos Rhinobatos, Rhinobatos cemiculus) and red-tailed mullet. Data available from inventories, point to the existence of 160 families of flora, of which about 12 species are endemic.
Table 13: Species representative of Guinean flora.
Representative species of the Sudano-
Guinean domain Species representative of the
Guinean domain Common species
Incense stick (Daniella oliveri) Bissilão (Khaya senegalensis) Lophira lanceolata Guava lala (Schreber arborea) Tambacumba (Parini macrophila) Manconi (Erytrophleum guineensis) Faroba of lala (Albizia Zizia) Account (Afzelia africana) Poilão forum (Bombax costatum) Bush mango (Cordila pinnata) Macit (Terminalia macroptera) Faroba (Parkia biglobosa) Carbon (Prosopis africana) Blood (Pterocarpus Erinaceus) Fidida white (Federbia albia) Mampataz (Parini excelsa) Yellow beast (Chlorophora regia) Black bug (antiaris africana) CIBE (Boatlanta rrasus aethiopium)
African antiaris Chlorophora regia Velvet (Diallium guineensis) Palm (Elaeis guineensis) Mampataz (Parini excelsa) Account (Afzelia africana) Albizzia aiantthifolia Bao bao (Ceiba pentandra) Incense sick (Daniella oliveri) Detarium senegalensis Manconi (Erytrophleum guineensis)
Cibes (Borassus aiethiopiu) Moruss mesozygia Parinari macrophyla Mangrove (Rhizophora racemosa)
Source: Atlanta Consult, 1985.
30
As for fauna, the following were identified:
11 species of primates;
21 species of carnivores;
19 ungulates;
8 species of rodents;
10 species of bats;
374 bird species, divided into about 31 families, especially about 30 species which include sandpipers, gulls and terns;
85 species of reptiles and 31 amphibians inventoried (only in the Bijagos Archipelago).
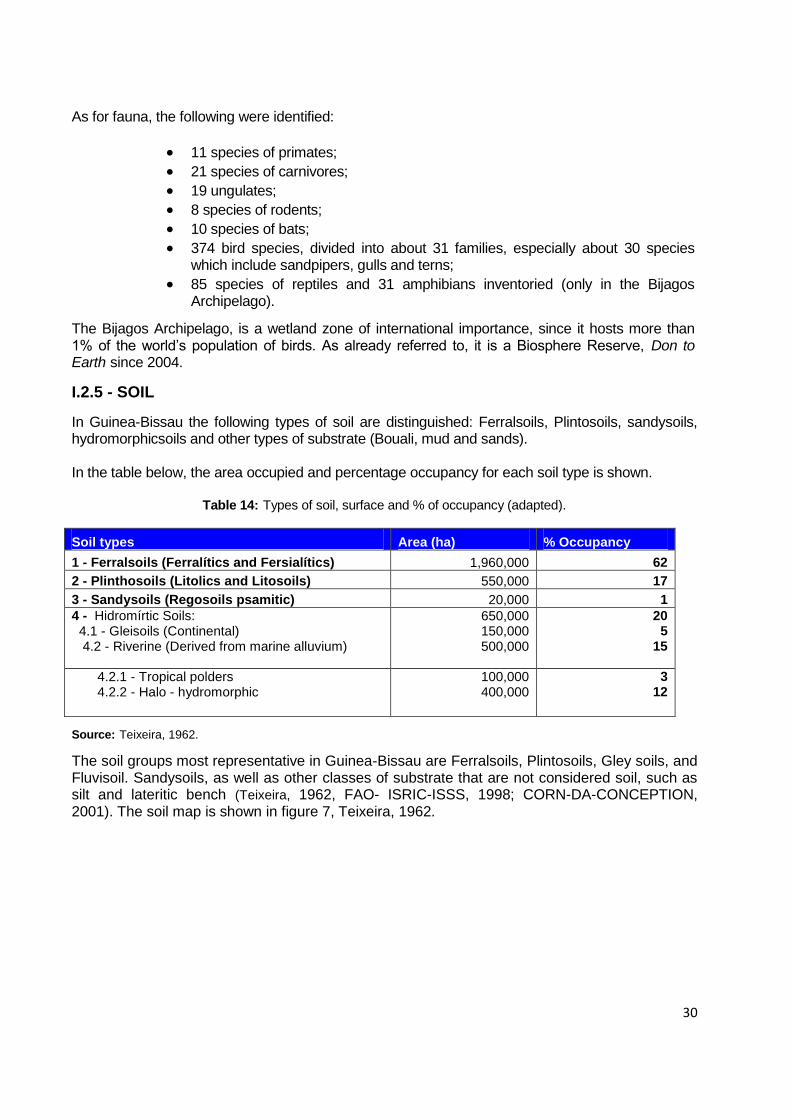
The Bijagos Archipelago, is a wetland zone of international importance, since it hosts more than 1% of the world’s population of birds. As already referred to, it is a Biosphere Reserve, Don to Earth since 2004. I.2.5 - SOIL In Guinea-Bissau the following types of soil are distinguished: Ferralsoils, Plintosoils, sandysoils, hydromorphicsoils and other types of substrate (Bouali, mud and sands). In the table below, the area occupied and percentage occupancy for each soil type is shown.
Table 14: Types of soil, surface and % of occupancy (adapted).
Soil types Area (ha) % Occupancy 1 - Ferralsoils (Ferralítics and Fersialítics) 1,960,000 62 2 - Plinthosoils (Litolics and Litosoils) 550,000 17
3 - Sandysoils (Regosoils psamitic) 20,000 1
4 - Hidromírtic Soils: 4.1 - Gleisoils (Continental) 4.2 - Riverine (Derived from marine alluvium)
650,000 150,000 500,000
20 5
15
4.2.1 - Tropical polders 4.2.2 - Halo - hydromorphic
100,000 400,000
3 12
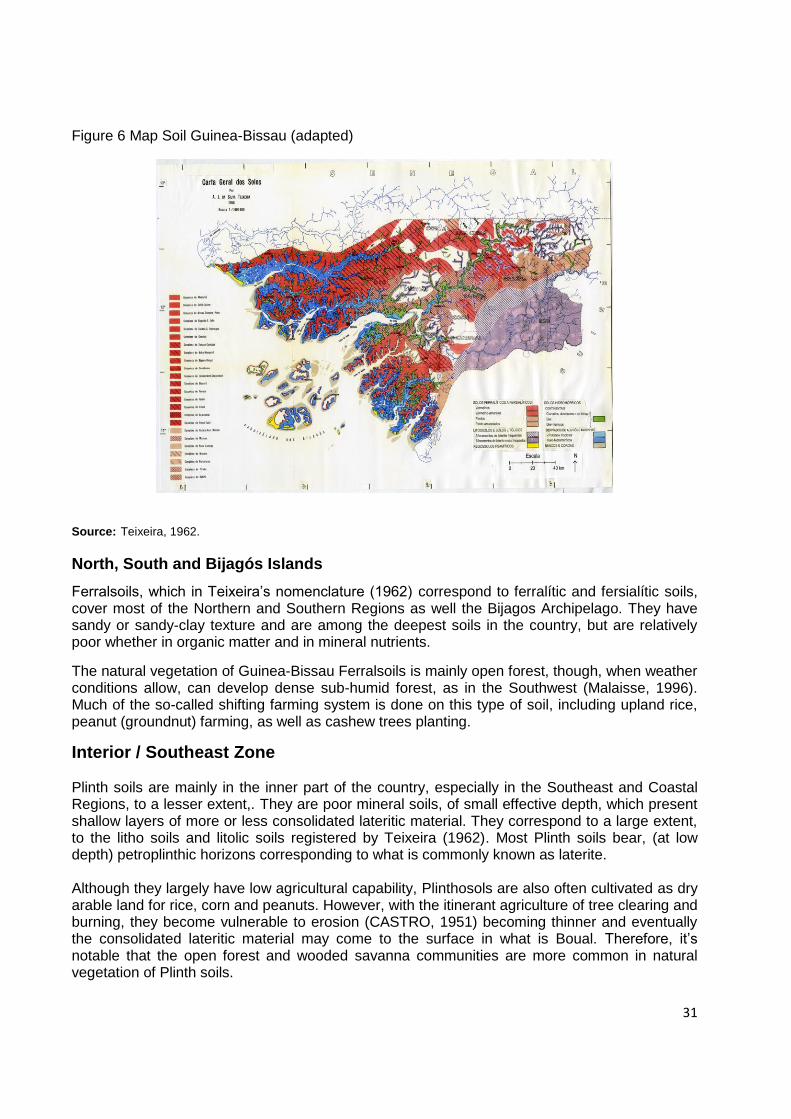
Source: Teixeira, 1962. The soil groups most representative in Guinea-Bissau are Ferralsoils, Plintosoils, Gley soils, and Fluvisoil. Sandysoils, as well as other classes of substrate that are not considered soil, such as silt and lateritic bench (Teixeira, 1962, FAO- ISRIC-ISSS, 1998; CORN-DA-CONCEPTION, 2001). The soil map is shown in figure 7, Teixeira, 1962.
31
Figure 6 Map Soil Guinea-Bissau (adapted)
Source: Teixeira, 1962.
North, South and Bijagós Islands Ferralsoils, which in Teixeira’s nomenclature (1962) correspond to ferralític and fersialític soils, cover most of the Northern and Southern Regions as well the Bijagos Archipelago. They have sandy or sandy-clay texture and are among the deepest soils in the country, but are relatively poor whether in organic matter and in mineral nutrients. The natural vegetation of Guinea-Bissau Ferralsoils is mainly open forest, though, when weather conditions allow, can develop dense sub-humid forest, as in the Southwest (Malaisse, 1996). Much of the so-called shifting farming system is done on this type of soil, including upland rice, peanut (groundnut) farming, as well as cashew trees planting. Interior / Southeast Zone Plinth soils are mainly in the inner part of the country, especially in the Southeast and Coastal Regions, to a lesser extent,. They are poor mineral soils, of small effective depth, which present shallow layers of more or less consolidated lateritic material. They correspond to a large extent, to the litho soils and litolic soils registered by Teixeira (1962). Most Plinth soils bear, (at low depth) petroplinthic horizons corresponding to what is commonly known as laterite. Although they largely have low agricultural capability, Plinthosols are also often cultivated as dry arable land for rice, corn and peanuts. However, with the itinerant agriculture of tree clearing and burning, they become vulnerable to erosion (CASTRO, 1951) becoming thinner and eventually the consolidated lateritic material may come to the surface in what is Boual. Therefore, it’s notable that the open forest and wooded savanna communities are more common in natural vegetation of Plinth soils.
32
Northwest and Southwest Coastal Regions of Mainland In these regions and some islands of the Bijagos Archipelago, such as Orango and Formosa, aerosols are found, although in a small fraction of the territory. They are sandy soils mainly quartz, with little deep organic matter, that are well drained and derived from consolidated dunes. Psamitic Regosoils correspond to the nomenclature used by Teixeira (1962) and sometimes mounted on muddy deposits, so that in depressed areas they can have high humidity. They are occupied mostly by wooded savannah. Interior lowlands and higher parts of rivers Gleisoils occur in inner lowlands and along the upper and middle sections of rivers on the mainland and some islands of the Bijagos Archipelago. These soils have fine texture and originate from alluvial, generally rich in organic matter in the upper horizons. They evolve under temporary swamping, presenting hydro-orphism, although sometimes poorly marked. They are considered to be derived from materials consisting of fine sand and / or limos earth, usually in a high percentage, transported by water and deposited on the surfaces by natural drainage. According to Teixeira (1962), they correspond to hydromorphic that come from continental origin. The main natural vegetation on these soils is called lala, almost exclusively herbaceous savanna from the lowlands which are periodically flooded, as well on the edge of these areas and in less swampy or elevated zones. There are also Elaeis guineensis palm-trees on these soils. These soils are also often used for irrigated rice cultivation, constituting freshwater rice fields. Coast Line and Lower Rivers Areas Fluvisoils occur in these areas. These soils are fine textured of fluvial origin, often affected by salt or brackish water and therefore high in sodium. According to Teixeira’s (1962), classification, they correspond to hydromorphic soils derived from marine alluvium. The natural vegetation on these soils consists mainly of mangroves and saltwater lala. The Fluvisoils are more fertile than the Gleisoils and are often used for growing rice in so-called salty water rice fields. Through the construction of levees, rain water is gradually desalted , constituting the so-called tropical "polders" (Teixeira, 1962). Cufada Park, by Corubal In this area, where there are outcrops of dolerite, the lixissoils derived from basic rocks are registered (MILHO-DA-CONCEICAO, 2001).The vegetation on these soils consists of wide forrests tree specimens, which can be explained either by the characteristics of the soil, or by proximity to the Corubal River. On a smaller scale, Boual also exist. Boé Region In this region other types of substrate - Boual exist, which is an area where a lateritic shield of variable thickness is on the surface without being covered with fine soil particles. Human activity, relating to the destruction of natural vegetation through overthrowing and / or burning, can contribute to accelerate the destruction of soil and outcrop on the surface of the lateritic breastplates in an unpredictable scale (CASTRO, 1951). West Zone of the mainland and some islands
33
These areas have coastal sands and siltstones. Alluvial deposits, with no stratification, are distributed along the periodically flooded margins of much of the coast, where areas are colonized by mangroves. I.2.6 - MINERAL RESOURCES The inventory of Guinea-Bissau minerals is reported in the General Directorate of Geology and Mining, in a database system with 85 minerals, 12 of which are useful; sands, gravel, clay, kaolin, laterite, shell limestone, quartzite, granite, dolerite, bauxite, black sand and phosphate. The country's potential in minerals was assessed and a plan has been outlined for their development in order to assist the Government to outline its mineral policy. The mining of bauxite is already underway in the area of Boe and includes a paved road linking Quebo to Boké with preliminary work already underway to construct new roads linking the area of bauxite exploitation to the Port of Buba (Cuntabane-Boe-Munhini), as well as other new roads that will link Tchetche-Beli-Boké, Gabu-Canquelifa-Buruntuma Boké-and-Pirada Canquelifa-Buruntuma-Boké. According to the Angola Bauxite Company, this region of the country has nine (9) bauxite deposits, six (6) of which are of great importance, given their significant quantities in reserves and their high contents. Studies confirm that there are proven reserves of around 113 million tons of bauxite and over 100 million tons classified as reserves. Using an estimated production of about 2 million tons per year, the life expectancy of the proved reserves would be about 56 years, according to the Bauxite Angola Website, (presented in the Reference Section in Annex). Its exploitation will be carried out through open mining, which may increase the emission of solid particles in the atmosphere. The soil where it will be exploited, (even if restored), could lose its ability to retain water, making it unsuitable for annual crops and as a result cause significant rainforest destruction. According to Switkes, (2007) tropical areas where bauxite ore is found usually are strongholds of biodiversity on earth. This mining activity may have an impact on the degradation of landscape, noise and vibration, dust and gas, water contamination, siltation of peripheral lakes, waste production, motor vehicle traffic, etc... (Silva 2007). Three (3) major investments are projected in infrastructure, including a port in the town of Buba, a highway and a power supply system to enable the evacuation of mining production. The opening of the highway linking Cuntabane-Boe-Munhini and the widening of the road from Buba to the Buba Port has decimated large areas of forests, which led to fragmentation of the landscape in some areas whose consequences are serious for some species. Even more new highways may possibly be opened linking various operating mining sites or deposits. The deforestation performed as a result of opening new roads to the Buba Port may contribute to the destruction of biodiversity, erosion and soil depletion (Leach and Lateritization), siltation of rivers (vendus), decreasing of rainfall rate, increasing of temperature, desertification, proliferation of diseases and pests. According to information, some companies have carried out exploration in 12 offshore petroleum blocks, with a positive perspective for exploitation. Thus, taking into account the environmental threats that the exploitation of these minerals imply, according to the way they are being done, it is urgent to carry out an environmental impact study and elaborate proposals for mitigation measures, so that the exploitation of these minerals does
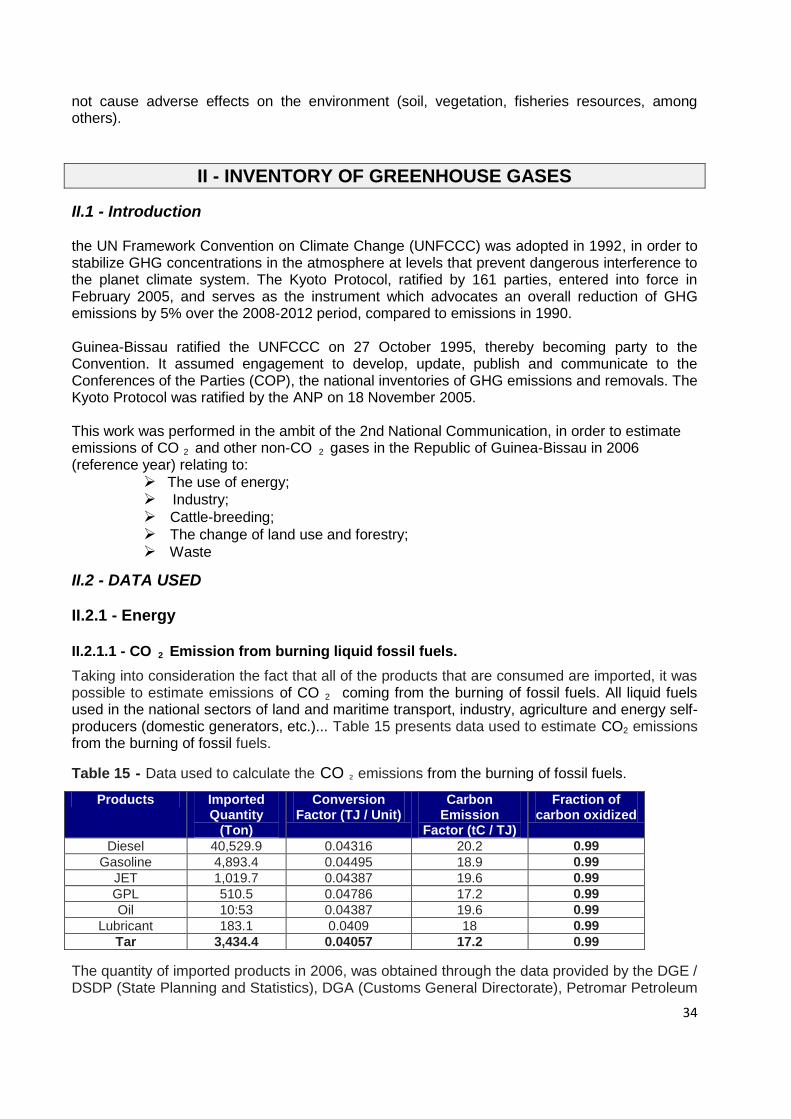
34
not cause adverse effects on the environment (soil, vegetation, fisheries resources, among others).
II - INVENTORY OF GREENHOUSE GASES II.1 - Introduction the UN Framework Convention on Climate Change (UNFCCC) was adopted in 1992, in order to stabilize GHG concentrations in the atmosphere at levels that prevent dangerous interference to the planet climate system. The Kyoto Protocol, ratified by 161 parties, entered into force in February 2005, and serves as the instrument which advocates an overall reduction of GHG emissions by 5% over the 2008-2012 period, compared to emissions in 1990. Guinea-Bissau ratified the UNFCCC on 27 October 1995, thereby becoming party to the Convention. It assumed engagement to develop, update, publish and communicate to the Conferences of the Parties (COP), the national inventories of GHG emissions and removals. The Kyoto Protocol was ratified by the ANP on 18 November 2005. This work was performed in the ambit of the 2nd National Communication, in order to estimate emissions of CO 2 and other non-CO 2 gases in the Republic of Guinea-Bissau in 2006 (reference year) relating to:
The use of energy; Industry; Cattle-breeding; The change of land use and forestry; Waste
II.2 - DATA USED II.2.1 - Energy II.2.1.1 - CO 2 Emission from burning liquid fossil fuels. Taking into consideration the fact that all of the products that are consumed are imported, it was possible to estimate emissions of CO 2 coming from the burning of fossil fuels. All liquid fuels used in the national sectors of land and maritime transport, industry, agriculture and energy self-producers (domestic generators, etc.)... Table 15 presents data used to estimate CO2 emissions from the burning of fossil fuels. Table 15 - Data used to calculate the CO 2 emissions from the burning of fossil fuels.
Products Imported
Quantity (Ton)
Conversion Factor (TJ / Unit)
Carbon Emission
Factor (tC / TJ)
Fraction of carbon oxidized
Diesel 40,529.9 0.04316 20.2 0.99 Gasoline 4,893.4 0.04495 18.9 0.99
JET 1,019.7 0.04387 19.6 0.99 GPL 510.5 0.04786 17.2 0.99 Oil 10:53 0.04387 19.6 0.99
Lubricant 183.1 0.0409 18 0.99 Tar 3,434.4 0.04057 17.2 0.99
The quantity of imported products in 2006, was obtained through the data provided by the DGE / DSDP (State Planning and Statistics), DGA (Customs General Directorate), Petromar Petroleum
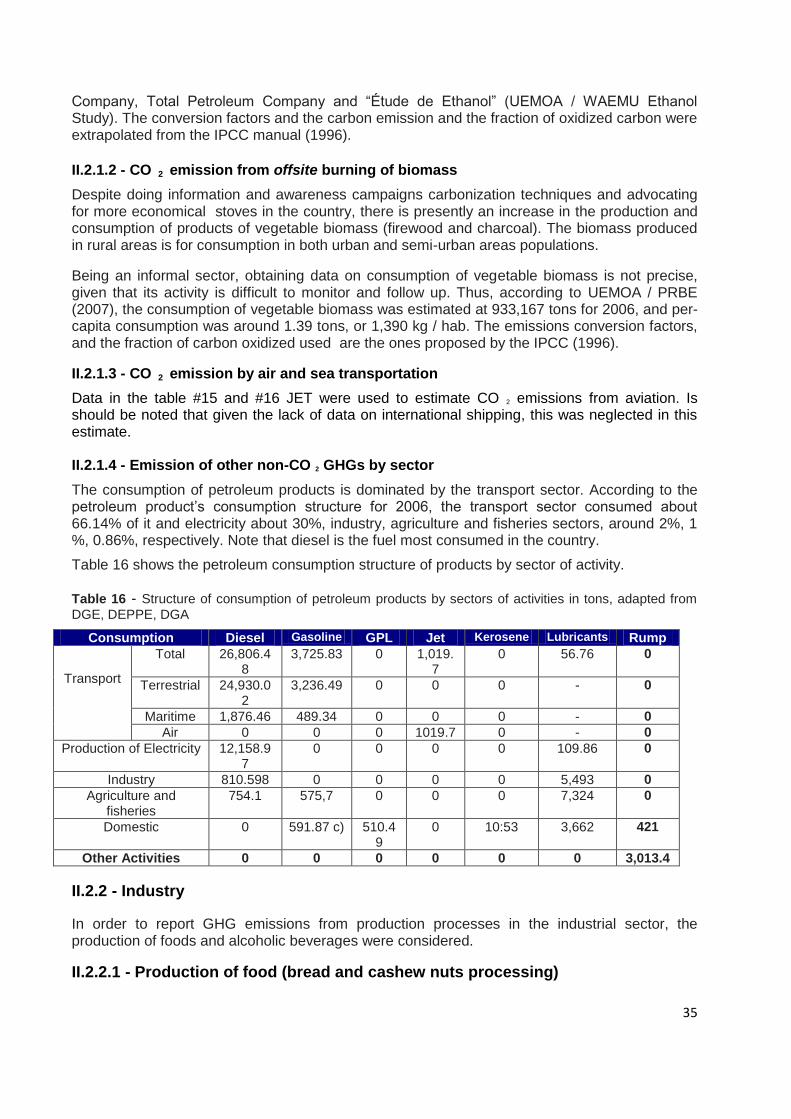
35
Company, Total Petroleum Company and “Étude de Ethanol” (UEMOA / WAEMU Ethanol Study). The conversion factors and the carbon emission and the fraction of oxidized carbon were extrapolated from the IPCC manual (1996). II.2.1.2 - CO 2 emission from offsite burning of biomass Despite doing information and awareness campaigns carbonization techniques and advocating for more economical stoves in the country, there is presently an increase in the production and consumption of products of vegetable biomass (firewood and charcoal). The biomass produced in rural areas is for consumption in both urban and semi-urban areas populations. Being an informal sector, obtaining data on consumption of vegetable biomass is not precise, given that its activity is difficult to monitor and follow up. Thus, according to UEMOA / PRBE (2007), the consumption of vegetable biomass was estimated at 933,167 tons for 2006, and per-capita consumption was around 1.39 tons, or 1,390 kg / hab. The emissions conversion factors, and the fraction of carbon oxidized used are the ones proposed by the IPCC (1996). II.2.1.3 - CO 2 emission by air and sea transportation Data in the table #15 and #16 JET were used to estimate CO 2 emissions from aviation. Is should be noted that given the lack of data on international shipping, this was neglected in this estimate. II.2.1.4 - Emission of other non-CO 2 GHGs by sector The consumption of petroleum products is dominated by the transport sector. According to the petroleum product’s consumption structure for 2006, the transport sector consumed about 66.14% of it and electricity about 30%, industry, agriculture and fisheries sectors, around 2%, 1 %, 0.86%, respectively. Note that diesel is the fuel most consumed in the country. Table 16 shows the petroleum consumption structure of products by sector of activity. Table 16 - Structure of consumption of petroleum products by sectors of activities in tons, adapted from
DGE, DEPPE, DGA
Consumption Diesel Gasoline GPL Jet Kerosene Lubricants Rump
Transport
Total 26,806.48
3,725.83 0 1,019.7
0 56.76 0
Terrestrial 24,930.02
3,236.49 0 0 0 - 0
Maritime 1,876.46 489.34 0 0 0 - 0 Air 0 0 0 1019.7 0 - 0
Production of Electricity 12,158.97
0 0 0 0 109.86 0
Industry 810.598 0 0 0 0 5,493 0 Agriculture and
fisheries 754.1 575,7 0 0 0 7,324 0
Domestic 0 591.87 c) 510.49
0 10:53 3,662 421
Other Activities 0 0 0 0 0 0 3,013.4 II.2.2 - Industry In order to report GHG emissions from production processes in the industrial sector, the production of foods and alcoholic beverages were considered. II.2.2.1 - Production of food (bread and cashew nuts processing)
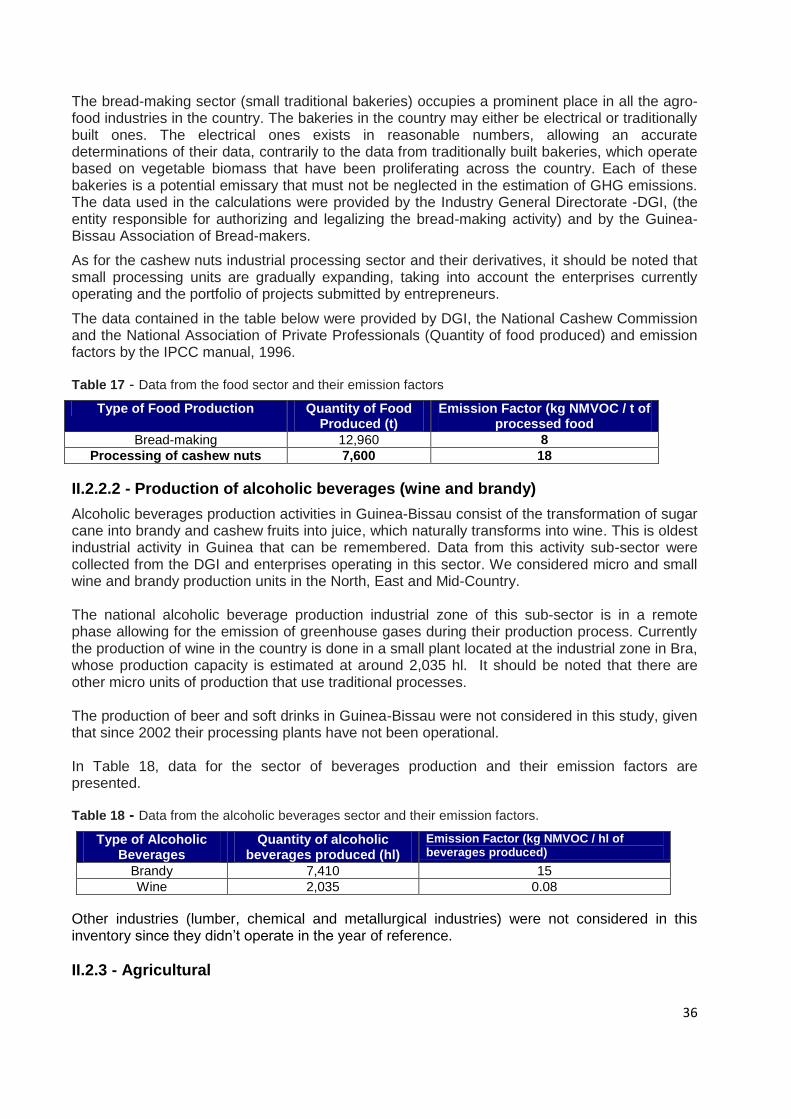
36
The bread-making sector (small traditional bakeries) occupies a prominent place in all the agro-food industries in the country. The bakeries in the country may either be electrical or traditionally built ones. The electrical ones exists in reasonable numbers, allowing an accurate determinations of their data, contrarily to the data from traditionally built bakeries, which operate based on vegetable biomass that have been proliferating across the country. Each of these bakeries is a potential emissary that must not be neglected in the estimation of GHG emissions. The data used in the calculations were provided by the Industry General Directorate -DGI, (the entity responsible for authorizing and legalizing the bread-making activity) and by the Guinea-Bissau Association of Bread-makers. As for the cashew nuts industrial processing sector and their derivatives, it should be noted that small processing units are gradually expanding, taking into account the enterprises currently operating and the portfolio of projects submitted by entrepreneurs. The data contained in the table below were provided by DGI, the National Cashew Commission and the National Association of Private Professionals (Quantity of food produced) and emission factors by the IPCC manual, 1996. Table 17 - Data from the food sector and their emission factors
Type of Food Production Quantity of Food
Produced (t) Emission Factor (kg NMVOC / t of
processed food Bread-making 12,960 8
Processing of cashew nuts 7,600 18
II.2.2.2 - Production of alcoholic beverages (wine and brandy) Alcoholic beverages production activities in Guinea-Bissau consist of the transformation of sugar cane into brandy and cashew fruits into juice, which naturally transforms into wine. This is oldest industrial activity in Guinea that can be remembered. Data from this activity sub-sector were collected from the DGI and enterprises operating in this sector. We considered micro and small wine and brandy production units in the North, East and Mid-Country. The national alcoholic beverage production industrial zone of this sub-sector is in a remote phase allowing for the emission of greenhouse gases during their production process. Currently the production of wine in the country is done in a small plant located at the industrial zone in Bra, whose production capacity is estimated at around 2,035 hl. It should be noted that there are other micro units of production that use traditional processes. The production of beer and soft drinks in Guinea-Bissau were not considered in this study, given that since 2002 their processing plants have not been operational. In Table 18, data for the sector of beverages production and their emission factors are presented.
Table 18 - Data from the alcoholic beverages sector and their emission factors.
Type of Alcoholic
Beverages Quantity of alcoholic
beverages produced (hl) Emission Factor (kg NMVOC / hl of beverages produced)
Brandy 7,410 15 Wine 2,035 0.08
Other industries (lumber, chemical and metallurgical industries) were not considered in this inventory since they didn’t operate in the year of reference. II.2.3 - Agricultural
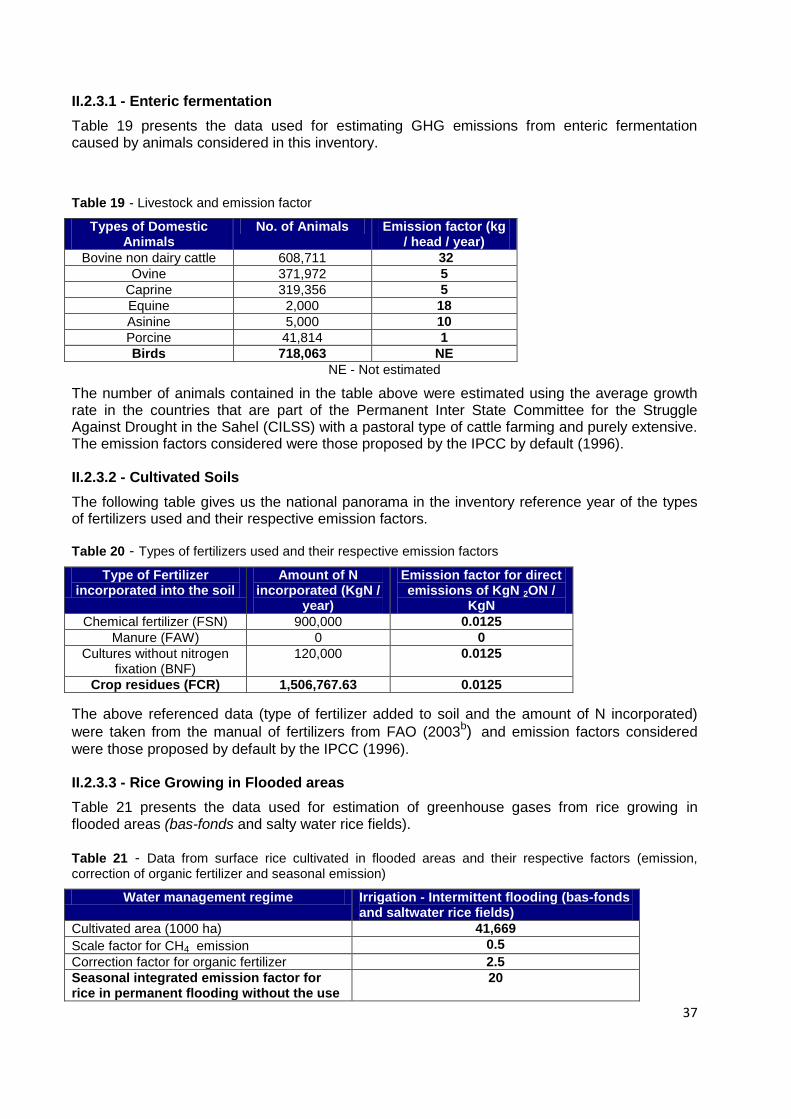
37
II.2.3.1 - Enteric fermentation Table 19 presents the data used for estimating GHG emissions from enteric fermentation caused by animals considered in this inventory. Table 19 - Livestock and emission factor
Types of Domestic
Animals No. of Animals Emission factor (kg
/ head / year) Bovine non dairy cattle 608,711 32
Ovine 371,972 5 Caprine 319,356 5 Equine 2,000 18 Asinine 5,000 10 Porcine 41,814 1 Birds 718,063 NE
NE - Not estimated The number of animals contained in the table above were estimated using the average growth rate in the countries that are part of the Permanent Inter State Committee for the Struggle Against Drought in the Sahel (CILSS) with a pastoral type of cattle farming and purely extensive. The emission factors considered were those proposed by the IPCC by default (1996). II.2.3.2 - Cultivated Soils The following table gives us the national panorama in the inventory reference year of the types of fertilizers used and their respective emission factors. Table 20 - Types of fertilizers used and their respective emission factors
Type of Fertilizer
incorporated into the soil Amount of N
incorporated (KgN / year)
Emission factor for direct emissions of KgN 2ON /
KgN Chemical fertilizer (FSN) 900,000 0.0125
Manure (FAW) 0 0 Cultures without nitrogen
fixation (BNF) 120,000 0.0125
Crop residues (FCR) 1,506,767.63 0.0125 The above referenced data (type of fertilizer added to soil and the amount of N incorporated)
were taken from the manual of fertilizers from FAO (2003b) and emission factors considered
were those proposed by default by the IPCC (1996). II.2.3.3 - Rice Growing in Flooded areas Table 21 presents the data used for estimation of greenhouse gases from rice growing in flooded areas (bas-fonds and salty water rice fields). Table 21 - Data from surface rice cultivated in flooded areas and their respective factors (emission, correction of organic fertilizer and seasonal emission)
Water management regime Irrigation - Intermittent flooding (bas-fonds and saltwater rice fields)
Cultivated area (1000 ha) 41,669 Scale factor for CH4 emission 0.5 Correction factor for organic fertilizer 2.5 Seasonal integrated emission factor for rice in permanent flooding without the use
20
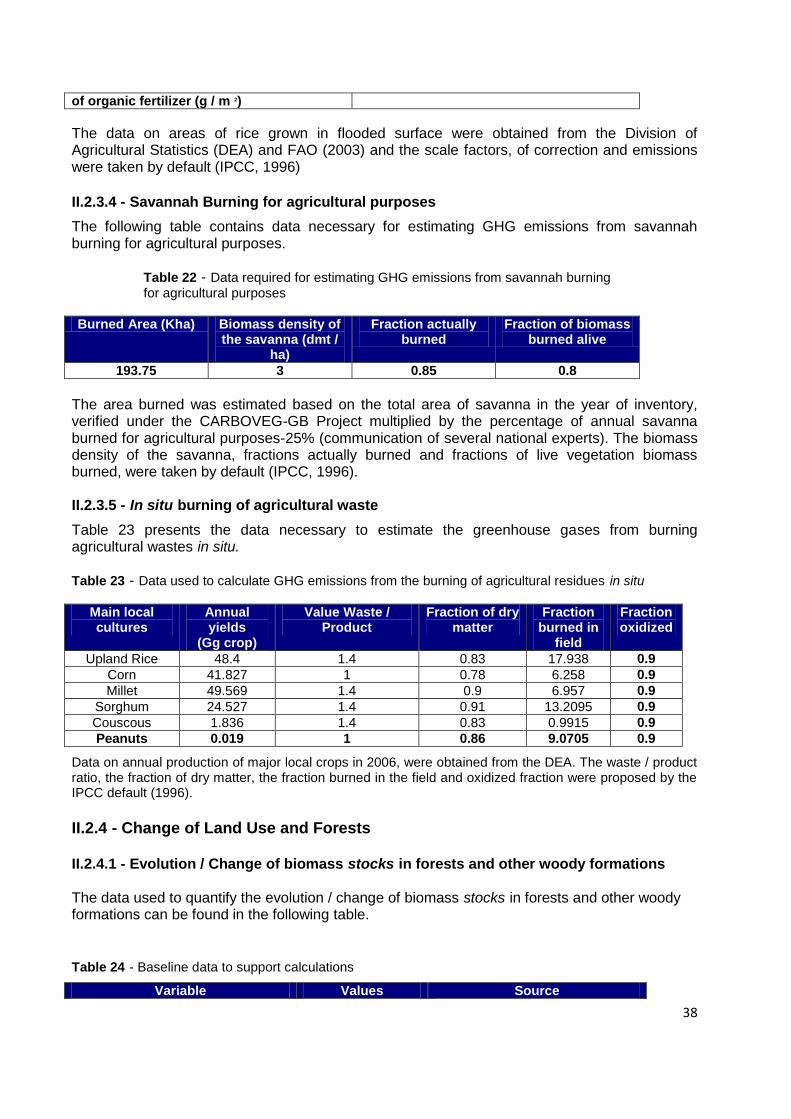
38
of organic fertilizer (g / m 2) The data on areas of rice grown in flooded surface were obtained from the Division of Agricultural Statistics (DEA) and FAO (2003) and the scale factors, of correction and emissions were taken by default (IPCC, 1996) II.2.3.4 - Savannah Burning for agricultural purposes The following table contains data necessary for estimating GHG emissions from savannah burning for agricultural purposes.
Table 22 - Data required for estimating GHG emissions from savannah burning for agricultural purposes
Burned Area (Kha) Biomass density of the savanna (dmt /
ha)
Fraction actually burned
Fraction of biomass burned alive
193.75 3 0.85 0.8 The area burned was estimated based on the total area of savanna in the year of inventory, verified under the CARBOVEG-GB Project multiplied by the percentage of annual savanna burned for agricultural purposes-25% (communication of several national experts). The biomass density of the savanna, fractions actually burned and fractions of live vegetation biomass burned, were taken by default (IPCC, 1996). II.2.3.5 - In situ burning of agricultural waste Table 23 presents the data necessary to estimate the greenhouse gases from burning agricultural wastes in situ. Table 23 - Data used to calculate GHG emissions from the burning of agricultural residues in situ
Main local cultures
Annual yields
(Gg crop)
Value Waste / Product
Fraction of dry matter
Fraction burned in
field
Fraction oxidized
Upland Rice 48.4 1.4 0.83 17.938 0.9 Corn 41.827 1 0.78 6.258 0.9 Millet 49.569 1.4 0.9 6.957 0.9
Sorghum 24.527 1.4 0.91 13.2095 0.9 Couscous 1.836 1.4 0.83 0.9915 0.9 Peanuts 0.019 1 0.86 9.0705 0.9
Data on annual production of major local crops in 2006, were obtained from the DEA. The waste / product ratio, the fraction of dry matter, the fraction burned in the field and oxidized fraction were proposed by the IPCC default (1996). II.2.4 - Change of Land Use and Forests II.2.4.1 - Evolution / Change of biomass stocks in forests and other woody formations The data used to quantify the evolution / change of biomass stocks in forests and other woody formations can be found in the following table.
Table 24 - Baseline data to support calculations
Variable Values Source
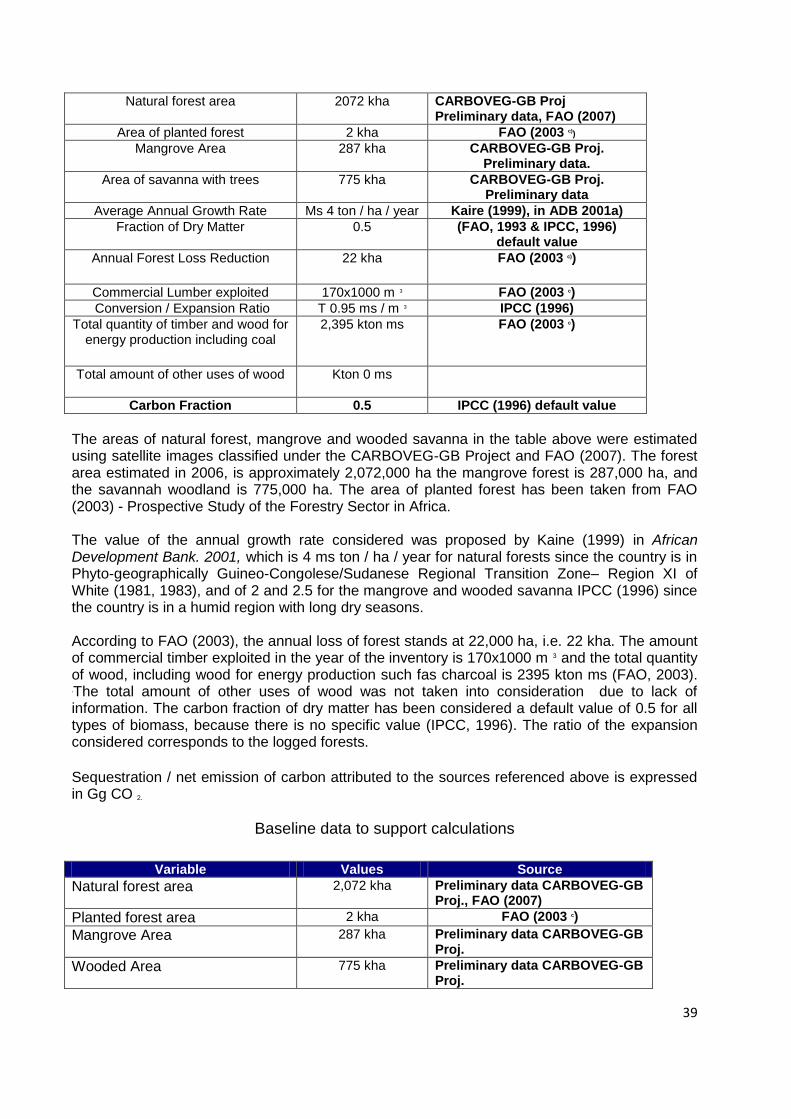
39
Natural forest area 2072 kha CARBOVEG-GB Proj Preliminary data, FAO (2007)
Area of planted forest 2 kha FAO (2003 c)) Mangrove Area 287 kha CARBOVEG-GB Proj.
Preliminary data. Area of savanna with trees 775 kha CARBOVEG-GB Proj.
Preliminary data Average Annual Growth Rate Ms 4 ton / ha / year Kaire (1999), in ADB 2001a)
Fraction of Dry Matter 0.5 (FAO, 1993 & IPCC, 1996) default value
Annual Forest Loss Reduction
22 kha FAO (2003 c))
Commercial Lumber exploited 170x1000 m 3 FAO (2003 c) Conversion / Expansion Ratio T 0.95 ms / m 3 IPCC (1996)
Total quantity of timber and wood for energy production including coal
2,395 kton ms FAO (2003 c)
Total amount of other uses of wood Kton 0 ms
Carbon Fraction 0.5 IPCC (1996) default value
The areas of natural forest, mangrove and wooded savanna in the table above were estimated using satellite images classified under the CARBOVEG-GB Project and FAO (2007). The forest area estimated in 2006, is approximately 2,072,000 ha the mangrove forest is 287,000 ha, and the savannah woodland is 775,000 ha. The area of planted forest has been taken from FAO (2003) - Prospective Study of the Forestry Sector in Africa. The value of the annual growth rate considered was proposed by Kaine (1999) in African Development Bank. 2001, which is 4 ms ton / ha / year for natural forests since the country is in Phyto-geographically Guineo-Congolese/Sudanese Regional Transition Zone– Region XI of White (1981, 1983), and of 2 and 2.5 for the mangrove and wooded savanna IPCC (1996) since the country is in a humid region with long dry seasons. According to FAO (2003), the annual loss of forest stands at 22,000 ha, i.e. 22 kha. The amount of commercial timber exploited in the year of the inventory is 170x1000 m 3 and the total quantity of wood, including wood for energy production such fas charcoal is 2395 kton ms (FAO, 2003). .The total amount of other uses of wood was not taken into consideration due to lack of information. The carbon fraction of dry matter has been considered a default value of 0.5 for all types of biomass, because there is no specific value (IPCC, 1996). The ratio of the expansion considered corresponds to the logged forests.
Sequestration / net emission of carbon attributed to the sources referenced above is expressed in Gg CO 2.
Baseline data to support calculations
Variable Values Source
Natural forest area 2,072 kha Preliminary data CARBOVEG-GB Proj., FAO (2007)
Planted forest area 2 kha FAO (2003 c)
Mangrove Area 287 kha Preliminary data CARBOVEG-GB Proj.
Wooded Area 775 kha Preliminary data CARBOVEG-GB Proj.
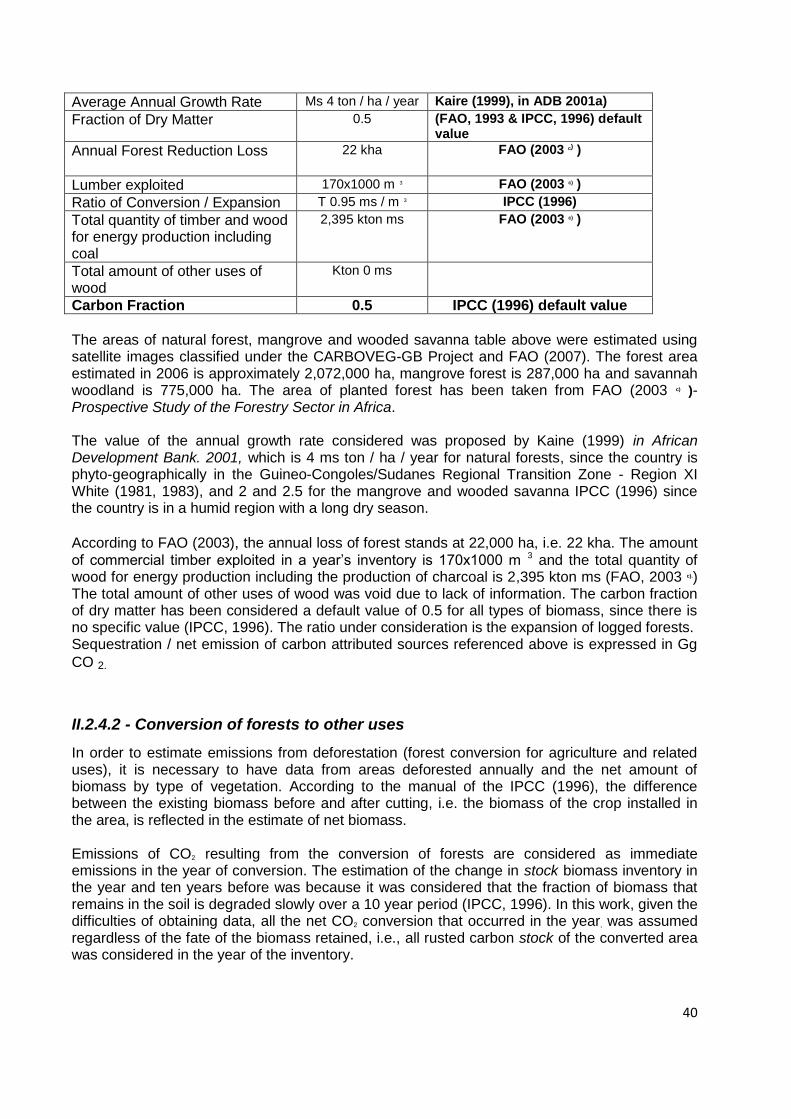
40
Average Annual Growth Rate Ms 4 ton / ha / year Kaire (1999), in ADB 2001a)
Fraction of Dry Matter 0.5 (FAO, 1993 & IPCC, 1996) default value
Annual Forest Reduction Loss
22 kha FAO (2003 c) )
Lumber exploited 170x1000 m 3 FAO (2003 c) )
Ratio of Conversion / Expansion T 0.95 ms / m 3 IPCC (1996)
Total quantity of timber and wood for energy production including coal
2,395 kton ms FAO (2003 c) )
Total amount of other uses of wood
Kton 0 ms
Carbon Fraction 0.5 IPCC (1996) default value
The areas of natural forest, mangrove and wooded savanna table above were estimated using satellite images classified under the CARBOVEG-GB Project and FAO (2007). The forest area estimated in 2006 is approximately 2,072,000 ha, mangrove forest is 287,000 ha and savannah woodland is 775,000 ha. The area of planted forest has been taken from FAO (2003 c) )- Prospective Study of the Forestry Sector in Africa. The value of the annual growth rate considered was proposed by Kaine (1999) in African Development Bank. 2001, which is 4 ms ton / ha / year for natural forests, since the country is phyto-geographically in the Guineo-Congoles/Sudanes Regional Transition Zone - Region XI White (1981, 1983), and 2 and 2.5 for the mangrove and wooded savanna IPCC (1996) since the country is in a humid region with a long dry season. According to FAO (2003), the annual loss of forest stands at 22,000 ha, i.e. 22 kha. The amount
of commercial timber exploited in a year’s inventory is 170x1000 m 3 and the total quantity of wood for energy production including the production of charcoal is 2,395 kton ms (FAO, 2003 c).) The total amount of other uses of wood was void due to lack of information. The carbon fraction of dry matter has been considered a default value of 0.5 for all types of biomass, since there is no specific value (IPCC, 1996). The ratio under consideration is the expansion of logged forests. Sequestration / net emission of carbon attributed sources referenced above is expressed in Gg
CO 2.
II.2.4.2 - Conversion of forests to other uses In order to estimate emissions from deforestation (forest conversion for agriculture and related uses), it is necessary to have data from areas deforested annually and the net amount of biomass by type of vegetation. According to the manual of the IPCC (1996), the difference between the existing biomass before and after cutting, i.e. the biomass of the crop installed in the area, is reflected in the estimate of net biomass. Emissions of CO2 resulting from the conversion of forests are considered as immediate emissions in the year of conversion. The estimation of the change in stock biomass inventory in the year and ten years before was because it was considered that the fraction of biomass that remains in the soil is degraded slowly over a 10 year period (IPCC, 1996). In this work, given the difficulties of obtaining data, all the net CO2 conversion that occurred in the year, was assumed regardless of the fate of the biomass retained, i.e., all rusted carbon stock of the converted area was considered in the year of the inventory.
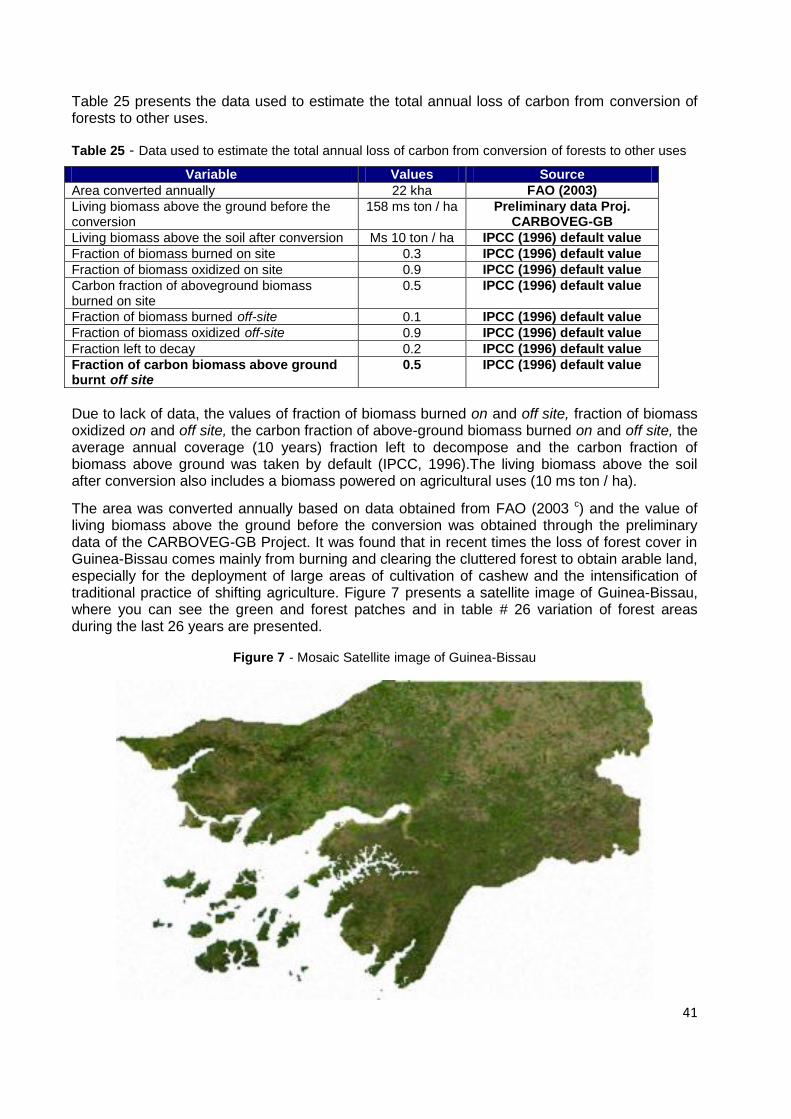
41
Table 25 presents the data used to estimate the total annual loss of carbon from conversion of forests to other uses. Table 25 - Data used to estimate the total annual loss of carbon from conversion of forests to other uses
Variable Values Source
Area converted annually 22 kha FAO (2003) Living biomass above the ground before the conversion
158 ms ton / ha Preliminary data Proj. CARBOVEG-GB
Living biomass above the soil after conversion Ms 10 ton / ha IPCC (1996) default value Fraction of biomass burned on site 0.3 IPCC (1996) default value Fraction of biomass oxidized on site 0.9 IPCC (1996) default value Carbon fraction of aboveground biomass burned on site
0.5 IPCC (1996) default value
Fraction of biomass burned off-site 0.1 IPCC (1996) default value Fraction of biomass oxidized off-site 0.9 IPCC (1996) default value Fraction left to decay 0.2 IPCC (1996) default value Fraction of carbon biomass above ground burnt off site
0.5 IPCC (1996) default value
Due to lack of data, the values of fraction of biomass burned on and off site, fraction of biomass oxidized on and off site, the carbon fraction of above-ground biomass burned on and off site, the average annual coverage (10 years) fraction left to decompose and the carbon fraction of biomass above ground was taken by default (IPCC, 1996).The living biomass above the soil after conversion also includes a biomass powered on agricultural uses (10 ms ton / ha). The area was converted annually based on data obtained from FAO (2003 c) and the value of living biomass above the ground before the conversion was obtained through the preliminary data of the CARBOVEG-GB Project. It was found that in recent times the loss of forest cover in Guinea-Bissau comes mainly from burning and clearing the cluttered forest to obtain arable land, especially for the deployment of large areas of cultivation of cashew and the intensification of traditional practice of shifting agriculture. Figure 7 presents a satellite image of Guinea-Bissau, where you can see the green and forest patches and in table # 26 variation of forest areas during the last 26 years are presented.
Figure 7 - Mosaic Satellite image of Guinea-Bissau
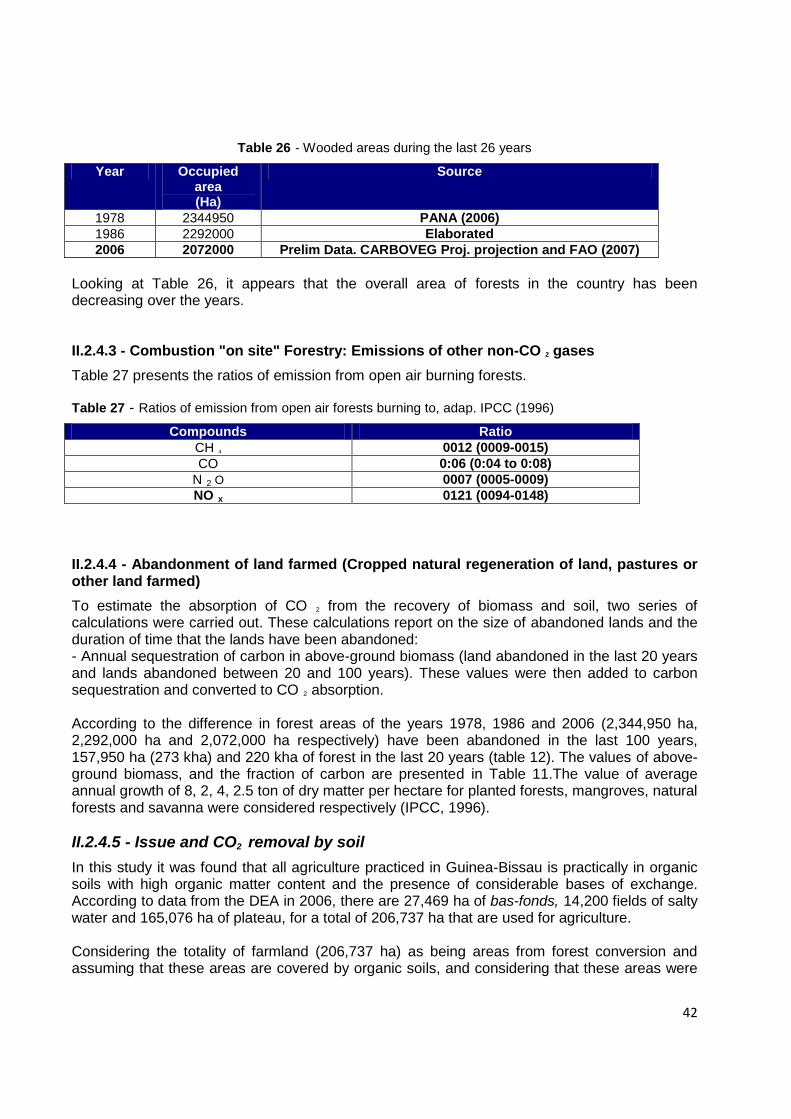
42
Table 26 - Wooded areas during the last 26 years
Year Occupied area (Ha)
Source
1978 2344950 PANA (2006) 1986 2292000 Elaborated 2006 2072000 Prelim Data. CARBOVEG Proj. projection and FAO (2007)
Looking at Table 26, it appears that the overall area of forests in the country has been decreasing over the years. II.2.4.3 - Combustion "on site" Forestry: Emissions of other non-CO 2 gases Table 27 presents the ratios of emission from open air burning forests. Table 27 - Ratios of emission from open air forests burning to, adap. IPCC (1996)
Compounds Ratio CH 4 0012 (0009-0015) CO 0:06 (0:04 to 0:08)
N 2 O 0007 (0005-0009) NO x 0121 (0094-0148)
II.2.4.4 - Abandonment of land farmed (Cropped natural regeneration of land, pastures or other land farmed) To estimate the absorption of CO 2 from the recovery of biomass and soil, two series of calculations were carried out. These calculations report on the size of abandoned lands and the duration of time that the lands have been abandoned: - Annual sequestration of carbon in above-ground biomass (land abandoned in the last 20 years and lands abandoned between 20 and 100 years). These values were then added to carbon sequestration and converted to CO 2 absorption. According to the difference in forest areas of the years 1978, 1986 and 2006 (2,344,950 ha, 2,292,000 ha and 2,072,000 ha respectively) have been abandoned in the last 100 years, 157,950 ha (273 kha) and 220 kha of forest in the last 20 years (table 12). The values of above-ground biomass, and the fraction of carbon are presented in Table 11.The value of average annual growth of 8, 2, 4, 2.5 ton of dry matter per hectare for planted forests, mangroves, natural forests and savanna were considered respectively (IPCC, 1996). II.2.4.5 - Issue and CO2 removal by soil In this study it was found that all agriculture practiced in Guinea-Bissau is practically in organic soils with high organic matter content and the presence of considerable bases of exchange. According to data from the DEA in 2006, there are 27,469 ha of bas-fonds, 14,200 fields of salty water and 165,076 ha of plateau, for a total of 206,737 ha that are used for agriculture. Considering the totality of farmland (206,737 ha) as being areas from forest conversion and assuming that these areas are covered by organic soils, and considering that these areas were
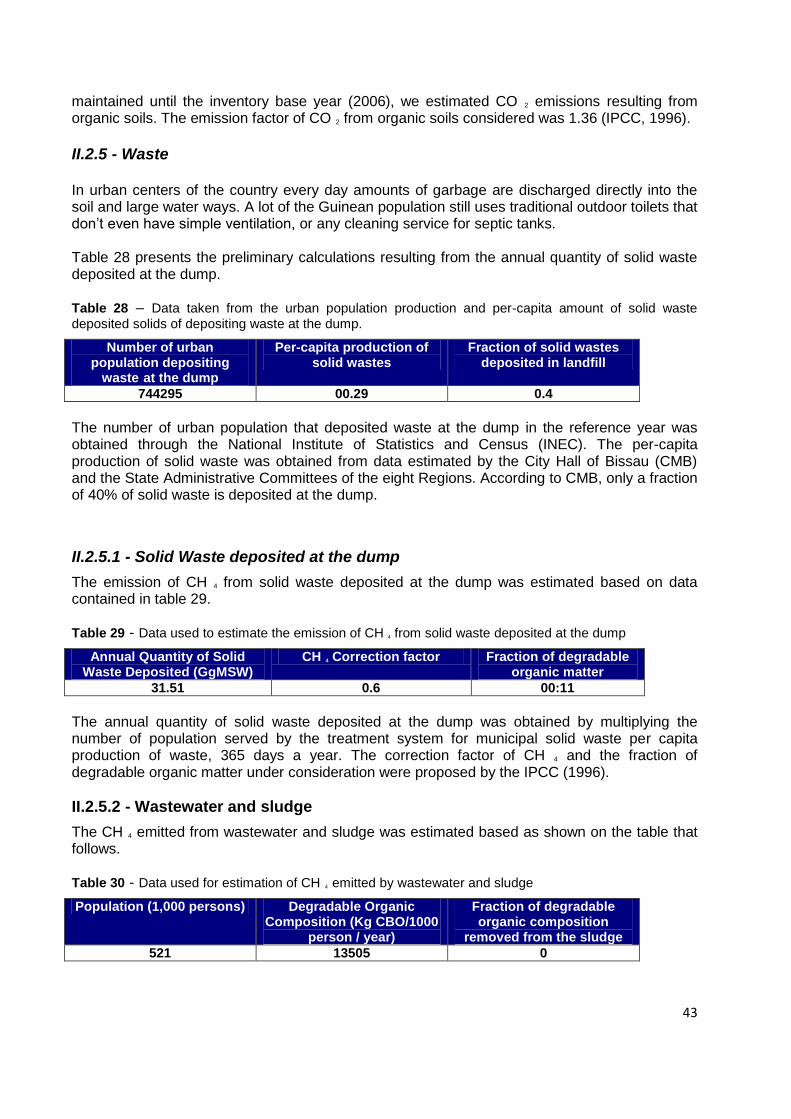
43
maintained until the inventory base year (2006), we estimated CO 2 emissions resulting from organic soils. The emission factor of CO 2 from organic soils considered was 1.36 (IPCC, 1996). II.2.5 - Waste In urban centers of the country every day amounts of garbage are discharged directly into the soil and large water ways. A lot of the Guinean population still uses traditional outdoor toilets that don’t even have simple ventilation, or any cleaning service for septic tanks. Table 28 presents the preliminary calculations resulting from the annual quantity of solid waste deposited at the dump. Table 28 – Data taken from the urban population production and per-capita amount of solid waste
deposited solids of depositing waste at the dump.
Number of urban population depositing
waste at the dump
Per-capita production of solid wastes
Fraction of solid wastes deposited in landfill
744295 00.29 0.4 The number of urban population that deposited waste at the dump in the reference year was obtained through the National Institute of Statistics and Census (INEC). The per-capita production of solid waste was obtained from data estimated by the City Hall of Bissau (CMB) and the State Administrative Committees of the eight Regions. According to CMB, only a fraction of 40% of solid waste is deposited at the dump.
II.2.5.1 - Solid Waste deposited at the dump The emission of CH 4 from solid waste deposited at the dump was estimated based on data contained in table 29. Table 29 - Data used to estimate the emission of CH 4 from solid waste deposited at the dump
Annual Quantity of Solid Waste Deposited (GgMSW)
CH 4 Correction factor Fraction of degradable organic matter
31.51 0.6 00:11 The annual quantity of solid waste deposited at the dump was obtained by multiplying the number of population served by the treatment system for municipal solid waste per capita production of waste, 365 days a year. The correction factor of CH 4 and the fraction of degradable organic matter under consideration were proposed by the IPCC (1996). II.2.5.2 - Wastewater and sludge The CH 4 emitted from wastewater and sludge was estimated based as shown on the table that follows. Table 30 - Data used for estimation of CH 4 emitted by wastewater and sludge Population (1,000 persons) Degradable Organic
Composition (Kg CBO/1000 person / year)
Fraction of degradable organic composition
removed from the sludge 521 13505 0
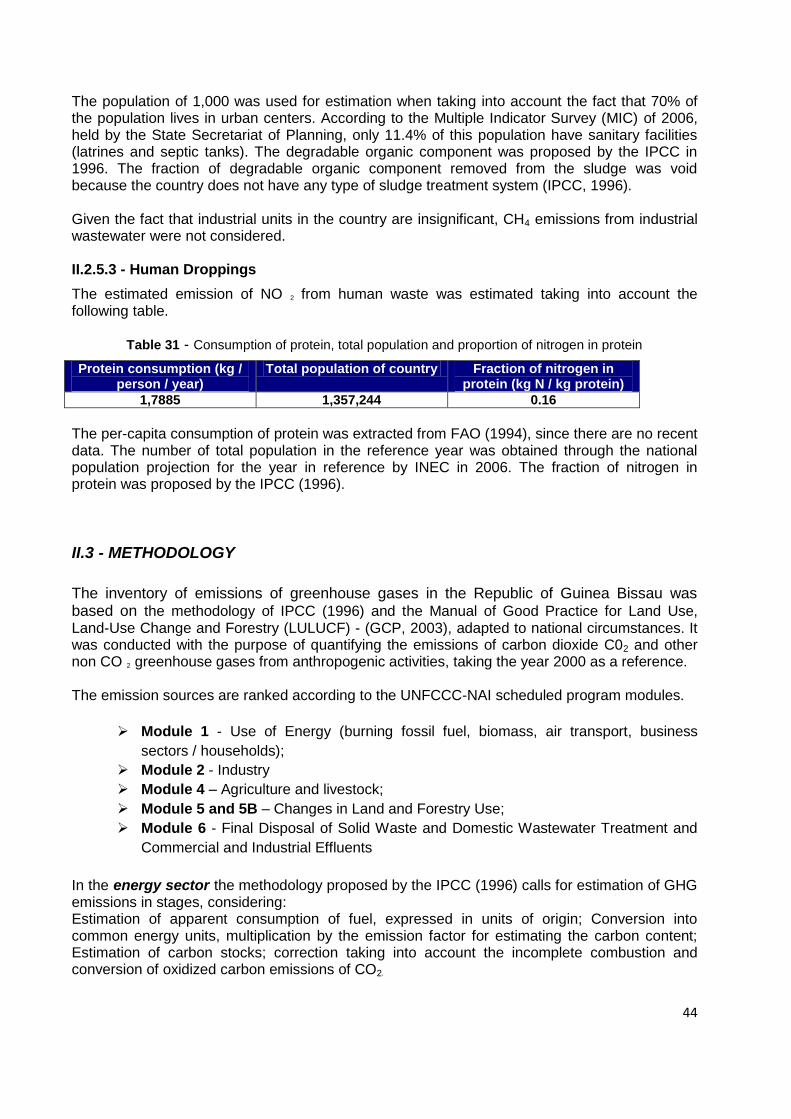
44
The population of 1,000 was used for estimation when taking into account the fact that 70% of the population lives in urban centers. According to the Multiple Indicator Survey (MIC) of 2006, held by the State Secretariat of Planning, only 11.4% of this population have sanitary facilities (latrines and septic tanks). The degradable organic component was proposed by the IPCC in 1996. The fraction of degradable organic component removed from the sludge was void because the country does not have any type of sludge treatment system (IPCC, 1996). Given the fact that industrial units in the country are insignificant, CH4 emissions from industrial wastewater were not considered. II.2.5.3 - Human Droppings The estimated emission of NO 2 from human waste was estimated taking into account the following table.
Table 31 - Consumption of protein, total population and proportion of nitrogen in protein
Protein consumption (kg / person / year)
Total population of country Fraction of nitrogen in protein (kg N / kg protein)
1,7885 1,357,244 0.16 The per-capita consumption of protein was extracted from FAO (1994), since there are no recent data. The number of total population in the reference year was obtained through the national population projection for the year in reference by INEC in 2006. The fraction of nitrogen in protein was proposed by the IPCC (1996).
II.3 - METHODOLOGY The inventory of emissions of greenhouse gases in the Republic of Guinea Bissau was based on the methodology of IPCC (1996) and the Manual of Good Practice for Land Use, Land-Use Change and Forestry (LULUCF) - (GCP, 2003), adapted to national circumstances. It was conducted with the purpose of quantifying the emissions of carbon dioxide C02 and other non CO 2 greenhouse gases from anthropogenic activities, taking the year 2000 as a reference. The emission sources are ranked according to the UNFCCC-NAI scheduled program modules.
Module 1 - Use of Energy (burning fossil fuel, biomass, air transport, business
sectors / households);
Module 2 - Industry
Module 4 – Agriculture and livestock;
Module 5 and 5B – Changes in Land and Forestry Use;
Module 6 - Final Disposal of Solid Waste and Domestic Wastewater Treatment and
Commercial and Industrial Effluents
In the energy sector the methodology proposed by the IPCC (1996) calls for estimation of GHG emissions in stages, considering: Estimation of apparent consumption of fuel, expressed in units of origin; Conversion into common energy units, multiplication by the emission factor for estimating the carbon content; Estimation of carbon stocks; correction taking into account the incomplete combustion and conversion of oxidized carbon emissions of CO2.
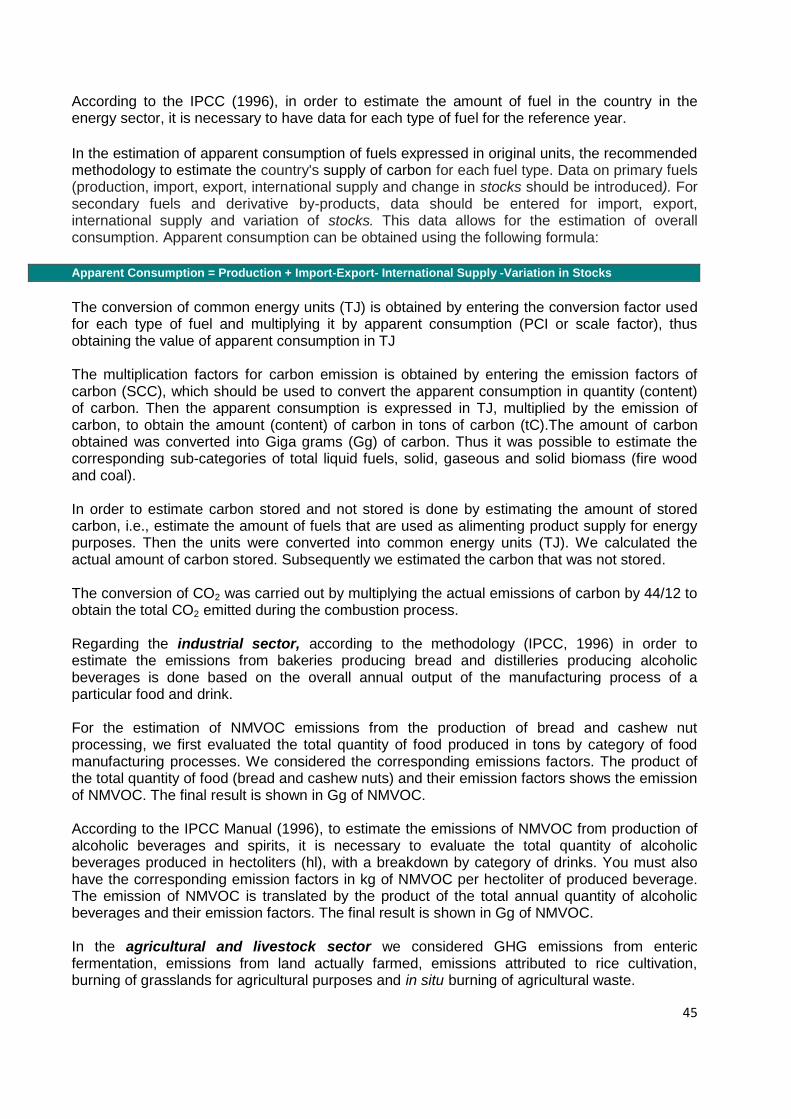
45
According to the IPCC (1996), in order to estimate the amount of fuel in the country in the energy sector, it is necessary to have data for each type of fuel for the reference year. In the estimation of apparent consumption of fuels expressed in original units, the recommended methodology to estimate the country's supply of carbon for each fuel type. Data on primary fuels (production, import, export, international supply and change in stocks should be introduced). For secondary fuels and derivative by-products, data should be entered for import, export, international supply and variation of stocks. This data allows for the estimation of overall consumption. Apparent consumption can be obtained using the following formula: Apparent Consumption = Production + Import-Export- International Supply -Variation in Stocks The conversion of common energy units (TJ) is obtained by entering the conversion factor used for each type of fuel and multiplying it by apparent consumption (PCI or scale factor), thus obtaining the value of apparent consumption in TJ The multiplication factors for carbon emission is obtained by entering the emission factors of carbon (SCC), which should be used to convert the apparent consumption in quantity (content) of carbon. Then the apparent consumption is expressed in TJ, multiplied by the emission of carbon, to obtain the amount (content) of carbon in tons of carbon (tC).The amount of carbon obtained was converted into Giga grams (Gg) of carbon. Thus it was possible to estimate the corresponding sub-categories of total liquid fuels, solid, gaseous and solid biomass (fire wood and coal). In order to estimate carbon stored and not stored is done by estimating the amount of stored carbon, i.e., estimate the amount of fuels that are used as alimenting product supply for energy purposes. Then the units were converted into common energy units (TJ). We calculated the actual amount of carbon stored. Subsequently we estimated the carbon that was not stored. The conversion of CO2 was carried out by multiplying the actual emissions of carbon by 44/12 to obtain the total CO2 emitted during the combustion process. Regarding the industrial sector, according to the methodology (IPCC, 1996) in order to estimate the emissions from bakeries producing bread and distilleries producing alcoholic beverages is done based on the overall annual output of the manufacturing process of a particular food and drink. For the estimation of NMVOC emissions from the production of bread and cashew nut processing, we first evaluated the total quantity of food produced in tons by category of food manufacturing processes. We considered the corresponding emissions factors. The product of the total quantity of food (bread and cashew nuts) and their emission factors shows the emission of NMVOC. The final result is shown in Gg of NMVOC. According to the IPCC Manual (1996), to estimate the emissions of NMVOC from production of alcoholic beverages and spirits, it is necessary to evaluate the total quantity of alcoholic beverages produced in hectoliters (hl), with a breakdown by category of drinks. You must also have the corresponding emission factors in kg of NMVOC per hectoliter of produced beverage. The emission of NMVOC is translated by the product of the total annual quantity of alcoholic beverages and their emission factors. The final result is shown in Gg of NMVOC. In the agricultural and livestock sector we considered GHG emissions from enteric fermentation, emissions from land actually farmed, emissions attributed to rice cultivation, burning of grasslands for agricultural purposes and in situ burning of agricultural waste.
46
The total emission of CH4 was calculated by the sum of emissions for each livestock. The IPCC methodology (1996) recommends multiplying the number of livestock in each species by an emission factor, taking into account climatic conditions and management of herds in the country. In this study the animals which were studied were: cows, pigs, horses, goats, sheep, donkeys and poultry. The dung management was not considered in this study since the extensive production system practiced in the country does not allow for its management control. As for N2O emissions from soils farmed, we only used the step of estimating direct emissions of N2O resulting from the incorporation of nitrogen in the soil. In forestry, the methodology calls for the emission and absorption of CO2 from changes in uses of land and forestry fall mainly into five categories of activities: development of biomass stocks in forests and other woody formations, conversion of forests and grasslands for other uses; "on site” combustion of forests; abandonment of land farmed (Cropped natural regeneration of land, pastures or other land farmed) and the issuance and removal of CO2 by the soil. In the category of Evolution / Change of biomass stocks in forests and other woody formations,
carbon emissions and removals (and CO 2) arising from the development of forest resources
and other woody biomass stocks under the influence of human activities were estimated. According to the IPCC Manual (1996), to estimate the net sequestration of CO 2 arising in this category, one must estimate the changes of biomass of planted forests from the wilderness to industrial exploitation. Thus, as the country has virtually no significant commercial exploitation of planted forests (N'Bunhe) they were treated the same way as natural forests. In addition to the methods already mentioned above, the Manual also includes trees that grow in urban areas. Keeping track of these trees planted, (per 1,000 trees), knowing the annual growth rate of species planted in tons of dry matter per hectare per tree (dry matter ton / ha / tree) allowed for the estimation the annual increment of biomass per acre or the number of trees. Given the lack of data regarding the trees planted in urban areas, we were unable to estimate the removal of CO 2 resulting from it. In the category of forest conversion to other uses in order to obtain estimates of CO 2 resulting from the conversion of forests / grasslands, we used three sets of calculations: 1 - CO 2 emitted from burning biomass crops (immediate issue that occurs during conversion); 2 - CO 2 released by the decomposition of above-ground biomass (issued for a period of 10 years); 3 - CO 2 released from the soil. In the category of combustion "on site" of forests: Emissions of other gases non-CO 2 (CH 4, N 2 O, CO and NOX), the emissions of CH 4 and CO were estimated under the form of ratio
to the flow of carbon emitted during combustion. The total nitrogen was estimated based on the
nitrogen / carbon. Emissions of N2O and NO x were estimated in the form of ratio to total
nitrogen. In the category of abandoned farm land (natural regeneration of farm land, pastures or other land farmed), it was considered that carbon accumulation in abandoned land largely depends on the type of natural ecosystem in which these lands are abandoned, since the land they farm are abandoned, or carbon cannot be accumulated in the soil, depending on several factors.
47
In the category of emission and removal of CO 2 by soils, we estimated the net CO 2 (carbon sinks and sources) from the three processes: 1) modification of carbon stored in the soil due to the practice of land use, 2) CO 2 emissions resulting from organic soils converted to farmland or plantations and 3) CO 2 emissions from lime application on agricultural soils. The carbon stored in soil was estimated in the upper area of land situated at a 30 cm depth. The calculations of CO 2 emissions from mineral soils were based on changes in allocation of land and farm management practices. The calculation of changes in carbon stocks requires an inventory period corresponding to 20 years. The estimation of allocation system for allocating land for different soil types is done at present, i.e. in the year of inventory and for a period equal to 20 years earlier. In this work we have assumed that the net changes of carbon from dead trees, the litter and soil minerals are zero (0). The calculations of CO 2 from the organic soils are conducted using annual estimates. Concerning waste, the IPCC (1996) recommends: 1 - Estimates of the emission of methane from solid waste deposited in the dumps; 2 - Methane emissions from domestic wastewater treatment and industrial products; 3 - Emissions of nitrogen oxide from human waste. For estimating the emission of methane from solid waste deposited at the dump, it was important to take into account the urban population served by waste collection, the amount of waste deposited at the dump, and the fraction of degradable organic carbon. It also appealed to the method of decomposition of the first order (DFO). The methane from the decomposition of organic matter in anaerobic conditions, of which some is produced and oxidized on the surface of the deposit and thus can still be recovered for energy purposes.
With regard to emission of methane from domestic waste-water treatment, we used the default estimation method proposed by IPCC's Manual (1996) for lack of data, mainly due to lack of treatment technology industry. For industrial wastewater, we used estimations of domestic wastewater obtained by default in the Manual mentioned above. For the quality of bread and alcohol drinks, data were extracted from the report of the industrial processes.
The emission of nitrogen oxide from human waste was estimated using the estimation of indirect emissions from wastewater or water environments, using the total number of population and per capita consumption of protein at the country level.
II.4 - SUMMARY OF EMISSIONS
The following table shows a summary of GHG emissions in the sectors concerned.
Table 32: Summary of GHG emissions in the Energy, Industry, Agriculture sectors, change in Forestry and Waste land use in the Republic of Guinea-Bissau during the year 2006.
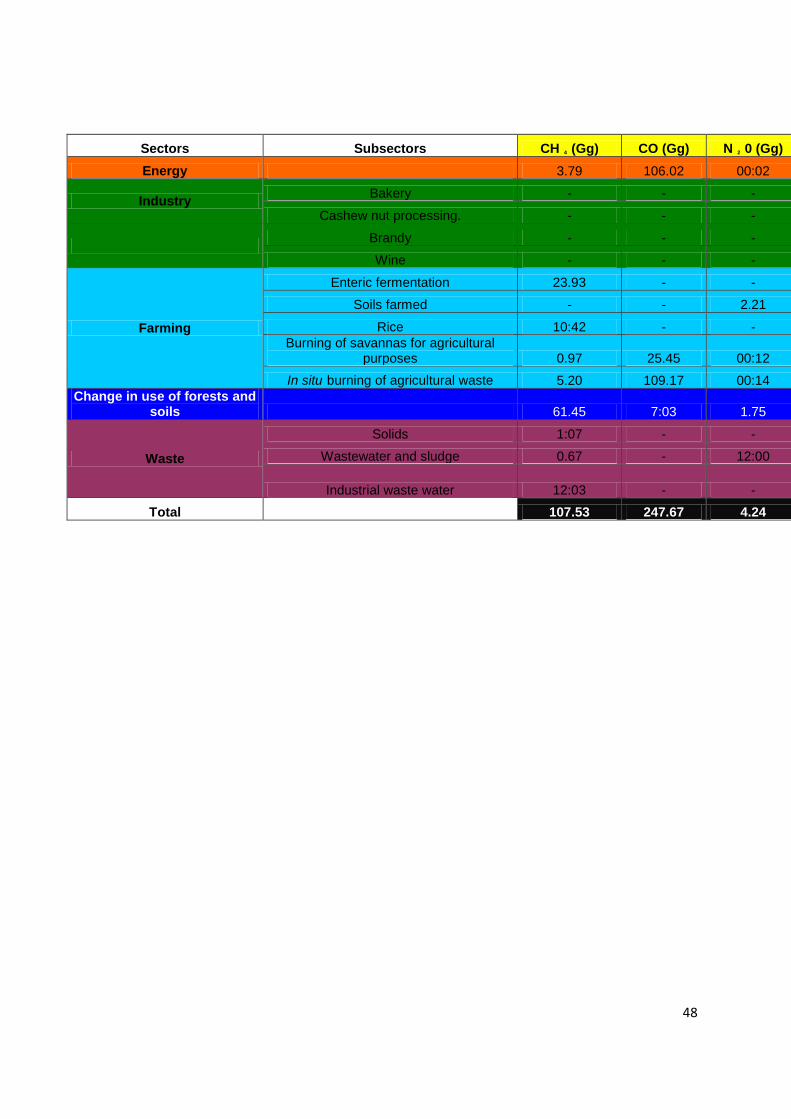
48
Sectors Subsectors CH 4 (Gg) CO (Gg) N 2 0 (Gg) NOx (Gg) NMVOC (Gg) CO 2 (Gg)
Energy 3.79 106.02 00:02 1:52 1:59 156.81
Industry Bakery - - - - 00:11 -
Cashew nut processing. - - - - 00:14 -
Brandy - - - - 00:11 -
Wine - - - - 12:00 -
Farming
Enteric fermentation 23.93 - - - - -
Soils farmed - - 2.21 - - -
Rice 10:42 - - - - -
Burning of savannas for agricultural purposes 0.97 25.45 00:12 4:34 -
-
In situ burning of agricultural waste 5.20 109.17 00:14 5:04 - -
Change in use of forests and soils 61.45 7:03 1.75 12:05 -
3623.99
Waste
Solids 1:07 - - - - -
Wastewater and sludge 0.67 - 12:00 - - -
Industrial waste water 12:03 - - - - -
Total 107.53 247.67 4.24 10.95 1.95 5231.07
49
III – CLIMATE CHANGE VULNERABILITY
Vulnerability means the degree of inability of a system to cope with the adverse effects of climate changes that are taking place because of variations in climate, the degree of responsiveness to these changes and its adaptive capacity. Numerous factors are involved, therefore, in its assessment, which implies an accumulation of uncertainties of various origins. The information concerning the impact of climate change in Guinea-Bissau is embryonic, due to limited data available. Although the incidence studies do not systematically support climate change scenarios, it is necessary to have general information about the evolution of climate projections adapted to the country. III.1 - CLIMATIC RISKS IN GUINEA-BISSAU During the consultation process of the populations for the elaboration of PANA, there have been frequent assertions by witnesses on the change of parameters related to rainfall, temperature, relative humidity, sea level and quantity of water resources. People have noted (i) a late onset of the rainy season (mid-June) compared to the usual (early May); (ii) a less regular distribution of rainfall than in the past; (iii) a shortening of the mild temperatures period, often called the "cold season” (Guinea-Bissau version of “winter)", with a duration of three months (December to February), now reduced to only two months (December to January); (iv) a warmer and drier environment; (v) frequent vacant dust clouds; (vi) more frequent occurrence of high-tides of greater magnitudes destroying dikes and rice fields; (vii) a decrease in water quality by saline water intrusion and water point infestation by aquatic plants; (viii ) reduction of the wetland areas and resentment due to drought. The evolution of rainfall over the past 30 years (1961-1990), or even in the last 45 years (1954-2000) shows a downward trend and irregular rainfall, based on observed variations: in the South, 2440-1800 mm; Mid-Country, 2,200 to 1,600 mm and the North, 1,600 to 1,200 mm, according to C. Silva quoted by A. O. da Silva (2001). For the period 1953-1983, a study would reveal that while in the North, on the border with Senegal, in just over 70 days, the average rainfall was 1,300 mm, as at the deep South end of the country it was more than 3,000 mm in more than 120 days of rain. For the period 1961-1990 (Imbali, F. and Silva, A. 1997), the average rainfall recorded was 162 days. In fact, there is currently a decrease in rainfall to only five months of the year (June to October), contrary to previous years (May to November). This is reflected in the scarcity of water, whose consequences are felt in the production of rice in small valleys and in cultures of upland rice and other cereals. Currently, the rains are always accompanied by strong winds especially in the months of August and September. The loss of production of cereal crops during this time is high. In the lowlands, bas-fond, flood damage can be significant, as well in the rice fields implanted in hydromorphic colonized mangrove lowlands. In this ecosystem, with recent rises in average sea levels, there have been invasions of tides into the rice fields, resulting in the destruction of dikes and consequently loss of productive capacity of land for rice cultivation. In the South, Mid-Country and the Islands, with productions that require more water such as rice and corn, in addition to the negative phenomena that are related to the concentration of poor rainfall and its temporal distribution. The reflections of other climatic parameters such as temperature, above flood level caused by the presence of semi-diurnal waves, whose amplitudes are among the highest in West Africa, particularly in Portogole and Buba, where they reach six meters, forty-two millimeters (6.42 m) in height.
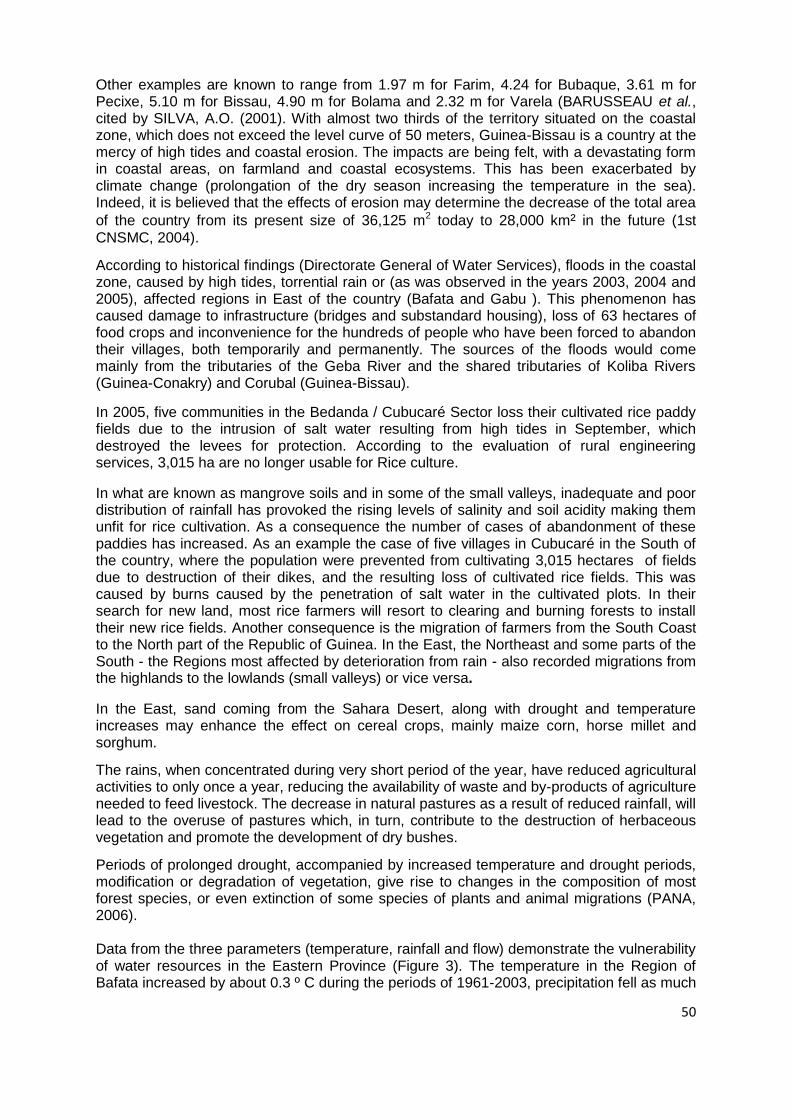
50
Other examples are known to range from 1.97 m for Farim, 4.24 for Bubaque, 3.61 m for Pecixe, 5.10 m for Bissau, 4.90 m for Bolama and 2.32 m for Varela (BARUSSEAU et al., cited by SILVA, A.O. (2001). With almost two thirds of the territory situated on the coastal zone, which does not exceed the level curve of 50 meters, Guinea-Bissau is a country at the mercy of high tides and coastal erosion. The impacts are being felt, with a devastating form in coastal areas, on farmland and coastal ecosystems. This has been exacerbated by climate change (prolongation of the dry season increasing the temperature in the sea). Indeed, it is believed that the effects of erosion may determine the decrease of the total area
of the country from its present size of 36,125 m2 today to 28,000 km² in the future (1st
CNSMC, 2004). According to historical findings (Directorate General of Water Services), floods in the coastal zone, caused by high tides, torrential rain or (as was observed in the years 2003, 2004 and 2005), affected regions in East of the country (Bafata and Gabu ). This phenomenon has caused damage to infrastructure (bridges and substandard housing), loss of 63 hectares of food crops and inconvenience for the hundreds of people who have been forced to abandon their villages, both temporarily and permanently. The sources of the floods would come mainly from the tributaries of the Geba River and the shared tributaries of Koliba Rivers (Guinea-Conakry) and Corubal (Guinea-Bissau). In 2005, five communities in the Bedanda / Cubucaré Sector loss their cultivated rice paddy fields due to the intrusion of salt water resulting from high tides in September, which destroyed the levees for protection. According to the evaluation of rural engineering services, 3,015 ha are no longer usable for Rice culture. In what are known as mangrove soils and in some of the small valleys, inadequate and poor distribution of rainfall has provoked the rising levels of salinity and soil acidity making them unfit for rice cultivation. As a consequence the number of cases of abandonment of these paddies has increased. As an example the case of five villages in Cubucaré in the South of the country, where the population were prevented from cultivating 3,015 hectares of fields due to destruction of their dikes, and the resulting loss of cultivated rice fields. This was caused by burns caused by the penetration of salt water in the cultivated plots. In their search for new land, most rice farmers will resort to clearing and burning forests to install their new rice fields. Another consequence is the migration of farmers from the South Coast to the North part of the Republic of Guinea. In the East, the Northeast and some parts of the South - the Regions most affected by deterioration from rain - also recorded migrations from the highlands to the lowlands (small valleys) or vice versa. In the East, sand coming from the Sahara Desert, along with drought and temperature increases may enhance the effect on cereal crops, mainly maize corn, horse millet and sorghum. The rains, when concentrated during very short period of the year, have reduced agricultural activities to only once a year, reducing the availability of waste and by-products of agriculture needed to feed livestock. The decrease in natural pastures as a result of reduced rainfall, will lead to the overuse of pastures which, in turn, contribute to the destruction of herbaceous vegetation and promote the development of dry bushes. Periods of prolonged drought, accompanied by increased temperature and drought periods, modification or degradation of vegetation, give rise to changes in the composition of most forest species, or even extinction of some species of plants and animal migrations (PANA, 2006). Data from the three parameters (temperature, rainfall and flow) demonstrate the vulnerability of water resources in the Eastern Province (Figure 3). The temperature in the Region of Bafata increased by about 0.3 º C during the periods of 1961-2003, precipitation fell as much
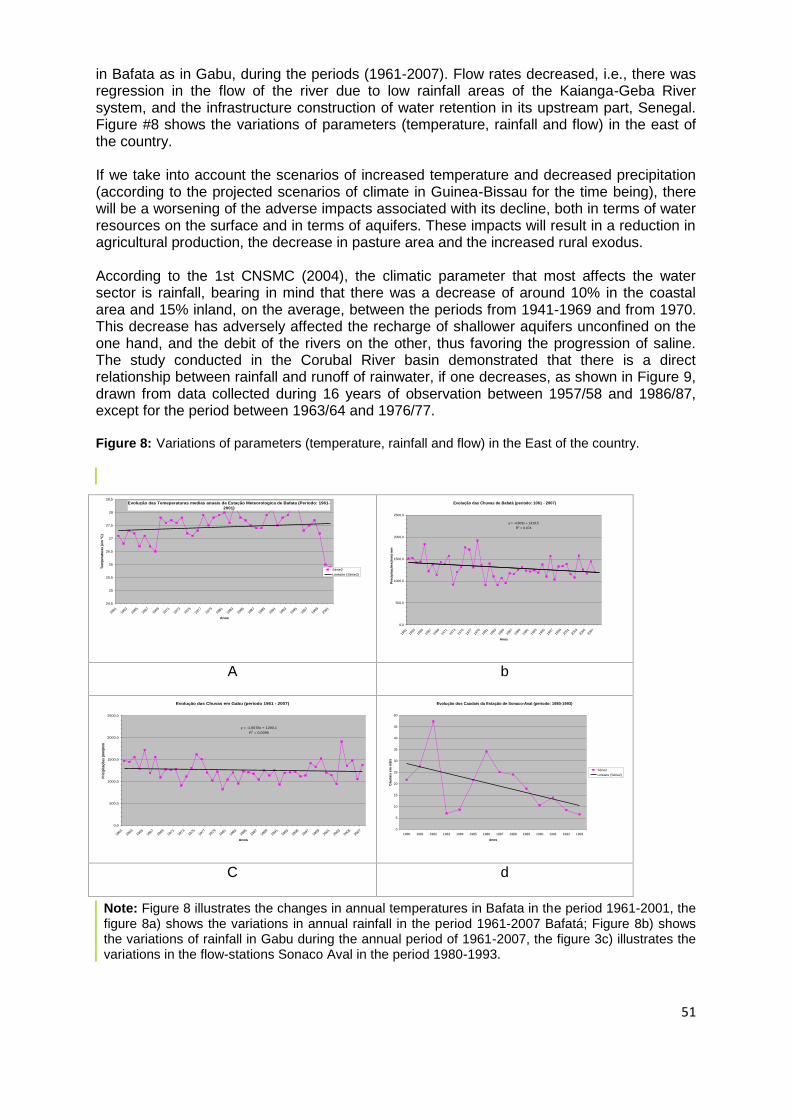
51
in Bafata as in Gabu, during the periods (1961-2007). Flow rates decreased, i.e., there was regression in the flow of the river due to low rainfall areas of the Kaianga-Geba River system, and the infrastructure construction of water retention in its upstream part, Senegal. Figure #8 shows the variations of parameters (temperature, rainfall and flow) in the east of the country. If we take into account the scenarios of increased temperature and decreased precipitation (according to the projected scenarios of climate in Guinea-Bissau for the time being), there will be a worsening of the adverse impacts associated with its decline, both in terms of water resources on the surface and in terms of aquifers. These impacts will result in a reduction in agricultural production, the decrease in pasture area and the increased rural exodus. According to the 1st CNSMC (2004), the climatic parameter that most affects the water sector is rainfall, bearing in mind that there was a decrease of around 10% in the coastal area and 15% inland, on the average, between the periods from 1941-1969 and from 1970. This decrease has adversely affected the recharge of shallower aquifers unconfined on the one hand, and the debit of the rivers on the other, thus favoring the progression of saline. The study conducted in the Corubal River basin demonstrated that there is a direct relationship between rainfall and runoff of rainwater, if one decreases, as shown in Figure 9, drawn from data collected during 16 years of observation between 1957/58 and 1986/87, except for the period between 1963/64 and 1976/77. Figure 8: Variations of parameters (temperature, rainfall and flow) in the East of the country.
Note: Figure 8 illustrates the changes in annual temperatures in Bafata in the period 1961-2001, the figure 8a) shows the variations in annual rainfall in the period 1961-2007 Bafatá; Figure 8b) shows the variations of rainfall in Gabu during the annual period of 1961-2007, the figure 3c) illustrates the variations in the flow-stations Sonaco Aval in the period 1980-1993.
Evolução das Temeperaturas medias anuais da Estação Meteorologica de Bafata (Periodo: 1961-
2001)
24,5
25
25,5
26
26,5
27
27,5
28
28,5
1961
1963
1965
1967
1969
1971
1973
1975
1977
1979
1981
1983
1985
1987
1989
1991
1993
1995
1997
1999
2001
Anos
Te
mp
era
tura
s (
em
°C
)
Série2
Linéaire (Série2)
Evolução das Chuvas de Bafatá (periodo: 1061 - 2007)
y = -4,603x + 1419,5
R2 = 0,074
0,0
500,0
1000,0
1500,0
2000,0
2500,0
1961
1963
1965
1967
1969
1971
1973
1975
1977
1979
1981
1983
1985
1987
1989
1991
1993
1995
1997
1999
2001
2003
2005
2007
Anos
Pre
cip
ita
çõ
es(m
m)
mm
A b
Evolução das Chuvas em Gabu (periodo 1961 - 2007)
y = -1,5678x + 1293,1
R2 = 0,0096
0,0
500,0
1000,0
1500,0
2000,0
2500,0
1961
1963
1965
1967
1969
1971
1973
1975
1977
1979
1981
1983
1985
1987
1989
1991
1993
1995
1997
1999
2001
2003
2005
2007
Anos
Pri
cip
ita
çõ
es (
mm
)mm
Evolução dos Caudais da Estação de Sonaco-Aval (periodo: 1980-1993)
0
5
10
15
20
25
30
35
40
45
50
1980 1981 1982 1983 1984 1985 1986 1987 1988 1989 1990 1991 1992 1993
Anos
Ca
ud
ais
em
m3
/s
Série2
Linéaire (Série2)
C d
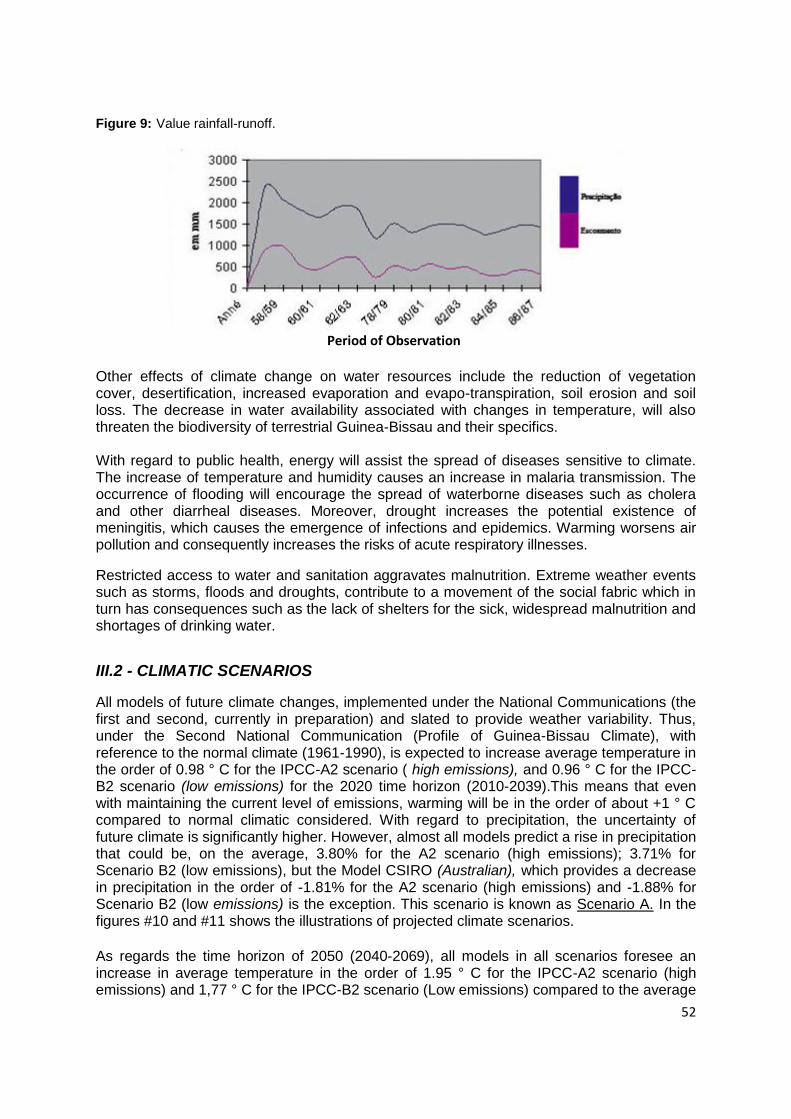
52
Figure 9: Value rainfall-runoff.
Period of Observation
Other effects of climate change on water resources include the reduction of vegetation cover, desertification, increased evaporation and evapo-transpiration, soil erosion and soil loss. The decrease in water availability associated with changes in temperature, will also threaten the biodiversity of terrestrial Guinea-Bissau and their specifics. With regard to public health, energy will assist the spread of diseases sensitive to climate. The increase of temperature and humidity causes an increase in malaria transmission. The occurrence of flooding will encourage the spread of waterborne diseases such as cholera and other diarrheal diseases. Moreover, drought increases the potential existence of meningitis, which causes the emergence of infections and epidemics. Warming worsens air pollution and consequently increases the risks of acute respiratory illnesses. Restricted access to water and sanitation aggravates malnutrition. Extreme weather events such as storms, floods and droughts, contribute to a movement of the social fabric which in turn has consequences such as the lack of shelters for the sick, widespread malnutrition and shortages of drinking water. III.2 - CLIMATIC SCENARIOS All models of future climate changes, implemented under the National Communications (the first and second, currently in preparation) and slated to provide weather variability. Thus, under the Second National Communication (Profile of Guinea-Bissau Climate), with reference to the normal climate (1961-1990), is expected to increase average temperature in the order of 0.98 ° C for the IPCC-A2 scenario ( high emissions), and 0.96 ° C for the IPCC-B2 scenario (low emissions) for the 2020 time horizon (2010-2039).This means that even with maintaining the current level of emissions, warming will be in the order of about +1 ° C compared to normal climatic considered. With regard to precipitation, the uncertainty of future climate is significantly higher. However, almost all models predict a rise in precipitation that could be, on the average, 3.80% for the A2 scenario (high emissions); 3.71% for Scenario B2 (low emissions), but the Model CSIRO (Australian), which provides a decrease in precipitation in the order of -1.81% for the A2 scenario (high emissions) and -1.88% for Scenario B2 (low emissions) is the exception. This scenario is known as Scenario A. In the figures #10 and #11 shows the illustrations of projected climate scenarios. As regards the time horizon of 2050 (2040-2069), all models in all scenarios foresee an increase in average temperature in the order of 1.95 ° C for the IPCC-A2 scenario (high emissions) and 1,77 ° C for the IPCC-B2 scenario (Low emissions) compared to the average
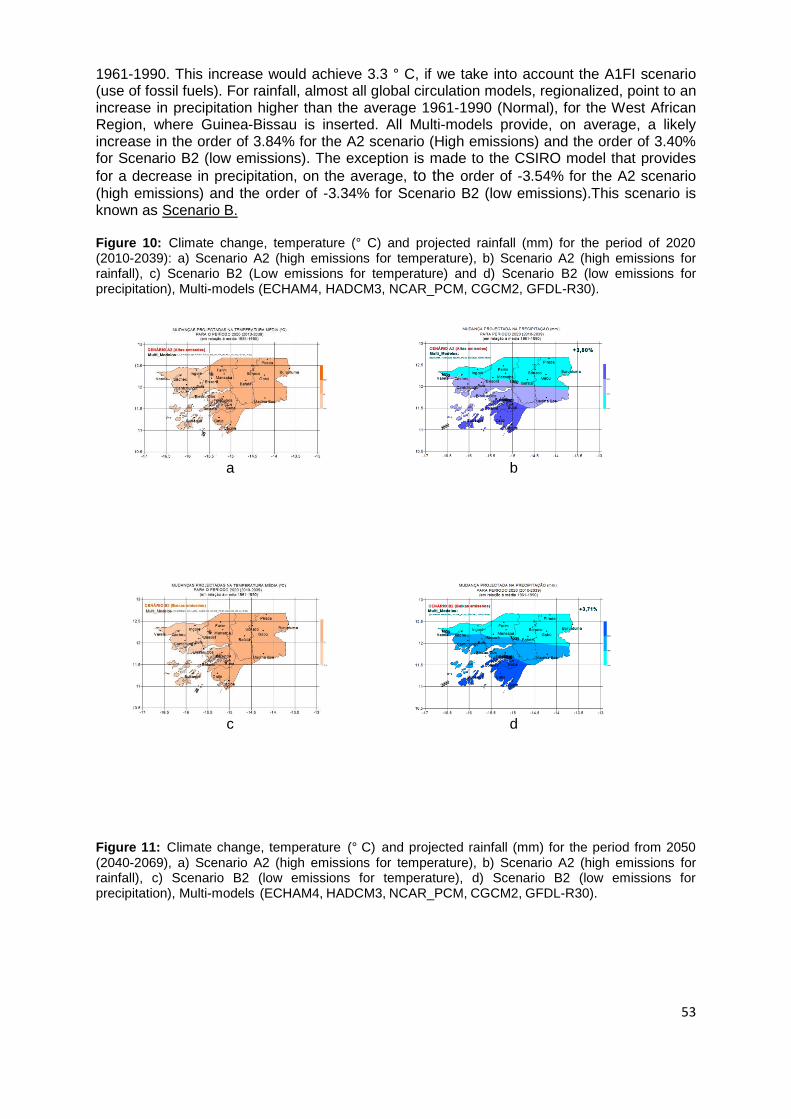
53
1961-1990. This increase would achieve 3.3 ° C, if we take into account the A1FI scenario (use of fossil fuels). For rainfall, almost all global circulation models, regionalized, point to an increase in precipitation higher than the average 1961-1990 (Normal), for the West African Region, where Guinea-Bissau is inserted. All Multi-models provide, on average, a likely increase in the order of 3.84% for the A2 scenario (High emissions) and the order of 3.40% for Scenario B2 (low emissions). The exception is made to the CSIRO model that provides
for a decrease in precipitation, on the average, to the order of -3.54% for the A2 scenario
(high emissions) and the order of -3.34% for Scenario B2 (low emissions).This scenario is known as Scenario B. Figure 10: Climate change, temperature (° C) and projected rainfall (mm) for the period of 2020 (2010-2039): a) Scenario A2 (high emissions for temperature), b) Scenario A2 (high emissions for rainfall), c) Scenario B2 (Low emissions for temperature) and d) Scenario B2 (low emissions for precipitation), Multi-models (ECHAM4, HADCM3, NCAR_PCM, CGCM2, GFDL-R30).
a b
c d
Figure 11: Climate change, temperature (° C) and projected rainfall (mm) for the period from 2050 (2040-2069), a) Scenario A2 (high emissions for temperature), b) Scenario A2 (high emissions for rainfall), c) Scenario B2 (low emissions for temperature), d) Scenario B2 (low emissions for precipitation), Multi-models (ECHAM4, HADCM3, NCAR_PCM, CGCM2, GFDL-R30).
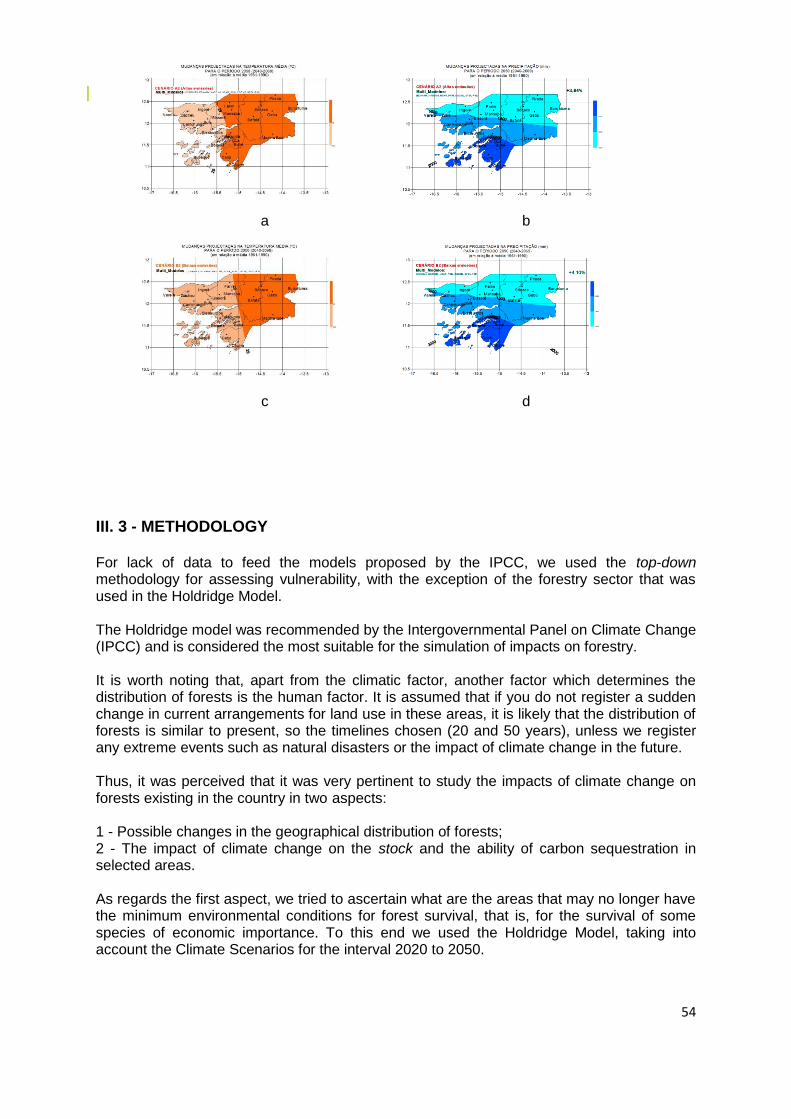
54
III. 3 - METHODOLOGY For lack of data to feed the models proposed by the IPCC, we used the top-down methodology for assessing vulnerability, with the exception of the forestry sector that was used in the Holdridge Model. The Holdridge model was recommended by the Intergovernmental Panel on Climate Change (IPCC) and is considered the most suitable for the simulation of impacts on forestry. It is worth noting that, apart from the climatic factor, another factor which determines the distribution of forests is the human factor. It is assumed that if you do not register a sudden change in current arrangements for land use in these areas, it is likely that the distribution of forests is similar to present, so the timelines chosen (20 and 50 years), unless we register any extreme events such as natural disasters or the impact of climate change in the future. Thus, it was perceived that it was very pertinent to study the impacts of climate change on forests existing in the country in two aspects: 1 - Possible changes in the geographical distribution of forests; 2 - The impact of climate change on the stock and the ability of carbon sequestration in selected areas. As regards the first aspect, we tried to ascertain what are the areas that may no longer have the minimum environmental conditions for forest survival, that is, for the survival of some species of economic importance. To this end we used the Holdridge Model, taking into account the Climate Scenarios for the interval 2020 to 2050.
a b
c d
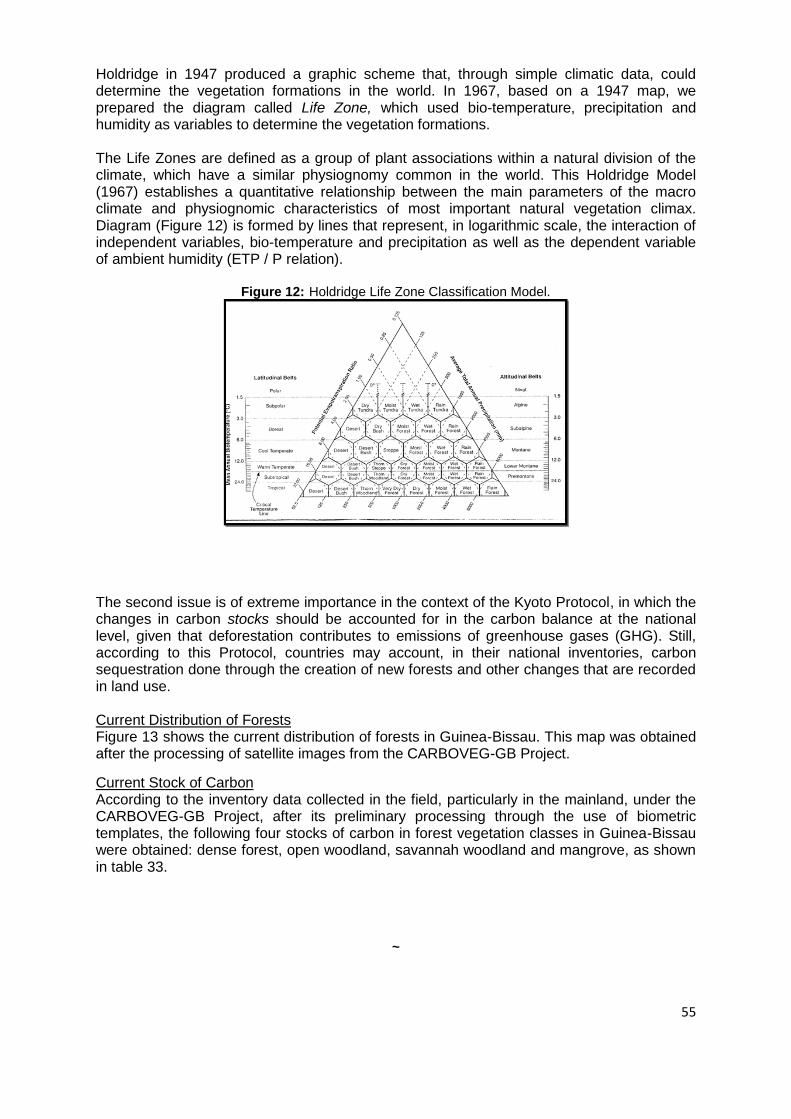
55
Holdridge in 1947 produced a graphic scheme that, through simple climatic data, could determine the vegetation formations in the world. In 1967, based on a 1947 map, we prepared the diagram called Life Zone, which used bio-temperature, precipitation and humidity as variables to determine the vegetation formations. The Life Zones are defined as a group of plant associations within a natural division of the climate, which have a similar physiognomy common in the world. This Holdridge Model (1967) establishes a quantitative relationship between the main parameters of the macro climate and physiognomic characteristics of most important natural vegetation climax. Diagram (Figure 12) is formed by lines that represent, in logarithmic scale, the interaction of independent variables, bio-temperature and precipitation as well as the dependent variable of ambient humidity (ETP / P relation).
Figure 12: Holdridge Life Zone Classification Model.
The second issue is of extreme importance in the context of the Kyoto Protocol, in which the changes in carbon stocks should be accounted for in the carbon balance at the national level, given that deforestation contributes to emissions of greenhouse gases (GHG). Still, according to this Protocol, countries may account, in their national inventories, carbon sequestration done through the creation of new forests and other changes that are recorded in land use. Current Distribution of Forests Figure 13 shows the current distribution of forests in Guinea-Bissau. This map was obtained after the processing of satellite images from the CARBOVEG-GB Project. Current Stock of Carbon According to the inventory data collected in the field, particularly in the mainland, under the CARBOVEG-GB Project, after its preliminary processing through the use of biometric templates, the following four stocks of carbon in forest vegetation classes in Guinea-Bissau were obtained: dense forest, open woodland, savannah woodland and mangrove, as shown in table 33.
~
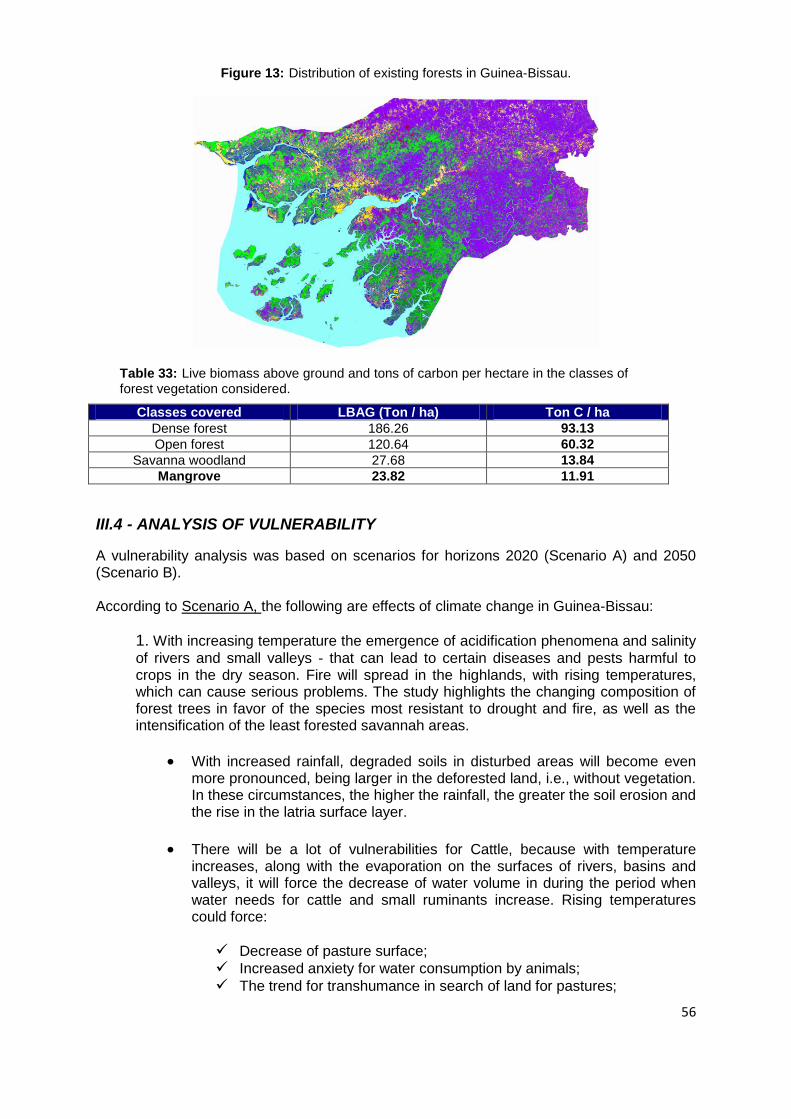
56
Figure 13: Distribution of existing forests in Guinea-Bissau.
Table 33: Live biomass above ground and tons of carbon per hectare in the classes of forest vegetation considered.
Classes covered LBAG (Ton / ha) Ton C / ha Dense forest 186.26 93.13 Open forest 120.64 60.32
Savanna woodland 27.68 13.84 Mangrove 23.82 11.91
III.4 - ANALYSIS OF VULNERABILITY A vulnerability analysis was based on scenarios for horizons 2020 (Scenario A) and 2050 (Scenario B). According to Scenario A, the following are effects of climate change in Guinea-Bissau:
1. With increasing temperature the emergence of acidification phenomena and salinity
of rivers and small valleys - that can lead to certain diseases and pests harmful to crops in the dry season. Fire will spread in the highlands, with rising temperatures, which can cause serious problems. The study highlights the changing composition of forest trees in favor of the species most resistant to drought and fire, as well as the intensification of the least forested savannah areas.
With increased rainfall, degraded soils in disturbed areas will become even more pronounced, being larger in the deforested land, i.e., without vegetation. In these circumstances, the higher the rainfall, the greater the soil erosion and the rise in the latria surface layer.
There will be a lot of vulnerabilities for Cattle, because with temperature increases, along with the evaporation on the surfaces of rivers, basins and valleys, it will force the decrease of water volume in during the period when water needs for cattle and small ruminants increase. Rising temperatures could force:
Decrease of pasture surface; Increased anxiety for water consumption by animals; The trend for transhumance in search of land for pastures;
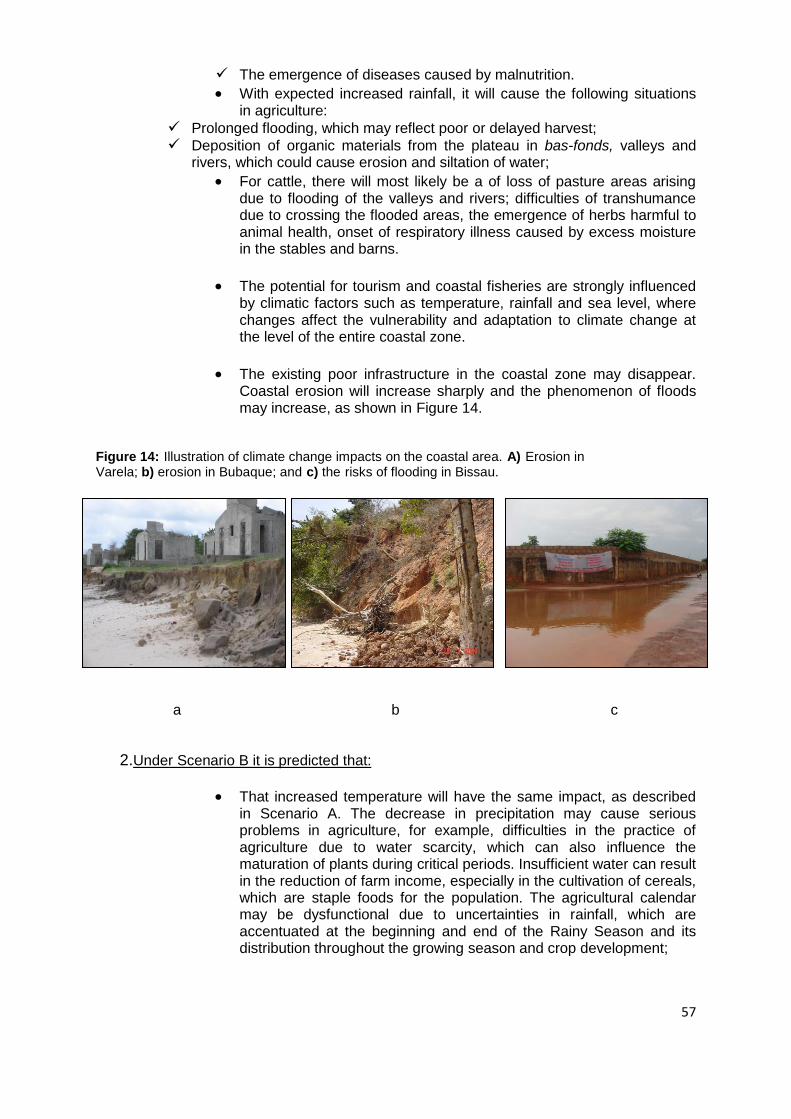
57
The emergence of diseases caused by malnutrition.
With expected increased rainfall, it will cause the following situations in agriculture:
Prolonged flooding, which may reflect poor or delayed harvest; Deposition of organic materials from the plateau in bas-fonds, valleys and
rivers, which could cause erosion and siltation of water;
For cattle, there will most likely be a of loss of pasture areas arising due to flooding of the valleys and rivers; difficulties of transhumance due to crossing the flooded areas, the emergence of herbs harmful to animal health, onset of respiratory illness caused by excess moisture in the stables and barns.
The potential for tourism and coastal fisheries are strongly influenced by climatic factors such as temperature, rainfall and sea level, where changes affect the vulnerability and adaptation to climate change at the level of the entire coastal zone.
The existing poor infrastructure in the coastal zone may disappear. Coastal erosion will increase sharply and the phenomenon of floods may increase, as shown in Figure 14.
Figure 14: Illustration of climate change impacts on the coastal area. A) Erosion in Varela; b) erosion in Bubaque; and c) the risks of flooding in Bissau.
a b c
2.Under Scenario B it is predicted that:
That increased temperature will have the same impact, as described in Scenario A. The decrease in precipitation may cause serious problems in agriculture, for example, difficulties in the practice of agriculture due to water scarcity, which can also influence the maturation of plants during critical periods. Insufficient water can result in the reduction of farm income, especially in the cultivation of cereals, which are staple foods for the population. The agricultural calendar may be dysfunctional due to uncertainties in rainfall, which are accentuated at the beginning and end of the Rainy Season and its distribution throughout the growing season and crop development;
58
Increasing the period of transhumance of livestock in search of water points and pasture, and possible social conflict between the ranchers and farmers.
In reference to water, impacts on the biophysical level, i.e., the
amount and quality of freshwater, such as changes in its temperature and its oxygen content, the increase in evapo-transpiration of freshwater flows, lowering flow in the Corubal River and its tributaries, the proliferation of aquatic plants in the river due to poor drainage - all of which could seriously compromise the fishing industry and lead to decreasing levels of groundwater recharge.
The biophysical impacts noted above, in turn, engender in cascades,
socio-economic impacts, such as rural exodus caused by the decrease in rainfall and the consequent decline in agricultural productivity, increasing water demand, caused by a combination of temperature factors and rural exodus.
That the biophysical impacts, with all its hardships, can make different social groups (women, children and the elderly, farmers, pastoralists, fishermen, gardeners, etc...), extremely vulnerable.
The country has faced, in recent times, a period of climatic disturbances with negative effects on agriculture and food production. Increasingly, the situation worsens and the effects are felt in the degradation of different production systems, particularly in the Southern Regions of Quinara and Tombali, the Northern Regions of Oio and Cacheu, and in the East, particularly in the Sectors and Pitche and Pirada. The irregular rainfall, floods and pests do not allow the crops to close their growing cycle, which therefore has a negative effect on overall production in the country. Consequently, food shortages will be frequent and serious, and will be even more so if the climatic phenomenon increases prices of agricultural products worldwide. The flow of the Saltinho and Geba River basins, due to their crossing-borders, not only depends on rainfall that occurs in our territory, but also occurring in countries through which they pass. The decrease in rainfall has not been very significant, with the trend not having changed much in the last 50 years (1954-2000), with average annual rainfall of around 2,200 mm, and strong inter-annual variations. In this vein, the current status of watercourses in Guinea-Bissau could be characterized still by small variations of rainfall and evaporation referred to above. Indeed, the decrease in rainfall results in a progressive decrease of water reserves, which is exacerbated by water shortages that takes place over the months of the rainy season, and by poor rainfall that takes place in the beginning of it. The impacts that can be seen in humid zones of the Continent is the late start and early end of the Rainy Season and that has consequences on the surface reduction of wetlands by not filling these up with rain water, causing a low amount of water being stored during the entire rainy period It dries up quickly by evaporation and is used quickly by animals in general. One of the most visible changes in climate (rainfall), in the rivers is the proliferation of aquatic plants. This is conditioned by the runoff into rivers, and there is a higher incidence in the Geba River (East of the country).
59
IV - CLIMATE CHANGE ADAPTATION
IV.1 - ASSESSMENT OF ADAPTATION The evaluation of adjustment is considered as an estimation of the ability of specific groups of systems ability to adapt to specific types of risks. In this document, there was no assessment as such, but an examination of current and future vulnerabilities faced with climate change scenarios in order to propose strategies for adaptation. The system is understood, in this work as an economic sector in relation to population. Risks are defined physically, for example, a drought, a storm or excessive rainfall. Thus, two approaches were used to propose adaptation strategies. The first approach used was during the preparation of the Guinea-Bissau National Program of Action for Adaptation to Climate Change (PANA). Indeed, during the preparation of PANA, a study was undertaken to determine climate changes and variability observed. The study of Guinea-Bissau climatic profile of is one example. Thus, from the lessons learned from this study and based on traditional know-how, some strategies for adapting to climate change were outlined. IV.2 - STRATEGIES AND MEANS OF ADAPTATIONS
As a contingency plan for the agricultural and rural sector, two major strategies have been determined by the Government:
An emergency strategy of supplying seeds and pesticides, to compensate for the current food shortages caused by climate change.
An investment strategy and support of capacity building for farmers and their organizations, assisting them in recovery or rehabilitation of agricultural production bases, irrigation projects for better water management.
The investment strategy for the agricultural sector has resulted not only in the formulation of the Agricultural Development Policy Charter and its Action Plan, approved in 1988 and updated in 2002, but also in the formulation of the Medium Term National Investment Program (PNIMP) and the National Program for Food Security (PNSA). However, with the exception of interventions made in connection with specific projects from time to time, policy letters and other documents unfortunately remain without effective enforcement and lack of financial resources. The formulation of the National Investment Fund (PNIA) is on-going and will have the following six priority areas of intervention:
i) Improved water management (through the promotion of irrigation and integrated water resources management). ii) Sustainable development of agriculture (components: Integrated management and soil fertility, strengthening of support services to producers and dissemination of improved technologies). iii) Improved management of other natural resources (components: organization of transhumance and route planning, sustainable management of forest resources and sustainable management of fisheries’ resources).
60
iv) Agricultural enterprise development and promotion of markets (components: development of agro-food, agriculture peri-urban areas, export crops, short cycle livestock, agro-food forest, fisheries and aquaculture, strengthening of support services to operators; national, regional and international trade promotion). v) Prevention and management of food crises and other natural disasters (components: promotion of early warning systems, crisis management development and development of compensation / insurance against disasters). vi) Institutional reinforcement (components: Improved capacity to formulate agricultural and rural policies and strategies, strengthening the capacity, coordination and capacity building for monitoring and evaluation).
According to PANA (2006), we identified some additional investments in the agricultural sector needed to address the adverse effects of climate change that, so far, are not in execution. Technical measures for adaptation to climate change, in agriculture, are being considered through the following priorities for action:
Conservation and protection systems for agro-forestry and pasture in the existing in the area under study;
Operation of production systems;
Incitement to change more conservative attitudes
We suggest the following actions for each of the intervention axles proposed above: 1 - Conservation and protection of the two existing production systems in the area under study a) System for production of bas-fonds
To improve current water management in small valleys;
Develop new superficies in small valleys;
Develop valleys and tributaries of the Geba River;
Support the mechanization of agriculture;
Support the development of small irrigation;
Give incentives to farmers to farm in the basin of the Geba River.
b) Plateau production system:
Popularize new varieties adaptable to the environment as well as the capabilities of the peasantry, in particular seed varieties with shorter cycle, more productive and resistant to drought;
Improve the genetic material of vegetable and cashew trees and palm groves;
Develop and implement programs for water management that encompasses the micro hydro-agricultural ornaments, construction of micro dams, reservoirs and promotion of small irrigation systems;
Develop small irrigation schemes;
Improve techniques and agricultural practices in order to intensify and diversify production;
Strengthen the research and dissemination of results;
Develop programs to conserve and protect the environment and improve the efficiency of the plants;
Encourage the development of horticulture in the hills;
61
Protect and conserve forests.
2 - Operation of production systems The operationalization of the production is primarily by the actions and measures of cross-monitoring, such as:
Rehabilitation of infrastructure;
Rehabilitation or construction of access roads that access production centers;
Limit the issuing of permits for logging and revise forest taxes;
Adoption of a National Plan for a Long-Term Agricultural Research Centre;
Creation of small agricultural and climatological stations in each region.
3 - Stimulate change for a more conservative attitude
Valuation of community radio stations;
Strengthening the ability of different actors in the countryside;
Awareness;
Regulate technically oriented construction, to protect the coast;
Dredging of rivers and harbors;
Spatial planning and management of physical space.
At the institutional level it would be necessary to:
Promote a coherent rural and balanced development policy, through major investments in infrastructure;
Promote credit systems adapted to the agricultural sector and local initiatives;
Promote conservation techniques, processing, storage and marketing of agricultural products;
Training staff involved in activities related to agriculture. In the livestock sector, suggest the following adaptation:
Develop a Master Plan for Forestry.
Encourage the breeding of short cycle;
Improve the system of management, biological capacity, creating conditions for safe production and improve the organization of producers;
Promote the program for genetic improvement of traditional diets;
Promote the training, information and awareness in the livestock sector;
Support the creation of transhumance corridors;
Support for intensive production of livestock;
Develop actions for the protection of animal health and the improvement of animal feed;
Develop small programs and projects that contribute to preserving genetic heritage through the implementation of characteristics which may provide better adaptability.
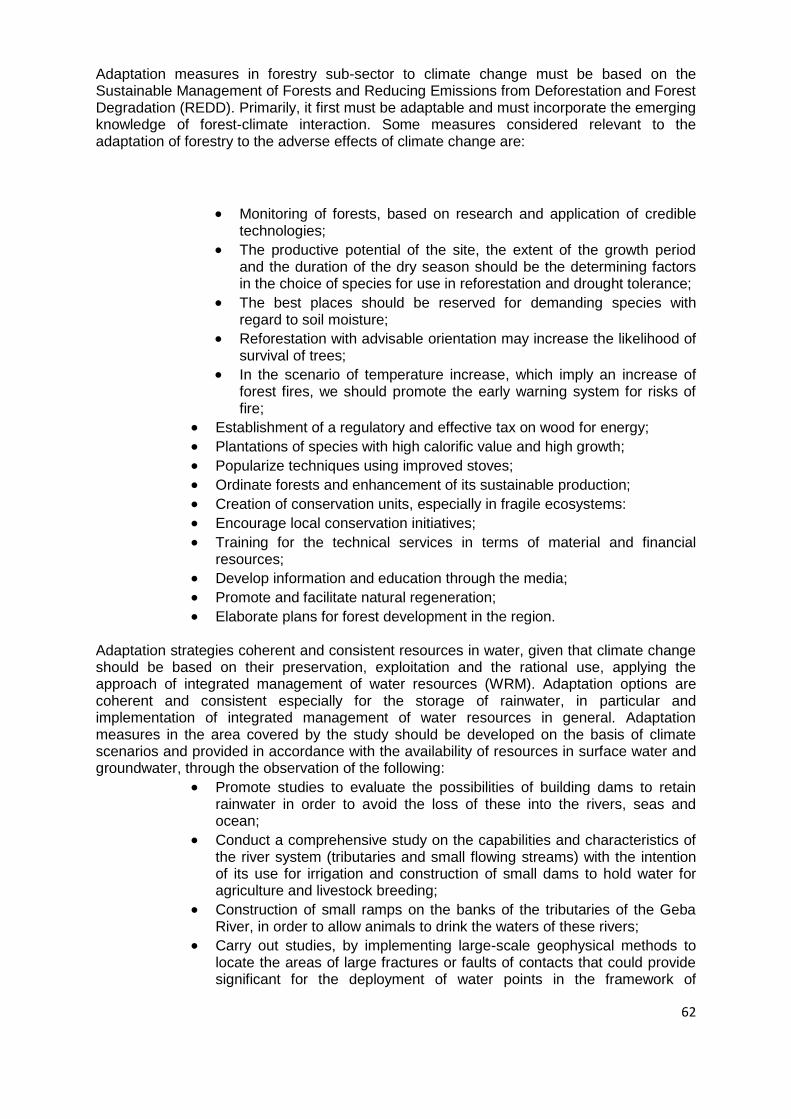
62
Adaptation measures in forestry sub-sector to climate change must be based on the Sustainable Management of Forests and Reducing Emissions from Deforestation and Forest Degradation (REDD). Primarily, it first must be adaptable and must incorporate the emerging knowledge of forest-climate interaction. Some measures considered relevant to the adaptation of forestry to the adverse effects of climate change are:
Monitoring of forests, based on research and application of credible technologies;
The productive potential of the site, the extent of the growth period and the duration of the dry season should be the determining factors in the choice of species for use in reforestation and drought tolerance;
The best places should be reserved for demanding species with regard to soil moisture;
Reforestation with advisable orientation may increase the likelihood of survival of trees;
In the scenario of temperature increase, which imply an increase of forest fires, we should promote the early warning system for risks of fire;
Establishment of a regulatory and effective tax on wood for energy;
Plantations of species with high calorific value and high growth;
Popularize techniques using improved stoves;
Ordinate forests and enhancement of its sustainable production;
Creation of conservation units, especially in fragile ecosystems:
Encourage local conservation initiatives;
Training for the technical services in terms of material and financial resources;
Develop information and education through the media;
Promote and facilitate natural regeneration;
Elaborate plans for forest development in the region. Adaptation strategies coherent and consistent resources in water, given that climate change should be based on their preservation, exploitation and the rational use, applying the approach of integrated management of water resources (WRM). Adaptation options are coherent and consistent especially for the storage of rainwater, in particular and implementation of integrated management of water resources in general. Adaptation measures in the area covered by the study should be developed on the basis of climate scenarios and provided in accordance with the availability of resources in surface water and groundwater, through the observation of the following:
Promote studies to evaluate the possibilities of building dams to retain rainwater in order to avoid the loss of these into the rivers, seas and ocean;
Conduct a comprehensive study on the capabilities and characteristics of the river system (tributaries and small flowing streams) with the intention of its use for irrigation and construction of small dams to hold water for agriculture and livestock breeding;
Construction of small ramps on the banks of the tributaries of the Geba River, in order to allow animals to drink the waters of these rivers;
Carry out studies, by implementing large-scale geophysical methods to locate the areas of large fractures or faults of contacts that could provide significant for the deployment of water points in the framework of
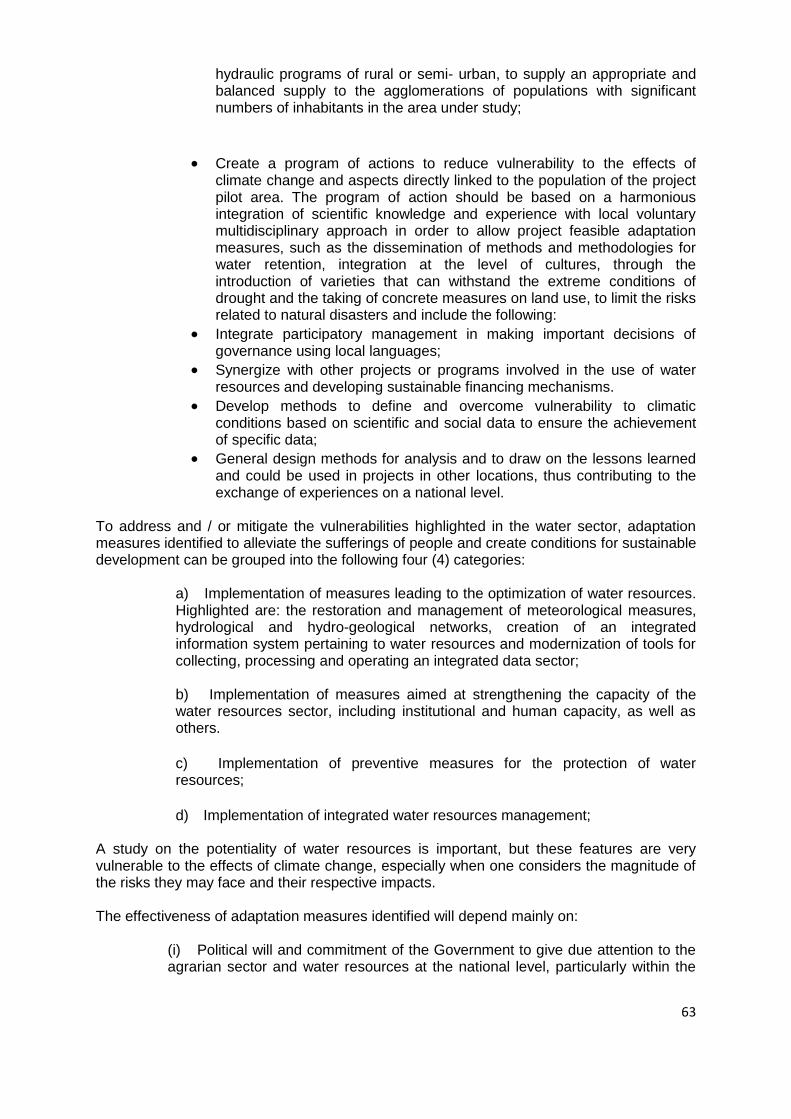
63
hydraulic programs of rural or semi- urban, to supply an appropriate and balanced supply to the agglomerations of populations with significant numbers of inhabitants in the area under study;
Create a program of actions to reduce vulnerability to the effects of climate change and aspects directly linked to the population of the project pilot area. The program of action should be based on a harmonious integration of scientific knowledge and experience with local voluntary multidisciplinary approach in order to allow project feasible adaptation measures, such as the dissemination of methods and methodologies for water retention, integration at the level of cultures, through the introduction of varieties that can withstand the extreme conditions of drought and the taking of concrete measures on land use, to limit the risks related to natural disasters and include the following:
Integrate participatory management in making important decisions of governance using local languages;
Synergize with other projects or programs involved in the use of water resources and developing sustainable financing mechanisms.
Develop methods to define and overcome vulnerability to climatic conditions based on scientific and social data to ensure the achievement of specific data;
General design methods for analysis and to draw on the lessons learned and could be used in projects in other locations, thus contributing to the exchange of experiences on a national level.
To address and / or mitigate the vulnerabilities highlighted in the water sector, adaptation measures identified to alleviate the sufferings of people and create conditions for sustainable development can be grouped into the following four (4) categories:
a) Implementation of measures leading to the optimization of water resources. Highlighted are: the restoration and management of meteorological measures, hydrological and hydro-geological networks, creation of an integrated information system pertaining to water resources and modernization of tools for collecting, processing and operating an integrated data sector;
b) Implementation of measures aimed at strengthening the capacity of the water resources sector, including institutional and human capacity, as well as others. c) Implementation of preventive measures for the protection of water resources; d) Implementation of integrated water resources management;
A study on the potentiality of water resources is important, but these features are very vulnerable to the effects of climate change, especially when one considers the magnitude of the risks they may face and their respective impacts. The effectiveness of adaptation measures identified will depend mainly on:
(i) Political will and commitment of the Government to give due attention to the agrarian sector and water resources at the national level, particularly within the
64
pilot area of the project, given the importance that these sectors have and are likely to represent for the balance and development of the national economy; (ii) Defining a clear policy and appropriate strategies for integrated management of agricultural patrimony and water resources in the area of the pilot project, taking into account climate change and variability and the manifold impacts that constitute their consequences;
(iii) Monitoring data on the evolution of the effects of climate change in relation to changes in hydrological and hydro-geological parameters.
It is worthwhile noting that one of the strategies and adaptation measures, addressing climate change, is the appreciation of traditional know-how of communities. Below, Table 34 illustrates the strategies and adaptation measures envisaged. Table 34: Strategies and adaptation measures envisaged.
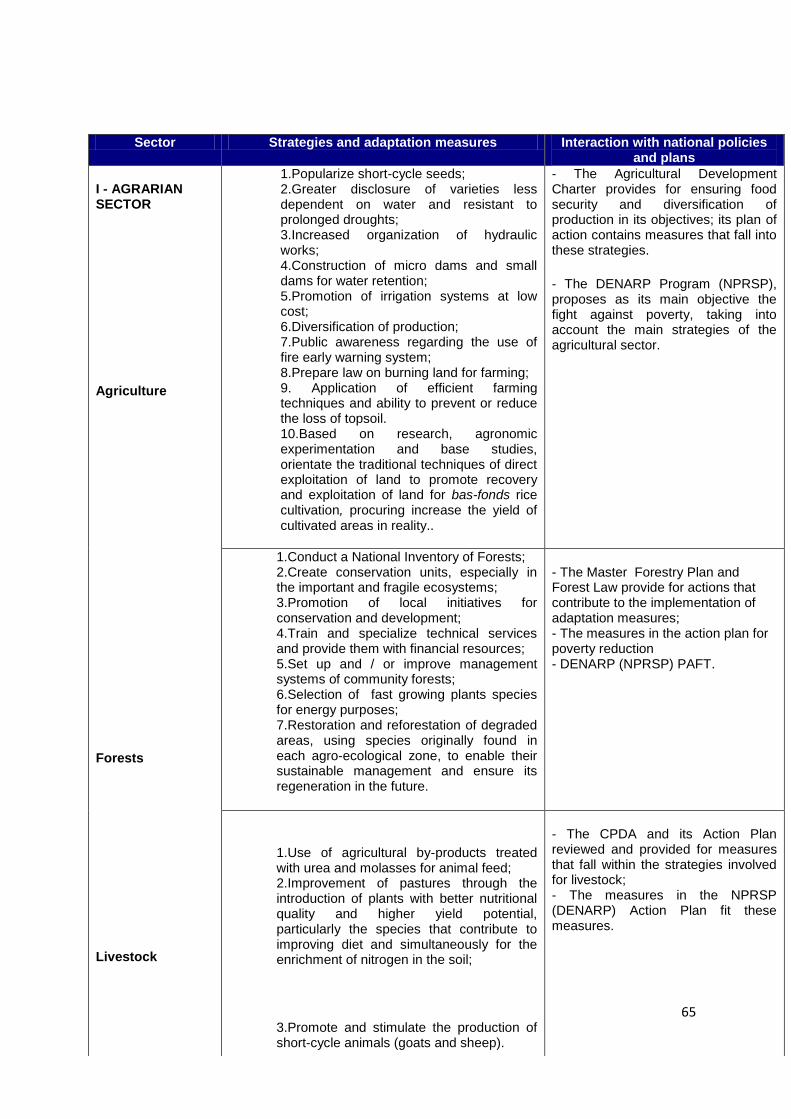
65
Sector Strategies and adaptation measures Interaction with national policies and plans
I - AGRARIAN SECTOR Agriculture Forests Livestock
1.Popularize short-cycle seeds; 2.Greater disclosure of varieties less dependent on water and resistant to prolonged droughts; 3.Increased organization of hydraulic works; 4.Construction of micro dams and small dams for water retention; 5.Promotion of irrigation systems at low cost; 6.Diversification of production; 7.Public awareness regarding the use of fire early warning system; 8.Prepare law on burning land for farming; 9. Application of efficient farming techniques and ability to prevent or reduce the loss of topsoil. 10.Based on research, agronomic experimentation and base studies, orientate the traditional techniques of direct exploitation of land to promote recovery and exploitation of land for bas-fonds rice cultivation, procuring increase the yield of cultivated areas in reality..
- The Agricultural Development Charter provides for ensuring food security and diversification of production in its objectives; its plan of action contains measures that fall into these strategies.
- The DENARP Program (NPRSP), proposes as its main objective the fight against poverty, taking into account the main strategies of the agricultural sector.
1.Conduct a National Inventory of Forests; 2.Create conservation units, especially in the important and fragile ecosystems; 3.Promotion of local initiatives for conservation and development; 4.Train and specialize technical services and provide them with financial resources; 5.Set up and / or improve management systems of community forests; 6.Selection of fast growing plants species for energy purposes; 7.Restoration and reforestation of degraded areas, using species originally found in each agro-ecological zone, to enable their sustainable management and ensure its regeneration in the future.
- The Master Forestry Plan and Forest Law provide for actions that contribute to the implementation of adaptation measures; - The measures in the action plan for poverty reduction - DENARP (NPRSP) PAFT.
1.Use of agricultural by-products treated with urea and molasses for animal feed; 2.Improvement of pastures through the introduction of plants with better nutritional quality and higher yield potential, particularly the species that contribute to improving diet and simultaneously for the enrichment of nitrogen in the soil;
3.Promote and stimulate the production of short-cycle animals (goats and sheep).
- The CPDA and its Action Plan reviewed and provided for measures that fall within the strategies involved for livestock; - The measures in the NPRSP (DENARP) Action Plan fit these measures.
66
V - MEASURES OF MITIGATION OF GHG EMISSIONS
This chapter presents options and mitigation measures for major sectors of GHG emissions (energy and agricultural) identified in the GHG inventory. It should be noted that the agricultural sector is formed by agriculture, forestry and livestock. V.1 - AGRARIAN SECTOR V.1.1 - Agriculture In Guinea-Bissau, farming is done manually and itinerant. They use the system of overturning and burning open spaces for agriculture, especially in the highlands. The country has a potential of arable land, estimated at 1,104,000 ha, distributed in a highland ecology. Of this total, 300,974 ha are cultivated land. Among the crops, 106,000 ha are mangroves, cultivated in an area equivalent to 51,000 ha, of which 200,000 ha are small valleys bas-
fonds, where 150,000 hectares are irrigated and 29,369 ha are cultivated. GHG Mitigation Options in Agriculture Based on the above mentioned scenarios, mitigation options of GHG emissions for the agricultural sector involve:
The increase of carbon sequestrations in soil and implementation activities and use of mechanisms that remove greenhouse gases into the atmosphere;
Direct planting system as carbon sequester;
Livestock - continued II - WATER RESOURCES
1.Rehabilitation, renovation and extension of infrastructure needed to quantitatively and qualitatively improve water resources and sanitation; 2.Rehabilitation and implementation of infrastructure for storm runoff water and the disposal of sewage at critical points in the major urban centers; 3.Organization and awareness to change mentality (creation of water user associations), to improve the level of knowledge of water resources (hydrology and hydrogeology) and its operation (training); 4.Implemented and improved a system for effective protection of water resources, to rationalize the construction of devices for their capture; 5.Implementation of effective and integrated management of the various uses of water resources; 6.Improve institutional organization, through the reactivation of the CAT, CIMA and CNA; 7. Updated existing legislation.
- The Director Scheme for the Water Sector and Sanitation involves the strategies outlined in this document. - The measures in the NPRSP Action Plan fit those measures. - The Water Code, approved by Government in 1992, establishes the general regime for the use of water resources as regards management, use and conservation. - This articulation was done also at the level of integrated management of watersheds and water resources, particularly through OMVG, the AGIR project, and GTZ.
67
Use of sustainable agricultural practices with the principles of agro-ecology and organic agriculture;
Building projects in agriculture, forestry and cattle uniting pasture and grain crops.(This is important because when there are more trees in the system they will be more efficient in reducing the carbon in the atmosphere);
Using the method of cultivation "mobilization zero", which protects and restores the soil, sequestering carbon;
Technical support to farmers in the evaluation and identification of risk levels, according to the following trinomial: risk, vulnerability and exposure;
Valuation of traditional knowledge of farmers in search of strategies for mitigation of GHGs;
Encouragement of conservation farming practices (a practice that involves minimal soil disturbance and can improve the efficiency of water use, carbon sequestration and improve the ability to withstand inclement weather);
Construction of reservoirs for irrigation (this initiative will contribute to the intensification of agricultural production, livestock and forestry);
Use of organic material compositions to improve soil and increase farm income;
Stabilization of agricultural land and strengthen traditional ones (this practice may help to stop the habit of farming in large areas of forest areas);
Planting trees between crops and around the small plots of land, which may help prevent soil erosion, to restore fertility and shade, thereby compensate for some of the effects of climate change.
V.1.2 - Forests Guinea-Bissau forests contribute 6% to the national GDP and contribute 6.2% to export revenues of the country. Deforestation, i.e. the use of forest resources for other purposes, is responsible for emitting large amounts of CO2 in the atmosphere.
The estimates show a decline of about 625,000 m 3 per year, of the forest area of the country, namely:
30% reduction in sub-humid dense forests in Tombali;
57% reduction of forests and savannahs in Bafata, Oio and Gabu;
19% reduction of mangrove forests. The consumption of firewood in the country is estimated at 296.37 Btu. This represents 87% of total consumption (SIE-GB, 2006). GHG mitigation options in forestry Based on the above mentioned scenarios, mitigation options of GHG emissions for the forest sector involve the following elements and actions:
Implementation of a policy of local governance;
Involvement of local communities in managing forest areas;
68
Implementation of efficient mechanisms of control of forest policy, aiming at their sustainable management;
Regulation of the profession of the wood and charcoal producer / marketer;
Adoption of compensatory policies to minimize or restore the damage to forests;
Encourage scientific research in the field of carbon sequestration and enhance sinks in the country;
Introduction and spread of forms of cleaner domestic energy (methane) in the country and in particular in rural areas;
Exploitation of renewable energy sources, improved stoves, using butane gas, solar, wind, etc..;
Elaborate a strategy for creating an international fund for structural measures;
Create central monitoring of our forests and, in particular, protected areas, with a view to maintaining their biodiversity;
Reforestation using resistant trees (tolerant to low rainfall and high temperatures) and rapid growth, etc..
V.1.3 - Livestock Livestock contributes 17% of the national GDP and 32% in the entire agricultural sector and is largely responsible for the emission of methane. GHG Mitigation Options in the livestock sector Based on the scenarios presented above, the options for mitigation of GHG emissions for the livestock sector include those factors and actions that follow:
Stimulation and development of scientific research, aiming at improvement of breeds and genetic digestive process of beef cattle;
The use of local breeds better adapted to climate and its variations;
Raising livestock in stables, limiting the pressure on the environment, especially in places where grasslands are rare and fodder crops are possible;
Use of a pasture is richer in sugar, which facilitate digestion;
Reduction of rent for cattle (the profits are split between the tenant and the raiser);
Improving the efficiency of food intake in animals, as well as the manipulation of diet and of better quality;
Use of food additives.
V.2 - ENERGY SECTOR
The energy situation in the country is distressing. Power plants run with serious hardships due to constant breakdowns of generator groups and often due to lack of diesel. Thus, to address the lack of electricity, most of the urban population uses personal generators to operate their business and their homes. This sector is the second largest emitter of CO2 after the forestry sector contributing to the
emission of large quantities of this gas, from the combustion of liquid fossil fuels and air transport, and CO emitted by the residential sector.
69
GHG mitigation options in energy sector With the implementation of the LEAP SCREENING program based on the scenarios referred to above, the following were selected:
The mitigation scenario through the substitution of traditional three-stone stoves or carbon stoves, for gas stoves the country would avoid the emission of 163,038 TE CO2 at a sale price of carbon of $ 5.2);
The mitigation scenario, through the construction of Saltinho and Cussilintra Dams (the country would divert the emission of 1,130,338 TE
CO2 at a sale price of carbon of $ 7.78);
The mitigation scenario decentralized rural electrification using a photovoltaic system (the country could safeguard against the issuance of
47,312 TE CO2 at a sale price of carbon of $ 6.24);
The mitigation scenario for the interconnection of the electricity grid and Sambagalou and Kaleta (the country would avoid the emission of 645,170
TE CO2 at a sale price of carbon of $ 126.72).
VI - ANALYSIS OF SOCIO-ECONOMIC IMPACTS OF CLIMATE CHANGE
VI.1 - INITIAL MACROECONOMIC SITUATION VI.1.1 – GDP, Growth and Inflation The economy of Guinea-Bissau is characterized by the predominance of agriculture (59.6% of GDP in 2004), services (28.4%) and industry (12%). Its sluggish rate of growth, from 2000 to 2004, which stood at around 1%, did not allow for the struggle against poverty to be enforced. In the 1990s, there was an annual decline of 1.3% of the indicators of standard of living, which worsened in 2002, reaching 7.2%, which was a direct result of the political-military conflict that devastated the country between 1998 and 1999. The levels of inflation, sometimes with inaccurate determinations, were estimated at around 3.5%, after the country's accession to UEMOA. Investment, despite having registered a sharp growth increase from 9.6% to 14.6% in 2005, remained far from the 20% target within the convergence criteria defined by UEMOA. Public savings, with a negative trend between 2001 and 2005, was reversed for the first time, reaching 16.2% in 2004. This result was possible thanks to money transfers made by immigrants, according to the Strategic Document for Poverty Reduction (DRSP). The country's exports are mainly constituted by cashew nuts, which represent 90% of its overall value. Its production has soared in recent years. In 2004, it reached the threshold of 100,000 tons. It should be noted that the country virtually has no industries and imports most of its goods. Although exports covered all imports in 2000 and 2001, that was not the case in in 2002, 2003 and 2004, respectively, covering only 93.1%, 98.8% and 94.1% of imports. The services balance remained in deficit from 2000 to 2004, with rates of -14.3% in 2003 and -16.9% of GDP, according to DRSPs. Consider the Macro Sector situation presented in Chapter I, on national circumstances.
70
VII - NEEDS REQUIRED TO STRENGTHEN NATIONAL CAPACITIES IN THE FIELDS OF TRAINING, COMMUNICATION, INFORMATION AND AWARENESS ON
CLIMATE CHANGE
With regard to information, education and public awareness, efforts have been made also by the State and its technical and financial partners. These multiple and varied initiatives have been made through the realization of training seminars, national conferences, radio interviews, production and dissemination of documents dealing with the issue of climate change. It should be noted that, during the preparation of COP 15 in Copenhagen, an Information, Education and Communication (IEC) seminar was held in Bissau entitled "Impact of Climate Change on Productive Sectors of the National Economy" that was attended by decision-makers, parliamentarians, senior technicians, NGOs, Civil Society and Media. Based on constraints and gaps, listed in Chapter VIII, covering the needs in education, training and public awareness about climate change, the following needs were ranked in order of priorities:
1. Sensitization of economic and industrial decision-makers, with the aim of raising
awareness among Members of Parliament, Government officials and senior management, and economic players on climate change, the Convention and the Kyoto Protocol: Challenges and prospects, opportunities and prospects for investment by domestic companies under the CDM; 2.Education and training of civil society and technical staff on the procedures of
projects in the field of climate change, funding procedures, CDM, adaptation strategies and mitigation measures; 3. Education, information and awareness among farmers about the adverse effects
of climate change on the environment, the opportunities that the CDM offers strategies for adaptation and mitigation measures; 4. Education and training of elementary, high school and college students about the
harmful effects of climate change on the environment, mitigation and adaptation and CDM; 5. Setting up an operational center for information exchange; 6. Stimulation of Web sites; 7. Establishment of thematic networks of exchange and reflection; 8. Preparation and / or strengthening of exchange programs between the parties.
In conclusion, in implementing the UNFCCC and in accordance with the obligations of the parties involved, we have programs concerning education, training and public awareness of the institutional and legal frameworks. In this context, various laws, orders and agreements - at National, Sub Regional and Regional levels - were endorsed and supported by various initiatives and projects. Despite numerous initiatives and projects, it appears that few initiatives have been undertaken so far by rural area decision-makers and for students who are the prime targets. Technicians have been struggling with limited success to convey the knowledge they hold. This is why there are still gaps and constraints that obstruct the effective implementation of the Convention. Given this situation, the main actions to be undertaken will address:
Decision-makers and economic policies;
Representatives of civil society and technical staff;
Producers;
Students. To this end, the Action Program should aim at the targets listed above as items 1 through 8.
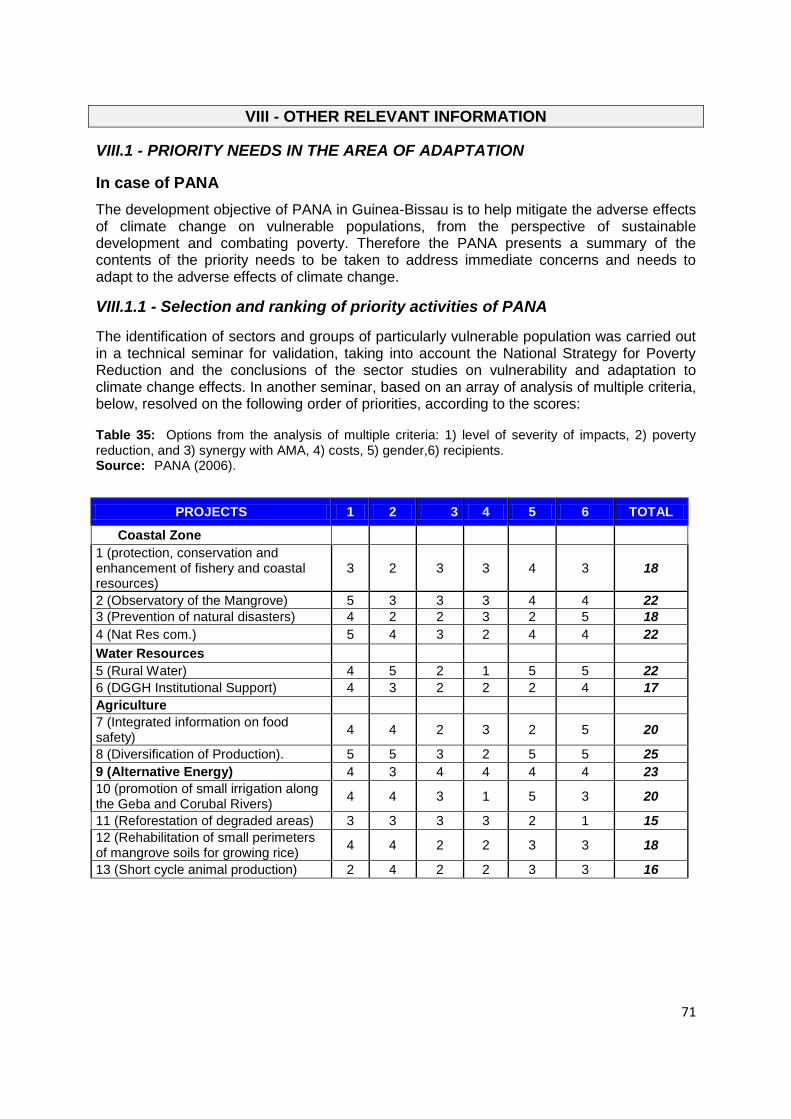
71
VIII - OTHER RELEVANT INFORMATION VIII.1 - PRIORITY NEEDS IN THE AREA OF ADAPTATION In case of PANA The development objective of PANA in Guinea-Bissau is to help mitigate the adverse effects of climate change on vulnerable populations, from the perspective of sustainable development and combating poverty. Therefore the PANA presents a summary of the contents of the priority needs to be taken to address immediate concerns and needs to adapt to the adverse effects of climate change. VIII.1.1 - Selection and ranking of priority activities of PANA
The identification of sectors and groups of particularly vulnerable population was carried out in a technical seminar for validation, taking into account the National Strategy for Poverty Reduction and the conclusions of the sector studies on vulnerability and adaptation to climate change effects. In another seminar, based on an array of analysis of multiple criteria, below, resolved on the following order of priorities, according to the scores: Table 35: Options from the analysis of multiple criteria: 1) level of severity of impacts, 2) poverty reduction, and 3) synergy with AMA, 4) costs, 5) gender,6) recipients. Source: PANA (2006).
PROJECTS 1 2 3 4 5 6 TOTAL
Coastal Zone 1 (protection, conservation and enhancement of fishery and coastal resources)
3 2 3 3 4 3 18
2 (Observatory of the Mangrove) 5 3 3 3 4 4 22 3 (Prevention of natural disasters) 4 2 2 3 2 5 18 4 (Nat Res com.) 5 4 3 2 4 4 22
Water Resources 5 (Rural Water) 4 5 2 1 5 5 22 6 (DGGH Institutional Support) 4 3 2 2 2 4 17 Agriculture 7 (Integrated information on food safety)
4 4 2 3 2 5 20
8 (Diversification of Production). 5 5 3 2 5 5 25 9 (Alternative Energy) 4 3 4 4 4 4 23 10 (promotion of small irrigation along the Geba and Corubal Rivers)
4 4 3 1 5 3 20
11 (Reforestation of degraded areas) 3 3 3 3 2 1 15 12 (Rehabilitation of small perimeters of mangrove soils for growing rice)
4 4 2 2 3 3 18
13 (Short cycle animal production) 2 4 2 2 3 3 16
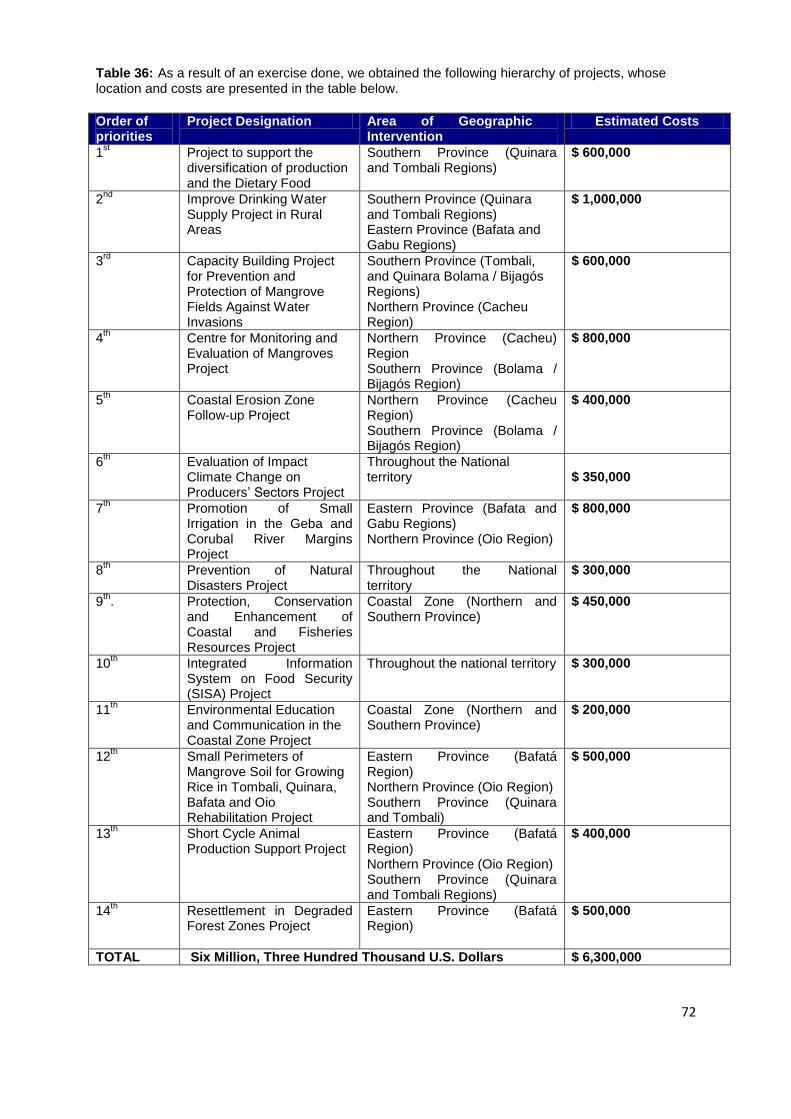
72
Table 36: As a result of an exercise done, we obtained the following hierarchy of projects, whose location and costs are presented in the table below. Order of priorities
Project Designation Area of Geographic Intervention
Estimated Costs
1st Project to support the
diversification of production and the Dietary Food
Southern Province (Quinara and Tombali Regions)
$ 600,000
2nd
Improve Drinking Water Supply Project in Rural Areas
Southern Province (Quinara and Tombali Regions) Eastern Province (Bafata and Gabu Regions)
$ 1,000,000
3rd
Capacity Building Project for Prevention and Protection of Mangrove Fields Against Water Invasions
Southern Province (Tombali, and Quinara Bolama / Bijagós Regions) Northern Province (Cacheu Region)
$ 600,000
4th Centre for Monitoring and
Evaluation of Mangroves Project
Northern Province (Cacheu) Region Southern Province (Bolama / Bijagós Region)
$ 800,000
5th Coastal Erosion Zone
Follow-up Project Northern Province (Cacheu Region) Southern Province (Bolama / Bijagós Region)
$ 400,000
6th Evaluation of Impact
Climate Change on Producers’ Sectors Project
Throughout the National territory
$ 350,000
7th Promotion of Small
Irrigation in the Geba and Corubal River Margins Project
Eastern Province (Bafata and Gabu Regions) Northern Province (Oio Region)
$ 800,000
8th Prevention of Natural
Disasters Project Throughout the National territory
$ 300,000
9th. Protection, Conservation
and Enhancement of Coastal and Fisheries Resources Project
Coastal Zone (Northern and Southern Province)
$ 450,000
10th Integrated Information
System on Food Security (SISA) Project
Throughout the national territory $ 300,000
11th Environmental Education
and Communication in the Coastal Zone Project
Coastal Zone (Northern and Southern Province)
$ 200,000
12th Small Perimeters of
Mangrove Soil for Growing Rice in Tombali, Quinara, Bafata and Oio Rehabilitation Project
Eastern Province (Bafatá Region) Northern Province (Oio Region) Southern Province (Quinara and Tombali)
$ 500,000
13th Short Cycle Animal
Production Support Project Eastern Province (Bafatá Region) Northern Province (Oio Region) Southern Province (Quinara and Tombali Regions)
$ 400,000
14th Resettlement in Degraded
Forest Zones Project Eastern Province (Bafatá Region)
$ 500,000
TOTAL Six Million, Three Hundred Thousand U.S. Dollars $ 6,300,000
73
Source: PANA (2006) These priorities are essentially aimed at increasing the level of food security of rural populations, aiming to strengthen their capacity for adaptation, reducing pressure on forest resources and fisheries, and improved access to potable water for human consumption and livestock. It is emphasized that climate change exerts a negative influence on the quality and quantity of water resources by reducing rainfall. The same is true for the conservation and recovery of fish stocks and coastal zones, as well as the utilization of the enormous potential of existing agrarian. It should be noted that according to the Agricultural Development Policy Charter (CPDA), the Country cannot guarantee food security without diversifying their food production, including short-cycle animal production. The country relies heavily on rice. Since domestic production of rice is not enough to cover the cycle of self-sufficiency, the majority of households in Guinea-Bissau apply the proceeds from cashew nut sales - the main export – to buy or trade for rice. In addition to the destruction of thousands of hectares of mangrove rice fields due to flooding caused by high tides during the last agricultural season, the price of cashew nuts in the international market fell substantially, reflecting negatively on the producer price in 2005 and 2006. This drop in producer price, coupled with the limited financial capacity for the overwhelming majority of the country's rural population caused serious consequences and increased hunger and / or malnutrition. This choice seeks to fulfill needs to maintain the synergies between this program and other international conventions, plans and internal policies of Guinea-Bissau.
VIII.2 - PRIORITY NEEDS FOR TECHNOLOGY TRANSFER
VIII.2.1 - OBJECTVE
The basic objective of this chapter is to identify the different technologies in sectors considered to be most important in relation to the welfare of the national economy.
VIII.2.2 - Identification of needs in the field of technology and its transfer The Government, Industry and Producers of the Republic of Guinea-Bissau, in general, are very interested in improving existing technologies in the Country, in various sectors and to import technologies adaptable to our reality.
It’s worthwhile to note that in this Technology Transfer, the most important thing to observe is the acquisition of environmental technology, considered "friendly" to the environment, and that also contribute to the welfare of the national economy.
In order to allow the country to develop its own technologies and modernize itself through innovation, it becomes imperative to create and develop within the Universities and Institutes Research and Development (R & D) activities
However, for the initiation and development of this work its necessary to know, in detail, the technologies used in each of the selected sectors and those considered important to the well-being and development of the country. One of the sources of technological information needed for our work was to identify applied technologies in the different sectors of the country.
74
Indeed, it is recognized that in the country, most sectors do not have technologies in the true sense of the word, and those that did are actually very old.
Consequently, one can infer that the country needs to be systematically informed about the latest technologies that could bring benefits to various sectors of the national economic life.
VIII.2.2.1 - Agriculture
Existing agriculture technologies used today in the Country are considered rudimentary, such as plows, hoes, machetes, scythes and very few small machines such as tractors from the 1960s to the 1990s. Despite the fact that these technologies are traditional, they have their negative impacts on the adaptation of populations to their habitats.
Agriculture, even though for subsistence, cannot and should not continue with this type. Thus, it is urgent that the Country adopt measures and policies that meet the aspirations of the agricultural sector, with regard to Technology Transfer. It is therefore necessary to transfer technology in this sector since the country needs to increase the quantity and quality of its production, which is only possible with the use of modern techniques and a scientific agriculture to ensure food safety factor prominently featured in the UNFCCC and the process of adaptation of populations. Since Technology Transfer is one form of innovation, it is important that trained human resources are available to take ownership and full advantage of technology. It is imperative to carry out technology transfer in agriculture with extensive use of new technology to increase the quantity and quality of production. The Technology Transfer required and recommended to address the objectives of development, are as follows:
Technology Transfer for the production:
a) Tractors, harvesters, seeders, etc.. (Special machines)
Transfer of knowledge; Transfer of techniques; Staff Training
VIII.2.2.2.Energy The strategy to build energy foundations necessary for the country's development necessarily involves the transfer of technology in this sector, hence it is proposed:
Wind Energy: Wind energy has a more modest potential, favored by the country's geomorphology and geographical location (island part). The bas-reliefs, the plains, the existence of a vast coastline and an Archipelago directly bathed by the Atlantic Ocean, causes the country to be crossed by a system of winds whose annual average speed is between 3 and 30m 5m/sa sun . (European Éolien Atlas (Class C). These characteristics were mentioned in the “Carta Mundial da Produtividade de
Eenergia Eólica” (Global Wind Energy Productivity Charter), which confirms the
75
possibility of using this form of energy, large-scale, low cost, in over 50% of coastal regions - connected or isolated networks - and small scale for water pumping and electrification of small villages. However, we emphasize that, while not burning fossil fuels and not emitting pollutants, wind energy is not devoid of environmental impacts. They alter landscapes with their towers and their propellers, and may threaten birds, if they are installed on migration routes. They emit a certain level of noise (low frequency), which can cause some discomfort. Moreover, they may cause interference to television networks broadcast.
Solar Energy:
According to the National Meteorological Data and data available on regional and international levels, (ASECNA, UNESCO, GRUNDFOS, TOTAL ENERGIE), daily radiation is more or less 5.5 kWh / m² (average of 2,000 kWh / m² / year) for an insulation average of 8 hours / day, i.e. 2,920 hours per year. This will allow the country to reasonably exploit that form of energy.
Water Resources Regarding the Transfer of Technology in this sector for the capture, retention, storage and distribution of water, we note that it can be done through the use of new technology in the manufacture of special deposits or reservoirs, cisterns, improved tanks and dams. This will have a reserve of water for later use, for human consumption, irrigation, and possibly for generation of hydropower.
Industrial Sector With regard to the need for Technology Transfer in this sector, the following might conjectured: It is known that the nature of environmental problems is partly attributed to the complex industrial processes used by man; any product, no matter what the material is or what the purpose of its use causes an impact on the environment, either because of the production process of raw materials which are consumed in their manufacture or due to its use or disposal (CHEHESE, 1997). Since the industrial sector is the domain of processing materials, all processes involving this industry needs Technology Transfer that are environmentally friendly, with a view to lowering carbon development.
Tourism Sector With regard to technologies used in this sector, we have not identified any thus far.
Fisheries Sector This sector is recommended for the following Transfer of Technology:
a) Transfer of technology in sophisticated systems of conservation; b) Transfer of technology for systems’ transformation; c) Transfer of technology in packaging systems.
Waste Sector
76
Concerning the waste sector, more specifically regarding the treatment of such waste, the technology used is rudimentary and reduces the burning of debris in the open, with the emission of CO2, CO, N2O to the atmosphere. In this line, there is a great need to implement technologies for composting and sophisticated incineration. Thus, the following technologies are recommended for this sector: recycling and reuse of certain wastes, selection and separation of waste by type (organic waste, glass, and paper, plastic) and containers.
Transportation In this sector very old technologies are still used with diesel and gasoline as fuels whose impact is negative for the environment. However, it is suggested that in the future, technologies be acquired in this sector, in which fuel to be used are those considered environmentally friendly (bio-fuels) or "green" technologies. It should be emphasized that Guinea-Bissau has major shortcomings in terms of acquisition of new technologies in the transport sector. The old ones currently used in the Country are those in which the engines operate by burning fossil fuel. Given the need for technology transfer, it is worth mentioning the fact that clean technologies used in “developed countries” have a high cost and its transfer to third parties requires substantial financial resources, due to its protection under the Industrial Property Rights. Moreover, the technologies currently being used and tested in some developed countries, and / or "frontier" technology are based Hydrogen / Bio-fuel. Thus, for Transfer of Technology in this sector, we recommend the following: adoption of the technology base for biodiesel and hybrid engines (Hydrogen).
Health Sector In the health sector, we could not identify technologies applied, yet the country needs to acquire new technologies, so as to meet the new requirements for public health. In this vein, the perfect understanding of these needs could enable the country to import a variety of technologies for the hospital sector: solid waste incineration, treatment related to oxygen and ozone, water treatment with ozone and hospital food freezing with liquid nitrogen, like in many other countries. In the same vein, it is recommended for Technology Transfer, process of incineration, water treatment hospital with ozone; freeze foods with liquid N2.
IX - CONSTRAINTS AND GAPS In terms of vulnerability, adaptation and mitigation measures to climate change effects, constraints can be found at three levels: human, material and / or technical and financial.
IX.1 - HUMAN LEVEL From a human stand point, mainly the following points:
Poor development of education, training and research on climate change, particularly with regard to both vulnerability and adaptation;
Lack of mastery of tools and methodologies for GHG inventory, properly assess vulnerability and adaptation to climate change;
Insufficiency of scientific backgrounds on certain aspects, such as vulnerability, adaptation and mitigation of the impact of climate;
Lack of knowledge on the part of national actors, the problems and challenges of climate change;
77
Weak culture of documentation and filing.
Constant political instability
IX.2 - MATERIAL AND TECHNICAL LEVEL At this level the following constraints are particularly apparent:
Lack of national institutions for research and systematic observation in the weather and water sciences, (meteorological, hydrological);
Lack of specialized personnel in the field of climate change;
Lack of a national database (hydrology, hydrogeology, forest inventory) accessible and structured for better vulnerability assessment and adaptation;
Lack of a method of documentation and data archives;
Lack of long term climatic parameters monitoring and surveillance units;
Lack of a specific coherent model with good resolution for the assessment of vulnerability and adaptation applicable for all sectors;
Lack of effective systems for weather and hydrological forecasts;
Lack of a national center specializing in research on climate change;
Insufficiency of nationwide material means of collecting, archiving for analysis and communication (GIS, Remote Sensing, etc..).
IX.3 - FINANCIAL LEVEL
The following difficulties are mainly distinguished at this level:
Weak financial capacity of the State and research institutions, for collection, storage and analysis of climatic data and natural renewable resources;
Lack of financial resources to purchase and acquire certain data and software necessary for vulnerability assessment and adaptation;
Insufficient financial resources to strengthen capacity and build an enduring system for assessing vulnerability and adaptation;
Weak mobilization of resources to fund programs and adaptation strategies.
With regard to systematic observation, systems for meteorological, atmospheric,
climatological, satellite, hydrological observations, and others, are the basic elements
essential to study the planet's climate. These systems do not exist in the Country, and the
meteorological observation process has been going through continuing degradation, taking
into account the economic and financial difficulties that the Country faces.
This resulted in the country's lack of contribution to the global programs of observation and climate research. The constraints of research and systematic observations, linked to climate change, can be summarized at the national level, highlighting the following issues:
Failure in quality and quantity of skilled human resources;
Economic and financial difficulties;
Failure and / or inadequacy of infrastructure necessary to conduct the investigation;
Lack of inter-discipline;
78
Insufficient human dimension involvement in climate change, often ignoring socio-economic and policies;
Inability to pay for expensive meteorological equipment. The following are verified on the Regional level:
Lack of a consistent and permanent synoptic observations network, throughout all of Africa;
Absence of consistent, continuous, consistent and robust climate observation network;
Lack of a reliable telecommunications network, which would facilitate the exchange of data and support systems for forecasting and early warning systems to establish and ensure sustainable development;
Lack of a radar network for areas exposed to bad weather - an essential tool for an early warning system;
Weak integration of climate change policies, strategies and development programs (public policy).
With regard to the needs to reinforce capacity building in training, communication, awareness and information gaps and constraints still exist and obstruct the effective implementation of the Convention. Among these the following may be cited:
Weak understanding of climate change by the very ones in charge of raising awareness around this concept;
Insufficiency and lack of awareness support adaptation;
High illiteracy rate of the population causes difficulty in understanding messages;
Insufficiency in assessing climate change;
Inadequate allocation of resources for further education, training and public awareness actions;
Relatively high cost to take advantage of media (newspapers, printing, radio, television, etc...), activities for Information, Education and Communication (IEC);
Low interest to this Convention by the civil society, taking into account its complexity and its technical character;
Lack of consideration of the issue of climate change into national policies and strategies of development;
Weak financial contribution mechanism of the Convention for developing countries’ actions, due to overly complex and lengthy procedures;
Insufficiency of national mechanisms for trade, promotion and dissemination of information.
79
REFERENCES
Africapractice. Available in: www.africapractice.com/case_studies/carbon_1.html , accessed
in 2010.
ALVES, P. H. (2000) A geologia da Guiné-Bissau no contexto da evolução regional do
Fundo de carbono para a Ásia e o Pacífico. Asian Development Bank. Available in:
www.adb.org/Clean-Energy/carbon-fund.asp, accessed in 2010.
Avançados. (2002). São Paulo, v. 16, n. 45, p. 34-42.
Biai, J. & Sá, J. (2009) Vulnerabilidade e adaptação as alterações climáticas, zona costeira.
BJÖRDAHL, G. & HENSBERGEN, Van. (2001a) Key Issues in Forestry Sector to Year 2020
in the West African Sub Region. Working Document, FOSA. Abidjan: African Development
Bank.
Carbon Finance Unit. State of the Carbon Market . Banco Mundial. Available in:
http://carbomfinance.org/docs/carbom_trends_2007FINAL_MAY_2.pdf, accessed in 2010.
Carvalho, J. A. T. & Nunes, F. J. S. F. P. (1956) Contribuição para o Estudo do Problema
Florestal da Guiné Portuguesa. Estudos e Ensaios. Documentos da Junta da Investigação
Científica do Ultramar. N30, 194 p.
Carvalho, J. A. T. & Nunes, F. J. S. F. P. (1956) Contribuição para o Estudo do Problema
Florestal da Guiné Portuguesa. setembro 2006 30, 194 p.
Cassamá, V. L. S., Djassi, B., Sal, D. (2009) Vulnerabilidade e adaptação as alterações
climáticas - Sector agrário, 2009, Bissau 37 pp
Catarino, L.; Martins, E. S. & Moreira, I. (2001) Influence of environmental features in the
phytogeographic framework of Guinea-Bissau. Syst. Geogr. Pl. 71: 1079-1086.
Convenção quadro das Nações Unidas sobre alterações climáticas (CCNUCC) (English and
French). Available in: http://unfccc.int/2860.php,accessed in 2010.
Reforço das capacidades para os MDL – CD4CDM. (Inglês). Disponível em:
www.cd4cdm.orgumentation, accessed in 2010.
80
CDM & JI Monitor, available in:
http://www.pointbarbon.com/category.php?categoryID=26&inag=en(português), accessed in
2010.
Cisse, M.K. (Mai 2004) Analyse socioéconomique des impacts des changements
climatiques.
Communications from Parties not included in Annex I to the Convention.
Comunicação Nacional Inicial da Guiné-Bissau sobre as Mudanças Climáticas, (2004)
Ministério de Energia e dos Recursos Naturais, GEF/UNDP, Bissau.
Costa, J. C. (1946) Meio físico da Guiné Portuguesa. Anais, Junta Missões Geográficas
Goia, M.S. da (2009) Estudo da vulnerabilidade e adaptação às alterações climáticas no
sector da saúde.
Estratégia Nacional para a Redução da Pobreza (DENARP) (setembro 2006), Bissau
FAO (1993) Evaluation des ressources forestières, 1990: Pays tropicaux
FAO (2003a) Anuário Estatístico, Vol. 57
FAO (2003b) Anuário Estatístico, Vol. 53
FAO (2003C) Rapport Sous - Regional Afrique de l'Ouest - Etude prospective du secteur
forestier en Afrique
FAO (2003C) Rapport Sous - Regional Afrique de l'Ouest - Etude prospective du secteur
forestier en Afrique
FAO (2007) Situation des Forêts du Monde
Formação e Utilização. Estudos e Ensaios. Documentos da Junta da Investigação Científica
do Ultramar. Lisboa, 100. 397 p.
Guinea-Bissau: Basic Data. IMF Country Report No. 06/313, August 2006.
Guinea-Bissau: Politics, Economics and Society, E Galli, Rosemary et Jones, Jocelyn
(1987), London, United Kingdom.
IDB. Inter American Deveploment Bank: Carbon Neutral Initiative-informações (English and
French), available in: www.iadb.org/sds/carbon_nuetral/index.cfm?language=EN&parid=1,
accessed in 2010.
81
IFP/MDL. Iniciativas francófonas de parceria. available in:
www.iepf.org/docs_prog05/pol_envir05/IFO-MDL_accueil.htm, accessed in 2010
DJASSY, Braima et CORREIA, Florentino (2007) Inventário de Gases com Efeito de Estufa
na Guiné-Bissau no Sector Agro-Pecuário. Direcção-Geral de Ambiente/PNUD/GEF,
Bissau.
CASSAMÁ, Viriato et CASSAMÁ, Seiti (2007) Inventário de Gases com Efeito de Estufa na
Guiné-Bissau no Sector Florestal. Direcção-Geral de Ambiente/PNUD/GEF, Bissau.
Djaló, Suleimane (2007) Inventário de Gases com Efeito de Estufa na Guiné-Bissau no
Sector Industrial. Direcção-Geral de Ambiente/PNUD/GEF, Bissau.
Inventories, 2000, available in <http://www.ipcc-nggip.iges.or.jp/public/gp/english/>.
Invest. Colon. 1: 11-31.
IPCC (1996) Guidelines for National Greenhouse Gas Inventories. The Reporting
Instructions (Volume1), The Workbook (Volume 2) & The Reference Manual (Volume 3)
IPCC. National Greenhouse Gas Inventories Programme Edited by Jim Penman,
IPCC/OECD/IEA: Revised 1996 IPCC Guidelines for national greenhouse gas inventories,
IPCC (1996) Good practice guidance and uncertainty management in national greenhouse
gas
IPCC (2001) CLIMATECHANGE 2001: THE SCIENTIFIC BASIS. Climate Change 2001:
The Scientific Basis is the most comprehensive and up-to-date scientific assessment of past,
present and future climate change. The report, edited by T. Houghton Y. Ding D.J. Griggs M.
Noguer P.J. van der Linden X. Dai K. Maskell & C.A. Johnson.
IPCC(2003) Good practice guidance for land use, land use change and forestry.
IPCC: (2006) IPCC Guidelines for Nacional Greenhouse gas Inventories. Volumes 1, 2, 3, 4,
5.
J.T. HOUGHTON, Y.; DING, D. J.; GRIGGS, M.; NOGUER, P.J. van der Linden X.; DAI, K.
Maskell & C. A. Johnson. IPCC (2001) CLIMATECHANGE 2001: THE SCIENTIFIC BASIS.
Climate Change 2001: The Scientific Basis is the most comprehensive and up-to-date
scientific assessment of past, present and future climate change. The report, LAWRENCE,
W., FEARNSIDE, P. et al. (1999) Relationship between soils an Amazon forest biomass: a
land scap study in forest ecology and management. 118: 127-138.
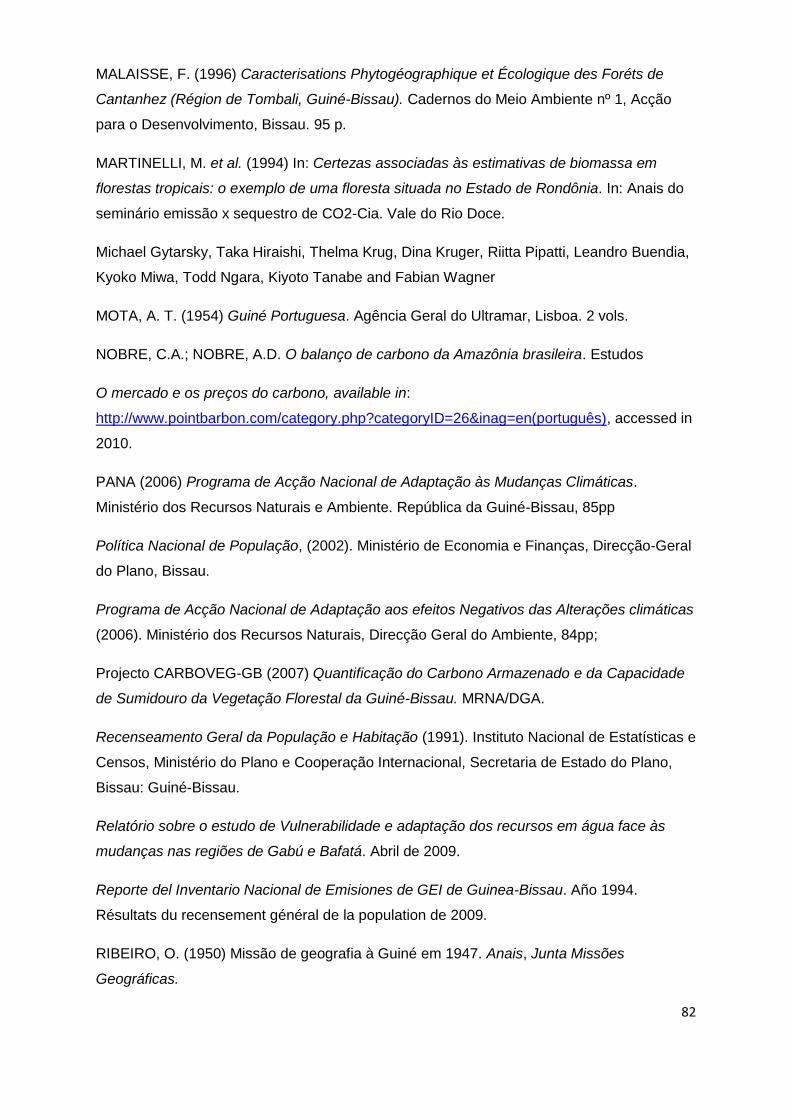
82
MALAISSE, F. (1996) Caracterisations Phytogéographique et Écologique des Foréts de
Cantanhez (Région de Tombali, Guiné-Bissau). Cadernos do Meio Ambiente nº 1, Acção
para o Desenvolvimento, Bissau. 95 p.
MARTINELLI, M. et al. (1994) In: Certezas associadas às estimativas de biomassa em
florestas tropicais: o exemplo de uma floresta situada no Estado de Rondônia. In: Anais do
seminário emissão x sequestro de CO2-Cia. Vale do Rio Doce.
Michael Gytarsky, Taka Hiraishi, Thelma Krug, Dina Kruger, Riitta Pipatti, Leandro Buendia,
Kyoko Miwa, Todd Ngara, Kiyoto Tanabe and Fabian Wagner
MOTA, A. T. (1954) Guiné Portuguesa. Agência Geral do Ultramar, Lisboa. 2 vols.
NOBRE, C.A.; NOBRE, A.D. O balanço de carbono da Amazônia brasileira. Estudos
O mercado e os preços do carbono, available in:
http://www.pointbarbon.com/category.php?categoryID=26&inag=en(português), accessed in
2010.
PANA (2006) Programa de Acção Nacional de Adaptação às Mudanças Climáticas.
Ministério dos Recursos Naturais e Ambiente. República da Guiné-Bissau, 85pp
Política Nacional de População, (2002). Ministério de Economia e Finanças, Direcção-Geral
do Plano, Bissau.
Programa de Acção Nacional de Adaptação aos efeitos Negativos das Alterações climáticas
(2006). Ministério dos Recursos Naturais, Direcção Geral do Ambiente, 84pp;
Projecto CARBOVEG-GB (2007) Quantificação do Carbono Armazenado e da Capacidade
de Sumidouro da Vegetação Florestal da Guiné-Bissau. MRNA/DGA.
Recenseamento Geral da População e Habitação (1991). Instituto Nacional de Estatísticas e
Censos, Ministério do Plano e Cooperação Internacional, Secretaria de Estado do Plano,
Bissau: Guiné-Bissau.
Relatório sobre o estudo de Vulnerabilidade e adaptação dos recursos em água face às
mudanças nas regiões de Gabú e Bafatá. Abril de 2009.
Reporte del Inventario Nacional de Emisiones de GEI de Guinea-Bissau. Año 1994.
Résultats du recensement général de la population de 2009.
RIBEIRO, O. (1950) Missão de geografia à Guiné em 1947. Anais, Junta Missões
Geográficas.
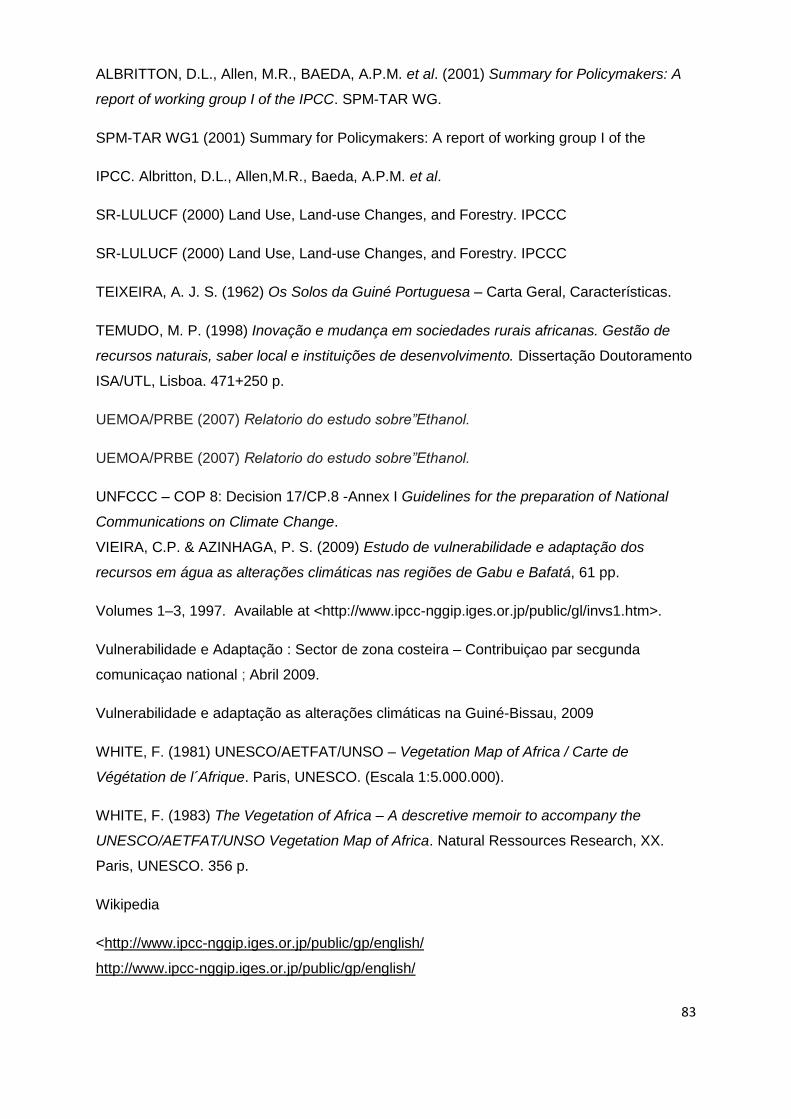
83
ALBRITTON, D.L., Allen, M.R., BAEDA, A.P.M. et al. (2001) Summary for Policymakers: A
report of working group I of the IPCC. SPM-TAR WG.
SPM-TAR WG1 (2001) Summary for Policymakers: A report of working group I of the
IPCC. Albritton, D.L., Allen,M.R., Baeda, A.P.M. et al.
SR-LULUCF (2000) Land Use, Land-use Changes, and Forestry. IPCCC
SR-LULUCF (2000) Land Use, Land-use Changes, and Forestry. IPCCC
TEIXEIRA, A. J. S. (1962) Os Solos da Guiné Portuguesa – Carta Geral, Características.
TEMUDO, M. P. (1998) Inovação e mudança em sociedades rurais africanas. Gestão de
recursos naturais, saber local e instituições de desenvolvimento. Dissertação Doutoramento
ISA/UTL, Lisboa. 471+250 p.
UEMOA/PRBE (2007) Relatorio do estudo sobre”Ethanol.
UEMOA/PRBE (2007) Relatorio do estudo sobre”Ethanol.
UNFCCC – COP 8: Decision 17/CP.8 -Annex I Guidelines for the preparation of National
Communications on Climate Change.
VIEIRA, C.P. & AZINHAGA, P. S. (2009) Estudo de vulnerabilidade e adaptação dos
recursos em água as alterações climáticas nas regiões de Gabu e Bafatá, 61 pp.
Volumes 1–3, 1997. Available at <http://www.ipcc-nggip.iges.or.jp/public/gl/invs1.htm>.
Vulnerabilidade e Adaptação : Sector de zona costeira – Contribuiçao par secgunda
comunicaçao national ; Abril 2009.
Vulnerabilidade e adaptação as alterações climáticas na Guiné-Bissau, 2009
WHITE, F. (1981) UNESCO/AETFAT/UNSO – Vegetation Map of Africa / Carte de
Végétation de l´Afrique. Paris, UNESCO. (Escala 1:5.000.000).
WHITE, F. (1983) The Vegetation of Africa – A descretive memoir to accompany the
UNESCO/AETFAT/UNSO Vegetation Map of Africa. Natural Ressources Research, XX.
Paris, UNESCO. 356 p.
Wikipedia
<http://www.ipcc-nggip.iges.or.jp/public/gp/english/
http://www.ipcc-nggip.iges.or.jp/public/gp/english/