Embed Size (px)
Citation preview
Ministry of International Trade and Industry
Second National eCommerce Council (Necc) Meeting and eCommerce Day
10 June 2016The inaugural eCommerce
Day organised today by MITI, in collaboration with MDEC, marks another milestone in the Government’s efforts towards driving the national eCommerce agenda in the era of borderless trading of goods and services. The main objective is to reach out and educate the public and local business community, particularly SMEs, on the national eCommerce agenda.
Salient key events throughout the day include the soft launch of the National eCommerce Strategic Roadmap as well as MITI’s eCommerce Weblink that will provide overview on the eCommerce ecosystem in Malaysia as well as updates on eCommerce events organised by various Ministries and agencies throughout the year. The day also featured presentations by experts from AT Kearney, MATRADE and SME Corp on various eCommerce related topics, including promoting cross-border eCommerce as well as increasing SMEs involvement in eCommerce.
Speaking at the Opening Ceremony of the eCommerce Day, the International Trade and Industry Minister YB Dato’ Sri Mustapa Mohamed stressed that the growth of eCommerce was vital to Malaysia’s economic future. "The Government is committed to increase the adoption of eCommerce in the country. The 11th Malaysia Plan (RMK11) for example has set the eCommerce GDP contribution at 6.4% (RM114 billion) by 2020" he said. Currently, Malaysia’s eCommerce GDP contribution stands at 5.8%. In terms of eCommerce contribution to GDP, we are still behind compared to other countries such as China (21% of GDP) and the US (35% of GDP).
eCommerce is growing rapidly in Malaysia as more people are getting connected to the internet and it has become extremely important in Malaysia’s digital economy agenda.
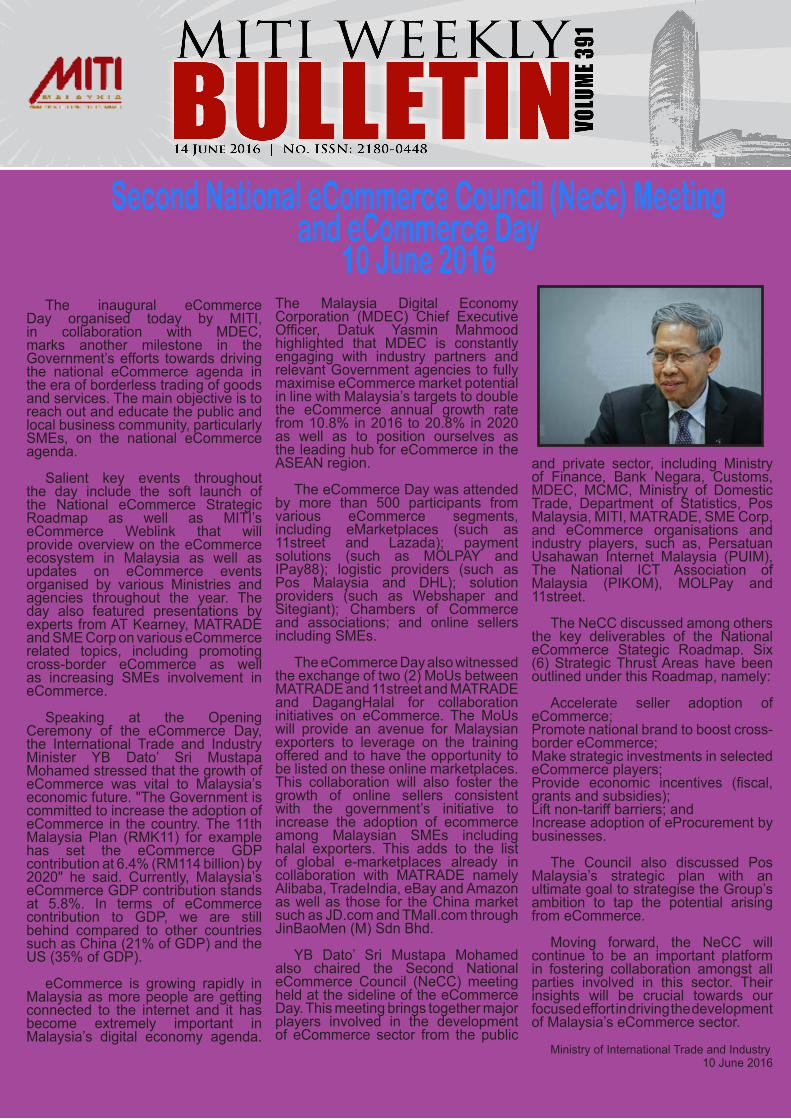
The Malaysia Digital Economy Corporation (MDEC) Chief Executive Officer, Datuk Yasmin Mahmood highlighted that MDEC is constantly engaging with industry partners and relevant Government agencies to fully maximise eCommerce market potential in line with Malaysia’s targets to double the eCommerce annual growth rate from 10.8% in 2016 to 20.8% in 2020 as well as to position ourselves as the leading hub for eCommerce in the ASEAN region.
The eCommerce Day was attended by more than 500 participants from various eCommerce segments, including eMarketplaces (such as 11street and Lazada); payment solutions (such as MOLPAY and IPay88); logistic providers (such as Pos Malaysia and DHL); solution providers (such as Webshaper and Sitegiant); Chambers of Commerce and associations; and online sellers including SMEs.
The eCommerce Day also witnessed the exchange of two (2) MoUs between MATRADE and 11street and MATRADE and DagangHalal for collaboration initiatives on eCommerce. The MoUs will provide an avenue for Malaysian exporters to leverage on the training offered and to have the opportunity to be listed on these online marketplaces. This collaboration will also foster the growth of online sellers consistent with the government’s initiative to increase the adoption of ecommerce among Malaysian SMEs including halal exporters. This adds to the list of global e-marketplaces already in collaboration with MATRADE namely Alibaba, TradeIndia, eBay and Amazon as well as those for the China market such as JD.com and TMall.com through JinBaoMen (M) Sdn Bhd.
YB Dato’ Sri Mustapa Mohamed also chaired the Second National eCommerce Council (NeCC) meeting held at the sideline of the eCommerce Day. This meeting brings together major players involved in the development of eCommerce sector from the public
and private sector, including Ministry of Finance, Bank Negara, Customs, MDEC, MCMC, Ministry of Domestic Trade, Department of Statistics, Pos Malaysia, MITI, MATRADE, SME Corp, and eCommerce organisations and industry players, such as, Persatuan Usahawan Internet Malaysia (PUIM), The National ICT Association of Malaysia (PIKOM), MOLPay and 11street.
The NeCC discussed among others the key deliverables of the National eCommerce Stategic Roadmap. Six (6) Strategic Thrust Areas have been outlined under this Roadmap, namely:
Accelerate seller adoption of eCommerce;Promote national brand to boost cross-border eCommerce;Make strategic investments in selected eCommerce players;Provide economic incentives (fiscal, grants and subsidies);Lift non-tariff barriers; andIncrease adoption of eProcurement by businesses.
The Council also discussed Pos Malaysia’s strategic plan with an ultimate goal to strategise the Group’s ambition to tap the potential arising from eCommerce.
Moving forward, the NeCC will continue to be an important platform in fostering collaboration amongst all parties involved in this sector. Their insights will be crucial towards our focused effort in driving the development of Malaysia’s eCommerce sector.
Ministry of International Trade and Industry10 June 2016
Ministry of International Trade and Industry
Malaysia
RM46.2 bil.11.5%*
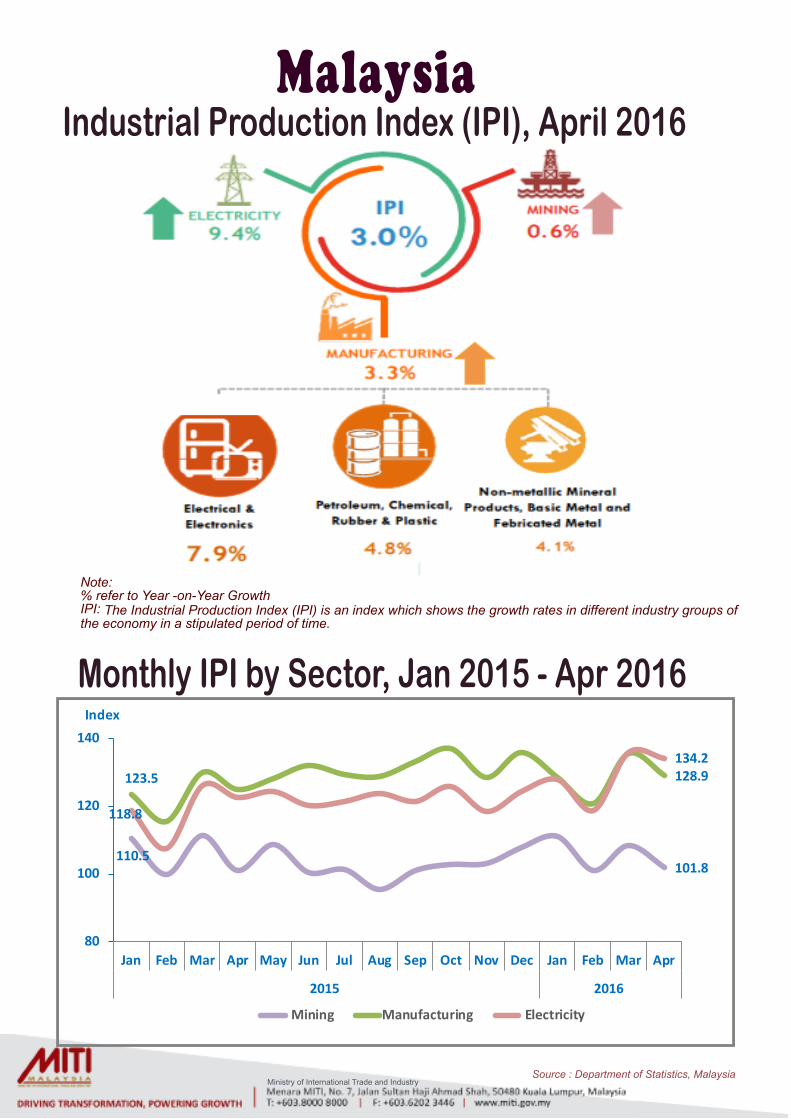
Industrial Production Index (IPI), April 2016
110.5101.8
123.5 128.9
118.8
134.2
80
100
120
140
Jan Feb Mar Apr May Jun Jul Aug Sep Oct Nov Dec Jan Feb Mar Apr
2015 2016
Index
Mining Manufacturing Electricity
Monthly IPI by Sector, Jan 2015 - Apr 2016
Source : Department of Statistics, Malaysia
Note: % refer to Year -on-Year GrowthIPI: The Industrial Production Index (IPI) is an index which shows the growth rates in different industry groups of the economy in a stipulated period of time.
Ministry of International Trade and Industry
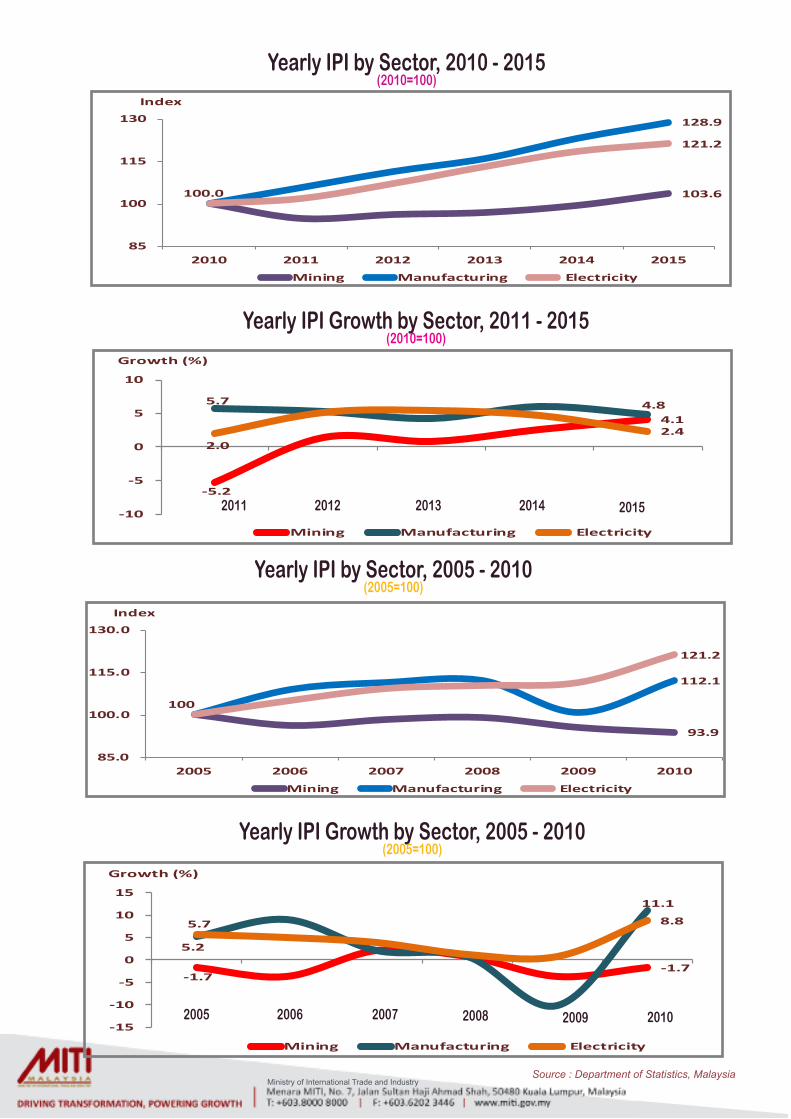
Yearly IPI by Sector, 2005 - 2010(2005=100)
93.9
112.1
100
121.2
85.0
100.0
115.0
130.0
2005 2006 2007 2008 2009 2010
Index
Mining Manufacturing Electricity
-1.7-1.7
5.2
11.1
5.7 8.8
-15
-10
-5
0
5
10
15
Growth (%)
Mining Manufacturing Electricity
Yearly IPI Growth by Sector, 2005 - 2010(2005=100)
2005 2006 2007 2008 2009 2010
103.6
128.9
100.0
121.2
85
100
115
130
2010 2011 2012 2013 2014 2015
Index
Mining Manufacturing Electricity
-5.2
4.1
5.7 4.8
2.02.4
-10
-5
0
5
10
Growth (%)
Mining Manufacturing Electricity
Yearly IPI Growth by Sector, 2011 - 2015(2010=100)
Yearly IPI by Sector, 2010 - 2015(2010=100)
2011 2012 2013 2014 2015
Source : Department of Statistics, Malaysia
Ministry of International Trade and Industry
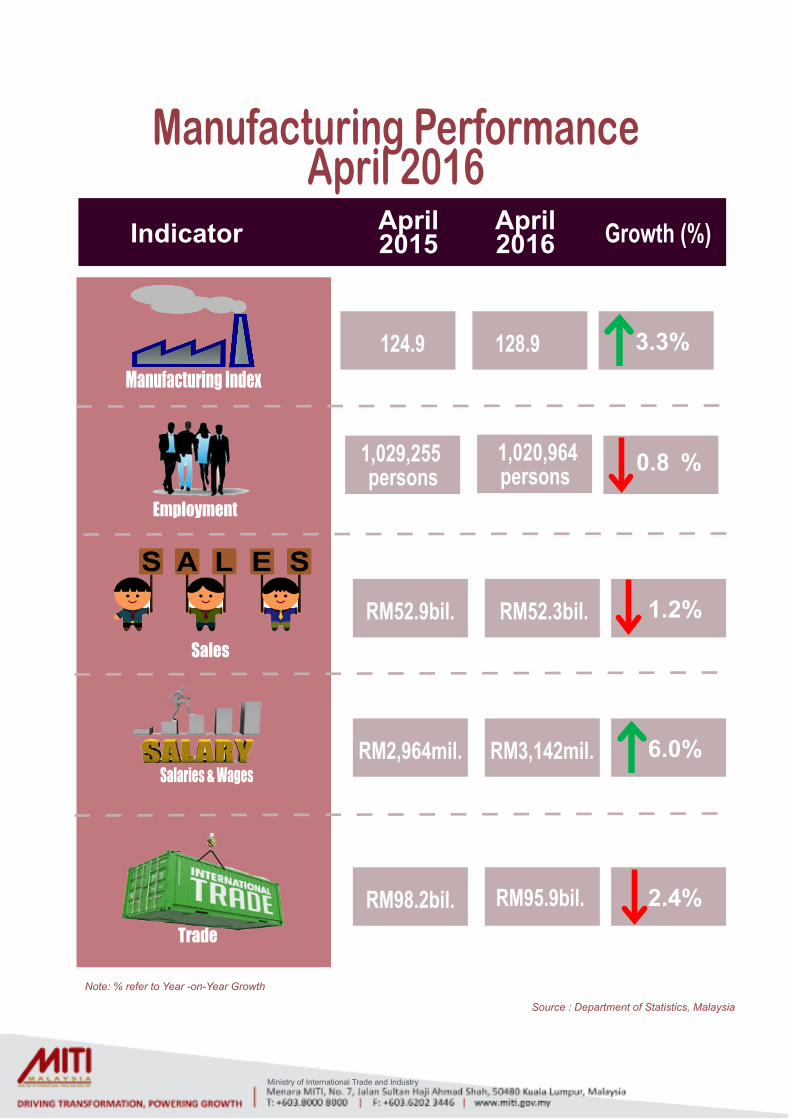
Manufacturing Performance April 2016
Employment
Sales
Manufacturing Index
April2015
Indicator Growth (%)
128.9 3.3% 124.9
0.8 % 1,029,255 persons
1,020,964 persons
1.2% RM52.9bil. RM52.3bil.
6.0% RM2,964mil. Salaries & Wages
RM3,142mil.
2.4% RM98.2bil. RM95.9bil. Trade
Source : Department of Statistics, Malaysia
Note: % refer to Year -on-Year Growth
April2016
Ministry of International Trade and Industry
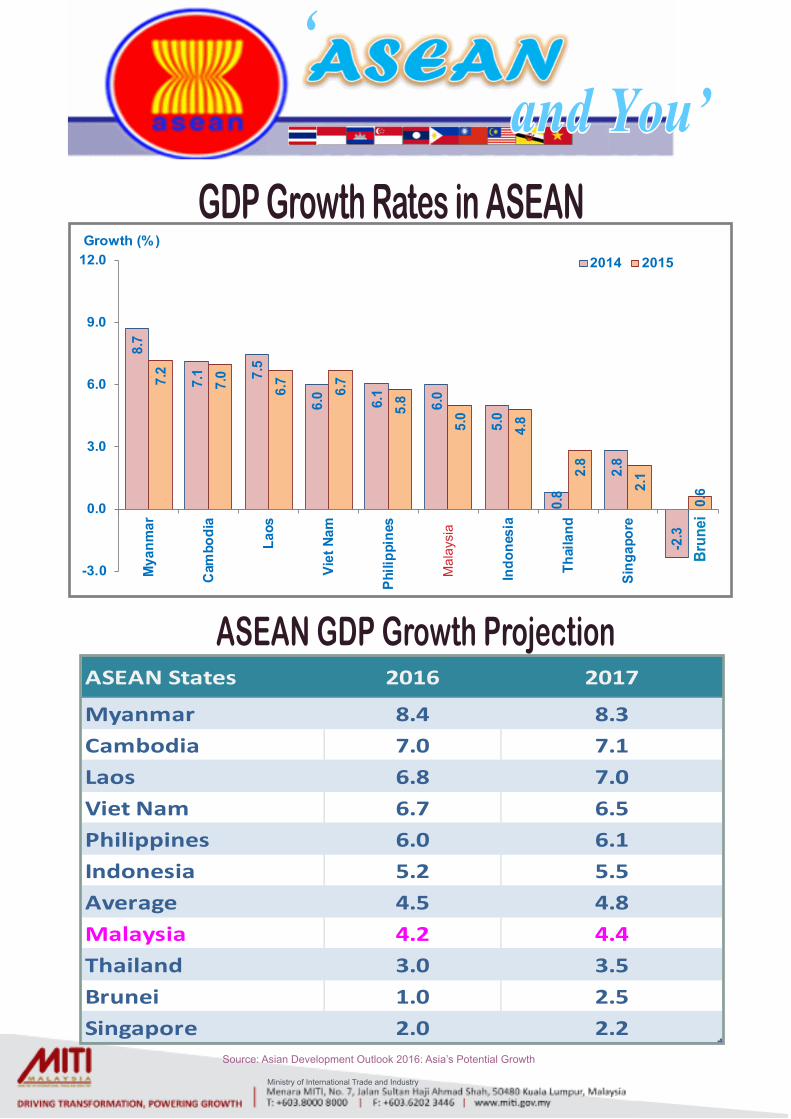
GDP Growth Rates in ASEAN
and You’‘
8.7
7.1 7.
5
6.0 6.1
6.0
5.0
0.8
2.8
-2.3
7.2
7.0
6.7
6.7
5.8
5.0
4.8
2.8
2.1
0.6
-3.0
0.0
3.0
6.0
9.0
12.0
Mya
nmar
Cam
bodi
a
Laos
Viet
Nam
Phili
ppin
es
Indo
nesi
a
Thai
land
Sing
apor
e
Growth (%)2014 2015
ASEAN States 2016 2017
Myanmar 8.4 8.3Cambodia 7.0 7.1Laos 6.8 7.0Viet Nam 6.7 6.5Philippines 6.0 6.1Indonesia 5.2 5.5Average 4.5 4.8Malaysia 4.2 4.4Thailand 3.0 3.5Brunei 1.0 2.5Singapore 2.0 2.2
ASEAN GDP Growth Projection
Source: Asian Development Outlook 2016: Asia’s Potential Growth
Mal
aysi
a
Brun
ei
Ministry of International Trade and Industry
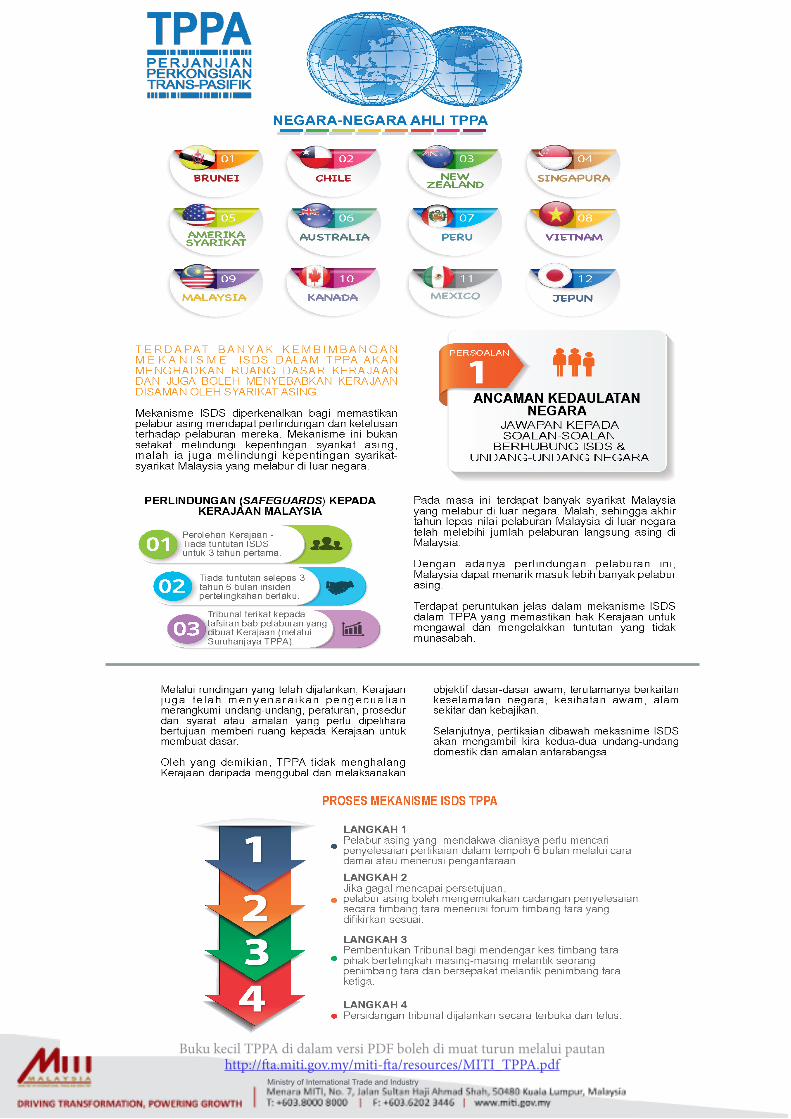
Buku kecil TPPA di dalam versi PDF boleh di muat turun melalui pautanhttp://fta.miti.gov.my/miti-fta/resources/MITI_TPPA.pdf
Ministry of International Trade and Industry
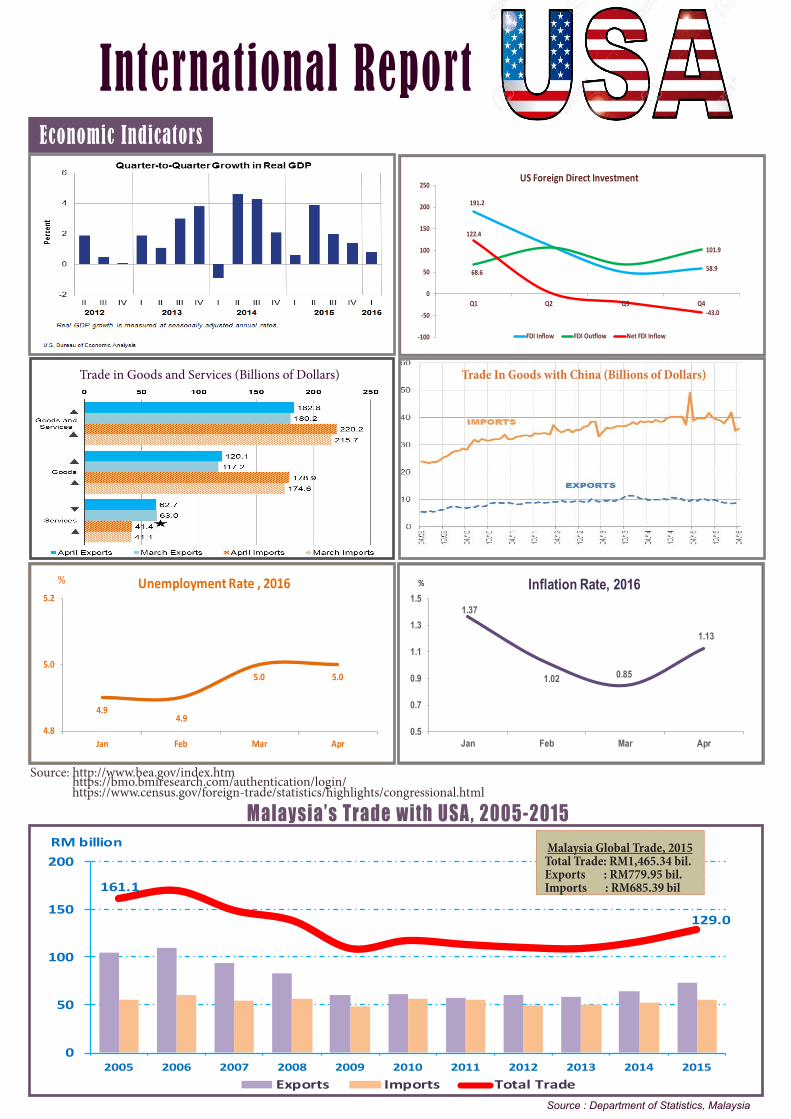
Malaysia’s Trade with USA , 2005-2015
Source : Department of Statistics, Malaysia
International ReportEconomic Indicators
1.37
1.02 0.85
1.13
0.5
0.7
0.9
1.1
1.3
1.5
Jan Feb Mar Apr
Inflation Rate, 2016%
4.94.9
5.0 5.0
4.8
5.0
5.2
Jan Feb Mar Apr
Unemployment Rate , 2016%
191.2
58.968.6
101.9
122.4
-43.0
-100
-50
0
50
100
150
200
250
Q1 Q2 Q3 Q4
US Foreign Direct Investment
FDI Inflow FDI Outflow Net FDI Inflow
Source: http://www.bea.gov/index.htm https://bmo.bmiresearch.com/authentication/login/ https://www.census.gov/foreign-trade/statistics/highlights/congressional.html
161.1
129.0
0
50
100
150
200
2005 2006 2007 2008 2009 2010 2011 2012 2013 2014 2015
RM billion
Exports Imports Total Trade
Trade In Goods with China (Billions of Dollars)Trade in Goods and Services (Billions of Dollars)
Malaysia Global Trade, 2015Total Trade: RM1,465.34 bil.Exports : RM779.95 bil.Imports : RM685.39 bil
Ministry of International Trade and Industry
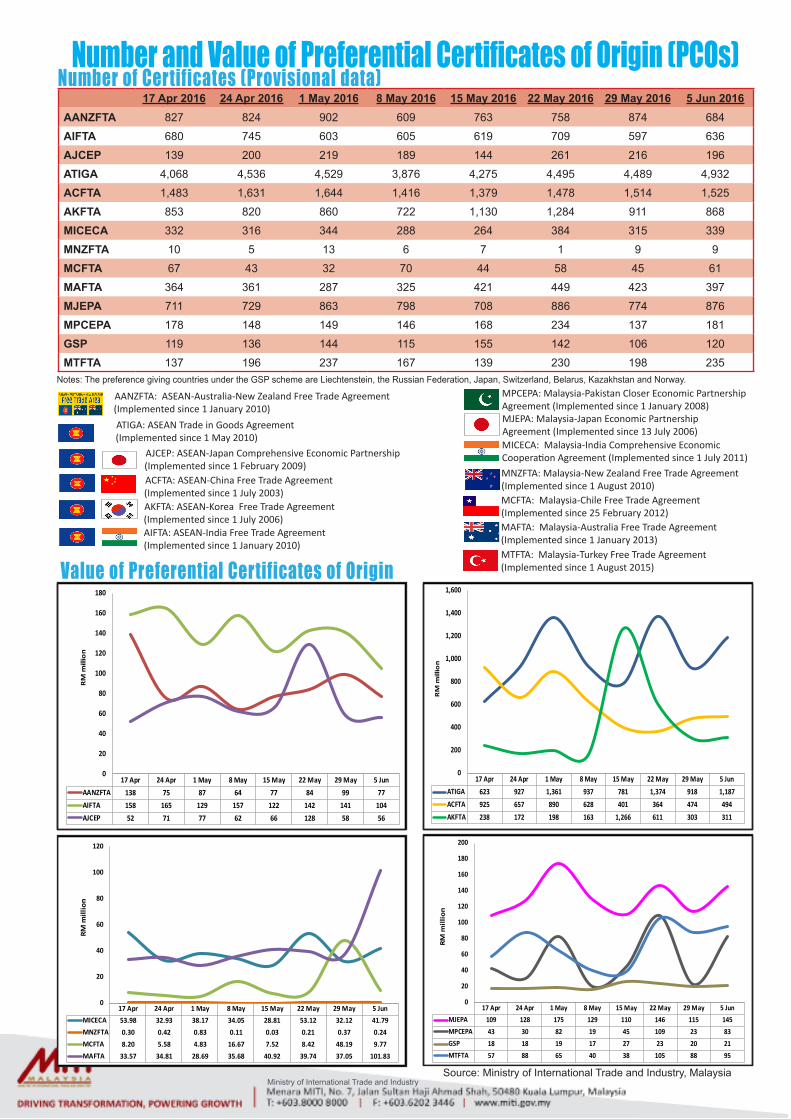
AJCEP: ASEAN-Japan Comprehensive Economic Partnership (Implemented since 1 February 2009) ACFTA: ASEAN-China Free Trade Agreement (Implemented since 1 July 2003) AKFTA: ASEAN-Korea Free Trade Agreement (Implemented since 1 July 2006)
AANZFTA: ASEAN-Australia-New Zealand Free Trade Agreement(Implemented since 1 January 2010)
AIFTA: ASEAN-India Free Trade Agreement (Implemented since 1 January 2010)
ATIGA: ASEAN Trade in Goods Agreement (Implemented since 1 May 2010)
MICECA: Malaysia-India Comprehensive Economic Cooperation Agreement (Implemented since 1 July 2011)MNZFTA: Malaysia-New Zealand Free Trade Agreement (Implemented since 1 August 2010)MCFTA: Malaysia-Chile Free Trade Agreement (Implemented since 25 February 2012)
MTFTA: Malaysia-Turkey Free Trade Agreement (Implemented since 1 August 2015)
MAFTA: Malaysia-Australia Free Trade Agreement (Implemented since 1 January 2013)
MPCEPA: Malaysia-Pakistan Closer Economic Partnership Agreement (Implemented since 1 January 2008)MJEPA: Malaysia-Japan Economic Partnership Agreement (Implemented since 13 July 2006)
17 Apr 24 Apr 1 May 8 May 15 May 22 May 29 May 5 JunAANZFTA 138 75 87 64 77 84 99 77AIFTA 158 165 129 157 122 142 141 104AJCEP 52 71 77 62 66 128 58 56
0
20
40
60
80
100
120
140
160
180
RM
mill
ion
17 Apr 24 Apr 1 May 8 May 15 May 22 May 29 May 5 JunATIGA 623 927 1,361 937 781 1,374 918 1,187ACFTA 925 657 890 628 401 364 474 494AKFTA 238 172 198 163 1,266 611 303 311
0
200
400
600
800
1,000
1,200
1,400
1,600
RM
mill
ion
17 Apr 24 Apr 1 May 8 May 15 May 22 May 29 May 5 JunMICECA 53.98 32.93 38.17 34.05 28.81 53.12 32.12 41.79MNZFTA 0.30 0.42 0.83 0.11 0.03 0.21 0.37 0.24MCFTA 8.20 5.58 4.83 16.67 7.52 8.42 48.19 9.77MAFTA 33.57 34.81 28.69 35.68 40.92 39.74 37.05 101.83
0
20
40
60
80
100
120
RM m
illio
n
17 Apr 2016 24 Apr 2016 1 May 2016 8 May 2016 15 May 2016 22 May 2016 29 May 2016 5 Jun 2016AANZFTA 827 824 902 609 763 758 874 684
AIFTA 680 745 603 605 619 709 597 636
AJCEP 139 200 219 189 144 261 216 196
ATIGA 4,068 4,536 4,529 3,876 4,275 4,495 4,489 4,932
ACFTA 1,483 1,631 1,644 1,416 1,379 1,478 1,514 1,525
AKFTA 853 820 860 722 1,130 1,284 911 868
MICECA 332 316 344 288 264 384 315 339
MNZFTA 10 5 13 6 7 1 9 9
MCFTA 67 43 32 70 44 58 45 61
MAFTA 364 361 287 325 421 449 423 397
MJEPA 711 729 863 798 708 886 774 876
MPCEPA 178 148 149 146 168 234 137 181
GSP 119 136 144 115 155 142 106 120
MTFTA 137 196 237 167 139 230 198 235
17 Apr 24 Apr 1 May 8 May 15 May 22 May 29 May 5 JunMJEPA 109 128 175 129 110 146 115 145MPCEPA 43 30 82 19 45 109 23 83GSP 18 18 19 17 27 23 20 21MTFTA 57 88 65 40 38 105 88 95
0
20
40
60
80
100
120
140
160
180
200
RM m
illio
n
Value of Preferential Certificates of Origin
Number and Value of Preferential Certificates of Origin (PCOs)Number of Certificates (Provisional data)
Notes: The preference giving countries under the GSP scheme are Liechtenstein, the Russian Federation, Japan, Switzerland, Belarus, Kazakhstan and Norway.
Source: Ministry of International Trade and Industry, Malaysia
Ministry of International Trade and Industry
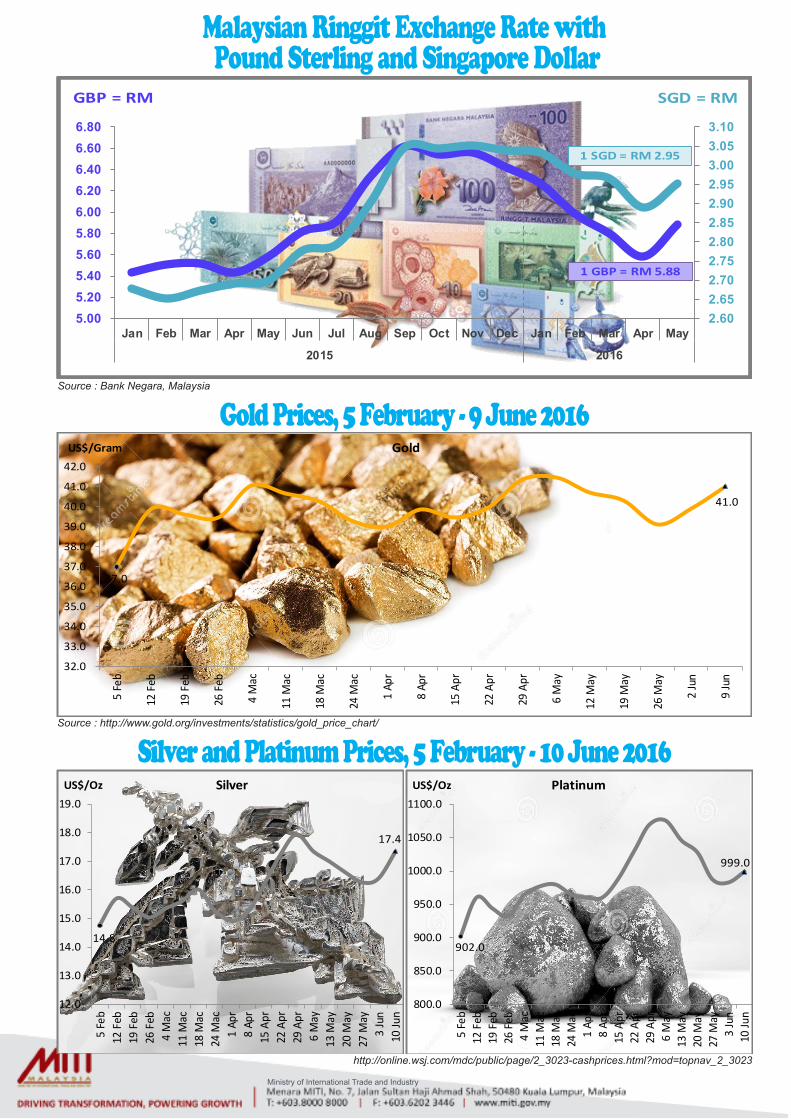
Source : Bank Negara, Malaysia
14.8
17.4
12.0
13.0
14.0
15.0
16.0
17.0
18.0
19.0
5 Fe
b12
Feb
19 F
eb26
Feb
4 M
ac11
Mac
18 M
ac24
Mac
1 Ap
r8
Apr
15 A
pr22
Apr
29 A
pr6
May
13 M
ay20
May
27 M
ay3
Jun
10 Ju
n
US$/Oz Silver
902.0
999.0
800.0
850.0
900.0
950.0
1000.0
1050.0
1100.0
5 Fe
b12
Feb
19 F
eb26
Feb
4 M
ac11
Mac
18 M
ac24
Mac
1 Ap
r8
Apr
15 A
pr22
Apr
29 A
pr6
May
13 M
ay20
May
27 M
ay3
Jun
10 Ju
n
US$/Oz Platinum
Source : http://www.gold.org/investments/statistics/gold_price_chart/
http://online.wsj.com/mdc/public/page/2_3023-cashprices.html?mod=topnav_2_3023
Gold Prices, 5 February - 9 June 2016
Silver and Platinum Prices, 5 February - 10 June 2016
37.0
41.0
32.0
33.0
34.0
35.0
36.0
37.0
38.0
39.0
40.0
41.0
42.0
5 Fe
b
12 F
eb
19 F
eb
26 F
eb
4 M
ac
11 M
ac
18 M
ac
24 M
ac
1 Ap
r
8 Ap
r
15 A
pr
22 A
pr
29 A
pr
6 M
ay
12 M
ay
19 M
ay
26 M
ay
2 Ju
n
9 Ju
n
US$/Gram Gold
Malaysian Ringgit Exchange Rate with Pound Sterling and Singapore Dollar
2.602.652.702.752.802.852.902.953.003.053.10
5.005.205.405.605.806.006.206.406.606.80
Jan Feb Mar Apr May Jun Jul Aug Sep Oct Nov Dec Jan Feb Mar Apr May
2015 2016
GBP = RM SGD = RM
1 SGD = RM 2.95
1 GBP = RM 5.88
Ministry of International Trade and Industry
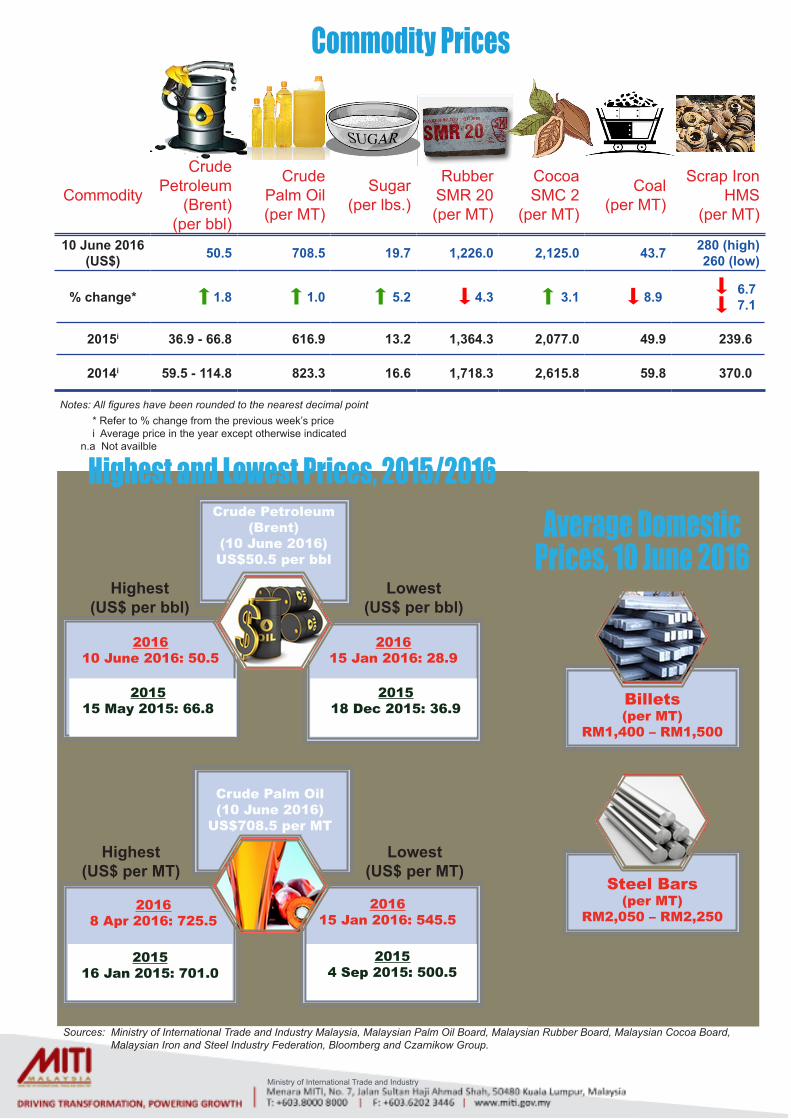
Commodity
Crude Petroleum
(Brent) (per bbl)
Crude Palm Oil (per MT)
Sugar (per lbs.)
Rubber SMR 20(per MT)
Cocoa SMC 2
(per MT)
Coal(per MT)
Scrap Iron HMS
(per MT)
10 June 2016 (US$) 50.5 708.5 19.7 1,226.0 2,125.0 43.7 280 (high)
260 (low)
% change* 1.8 1.0 5.2 4.3 3.1 8.9 6.77.1
2015i 36.9 - 66.8 616.9 13.2 1,364.3 2,077.0 49.9 239.6
2014i 59.5 - 114.8 823.3 16.6 1,718.3 2,615.8 59.8 370.0
Commodity Prices
Notes: All figures have been rounded to the nearest decimal point * Refer to % change from the previous week’s price i Average price in the year except otherwise indicated n.a Not availble
Sources: Ministry of International Trade and Industry Malaysia, Malaysian Palm Oil Board, Malaysian Rubber Board, Malaysian Cocoa Board, Malaysian Iron and Steel Industry Federation, Bloomberg and Czarnikow Group.
Highest and Lowest Prices, 2015/2016
Lowest (US$ per bbl)
Highest(US$ per bbl)
Crude Petroleum(Brent)
(10 June 2016)US$50.5 per bbl
201515 May 2015: 66.8
201518 Dec 2015: 36.9
201610 June 2016: 50.5
201615 Jan 2016: 28.9
Lowest (US$ per MT)
Highest(US$ per MT)
Crude Palm Oil (10 June 2016)
US$708.5 per MT
201516 Jan 2015: 701.0
20154 Sep 2015: 500.5
20168 Apr 2016: 725.5
201615 Jan 2016: 545.5
Steel Bars(per MT)
RM2,050 – RM2,250
Average Domestic Prices, 10 June 2016
Billets(per MT)
RM1,400 – RM1,500
Ministry of International Trade and Industry
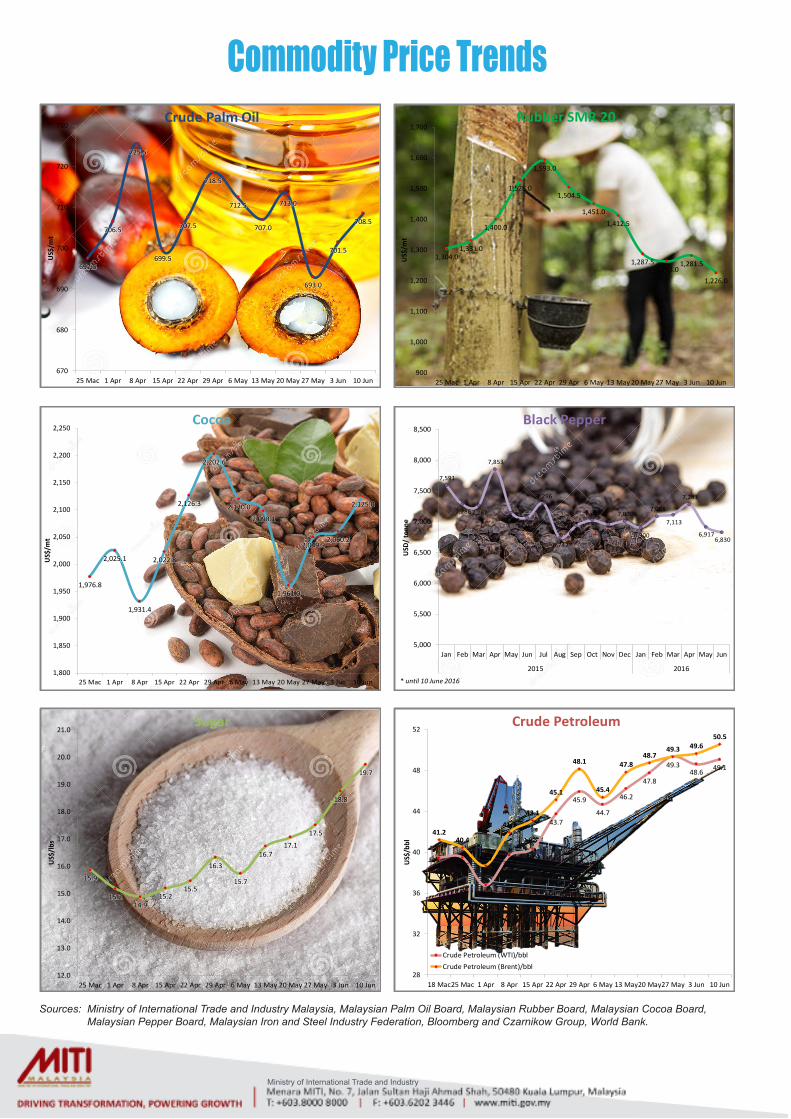
Sources: Ministry of International Trade and Industry Malaysia, Malaysian Palm Oil Board, Malaysian Rubber Board, Malaysian Cocoa Board, Malaysian Pepper Board, Malaysian Iron and Steel Industry Federation, Bloomberg and Czarnikow Group, World Bank.
Commodity Price Trends
697.5
706.5
725.5
699.5
707.5
718.5
712.5
707.0
713.0
693.0
701.5
708.5
670
680
690
700
710
720
730
25 Mac 1 Apr 8 Apr 15 Apr 22 Apr 29 Apr 6 May 13 May 20 May 27 May 3 Jun 10 Jun
US$
/mt
Crude Palm Oil
1,976.8
2,025.1
1,931.4
2,022.8
2,126.3
2,202.6
2,120.0
2,098.1
1,961.0
2,049.92,060.2
2,125.0
1,800
1,850
1,900
1,950
2,000
2,050
2,100
2,150
2,200
2,250
25 Mac 1 Apr 8 Apr 15 Apr 22 Apr 29 Apr 6 May 13 May 20 May 27 May 3 Jun 10 Jun
US$
/mt
Cocoa
15.9
15.214.9
15.215.5
16.3
15.7
16.717.1
17.5
18.8
19.7
12.0
13.0
14.0
15.0
16.0
17.0
18.0
19.0
20.0
21.0
25 Mac 1 Apr 8 Apr 15 Apr 22 Apr 29 Apr 6 May 13 May 20 May 27 May 3 Jun 10 Jun
US$
/lbs
Sugar
1,304.01,331.0
1,400.0
1,528.0
1,593.0
1,504.5
1,451.01,412.5
1,287.51,263.0
1,281.5
1,226.0
900
1,000
1,100
1,200
1,300
1,400
1,500
1,600
1,700
25 Mac 1 Apr 8 Apr 15 Apr 22 Apr 29 Apr 6 May 13 May 20 May 27 May 3 Jun 10 Jun
US$
/mt
Rubber SMR 20
7,591
7,286 7,267
7,853
7,148 7,063
7,296
6,742
6,940
7,029
6,963
7,008
6,900
7,088
7,113
7,281
6,917 6,830
5,000
5,500
6,000
6,500
7,000
7,500
8,000
8,500
Jan Feb Mar Apr May Jun Jul Aug Sep Oct Nov Dec Jan Feb Mar Apr May Jun
2015 2016
USD
/ to
nne
Black Pepper
* until 10 June 2016
39.4 39.5
36.8
39.740.4
43.7
45.9
44.7
46.2
47.8
49.348.6 49.1
41.240.4
38.7
41.9
43.1
45.1
48.1
45.4
47.848.7
49.3 49.650.5
28
32
36
40
44
48
52
18 Mac25 Mac 1 Apr 8 Apr 15 Apr 22 Apr 29 Apr 6 May 13 May20 May27 May 3 Jun 10 Jun
US$
/bbl
Crude Petroleum
Crude Petroleum (WTI)/bbl Crude Petroleum (Brent)/bbl
Ministry of International Trade and Industry
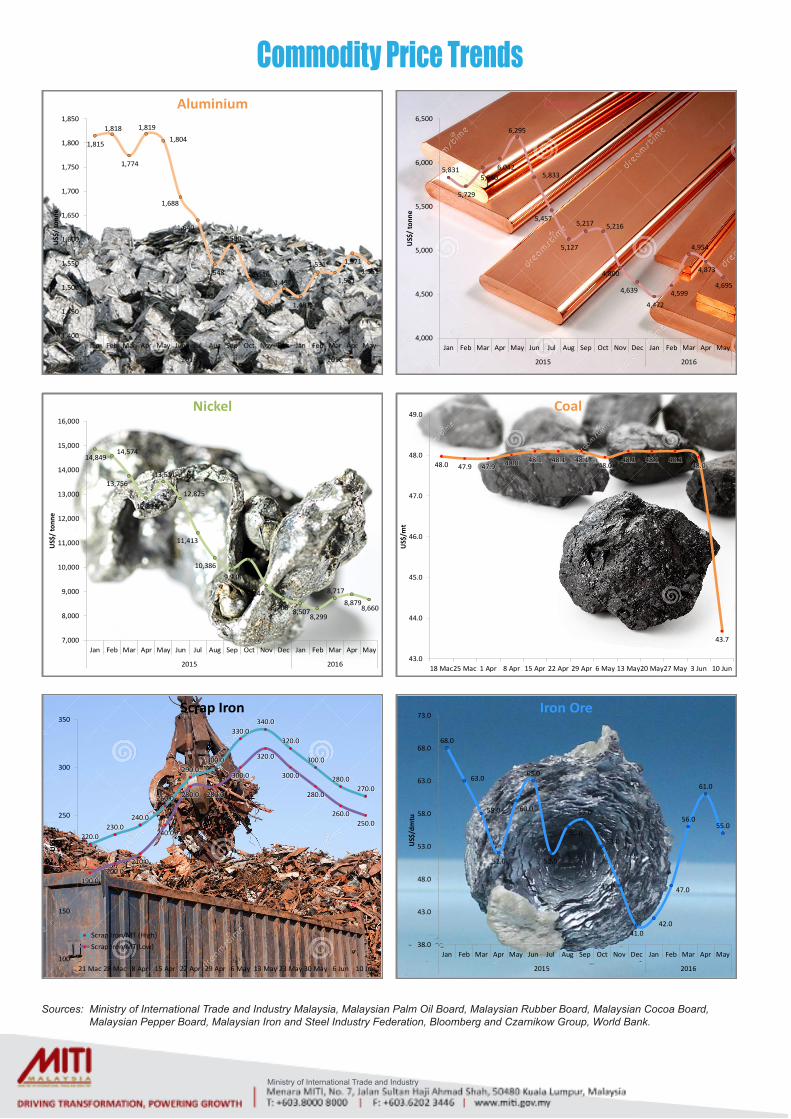
Sources: Ministry of International Trade and Industry Malaysia, Malaysian Palm Oil Board, Malaysian Rubber Board, Malaysian Cocoa Board, Malaysian Pepper Board, Malaysian Iron and Steel Industry Federation, Bloomberg and Czarnikow Group, World Bank.
Commodity Price Trends
220.0230.0
240.0
260.0
290.0300.0
330.0340.0
320.0
300.0
280.0270.0
190.0200.0
210.0
240.0
280.0 280.0
300.0
320.0
300.0
280.0
260.0250.0
100
150
200
250
300
350
21 Mac 28 Mac 8 Apr 15 Apr 22 Apr 29 Apr 6 May 13 May 23 May 30 May 6 Jun 10 Jun
US$
/mt
Scrap Iron
Scrap Iron/MT (High) Scrap Iron/MT(Low)
48.0 47.9 47.9 48.0 48.1 48.1 48.148.0
48.1 48.1 48.148.0
43.7
43.0
44.0
45.0
46.0
47.0
48.0
49.0
18 Mac25 Mac 1 Apr 8 Apr 15 Apr 22 Apr 29 Apr 6 May 13 May20 May27 May 3 Jun 10 Jun
US$
/mt
Coal
68.0
63.0
58.0
52.0
60.0
63.0
52.0
56.0
57.0
53.0
47.0
41.042.0
47.0
56.0
61.0
55.0
38.0
43.0
48.0
53.0
58.0
63.0
68.0
73.0
Jan Feb Mar Apr May Jun Jul Aug Sep Oct Nov Dec Jan Feb Mar Apr May
2015 2016
US$
/dm
tu
Iron Ore
1,815
1,818
1,774
1,819
1,804
1,688
1,640
1,548
1,590
1,516
1,468
1,497
1,481
1,531
1,531
1,571 1,551
1,400
1,450
1,500
1,550
1,600
1,650
1,700
1,750
1,800
1,850
Jan Feb Mar Apr May Jun Jul Aug Sep Oct Nov Dec Jan Feb Mar Apr May
2015 2016
US$
/ to
nne
Aluminium
5,831
5,729
5,940 6,042
6,295
5,833
5,457
5,127
5,217 5,216
4,800
4,639
4,472 4,599
4,954
4,873
4,695
4,000
4,500
5,000
5,500
6,000
6,500
Jan Feb Mar Apr May Jun Jul Aug Sep Oct Nov Dec Jan Feb Mar Apr May
2015 2016
US$
/ to
nne
Copper
14,849 14,574
13,756
12,831
13,511
12,825
11,413
10,386 9,938
10,317
9,244
8,708 8,507 8,299
8,717
8,879 8,660
7,000
8,000
9,000
10,000
11,000
12,000
13,000
14,000
15,000
16,000
Jan Feb Mar Apr May Jun Jul Aug Sep Oct Nov Dec Jan Feb Mar Apr May
2015 2016
US$
/ to
nne
Nickel
Ministry of International Trade and Industry
SUCCESS STORY
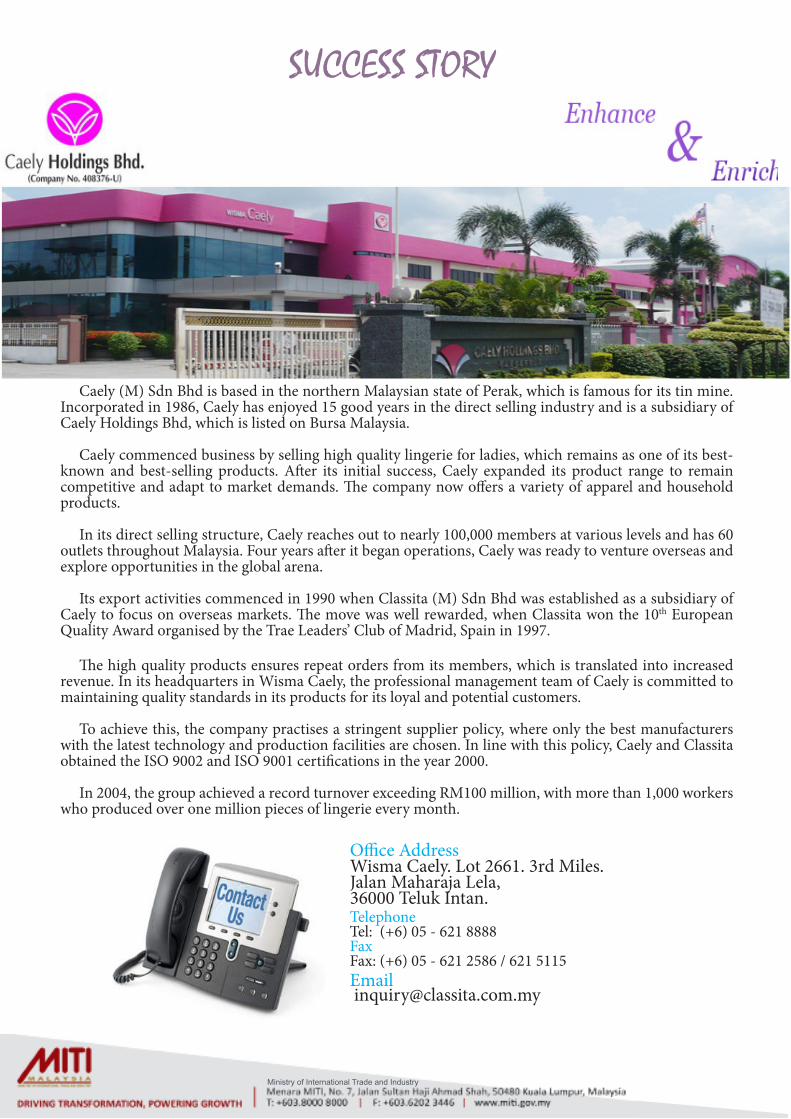
Office AddressWisma Caely. Lot 2661. 3rd Miles.Jalan Maharaja Lela,36000 Teluk Intan.TelephoneTel: (+6) 05 - 621 8888FaxFax: (+6) 05 - 621 2586 / 621 5115Email [email protected]
Caely (M) Sdn Bhd is based in the northern Malaysian state of Perak, which is famous for its tin mine. Incorporated in 1986, Caely has enjoyed 15 good years in the direct selling industry and is a subsidiary of Caely Holdings Bhd, which is listed on Bursa Malaysia.
Caely commenced business by selling high quality lingerie for ladies, which remains as one of its best-known and best-selling products. After its initial success, Caely expanded its product range to remain competitive and adapt to market demands. The company now offers a variety of apparel and household products.
In its direct selling structure, Caely reaches out to nearly 100,000 members at various levels and has 60 outlets throughout Malaysia. Four years after it began operations, Caely was ready to venture overseas and explore opportunities in the global arena.
Its export activities commenced in 1990 when Classita (M) Sdn Bhd was established as a subsidiary of Caely to focus on overseas markets. The move was well rewarded, when Classita won the 10th European Quality Award organised by the Trae Leaders’ Club of Madrid, Spain in 1997.
The high quality products ensures repeat orders from its members, which is translated into increased revenue. In its headquarters in Wisma Caely, the professional management team of Caely is committed to maintaining quality standards in its products for its loyal and potential customers.
To achieve this, the company practises a stringent supplier policy, where only the best manufacturers with the latest technology and production facilities are chosen. In line with this policy, Caely and Classita obtained the ISO 9002 and ISO 9001 certifications in the year 2000.
In 2004, the group achieved a record turnover exceeding RM100 million, with more than 1,000 workers who produced over one million pieces of lingerie every month.
Ministry of International Trade and Industry
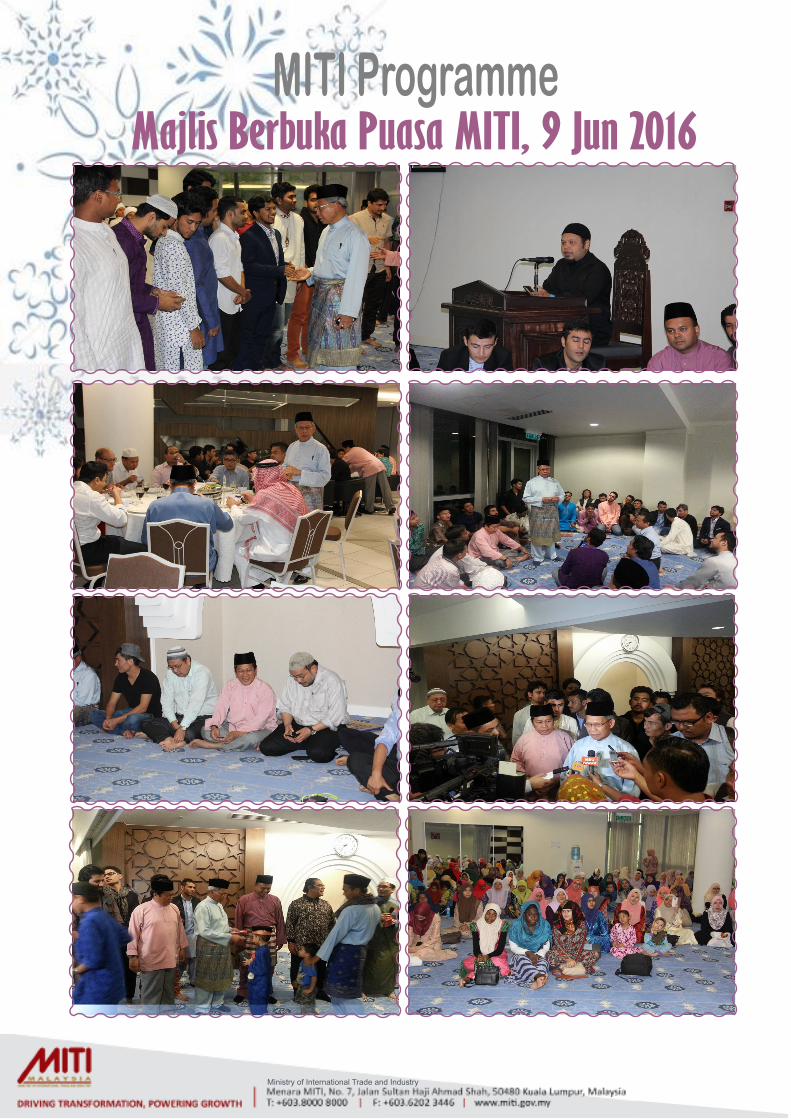
MITI ProgrammeMajlis Berbuka Puasa MITI, 9 Jun 2016
Ministry of International Trade and Industry
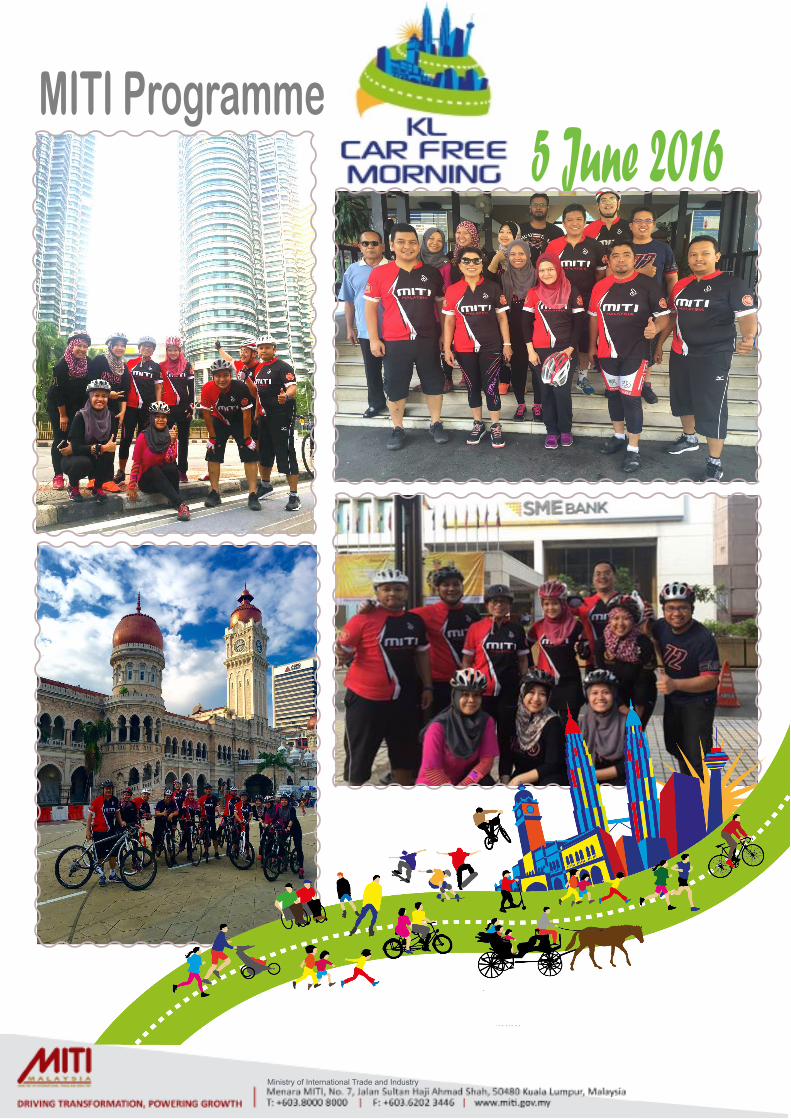
MITI Programme5 June 2016
Ministry of International Trade and Industry
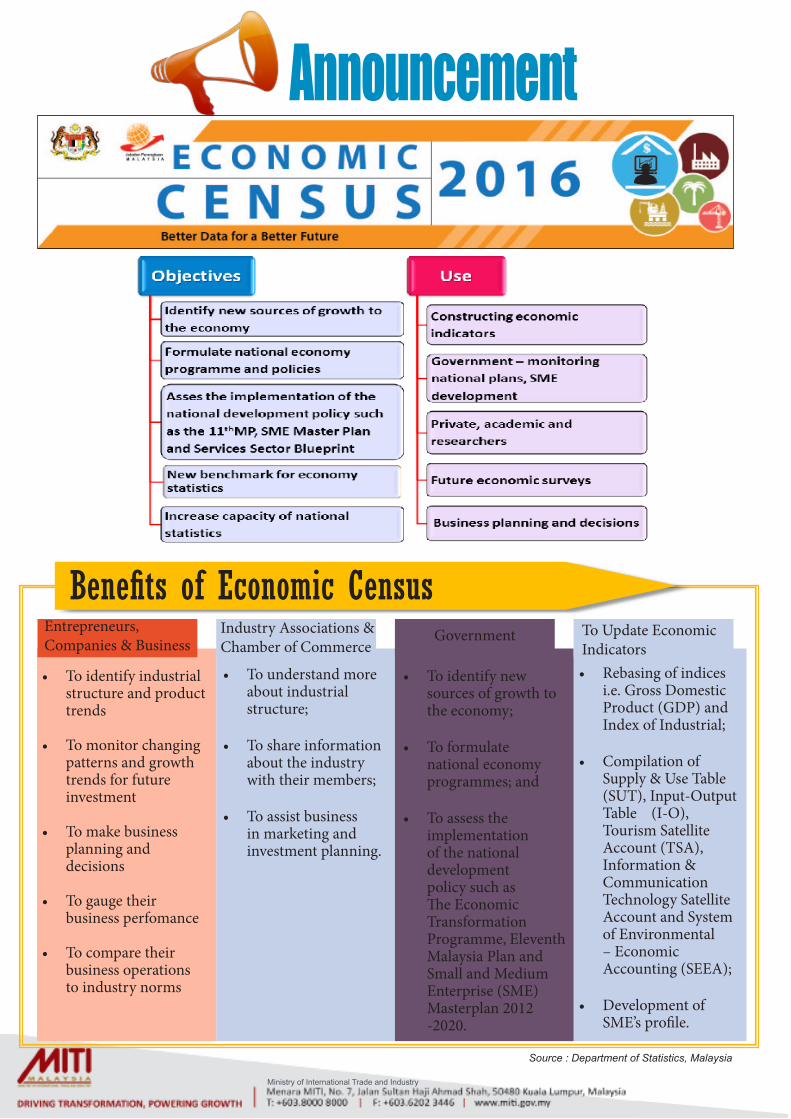
Announcement
Benefits of Economic CensusEntrepreneurs, Companies & Business
Industry Associations & Chamber of Commerce
Government To Update Economic Indicators
• To identify industrial structure and product trends
• To monitor changing patterns and growth trends for future investment
• To make business planning and decisions
• To gauge their business perfomance
• To compare their business operations to industry norms
• Rebasing of indices i.e. Gross Domestic Product (GDP) and Index of Industrial;
• Compilation of
Supply & Use Table (SUT), Input-Output Table (I-O), Tourism Satellite Account (TSA), Information & Communication Technology Satellite Account and System of Environmental – Economic Accounting (SEEA);
• Development of SME’s profile.
• To identify new sources of growth to the economy;
• To formulate national economy programmes; and
• To assess the implementation of the national development policy such as The Economic Transformation Programme, Eleventh Malaysia Plan and Small and Medium Enterprise (SME) Masterplan 2012 -2020.
• To understand more about industrial structure;
• To share information about the industry with their members;
• To assist business in marketing and investment planning.
Source : Department of Statistics, Malaysia

Ministry of International Trade and Industry
AnnouncementMITI Weekly Bulletin (MWB) Mobile Apps
MITI MWB APPs is now available for IOS, Android and Windows platforms. MWB APPs can be download from Gallery of Malaysian Government Mobile APPs (GAMMA) at the link: http://gamma.malaysia.gov.my/#/appDetails/85
Comments &
Suggestions
Dear Readers,
Kindly click the link below for any comments in this issue. MWB reserves the right to edit and republish letters as reprints.
http://www.miti.gov.my/index.php/forms/form/13
@ YOUR SERVICE
Syamsul Ammar Shuib03-6200 [email protected]
Designation : Islamic Affairs OfficerDivision : Human ResourcesJob Description : Manage matters related to Strategy Unit I - Manage courses and islamic affairs
Syarul Emy Abu Samah03-6200 [email protected]
Designation : Information Technology OfficerDivision : Human ResourcesJob Description : Manage matters related to Strategy Unit II - Manage HRMIS