Embed Size (px)
Citation preview
Q216 highlights
2
25.0m total subscribers 92.3% of sub base registered under DTN
THB8.7b data revenues
54.2% of service revenues ex. IC
THB6.6b EBITDA
33.4% EBITDA margin
THB4.3b CAPEX
21.7% to total revenues
THB0.42 per share dividend 71% of net profit
operational highlights
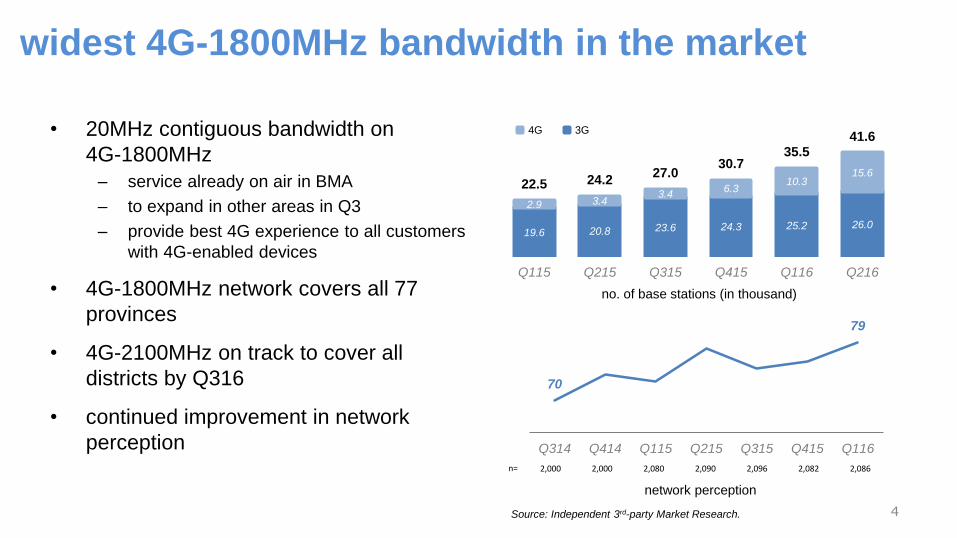
widest 4G-1800MHz bandwidth in the market
• 20MHz contiguous bandwidth on
4G-1800MHz
– service already on air in BMA
– to expand in other areas in Q3
– provide best 4G experience to all customers
with 4G-enabled devices
• 4G-1800MHz network covers all 77
provinces
• 4G-2100MHz on track to cover all
districts by Q316
• continued improvement in network
perception
19.6 20.8 23.6 24.3 25.2 26.0
2.9 3.4 3.4
6.3 10.3
15.6 22.5 24.2
27.0 30.7
35.5 41.6
Q115 Q215 Q315 Q415 Q116 Q216
4G 3G
4
no. of base stations (in thousand)
70
79
Q314 Q414 Q115 Q215 Q315 Q415 Q116
network perception
n= 2,000 2,000 2,080 2,090 2,096 2,082 2,086
Source: Independent 3rd-party Market Research.
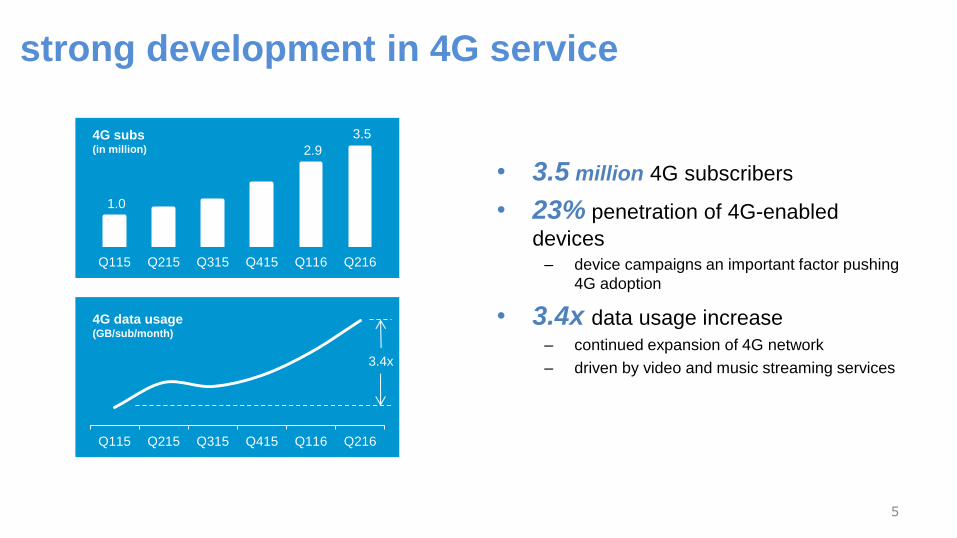
Q115 Q215 Q315 Q415 Q116 Q216
1.0
2.9
3.5
Q115 Q215 Q315 Q415 Q116 Q216
strong development in 4G service
• 3.5 million 4G subscribers
• 23% penetration of 4G-enabled
devices – device campaigns an important factor pushing
4G adoption
• 3.4x data usage increase
– continued expansion of 4G network
– driven by video and music streaming services
5
4G subs (in million)
4G data usage (GB/sub/month)
3.4x
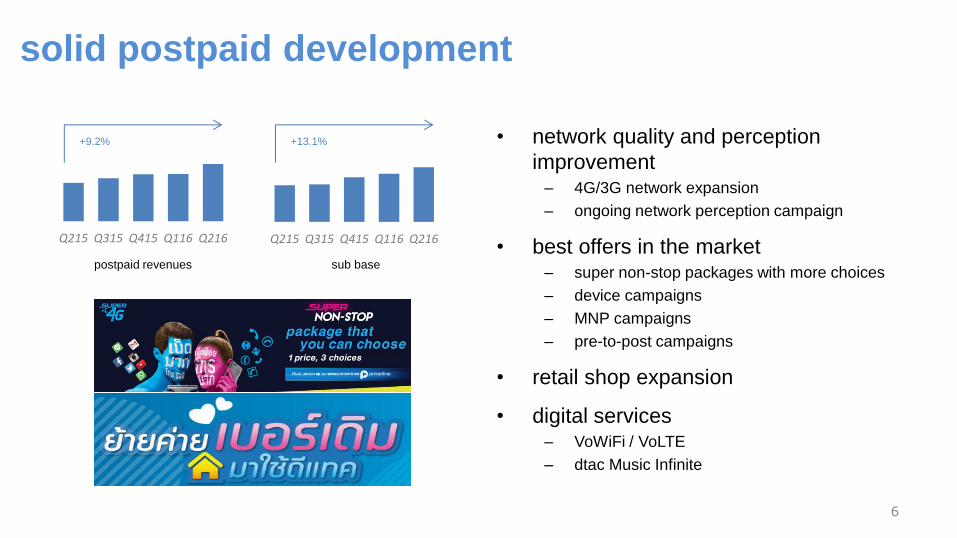
solid postpaid development
Q215 Q315 Q415 Q116 Q216
• network quality and perception
improvement – 4G/3G network expansion
– ongoing network perception campaign
• best offers in the market – super non-stop packages with more choices
– device campaigns
– MNP campaigns
– pre-to-post campaigns
• retail shop expansion
• digital services – VoWiFi / VoLTE
– dtac Music Infinite
6
postpaid revenues
Q215 Q315 Q415 Q116 Q216
sub base
+9.2% +13.1%
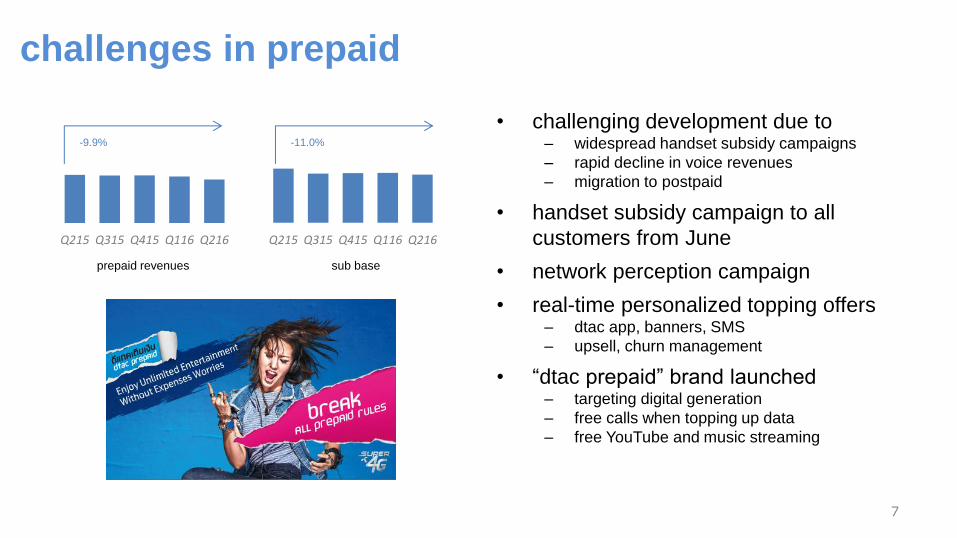
challenges in prepaid
• challenging development due to – widespread handset subsidy campaigns
– rapid decline in voice revenues
– migration to postpaid
• handset subsidy campaign to all
customers from June
• network perception campaign
• real-time personalized topping offers – dtac app, banners, SMS
– upsell, churn management
• “dtac prepaid” brand launched – targeting digital generation
– free calls when topping up data
– free YouTube and music streaming
7
Q215 Q315 Q415 Q116 Q216
prepaid revenues
Q215 Q315 Q415 Q116 Q216
sub base
-9.9% -11.0%
aspiring to become no. 1 digital brand
8
• offer attractive and relevant digital
services for customers – dtac app
– VoLTE, VoWiFi
– Capture cloud storage
– Music Infinite
– Jaew Wallet financial service
• plan to launch new services regularly
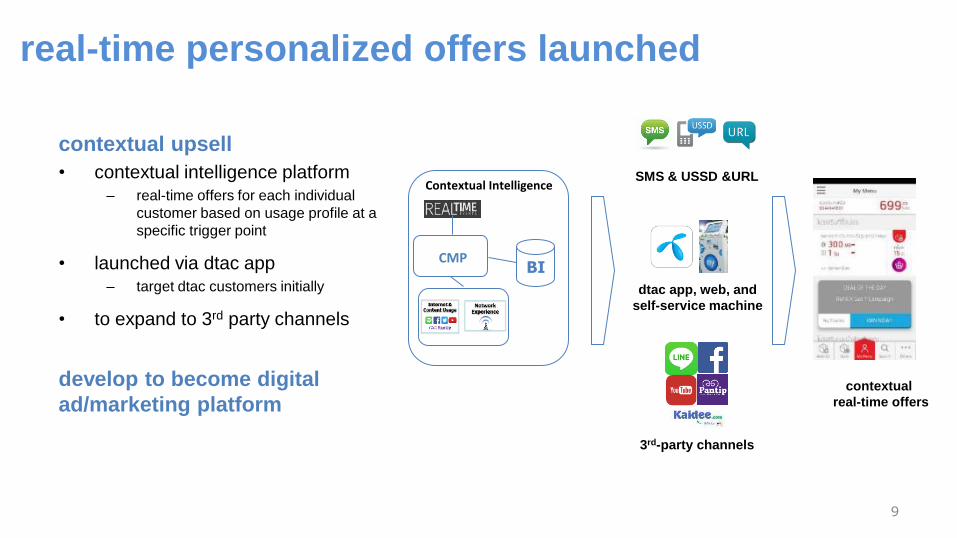
real-time personalized offers launched
contextual upsell
• contextual intelligence platform
– real-time offers for each individual
customer based on usage profile at a
specific trigger point
• launched via dtac app
– target dtac customers initially
• to expand to 3rd party channels
develop to become digital
ad/marketing platform
9
SMS & USSD &URL
dtac app, web, and
self-service machine
3rd-party channels
contextual
real-time offers
Contextual Intelligence
CMP BI
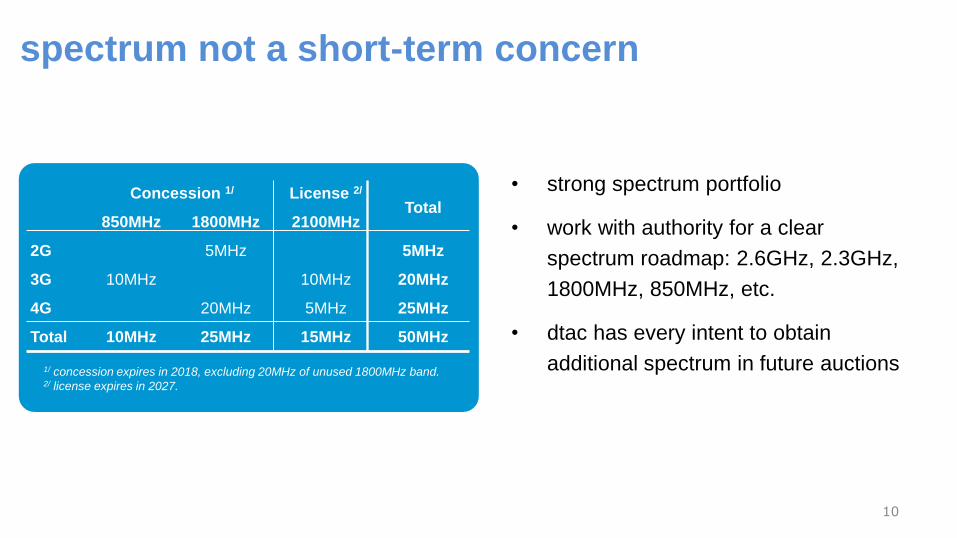
spectrum not a short-term concern
• strong spectrum portfolio
• work with authority for a clear
spectrum roadmap: 2.6GHz, 2.3GHz,
1800MHz, 850MHz, etc.
• dtac has every intent to obtain
additional spectrum in future auctions
10
Concession 1/ License 2/ Total
850MHz 1800MHz 2100MHz
2G 5MHz 5MHz
3G 10MHz 10MHz 20MHz
4G 20MHz 5MHz 25MHz
Total 10MHz 25MHz 15MHz 50MHz
1/ concession expires in 2018, excluding 20MHz of unused 1800MHz band. 2/ license expires in 2027.

financial highlights
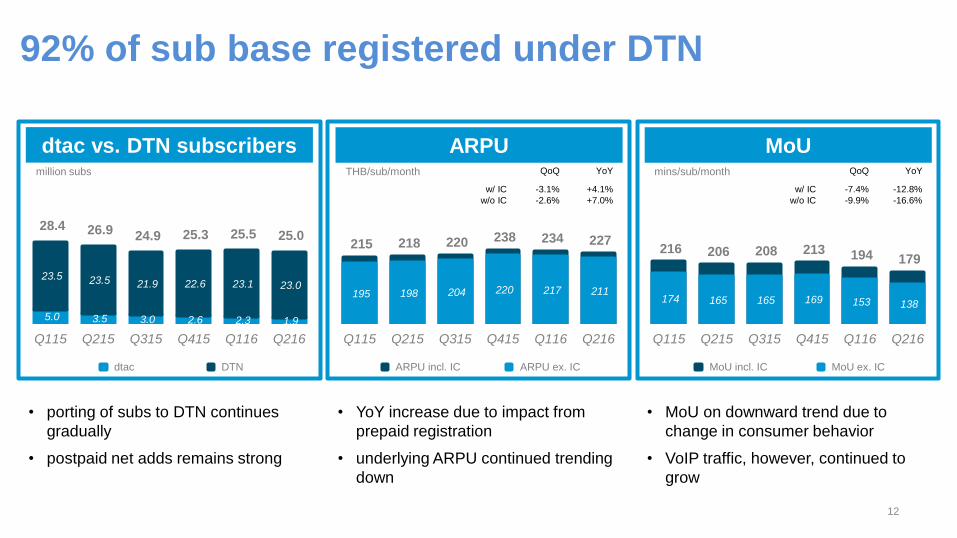
92% of sub base registered under DTN
5.0 3.5 3.0 2.6 2.3 1.9
23.5 23.5 21.9 22.6 23.1 23.0
28.4 26.9 24.9 25.3 25.5 25.0
Q115 Q215 Q315 Q415 Q116 Q216
dtac DTN
215 218 220 238 234 227
195 198 204 220 217 211
Q115 Q215 Q315 Q415 Q116 Q216
ARPU incl. IC ARPU ex. IC
216 206 208 213 194 179
174 165 165 169 153 138
Q115 Q215 Q315 Q415 Q116 Q216
MoU incl. IC MoU ex. IC
dtac vs. DTN subscribers ARPU MoU million subs THB/sub/month mins/sub/month
• porting of subs to DTN continues
gradually
• postpaid net adds remains strong
• MoU on downward trend due to
change in consumer behavior
• VoIP traffic, however, continued to
grow
QoQ YoY
w/ IC
w/o IC
-3.1%
-2.6%
+4.1%
+7.0%
QoQ YoY
w/ IC
w/o IC
-7.4%
-9.9%
-12.8%
-16.6%
12
• YoY increase due to impact from
prepaid registration
• underlying ARPU continued trending
down
data revenue growth accelerated
13
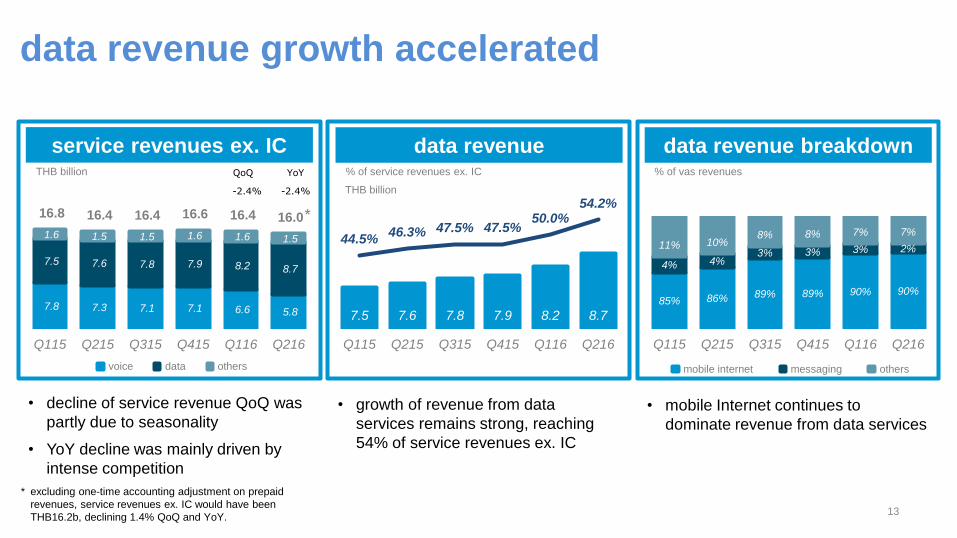
7.8 7.3 7.1 7.1 6.6 5.8
7.5 7.6 7.8 7.9 8.2 8.7
1.6 1.5 1.5 1.6 1.6 1.5
16.8 16.4 16.4 16.6 16.4 16.0
Q115 Q215 Q315 Q415 Q116 Q216
voice data others
service revenues ex. IC data revenue
85% 86% 89% 89% 90% 90%
4% 4% 3% 3% 3% 2% 11% 10% 8% 8% 7% 7%
Q115 Q215 Q315 Q415 Q116 Q216
mobile internet messaging others
data revenue breakdown THB billion % of service revenues ex. IC % of vas revenues
• growth of revenue from data
services remains strong, reaching
54% of service revenues ex. IC
• mobile Internet continues to
dominate revenue from data services
• decline of service revenue QoQ was
partly due to seasonality
• YoY decline was mainly driven by
intense competition
7.5 7.6 7.8 7.9 8.2 8.7
44.5% 46.3% 47.5% 47.5%
50.0% 54.2%
Q115 Q215 Q315 Q415 Q116 Q216
QoQ YoY
-2.4% -2.4% THB billion
*
* excluding one-time accounting adjustment on prepaid
revenues, service revenues ex. IC would have been
THB16.2b, declining 1.4% QoQ and YoY.
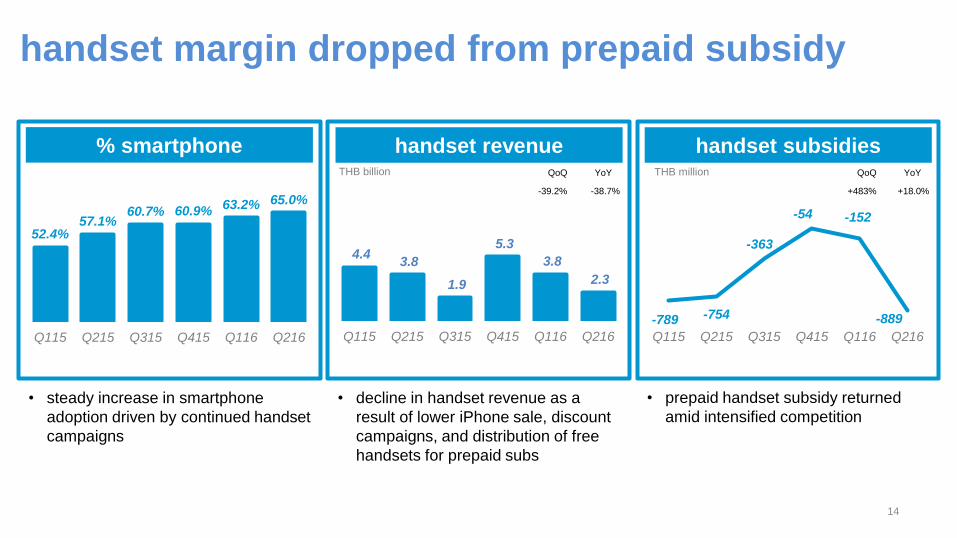
4.4 3.8
1.9
5.3
3.8
2.3
Q115 Q215 Q315 Q415 Q116 Q216
% smartphone handset revenue
52.4% 57.1%
60.7% 60.9% 63.2% 65.0%
Q115 Q215 Q315 Q415 Q116 Q216
handset subsidies
-789 -754
-363
-54 -152
-889
Q115 Q215 Q315 Q415 Q116 Q216
THB billion
• decline in handset revenue as a
result of lower iPhone sale, discount
campaigns, and distribution of free
handsets for prepaid subs
• prepaid handset subsidy returned
amid intensified competition
• steady increase in smartphone
adoption driven by continued handset
campaigns
14
handset margin dropped from prepaid subsidy
QoQ YoY
-39.2% -38.7%
THB million QoQ YoY
+483% +18.0%
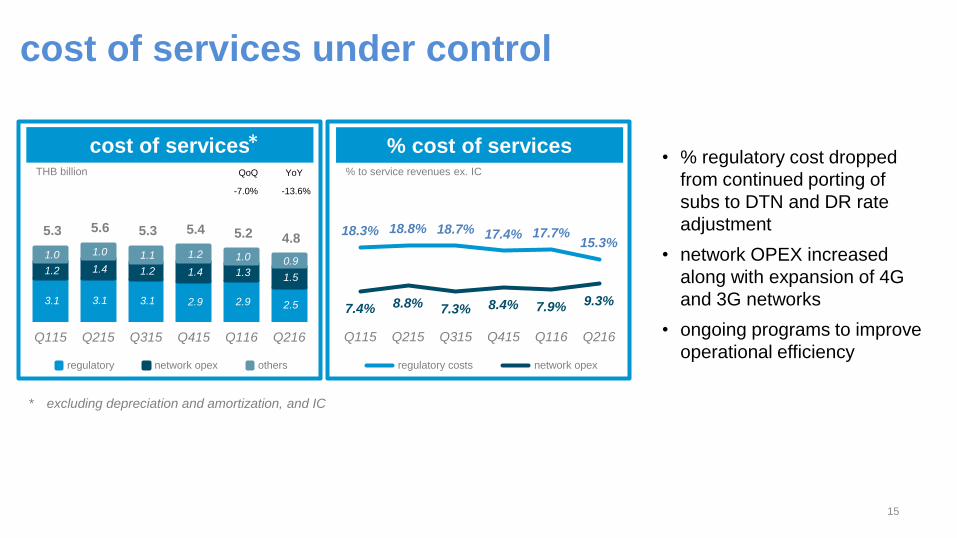
3.1 3.1 3.1 2.9 2.9 2.5
1.2 1.4 1.2 1.4 1.3 1.5
1.0 1.0 1.1 1.2 1.0 0.9
5.3 5.6 5.3 5.4 5.2 4.8
Q115 Q215 Q315 Q415 Q116 Q216
regulatory network opex others
cost of services % cost of services THB billion % to service revenues ex. IC
18.3% 18.8% 18.7% 17.4% 17.7% 15.3%
7.4% 8.8% 7.3% 8.4% 7.9% 9.3%
Q115 Q215 Q315 Q415 Q116 Q216
regulatory costs network opex
• % regulatory cost dropped
from continued porting of
subs to DTN and DR rate
adjustment
• network OPEX increased
along with expansion of 4G
and 3G networks
• ongoing programs to improve
operational efficiency
* excluding depreciation and amortization, and IC
*
15
cost of services under control
QoQ YoY
-7.0% -13.6%
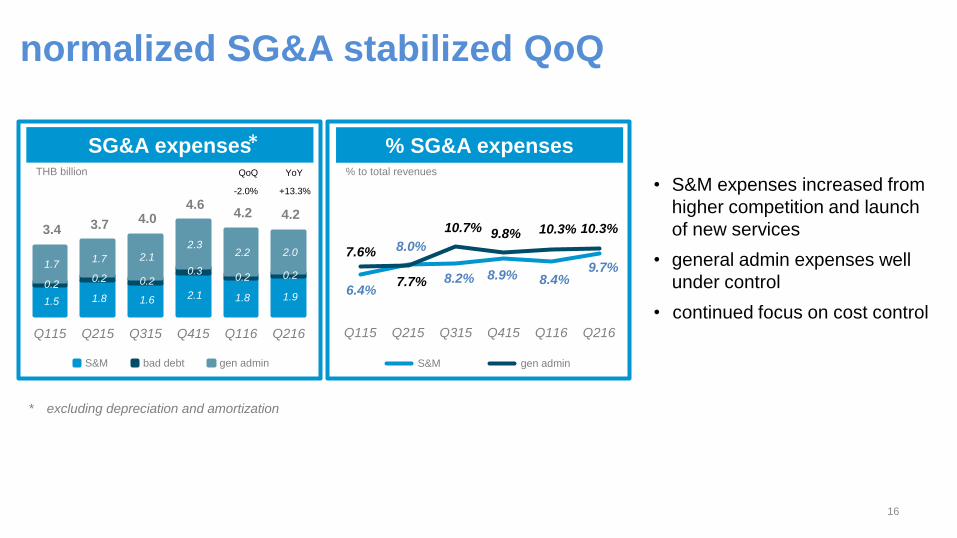
% SG&A expenses
• S&M expenses increased from
higher competition and launch
of new services
• general admin expenses well
under control
• continued focus on cost control
SG&A expenses THB billion
6.4%
8.0%
8.2% 8.9% 8.4% 9.7%
7.6%
7.7%
10.7% 9.8% 10.3% 10.3%
Q115 Q215 Q315 Q415 Q116 Q216
S&M gen admin
% to total revenues
* excluding depreciation and amortization
*
1.5 1.8 1.6 2.1 1.8 1.9
0.2 0.2 0.2
0.3 0.2 0.2
1.7 1.7 2.1
2.3 2.2 2.0
3.4 3.7 4.0 4.6
4.2 4.2
Q115 Q215 Q315 Q415 Q116 Q216
S&M bad debt gen admin
16
normalized SG&A stabilized QoQ
QoQ YoY
-2.0% +13.3%
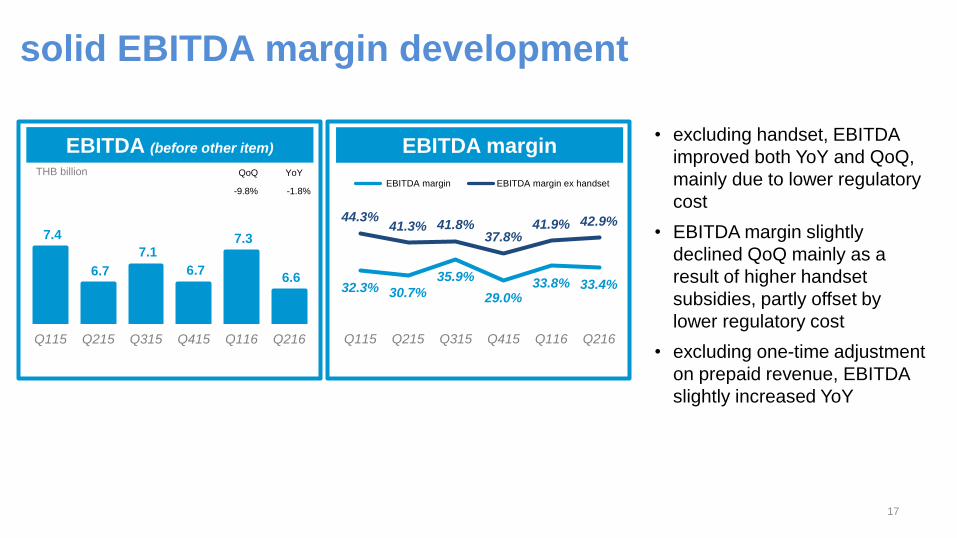
solid EBITDA margin development
7.4
6.7
7.1
6.7
7.3
6.6
Q115 Q215 Q315 Q415 Q116 Q216
EBITDA (before other item) EBITDA margin THB billion
32.3% 30.7%
35.9%
29.0% 33.8% 33.4%
44.3% 41.3% 41.8%
37.8% 41.9% 42.9%
Q115 Q215 Q315 Q415 Q116 Q216
EBITDA margin EBITDA margin ex handset
• excluding handset, EBITDA
improved both YoY and QoQ,
mainly due to lower regulatory
cost
• EBITDA margin slightly
declined QoQ mainly as a
result of higher handset
subsidies, partly offset by
lower regulatory cost
• excluding one-time adjustment
on prepaid revenue, EBITDA
slightly increased YoY
17
QoQ YoY
-9.8% -1.8%
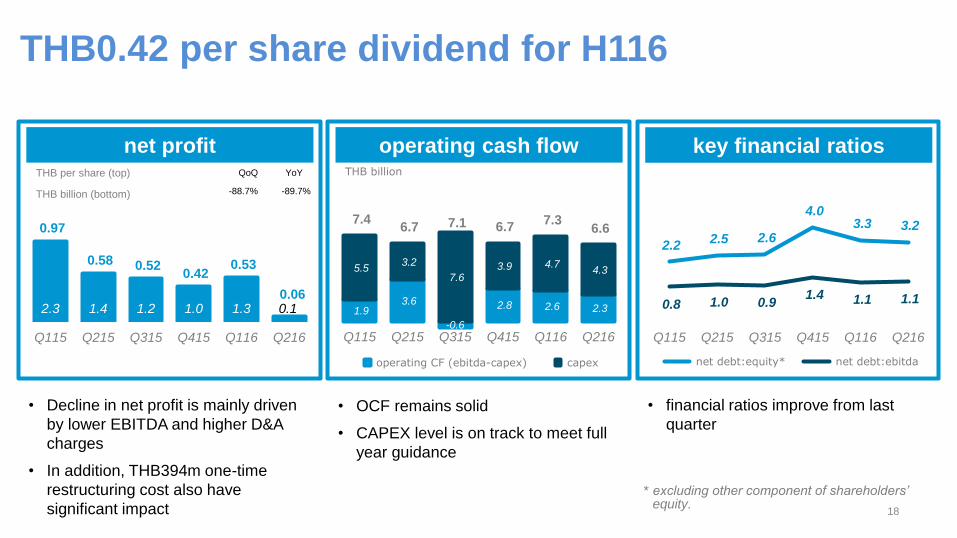
0.97
0.58 0.52 0.42
0.53
0.06 2.3 1.4 1.2 1.0 1.3 0.1
Q115 Q215 Q315 Q415 Q116 Q216
net profit THB per share (top)
THB billion (bottom)
• Decline in net profit is mainly driven
by lower EBITDA and higher D&A
charges
• In addition, THB394m one-time
restructuring cost also have
significant impact 18
THB0.42 per share dividend for H116
QoQ YoY
-88.7% -89.7%
1.9 3.6
-0.6
2.8 2.6 2.3
5.5 3.2
7.6 3.9 4.7
4.3
7.4 6.7 7.1 6.7
7.3 6.6
Q115 Q215 Q315 Q415 Q116 Q216
operating CF (ebitda-capex) capex
operating cash flow key financial ratios THB billion
2.2 2.5 2.6
4.0 3.3 3.2
0.8 1.0 0.9 1.4 1.1 1.1
Q115 Q215 Q315 Q415 Q116 Q216
net debt:equity* net debt:ebitda
* excluding other component of shareholders’ equity.
• OCF remains solid
• CAPEX level is on track to meet full
year guidance
• financial ratios improve from last
quarter
strategic direction and outlook
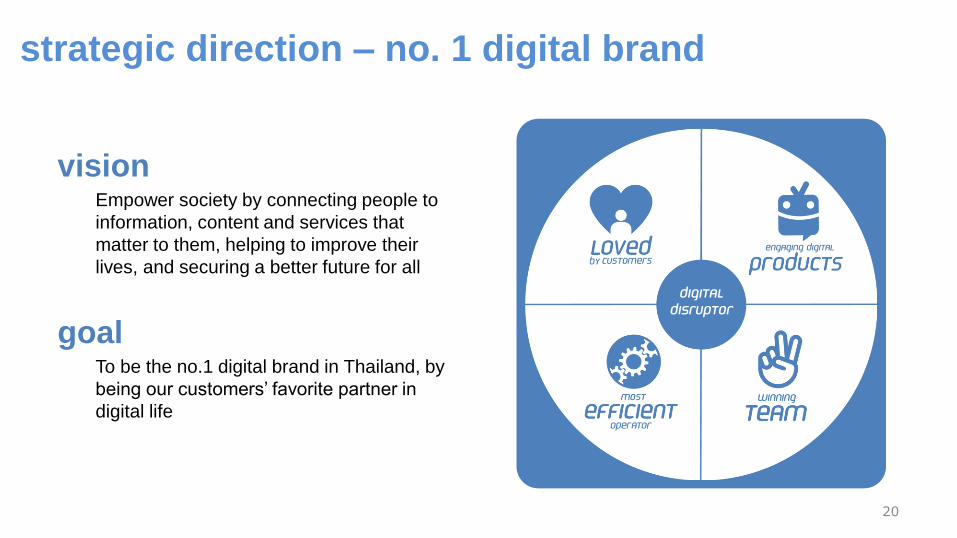
strategic direction – no. 1 digital brand
20
vision Empower society by connecting people to
information, content and services that
matter to them, helping to improve their
lives, and securing a better future for all
goal To be the no.1 digital brand in Thailand, by
being our customers’ favorite partner in
digital life
digital disruptor
21
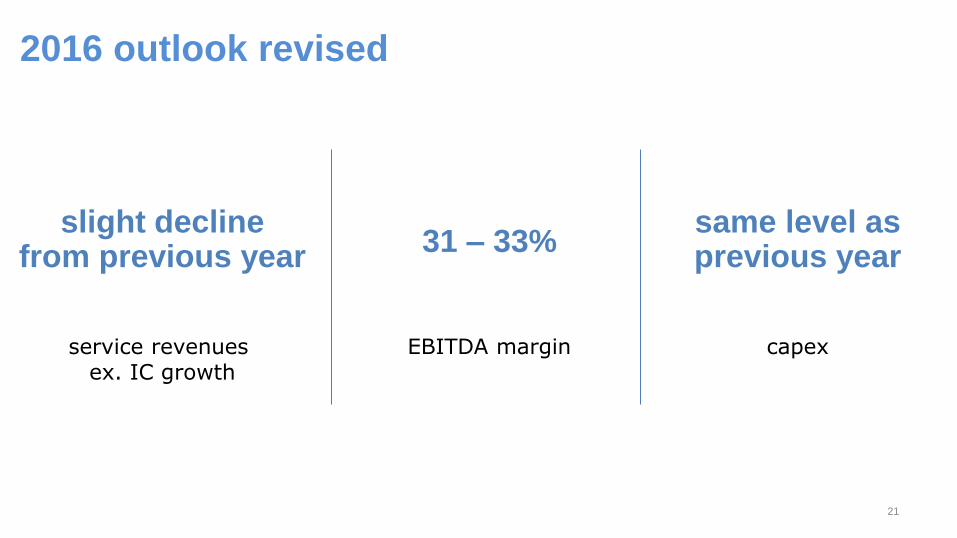
slight decline from previous year
service revenues ex. IC growth
same level as previous year
capex
2016 outlook revised
EBITDA margin
31 – 33%
Certain forward looking statements may be made in the course of the presentation. These forward-looking statements
generally can be identified by use of statements that include words or phrases such as dtac or its management
“believes”, “expects”, “anticipates”, “intends”, “plans”, “foresees”, or other words or phrases of similar import. Similarly,
statements that describe dtac’s objectives, plans or goals also are forward-looking statements.
All such forward-looking statements are subject to certain risks and uncertainties that could cause actual results to differ
materially from those contemplated by the relevant forward-looking statement. The forward-looking statements
contained in the slides are not and should not be constructed as representations of the future performance of dtac and
that such statements are an expression of the Company’s reviews based on its current view and certain assumptions
including, but not limited to, prevailing economic and market conditions and currently available information.
disclaimer
Investor Relations
E: [email protected] T: +662 202 8882


![[XLS]engineeringstudentsdata.comengineeringstudentsdata.com/downloads/2016/Telangana... · Web view2016 2016 2016 2016 2016 2016 2016 2016 2016 2016 2016 2016 2016 2016 2016 2016](https://img.pdfslide.net/doc/110x75/5b19478b7f8b9a23258c8745/xlseng-web-view2016-2016-2016-2016-2016-2016-2016-2016-2016-2016-2016-2016.jpg)


![[XLS] · Web view1 2 3 4 5 6 7 8 9 10 11 12 2016 23 2016 2016 2016 2016 2016 2016 2016 2016 2016 2016 2016 2016 2016 2016 2016 2016 2016 2016 2016 2016 2016 2016 2016 2016 2016 2016](https://img.pdfslide.net/doc/110x75/5abbc6ce7f8b9a76038d1e1d/xls-view1-2-3-4-5-6-7-8-9-10-11-12-2016-23-2016-2016-2016-2016-2016-2016-2016.jpg)