Embed Size (px)
Citation preview

APTIV
July 31, 2018
Second Quarter 2018 Earnings Call
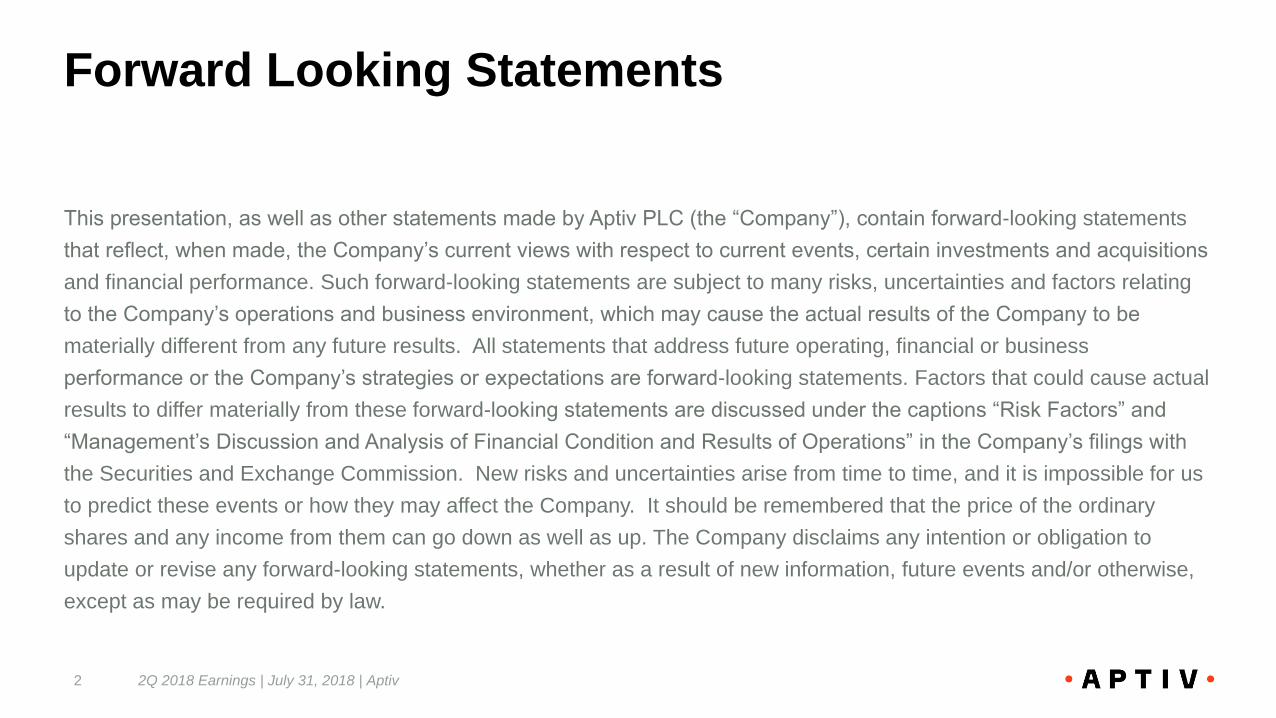
This presentation, as well as other statements made by Aptiv PLC (the “Company”), contain forward-looking statements
that reflect, when made, the Company’s current views with respect to current events, certain investments and acquisitions
and financial performance. Such forward-looking statements are subject to many risks, uncertainties and factors relating
to the Company’s operations and business environment, which may cause the actual results of the Company to be
materially different from any future results. All statements that address future operating, financial or business
performance or the Company’s strategies or expectations are forward-looking statements. Factors that could cause actual
results to differ materially from these forward-looking statements are discussed under the captions “Risk Factors” and
“Management’s Discussion and Analysis of Financial Condition and Results of Operations” in the Company’s filings with
the Securities and Exchange Commission. New risks and uncertainties arise from time to time, and it is impossible for us
to predict these events or how they may affect the Company. It should be remembered that the price of the ordinary
shares and any income from them can go down as well as up. The Company disclaims any intention or obligation to
update or revise any forward-looking statements, whether as a result of new information, future events and/or otherwise,
except as may be required by law.
Forward Looking Statements
2Q 2018 Earnings | July 31, 2018 | Aptiv2
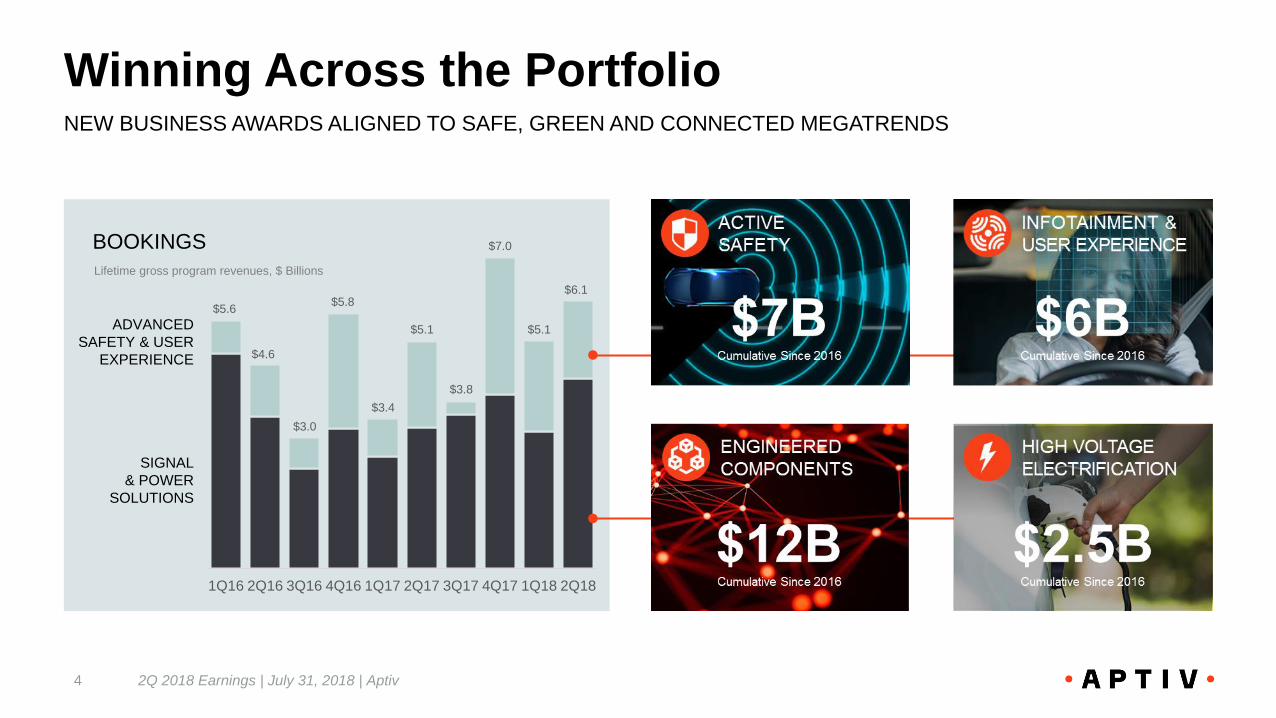
BOOKINGS
1Q16 2Q16 3Q16 4Q16 1Q17 2Q17 3Q17 4Q17 1Q18 2Q18
Winning Across the Portfolio
2Q 2018 Earnings | July 31, 2018 | Aptiv4
NEW BUSINESS AWARDS ALIGNED TO SAFE, GREEN AND CONNECTED MEGATRENDS
$5.1
Lifetime gross program revenues, $ Billions
$7.0
$3.8
$5.1
$3.4
$5.8
$3.0
$4.6
$5.6
ADVANCED
SAFETY & USER
EXPERIENCE
SIGNAL
& POWER
SOLUTIONS
$6.1
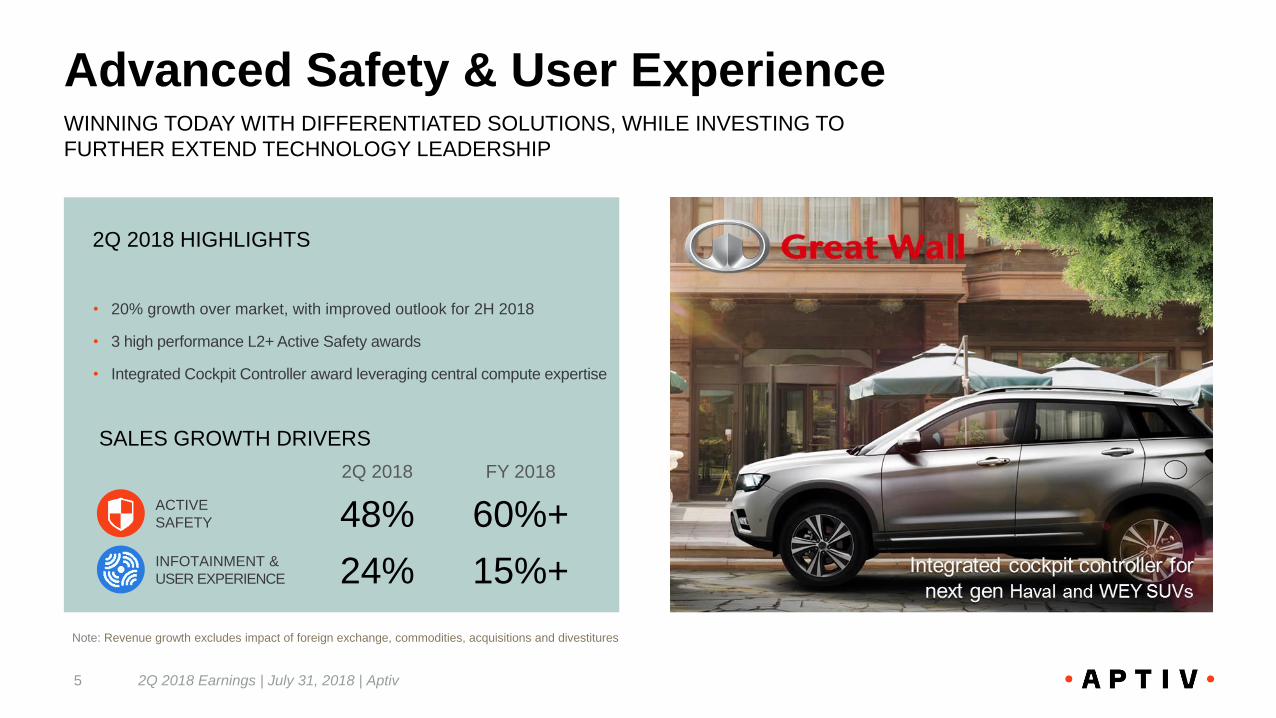
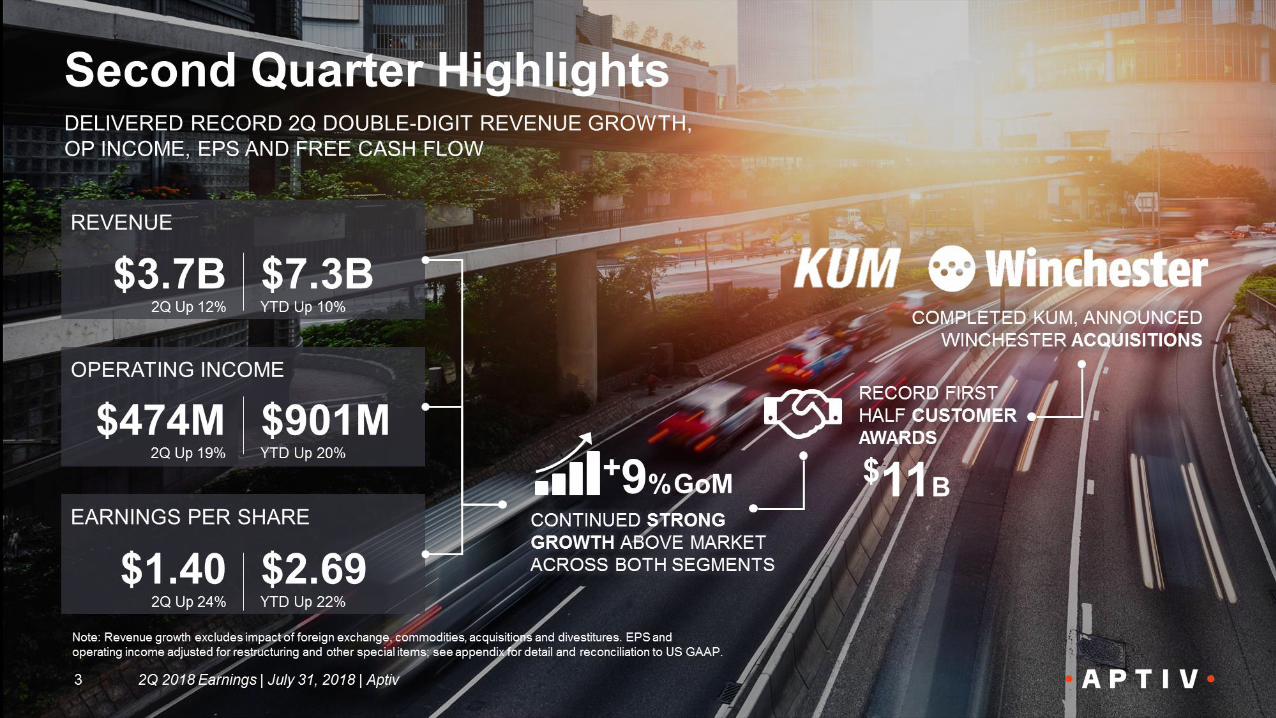
2Q 2018 HIGHLIGHTS
Advanced Safety & User Experience
2Q 2018 Earnings | July 31, 2018 | Aptiv5
WINNING TODAY WITH DIFFERENTIATED SOLUTIONS, WHILE INVESTING TO
FURTHER EXTEND TECHNOLOGY LEADERSHIP
INFOTAINMENT &
USER EXPERIENCE
ACTIVE
SAFETY
2Q 2018 FY 2018
48% 60%+
24% 15%+
SALES GROWTH DRIVERS
• 20% growth over market, with improved outlook for 2H 2018
• 3 high performance L2+ Active Safety awards
• Integrated Cockpit Controller award leveraging central compute expertise
Note: Revenue growth excludes impact of foreign exchange, commodities, acquisitions and divestitures
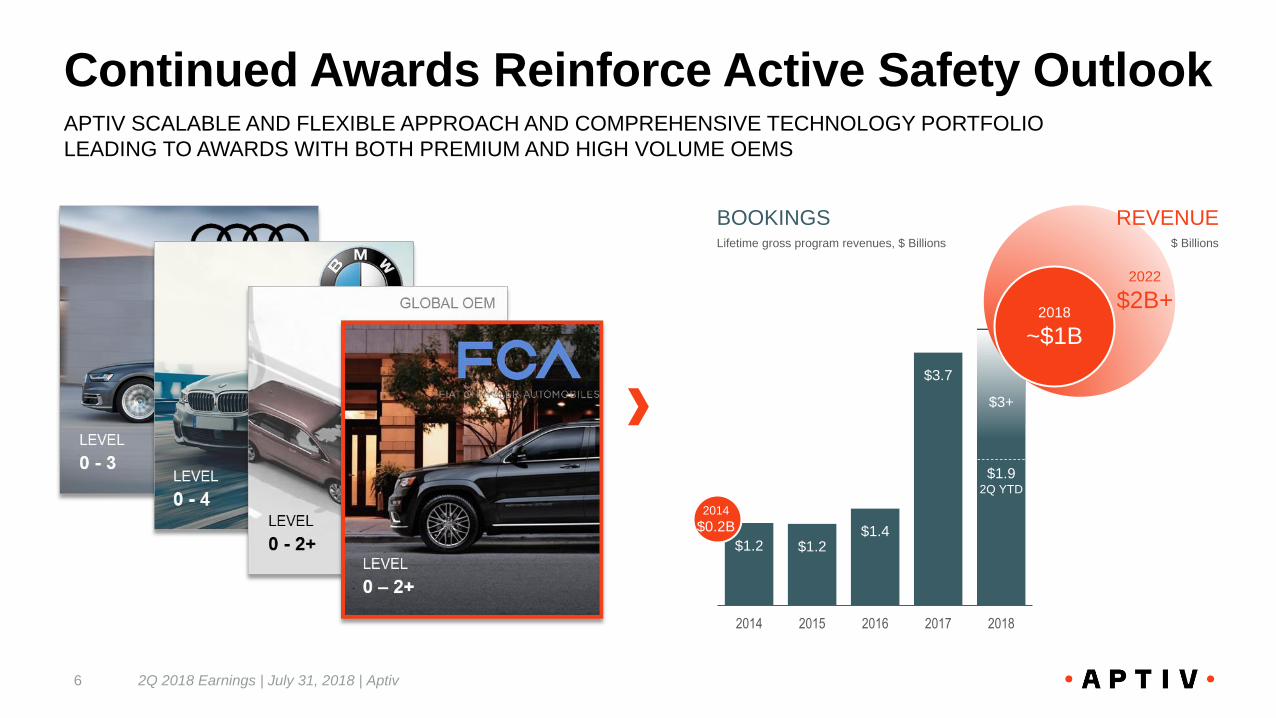
$1.2 $1.2$1.4
$3.7
$3+
2014 2015 2016 2017 2018
2018
~$1B
2022
$2B+
Continued Awards Reinforce Active Safety Outlook
2Q 2018 Earnings | July 31, 2018 | Aptiv6
APTIV SCALABLE AND FLEXIBLE APPROACH AND COMPREHENSIVE TECHNOLOGY PORTFOLIO
LEADING TO AWARDS WITH BOTH PREMIUM AND HIGH VOLUME OEMS
$1.92Q YTD
REVENUE$ Billions
BOOKINGSLifetime gross program revenues, $ Billions
2014
$0.2B

2Q 2018 HIGHLIGHTS
Signal & Power Solutions
2Q 2018 Earnings | July 31, 2018 | Aptiv8
GROWTH OVER MARKET OF 5% DRIVEN BY STRONG GROWTH ACROSS ALL PRODUCT LINES
HIGH VOLTAGE
ELECTRIFICATION 63% 60%+ENGINEERED
COMPONENTS 12% ~10%
2Q 2018 FY 2018
• New Launches accelerate growth: EDS +5%, ECG +12%
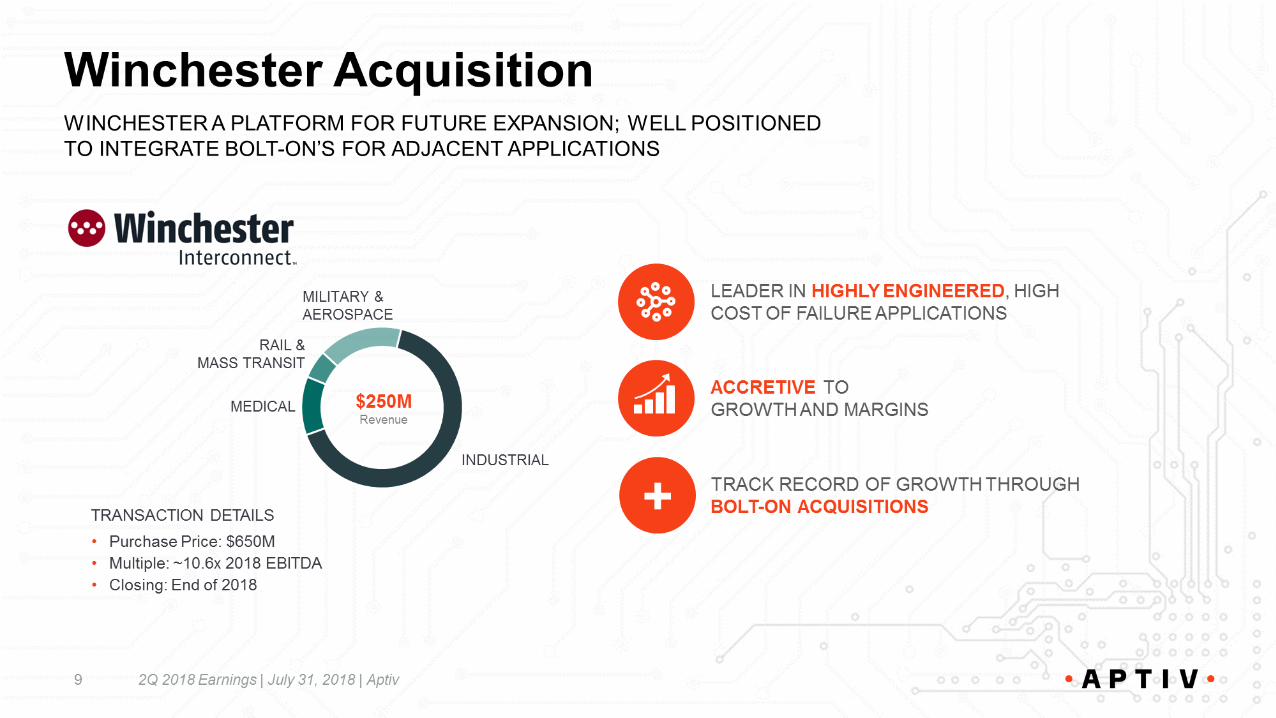
• Adding accretive bolt-ons: KUM closing, Winchester announcement
• Continued penetration of advanced features and functionality
driving growth
SALES GROWTH DRIVERS
Note: Revenue growth excludes impact of foreign exchange, commodities, acquisitions and divestitures
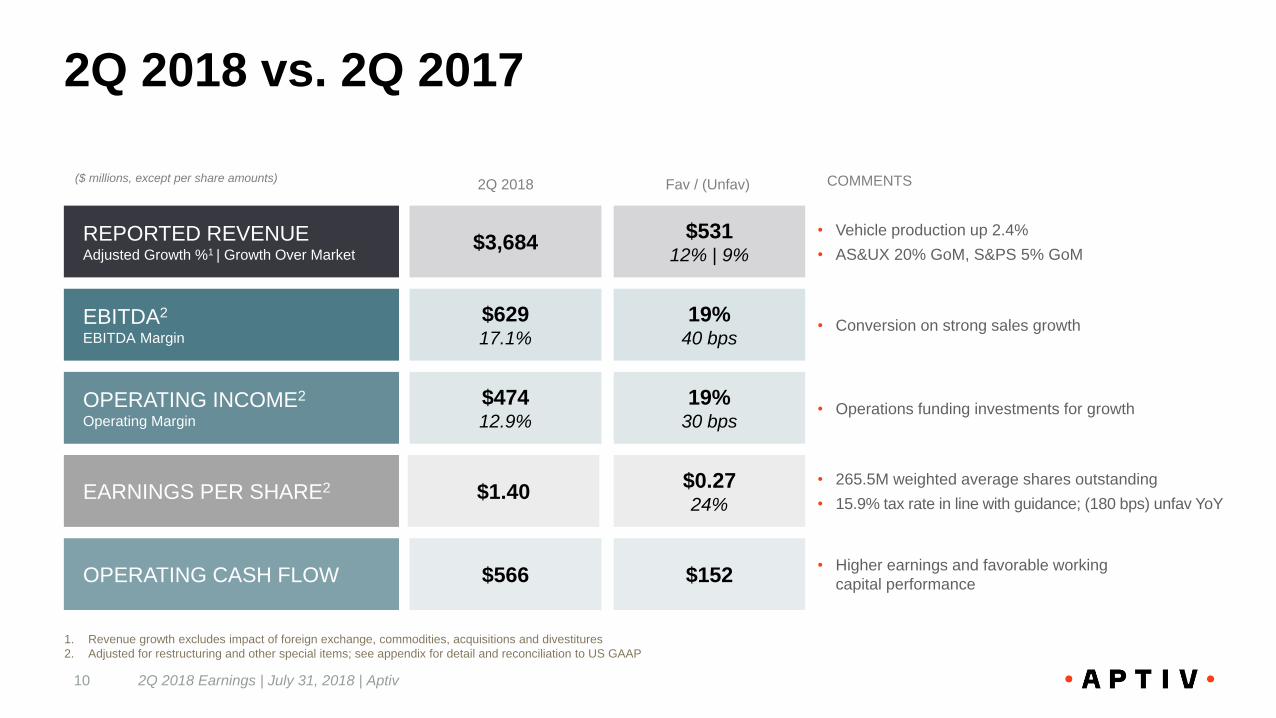
$152
19%30 bps
19%40 bps
$53112% | 9%
2Q 2018 vs. 2Q 2017
2Q 2018 Earnings | July 31, 2018 | Aptiv10
EBITDA2
EBITDA Margin
OPERATING INCOME2
Operating Margin
OPERATING CASH FLOW
REPORTED REVENUEAdjusted Growth %1 | Growth Over Market
$62917.1%
$47412.9%
$566
$3,684
2Q 2018 Fav / (Unfav)
1. Revenue growth excludes impact of foreign exchange, commodities, acquisitions and divestitures
2. Adjusted for restructuring and other special items; see appendix for detail and reconciliation to US GAAP
$0.2724%
$1.40EARNINGS PER SHARE2
($ millions, except per share amounts)
• Vehicle production up 2.4%
• AS&UX 20% GoM, S&PS 5% GoM
COMMENTS
• Conversion on strong sales growth
• Operations funding investments for growth
• Higher earnings and favorable working
capital performance
• 265.5M weighted average shares outstanding
• 15.9% tax rate in line with guidance; (180 bps) unfav YoY
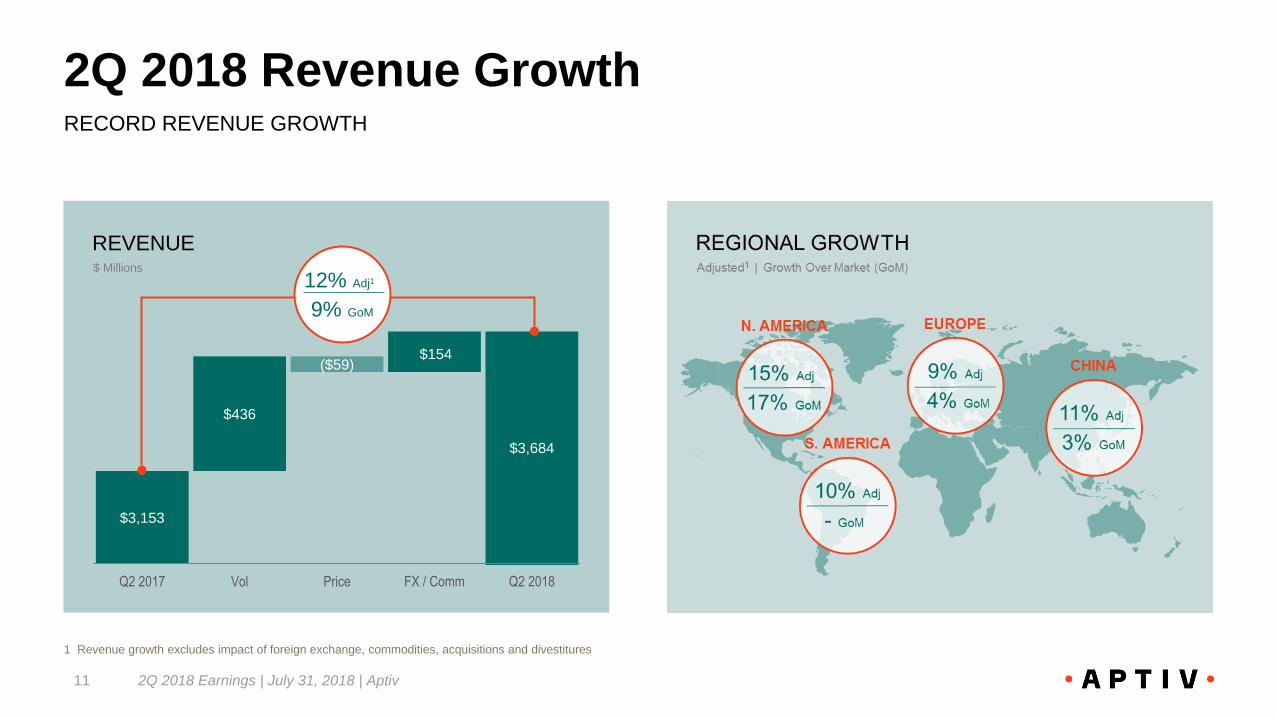
2Q 2018 Revenue Growth
2Q 2018 Earnings | July 31, 2018 | Aptiv11
RECORD REVENUE GROWTH
REVENUE
$3,153
$436
($59)$154
$3,684
Q2 2017 Vol Price FX / Comm Q2 2018
$ Millions
1 Revenue growth excludes impact of foreign exchange, commodities, acquisitions and divestitures
12% Adj1
9% GoM
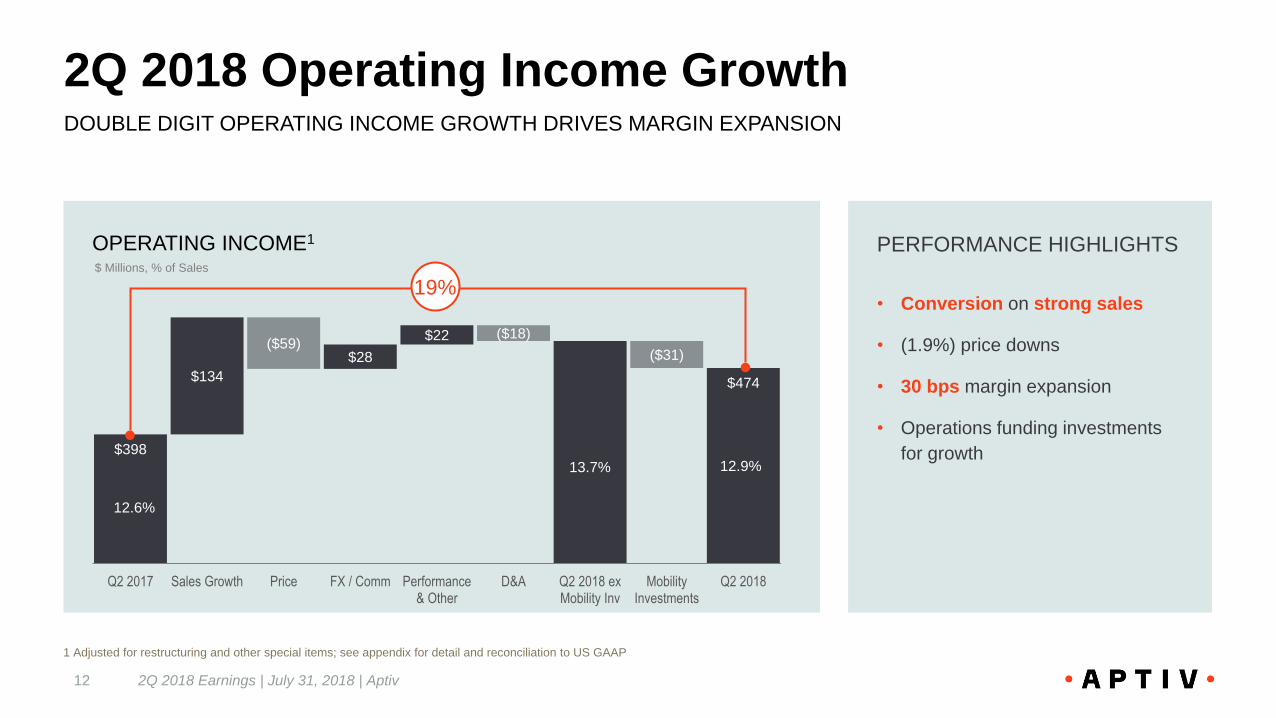
2Q 2018 Operating Income Growth
2Q 2018 Earnings | July 31, 2018 | Aptiv12
DOUBLE DIGIT OPERATING INCOME GROWTH DRIVES MARGIN EXPANSION
OPERATING INCOME1
$ Millions, % of Sales
1 Adjusted for restructuring and other special items; see appendix for detail and reconciliation to US GAAP
$398
$474$134
($59)$28
$22 ($18)
($31)
Q2 2017 Sales Growth Price FX / Comm Performance& Other
D&A Q2 2018 exMobility Inv
MobilityInvestments
Q2 2018
19%
12.6%
12.9%13.7%
PERFORMANCE HIGHLIGHTS
• Conversion on strong sales
• (1.9%) price downs
• 30 bps margin expansion
• Operations funding investments
for growth
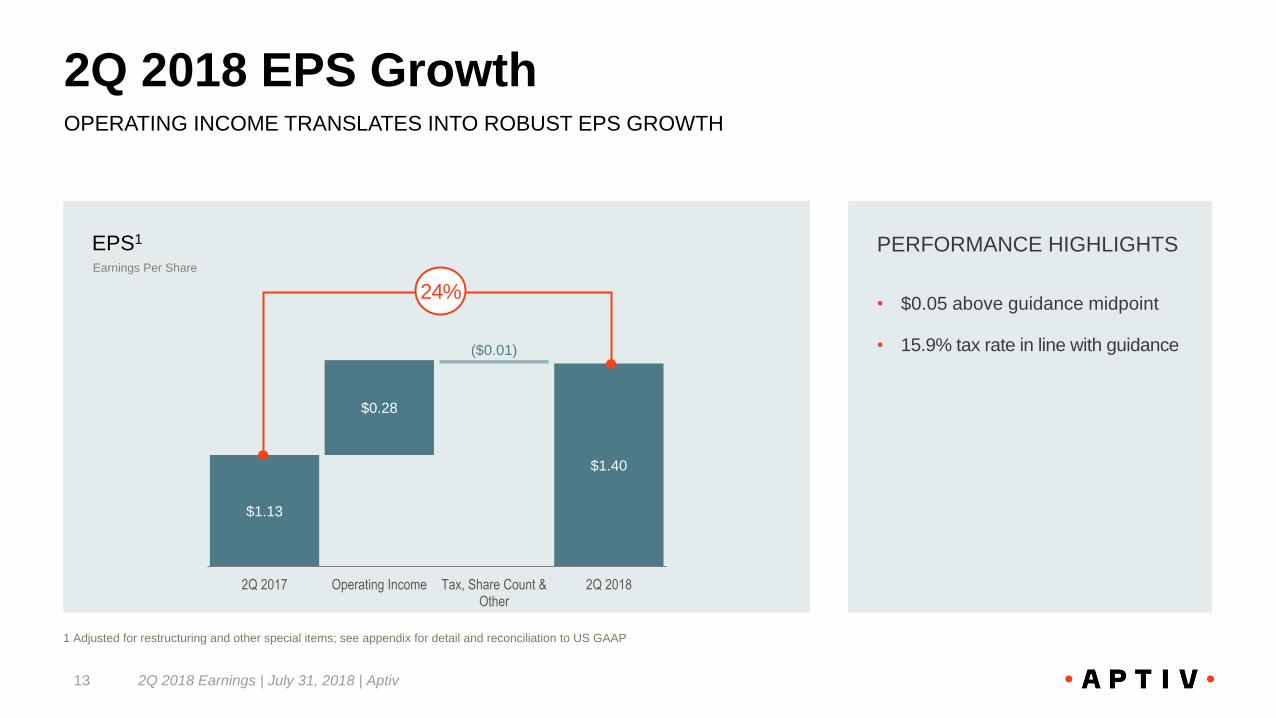
EPS1
Earnings Per Share
$1.13
$1.40
$0.28
($0.01)
2Q 2017 Operating Income Tax, Share Count &Other
2Q 2018
24%
2Q 2018 EPS Growth
2Q 2018 Earnings | July 31, 2018 | Aptiv13
OPERATING INCOME TRANSLATES INTO ROBUST EPS GROWTH
1 Adjusted for restructuring and other special items; see appendix for detail and reconciliation to US GAAP
PERFORMANCE HIGHLIGHTS
• $0.05 above guidance midpoint
• 15.9% tax rate in line with guidance
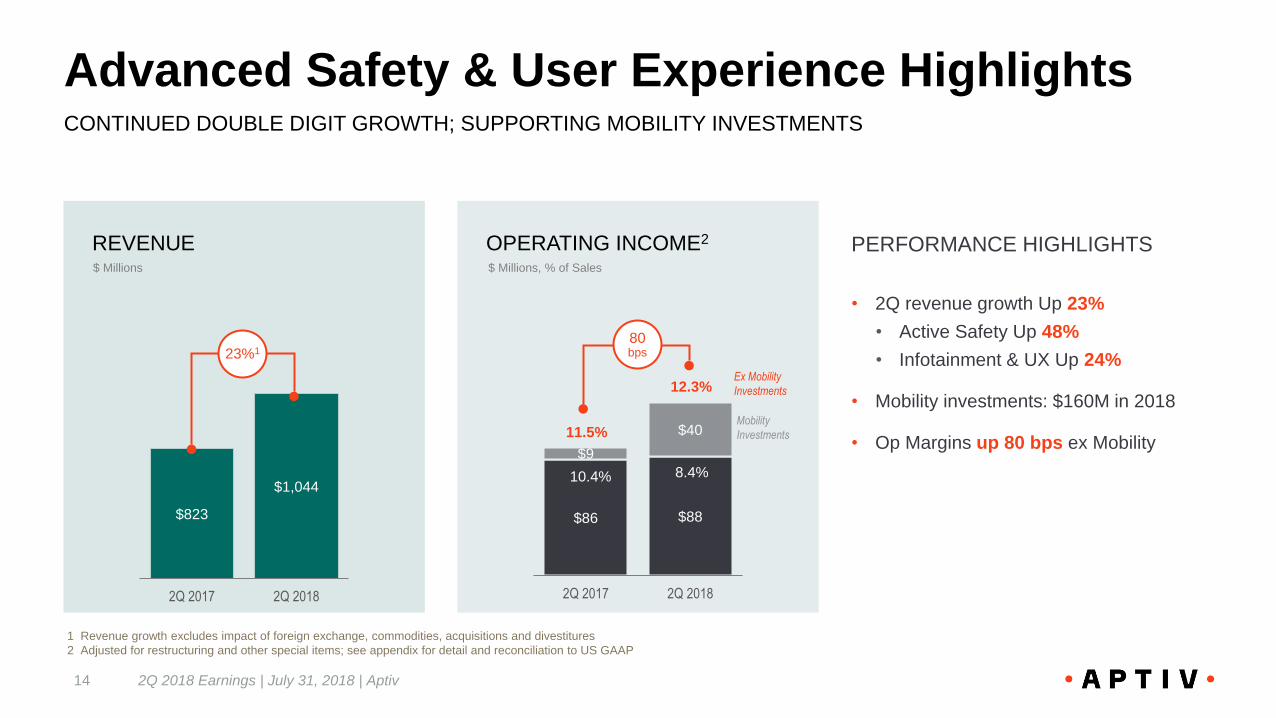
Advanced Safety & User Experience Highlights
REVENUE OPERATING INCOME2
2Q 2018 Earnings | July 31, 2018 | Aptiv14
CONTINUED DOUBLE DIGIT GROWTH; SUPPORTING MOBILITY INVESTMENTS
$ Millions $ Millions, % of Sales
$86 $88
$9
$40
2Q 2017 2Q 2018
12.3%
1 Revenue growth excludes impact of foreign exchange, commodities, acquisitions and divestitures
2 Adjusted for restructuring and other special items; see appendix for detail and reconciliation to US GAAP
PERFORMANCE HIGHLIGHTS
• 2Q revenue growth Up 23%
• Active Safety Up 48%
• Infotainment & UX Up 24%
• Mobility investments: $160M in 2018
• Op Margins up 80 bps ex Mobility
Ex Mobility
Investments
8.4%
$823
$1,044
2Q 2017 2Q 2018
10.4%
23%1
11.5%
80bps
Mobility
Investments
Signal & Power Solutions
REVENUE OPERATING INCOME2
2Q 2018 Earnings | July 31, 2018 | Aptiv15
MID SINGLE DIGIT GROWTH IN 2018; SOLID GROWTH OVER MARKET
$2,346$2,650
2Q 2017 2Q 2018
$ Millions $ Millions, % of Sales
$312$386
2Q 2017 2Q 2018
1 Revenue growth excludes impact of foreign exchange, commodities, acquisitions and divestitures
2 Adjusted for restructuring and other special items; see appendix for detail and reconciliation to US GAAP
PERFORMANCE HIGHLIGHTS
• 2Q revenue growth Up 8%
• Program launches support accelerated
growth
• Strong North America growth despite
continued passenger car headwinds
• Operating Margins up 130 bps
• Recent acquisitions aligned to strategy
14.6%
13.3%
4Q8%1
130bps
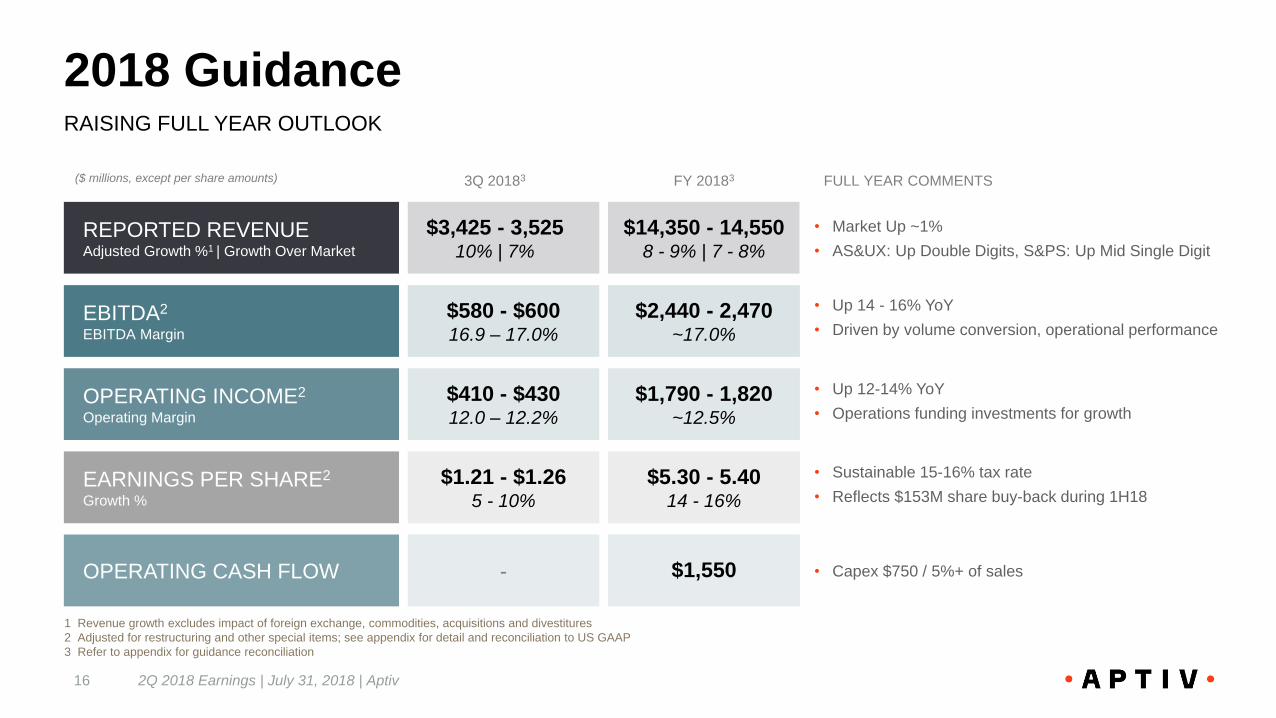
2018 Guidance
2Q 2018 Earnings | July 31, 2018 | Aptiv16
RAISING FULL YEAR OUTLOOK
$2,440 - 2,470~17.0%
$1,790 - 1,820~12.5%
$1,550
3Q 20183 FY 20183
$580 - $60016.9 – 17.0%
$410 - $43012.0 – 12.2%
-
$3,425 - 3,52510% | 7%
$14,350 - 14,5508 - 9% | 7 - 8%
EBITDA2
EBITDA Margin
OPERATING INCOME2
Operating Margin
OPERATING CASH FLOW
REPORTED REVENUEAdjusted Growth %1 | Growth Over Market
$5.30 - 5.4014 - 16%
$1.21 - $1.265 - 10%
EARNINGS PER SHARE2
Growth %
• Market Up ~1%
• AS&UX: Up Double Digits, S&PS: Up Mid Single Digit
FULL YEAR COMMENTS
• Up 14 - 16% YoY
• Driven by volume conversion, operational performance
• Up 12-14% YoY
• Operations funding investments for growth
• Capex $750 / 5%+ of sales
• Sustainable 15-16% tax rate
• Reflects $153M share buy-back during 1H18
1 Revenue growth excludes impact of foreign exchange, commodities, acquisitions and divestitures
2 Adjusted for restructuring and other special items; see appendix for detail and reconciliation to US GAAP
3 Refer to appendix for guidance reconciliation
($ millions, except per share amounts)
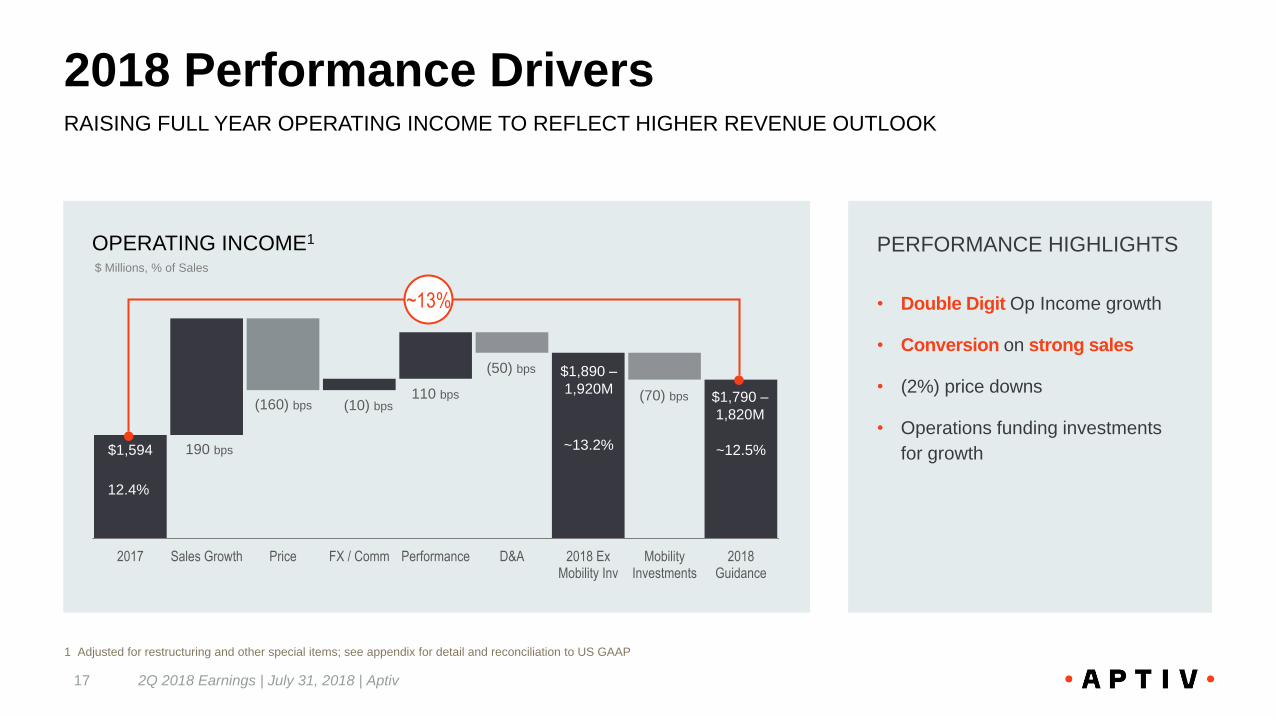
OPERATING INCOME1
$1,594
2017 Sales Growth Price FX / Comm Performance D&A 2018 ExMobility Inv
MobilityInvestments
2018Guidance
PERFORMANCE HIGHLIGHTS
• Double Digit Op Income growth
• Conversion on strong sales
• (2%) price downs
• Operations funding investments
for growth
2018 Performance Drivers
2Q 2018 Earnings | July 31, 2018 | Aptiv17
$ Millions, % of Sales
RAISING FULL YEAR OPERATING INCOME TO REFLECT HIGHER REVENUE OUTLOOK
12.4%
~12.5%
$1,790 –
1,820M
190 bps
(160) bps (10) bps110 bps
(50) bps $1,890 –
1,920M
~13.2%
~13%
(70) bps
1 Adjusted for restructuring and other special items; see appendix for detail and reconciliation to US GAAP
Cash & Balance Sheet Update
2Q 2018 Earnings | July 31, 2018 | Aptiv18
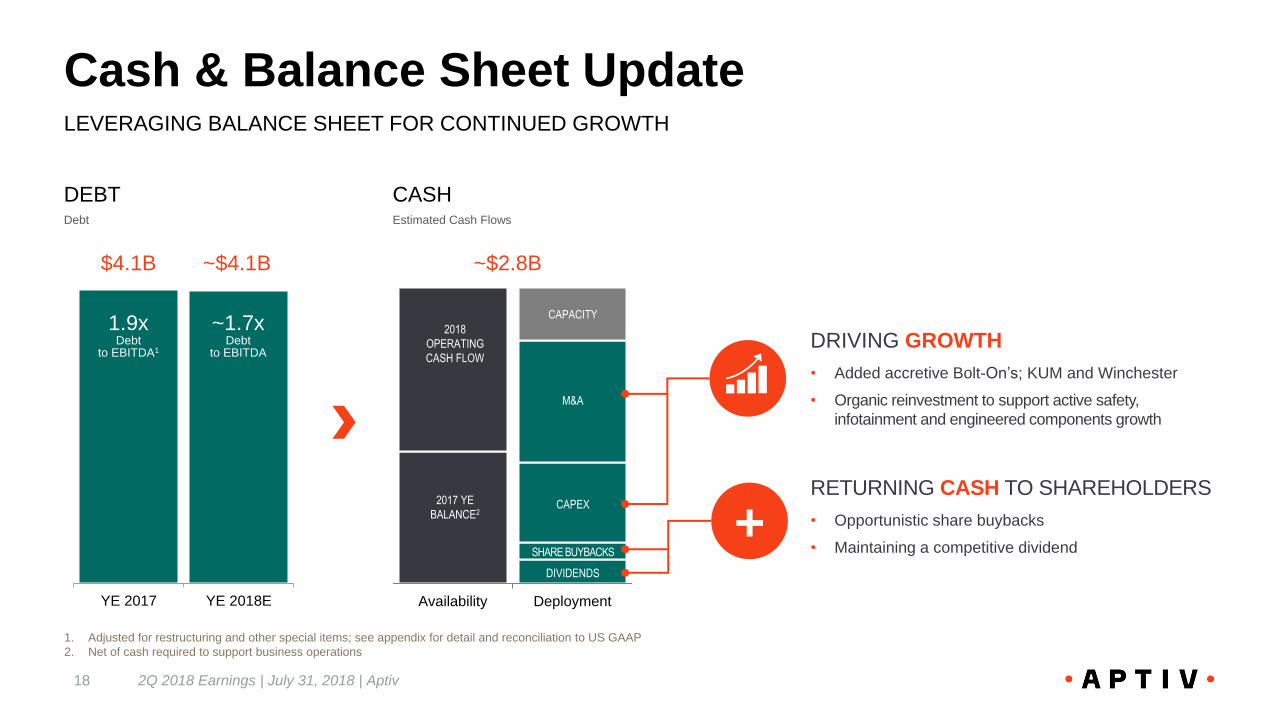
Availability Deployment
2018
OPERATING
CASH FLOW
2017 YE
BALANCE2
CAPACITY
Estimated Cash Flows
M&A
CAPEX
SHARE BUYBACKS
DIVIDENDS
~$2.8B
CASHDEBT
LEVERAGING BALANCE SHEET FOR CONTINUED GROWTH
YE 2017 YE 2018E
$4.1B ~$4.1B
1.9xDebt
to EBITDA1
~1.7xDebt
to EBITDA
1. Adjusted for restructuring and other special items; see appendix for detail and reconciliation to US GAAP
2. Net of cash required to support business operations
+
DRIVING GROWTH
• Added accretive Bolt-On’s; KUM and Winchester
• Organic reinvestment to support active safety,
infotainment and engineered components growth
RETURNING CASH TO SHAREHOLDERS
• Opportunistic share buybacks
• Maintaining a competitive dividend
Debt
Acquisitions Aligned to Aptiv Strategy
2Q 2018 Earnings | July 31, 2018 | Aptiv19
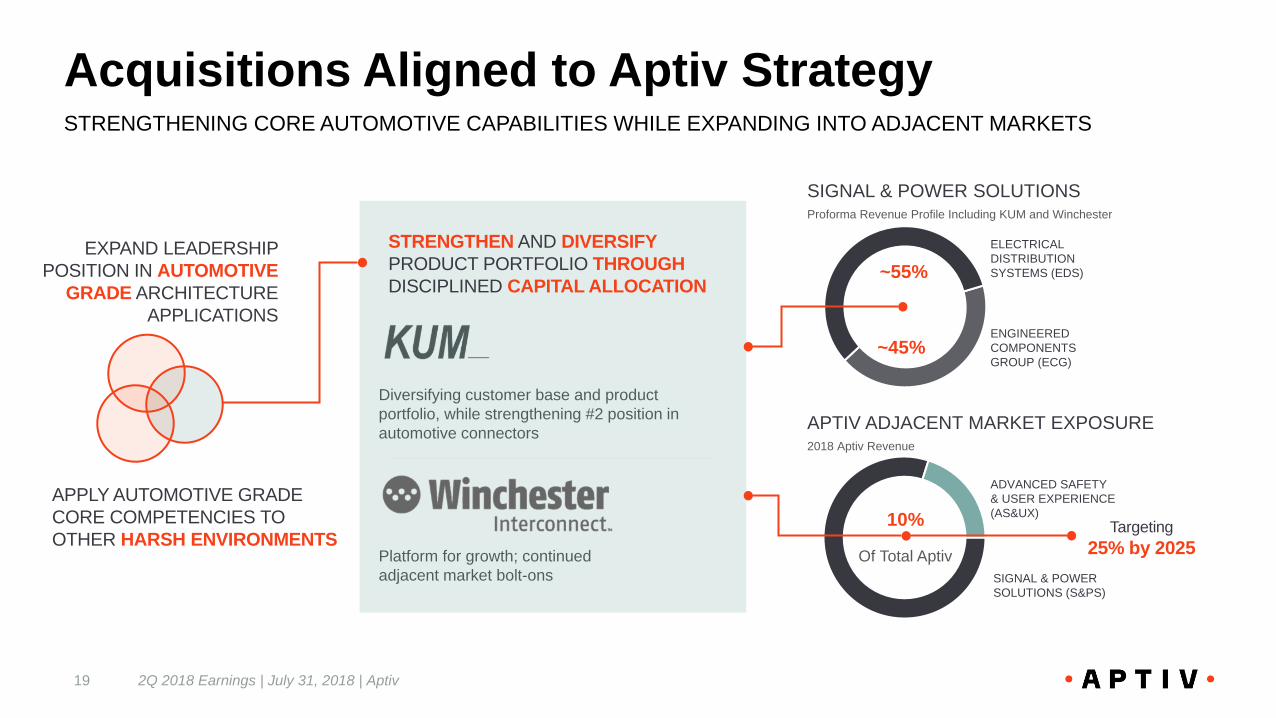
STRENGTHENING CORE AUTOMOTIVE CAPABILITIES WHILE EXPANDING INTO ADJACENT MARKETS
EXPAND LEADERSHIP
POSITION IN AUTOMOTIVE
GRADE ARCHITECTURE
APPLICATIONS
APPLY AUTOMOTIVE GRADE
CORE COMPETENCIES TO
OTHER HARSH ENVIRONMENTS
STRENGTHEN AND DIVERSIFY
PRODUCT PORTFOLIO THROUGH
DISCIPLINED CAPITAL ALLOCATION
Diversifying customer base and product
portfolio, while strengthening #2 position in
automotive connectors
Platform for growth; continued
adjacent market bolt-ons
ENGINEERED
COMPONENTS
GROUP (ECG)
ELECTRICAL
DISTRIBUTION
SYSTEMS (EDS)
SIGNAL & POWER
SOLUTIONS (S&PS)
ADVANCED SAFETY
& USER EXPERIENCE
(AS&UX)10%
Of Total Aptiv
APTIV ADJACENT MARKET EXPOSURE2018 Aptiv Revenue
SIGNAL & POWER SOLUTIONSProforma Revenue Profile Including KUM and Winchester
Targeting
25% by 2025
~55%
~45%
Non-US GAAP Financial Metrics
2Q 2018 Earnings | July 31, 2018 | Aptiv22
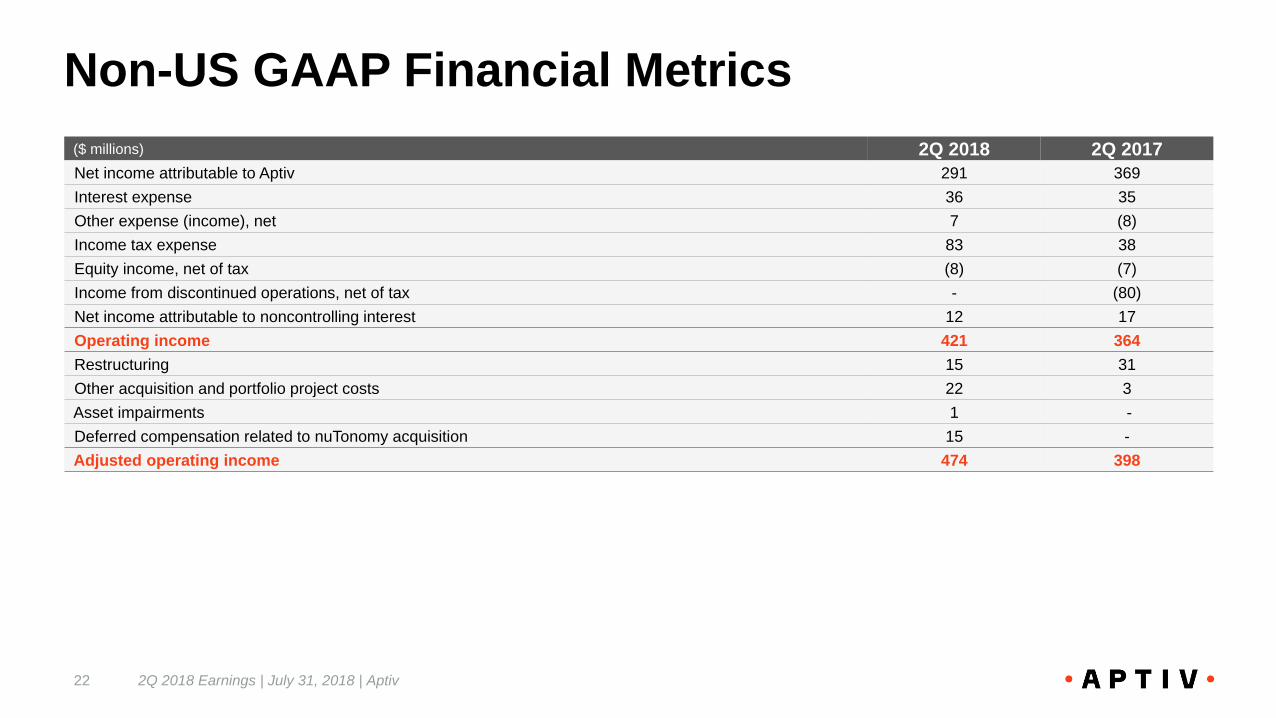
($ millions) 2Q 2018 2Q 2017
Net income attributable to Aptiv 291 369
Interest expense 36 35
Other expense (income), net 7 (8)
Income tax expense 83 38
Equity income, net of tax (8) (7)
Income from discontinued operations, net of tax - (80)
Net income attributable to noncontrolling interest 12 17
Operating income 421 364
Restructuring 15 31
Other acquisition and portfolio project costs 22 3
Asset impairments 1 -
Deferred compensation related to nuTonomy acquisition 15 -
Adjusted operating income 474 398
Non-US GAAP Financial Metrics
23 2Q 2018 Earnings | July 31, 2018 | Aptiv
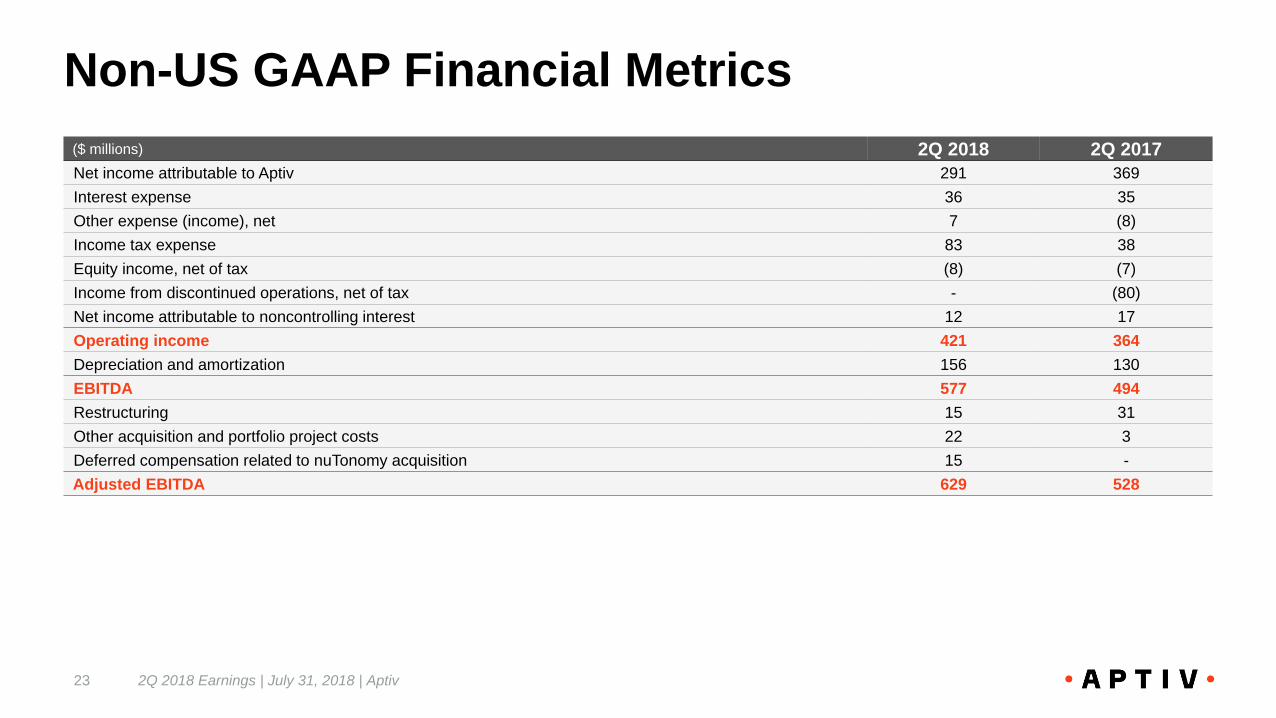
($ millions) 2Q 2018 2Q 2017
Net income attributable to Aptiv 291 369
Interest expense 36 35
Other expense (income), net 7 (8)
Income tax expense 83 38
Equity income, net of tax (8) (7)
Income from discontinued operations, net of tax - (80)
Net income attributable to noncontrolling interest 12 17
Operating income 421 364
Depreciation and amortization 156 130
EBITDA 577 494
Restructuring 15 31
Other acquisition and portfolio project costs 22 3
Deferred compensation related to nuTonomy acquisition 15 -
Adjusted EBITDA 629 528
Non-US GAAP Financial Metrics
24 2Q 2018 Earnings | July 31, 2018 | Aptiv
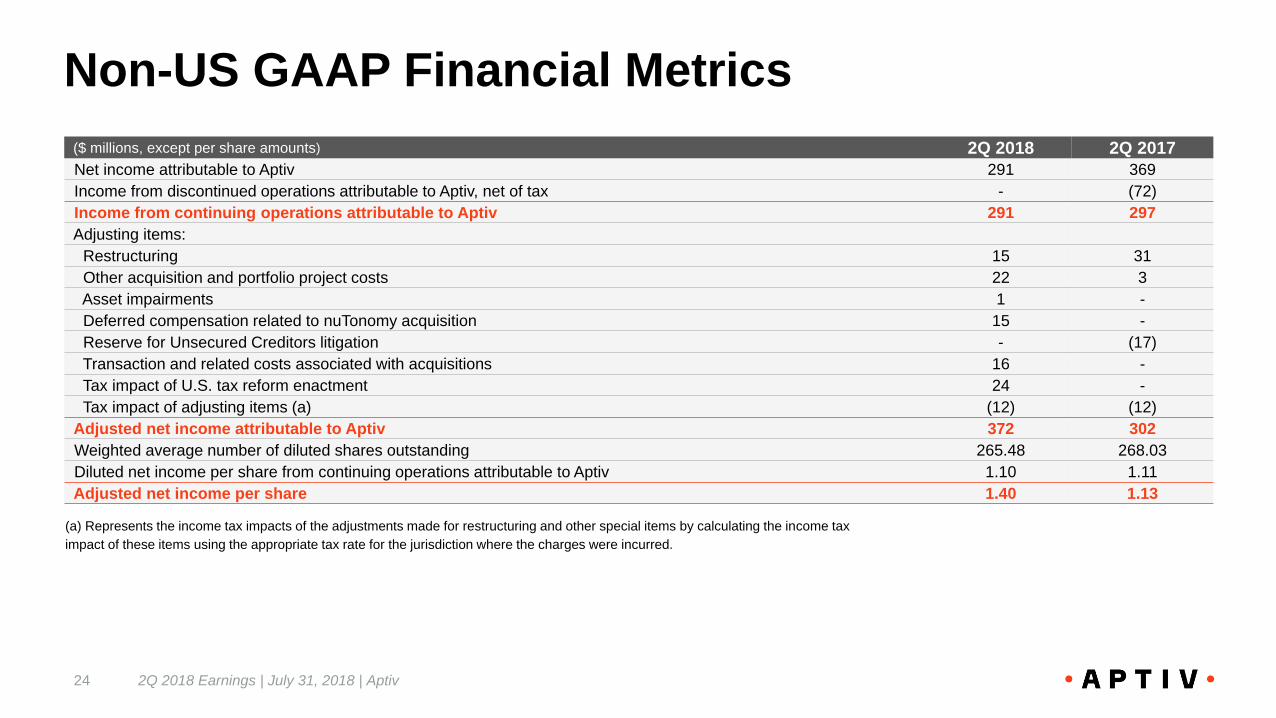
($ millions, except per share amounts) 2Q 2018 2Q 2017
Net income attributable to Aptiv 291 369
Income from discontinued operations attributable to Aptiv, net of tax - (72)
Income from continuing operations attributable to Aptiv 291 297
Adjusting items:
Restructuring 15 31
Other acquisition and portfolio project costs 22 3
Asset impairments 1 -
Deferred compensation related to nuTonomy acquisition 15 -
Reserve for Unsecured Creditors litigation - (17)
Transaction and related costs associated with acquisitions 16 -
Tax impact of U.S. tax reform enactment 24 -
Tax impact of adjusting items (a) (12) (12)
Adjusted net income attributable to Aptiv 372 302
Weighted average number of diluted shares outstanding 265.48 268.03
Diluted net income per share from continuing operations attributable to Aptiv 1.10 1.11
Adjusted net income per share 1.40 1.13
(a) Represents the income tax impacts of the adjustments made for restructuring and other special items by calculating the income tax
impact of these items using the appropriate tax rate for the jurisdiction where the charges were incurred.
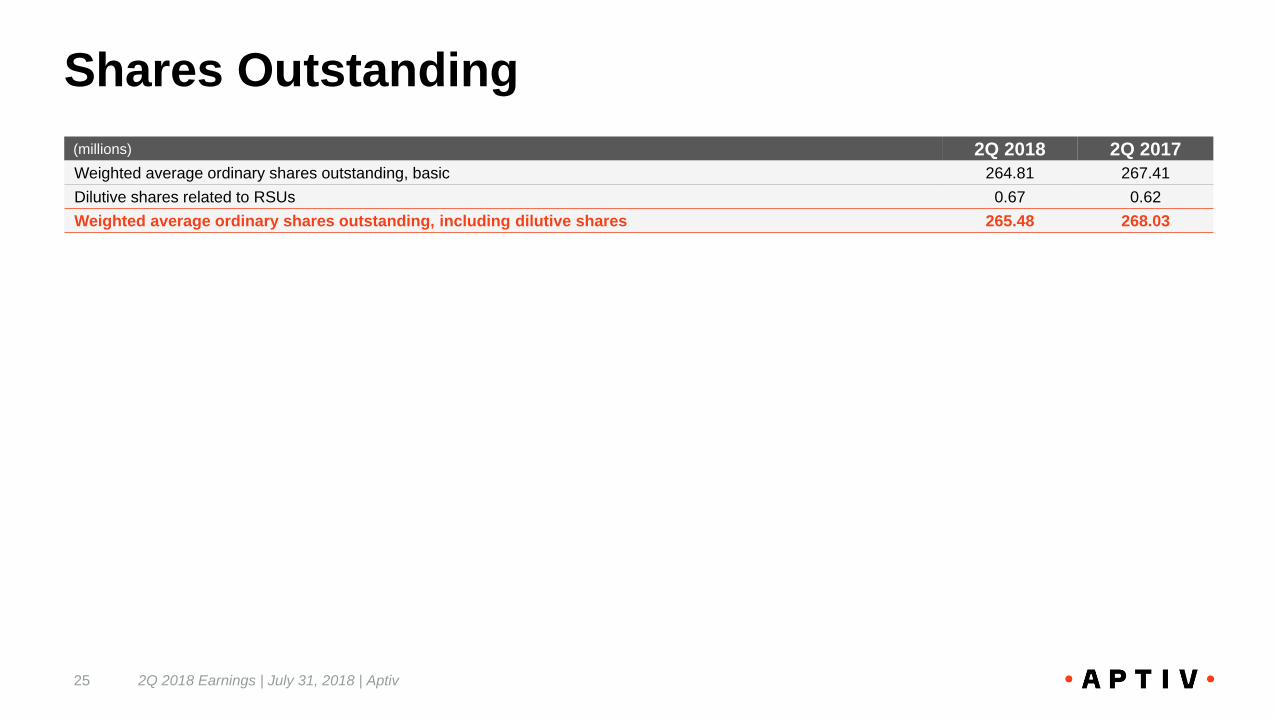
Shares Outstanding
25 2Q 2018 Earnings | July 31, 2018 | Aptiv
(millions) 2Q 2018 2Q 2017
Weighted average ordinary shares outstanding, basic 264.81 267.41
Dilutive shares related to RSUs 0.67 0.62
Weighted average ordinary shares outstanding, including dilutive shares 265.48 268.03
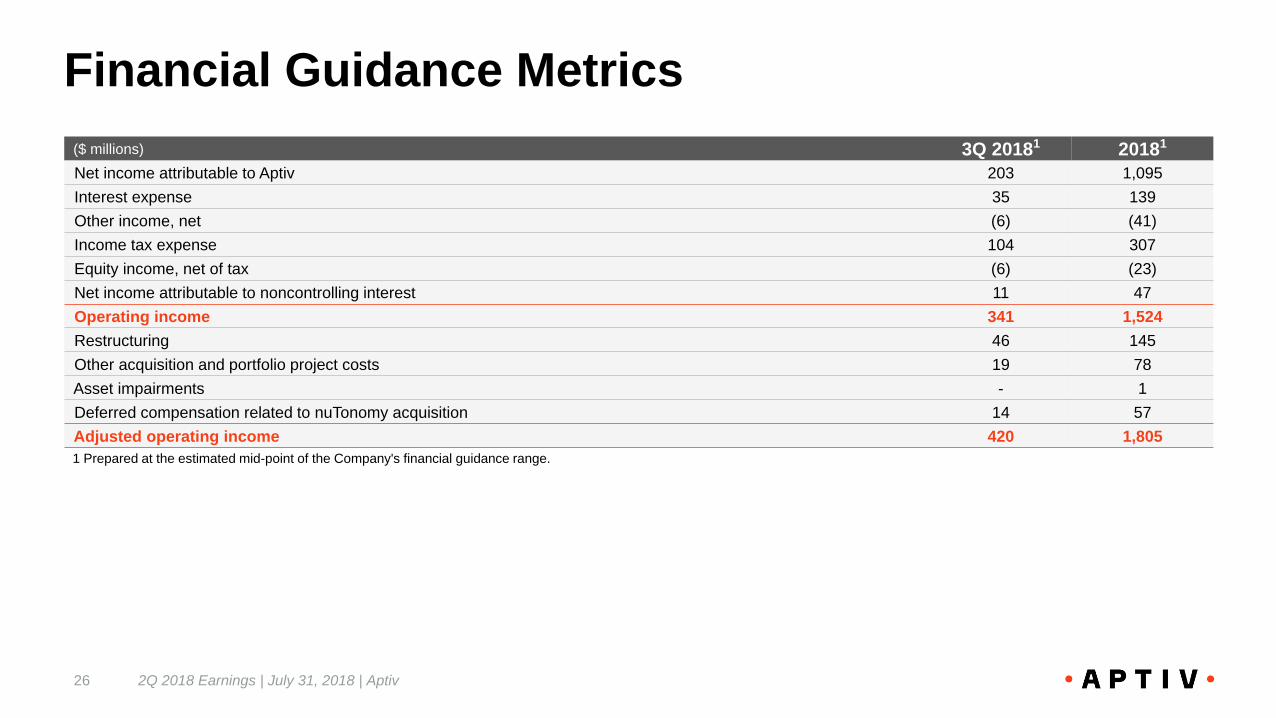
Financial Guidance Metrics
26 2Q 2018 Earnings | July 31, 2018 | Aptiv
($ millions) 3Q 20181 20181
Net income attributable to Aptiv 203 1,095
Interest expense 35 139
Other income, net (6) (41)
Income tax expense 104 307
Equity income, net of tax (6) (23)
Net income attributable to noncontrolling interest 11 47
Operating income 341 1,524
Restructuring 46 145
Other acquisition and portfolio project costs 19 78
Asset impairments - 1
Deferred compensation related to nuTonomy acquisition 14 57
Adjusted operating income 420 1,805
1 Prepared at the estimated mid-point of the Company's financial guidance range.

Financial Guidance Metrics
27 2Q 2018 Earnings | July 31, 2018 | Aptiv
($ millions) 3Q 20181 20181
Net income attributable to Aptiv 203 1,095
Interest expense 35 139
Other income, net (6) (41)
Income tax expense 104 307
Equity income, net of tax (6) (23)
Net income attributable to noncontrolling interest 11 47
Operating income 341 1,524
Depreciation and amortization 170 651
EBITDA 511 2,175
Restructuring 46 145
Other acquisition and portfolio project costs 19 78
Deferred compensation related to nuTonomy acquisition 14 57
Adjusted EBITDA 590 2,455
(a) Represents the income tax impacts of the adjustments made for restructuring and other special items by calculating the income tax
impact of these items using the appropriate tax rate for the jurisdiction where the charges were incurred.

Financial Guidance Metrics
28 Q2 2018 Earnings | July 31, 2018 | Aptiv
($ millions, except per share amounts) 3Q 20181 20181
Net income attributable to Aptiv 203 1,095
Restructuring 46 145
Other acquisition and portfolio project costs 19 78
Asset impairments - 1
Deferred compensation related to nuTonomy acquisition 14 57
Transaction and related costs associated with acquisitions - 5
Tax impact of U.S. tax reform enactment - 24
Tax impact of adjusting items (a) 44 17
Adjusted net income attributable to Aptiv 326 1,422
Weighted average number of diluted shares outstanding 265.65 265.89
Diluted net income per share from continuing operations attributable to Aptiv 0.76 4.12
Adjusted net income per share 1.23 5.35
(a) Represents the income tax impacts of the adjustments made for restructuring and other special items by calculating the income tax
impact of these items using the appropriate tax rate for the jurisdiction where the charges were incurred.
1 Prepared at the estimated mid-point of the Company's financial guidance range.