Embed Size (px)
Citation preview

Second Quarter 2020Earnings Review
December 4, 2019
2
Safe Harbor StatementThis presentation contains certain forward-looking statements concerning the Company’s Fiscal Year 2020 Outlook, Fiscal Year 2022 Target, operations,performance, and financial condition. Reliance should not be placed on forward-looking statements, as actual results may differ materially from those in anyforward-looking statements. Any such forward-looking statements are based upon a number of assumptions and estimates that are inherently subject touncertainties and contingencies, many of which are beyond the control of the Company and are subject to change based on many important factors. Suchfactors include, but are not limited to (i) the level of investment in new technologies and products; (ii) subscriber renewal rates for the Company's journals; (iii)the financial stability and liquidity of journal subscription agents; (iv) the consolidation of book wholesalers and retail accounts; (v) the market position andfinancial stability of key online retailers; (vi) the seasonal nature of the Company's educational business and the impact of the used book market; (vii) worldwideeconomic and political conditions; (viii) the Company's ability to protect its copyrights and other intellectual property worldwide (ix) the ability of the Companyto successfully integrate acquired operations and realize expected opportunities; (x) achievement of targeted run rate savings through restructuring actions; (xi)and other factors detailed from time to time in the Company's filings with the Securities and Exchange Commission. The Company undertakes no obligation toupdate or revise any such forward-looking statements to reflect subsequent events or circumstances
Non-GAAP MeasuresIn this presentation, management provides the following non-GAAP performance measures:• Adjusted Earnings Per Share (“Adjusted EPS”);• Free Cash Flow less Product Development Spending;• Adjusted Revenue;• Adjusted Operating Income and margin;• Adjusted Contribution to Profit (“Adjusted CTP”) and margin;• Adjusted EBITDA;• Organic revenue; and• Results on a constant currency (“CC”) basis.
Management believes non-GAAP financial measures, which exclude the impact of restructuring charges and credits and other items, provide supplementary information to support analyzing operating results and earnings and are commonly used by shareholders to measure our performance. Free Cash Flow less Product Development Spending helps assess our ability over the long term to create value for our shareholders. Results on a constant currency basisremoves distortion from the effects of foreign currency movements to provide better comparability of our business trends from period to period. We measure our performance before the impact of foreign currency (or at “constant currency” “CC”), which means that we apply the same foreign currency exchange rates for the current and equivalent prior period. We have not provided our 2020 outlook, or 2022 Target for the most directly comparable U.S. GAAP financial measures, as they are not available without unreasonable effort due to the high variability, complexity, and low visibility with respect to certain items, including restructuring charges and credits, gains and losses on foreign currency, and other gains and losses. These items are uncertain, depend on various factors, and could be material to our results computed in accordance with U.S. GAAP.

Executive SummaryBrian Napack, President and CEO

4
WILEY RESEARCHDriving the discovery, usage and impact of scholarly research
Research Publishing & Platforms
WILEY EDUCATIONEnabling powerful learning for personal and professional growth
Academic & Professional Learning
EducationServices
Driving the world forward with Research and Education
Researchers Learners Institutions Corporations
• Growing publishing output and driving efficiency
• Strongest research market growth since 20111
• Focus on courseware for high-
demand skills and careers
• Growing corporate training
• Market-driven book declines2
• Driving new partnerships,
programs and offerings
• Ed Services (OPX) to reach
nearly $8B by 20253
1 Simba Report – Oct 2019 2 Public filings – Fall 20193 HolonIQ Report – September 2019

5
10,000+
Research institutions
600+
Scientificsocieties
60+
Service partner universities
1,000+
Corporate partners
4M+
Societymembers
16M+
Researcheraudience
Millions
Students
Millions
Professionals
WILEY RESEARCH WILEY EDUCATIONGLOBAL NETWORK
Driving the world forward with Research and Education

6
Second Quarter Key Takeaways
Revenue
+5%*
$466M
Adj. EBITDA
+3%*
$110M
Adj. EPS
-1%*
$0.85
• Strong revenue growth and improved profitability in Research and Education Services
• Academic & Professional Learning down on market-driven declines in book publishing
• Investments gaining traction in key strategic areas
— Research: increasing publishing volume and operating efficiency
— Academic & Professional: shifting to high-impact courseware and high demand careers
— Education Services: expanding beyond core OPM services and driving efficiency
• Modest Adjusted EPS decline from investments in growth and optimization
*At constant currency. Revenue up 4% as reported. Revenue down 1% excluding acquisitions.
GAAP EPS
+4%
$0.79
7
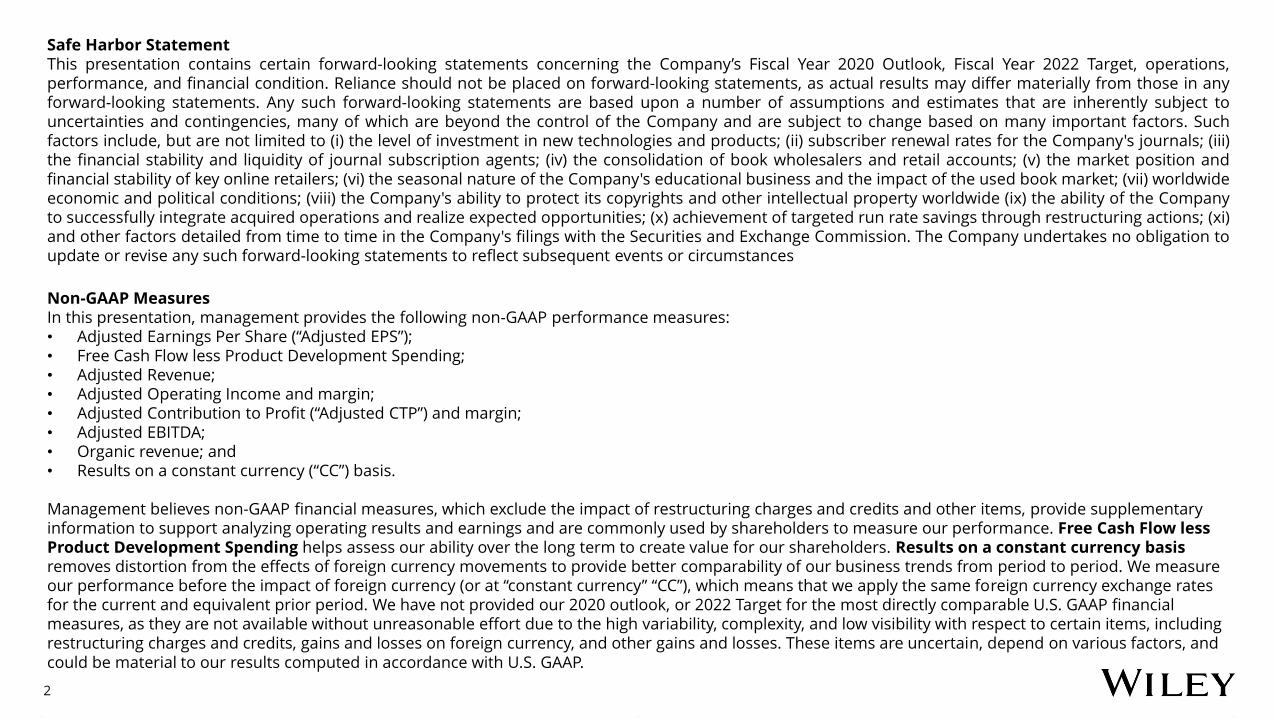
• Revenue growth (+4%) driven by increased publishing volume
• Research publishing demand strong, with steady growth in articles submitted and content usage
• CY20 society publishing net wins +$8M
• EBITDA improvement from revenue growth and optimization gains
Research Publishing & PlatformsSolid revenue and earnings growth; favorable market fundamentals
Article Submissions
+9%
Revenue +4%
$235M
Adj. EBITDA+6%
$81M
Online Platform Sessions
3.3BChange at constant currency. Revenue +2% as reported.
Q2’20 Trailing Twelve Months
Nobel Laureates
12
Fall 2019

8
Enhancing our value proposition for researchersDelivering new tools and support services for an enhanced researcher experience
November
Author Promotion Services
September
Author Collaboration Platform
Research Filtering Tool
Research Insights Platform
Days to Publish-40%
From acceptance to publicationSept 2019 vs. Sept 2018
Researcher Community16 million
October

9
• Declines due to weak market conditions in book publishing
• Growth in test prep and corporate training
• zyBooks and Knewton integrations on track
• EBITDA impacted by revenue decline and growth investments, including recent acquisitions
Academic & Professional Learning Market-driven declines in book publishing; shifting courseware investment to high-demand careers
Corporate Partners
+10
Revenue -5%
$178M
Adj. EBITDA-19%$53M
Change at constant currency
Revenue at constant currency down 9% excluding acquisitions, down 6% as reported
Q2’20 Q2’20
+11
Brandon Hall AwardsTest Prep Revenue
+15%
Q2’20
10
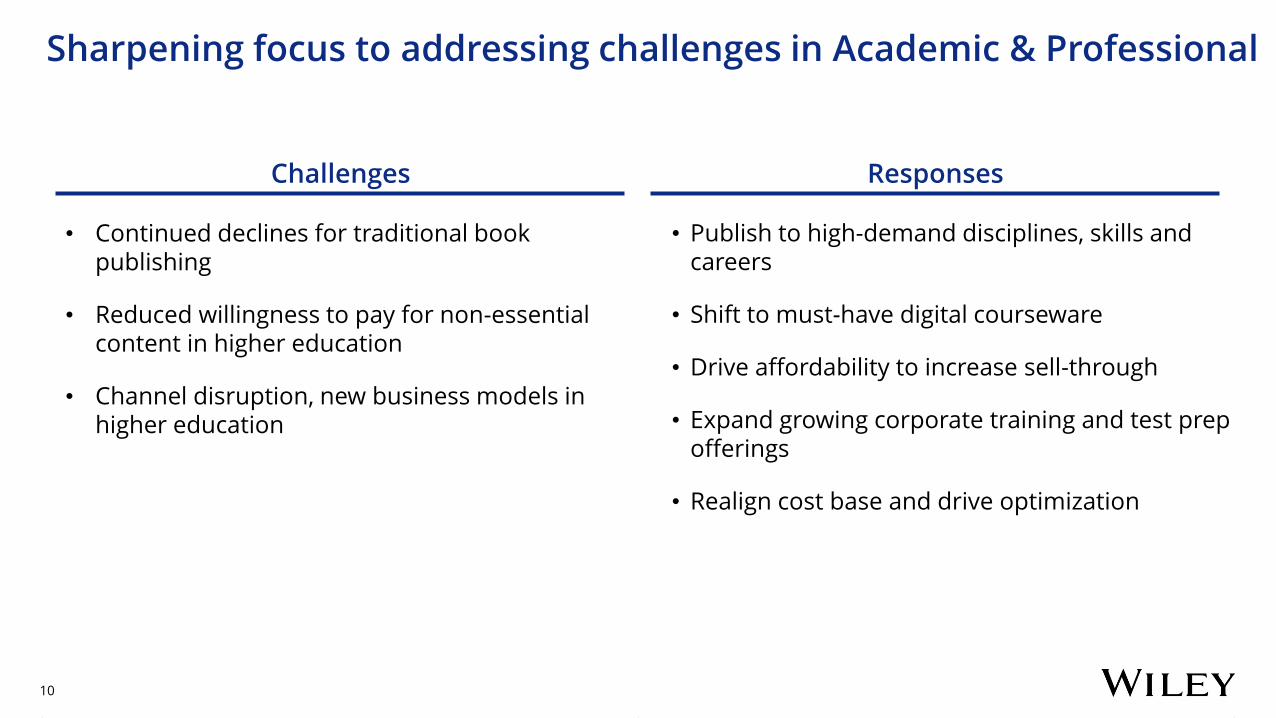
Sharpening focus to addressing challenges in Academic & Professional
Challenges Responses
• Publish to high-demand disciplines, skills and careers
• Shift to must-have digital courseware
• Drive affordability to increase sell-through
• Expand growing corporate training and test prep offerings
• Realign cost base and drive optimization
• Continued declines for traditional book publishing
• Reduced willingness to pay for non-essential content in higher education
• Channel disruption, new business models in higher education

11
• Revenue performance from strong organic growth and inorganic contribution from Learning House (acquired Q3 Fiscal 2019)
• Robust growth in targeted service offerings, international online programs, and career credentialing
• Adjusted EBITDA growth due to organic revenue growth and timing of expenses
Education ServicesStrong revenue growth and EBITDA improvement
+9%
Revenue +80%$54M
Adj. EBITDA+208%
$8M
Enrollments Total OPM Partners
65
Q2’20 As of Q2 close
Organic Growth
10%
Q2’20
Change at constant currency.
Revenue at constant currency up 10% organically

12
Building momentum beyond OPM core
Targeted ServiceOfferings
InternationalPrograms
Career CredentialingServices
Full OPM Services
90% of Revenue 10% of Revenue
Strong double-digit growth
Wiley Education Services Offerings
Low-to-mid teens growth

Financial SummaryJohn Kritzmacher, CFO and EVP, Operations
13

14 14
Q2’19 Q2’20
$466$449
Revenue GAAP EPS Adjusted EPS Adjusted EBITDA
Q2’19 Q2’20Q2’19 Q2’20 Q2’19Q2’20
$107 $110$0.89$0.79$0.76
$0.85
Second Quarter 2020 Summary
+5%* +3%*+4% -1%*
*at constant currency
Revenue at constant currency and excluding impact of acquisitions was -1%. Revenue +4% as reported
Includes $0.07 of favorable variance impact from restructuring charges
15 15
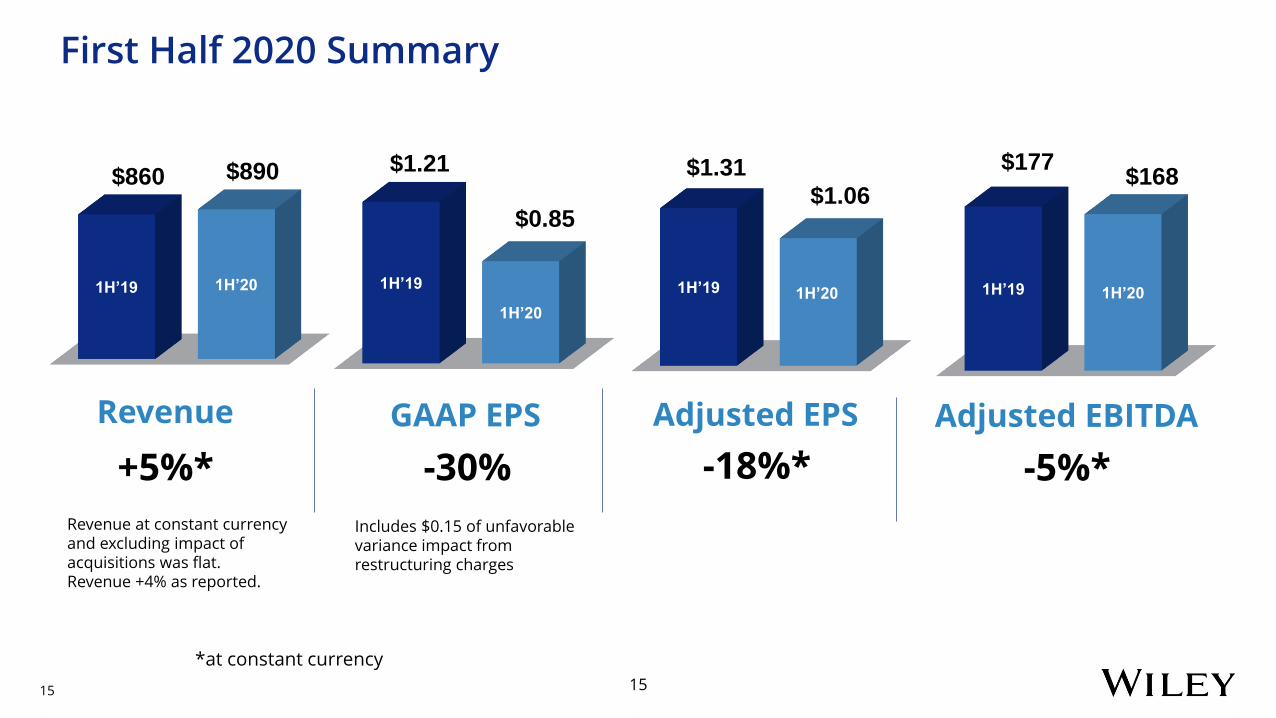
1H’19 1H’20
$890$860
Revenue Adjusted EBITDA
1H’19 1H’20
$177$168
First Half 2020 Summary
+5%* -5%*
GAAP EPS Adjusted EPS
1H’19
1H’20
1H’19 1H’20
$1.31
$0.85
$1.21
$1.06
-30% -18%*
Revenue at constant currency and excluding impact of acquisitions was flat. Revenue +4% as reported.
Includes $0.15 of unfavorable variance impact from restructuring charges
*at constant currency

16
• YTD Operating Cash Flow improvement +$17M,
Free Cash Flow +$7M; historically a use of cash in
first half of fiscal year
• Modest leverage and strong liquidity position
Net Debt / EBITDA at 1.8, inclusive of acquisitions
and seasonally high working capital needs. In
excess of $800M liquidity available in cash and
undrawn debt facilities
• Strong and consistent track record of returning
cash to shareholders, including 1H share
repurchases of $25M
1H19 1H20
Dividends and Share Repurchases
$63M $63M
Free Cash Flow
1H19 1H20 Change
($163M) ($156M) +$7M
Free Cash Flow and Return to Shareholders

17
FY19 Actual FY20 Outlook*
Revenue $1.80B $1.855B-$1.885B
Adjusted EBITDA $388M $357-$372M
Adjusted EPS $2.96 $2.35-$2.45
Free Cash Flow $149M $210M - $230M
*Outlook is at constant currency (reflecting FY19 average exchange rates) and includes contributions from to-date acquisitions
Full Year Outlook Reaffirmed

18
Second Quarter 2020 Summary
• Strong revenue growth and improved profitability in Research and Education Services
• Academic & Professional Learning down on market-driven declines in book publishing
• Investments gaining traction in key strategic areas
— Research: increasing publishing volume and operating efficiency
— Academic & Professional: to high-impact courseware and high demand careers
— Education Services: expanding beyond core OPM services and driving efficiency
• Modest Adjusted EPS decline from investments in growth and optimization
• Full year guidance reaffirmed
19
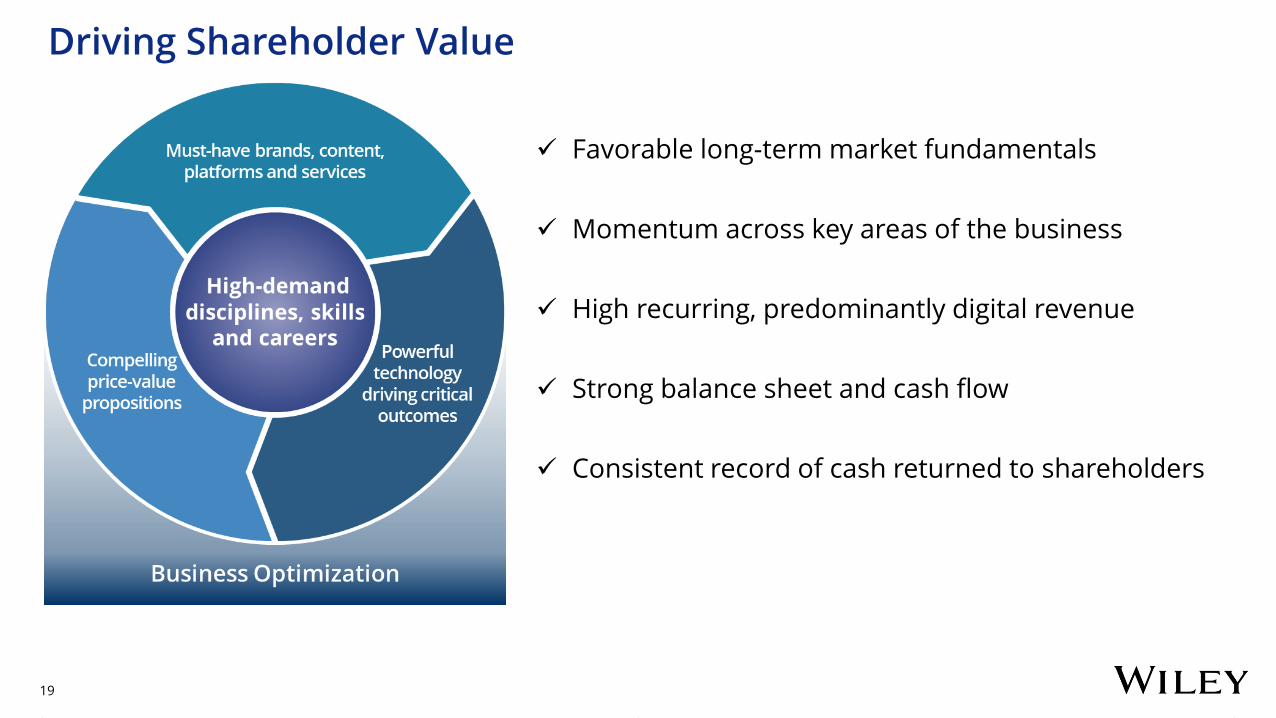
Driving Shareholder Value
✓ Favorable long-term market fundamentals
✓ Momentum across key areas of the business
✓ High recurring, predominantly digital revenue
✓ Strong balance sheet and cash flow
✓ Consistent record of cash returned to shareholders

20
Thank you for joining us
Replay of October Investor Day available on wiley.com>About Us>Investors
Contact for follow-up:[email protected]

21
APPENDIX

22
Appendix
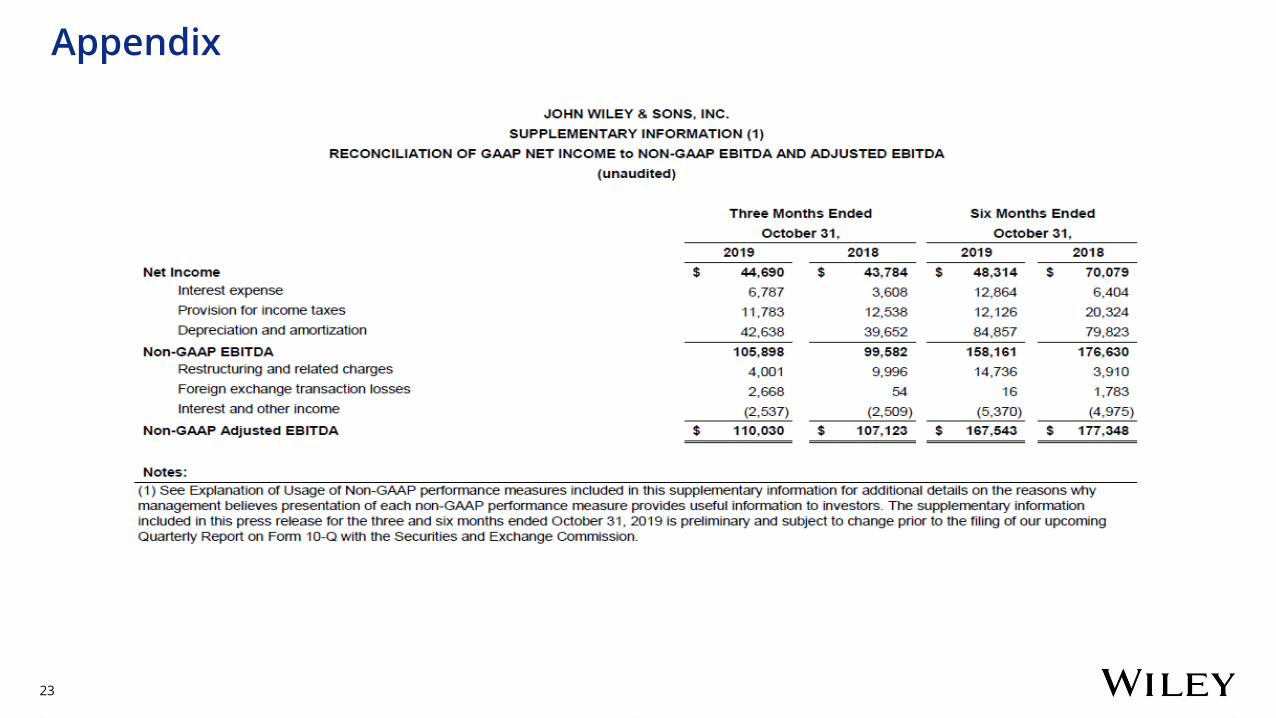
23
Appendix