Embed Size (px)
Citation preview

Supporting healthcareprofessionals for over 150 yearsSupporting healthcareprofessionals for over 150 years
1
Second Quarter and First Half 2018 Results

Forward looking statements and non-IFRS measures
This document may contain forward-looking statements that may or may not prove accurate. For example, statements regarding expected revenue growth andtrading margins, market trends and our product pipeline are forward-looking statements. Phrases such as "aim", "plan", "intend", "anticipate", "well-placed","believe", "estimate", "expect", "target", "consider" and similar expressions are generally intended to identify forward-looking statements. Forward-lookingstatements involve known and unknown risks, uncertainties and other important factors that could cause actual results to differ materially from what is expressedor implied by the statements. For Smith & Nephew, these factors include: economic and financial conditions in the markets we serve, especially those affectinghealth care providers, payers and customers; price levels for established and innovative medical devices; developments in medical technology; regulatoryapprovals, reimbursement decisions or other government actions; product defects or recalls or other problems with quality management systems or failure tocomply with related regulations; litigation relating to patent or other claims; legal compliance risks and related investigative, remedial or enforcement actions;disruption to our supply chain or operations or those of our suppliers; competition for qualified personnel; strategic actions, including acquisitions anddispositions, our success in performing due diligence, valuing and integrating acquired businesses; disruption that may result from transactions or other changeswe make in our business plans or organisation to adapt to market developments; and numerous other matters that affect us or our markets, including those of apolitical, economic, business, competitive or reputational nature. Please refer to the documents that Smith & Nephew has filed with the U.S. Securities andExchange Commission under the U.S. Securities Exchange Act of 1934, as amended, including Smith & Nephew's most recent annual report on Form 20-F, for adiscussion of certain of these factors. Any forward-looking statement is based on information available to Smith & Nephew as of the date of the statement. Allwritten or oral forward-looking statements attributable to Smith & Nephew are qualified by this caution. Smith & Nephew does not undertake any obligation toupdate or revise any forward-looking statement to reflect any change in circumstances or in Smith & Nephew's expectations.
Certain items included in ‘trading results’, such as trading profit, trading profit margin, tax rate on trading results, trading cash flow, trading profit to cashconversion ratio, EPSA and underlying growth are non-IFRS financial measures. The non-IFRS financial measures in this announcement are explained andreconciled to the most directly comparable financial measure prepared in accordance with IFRS in our Second Quarter and First Half 2018 Results announcementdated 26 July 2018.
2

Chief Executive OfficerNamal Nawana
3

Initial thoughts: A portfolio medical device company
4
Sports Medicine Joint Repair
Arthroscopic Enabling Technologies
Trauma and Extremities
Other Surgical Businesses
Knees
Hips
AWC
AWBAWD
H1 2018 revenue split
6%
15%
4%
13%
21%
4%
10%
13%
14%
Second Quarter and First Half 2018 Results

Initial thoughts:Our leading medical technologies
5
Emerging
INTERTAN™
WEREWOLF™
REGENETEN™
PICO™ 7
REDAPT™
POLARSTEM™
JOURNEY™ II BCS
NAVIO™
ALLEVYN™ LIFE

Initial thoughts:Improving how we do business
6
Creating a purpose-driven culture
Commercial model
Operating model
• Focus more on lead products• Provide leadership in each category• A more customer centric approach
• Faster, more streamlined decision making• First steps taken to new leadership structure• Take complexity and costs out – deliver on APEX

9%
-6%
2%
1%
3%
8%
-5%
-1%
8%
-10% 0% 10%
Q2 revenue of $1,245m; 4% reported growth, 2% underlying
‘Other Est’ is Australia, Canada, Europe, Japan and New Zealand ‘Other Surgical’ includes ENT and robotics sales (excluding implant sales)
Emerging
Other Est
US
6%
1%
1%
0% 5% 10%
AWB
AWD
AWC
Hips
Knees
Other surgical
Trauma & Extremities
Arthroscopic Enabling Tech
Sports Medicine
Joint Repair
7All revenue growth rates in the presentation are on an underlying basis and without adjustment for number of selling days, unless otherwise stated
Geographical growth Revenue split Product franchise growth

Sports Medicine, Trauma & OSB
Q2 revenue performance• Sports Medicine Joint Repair +8% ($173m)
• Arthroscopic Enabling Technologies (AET) -1% ($153m)
• Trauma & Extremities -5% ($122m)
• Other Surgical Businesses* +8% ($54m)
Commentary• REGENETEN™ (Rotation Medical) performing strongly
in shoulder repair
• AET improving, focus on driving WEREWOLF™ COBLATION™
• Trauma decline reflects Middle East tender order in Q2 2017
* ‘Other Surgical Businesses’ includes ENT and robotics sales (excluding implant sales)
EVOS™ SMALLPlating System
8

Reconstruction
Q2 revenue performance• Knees: global +3%, US +1%, OUS +6% ($258m)
• Hips: global +1%, US +4%, OUS -1% ($156m)
Commentary• Knees growth driven by JOURNEY II™, LEGION™ and ANTHEM™ systems
• Renewed focus on POLAR3™ total hip solution and leadingsurvivorship data
9
POLAR3™ Total Hip Solution
Advanced Wound Management
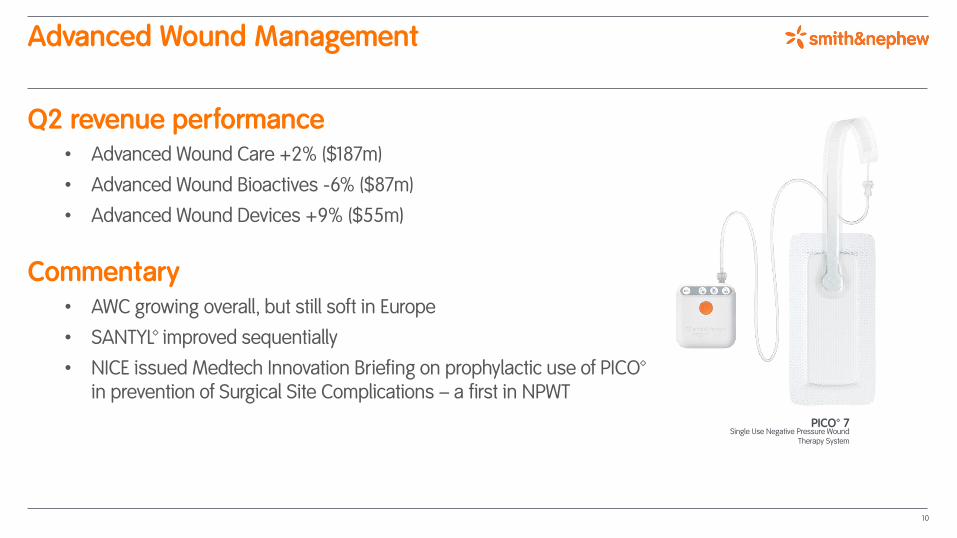
Q2 revenue performance• Advanced Wound Care +2% ($187m)
• Advanced Wound Bioactives -6% ($87m)
• Advanced Wound Devices +9% ($55m)
Commentary• AWC growing overall, but still soft in Europe
• SANTYL™ improved sequentially
• NICE issued Medtech Innovation Briefing on prophylactic use of PICO™in prevention of Surgical Site Complications – a first in NPWT
PICO™ 7Single Use Negative Pressure Wound
Therapy System
10

SVP Group FinanceIan Melling
11

H1 trading income statement
12
Half Year
2018$m
2017$m
Revenue 2,440 2,336
Cost of goods sold (651) (603)
Gross profit 1,789 1,733
Gross profit margin 73.3% 74.2%
Selling, general and admin (1,168) (1,133)
Research and development (114) (107)
Trading profit 507 493
Trading profit margin 20.8% 21.1%
1% underlying growth
30bps decline

H1 EPSA and EPS
13
Half Year
2018$m
2017$m
Growth
Trading profit 507 493 3%
Net interest payable (25) (25)
Other finance costs (7) (4)
Share of results from associate 2 -
Adjusted profit before tax 477 464 3%
Taxation on trading result (96) (88)
Adjusted attributable profit 381 376 1%
Weighted average number of shares (m) 873 874
Adjusted earnings per share ("EPSA") 43.7¢ 43.0¢ 2%
Earnings per share ("EPS") 31.4¢ 37.0¢ (15%)
Interim dividend: 14 cents (+14%)
Tax rate(1): 20.1% (H1 2017: 19.0%)
(1) Tax rate on trading result

H1 free cash flow
14
Half Year
2018$m
2017$m
Trading profit 507 493
Share based payment 18 15
Depreciation and amortisation 171 154
Capital expenditure (178) (178)
Movements in working capital and other (131) (157)
Trading cash flow 387 327
Trading cash conversion 76% 66%
Restructuring, acquisition, legal & other (147) (67)
Net interest paid (26) (25)
Taxation paid (95) (62)
Free cash flow 119 173
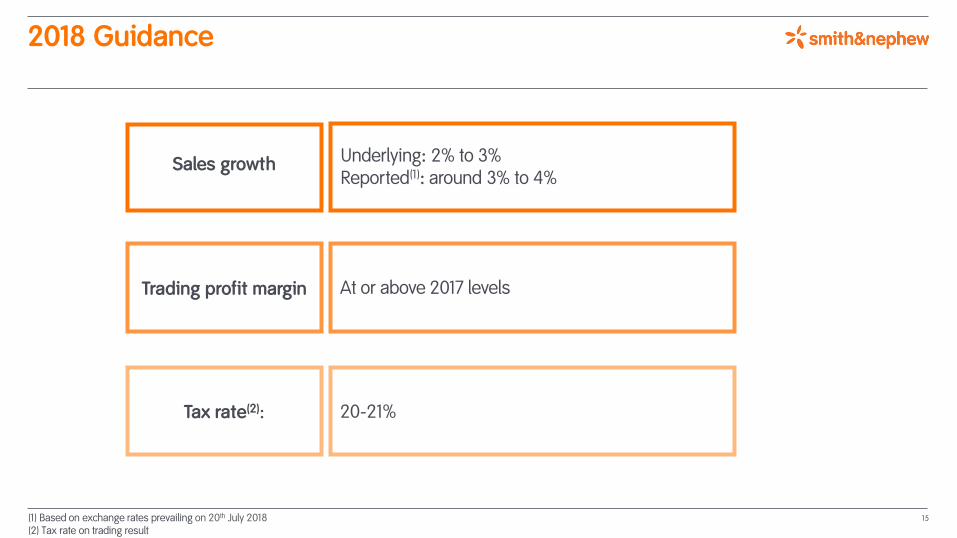
2018 Guidance
15(1) Based on exchange rates prevailing on 20th July 2018 (2) Tax rate on trading result
Sales growth
At or above 2017 levels
20-21%
Underlying: 2% to 3%Reported(1): around 3% to 4%
Trading profit margin
Tax rate(2):

Summary

Appendices
17

2018 technical guidance
July 2018
Foreign exchange and other revenue impact
Impact of translational FX* on revenue +1.1%
Acquisition impact on revenue +0.3%
Exceptional items
Restructuring costs c. $100m
Acquisition and integration costs c. $5m
European Medical Device Regulation (MDR) compliance costs $20m-$30m
Other
Amortisation of acquisition intangibles c. $110m
Income from associates c. $5m
Net interest $51m - $55m
Other finance costs c. $15m
Tax rate on trading result 20-21%
* Based on the foreign exchange rates prevailing on 20th July 2018 18

H1 IFRS reconciliation
19
Half year
2018$m
2017$m
Growth
Trading profit 507 493 3%
Trading profit margin 20.8% 21.1% (30bps)
Acquisition related costs (2) (2)
Restructuring and rationalisation (58) -
Amortisation of acquisition intangibles (57) (65)
Legal and other items (18) (12)
IFRS Operating profit 372 414 (10%)
Operating profit margin 15.3% 17.7% (240bps)

Franchise revenue analysis
2017 2018
Q1 Q2 Q3 Q4FullYear
Q1 Q2
Growth Growth Growth Growth Growth Growth Revenue Growth
% % % % % % $m %
Sports Medicine, Trauma & OSB 4 3 2 2 3 1 502 2
Sports Medicine Joint Repair 7 5 8 6 6 6 173 8
Arthroscopic Enabling Technologies
(1) (4) (3) (3) (3) (5) 153 (1)
Trauma & Extremities 5 7 (2) 5 4 (2) 122 (5)
Other Surgical Businesses 7 11 6 4 7 9 54 8
Reconstruction 3 2 4 4 3 0 414 3
Knee Implants 5 4 6 6 5 2 258 3
Hip Implants 0 (1) 1 1 0 (2) 156 1
Advanced Wound Management 1 3 2 0 2 (2) 329 1
Advanced Wound Care 1 2 (1) (3) 0 0 187 2
Advanced Wound Bioactives (8) 0 7 0 0 (12) 87 (6)
Advanced Wound Devices 16 14 8 14 13 2 55 9
Group 3 3 3 2 3 0 1,245 2
All revenue growth rates are on an underlying basis and without adjustment for number of selling days 20

Regional revenue analysis
2017 2018
Q1 Q2 Q3 Q4FullYear
Q1 Q2
Growth Growth Growth Growth Growth Growth Revenue Growth
% % % % % % $m %
Geographic regions
US 1 2 2 1 2 (2) 590 1
Other Established Markets 1 (1) 0 (1) 0 (2) 429 1
Established Markets 1 1 1 0 1 (2) 1,019 1
Emerging Markets 12 13 9 14 12 9 226 6
Group 3 3 3 2 3 0 1,245 2
‘Other Established Markets’ is Australia, Canada, Europe, Japan and New Zealand. All revenue growth rates are on an underlying basis and without adjustment for number of selling days
21

6%
-8%
1%
0%
3%
9%
-3%
-3%
7%
-10% 0% 10%
H1 revenue of $2,440m; 4% reported growth, 1% underlying
‘Other Est’ is Australia, Canada, Europe, Japan and New Zealand ‘Other Surgical’ includes ENT and robotics sales (excluding implant sales)
Emerging
Other Est
US
8%
0%
-1%
-5% 0% 5% 10%
AWB
AWD
AWC
Hips
Knees
Other surgical
Trauma & Extremities
Arthroscopic Enabling Tech
Sports Medicine
Joint Repair
22All revenue growth rates in the presentation are on an underlying basis and without adjustment for number of selling days, unless otherwise stated
Geographical growth Revenue split Product franchise growth

Trading days per quarter
• Year-on-year differences in the number of trading days typically impacts our surgical businesses in the Established Markets more than our wholesaler and distributor-supported businesses. • We define trading days as week days adjusted for significant holidays in our principal countries.
Q1 Q2 Q3 Q4 Full Year
2016 64 64 63 60 251
2017 64 63 63 60 250
2018 63 64 63 61 251
23