Embed Size (px)
Citation preview
Second quarter
and half year results 2020
ams
Alexander Everke, CEO
Ingo Bank, CFO
Moritz M. Gmeiner, Head of IR
July 2020
Vision for ams/OSRAM
Create the uncontested leader in optical solutions
Sensing Illumination Visualization
© ams AG
Page 2
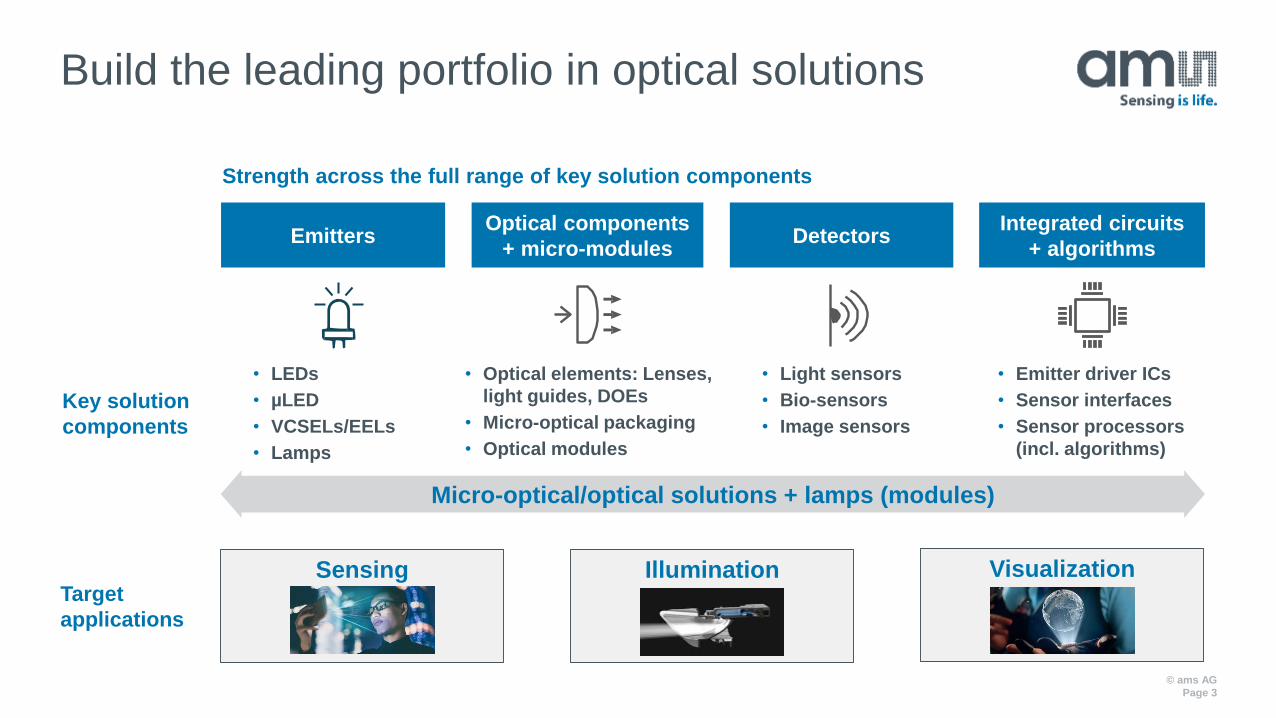
Build the leading portfolio in optical solutions
EmittersIntegrated circuits
+ algorithms
Optical components
+ micro-modulesDetectors
Key solution
components
• LEDs
• µLED
• VCSELs/EELs
• Lamps
• Optical elements: Lenses,
light guides, DOEs
• Micro-optical packaging
• Optical modules
• Light sensors
• Bio-sensors
• Image sensors
• Emitter driver ICs
• Sensor interfaces
• Sensor processors
(incl. algorithms)
Micro-optical/optical solutions + lamps (modules)
Sensing Illumination VisualizationTarget
applications
Strength across the full range of key solution components
© ams AG
Page 3
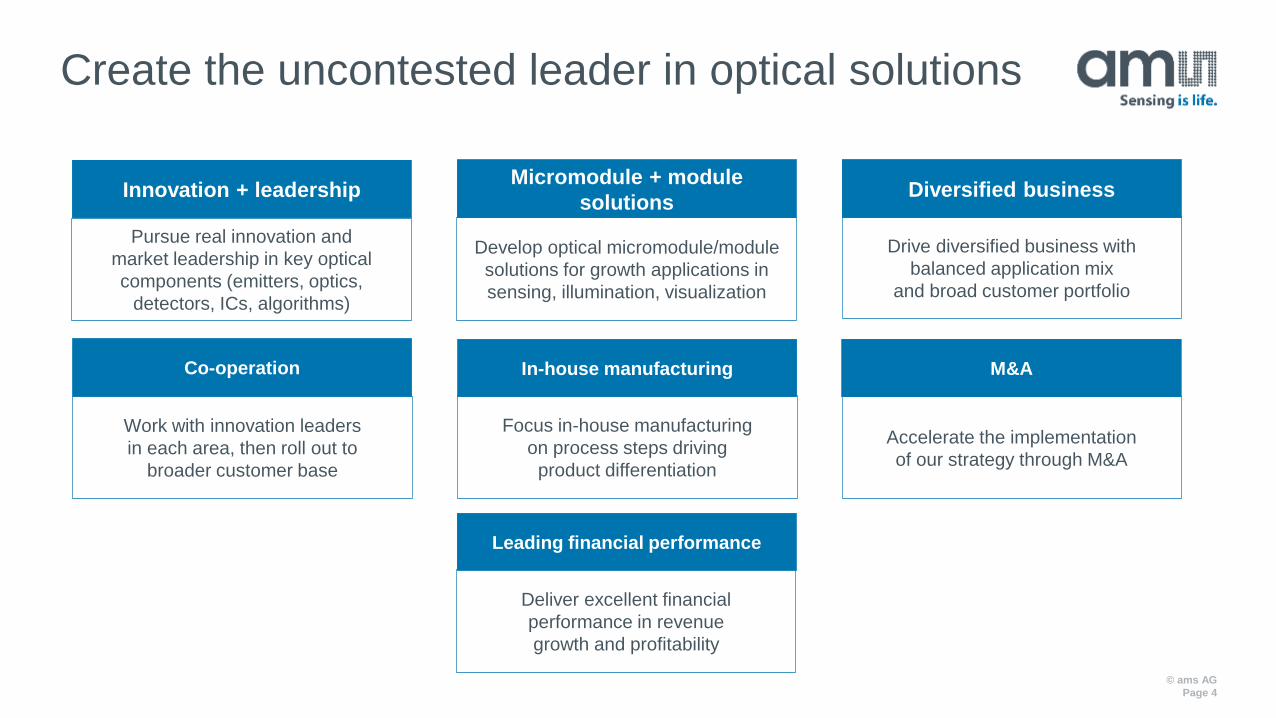
Create the uncontested leader in optical solutions
Innovation + leadership
Pursue real innovation and
market leadership in key optical
components (emitters, optics,
detectors, ICs, algorithms)
Micromodule + module
solutions
Develop optical micromodule/module
solutions for growth applications in
sensing, illumination, visualization
Diversified business
Drive diversified business with
balanced application mix
and broad customer portfolio
Co-operation
Work with innovation leaders
in each area, then roll out to
broader customer base
In-house manufacturing
Focus in-house manufacturing
on process steps driving
product differentiation
M&A
Accelerate the implementation
of our strategy through M&A
Leading financial performance
Deliver excellent financial
performance in revenue
growth and profitability
© ams AG
Page 4
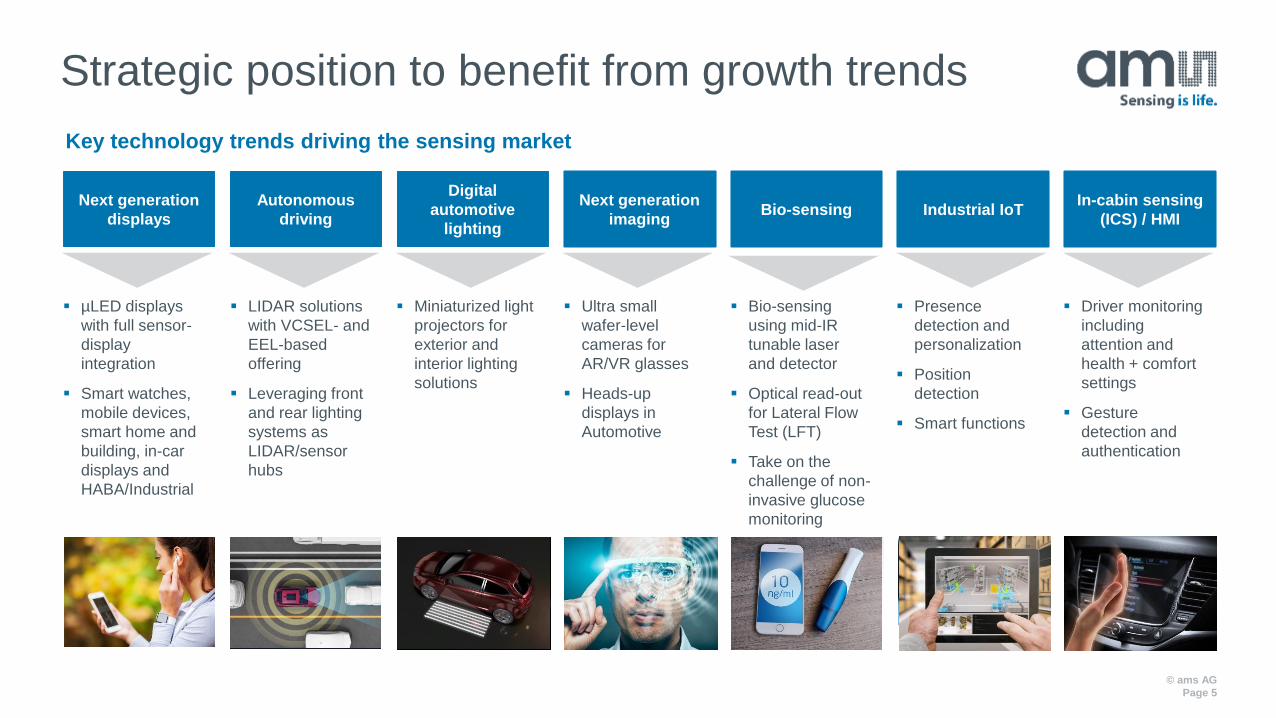
Strategic position to benefit from growth trends
Key technology trends driving the sensing market
Next generation
displays
µLED displays
with full sensor-
display
integration
Smart watches,
mobile devices,
smart home and
building, in-car
displays and
HABA/Industrial
Next generation
imaging
Ultra small
wafer-level
cameras for
AR/VR glasses
Heads-up
displays in
Automotive
Digital
automotive
lighting
Miniaturized light
projectors for
exterior and
interior lighting
solutions
Autonomous
driving
LIDAR solutions
with VCSEL- and
EEL-based
offering
Leveraging front
and rear lighting
systems as
LIDAR/sensor
hubs
Bio-sensing
Bio-sensing
using mid-IR
tunable laser
and detector
Optical read-out
for Lateral Flow
Test (LFT)
Take on the
challenge of non-
invasive glucose
monitoring
Industrial IoT
Presence
detection and
personalization
Position
detection
Smart functions
In-cabin sensing
(ICS) / HMI
Driver monitoring
including
attention and
health + comfort
settings
Gesture
detection and
authentication
© ams AG
Page 5
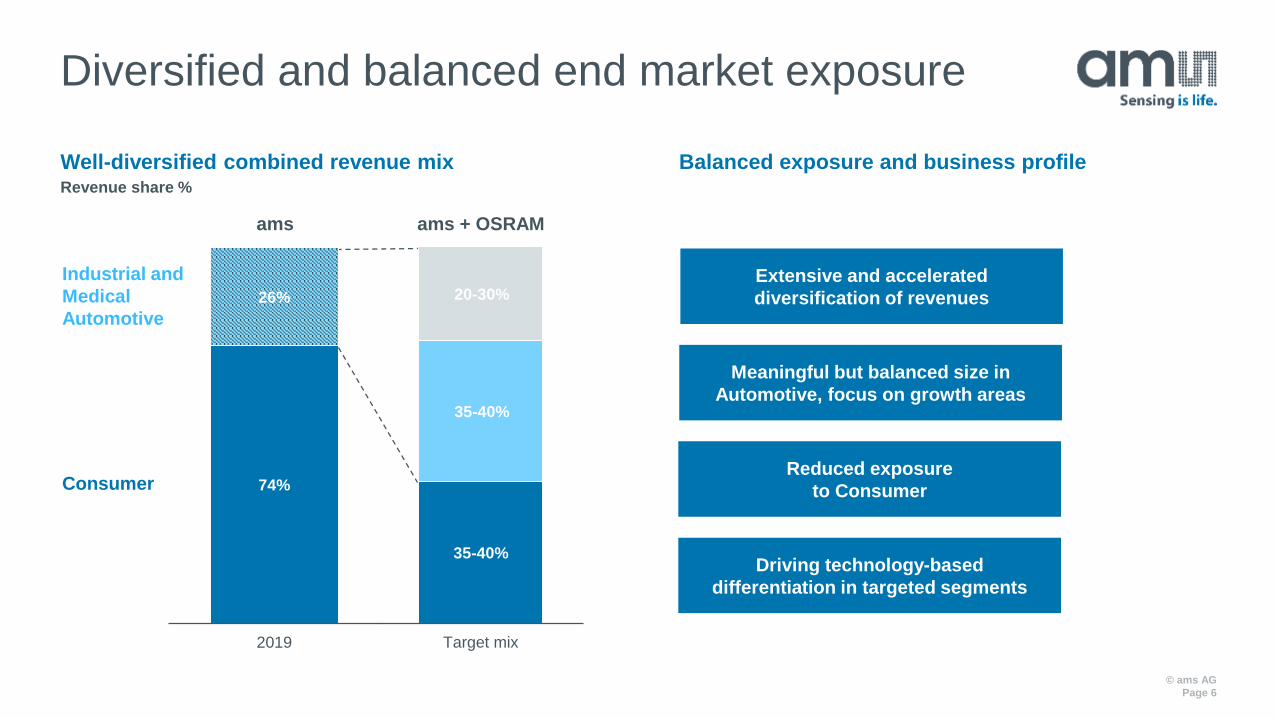
74%
26%
2019
© ams AG
Page 6
Extensive and accelerated
diversification of revenues
Meaningful but balanced size in
Automotive, focus on growth areas
Driving technology-based
differentiation in targeted segments
Well-diversified combined revenue mix Balanced exposure and business profileRevenue share %
ams ams + OSRAM
Target mix
20-30%
Diversified and balanced end market exposure
35-40%
35-40%
Industrial and
Medical
Automotive
ConsumerReduced exposure
to Consumer
© ams AG
Page 7
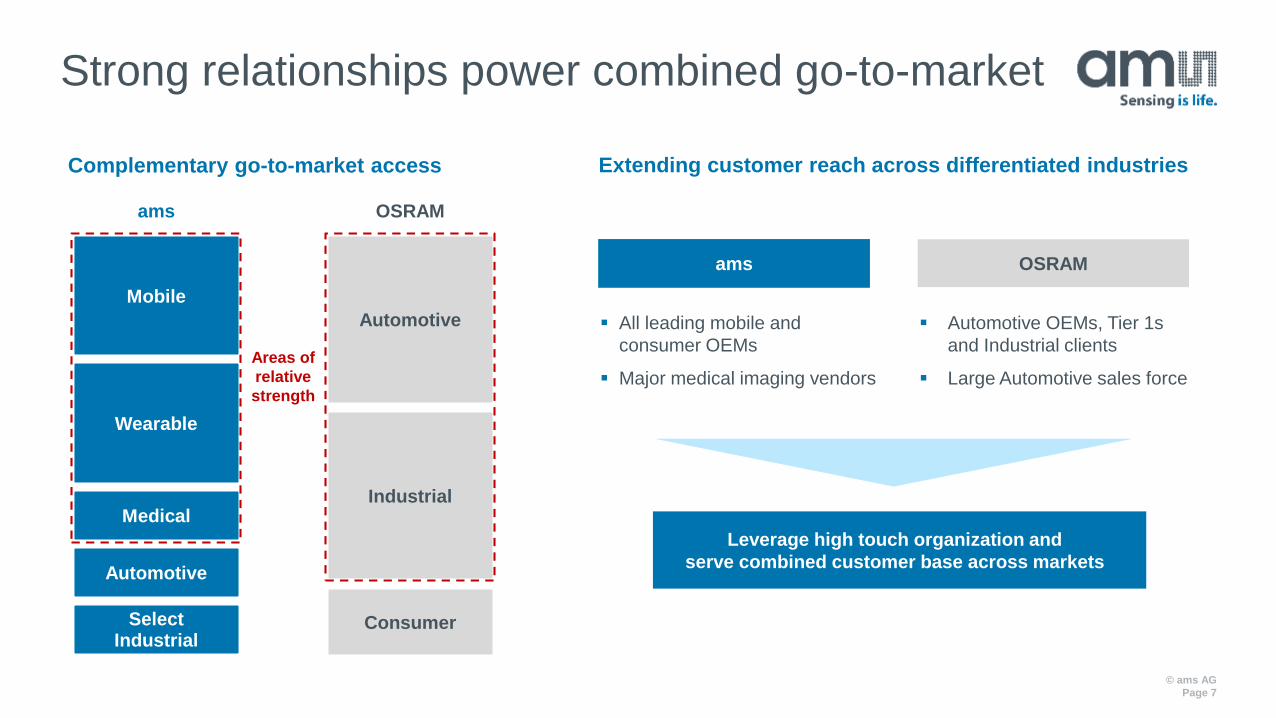
Extending customer reach across differentiated industries
OSRAM
Mobile
Wearable
Medical
Select Industrial
Automotive
Industrial
ams
Automotive
Consumer
Areas of
relative
strength
Complementary go-to-market access
All leading mobile and
consumer OEMs
Major medical imaging vendors
ams OSRAM
Automotive OEMs, Tier 1s
and Industrial clients
Large Automotive sales force
Leverage high touch organization and
serve combined customer base across markets
Strong relationships power combined go-to-market
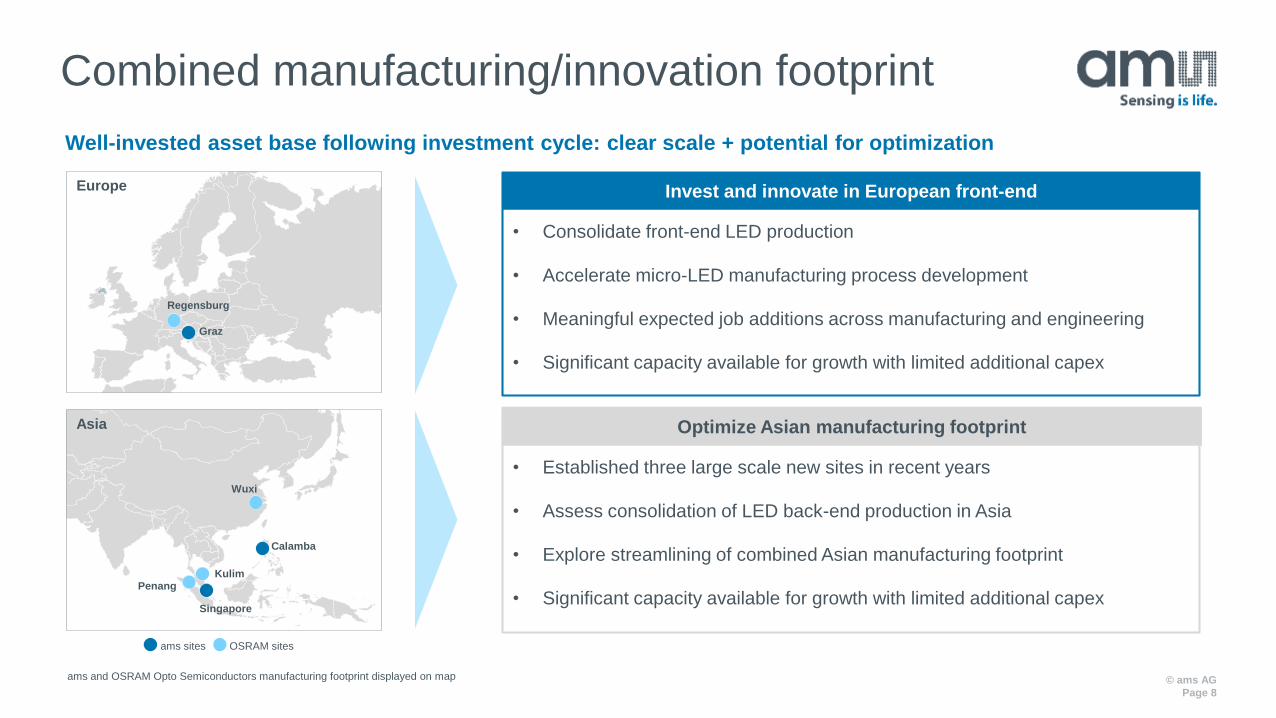
Combined manufacturing/innovation footprint
© ams AG
Page 8
Well-invested asset base following investment cycle: clear scale + potential for optimization
Penang
Regensburg
Graz
Kulim
Wuxi
Singapore
• Consolidate front-end LED production
• Accelerate micro-LED manufacturing process development
• Meaningful expected job additions across manufacturing and engineering
• Significant capacity available for growth with limited additional capex
Invest and innovate in European front-end
• Established three large scale new sites in recent years
• Assess consolidation of LED back-end production in Asia
• Explore streamlining of combined Asian manufacturing footprint
• Significant capacity available for growth with limited additional capex
Calamba
Europe
Asia
OSRAM sitesams sites
ams and OSRAM Opto Semiconductors manufacturing footprint displayed on map
Optimize Asian manufacturing footprint
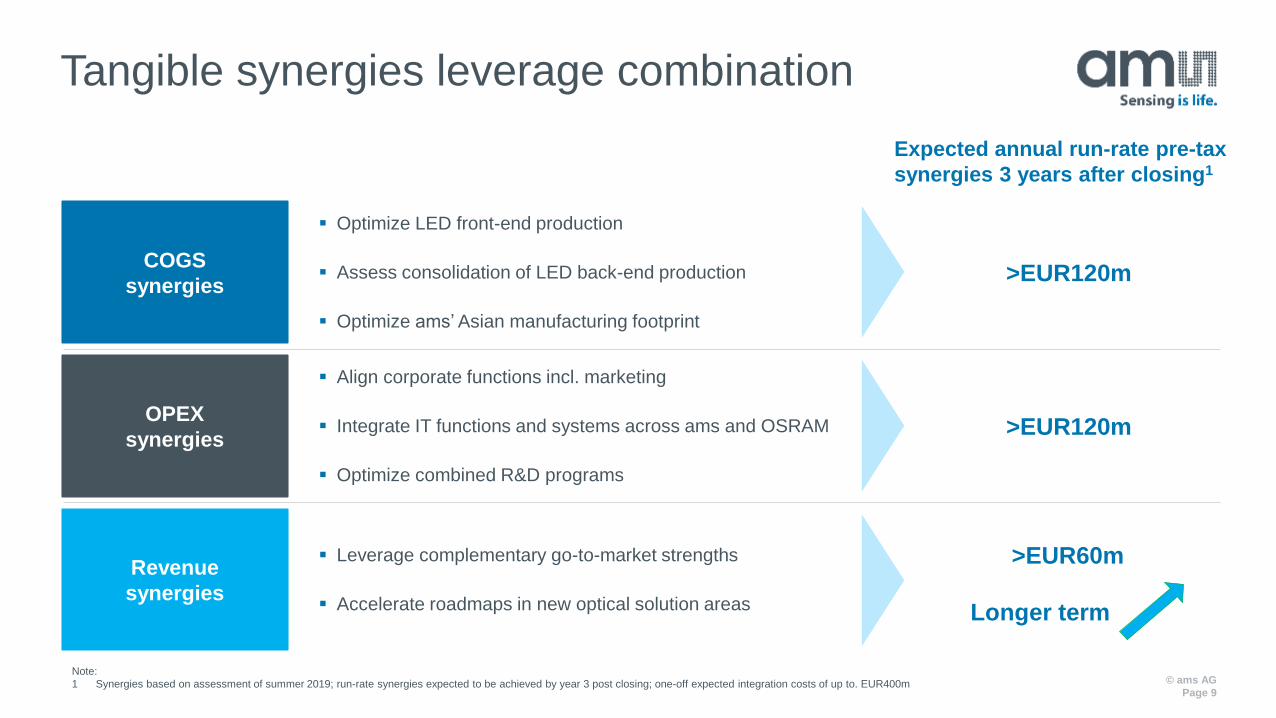
>EUR60m
© ams AG
Page 9
Expected annual run-rate pre-tax
synergies 3 years after closing1
>EUR120m
>EUR120m
Revenue
synergies
OPEX
synergies
COGS
synergies
Leverage complementary go-to-market strengths
Accelerate roadmaps in new optical solution areas
Align corporate functions incl. marketing
Integrate IT functions and systems across ams and OSRAM
Optimize combined R&D programs
Optimize LED front-end production
Assess consolidation of LED back-end production
Optimize ams’ Asian manufacturing footprint
Note:
1 Synergies based on assessment of summer 2019; run-rate synergies expected to be achieved by year 3 post closing; one-off expected integration costs of up to. EUR400m
Tangible synergies leverage combination
Longer term
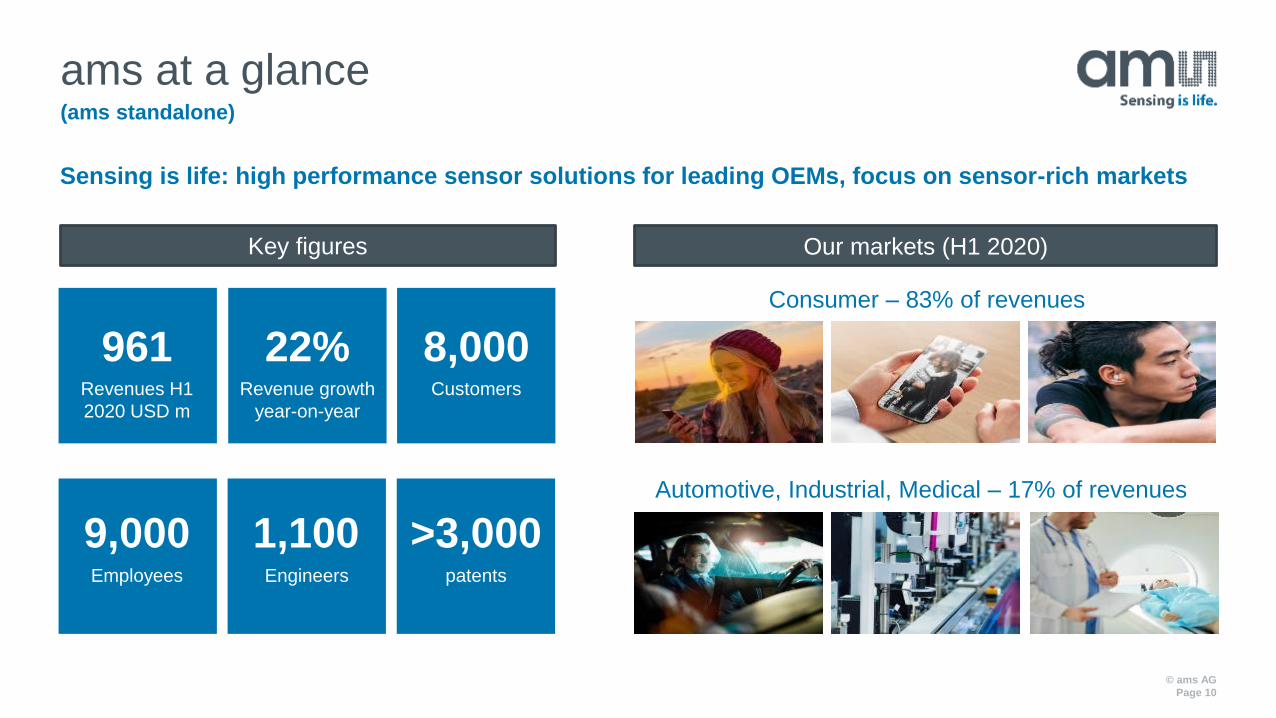
(ams standalone)
ams at a glance
© ams AG
Page 10
Automotive, Industrial, Medical – 17% of revenues
Our markets (H1 2020)
961Revenues H1
2020 USD m
9,000Employees
22%Revenue growth
year-on-year
1,100Engineers
8,000Customers
>3,000patents
Key figures
Sensing is life: high performance sensor solutions for leading OEMs, focus on sensor-rich markets
Consumer – 83% of revenues
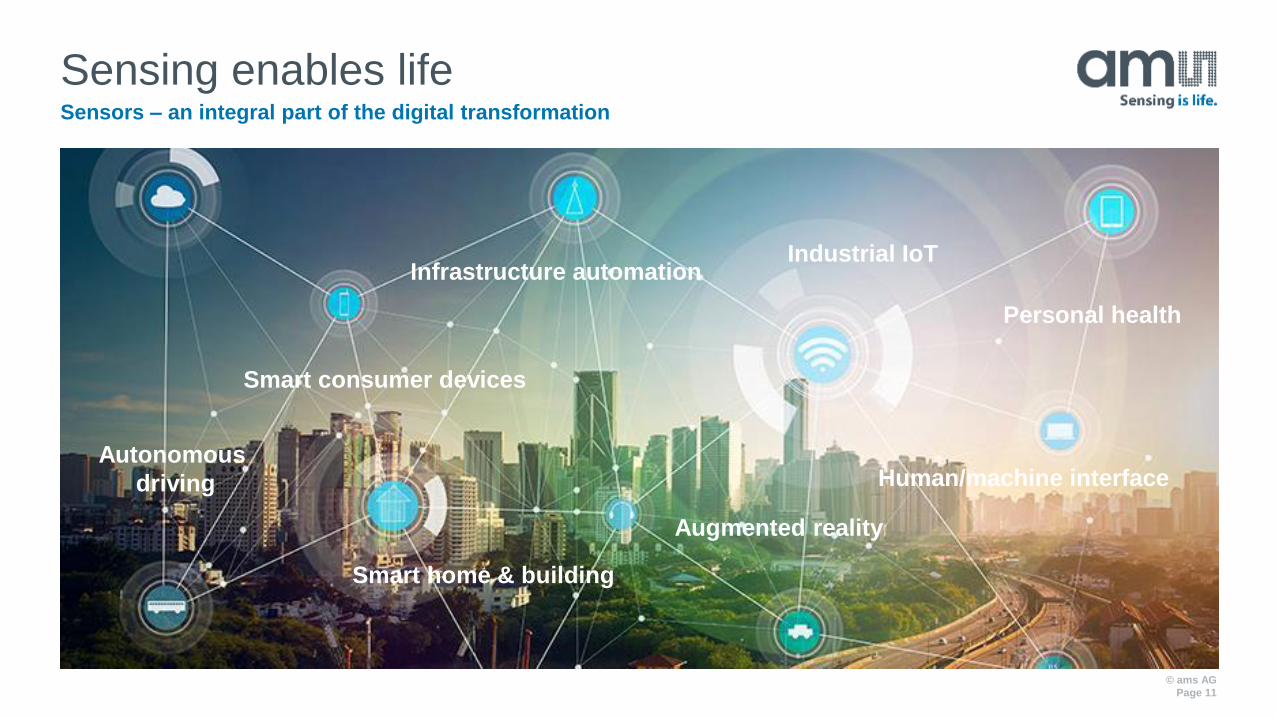
Sensors – an integral part of the digital transformation
Sensing enables life
© ams AG
Page 11
Autonomous
driving
Smart home & building
Infrastructure automationIndustrial IoT
Human/machine interface
Personal health
Augmented reality
Smart consumer devices
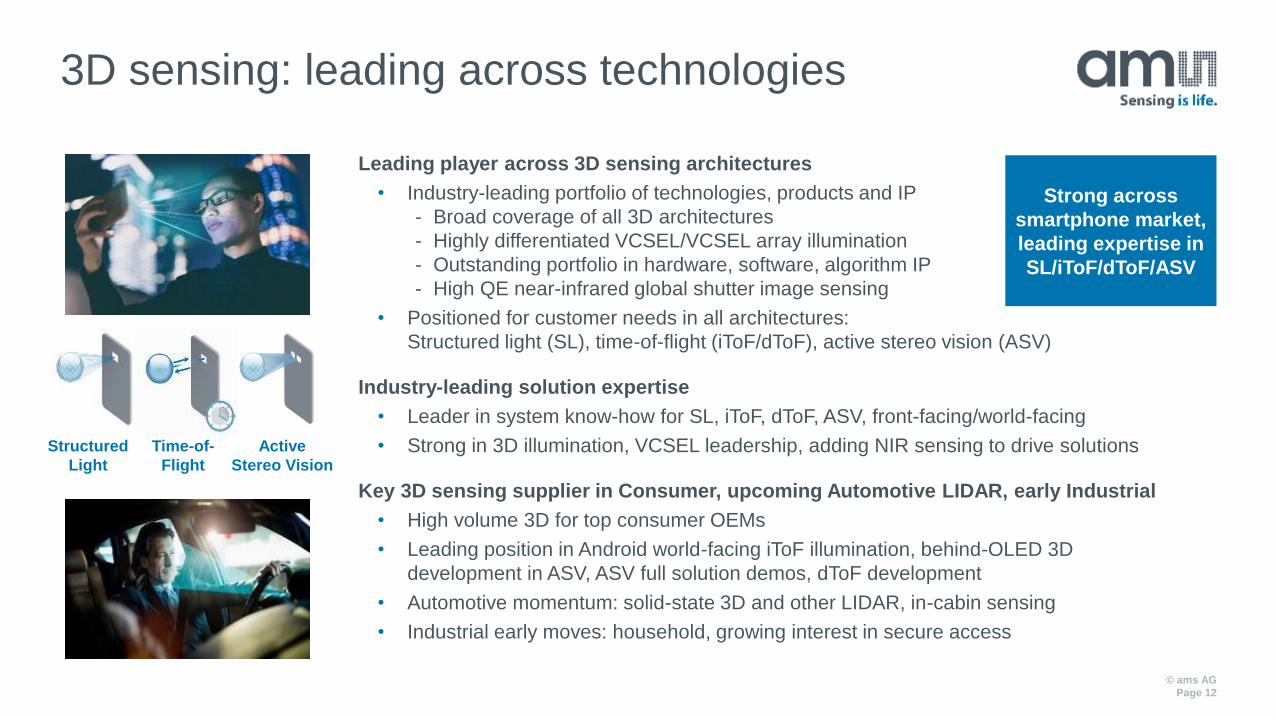
3D sensing: leading across technologies
© ams AG
Page 12
Leading player across 3D sensing architectures
• Industry-leading portfolio of technologies, products and IP
- Broad coverage of all 3D architectures
- Highly differentiated VCSEL/VCSEL array illumination
- Outstanding portfolio in hardware, software, algorithm IP
- High QE near-infrared global shutter image sensing
• Positioned for customer needs in all architectures:
Structured light (SL), time-of-flight (iToF/dToF), active stereo vision (ASV)
Industry-leading solution expertise
• Leader in system know-how for SL, iToF, dToF, ASV, front-facing/world-facing
• Strong in 3D illumination, VCSEL leadership, adding NIR sensing to drive solutions
Key 3D sensing supplier in Consumer, upcoming Automotive LIDAR, early Industrial
• High volume 3D for top consumer OEMs
• Leading position in Android world-facing iToF illumination, behind-OLED 3D
development in ASV, ASV full solution demos, dToF development
• Automotive momentum: solid-state 3D and other LIDAR, in-cabin sensing
• Industrial early moves: household, growing interest in secure access
Strong across
smartphone market,
leading expertise in
SL/iToF/dToF/ASV
Active
Stereo Vision
Structured
Light
Time-of-
Flight
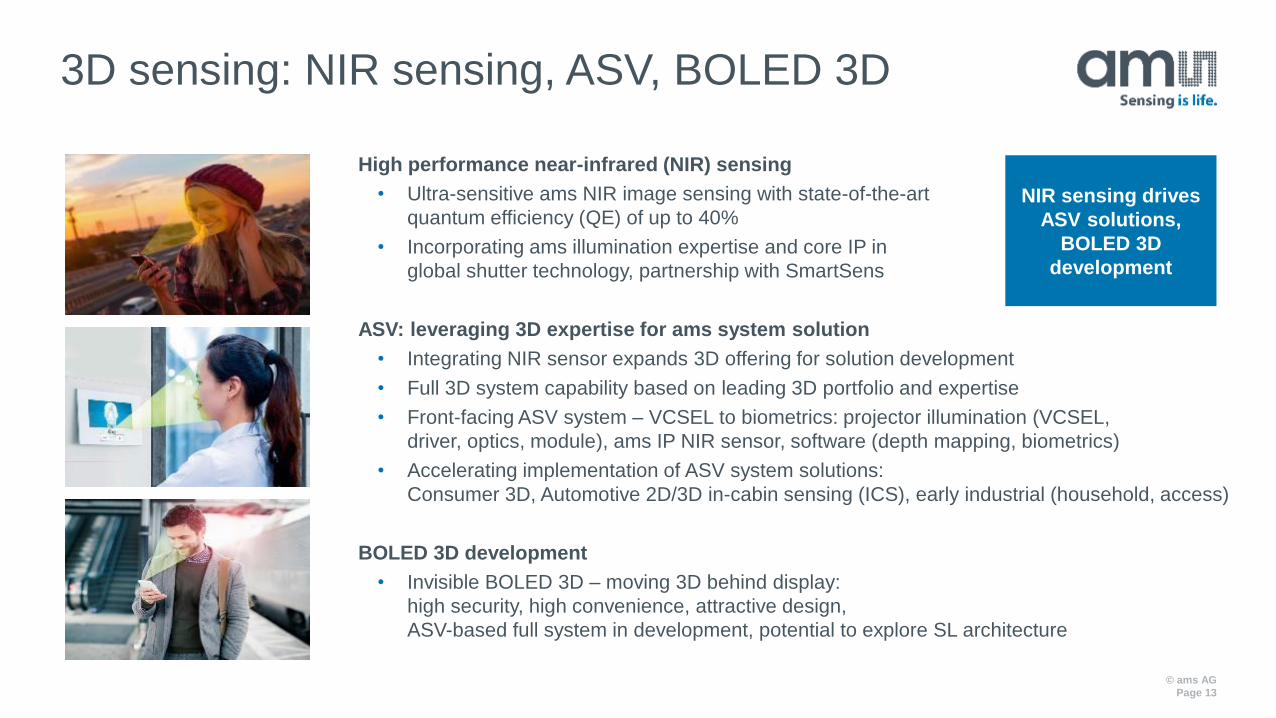
3D sensing: NIR sensing, ASV, BOLED 3D
© ams AG
Page 13
High performance near-infrared (NIR) sensing
• Ultra-sensitive ams NIR image sensing with state-of-the-art
quantum efficiency (QE) of up to 40%
• Incorporating ams illumination expertise and core IP in
global shutter technology, partnership with SmartSens
ASV: leveraging 3D expertise for ams system solution
• Integrating NIR sensor expands 3D offering for solution development
• Full 3D system capability based on leading 3D portfolio and expertise
• Front-facing ASV system – VCSEL to biometrics: projector illumination (VCSEL,
driver, optics, module), ams IP NIR sensor, software (depth mapping, biometrics)
• Accelerating implementation of ASV system solutions:
Consumer 3D, Automotive 2D/3D in-cabin sensing (ICS), early industrial (household, access)
BOLED 3D development
• Invisible BOLED 3D – moving 3D behind display:
high security, high convenience, attractive design,
ASV-based full system in development, potential to explore SL architecture
NIR sensing drives
ASV solutions,
BOLED 3D
development
3D sensing: dToF development, VCSELs
© ams AG
Page 14
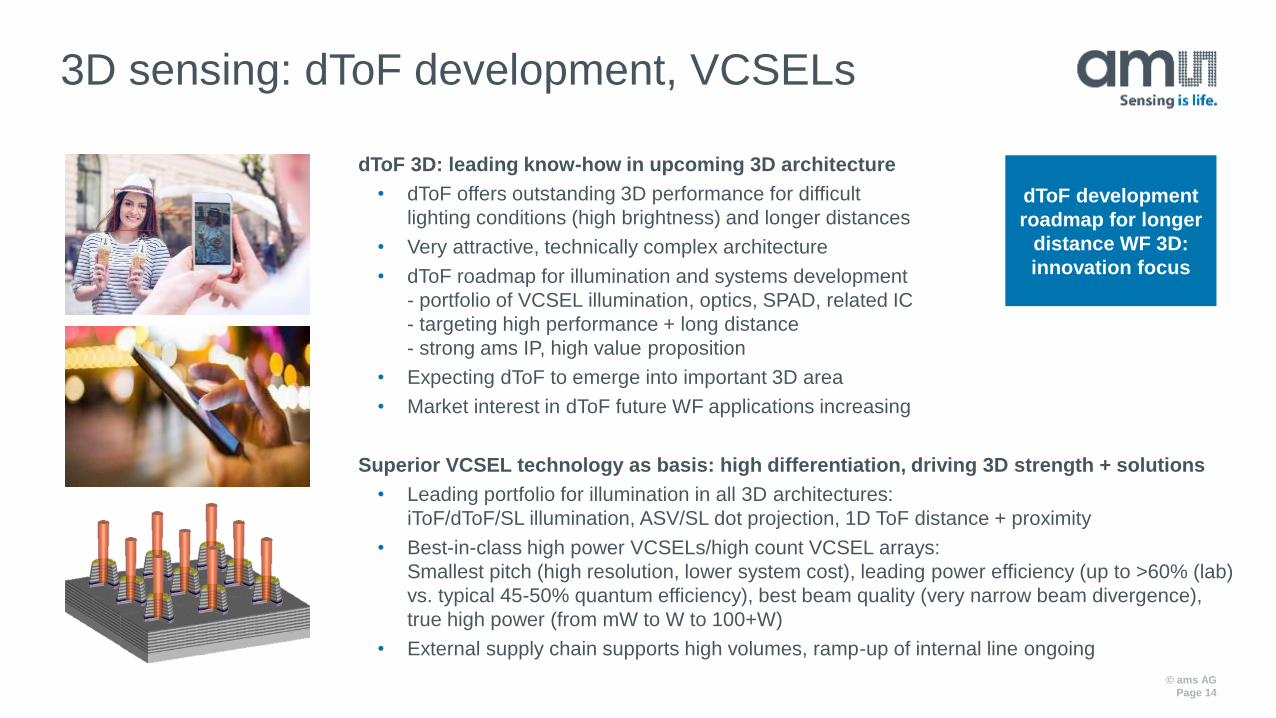
dToF 3D: leading know-how in upcoming 3D architecture
• dToF offers outstanding 3D performance for difficult
lighting conditions (high brightness) and longer distances
• Very attractive, technically complex architecture
• dToF roadmap for illumination and systems development
- portfolio of VCSEL illumination, optics, SPAD, related IC
- targeting high performance + long distance
- strong ams IP, high value proposition
• Expecting dToF to emerge into important 3D area
• Market interest in dToF future WF applications increasing
Superior VCSEL technology as basis: high differentiation, driving 3D strength + solutions
• Leading portfolio for illumination in all 3D architectures:
iToF/dToF/SL illumination, ASV/SL dot projection, 1D ToF distance + proximity
• Best-in-class high power VCSELs/high count VCSEL arrays:
Smallest pitch (high resolution, lower system cost), leading power efficiency (up to >60% (lab)
vs. typical 45-50% quantum efficiency), best beam quality (very narrow beam divergence),
true high power (from mW to W to 100+W)
• External supply chain supports high volumes, ramp-up of internal line ongoing
dToF development
roadmap for longer
distance WF 3D:
innovation focus
3D sensing: Automotive 3D LIDAR, in-cabin
© ams AG
Page 15
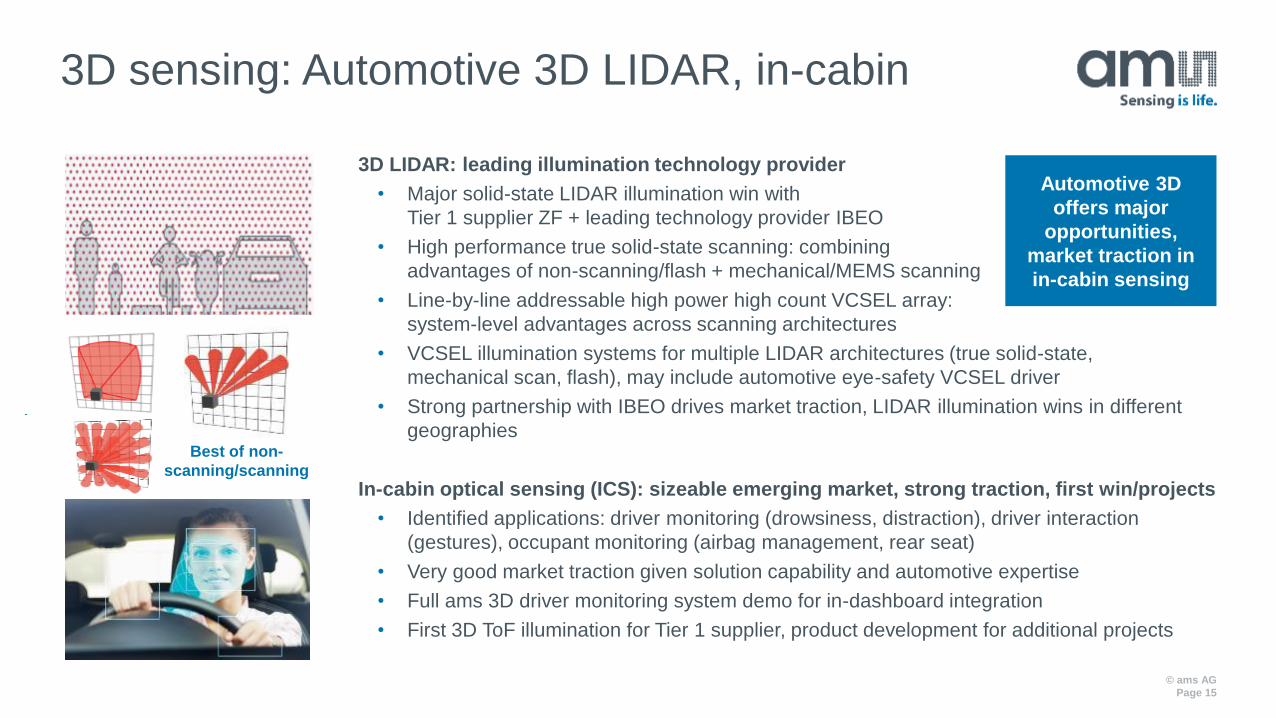
3D LIDAR: leading illumination technology provider
• Major solid-state LIDAR illumination win with
Tier 1 supplier ZF + leading technology provider IBEO
• High performance true solid-state scanning: combining
advantages of non-scanning/flash + mechanical/MEMS scanning
• Line-by-line addressable high power high count VCSEL array:
system-level advantages across scanning architectures
• VCSEL illumination systems for multiple LIDAR architectures (true solid-state,
mechanical scan, flash), may include automotive eye-safety VCSEL driver
• Strong partnership with IBEO drives market traction, LIDAR illumination wins in different
geographies
In-cabin optical sensing (ICS): sizeable emerging market, strong traction, first win/projects
• Identified applications: driver monitoring (drowsiness, distraction), driver interaction
(gestures), occupant monitoring (airbag management, rear seat)
• Very good market traction given solution capability and automotive expertise
• Full ams 3D driver monitoring system demo for in-dashboard integration
• First 3D ToF illumination for Tier 1 supplier, product development for additional projects
Best of non-
scanning/scanning
Automotive 3D
offers major
opportunities,
market traction in
in-cabin sensing
Optical sensing
© ams AG
Page 16
A worldwide leader in light sensing solutions
• Leading in optical sensing:
sensors, illumination solutions, high performance optical systems
• High quality optical sensing at top consumer OEMs
• Driving innovation in optical technologies
• Upcoming growth markets in Automotive + Industrial
Broad portfolio: 3D sensing incl. VCSEL, display management/proximity, BOLED
• 3D sensing: leading portfolio + system expertise, all technologies, major consumer OEMs
• High performance VCSELs for 3D/optical sensing: strong in consumer, early automotive lead
• Innovative behind-OLED light/prox sensing: fast adoption, enabling BOLED 3D (development)
• Display management ALS/proximity, ultra-small proximity for wireless earbuds, camera AWB
Technology leadership for new markets: spectral sensing, bio-sensing
• Biosensing: high quality blood pressure + health data measurement
• Spectral sensing: bio/medical sample analysis innovation, highly accurate optical read-out
for lateral flow test (LFT), first partnership for Covid-19 antibody fast point-of-care diagnostics
Leadership in 3D
and optical sensing
for consumer and
non-consumer
markets
Optical sensing: BOLED sensing, spectral AWB
© ams AG
Page 17
Behind-OLED (BOLED) light and proximity sensing
• Invisible high quality optical sensing behind OLED displays
• Complex industry-leading technology and sensor solution:
very low light levels passing through OLED (approx. 4%),
proximity lighting emitted through display
• Fast penetration of leading smartphone OEMs and major
platforms at higher content
• Valuable feature for high end smartphone displays, enables
industry trend for maximum screen-to-body ratio and bezel-less designs
• Multi-generation roadmap driving performance/sensitivity,
basis for BOLED 3D: BOLED ASV system in development
High accuracy auto white balancing (AWB) for smartphone cameras
• Integrated spectral sensing solution for highly accurate AWB:
11-channel spectrum analysis of light environment and light source mix
• Correct white-point balancing: key photographic function to realize best picture quality,
compensate image colors for distorting effects of ambient light environment
• Unparalleled image quality even in high color contrast scenes, vivid natural colors
• First major high-end smartphone platform, higher DXOMARK camera ranking
BOLED adoption
ongoing: major
OEMs + platforms;
innovative AWB
market success
Optical sensing: spectral read-out for medical LFT
© ams AG
Page 18
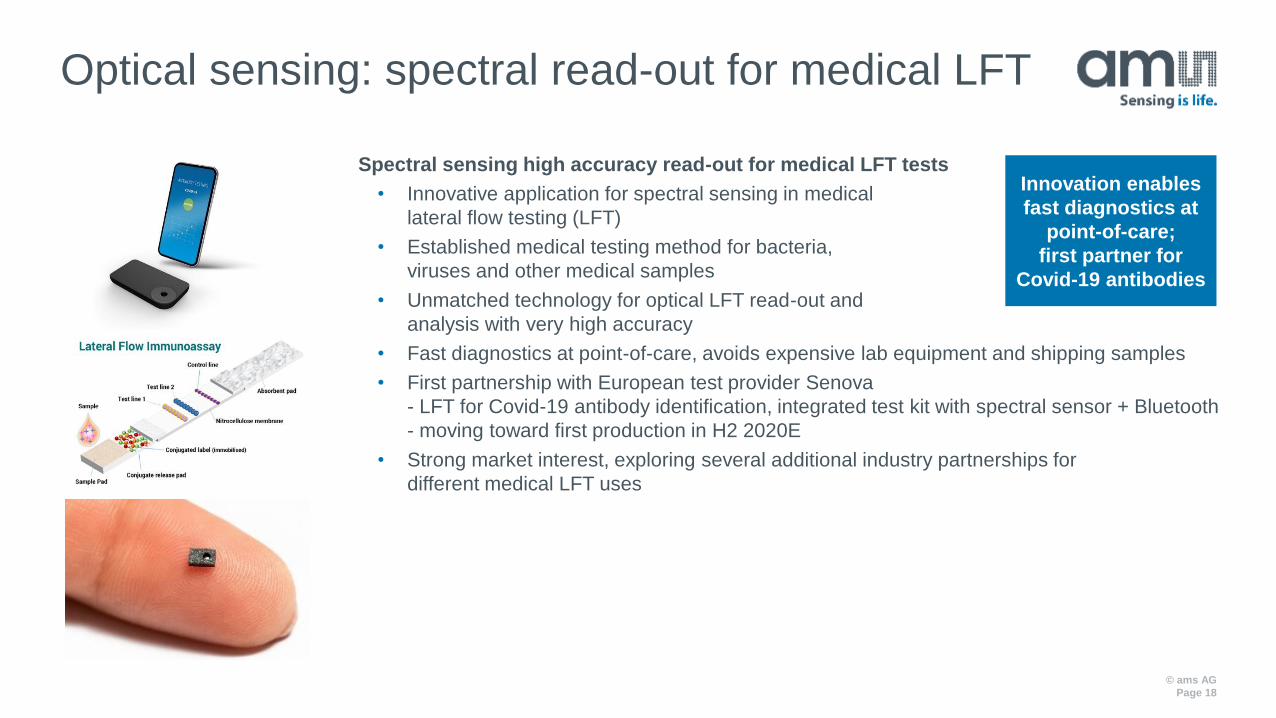
Spectral sensing high accuracy read-out for medical LFT tests
• Innovative application for spectral sensing in medical
lateral flow testing (LFT)
• Established medical testing method for bacteria,
viruses and other medical samples
• Unmatched technology for optical LFT read-out and
analysis with very high accuracy
• Fast diagnostics at point-of-care, avoids expensive lab equipment and shipping samples
• First partnership with European test provider Senova
- LFT for Covid-19 antibody identification, integrated test kit with spectral sensor + Bluetooth
- moving toward first production in H2 2020E
• Strong market interest, exploring several additional industry partnerships for
different medical LFT uses
Innovation enables
fast diagnostics at
point-of-care;
first partner for
Covid-19 antibodies
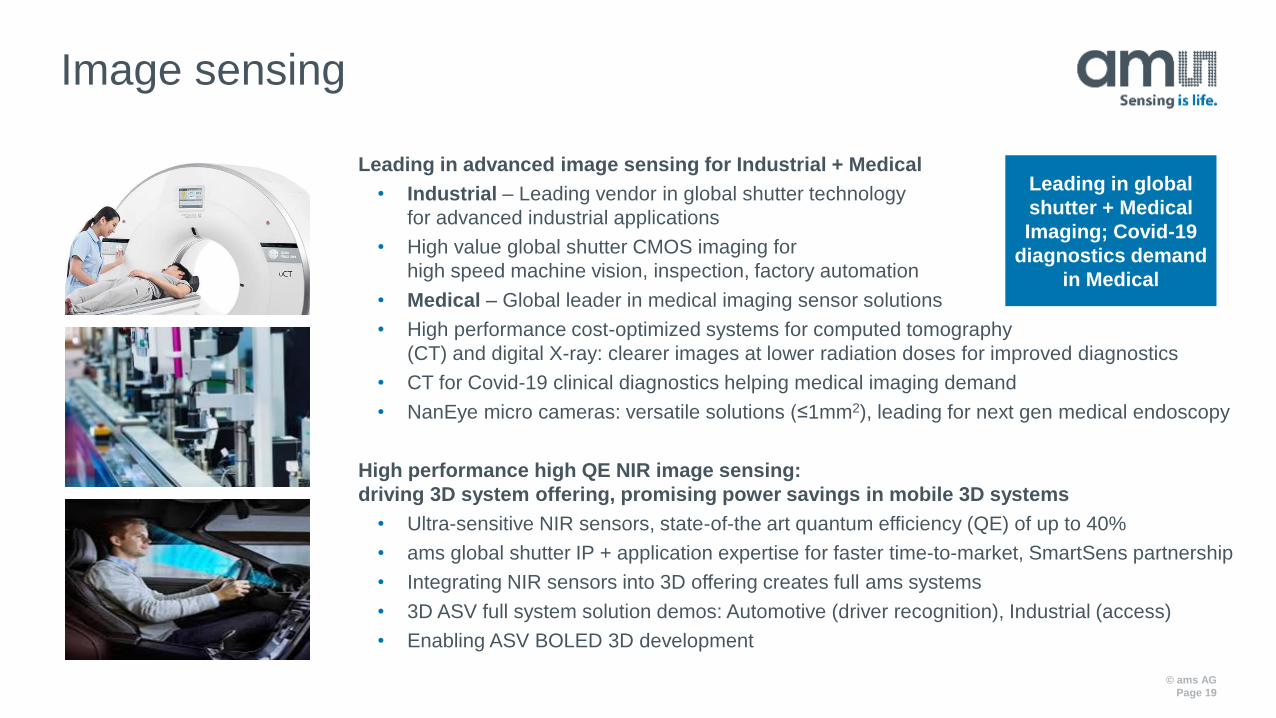
Image sensing
© ams AG
Page 19
Leading in advanced image sensing for Industrial + Medical
• Industrial – Leading vendor in global shutter technology
for advanced industrial applications
• High value global shutter CMOS imaging for
high speed machine vision, inspection, factory automation
• Medical – Global leader in medical imaging sensor solutions
• High performance cost-optimized systems for computed tomography
(CT) and digital X-ray: clearer images at lower radiation doses for improved diagnostics
• CT for Covid-19 clinical diagnostics helping medical imaging demand
• NanEye micro cameras: versatile solutions (≤1mm2), leading for next gen medical endoscopy
High performance high QE NIR image sensing:
driving 3D system offering, promising power savings in mobile 3D systems
• Ultra-sensitive NIR sensors, state-of-the art quantum efficiency (QE) of up to 40%
• ams global shutter IP + application expertise for faster time-to-market, SmartSens partnership
• Integrating NIR sensors into 3D offering creates full ams systems
• 3D ASV full system solution demos: Automotive (driver recognition), Industrial (access)
• Enabling ASV BOLED 3D development
Leading in global
shutter + Medical
Imaging; Covid-19
diagnostics demand
in Medical
Audio sensing
© ams AG
Page 20
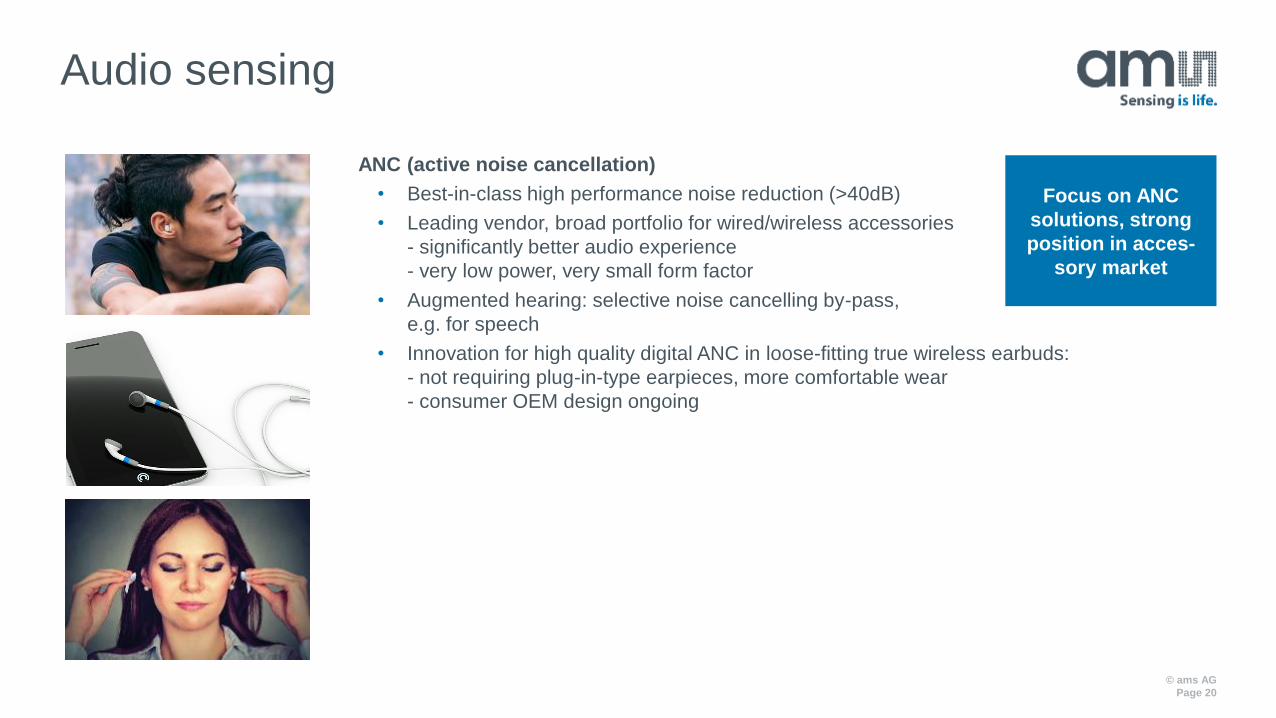
ANC (active noise cancellation)
• Best-in-class high performance noise reduction (>40dB)
• Leading vendor, broad portfolio for wired/wireless accessories
- significantly better audio experience
- very low power, very small form factor
• Augmented hearing: selective noise cancelling by-pass,
e.g. for speech
• Innovation for high quality digital ANC in loose-fitting true wireless earbuds:
- not requiring plug-in-type earpieces, more comfortable wear
- consumer OEM design ongoing
Focus on ANC
solutions, strong
position in acces-
sory market
ams hybrid volume manufacturing model
© ams AG
Page 21
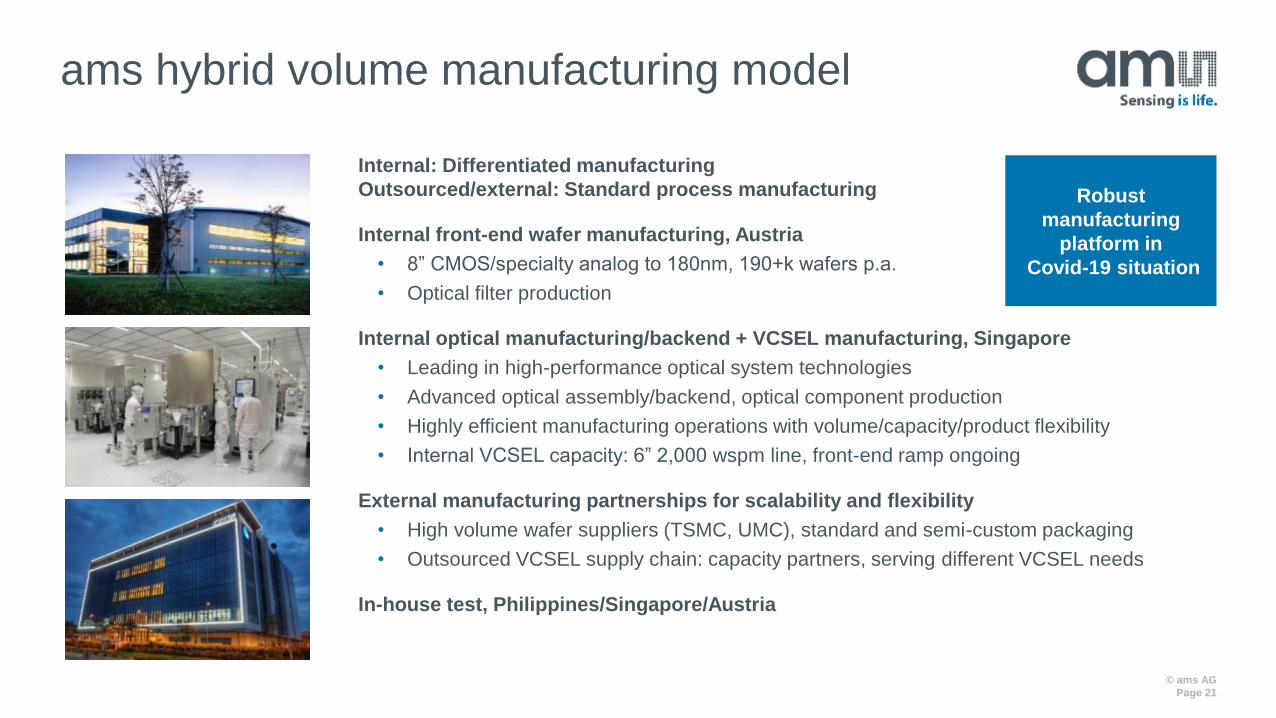
Internal: Differentiated manufacturing
Outsourced/external: Standard process manufacturing
Internal front-end wafer manufacturing, Austria
• 8” CMOS/specialty analog to 180nm, 190+k wafers p.a.
• Optical filter production
Internal optical manufacturing/backend + VCSEL manufacturing, Singapore
• Leading in high-performance optical system technologies
• Advanced optical assembly/backend, optical component production
• Highly efficient manufacturing operations with volume/capacity/product flexibility
• Internal VCSEL capacity: 6” 2,000 wspm line, front-end ramp ongoing
External manufacturing partnerships for scalability and flexibility
• High volume wafer suppliers (TSMC, UMC), standard and semi-custom packaging
• Outsourced VCSEL supply chain: capacity partners, serving different VCSEL needs
In-house test, Philippines/Singapore/Austria
Robust
manufacturing
platform in
Covid-19 situation
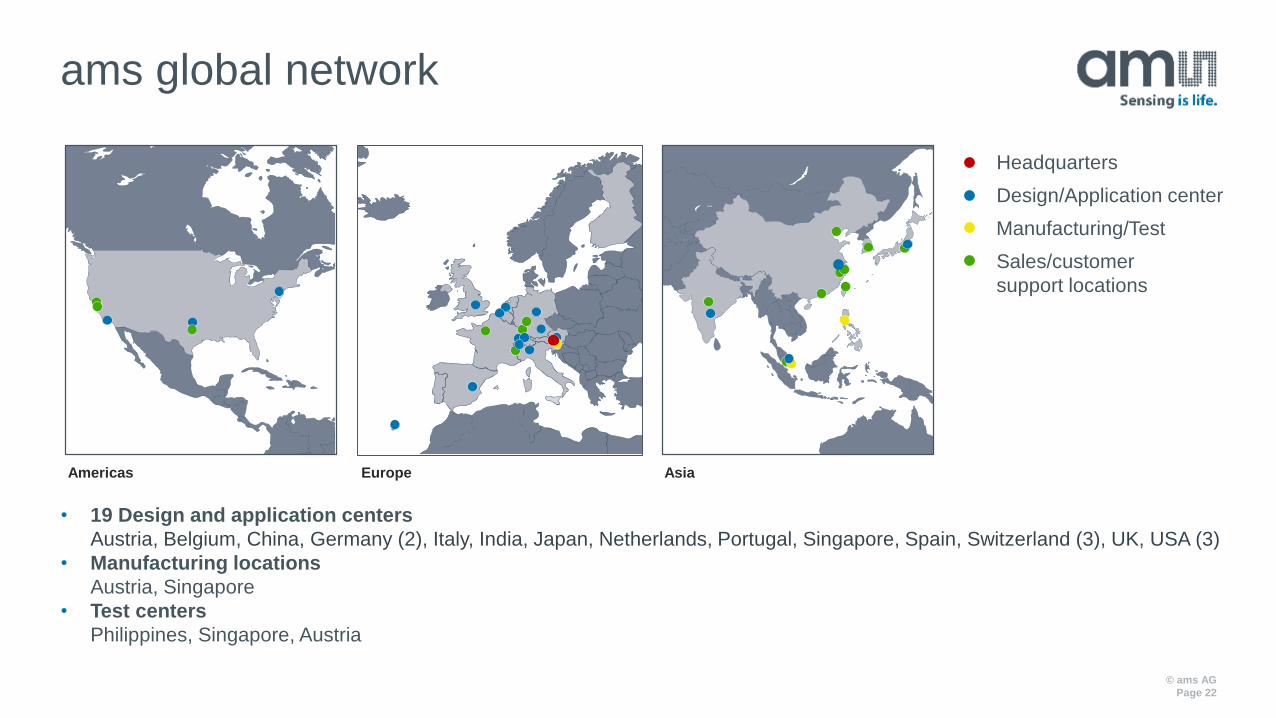
ams global network
© ams AG
Page 22
Americas Europe Asia
Headquarters
Design/Application center
Manufacturing/Test
Sales/customer
support locations
• 19 Design and application centers
Austria, Belgium, China, Germany (2), Italy, India, Japan, Netherlands, Portugal, Singapore, Spain, Switzerland (3), UK, USA (3)
• Manufacturing locations
Austria, Singapore
• Test centers
Philippines, Singapore, Austria
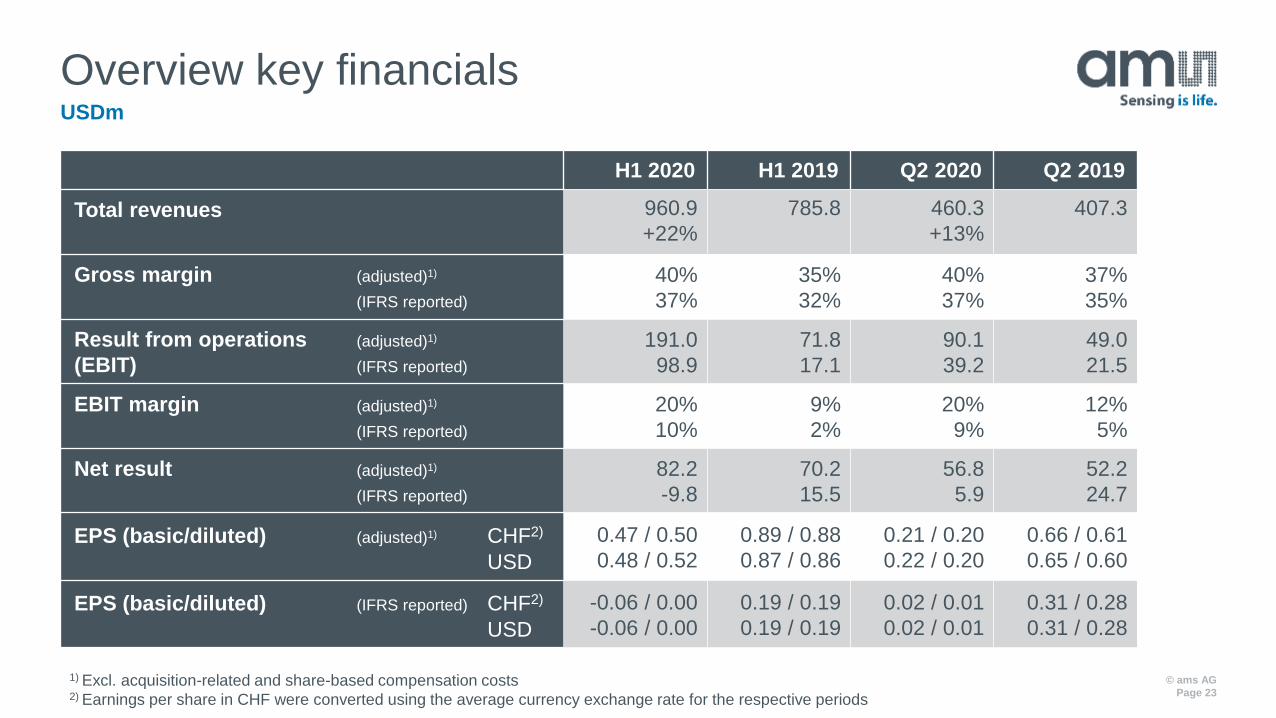
USDm
Overview key financials
H1 2020 H1 2019 Q2 2020 Q2 2019
Total revenues 960.9
+22%
785.8 460.3
+13%
407.3
Gross margin (adjusted)1)
f (IFRS reported)
40%
37%
35%
32%
40%
37%
37%
35%
Result from operations (adjusted)1)
(EBIT) (IFRS reported)
191.0
98.9
71.8
17.1
90.1
39.2
49.0
21.5
EBIT margin (adjusted)1)
f (IFRS reported)
20%
10%
9%
2%
20%
9%
12%
5%
Net result (adjusted)1)
(IFRS reported)
82.2
-9.8
70.2
15.5
56.8
5.9
52.2
24.7
EPS (basic/diluted) (adjusted)1) CHF2)
USD
0.47 / 0.50
0.48 / 0.52
0.89 / 0.88
0.87 / 0.86
0.21 / 0.20
0.22 / 0.20
0.66 / 0.61
0.65 / 0.60
EPS (basic/diluted) (IFRS reported) CHF2)
USD
-0.06 / 0.00
-0.06 / 0.00
0.19 / 0.19
0.19 / 0.19
0.02 / 0.01
0.02 / 0.01
0.31 / 0.28
0.31 / 0.28
1) Excl. acquisition-related and share-based compensation costs 2) Earnings per share in CHF were converted using the average currency exchange rate for the respective periods
© ams AG
Page 23
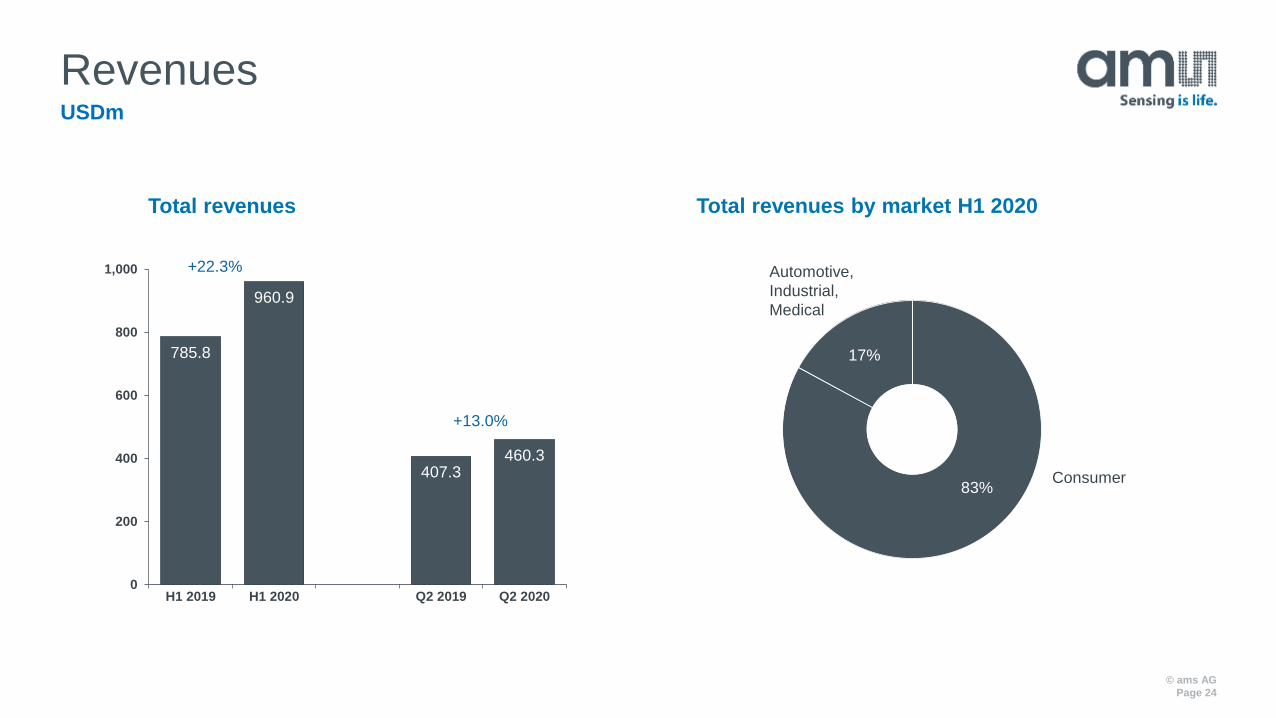
Revenues
© ams AG
Page 24
USDm
785.8
960.9
407.3460.3
0
200
400
600
800
1,000
H1 2019 H1 2020 Q2 2019 Q2 2020
Total revenues
+13.0%
+22.3%
Total revenues by market H1 2020
Automotive,
Industrial,
Medical
Consumer83%
17%
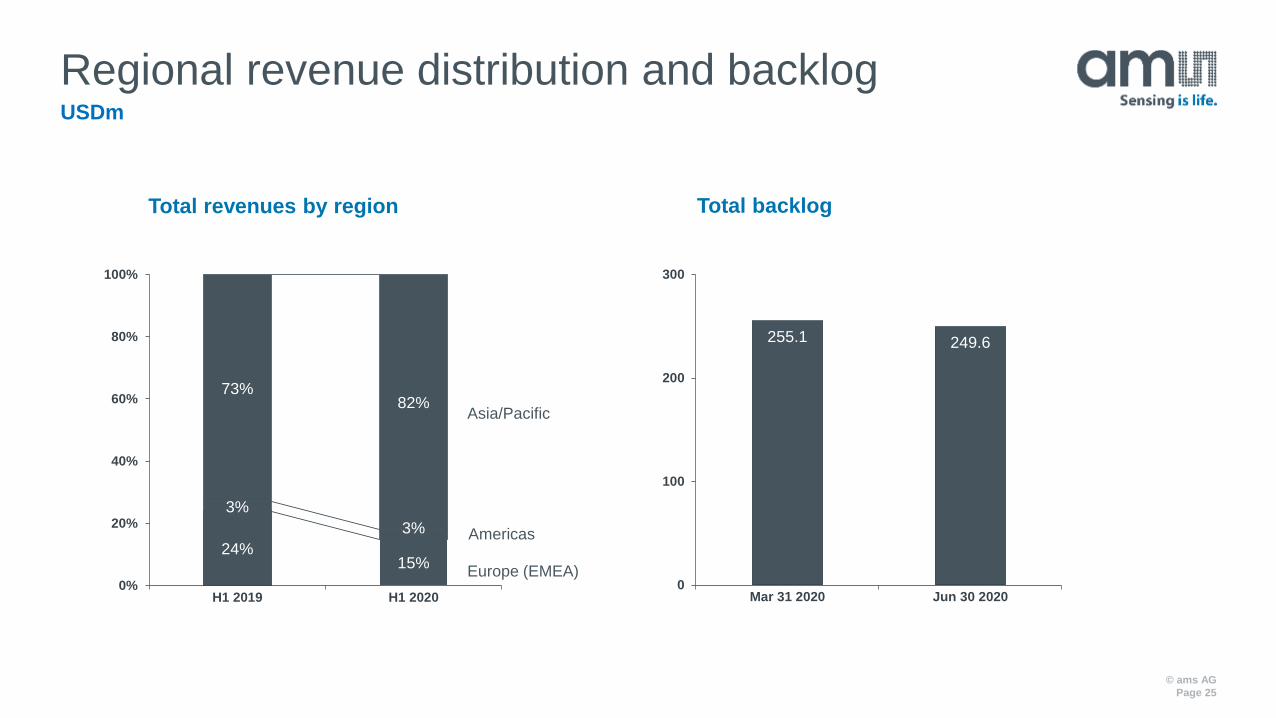
Regional revenue distribution and backlog
© ams AG
Page 25
USDm
255.1 249.6
0
100
200
300
Mar 31 2020 Jun 30 2020
Total backlog
Europe (EMEA)
Asia/Pacific
Americas
Total revenues by region
24%15%
3%
3%
73%82%
0%
20%
40%
60%
80%
100%
H1 2019 H1 2020
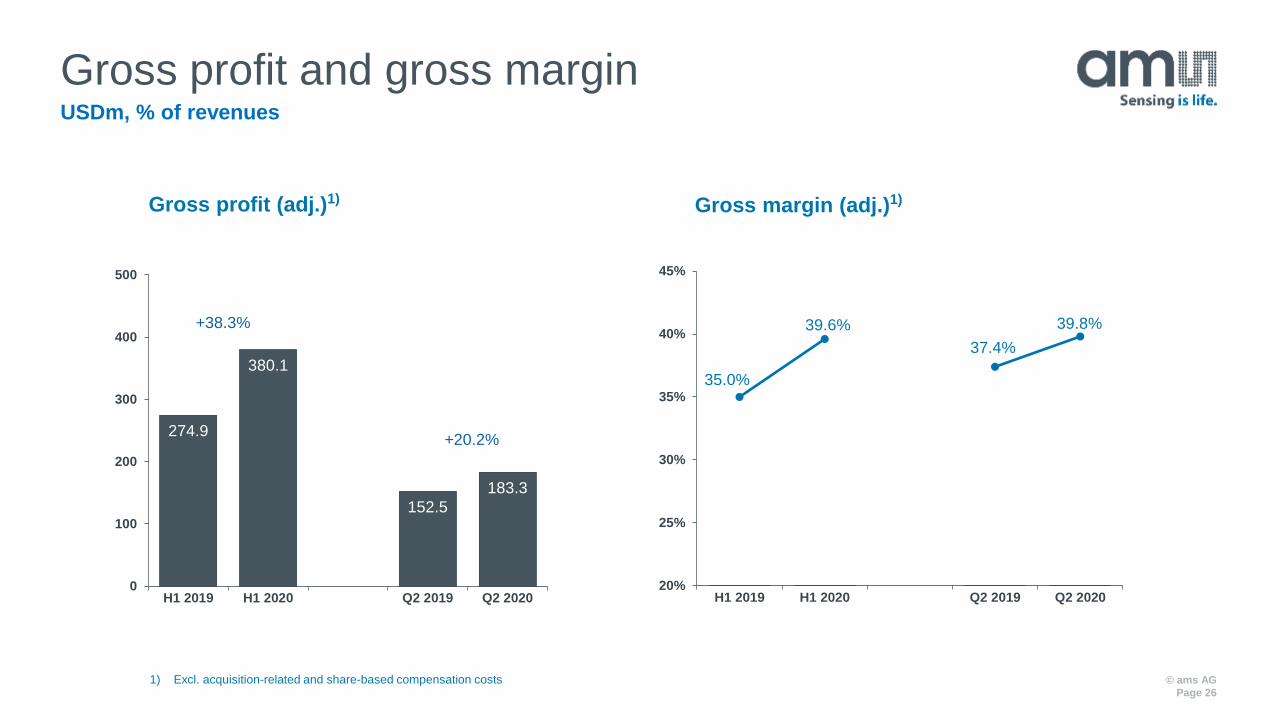
Gross profit and gross margin
© ams AG
Page 26
USDm, % of revenues
274.9
380.1
152.5
183.3
0
100
200
300
400
500
H1 2019 H1 2020 Q2 2019 Q2 2020
Gross profit (adj.)1) Gross margin (adj.)1)
+20.2%
+38.3%
35.0%
39.6%
37.4%
39.8%
20%
25%
30%
35%
40%
45%
H1 2019 H1 2020 Q2 2019 Q2 2020
1) Excl. acquisition-related and share-based compensation costs
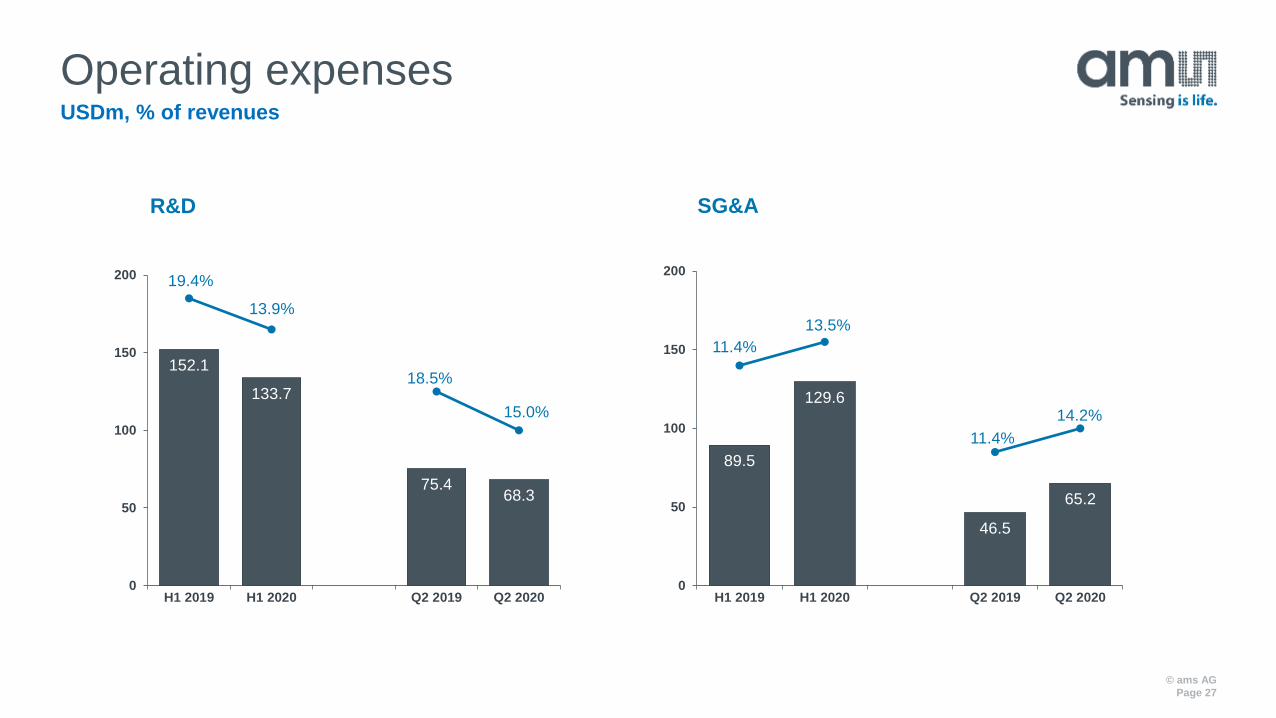
Operating expenses
© ams AG
Page 27
USDm, % of revenues
R&D SG&A
152.1
133.7
75.468.3
19.4%
13.9%
18.5%
15.0%
0
50
100
150
200
H1 2019 H1 2020 Q2 2019 Q2 2020
89.5
129.6
46.5
65.2
11.4%
13.5%
11.4%
14.2%
0
50
100
150
200
H1 2019 H1 2020 Q2 2019 Q2 2020
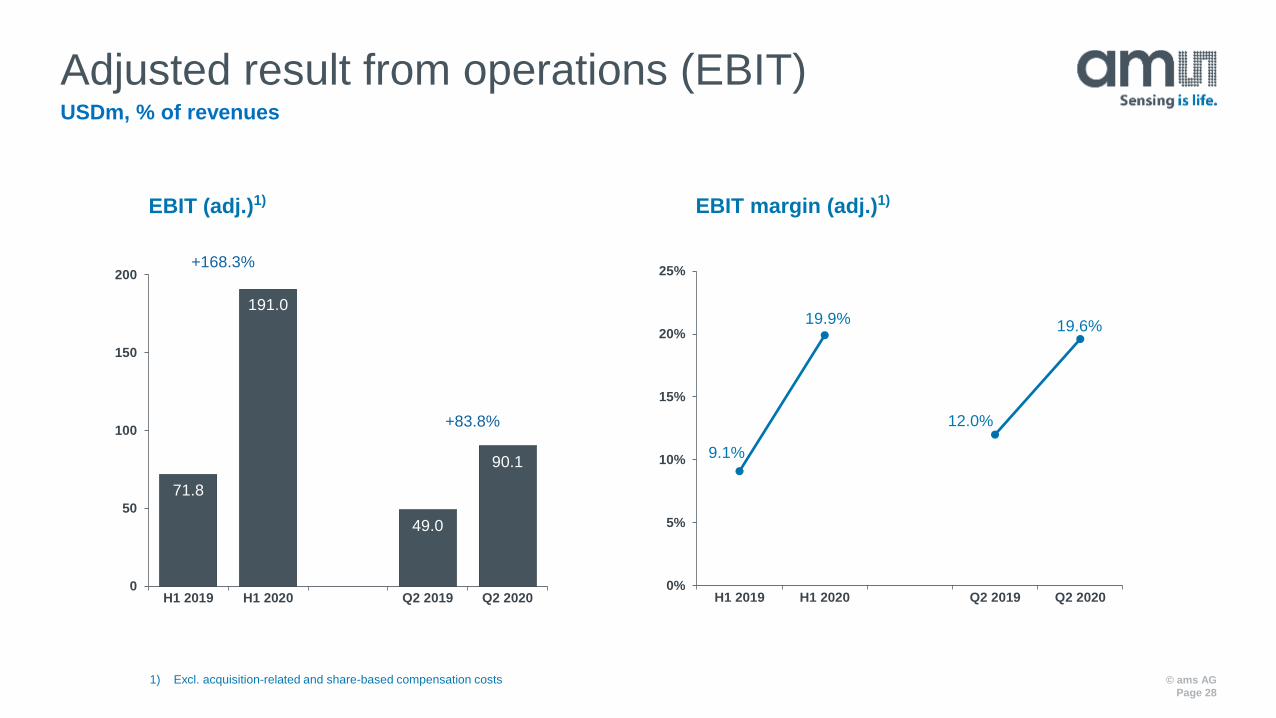
Adjusted result from operations (EBIT)
© ams AG
Page 28
USDm, % of revenues
71.8
191.0
49.0
90.1
0
50
100
150
200
H1 2019 H1 2020 Q2 2019 Q2 2020
EBIT (adj.)1) EBIT margin (adj.)1)
+83.8%
+168.3%
0.0 0.0 0.0 0.0
9.1%
19.9%
12.0%
19.6%
0%
5%
10%
15%
20%
25%
H1 2019 H1 2020 Q2 2019 Q2 2020
1) Excl. acquisition-related and share-based compensation costs
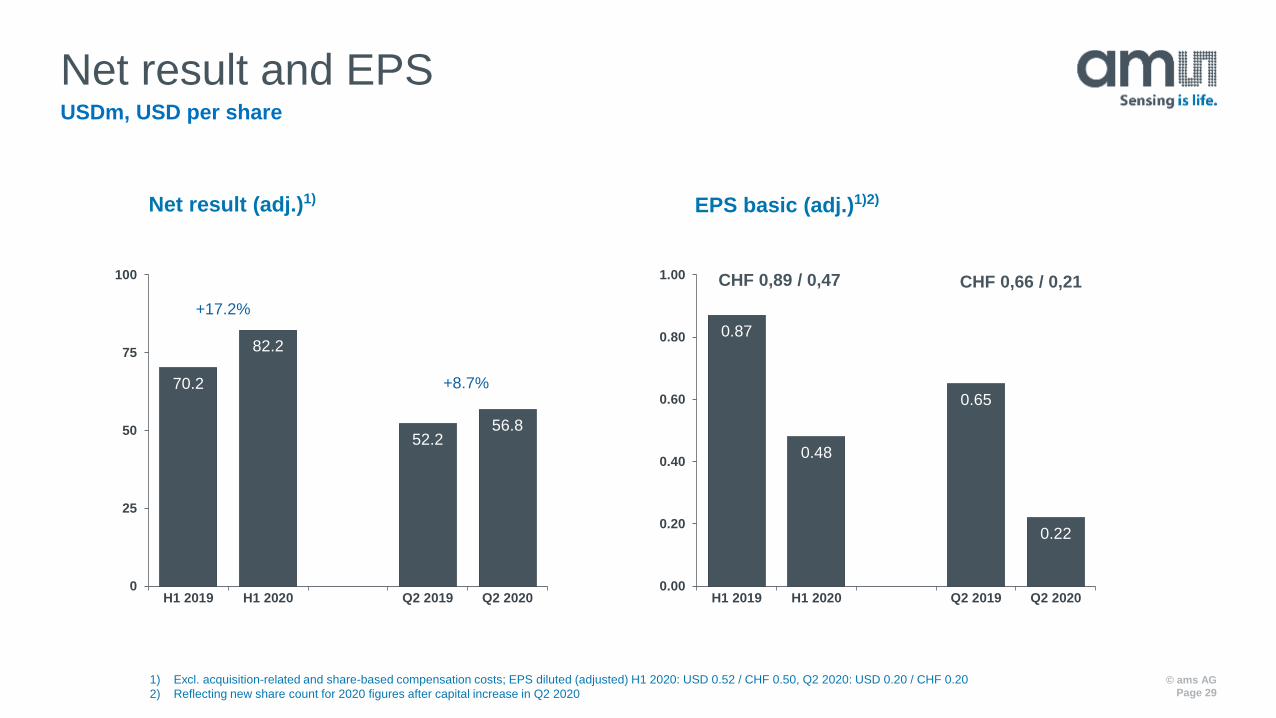
Net result and EPS
© ams AG
Page 29
USDm, USD per share
1) Excl. acquisition-related and share-based compensation costs; EPS diluted (adjusted) H1 2020: USD 0.52 / CHF 0.50, Q2 2020: USD 0.20 / CHF 0.20
2) Reflecting new share count for 2020 figures after capital increase in Q2 2020
70.2
82.2
52.256.8
0
25
50
75
100
H1 2019 H1 2020 Q2 2019 Q2 2020
Net result (adj.)1) EPS basic (adj.)1)2)
+8.7%
+17.2%
0.87
0.48
0.65
0.22
0.00
0.20
0.40
0.60
0.80
1.00
H1 2019 H1 2020 Q2 2019 Q2 2020
CHF 0,89 / 0,47 CHF 0,66 / 0,21
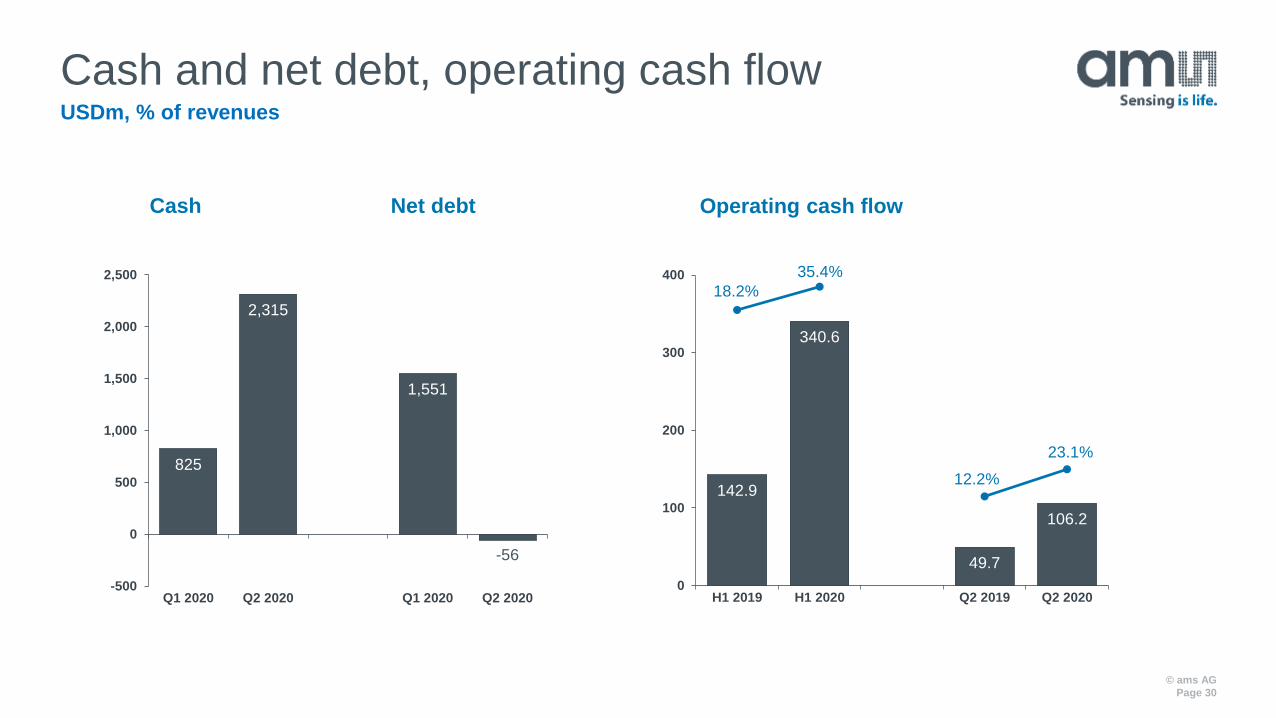
Cash and net debt, operating cash flow
© ams AG
Page 30
USDm, % of revenues
Cash Net debt
825
2,315
1,551
-56
-500
0
500
1,000
1,500
2,000
2,500
Q1 2020 Q2 2020 Q1 2020 Q2 2020
Operating cash flow
142.9
340.6
49.7
106.2
18.2%
35.4%
12.2%
23.1%
0
100
200
300
400
H1 2019 H1 2020 Q2 2019 Q2 2020
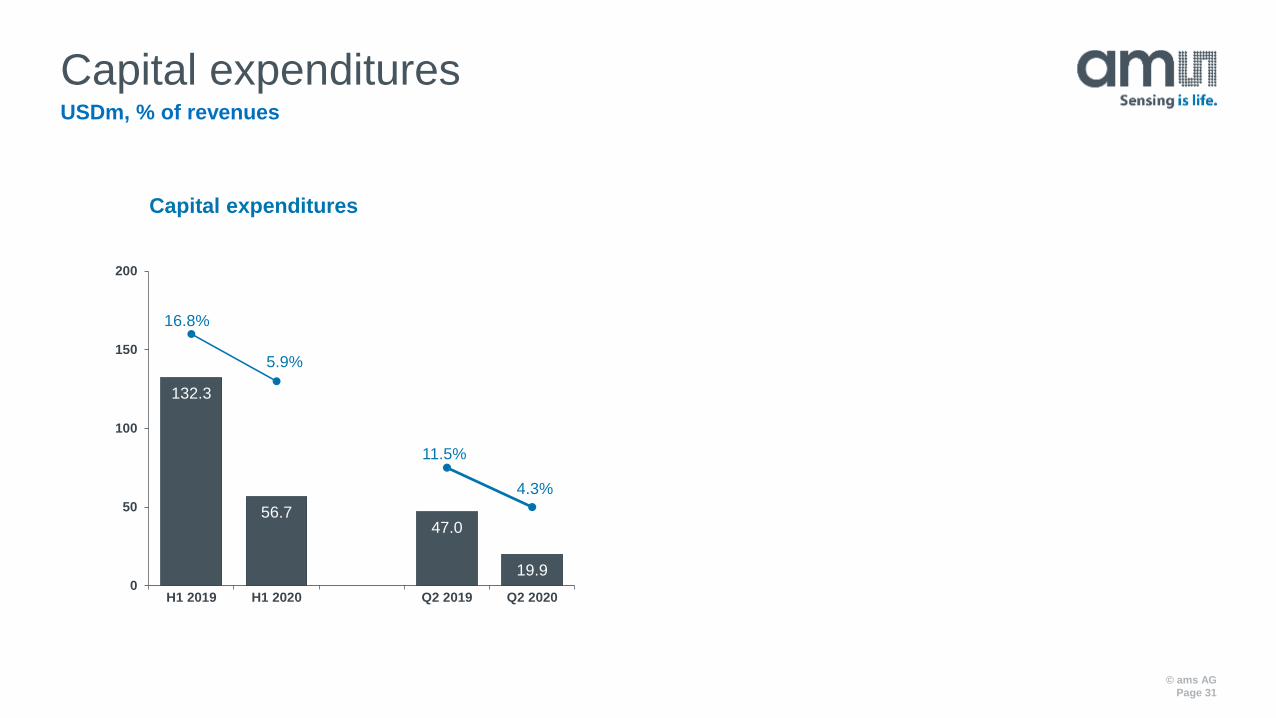
Capital expenditures
© ams AG
Page 31
USDm, % of revenues
Capital expenditures
132.3
56.747.0
19.9
16.8%
5.9%
11.5%
4.3%
0
50
100
150
200
H1 2019 H1 2020 Q2 2019 Q2 2020
Shaping the world with sensor solutions
ams
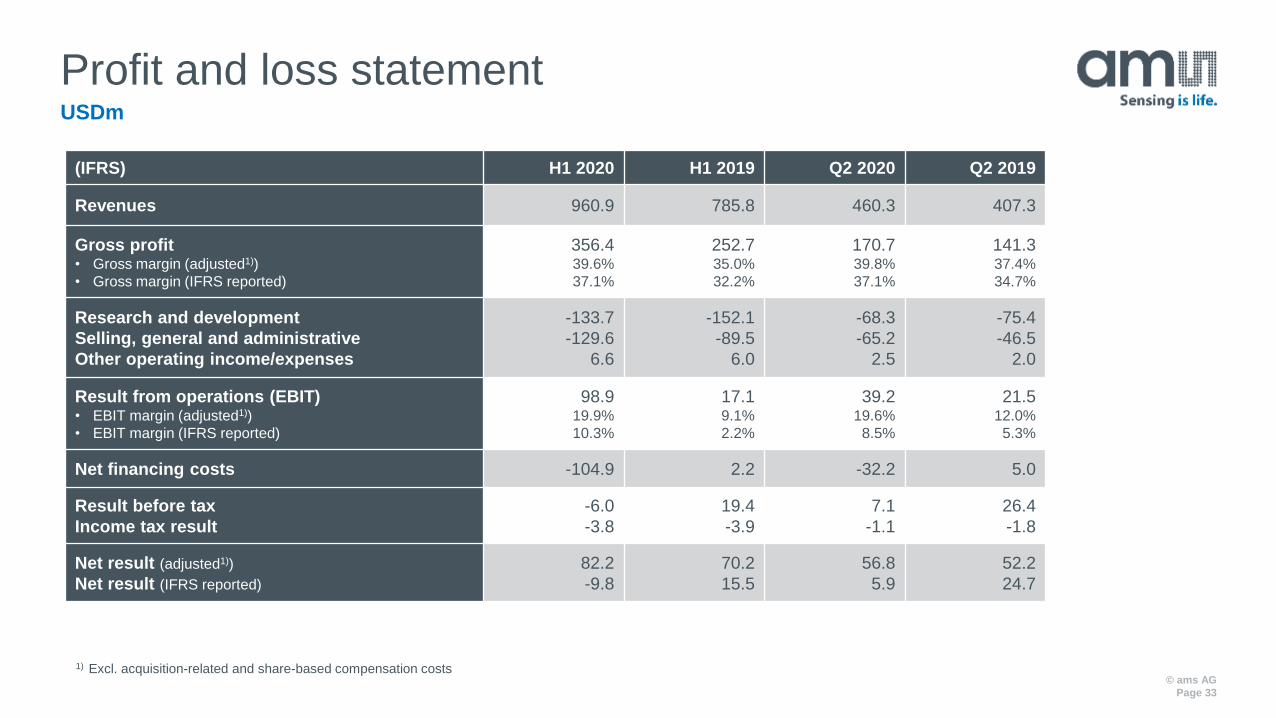
Profit and loss statement
© ams AG
Page 33
USDm
(IFRS) H1 2020 H1 2019 Q2 2020 Q2 2019
Revenues 960.9 785.8 460.3 407.3
Gross profit• Gross margin (adjusted1))
• Gross margin (IFRS reported)
356.439.6%
37.1%
252.735.0%
32.2%
170.739.8%
37.1%
141.337.4%
34.7%
Research and development
Selling, general and administrative
Other operating income/expenses
-133.7
-129.6
6.6
-152.1
-89.5
6.0
-68.3
-65.2
2.5
-75.4
-46.5
2.0
Result from operations (EBIT)• EBIT margin (adjusted1))
• EBIT margin (IFRS reported)
98.919.9%
10.3%
17.19.1%
2.2%
39.219.6%
8.5%
21.512.0%
5.3%
Net financing costs -104.9 2.2 -32.2 5.0
Result before tax
Income tax result
-6.0
-3.8
19.4
-3.9
7.1
-1.1
26.4
-1.8
Net result (adjusted1))
Net result (IFRS reported)
82.2
-9.8
70.2
15.5
56.8
5.9
52.2
24.7
1) Excl. acquisition-related and share-based compensation costs
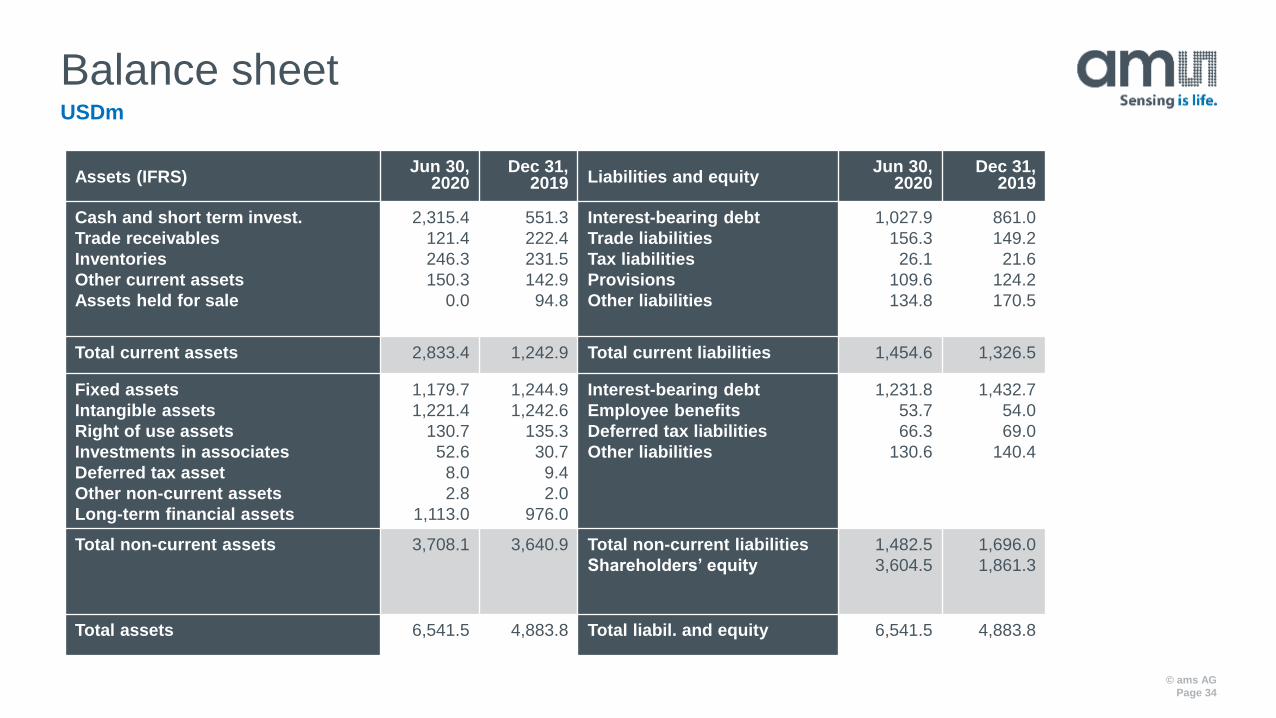
Balance sheet
© ams AG
Page 34
USDm
Assets (IFRS)Jun 30,
2020Dec 31,
2019 Liabilities and equityJun 30,
2020Dec 31,
2019
Cash and short term invest.
Trade receivables
Inventories
Other current assets
Assets held for sale
2,315.4
121.4
246.3
150.3
0.0
551.3
222.4
231.5
142.9
94.8
Interest-bearing debt
Trade liabilities
Tax liabilities
Provisions
Other liabilities
1,027.9
156.3
26.1
109.6
134.8
861.0
149.2
21.6
124.2
170.5
Total current assets 2,833.4 1,242.9 Total current liabilities 1,454.6 1,326.5
Fixed assets
Intangible assets
Right of use assets
Investments in associates
Deferred tax asset
Other non-current assets
Long-term financial assets
1,179.7
1,221.4
130.7
52.6
8.0
2.8
1,113.0
1,244.9
1,242.6
135.3
30.7
9.4
2.0
976.0
Interest-bearing debt
Employee benefits
Deferred tax liabilities
Other liabilities
1,231.8
53.7
66.3
130.6
1,432.7
54.0
69.0
140.4
Total non-current assets 3,708.1 3,640.9 Total non-current liabilities
Shareholders’ equity
1,482.5
3,604.5
1,696.0
1,861.3
Total assets 6,541.5 4,883.8 Total liabil. and equity 6,541.5 4,883.8
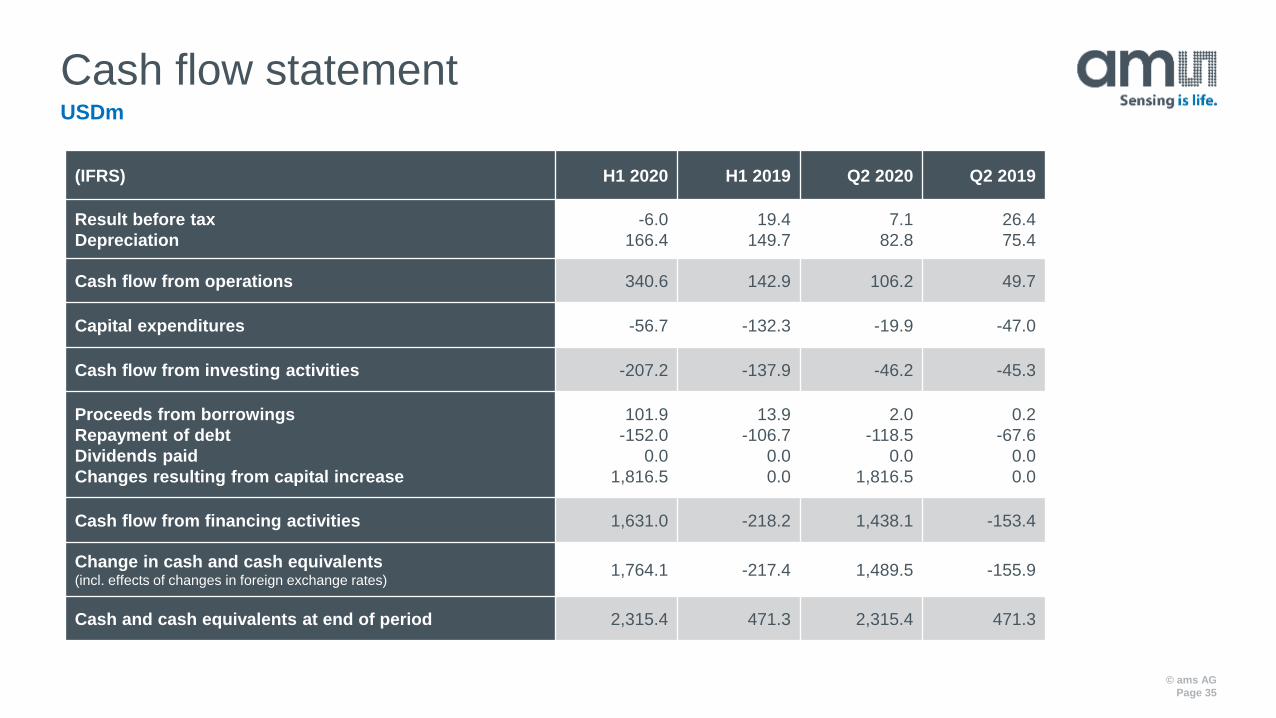
Cash flow statement
© ams AG
Page 35
USDm
(IFRS) H1 2020 H1 2019 Q2 2020 Q2 2019
Result before tax
Depreciation
-6.0
166.4
19.4
149.7
7.1
82.8
26.4
75.4
Cash flow from operations 340.6 142.9 106.2 49.7
Capital expenditures -56.7 -132.3 -19.9 -47.0
Cash flow from investing activities -207.2 -137.9 -46.2 -45.3
Proceeds from borrowings
Repayment of debt
Dividends paid
Changes resulting from capital increase
101.9
-152.0
0.0
1,816.5
13.9
-106.7
0.0
0.0
2.0
-118.5
0.0
1,816.5
0.2
-67.6
0.0
0.0
Cash flow from financing activities 1,631.0 -218.2 1,438.1 -153.4
Change in cash and cash equivalents(incl. effects of changes in foreign exchange rates)
1,764.1 -217.4 1,489.5 -155.9
Cash and cash equivalents at end of period 2,315.4 471.3 2,315.4 471.3