Embed Size (px)
Citation preview
To us there are no foreign markets.™
INVESTOR PRESENTATION | November 2017
Second Quarter Fiscal 2018
To us there are no foreign markets.™To us there are no foreign markets.™
How We Are Creating Shareholder Value
Page 2
Drive a strong culture
Continue to builda stable and scalablewealth management
business and a focusedand independent mid-
marketinvestment bank
Improve stability
Remain agile
Strong focus on cost containment
Create a dominantmid-market competitor
Complete alignment with shareholders
Expanding wealth management
To us there are no foreign markets.™
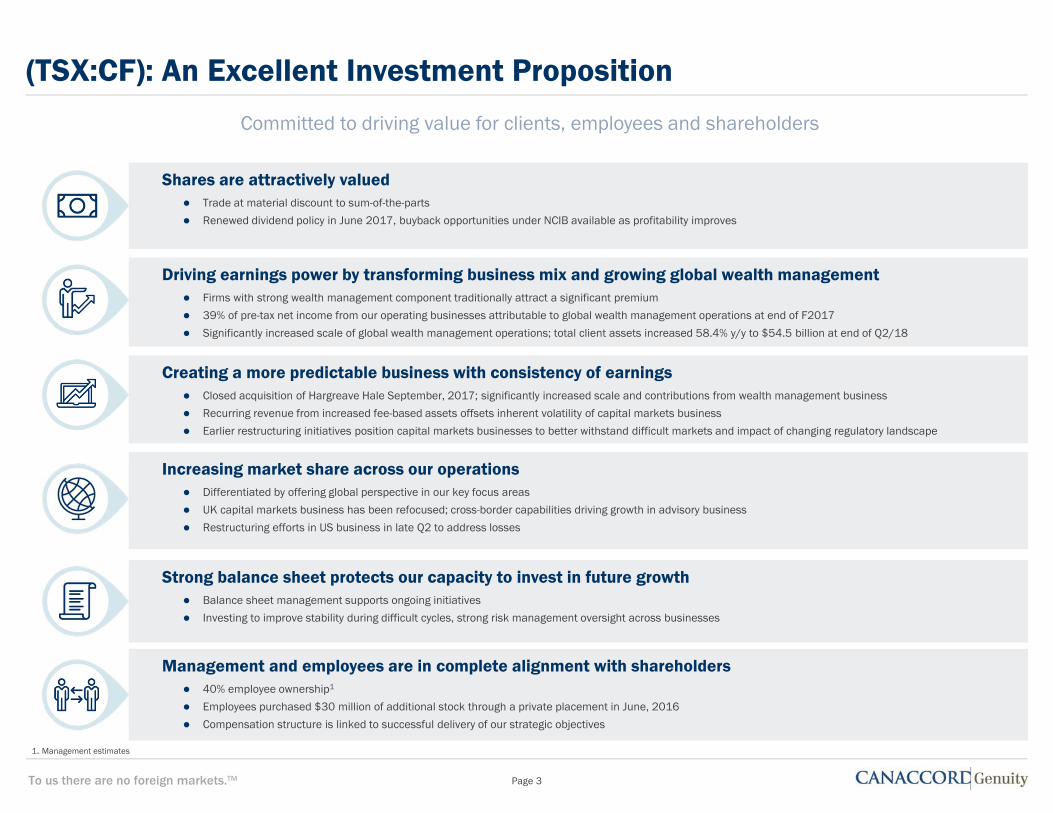
(TSX:CF): An Excellent Investment Proposition
Page 3
Management and employees are in complete alignment with shareholders 40% employee ownership1
Employees purchased $30 million of additional stock through a private placement in June, 2016
Compensation structure is linked to successful delivery of our strategic objectives
Strong balance sheet protects our capacity to invest in future growth Balance sheet management supports ongoing initiatives
Investing to improve stability during difficult cycles, strong risk management oversight across businesses
Committed to driving value for clients, employees and shareholders
Creating a more predictable business with consistency of earnings Closed acquisition of Hargreave Hale September, 2017; significantly increased scale and contributions from wealth management business
Recurring revenue from increased fee-based assets offsets inherent volatility of capital markets business
Earlier restructuring initiatives position capital markets businesses to better withstand difficult markets and impact of changing regulatory landscape
Driving earnings power by transforming business mix and growing global wealth management Firms with strong wealth management component traditionally attract a significant premium
39% of pre-tax net income from our operating businesses attributable to global wealth management operations at end of F2017
Significantly increased scale of global wealth management operations; total client assets increased 58.4% y/y to $54.5 billion at end of Q2/18
Increasing market share across our operations Differentiated by offering global perspective in our key focus areas
UK capital markets business has been refocused; cross-border capabilities driving growth in advisory business
Restructuring efforts in US business in late Q2 to address losses
Shares are attractively valued Trade at material discount to sum-of-the-parts
Renewed dividend policy in June 2017, buyback opportunities under NCIB available as profitability improves
1. Management estimates
To us there are no foreign markets.™
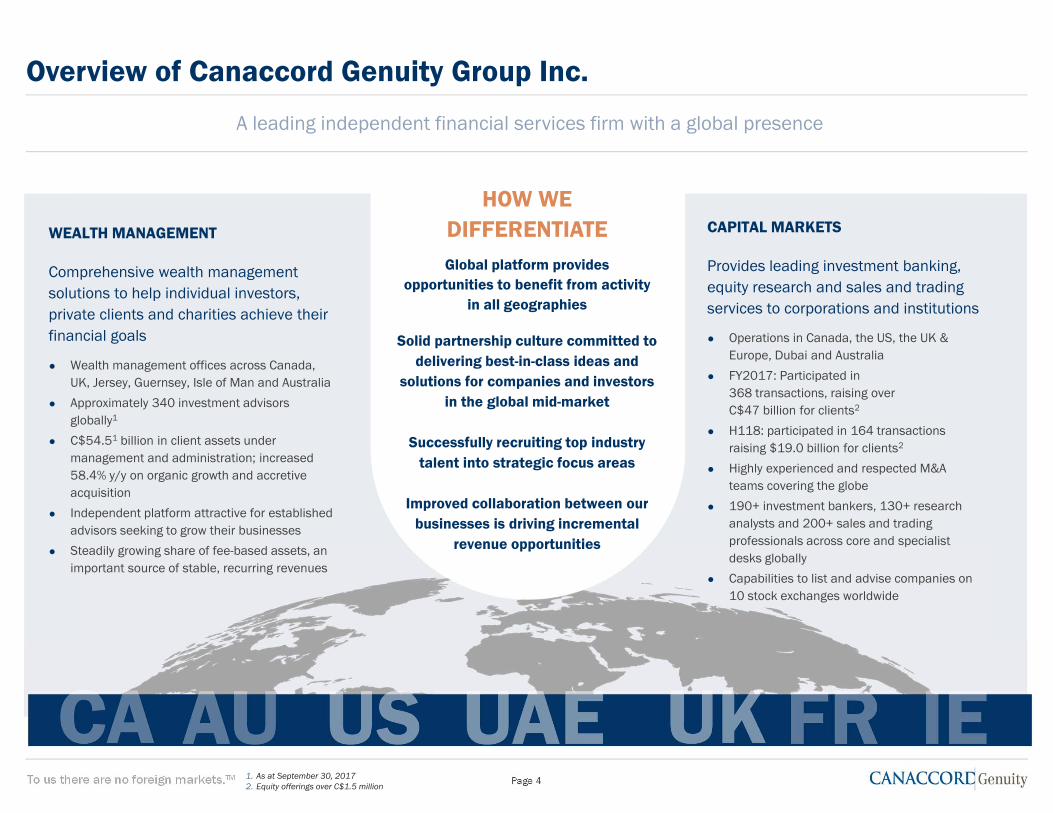
Overview of Canaccord Genuity Group Inc.
Page 4
A leading independent financial services firm with a global presence
CAPITAL MARKETS
Provides leading investment banking, equity research and sales and trading services to corporations and institutions
Operations in Canada, the US, the UK & Europe, Dubai and Australia
FY2017: Participated in 368 transactions, raising over C$47 billion for clients2
H118: participated in 164 transactions raising $19.0 billion for clients2
Highly experienced and respected M&A teams covering the globe
190+ investment bankers, 130+ research analysts and 200+ sales and trading professionals across core and specialist desks globally
Capabilities to list and advise companies on 10 stock exchanges worldwide
WEALTH MANAGEMENT
Comprehensive wealth management solutions to help individual investors, private clients and charities achieve their financial goals
Wealth management offices across Canada, UK, Jersey, Guernsey, Isle of Man and Australia
Approximately 340 investment advisors globally1
C$54.51 billion in client assets under management and administration; increased 58.4% y/y on organic growth and accretive acquisition
Independent platform attractive for established advisors seeking to grow their businesses
Steadily growing share of fee-based assets, an important source of stable, recurring revenues
HOW WE DIFFERENTIATEGlobal platform provides
opportunities to benefit from activity in all geographies
Solid partnership culture committed to delivering best-in-class ideas and
solutions for companies and investors in the global mid-market
Successfully recruiting top industry talent into strategic focus areas
Improved collaboration between our businesses is driving incremental
revenue opportunities
1. As at September 30, 20172. Equity offerings over C$1.5 million
To us there are no foreign markets.™
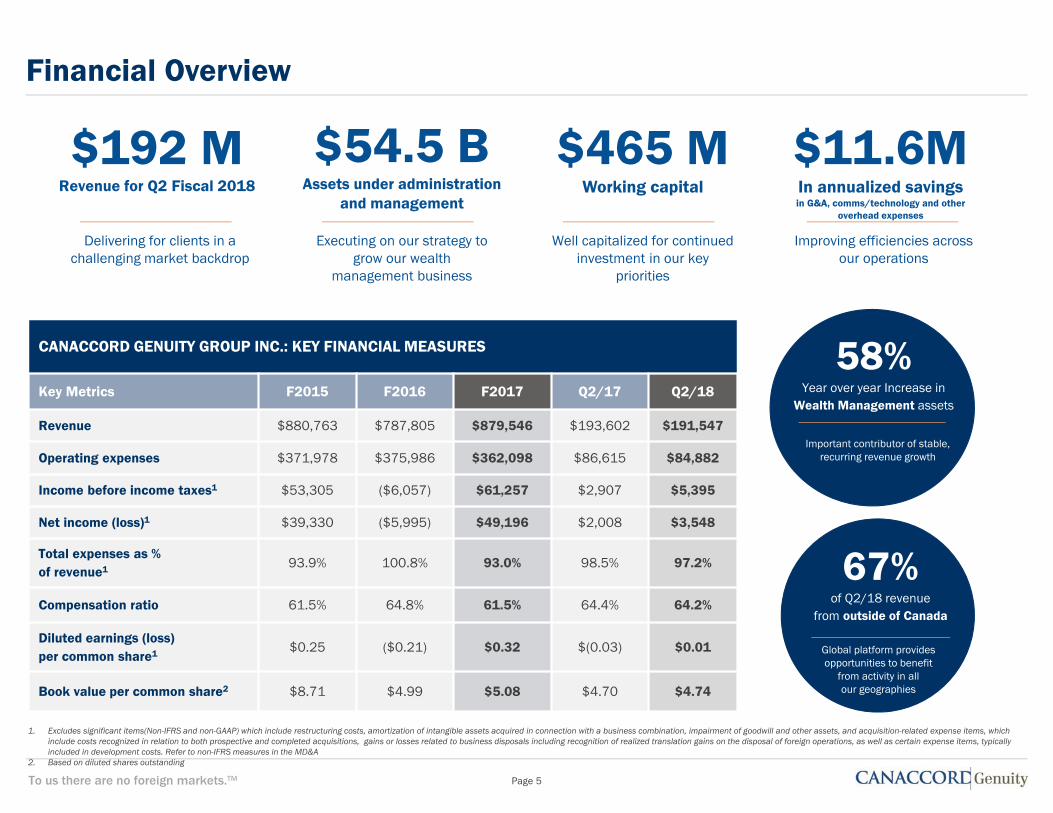
Financial Overview
Page 5
CANACCORD GENUITY GROUP INC.: KEY FINANCIAL MEASURES
Key Metrics F2015 F2016 F2017 Q2/17 Q2/18
Revenue $880,763 $787,805 $879,546 $193,602 $191,547
Operating expenses $371,978 $375,986 $362,098 $86,615 $84,882
Income before income taxes1 $53,305 ($6,057) $61,257 $2,907 $5,395
Net income (loss)1 $39,330 ($5,995) $49,196 $2,008 $3,548
Total expenses as % of revenue1 93.9% 100.8% 93.0% 98.5% 97.2%
Compensation ratio 61.5% 64.8% 61.5% 64.4% 64.2%
Diluted earnings (loss) per common share1 $0.25 ($0.21) $0.32 $(0.03) $0.01
Book value per common share2 $8.71 $4.99 $5.08 $4.70 $4.74
1. Excludes significant items(Non-IFRS and non-GAAP) which include restructuring costs, amortization of intangible assets acquired in connection with a business combination, impairment of goodwill and other assets, and acquisition-related expense items, whichinclude costs recognized in relation to both prospective and completed acquisitions, gains or losses related to business disposals including recognition of realized translation gains on the disposal of foreign operations, as well as certain expense items, typically included in development costs. Refer to non-IFRS measures in the MD&A
2. Based on diluted shares outstanding
Delivering for clients in a challenging market backdrop
$192 M Revenue for Q2 Fiscal 2018
Well capitalized for continued investment in our key
priorities
$11.6MIn annualized savingsin G&A, comms/technology and other
overhead expenses
$54.5 BAssets under administration
and management
Improving efficiencies across our operations
$465 M Working capital
Executing on our strategy to grow our wealth
management business
Important contributor of stable, recurring revenue growth
58%Year over year Increase in
Wealth Management assets
67%of Q2/18 revenue
from outside of Canada
Global platform provides opportunities to benefit
from activity in all our geographies
To us there are no foreign markets.™
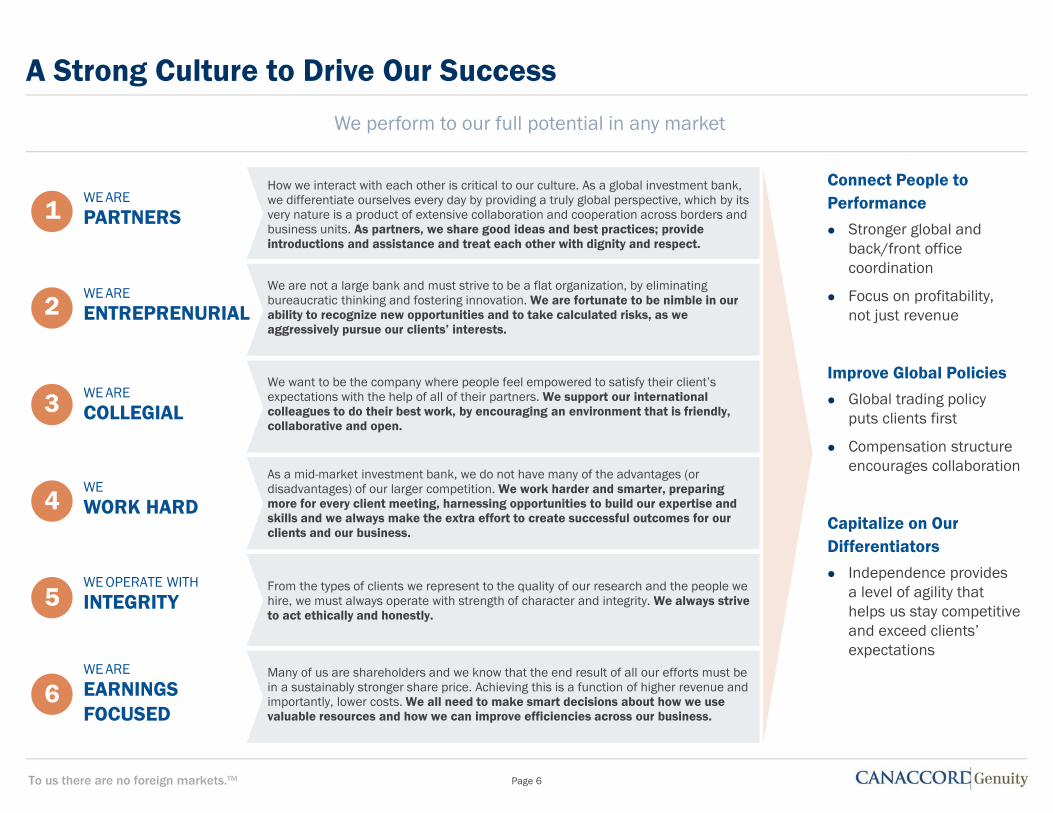
A Strong Culture to Drive Our Success
Connect People to Performance Stronger global and
back/front office coordination
Focus on profitability, not just revenue
Improve Global Policies Global trading policy
puts clients first
Compensation structure encourages collaboration
Capitalize on Our Differentiators Independence provides
a level of agility that helps us stay competitive and exceed clients’ expectations
Page 6
We perform to our full potential in any market
WE ARE
PARTNERS
2
1
4
3
5
6
WE ARE
ENTREPRENURIAL
WE ARE
COLLEGIAL
WE
WORK HARD
WE OPERATE WITH
INTEGRITY
WE ARE
EARNINGSFOCUSED
How we interact with each other is critical to our culture. As a global investment bank, we differentiate ourselves every day by providing a truly global perspective, which by its very nature is a product of extensive collaboration and cooperation across borders and business units. As partners, we share good ideas and best practices; provide introductions and assistance and treat each other with dignity and respect.
We are not a large bank and must strive to be a flat organization, by eliminating bureaucratic thinking and fostering innovation. We are fortunate to be nimble in our ability to recognize new opportunities and to take calculated risks, as we aggressively pursue our clients’ interests.
We want to be the company where people feel empowered to satisfy their client’s expectations with the help of all of their partners. We support our international colleagues to do their best work, by encouraging an environment that is friendly, collaborative and open.
As a mid-market investment bank, we do not have many of the advantages (or disadvantages) of our larger competition. We work harder and smarter, preparing more for every client meeting, harnessing opportunities to build our expertise and skills and we always make the extra effort to create successful outcomes for our clients and our business.
From the types of clients we represent to the quality of our research and the people we hire, we must always operate with strength of character and integrity. We always strive to act ethically and honestly.
Many of us are shareholders and we know that the end result of all our efforts must be in a sustainably stronger share price. Achieving this is a function of higher revenue and importantly, lower costs. We all need to make smart decisions about how we use valuable resources and how we can improve efficiencies across our business.
To us there are no foreign markets.™
Expanding Global Wealth Management
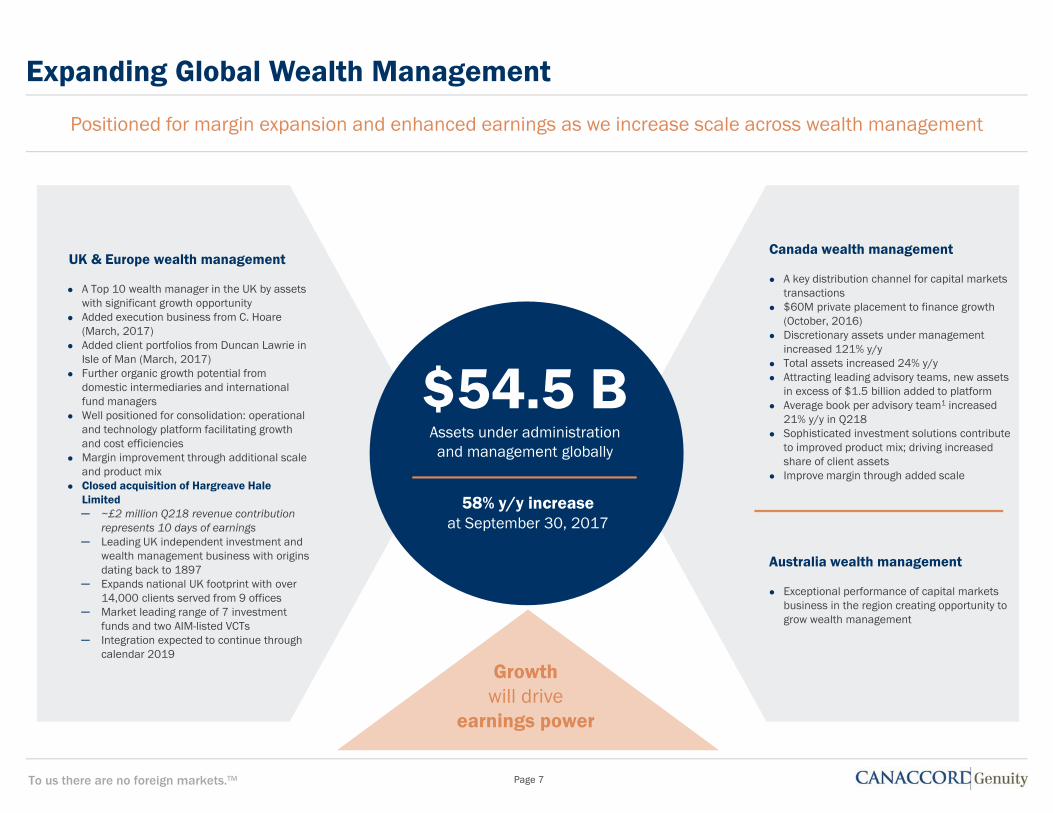
Positioned for margin expansion and enhanced earnings as we increase scale across wealth management
Canada wealth management
A key distribution channel for capital markets transactions
$60M private placement to finance growth (October, 2016)
Discretionary assets under management increased 121% y/y
Total assets increased 24% y/y Attracting leading advisory teams, new assets
in excess of $1.5 billion added to platform Average book per advisory team1 increased
21% y/y in Q218 Sophisticated investment solutions contribute
to improved product mix; driving increased share of client assets
Improve margin through added scale
Australia wealth management
Exceptional performance of capital markets business in the region creating opportunity to grow wealth management
UK & Europe wealth management
A Top 10 wealth manager in the UK by assets with significant growth opportunity
Added execution business from C. Hoare (March, 2017)
Added client portfolios from Duncan Lawrie in Isle of Man (March, 2017)
Further organic growth potential from domestic intermediaries and international fund managers
Well positioned for consolidation: operational and technology platform facilitating growth and cost efficiencies
Margin improvement through additional scale and product mix
Closed acquisition of Hargreave Hale Limited─ ~£2 million Q218 revenue contribution
represents 10 days of earnings─ Leading UK independent investment and
wealth management business with origins dating back to 1897
─ Expands national UK footprint with over 14,000 clients served from 9 offices
─ Market leading range of 7 investment funds and two AIM-listed VCTs
─ Integration expected to continue through calendar 2019
$54.5 BAssets under administration and management globally
58% y/y increase at September 30, 2017
Growthwill drive
earnings power
Page 7
To us there are no foreign markets.™
Improve Stability
Page 8
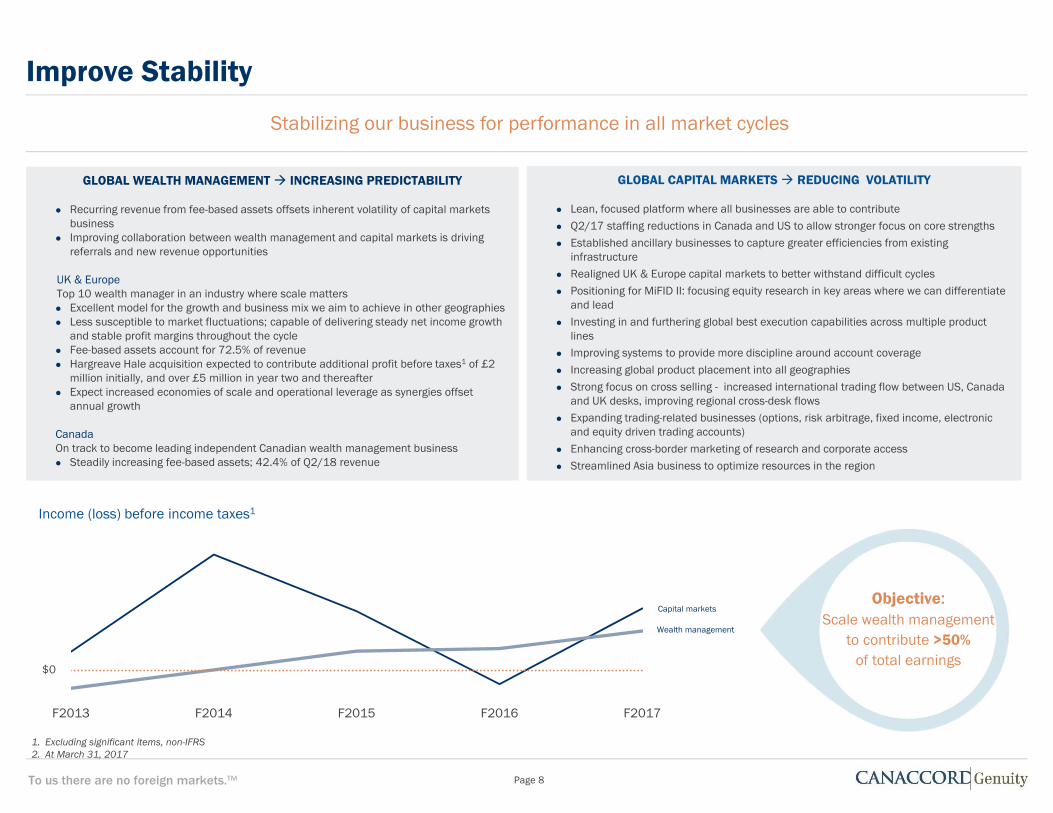
Stabilizing our business for performance in all market cycles
F2013 F2014 F2015 F2016 F2017
Capital markets
Income (loss) before income taxes1
1. Excluding significant items, non-IFRS2. At March 31, 2017
Objective: Scale wealth management
to contribute >50% of total earnings
Wealth management
$0
GLOBAL WEALTH MANAGEMENT INCREASING PREDICTABILITY
Recurring revenue from fee-based assets offsets inherent volatility of capital markets business
Improving collaboration between wealth management and capital markets is driving referrals and new revenue opportunities
UK & EuropeTop 10 wealth manager in an industry where scale matters Excellent model for the growth and business mix we aim to achieve in other geographies Less susceptible to market fluctuations; capable of delivering steady net income growth
and stable profit margins throughout the cycle Fee-based assets account for 72.5% of revenue Hargreave Hale acquisition expected to contribute additional profit before taxes1 of £2
million initially, and over £5 million in year two and thereafter Expect increased economies of scale and operational leverage as synergies offset
annual growth
CanadaOn track to become leading independent Canadian wealth management business Steadily increasing fee-based assets; 42.4% of Q2/18 revenue
GLOBAL CAPITAL MARKETS REDUCING VOLATILITY
Lean, focused platform where all businesses are able to contribute Q2/17 staffing reductions in Canada and US to allow stronger focus on core strengths Established ancillary businesses to capture greater efficiencies from existing
infrastructure Realigned UK & Europe capital markets to better withstand difficult cycles Positioning for MiFID II: focusing equity research in key areas where we can differentiate
and lead Investing in and furthering global best execution capabilities across multiple product
lines Improving systems to provide more discipline around account coverage Increasing global product placement into all geographies Strong focus on cross selling - increased international trading flow between US, Canada
and UK desks, improving regional cross-desk flows Expanding trading-related businesses (options, risk arbitrage, fixed income, electronic
and equity driven trading accounts) Enhancing cross-border marketing of research and corporate access Streamlined Asia business to optimize resources in the region
To us there are no foreign markets.™
Remain Agile
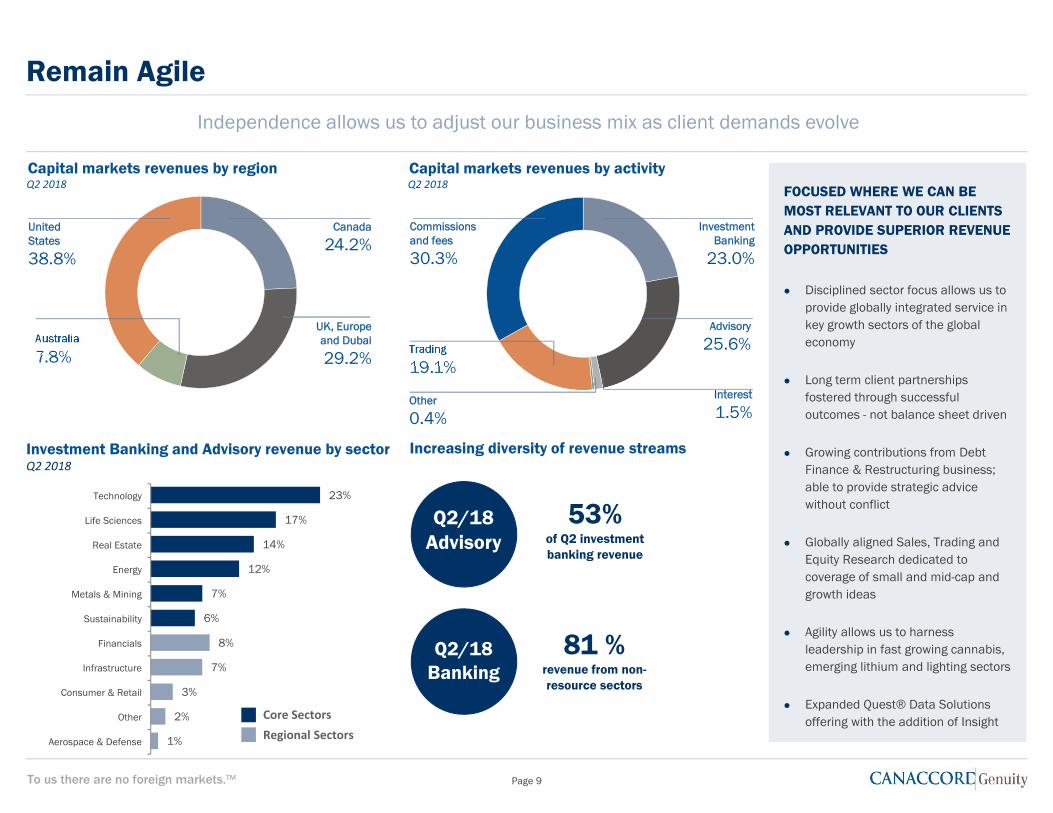
Independence allows us to adjust our business mix as client demands evolve
FOCUSED WHERE WE CAN BE MOST RELEVANT TO OUR CLIENTS AND PROVIDE SUPERIOR REVENUE OPPORTUNITIES
Disciplined sector focus allows us to provide globally integrated service in key growth sectors of the global economy
Long term client partnerships fostered through successful outcomes - not balance sheet driven
Growing contributions from Debt Finance & Restructuring business; able to provide strategic advice without conflict
Globally aligned Sales, Trading and Equity Research dedicated to coverage of small and mid-cap and growth ideas
Agility allows us to harness leadership in fast growing cannabis, emerging lithium and lighting sectors
Expanded Quest® Data Solutions offering with the addition of Insight
23%
17%
14%
12%
7%
6%
8%
7%
3%
2%
1%
Technology
Life Sciences
Real Estate
Energy
Metals & Mining
Sustainability
Financials
Infrastructure
Consumer & Retail
Other
Aerospace & Defense
Investment Banking and Advisory revenue by sectorQ2 2018
Capital markets revenues by regionQ2 2018
Capital markets revenues by activityQ2 2018
Increasing diversity of revenue streams
33.1%Increase in
principal trading revenue for Fiscal
2017
Core SectorsRegional Sectors
F2017
Advisory53%
of Q2 investment banking revenue
Q2/18Advisory
81 %revenue from non-resource sectors
Q2/18Banking
UK, Europe and Dubai
29.2%
Canada
24.2%United States
38.8%
Australia
7.8%
Other
0.4%
Commissions and fees
30.3%
Trading
19.1%
InvestmentBanking
23.0%
Advisory
25.6%
Interest
1.5%
Page 9
To us there are no foreign markets.™
OPPORTUNITIES
Additional G&A savings anticipated as measures take effect through F2018
Globally integrated CRM platform provides stronger discipline around account coverage across global capital markets businesses
Operating efficiencies will continue to improve in wealth management businesses with increased scale
Strong Focus on Cost Containment
Page 10
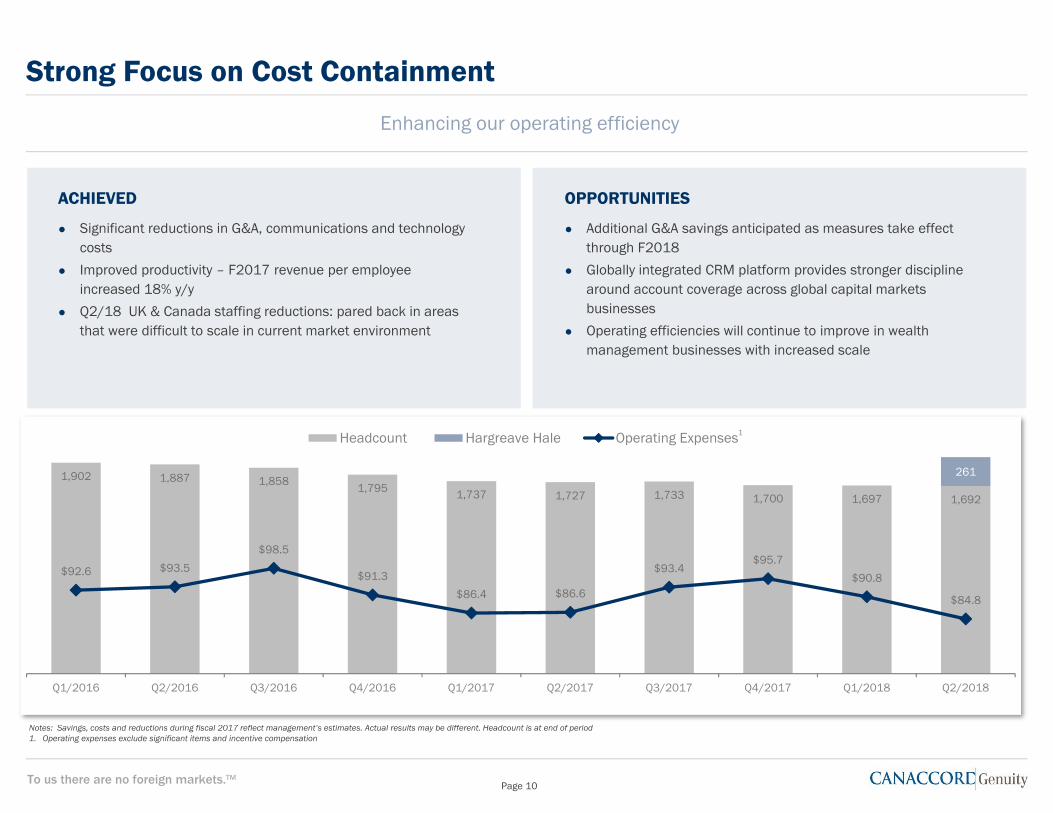
Enhancing our operating efficiency
ACHIEVED
Significant reductions in G&A, communications and technology costs
Improved productivity – F2017 revenue per employee increased 18% y/y
Q2/18 UK & Canada staffing reductions: pared back in areas that were difficult to scale in current market environment
Notes: Savings, costs and reductions during fiscal 2017 reflect management’s estimates. Actual results may be different. Headcount is at end of period1. Operating expenses exclude significant items and incentive compensation
1,902 1,887 1,8581,795 1,737 1,727 1,733 1,700 1,697 1,692
261
$92.6 $93.5
$98.5
$91.3
$86.4 $86.6
$93.4$95.7
$90.8
$84.8
Q1/2016 Q2/2016 Q3/2016 Q4/2016 Q1/2017 Q2/2017 Q3/2017 Q4/2017 Q1/2018 Q2/2018
Headcount Hargreave Hale Operating Expenses1
To us there are no foreign markets.™
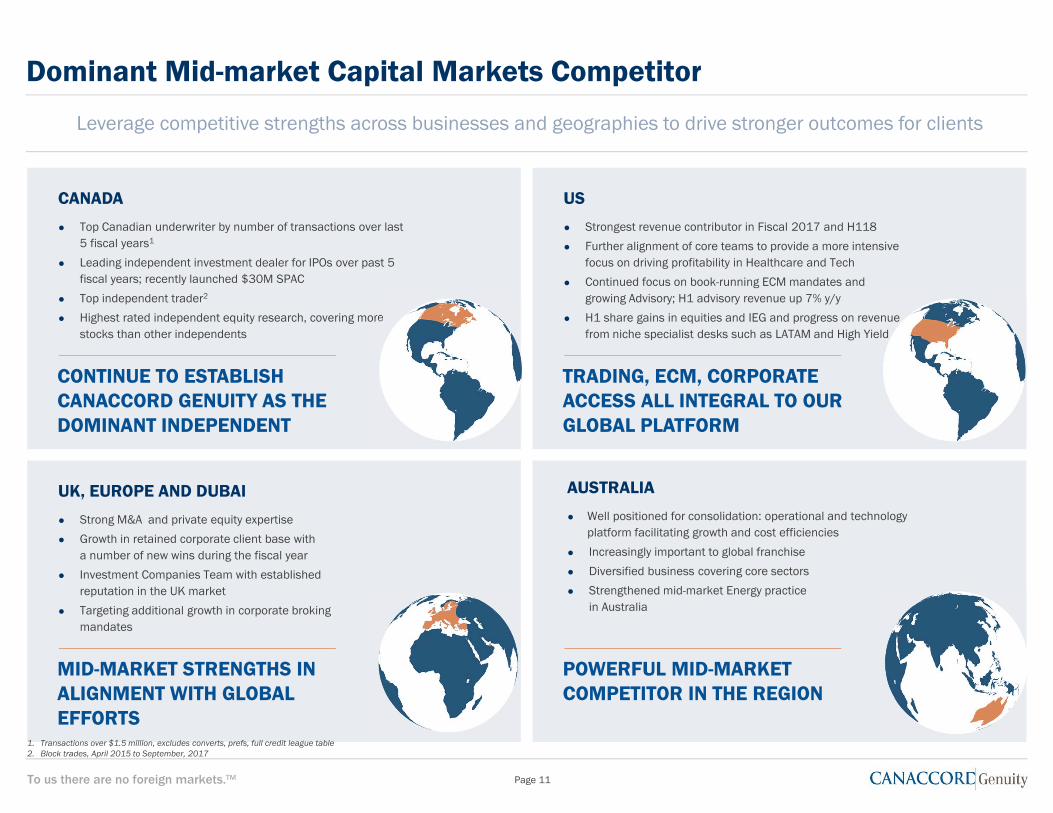
Dominant Mid-market Capital Markets Competitor
Page 11
Leverage competitive strengths across businesses and geographies to drive stronger outcomes for clients
CANADA
Top Canadian underwriter by number of transactions over last 5 fiscal years1
Leading independent investment dealer for IPOs over past 5 fiscal years; recently launched $30M SPAC
Top independent trader2
Highest rated independent equity research, covering more stocks than other independents
CONTINUE TO ESTABLISH CANACCORD GENUITY AS THE DOMINANT INDEPENDENT
TRADING, ECM, CORPORATE ACCESS ALL INTEGRAL TO OUR GLOBAL PLATFORM
UK, EUROPE AND DUBAI
Strong M&A and private equity expertise
Growth in retained corporate client base with a number of new wins during the fiscal year
Investment Companies Team with established reputation in the UK market
Targeting additional growth in corporate broking mandates
MID-MARKET STRENGTHS IN ALIGNMENT WITH GLOBAL EFFORTS
AUSTRALIA
Well positioned for consolidation: operational and technology platform facilitating growth and cost efficiencies
Increasingly important to global franchise
Diversified business covering core sectors
Strengthened mid-market Energy practice in Australia
POWERFUL MID-MARKET COMPETITOR IN THE REGION
1. Transactions over $1.5 million, excludes converts, prefs, full credit league table2. Block trades, April 2015 to September, 2017
US
Strongest revenue contributor in Fiscal 2017 and H118
Further alignment of core teams to provide a more intensive focus on driving profitability in Healthcare and Tech
Continued focus on book-running ECM mandates and growing Advisory; H1 advisory revenue up 7% y/y
H1 share gains in equities and IEG and progress on revenue from niche specialist desks such as LATAM and High Yield
To us there are no foreign markets.™
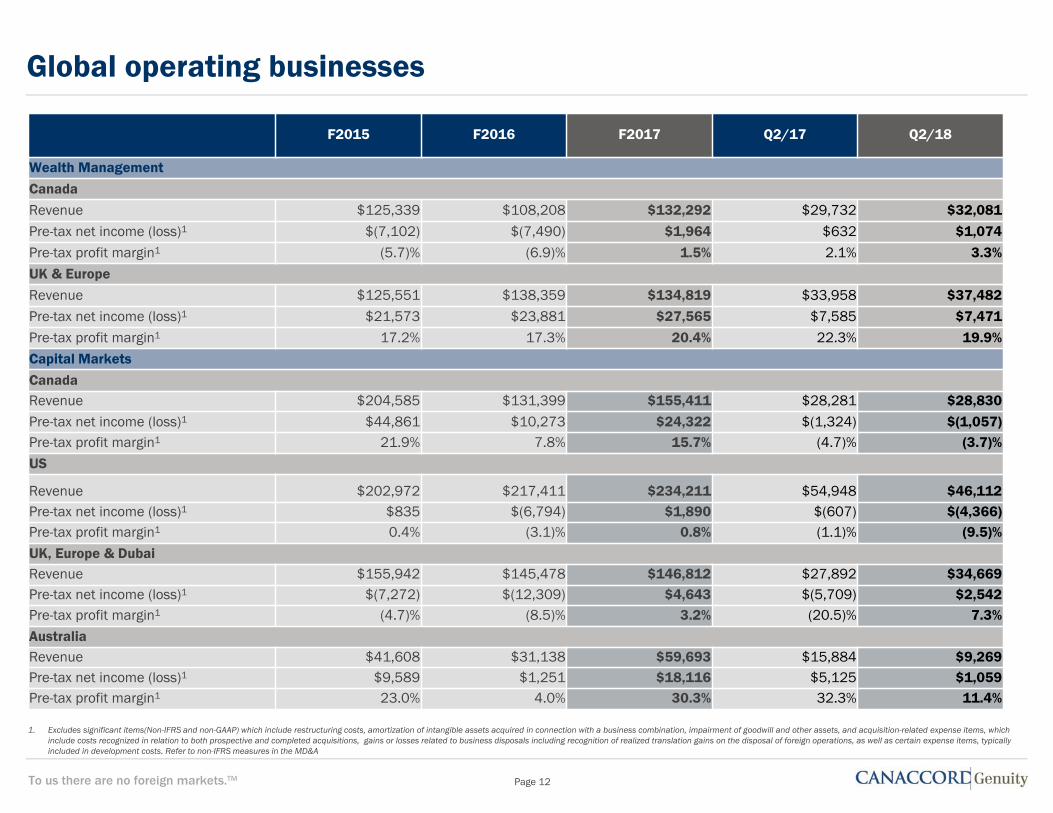
Global operating businesses
F2015 F2016 F2017 Q2/17 Q2/18
Wealth ManagementCanada Revenue $125,339 $108,208 $132,292 $29,732 $32,081Pre-tax net income (loss)1 $(7,102) $(7,490) $1,964 $632 $1,074Pre-tax profit margin1 (5.7)% (6.9)% 1.5% 2.1% 3.3%UK & EuropeRevenue $125,551 $138,359 $134,819 $33,958 $37,482Pre-tax net income (loss)1 $21,573 $23,881 $27,565 $7,585 $7,471Pre-tax profit margin1 17.2% 17.3% 20.4% 22.3% 19.9%Capital MarketsCanadaRevenue $204,585 $131,399 $155,411 $28,281 $28,830Pre-tax net income (loss)1 $44,861 $10,273 $24,322 $(1,324) $(1,057)Pre-tax profit margin1 21.9% 7.8% 15.7% (4.7)% (3.7)%US
Revenue $202,972 $217,411 $234,211 $54,948 $46,112Pre-tax net income (loss)1 $835 $(6,794) $1,890 $(607) $(4,366)Pre-tax profit margin1 0.4% (3.1)% 0.8% (1.1)% (9.5)%UK, Europe & DubaiRevenue $155,942 $145,478 $146,812 $27,892 $34,669Pre-tax net income (loss)1 $(7,272) $(12,309) $4,643 $(5,709) $2,542Pre-tax profit margin1 (4.7)% (8.5)% 3.2% (20.5)% 7.3%AustraliaRevenue $41,608 $31,138 $59,693 $15,884 $9,269Pre-tax net income (loss)1 $9,589 $1,251 $18,116 $5,125 $1,059Pre-tax profit margin1 23.0% 4.0% 30.3% 32.3% 11.4%
1. Excludes significant items(Non-IFRS and non-GAAP) which include restructuring costs, amortization of intangible assets acquired in connection with a business combination, impairment of goodwill and other assets, and acquisition-related expense items, whichinclude costs recognized in relation to both prospective and completed acquisitions, gains or losses related to business disposals including recognition of realized translation gains on the disposal of foreign operations, as well as certain expense items, typically included in development costs. Refer to non-IFRS measures in the MD&A
Page 12
To us there are no foreign markets.™
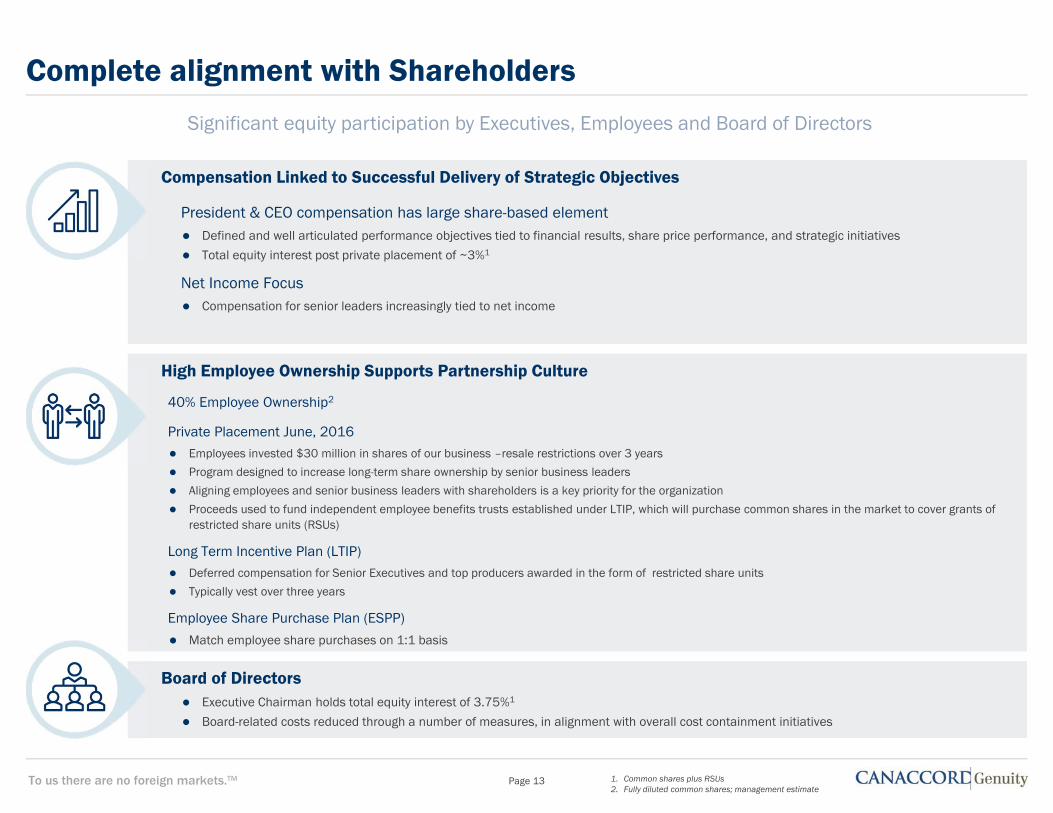
Complete alignment with Shareholders
Page 13
Compensation Linked to Successful Delivery of Strategic Objectives
• President & CEO compensation has large share-based element Defined and well articulated performance objectives tied to financial results, share price performance, and strategic initiatives
Total equity interest post private placement of ~3%1
• Net Income Focus Compensation for senior leaders increasingly tied to net income
High Employee Ownership Supports Partnership Culture
Board of Directors Executive Chairman holds total equity interest of 3.75%1
Board-related costs reduced through a number of measures, in alignment with overall cost containment initiatives
1. Common shares plus RSUs2. Fully diluted common shares; management estimate
Significant equity participation by Executives, Employees and Board of Directors
• 40% Employee Ownership2
• Private Placement June, 2016 Employees invested $30 million in shares of our business –resale restrictions over 3 years
Program designed to increase long-term share ownership by senior business leaders
Aligning employees and senior business leaders with shareholders is a key priority for the organization
Proceeds used to fund independent employee benefits trusts established under LTIP, which will purchase common shares in the market to cover grants of restricted share units (RSUs)
• Long Term Incentive Plan (LTIP) Deferred compensation for Senior Executives and top producers awarded in the form of restricted share units
Typically vest over three years
• Employee Share Purchase Plan (ESPP)
Match employee share purchases on 1:1 basis
To us there are no foreign markets.™
(TSX:CF): An Excellent Investment Proposition
Page 14
Committed to driving value for clients, employees and shareholders
Shares are attractively valued
Management and employees are in complete alignment with shareholders
Strong balance sheet protects our capacity to invest in future growth
Driving earnings power by transforming business mix and growing global wealth management
Increasing market share across our operations
Creating a more predictable business with consistency of earnings
To us there are no foreign markets.™
Analyst Coverage
Cormark SecuritiesJeff Fenwick
TD Securities Inc.Graham Ryding
Canaccord Genuity Group Inc. is followed by the analysts listed above. Please note that any opinions, estimates or forecasts regarding Canaccord Genuity's performance made by these analysts are theirs alone and do not represent opinions, forecasts or predictions of the Company or its management. Canaccord Genuity does not by its reference above or distribution imply its endorsement of or concurrence with such information, conclusions or recommendations.
To us there are no foreign markets.™
To us there are no foreign markets.™
Financial Performance
Capital Metrics, Quarterly Performance, Annual PerformanceCanaccord Genuity – Financial snapshotWealth Management – Financial snapshot
To us there are no foreign markets.™
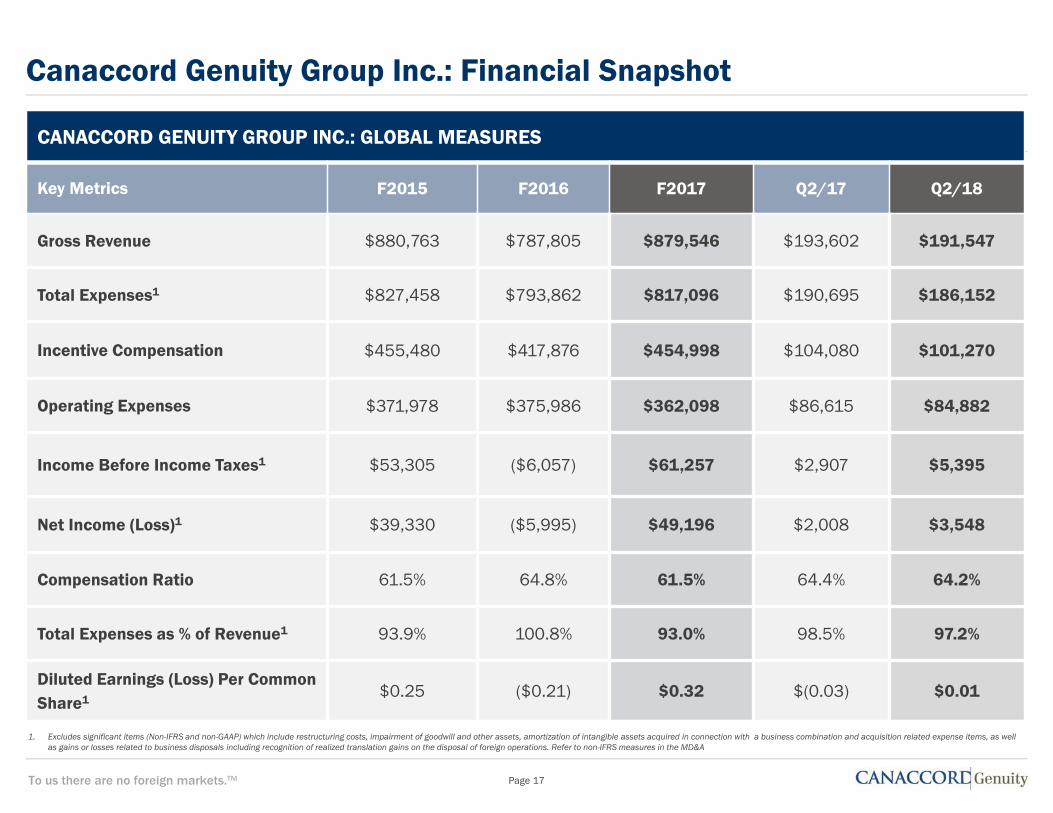
Canaccord Genuity Group Inc.: Financial Snapshot
Page 17
CANACCORD GENUITY GROUP INC.: GLOBAL MEASURES
Key Metrics F2015 F2016 F2017 Q2/17 Q2/18
Gross Revenue $880,763 $787,805 $879,546 $193,602 $191,547
Total Expenses1 $827,458 $793,862 $817,096 $190,695 $186,152
Incentive Compensation $455,480 $417,876 $454,998 $104,080 $101,270
Operating Expenses $371,978 $375,986 $362,098 $86,615 $84,882
Income Before Income Taxes1 $53,305 ($6,057) $61,257 $2,907 $5,395
Net Income (Loss)1 $39,330 ($5,995) $49,196 $2,008 $3,548
Compensation Ratio 61.5% 64.8% 61.5% 64.4% 64.2%
Total Expenses as % of Revenue1 93.9% 100.8% 93.0% 98.5% 97.2%
Diluted Earnings (Loss) Per Common Share1 $0.25 ($0.21) $0.32 $(0.03) $0.01
1. Excludes significant items (Non-IFRS and non-GAAP) which include restructuring costs, impairment of goodwill and other assets, amortization of intangible assets acquired in connection with a business combination and acquisition related expense items, as well as gains or losses related to business disposals including recognition of realized translation gains on the disposal of foreign operations. Refer to non-IFRS measures in the MD&A
To us there are no foreign markets.™
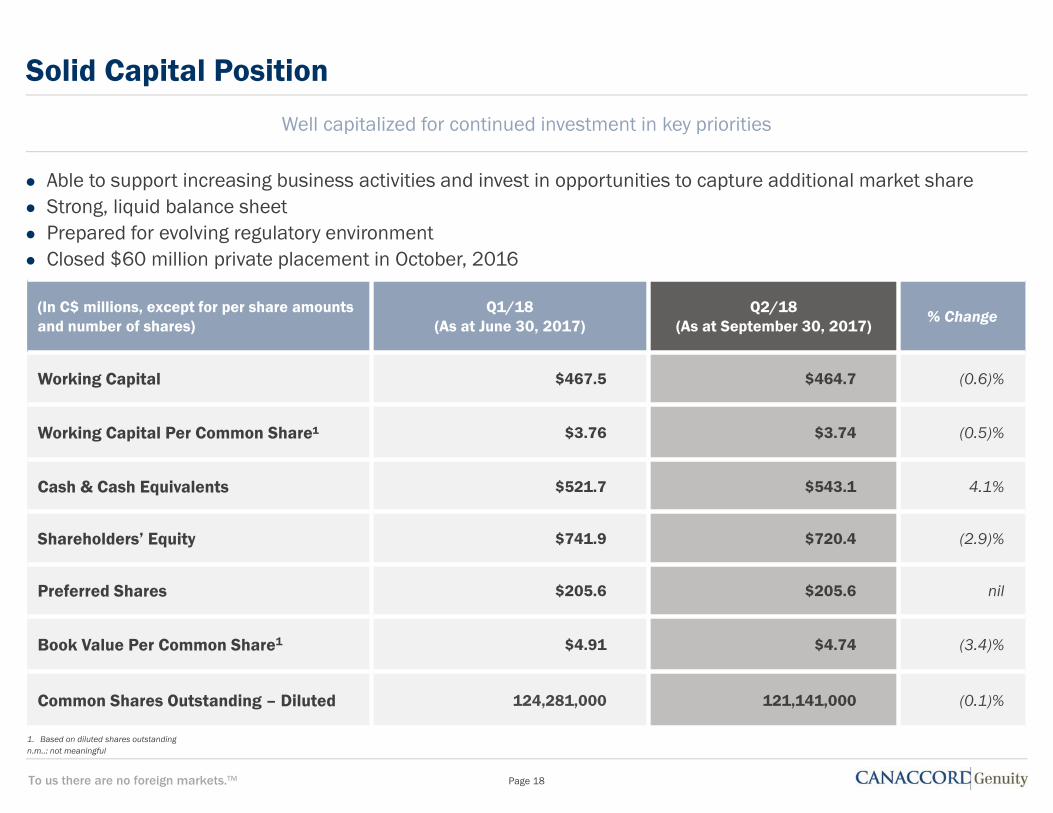
Solid Capital Position
Able to support increasing business activities and invest in opportunities to capture additional market share Strong, liquid balance sheet Prepared for evolving regulatory environment Closed $60 million private placement in October, 2016
Well capitalized for continued investment in key priorities
1. Based on diluted shares outstandingn.m..: not meaningful
Page 18
(In C$ millions, except for per share amounts and number of shares)
Q1/18(As at June 30, 2017)
Q2/18(As at September 30, 2017)
% Change
Working Capital $467.5 $464.7 (0.6)%
Working Capital Per Common Share¹ $3.76 $3.74 (0.5)%
Cash & Cash Equivalents $521.7 $543.1 4.1%
Shareholders’ Equity $741.9 $720.4 (2.9)%
Preferred Shares $205.6 $205.6 nil
Book Value Per Common Share1 $4.91 $4.74 (3.4)%
Common Shares Outstanding – Diluted 124,281,000 121,141,000 (0.1)%
To us there are no foreign markets.™
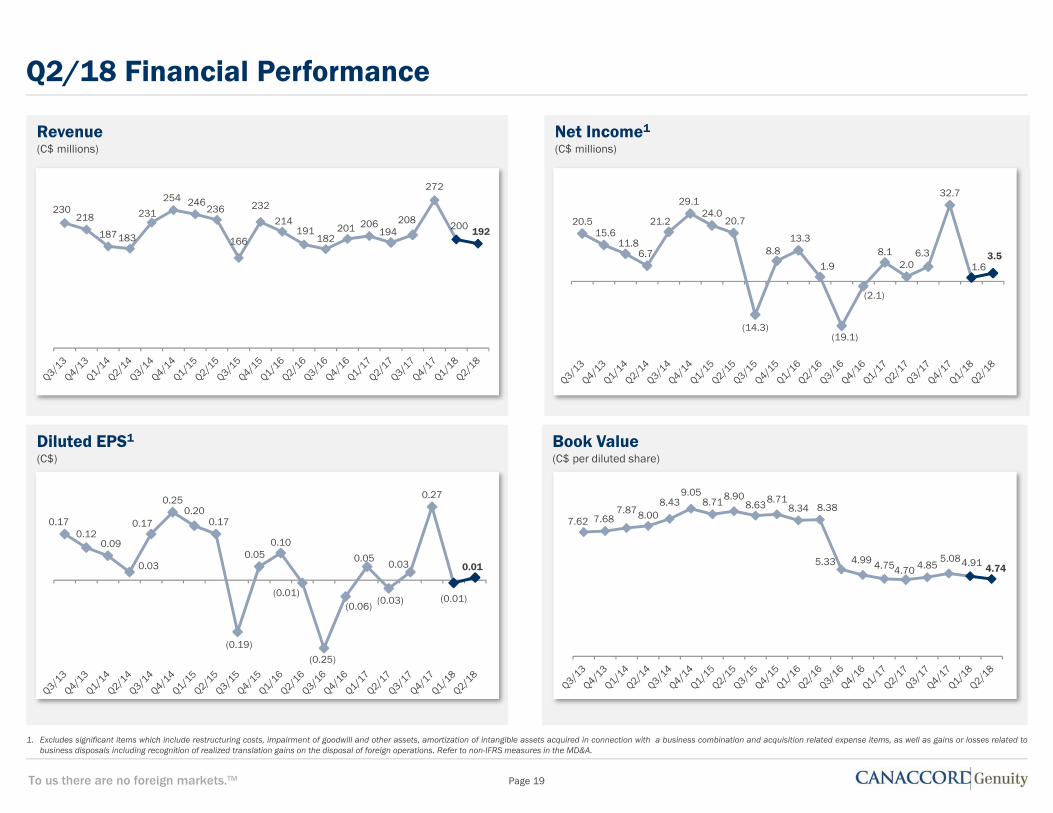
Revenue(C$ millions)
Q2/18 Financial Performance
Page 19
1. Excludes significant items which include restructuring costs, impairment of goodwill and other assets, amortization of intangible assets acquired in connection with a business combination and acquisition related expense items, as well as gains or losses related tobusiness disposals including recognition of realized translation gains on the disposal of foreign operations. Refer to non-IFRS measures in the MD&A.
Book Value(C$ per diluted share)
Diluted EPS1
(C$)
Net Income1
(C$ millions)
230218
187183
231
254 246236
166
232
214191
182201 206
194208
272
200 19220.5
15.6 11.8
6.7
21.2
29.1 24.0
20.7
(14.3)
8.8 13.3
1.9
(19.1)
(2.1)
8.1 2.0
6.3
32.7
1.6 3.5
0.17 0.12
0.09
0.03
0.17
0.25 0.20
0.17
(0.19)
0.05 0.10
(0.01)
(0.25)
(0.06)
0.05
(0.03)
0.03
0.27
(0.01)
0.01
7.62 7.68 7.87 8.00
8.43 9.05
8.71 8.90
8.63 8.71 8.34 8.38
5.33 4.99 4.75 4.70 4.85 5.08 4.91 4.74
To us there are no foreign markets.™
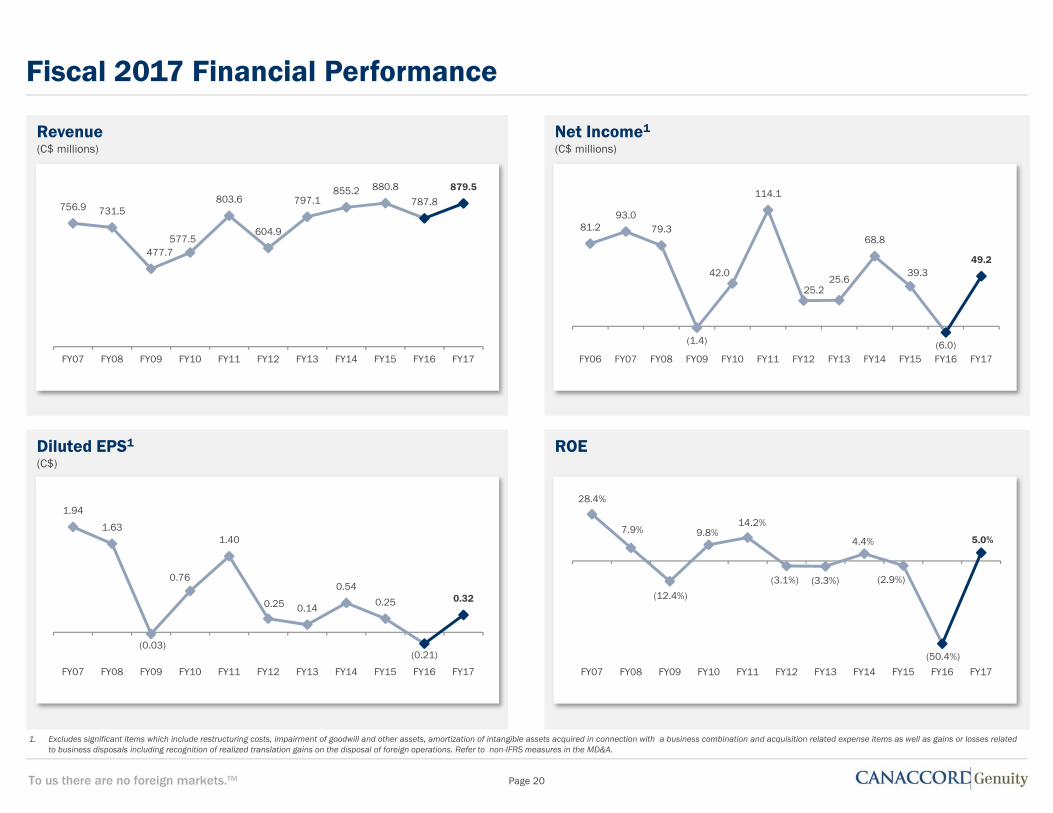
Fiscal 2017 Financial Performance
Page 20
Revenue(C$ millions)
ROEDiluted EPS1
(C$)
Net Income1
(C$ millions)
756.9 731.5
477.7577.5
803.6
604.9
797.1855.2 880.8
787.8
879.5
FY07 FY08 FY09 FY10 FY11 FY12 FY13 FY14 FY15 FY16 FY17
81.2 93.0
79.3
(1.4)
42.0
114.1
25.2 25.6
68.8
39.3
(6.0)
49.2
FY06 FY07 FY08 FY09 FY10 FY11 FY12 FY13 FY14 FY15 FY16 FY17
28.4%
7.9%
(12.4%)
9.8%14.2%
(3.1%) (3.3%)
4.4%
(2.9%)
(50.4%)
5.0%
FY07 FY08 FY09 FY10 FY11 FY12 FY13 FY14 FY15 FY16 FY17
1. Excludes significant items which include restructuring costs, impairment of goodwill and other assets, amortization of intangible assets acquired in connection with a business combination and acquisition related expense items as well as gains or losses relatedto business disposals including recognition of realized translation gains on the disposal of foreign operations. Refer to non-IFRS measures in the MD&A.
1.94
1.63
(0.03)
0.76
1.40
0.25 0.14
0.54
0.25
(0.21)
0.32
FY07 FY08 FY09 FY10 FY11 FY12 FY13 FY14 FY15 FY16 FY17
To us there are no foreign markets.™
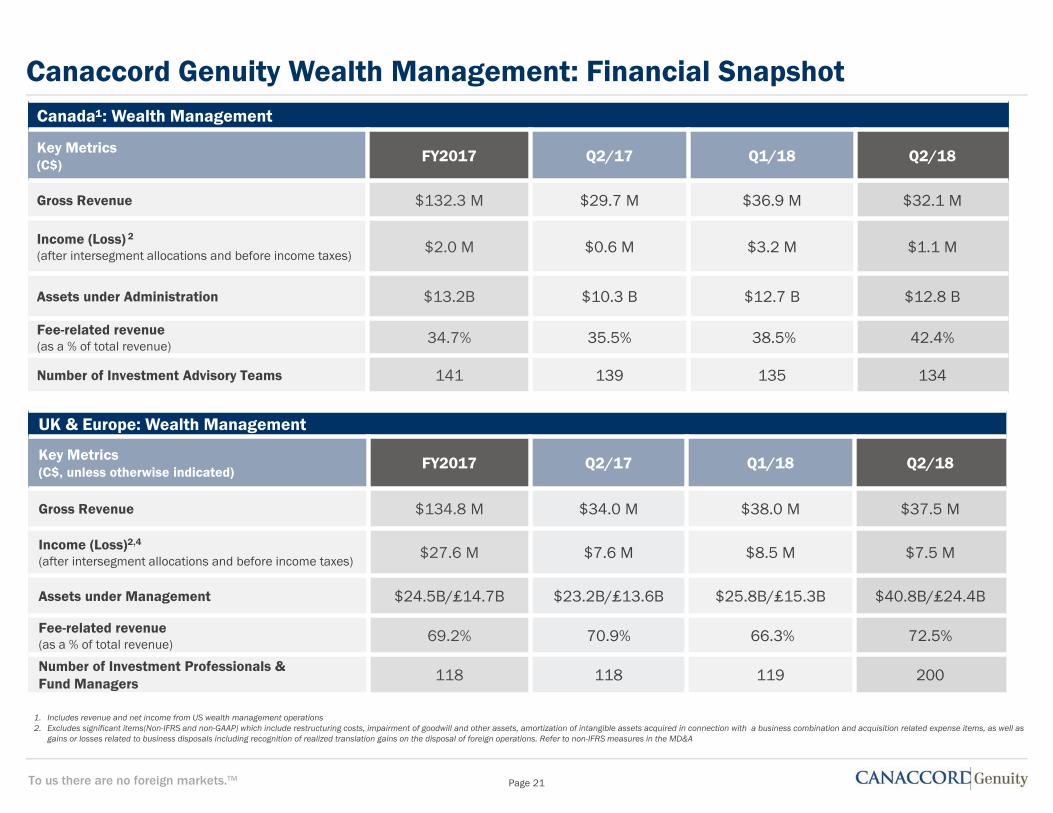
Canaccord Genuity Wealth Management: Financial Snapshot Canada¹: Wealth Management
Key Metrics (C$)
FY2017 Q2/17 Q1/18 Q2/18
Gross Revenue $132.3 M $29.7 M $36.9 M $32.1 M
Income (Loss) 2
(after intersegment allocations and before income taxes) $2.0 M $0.6 M $3.2 M $1.1 M
Assets under Administration $13.2B $10.3 B $12.7 B $12.8 B
Fee-related revenue (as a % of total revenue) 34.7% 35.5% 38.5% 42.4%
Number of Investment Advisory Teams 141 139 135 134
1. Includes revenue and net income from US wealth management operations2. Excludes significant items(Non-IFRS and non-GAAP) which include restructuring costs, impairment of goodwill and other assets, amortization of intangible assets acquired in connection with a business combination and acquisition related expense items, as well as
gains or losses related to business disposals including recognition of realized translation gains on the disposal of foreign operations. Refer to non-IFRS measures in the MD&A
UK & Europe: Wealth Management
Key Metrics (C$, unless otherwise indicated)
FY2017 Q2/17 Q1/18 Q2/18
Gross Revenue $134.8 M $34.0 M $38.0 M $37.5 M
Income (Loss)2,4
(after intersegment allocations and before income taxes) $27.6 M $7.6 M $8.5 M $7.5 M
Assets under Management $24.5B/₤14.7B $23.2B/₤13.6B $25.8B/₤15.3B $40.8B/₤24.4B
Fee-related revenue (as a % of total revenue) 69.2% 70.9% 66.3% 72.5%
Number of Investment Professionals & Fund Managers 118 118 119 200
Page 21
To us there are no foreign markets.™
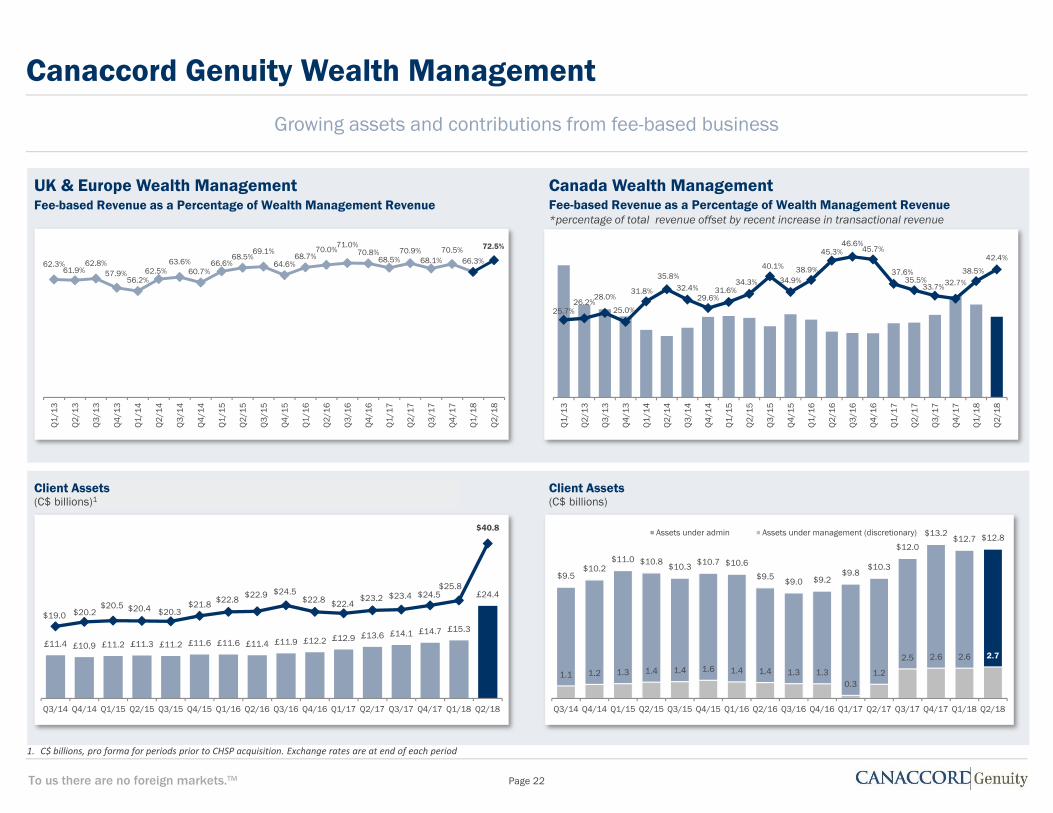
Canaccord Genuity Wealth Management
UK & Europe Wealth Management
Growing assets and contributions from fee-based business
Canada Wealth Management
25.7%26.2%
28.0%
25.0%
31.8%
35.8%
32.4%29.6%
31.6%34.3%
40.1%
34.9%38.9%
45.3%46.6%
45.7%
37.6%35.5%
33.7%32.7%38.5%
42.4%
Q1
/13
Q2
/13
Q3
/13
Q4
/13
Q1
/14
Q2
/14
Q3
/14
Q4
/14
Q1
/15
Q2
/15
Q3
/15
Q4
/15
Q1
/16
Q2
/16
Q3
/16
Q4
/16
Q1
/17
Q2
/17
Q3
/17
Q4
/17
Q1
/18
Q2
/18
Fee-based Revenue as a Percentage of Wealth Management Revenue*percentage of total revenue offset by recent increase in transactional revenue
$9.5$10.2
$11.0 $10.8$10.3 $10.7 $10.6
$9.5$9.0 $9.2
$9.8$10.3
$12.0
$13.2$12.7 $12.8
1.1 1.2 1.3 1.4 1.4 1.6 1.4 1.4 1.3 1.3 0.3
1.2
2.5 2.6 2.6 2.7
Q3/14 Q4/14 Q1/15 Q2/15 Q3/15 Q4/15 Q1/16 Q2/16 Q3/16 Q4/16 Q1/17 Q2/17 Q3/17 Q4/17 Q1/18 Q2/18
Assets under admin Assets under management (discretionary)
Client Assets
£11.4 £10.9 £11.2 £11.3 £11.2 £11.6 £11.6 £11.4 £11.9 £12.2 £12.9 £13.6 £14.1 £14.7 £15.3
£24.4
$19.0 $20.2 $20.5 $20.4 $20.3
$21.8 $22.8 $22.9 $24.5 $22.8 $22.4
$23.2 $23.4 $24.5 $25.8
$40.8
Q3/14 Q4/14 Q1/15 Q2/15 Q3/15 Q4/15 Q1/16 Q2/16 Q3/16 Q4/16 Q1/17 Q2/17 Q3/17 Q4/17 Q1/18 Q2/18
Client Assets
62.3%61.9%
62.8%57.9%
56.2%62.5%
63.6%60.7%
66.6%68.5%
69.1%
64.6%68.7%
70.0%71.0%
70.8%68.5%
70.9%68.1%
70.5%66.3%
72.5%
Q1
/13
Q2
/13
Q3
/13
Q4
/13
Q1
/14
Q2
/14
Q3
/14
Q4
/14
Q1
/15
Q2
/15
Q3
/15
Q4
/15
Q1
/16
Q2
/16
Q3
/16
Q4
/16
Q1
/17
Q2
/17
Q3
/17
Q4
/17
Q1
/18
Q2
/18
Fee-based Revenue as a Percentage of Wealth Management Revenue
Page 22
1. C$ billions, pro forma for periods prior to CHSP acquisition. Exchange rates are at end of each period
(C$ billions)1 (C$ billions)
To us there are no foreign markets.™
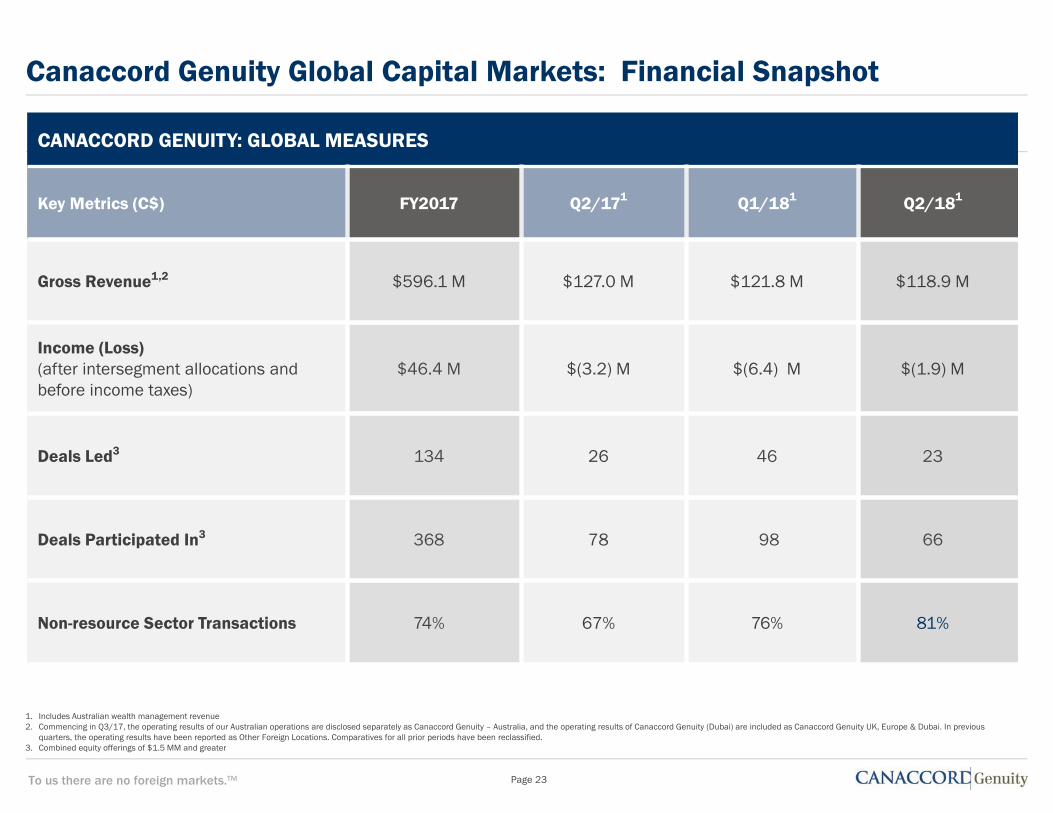
Canaccord Genuity Global Capital Markets: Financial Snapshot
CANACCORD GENUITY: GLOBAL MEASURES
Key Metrics (C$) FY2017 Q2/171 Q1/181 Q2/181
Gross Revenue1,2 $596.1 M $127.0 M $121.8 M $118.9 M
Income (Loss)(after intersegment allocations and before income taxes)
$46.4 M $(3.2) M $(6.4) M $(1.9) M
Deals Led3 134 26 46 23
Deals Participated In3 368 78 98 66
Non-resource Sector Transactions 74% 67% 76% 81%
1. Includes Australian wealth management revenue2. Commencing in Q3/17, the operating results of our Australian operations are disclosed separately as Canaccord Genuity – Australia, and the operating results of Canaccord Genuity (Dubai) are included as Canaccord Genuity UK, Europe & Dubai. In previous
quarters, the operating results have been reported as Other Foreign Locations. Comparatives for all prior periods have been reclassified.3. Combined equity offerings of $1.5 MM and greater
Page 23