Embed Size (px)
Citation preview
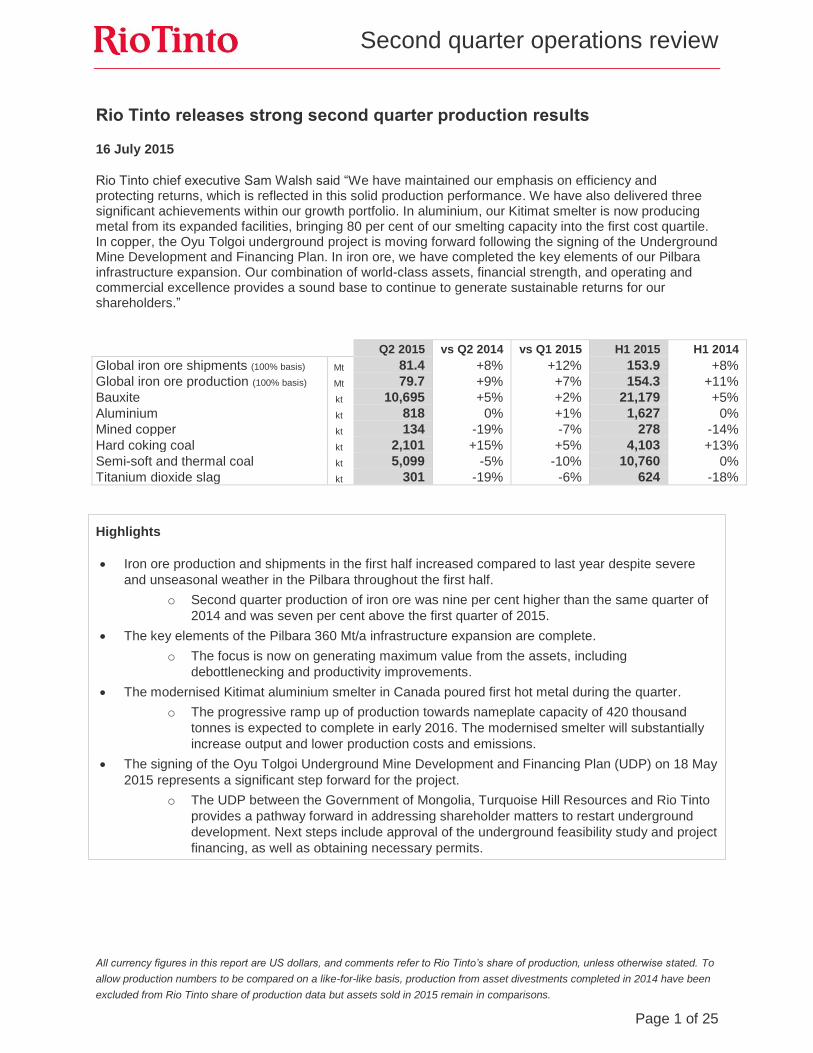
Second quarter operations review
Page 1 of 25
Rio Tinto releases strong second quarter production results
16 July 2015
Rio Tinto chief executive Sam Walsh said “We have maintained our emphasis on efficiency and protecting returns, which is reflected in this solid production performance. We have also delivered three significant achievements within our growth portfolio. In aluminium, our Kitimat smelter is now producing metal from its expanded facilities, bringing 80 per cent of our smelting capacity into the first cost quartile. In copper, the Oyu Tolgoi underground project is moving forward following the signing of the Underground Mine Development and Financing Plan. In iron ore, we have completed the key elements of our Pilbara infrastructure expansion. Our combination of world-class assets, financial strength, and operating and commercial excellence provides a sound base to continue to generate sustainable returns for our shareholders.”
Q2 2015 vs Q2 2014 vs Q1 2015 H1 2015 H1 2014
Global iron ore shipments (100% basis) Mt 81.4 +8% +12% 153.9 +8%
Global iron ore production (100% basis) Mt 79.7 +9% +7% 154.3 +11%
Bauxite kt 10,695 +5% +2% 21,179 +5%
Aluminium kt 818 0% +1% 1,627 0%
Mined copper kt 134 -19% -7% 278 -14%
Hard coking coal kt 2,101 +15% +5% 4,103 +13%
Semi-soft and thermal coal kt 5,099 -5% -10% 10,760 0%
Titanium dioxide slag kt 301 -19% -6% 624 -18%
Highlights
Iron ore production and shipments in the first half increased compared to last year despite severe
and unseasonal weather in the Pilbara throughout the first half.
o Second quarter production of iron ore was nine per cent higher than the same quarter of
2014 and was seven per cent above the first quarter of 2015.
The key elements of the Pilbara 360 Mt/a infrastructure expansion are complete.
o The focus is now on generating maximum value from the assets, including
debottlenecking and productivity improvements.
The modernised Kitimat aluminium smelter in Canada poured first hot metal during the quarter.
o The progressive ramp up of production towards nameplate capacity of 420 thousand
tonnes is expected to complete in early 2016. The modernised smelter will substantially
increase output and lower production costs and emissions.
The signing of the Oyu Tolgoi Underground Mine Development and Financing Plan (UDP) on 18 May
2015 represents a significant step forward for the project.
o The UDP between the Government of Mongolia, Turquoise Hill Resources and Rio Tinto
provides a pathway forward in addressing shareholder matters to restart underground
development. Next steps include approval of the underground feasibility study and project
financing, as well as obtaining necessary permits.
All currency figures in this report are US dollars, and comments refer to Rio Tinto’s share of production, unless otherwise stated. To
allow production numbers to be compared on a like-for-like basis, production from asset divestments completed in 2014 have been
excluded from Rio Tinto share of production data but assets sold in 2015 remain in comparisons.
Page 2 of 25
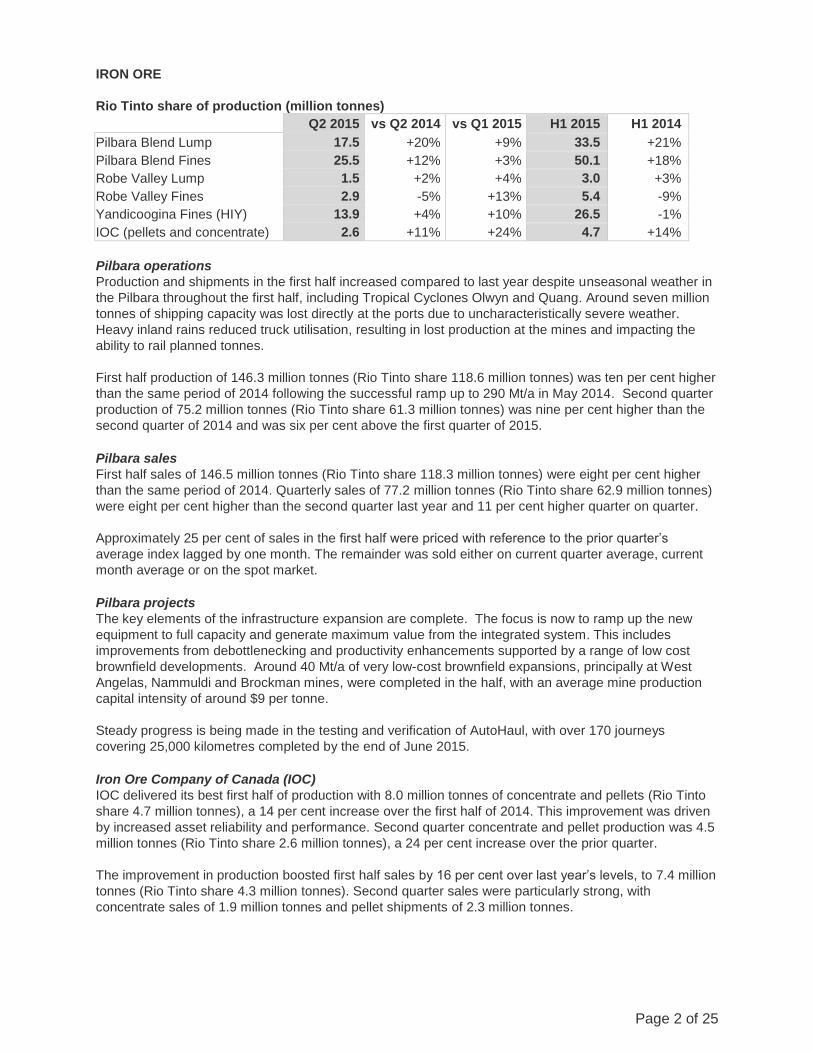
IRON ORE
Rio Tinto share of production (million tonnes)
Q2 2015 vs Q2 2014 vs Q1 2015 H1 2015 H1 2014
Pilbara Blend Lump 17.5 +20% +9% 33.5 +21%
Pilbara Blend Fines 25.5 +12% +3% 50.1 +18%
Robe Valley Lump 1.5 +2% +4% 3.0 +3%
Robe Valley Fines 2.9 -5% +13% 5.4 -9%
Yandicoogina Fines (HIY) 13.9 +4% +10% 26.5 -1%
IOC (pellets and concentrate) 2.6 +11% +24% 4.7 +14%
Pilbara operations
Production and shipments in the first half increased compared to last year despite unseasonal weather in
the Pilbara throughout the first half, including Tropical Cyclones Olwyn and Quang. Around seven million
tonnes of shipping capacity was lost directly at the ports due to uncharacteristically severe weather.
Heavy inland rains reduced truck utilisation, resulting in lost production at the mines and impacting the
ability to rail planned tonnes.
First half production of 146.3 million tonnes (Rio Tinto share 118.6 million tonnes) was ten per cent higher
than the same period of 2014 following the successful ramp up to 290 Mt/a in May 2014. Second quarter
production of 75.2 million tonnes (Rio Tinto share 61.3 million tonnes) was nine per cent higher than the
second quarter of 2014 and was six per cent above the first quarter of 2015.
Pilbara sales
First half sales of 146.5 million tonnes (Rio Tinto share 118.3 million tonnes) were eight per cent higher
than the same period of 2014. Quarterly sales of 77.2 million tonnes (Rio Tinto share 62.9 million tonnes)
were eight per cent higher than the second quarter last year and 11 per cent higher quarter on quarter.
Approximately 25 per cent of sales in the first half were priced with reference to the prior quarter’s
average index lagged by one month. The remainder was sold either on current quarter average, current
month average or on the spot market.
Pilbara projects
The key elements of the infrastructure expansion are complete. The focus is now to ramp up the new
equipment to full capacity and generate maximum value from the integrated system. This includes
improvements from debottlenecking and productivity enhancements supported by a range of low cost
brownfield developments. Around 40 Mt/a of very low-cost brownfield expansions, principally at West
Angelas, Nammuldi and Brockman mines, were completed in the half, with an average mine production
capital intensity of around $9 per tonne.
Steady progress is being made in the testing and verification of AutoHaul, with over 170 journeys
covering 25,000 kilometres completed by the end of June 2015.
Iron Ore Company of Canada (IOC)
IOC delivered its best first half of production with 8.0 million tonnes of concentrate and pellets (Rio Tinto
share 4.7 million tonnes), a 14 per cent increase over the first half of 2014. This improvement was driven
by increased asset reliability and performance. Second quarter concentrate and pellet production was 4.5
million tonnes (Rio Tinto share 2.6 million tonnes), a 24 per cent increase over the prior quarter.
The improvement in production boosted first half sales by 16 per cent over last year’s levels, to 7.4 million
tonnes (Rio Tinto share 4.3 million tonnes). Second quarter sales were particularly strong, with
concentrate sales of 1.9 million tonnes and pellet shipments of 2.3 million tonnes.

Page 3 of 25
2015 guidance
Due to the weather disruption in the first half of the year, anticipated shipments were reduced by around
seven million tonnes. Accordingly, Rio Tinto now expects 2015 global shipments of 340 million tonnes
(100 per cent basis) from its operations in Australia and Canada.
ALUMINIUM
Rio Tinto share of production (‘000 tonnes)
Q2 2015 vs Q2 2014 vs Q1 2015 H1 2015 H1 2014
Rio Tinto Aluminium
Bauxite 10,695 +5% +2% 21,179 +5%
Alumina 1,925 +7% +2% 3,821 +5%
Aluminium 818 0% +1% 1,627 0%
Bauxite
Bauxite production was five per cent higher than the first half of 2014 and set a new first half record. This
was primarily due to a very strong performance at Weipa and the continued ramp up of production at
Gove towards eight million tonnes per annum. Gove finished the second quarter with a monthly
performance equivalent to a 7.7 million tonne run-rate, well on track to reach an eight million tonne run-
rate by the fourth quarter of 2015.
These strong performances from Weipa and Gove delivered second quarter production five per cent
higher than the same quarter of 2014 and enabled a seven per cent improvement in third party sales
quarter on quarter.
Alumina
Alumina production was up by five per cent compared with the first half of 2014 (excluding production
from the Gove refinery which was curtailed in May 2014), reflecting improved productivity at Queensland
Alumina and Yarwun.
Aluminium
First half and second quarter aluminium production was in line with the same periods of 2014, despite
lower production from Kitimat as it prepared for commissioning of the modernised smelter which poured
first hot metal during the quarter. Kitimat will ramp up towards nameplate capacity of 420 thousand
tonnes (a 48 per cent increase over previous nameplate capacity), which is expected to be completed in
early 2016.
2015 guidance
Rio Tinto’s expected share of production remains unchanged at 43 million tonnes of bauxite, eight million
tonnes of alumina and 3.3 million tonnes of aluminium.
Page 4 of 25
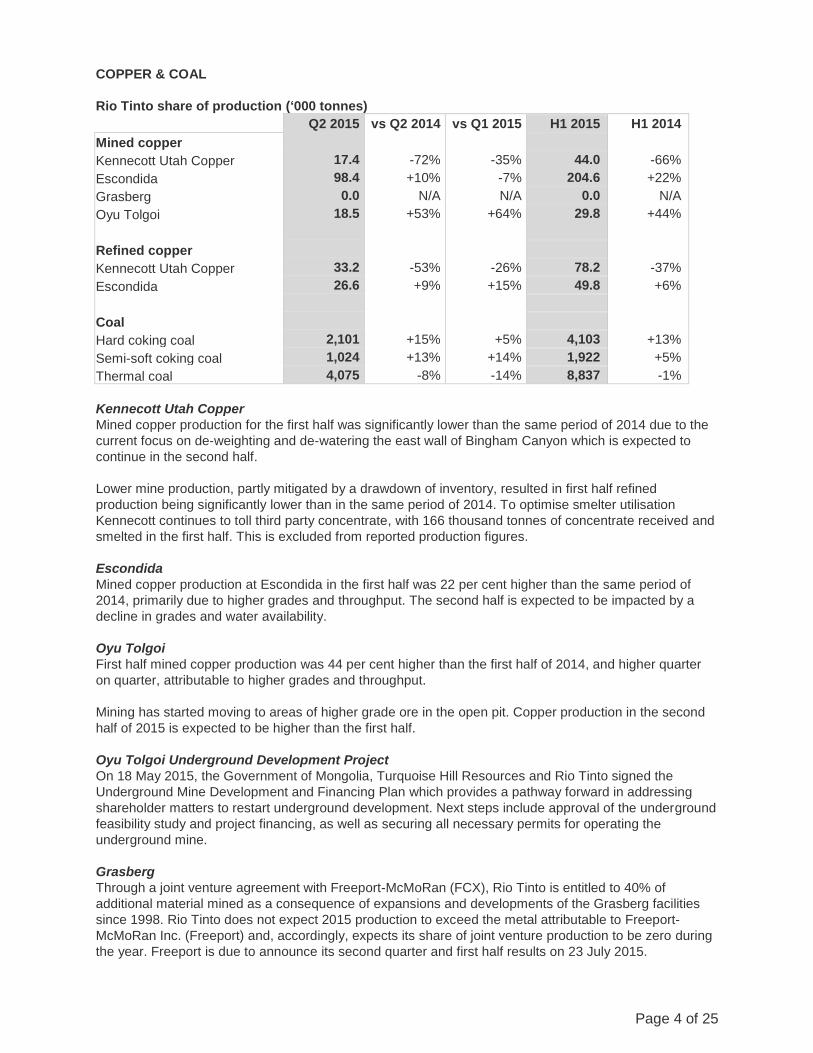
COPPER & COAL
Rio Tinto share of production (‘000 tonnes)
Q2 2015 vs Q2 2014 vs Q1 2015 H1 2015 H1 2014
Mined copper
Kennecott Utah Copper 17.4 -72% -35% 44.0 -66%
Escondida 98.4 +10% -7% 204.6 +22%
Grasberg 0.0 N/A N/A 0.0 N/A
Oyu Tolgoi 18.5 +53% +64% 29.8 +44%
Refined copper
Kennecott Utah Copper 33.2 -53% -26% 78.2 -37%
Escondida 26.6 +9% +15% 49.8 +6%
Coal
Hard coking coal 2,101 +15% +5% 4,103 +13%
Semi-soft coking coal 1,024 +13% +14% 1,922 +5%
Thermal coal 4,075 -8% -14% 8,837 -1%
Kennecott Utah Copper
Mined copper production for the first half was significantly lower than the same period of 2014 due to the
current focus on de-weighting and de-watering the east wall of Bingham Canyon which is expected to
continue in the second half.
Lower mine production, partly mitigated by a drawdown of inventory, resulted in first half refined
production being significantly lower than in the same period of 2014. To optimise smelter utilisation
Kennecott continues to toll third party concentrate, with 166 thousand tonnes of concentrate received and
smelted in the first half. This is excluded from reported production figures.
Escondida
Mined copper production at Escondida in the first half was 22 per cent higher than the same period of
2014, primarily due to higher grades and throughput. The second half is expected to be impacted by a
decline in grades and water availability.
Oyu Tolgoi
First half mined copper production was 44 per cent higher than the first half of 2014, and higher quarter
on quarter, attributable to higher grades and throughput.
Mining has started moving to areas of higher grade ore in the open pit. Copper production in the second
half of 2015 is expected to be higher than the first half.
Oyu Tolgoi Underground Development Project
On 18 May 2015, the Government of Mongolia, Turquoise Hill Resources and Rio Tinto signed the
Underground Mine Development and Financing Plan which provides a pathway forward in addressing
shareholder matters to restart underground development. Next steps include approval of the underground
feasibility study and project financing, as well as securing all necessary permits for operating the
underground mine.
Grasberg
Through a joint venture agreement with Freeport-McMoRan (FCX), Rio Tinto is entitled to 40% of
additional material mined as a consequence of expansions and developments of the Grasberg facilities
since 1998. Rio Tinto does not expect 2015 production to exceed the metal attributable to Freeport-
McMoRan Inc. (Freeport) and, accordingly, expects its share of joint venture production to be zero during
the year. Freeport is due to announce its second quarter and first half results on 23 July 2015.
Page 5 of 25
Provisional pricing
At 30 June 2015, the Group had an estimated 333 million pounds of copper sales that were provisionally
priced at US 268 cents per pound. The final price of these sales will be determined during the second half
of 2015. This compared with 331 million pounds of open shipments at 31 December 2014, provisionally
priced at US 288 cents per pound.
Coal
Hard coking coal production was 13 per cent higher than the first half of 2014 as a result of improved
production rates at Kestrel which continues to ramp up towards nameplate long-wall capacity of around
six million tonnes.
Semi-soft coking coal production was five per cent higher than the first half of 2014 reflecting mine
production sequencing at the Hunter Valley Operations. Thermal coal production was in line with the first
half of 2014 with increased tonnage at Hail Creek through a processing plant by-product stream and a
strong operational performance which was offset by the impacts of wet weather in the Hunter Valley.
2015 guidance
In 2015, as previously announced, Rio Tinto expects its share of mined copper production to be between
500 and 535 thousand tonnes, and refined copper production to be between 190 and 220 thousand
tonnes.
For coal, Rio Tinto’s share of production is expected to be 18 to 19 million tonnes of thermal coal, 3.0 to
3.4 million tonnes of semi-soft coking coal and 7.1 to 8.1 million tonnes of hard coking coal.
DIAMONDS & MINERALS
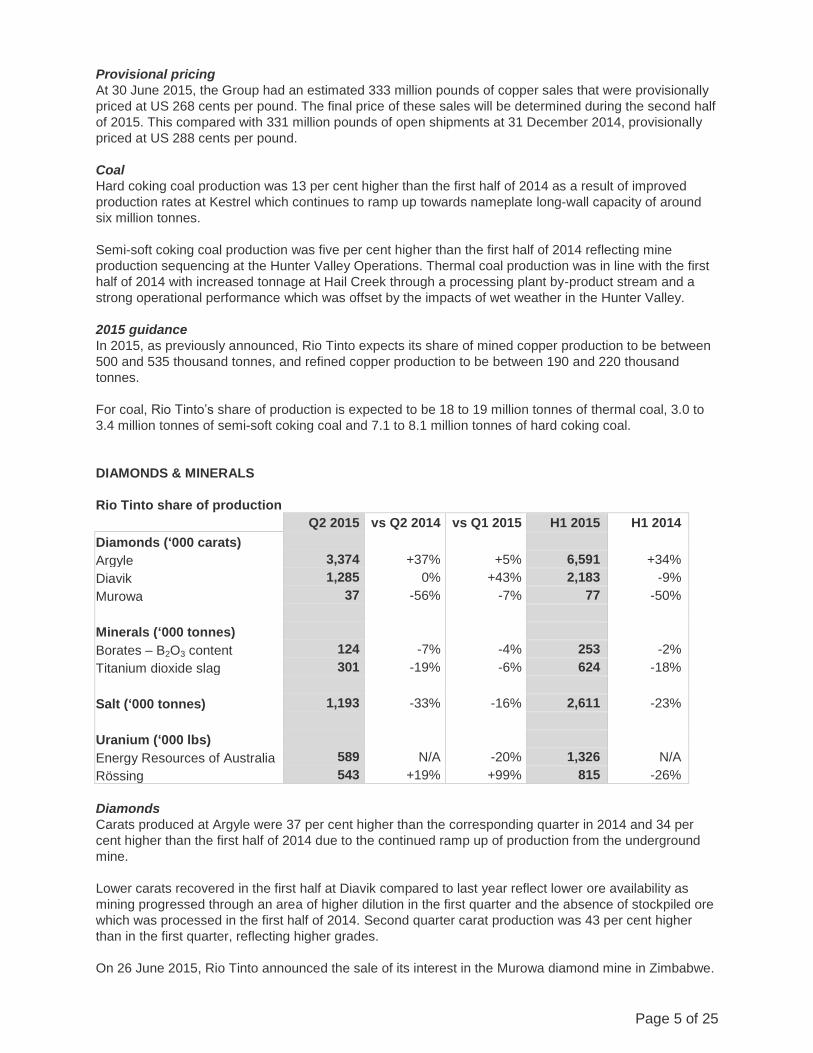
Rio Tinto share of production
Q2 2015 vs Q2 2014 vs Q1 2015 H1 2015 H1 2014
Diamonds (‘000 carats)
Argyle 3,374 +37% +5% 6,591 +34%
Diavik 1,285 0% +43% 2,183 -9%
Murowa 37 -56% -7% 77 -50%
Minerals (‘000 tonnes)
Borates – B2O3 content 124 -7% -4% 253 -2%
Titanium dioxide slag 301 -19% -6% 624 -18%
Salt (‘000 tonnes) 1,193 -33% -16% 2,611 -23%
Uranium (‘000 lbs)
Energy Resources of Australia 589 N/A -20% 1,326 N/A
Rössing 543 +19% +99% 815 -26%
Diamonds
Carats produced at Argyle were 37 per cent higher than the corresponding quarter in 2014 and 34 per
cent higher than the first half of 2014 due to the continued ramp up of production from the underground
mine.
Lower carats recovered in the first half at Diavik compared to last year reflect lower ore availability as
mining progressed through an area of higher dilution in the first quarter and the absence of stockpiled ore
which was processed in the first half of 2014. Second quarter carat production was 43 per cent higher
than in the first quarter, reflecting higher grades.
On 26 June 2015, Rio Tinto announced the sale of its interest in the Murowa diamond mine in Zimbabwe.
Page 6 of 25
Minerals
Borates production was slightly lower than in the first half of 2014 which included additional production in
preparation for the commissioning of the modified direct dissolving of kernite (MDDK) plant.
Rio Tinto Iron and Titanium (RTIT)
Titanium dioxide slag production was 18 per cent lower than in the first half of 2014 as production
continued to be optimised to align with market demand. Two out of nine furnaces are currently idled in Rio
Tinto Fer et Titane (RTFT) in Quebec.
Salt
First half salt production was lower than the comparative period in 2014 as a result of weaker demand
and management of inventory.
Uranium
Energy Resources of Australia (ERA) continues to process existing stockpiles. Quarter on quarter,
uranium production was 20 per cent lower as a result of lower mill head grade and recovery.
First half production at Rössing was lower than the first half of 2014, largely as a result of lower grades
and recoveries, partially offset by higher throughput. Second quarter production was higher following
recovery from a fire in the final product recovery plant in the first quarter.
2015 guidance
In 2015, Rio Tinto’s share of production is expected to be 1.2 million tonnes of titanium dioxide slag
(previously 1.3 million tonnes), 0.5 million tonnes of boric oxide equivalent and 20 million carats of
diamonds.
Rio Tinto’s share of uranium production is expected to be approximately five million pounds (at the lower
end of the previous guidance range of five to six million tonnes).
EXPLORATION AND EVALUATION
Pre-tax and pre-divestment expenditure on exploration and evaluation charged to the profit and loss
account in the first half was $243 million (of which $117 million was spent in the second quarter),
compared with $340 million in the same period of 2014.
Approximately 37 per cent of this expenditure was incurred by Copper & Coal, five per cent by Iron Ore,
22 per cent by Diamonds & Minerals and the balance by central exploration.
There were no significant divestments of central exploration properties in the quarter.
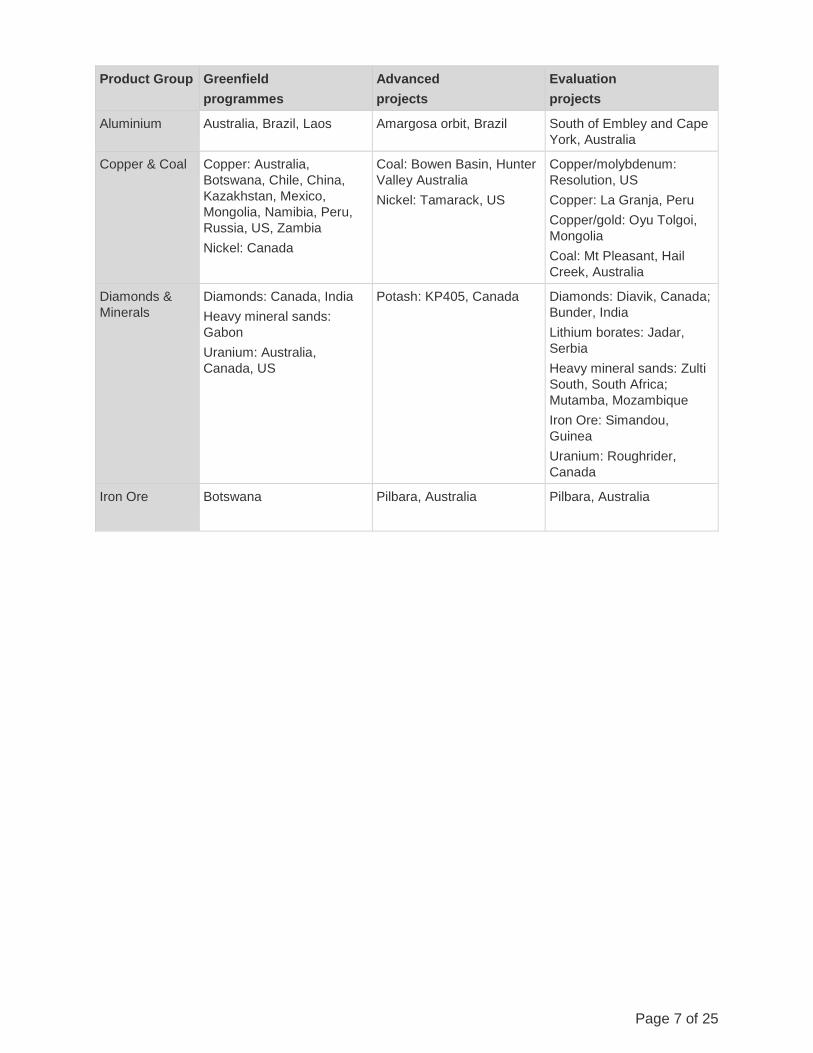
Activity in the quarter
Rio Tinto has a strong portfolio of exploration projects with activity in 18 countries across some eight
commodities. The main focus of our exploration spend in the period was on copper targets in the United
States, Mexico, Chile, Peru, Botswana, Namibia, Zambia, Kazakhstan and Russia. Mine-lease
exploration continued at a number of Rio Tinto businesses including Pilbara Iron, Rio Tinto Coal Australia,
Richards Bay, Oyu Tolgoi, Weipa and Kennecott Utah Copper.
A summary of activity for the period is as follows:
Page 7 of 25
Product Group Greenfield
programmes
Advanced
projects
Evaluation
projects
Aluminium Australia, Brazil, Laos Amargosa orbit, Brazil South of Embley and Cape
York, Australia
Copper & Coal Copper: Australia,
Botswana, Chile, China,
Kazakhstan, Mexico,
Mongolia, Namibia, Peru,
Russia, US, Zambia
Nickel: Canada
Coal: Bowen Basin, Hunter
Valley Australia
Nickel: Tamarack, US
Copper/molybdenum:
Resolution, US
Copper: La Granja, Peru
Copper/gold: Oyu Tolgoi,
Mongolia
Coal: Mt Pleasant, Hail
Creek, Australia
Diamonds &
Minerals
Diamonds: Canada, India
Heavy mineral sands:
Gabon
Uranium: Australia,
Canada, US
Potash: KP405, Canada
Diamonds: Diavik, Canada;
Bunder, India
Lithium borates: Jadar,
Serbia
Heavy mineral sands: Zulti
South, South Africa;
Mutamba, Mozambique
Iron Ore: Simandou,
Guinea
Uranium: Roughrider,
Canada
Iron Ore Botswana Pilbara, Australia Pilbara, Australia

Page 8 of 25
Contacts
www.riotinto.com
Follow @riotinto on Twitter
Media Relations, EMEA/Americas
Illtud Harri
T +44 20 7781 1152
M +44 7920 503 600
David Outhwaite
T +44 20 7781 1623
M +44 7787 597 493
David Luff
T + 44 20 7781 1177
M + 44 7780 226 422
Investor Relations, EMEA/Americas
John Smelt
T +44 20 7781 1654
M +44 7879 642 675
David Ovington
T +44 20 7781 2051
M +44 7920 010 978
Grant Donald
T +44 20 7781 1262
M +44 7920 587 805
Media Relations, Australia/Asia
Ben Mitchell
T +61 3 9283 3620
M +61 419 850 212
Bruce Tobin
T +61 3 9283 3612
M +61 419 103 454
Matt Klar
T + 61 7 3625 4244
M + 61 457 525 578
Investor Relations, Australia/Asia
Natalie Worley
T +61 3 9283 3063
M +61 409 210 462
Rachel Storrs
T +61 3 9283 3628
M +61 417 401 018
Galina Rogova
T +86 21 6103 3550
M +86 152 2118 3942
Rio Tinto plc
6 St James’s Square
London SW1Y 4AD
United Kingdom
T +44 20 7781 2000
Registered in England
No. 719885
Rio Tinto Limited
120 Collins Street
Melbourne 3000
Australia
T +61 3 9283 3333
Registered in Australia
ABN 96 004 458 404
Page 9 of 25
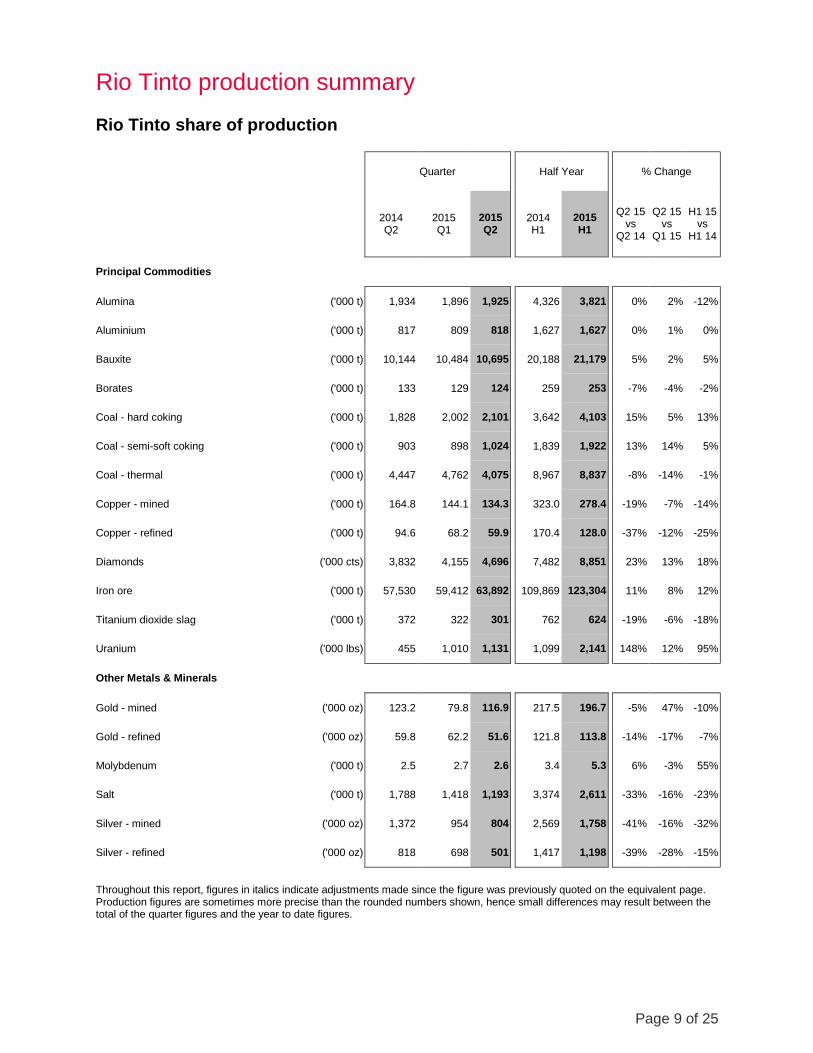
Rio Tinto production summary
Rio Tinto share of production
Quarter
Half Year
% Change
2014 Q2
2015 Q1
2015 Q2
2014 H1
2015 H1
Q2 15
vs Q2 14
Q2 15 vs
Q1 15
H1 15 vs
H1 14
Principal Commodities
Alumina ('000 t) 1,934 1,896 1,925 4,326 3,821 0% 2% -12%
Aluminium ('000 t) 817 809 818 1,627 1,627 0% 1% 0%
Bauxite ('000 t) 10,144 10,484 10,695 20,188 21,179 5% 2% 5%
Borates ('000 t) 133 129 124 259 253 -7% -4% -2%
Coal - hard coking ('000 t) 1,828 2,002 2,101 3,642 4,103 15% 5% 13%
Coal - semi-soft coking ('000 t) 903 898 1,024 1,839 1,922 13% 14% 5%
Coal - thermal ('000 t) 4,447 4,762 4,075 8,967 8,837 -8% -14% -1%
Copper - mined ('000 t) 164.8 144.1 134.3 323.0 278.4 -19% -7% -14%
Copper - refined ('000 t) 94.6 68.2 59.9 170.4 128.0 -37% -12% -25%
Diamonds ('000 cts) 3,832 4,155 4,696 7,482 8,851 23% 13% 18%
Iron ore ('000 t) 57,530 59,412 63,892 109,869 123,304 11% 8% 12%
Titanium dioxide slag ('000 t) 372 322 301 762 624 -19% -6% -18%
Uranium ('000 lbs) 455 1,010 1,131 1,099 2,141 148% 12% 95%
Other Metals & Minerals
Gold - mined ('000 oz) 123.2 79.8 116.9 217.5 196.7 -5% 47% -10%
Gold - refined ('000 oz) 59.8 62.2 51.6 121.8 113.8 -14% -17% -7%
Molybdenum ('000 t) 2.5 2.7 2.6 3.4 5.3 6% -3% 55%
Salt ('000 t) 1,788 1,418 1,193 3,374 2,611 -33% -16% -23%
Silver - mined ('000 oz) 1,372 954 804 2,569 1,758 -41% -16% -32%
Silver - refined ('000 oz) 818 698 501 1,417 1,198 -39% -28% -15%
Throughout this report, figures in italics indicate adjustments made since the figure was previously quoted on the equivalent page. Production figures are sometimes more precise than the rounded numbers shown, hence small differences may result between the total of the quarter figures and the year to date figures.
Page 10 of 25
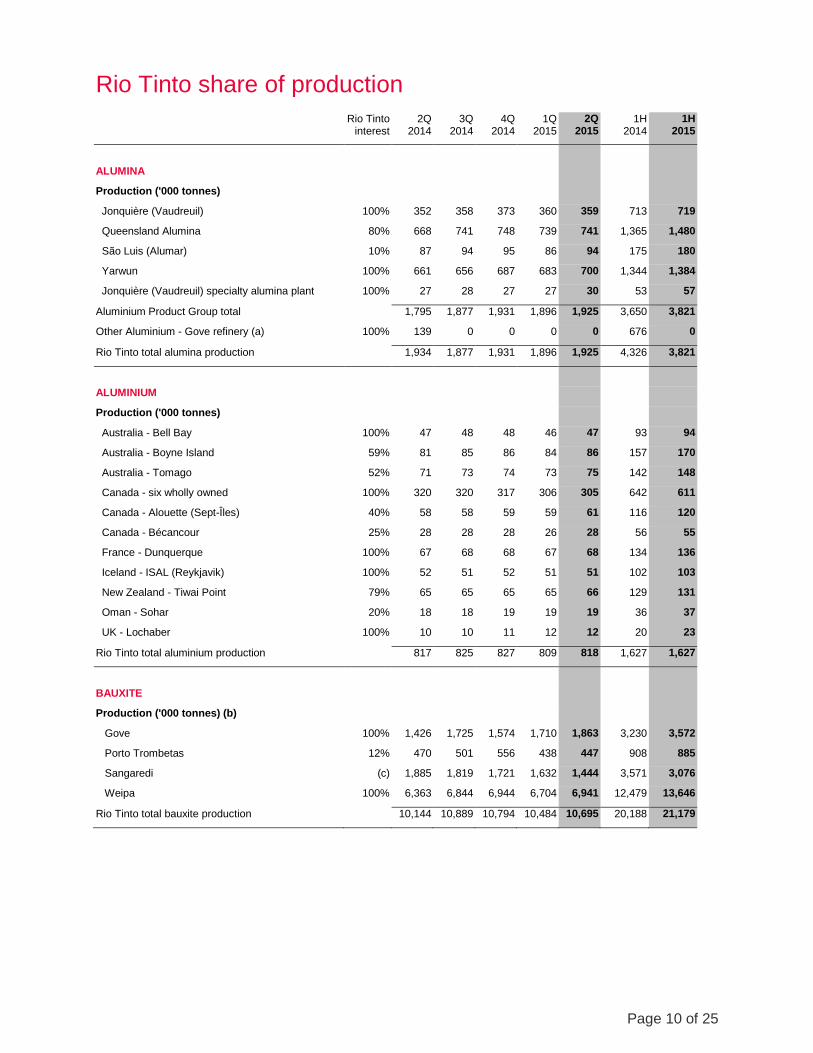
Rio Tinto share of production
Rio Tinto interest
2Q 2014
3Q 2014
4Q 2014
1Q 2015
2Q 2015
1H 2014
1H 2015
ALUMINA
Production ('000 tonnes)
Jonquière (Vaudreuil) 100% 352 358 373 360 359 713 719
Queensland Alumina 80% 668 741 748 739 741 1,365 1,480
São Luis (Alumar) 10% 87 94 95 86 94 175 180
Yarwun 100% 661 656 687 683 700 1,344 1,384
Jonquière (Vaudreuil) specialty alumina plant 100% 27 28 27 27 30 53 57
Aluminium Product Group total 1,795 1,877 1,931 1,896 1,925 3,650 3,821
Other Aluminium - Gove refinery (a) 100% 139 0 0 0 0 676 0
Rio Tinto total alumina production 1,934 1,877 1,931 1,896 1,925 4,326 3,821
ALUMINIUM
Production ('000 tonnes)
Australia - Bell Bay 100% 47 48 48 46 47 93 94
Australia - Boyne Island 59% 81 85 86 84 86 157 170
Australia - Tomago 52% 71 73 74 73 75 142 148
Canada - six wholly owned 100% 320 320 317 306 305 642 611
Canada - Alouette (Sept-Îles) 40% 58 58 59 59 61 116 120
Canada - Bécancour 25% 28 28 28 26 28 56 55
France - Dunquerque 100% 67 68 68 67 68 134 136
Iceland - ISAL (Reykjavik) 100% 52 51 52 51 51 102 103
New Zealand - Tiwai Point 79% 65 65 65 65 66 129 131
Oman - Sohar 20% 18 18 19 19 19 36 37
UK - Lochaber 100% 10 10 11 12 12 20 23
Rio Tinto total aluminium production 817 825 827 809 818 1,627 1,627
BAUXITE
Production ('000 tonnes) (b)
Gove 100% 1,426 1,725 1,574 1,710 1,863 3,230 3,572
Porto Trombetas 12% 470 501 556 438 447 908 885
Sangaredi (c) 1,885 1,819 1,721 1,632 1,444 3,571 3,076
Weipa 100% 6,363 6,844 6,944 6,704 6,941 12,479 13,646
Rio Tinto total bauxite production 10,144 10,889 10,794 10,484 10,695 20,188 21,179
Page 11 of 25
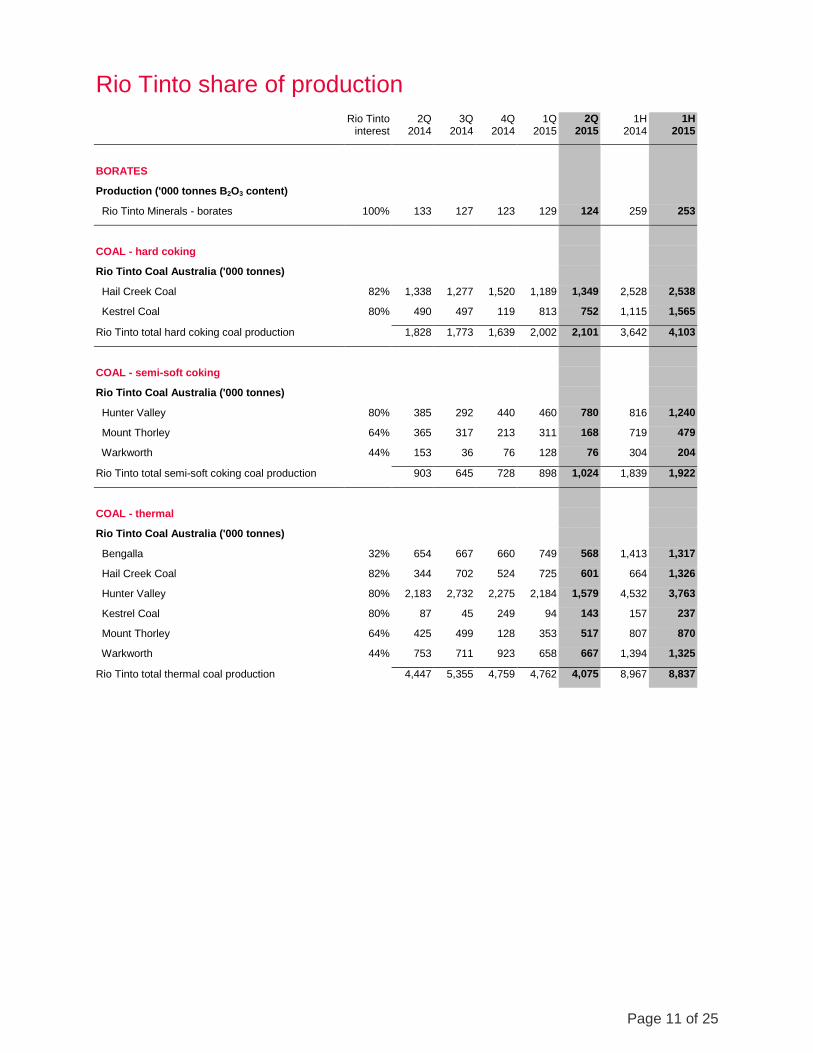
Rio Tinto share of production
Rio Tinto interest
2Q 2014
3Q 2014
4Q 2014
1Q 2015
2Q 2015
1H 2014
1H 2015
BORATES
Production ('000 tonnes B2O3 content)
Rio Tinto Minerals - borates 100% 133 127 123 129 124 259 253
COAL - hard coking
Rio Tinto Coal Australia ('000 tonnes)
Hail Creek Coal 82% 1,338 1,277 1,520 1,189 1,349 2,528 2,538
Kestrel Coal 80% 490 497 119 813 752 1,115 1,565
Rio Tinto total hard coking coal production 1,828 1,773 1,639 2,002 2,101 3,642 4,103
COAL - semi-soft coking
Rio Tinto Coal Australia ('000 tonnes)
Hunter Valley 80% 385 292 440 460 780 816 1,240
Mount Thorley 64% 365 317 213 311 168 719 479
Warkworth 44% 153 36 76 128 76 304 204
Rio Tinto total semi-soft coking coal production 903 645 728 898 1,024 1,839 1,922
COAL - thermal
Rio Tinto Coal Australia ('000 tonnes)
Bengalla 32% 654 667 660 749 568 1,413 1,317
Hail Creek Coal 82% 344 702 524 725 601 664 1,326
Hunter Valley 80% 2,183 2,732 2,275 2,184 1,579 4,532 3,763
Kestrel Coal 80% 87 45 249 94 143 157 237
Mount Thorley 64% 425 499 128 353 517 807 870
Warkworth 44% 753 711 923 658 667 1,394 1,325
Rio Tinto total thermal coal production 4,447 5,355 4,759 4,762 4,075 8,967 8,837
Page 12 of 25
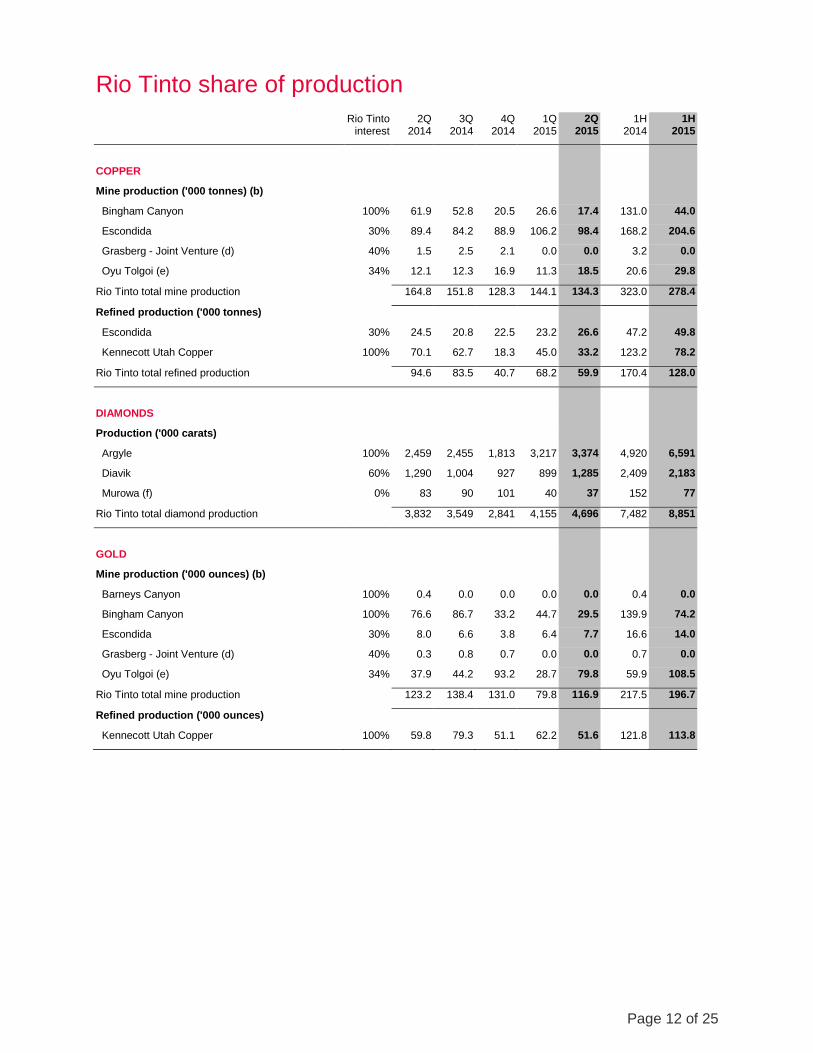
Rio Tinto share of production
Rio Tinto interest
2Q 2014
3Q 2014
4Q 2014
1Q 2015
2Q 2015
1H 2014
1H 2015
COPPER
Mine production ('000 tonnes) (b)
Bingham Canyon 100% 61.9 52.8 20.5 26.6 17.4 131.0 44.0
Escondida 30% 89.4 84.2 88.9 106.2 98.4 168.2 204.6
Grasberg - Joint Venture (d) 40% 1.5 2.5 2.1 0.0 0.0 3.2 0.0
Oyu Tolgoi (e) 34% 12.1 12.3 16.9 11.3 18.5 20.6 29.8
Rio Tinto total mine production 164.8 151.8 128.3 144.1 134.3 323.0 278.4
Refined production ('000 tonnes)
Escondida 30% 24.5 20.8 22.5 23.2 26.6 47.2 49.8
Kennecott Utah Copper 100% 70.1 62.7 18.3 45.0 33.2 123.2 78.2
Rio Tinto total refined production 94.6 83.5 40.7 68.2 59.9 170.4 128.0
DIAMONDS
Production ('000 carats)
Argyle 100% 2,459 2,455 1,813 3,217 3,374 4,920 6,591
Diavik 60% 1,290 1,004 927 899 1,285 2,409 2,183
Murowa (f) 0% 83 90 101 40 37 152 77
Rio Tinto total diamond production 3,832 3,549 2,841 4,155 4,696 7,482 8,851
GOLD
Mine production ('000 ounces) (b)
Barneys Canyon 100% 0.4 0.0 0.0 0.0 0.0 0.4 0.0
Bingham Canyon 100% 76.6 86.7 33.2 44.7 29.5 139.9 74.2
Escondida 30% 8.0 6.6 3.8 6.4 7.7 16.6 14.0
Grasberg - Joint Venture (d) 40% 0.3 0.8 0.7 0.0 0.0 0.7 0.0
Oyu Tolgoi (e) 34% 37.9 44.2 93.2 28.7 79.8 59.9 108.5
Rio Tinto total mine production 123.2 138.4 131.0 79.8 116.9 217.5 196.7
Refined production ('000 ounces)
Kennecott Utah Copper 100% 59.8 79.3 51.1 62.2 51.6 121.8 113.8
Page 13 of 25
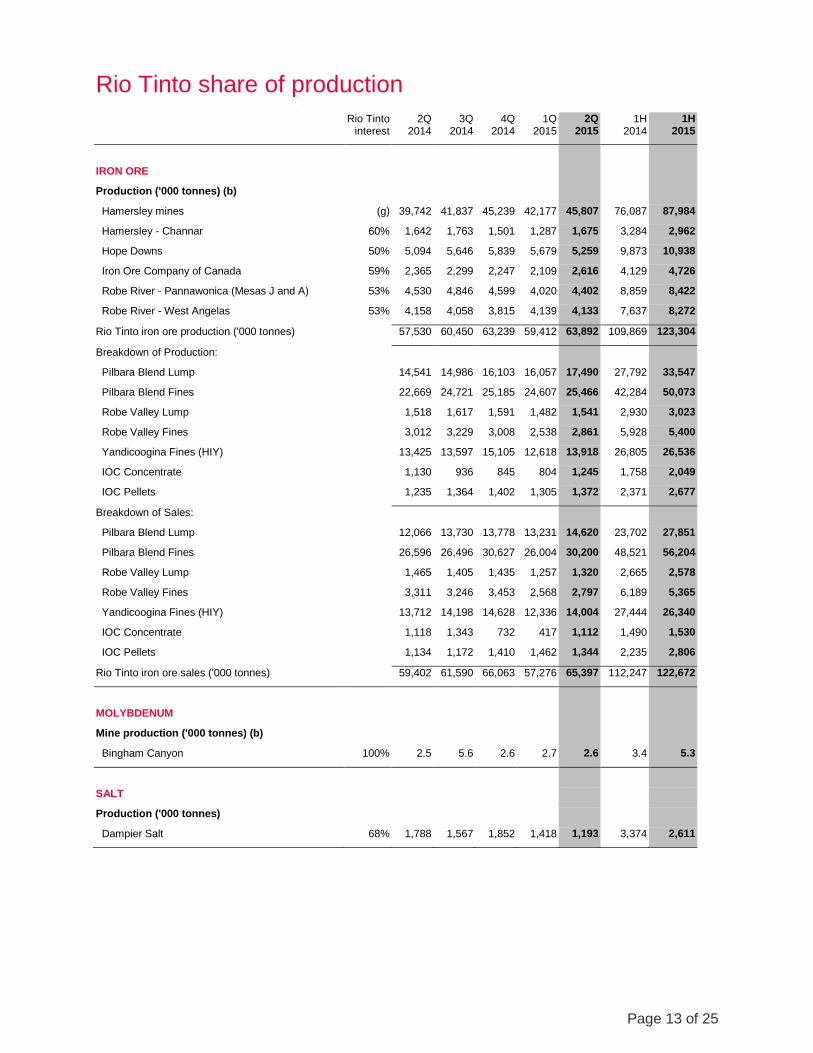
Rio Tinto share of production
Rio Tinto interest
2Q 2014
3Q 2014
4Q 2014
1Q 2015
2Q 2015
1H 2014
1H 2015
IRON ORE
Production ('000 tonnes) (b)
Hamersley mines (g) 39,742 41,837 45,239 42,177 45,807 76,087 87,984
Hamersley - Channar 60% 1,642 1,763 1,501 1,287 1,675 3,284 2,962
Hope Downs 50% 5,094 5,646 5,839 5,679 5,259 9,873 10,938
Iron Ore Company of Canada 59% 2,365 2,299 2,247 2,109 2,616 4,129 4,726
Robe River - Pannawonica (Mesas J and A) 53% 4,530 4,846 4,599 4,020 4,402 8,859 8,422
Robe River - West Angelas 53% 4,158 4,058 3,815 4,139 4,133 7,637 8,272
Rio Tinto iron ore production ('000 tonnes) 57,530 60,450 63,239 59,412 63,892 109,869 123,304
Breakdown of Production:
Pilbara Blend Lump 14,541 14,986 16,103 16,057 17,490 27,792 33,547
Pilbara Blend Fines 22,669 24,721 25,185 24,607 25,466 42,284 50,073
Robe Valley Lump 1,518 1,617 1,591 1,482 1,541 2,930 3,023
Robe Valley Fines 3,012 3,229 3,008 2,538 2,861 5,928 5,400
Yandicoogina Fines (HIY) 13,425 13,597 15,105 12,618 13,918 26,805 26,536
IOC Concentrate 1,130 936 845 804 1,245 1,758 2,049
IOC Pellets 1,235 1,364 1,402 1,305 1,372 2,371 2,677
Breakdown of Sales:
Pilbara Blend Lump 12,066 13,730 13,778 13,231 14,620 23,702 27,851
Pilbara Blend Fines 26,596 26,496 30,627 26,004 30,200 48,521 56,204
Robe Valley Lump 1,465 1,405 1,435 1,257 1,320 2,665 2,578
Robe Valley Fines 3,311 3,246 3,453 2,568 2,797 6,189 5,365
Yandicoogina Fines (HIY) 13,712 14,198 14,628 12,336 14,004 27,444 26,340
IOC Concentrate 1,118 1,343 732 417 1,112 1,490 1,530
IOC Pellets 1,134 1,172 1,410 1,462 1,344 2,235 2,806
Rio Tinto iron ore sales ('000 tonnes) 59,402 61,590 66,063 57,276 65,397 112,247 122,672
MOLYBDENUM
Mine production ('000 tonnes) (b)
Bingham Canyon 100% 2.5 5.6 2.6 2.7 2.6 3.4 5.3
SALT
Production ('000 tonnes)
Dampier Salt 68% 1,788 1,567 1,852 1,418 1,193 3,374 2,611

Page 14 of 25
Rio Tinto share of production
Rio Tinto interest
2Q 2014
3Q 2014
4Q 2014
1Q 2015
2Q 2015
1H 2014
1H 2015
SILVER
Mine production ('000 ounces) (b)
Bingham Canyon 100% 864 970 356 486 310 1,608 796
Escondida 30% 432 348 288 407 394 829 801
Grasberg - Joint Venture (d) 40% 0 0 0 0 0 0 0
Oyu Tolgoi (e) 34% 77 72 96 62 100 131 161
Rio Tinto total mine production 1,372 1,390 740 954 804 2,569 1,758
Refined production ('000 ounces)
Kennecott Utah Copper 100% 818 759 636 698 501 1,417 1,198
TITANIUM DIOXIDE SLAG
Production ('000 tonnes)
Rio Tinto Iron & Titanium (h) 100% 372 365 316 322 301 762 624
URANIUM
Production ('000 lbs U3O8)
Energy Resources of Australia (i) 68% 0 853 904 737 589 0 1,326
Rössing 69% 455 615 618 272 543 1,099 815
Rio Tinto total uranium production 455 1,467 1,523 1,010 1,131 1,099 2,141
Production data notes: Production figures are sometimes more precise than the rounded numbers shown, hence small differences may result between the total of the quarter figures and the year to date figures.
(a) The curtailment of production at the Gove refinery was completed on 28 May 2014.
(b) Mine production figures for metals refer to the total quantity of metal produced in concentrates, leach liquor or doré bullion
irrespective of whether these products are then refined onsite, except for the data for bauxite and iron ore which represent
production of marketable quantities of ore plus concentrates and pellets.
(c) Rio Tinto has a 22.95% shareholding in the Sangaredi mine but benefits from 45.0% of production.
(d) Through a joint venture agreement with Freeport-McMoRan (FCX), Rio Tinto is entitled to 40% of additional material mined as a
consequence of expansions and developments of the Grasberg facilities since 1998.
(e) Rio Tinto owns a 33.52% indirect interest in Oyu Tolgoi through its 50.79% interest in Turquoise Hill Resources Ltd.
(f) Rio Tinto sold its 77.8% interest in Murowa Diamonds with an effective date of 17 June 2015. Production data are shown up to
that date.
(g) Includes 100% of production from Paraburdoo, Mt Tom Price, Marandoo, Yandicoogina, Brockman, Nammuldi and the Eastern
Range mines. Whilst Rio Tinto owns 54% of the Eastern Range mine, under the terms of the joint venture agreement, Hamersley
Iron manages the operation and is obliged to purchase all mine production from the joint venture and therefore all of the production
is included in Rio Tinto's share of production.
(h) Quantities comprise 100% of Rio Tinto Fer et Titane and Rio Tinto's 74% interest in Richards Bay Minerals (RBM).
(i) ERA production reported is 'drummed' U3O8.
The Rio Tinto percentage shown above is at 30 June 2015.
Rio Tinto's interest in the Benga and Clermont mines and the Alucam and SØRAL smelters were sold in 2014. No data for these operations are included in the Share of Production table.

Page 15 of 25
Rio Tinto operational data
Rio Tinto interest
2Q 2014
3Q 2014
4Q 2014
1Q 2015
2Q 2015
1H 2014
1H 2015
ALUMINA
Smelter Grade Alumina - Aluminium Group
Alumina production ('000 tonnes)
Australia
Queensland Alumina Refinery - Queensland 80.0% 835 926 935 924 927 1,706 1,850
Yarwun refinery - Queensland 100.0% 661 656 687 683 700 1,344 1,384
Brazil
São Luis (Alumar) refinery 10.0% 865 938 953 862 940 1,747 1,802
Canada
Jonquière (Vaudreuil) refinery - Quebec (a) 100.0% 352 358 373 360 359 713 719
(a) Jonquière’s (Vaudreuil’s) production shows smelter grade alumina only and excludes hydrate produced and used for specialty alumina.
Smelter Grade Alumina - Other Aluminium
Alumina production ('000 tonnes)
Australia
Gove refinery - Northern Territory (a) 100.0% 139 0 0 0 0 676 0
(a) The curtailment of production at the Gove refinery was completed on 28 May 2014.
Specialty Alumina - Aluminium Group
Specialty alumina production ('000 tonnes)
Canada
Jonquière (Vaudreuil) plant – Quebec 100.0% 27 28 27 27 30 53 57
Rio Tinto percentage interest shown above is at 30 June 2015. The data represent full production and sales on a 100% basis unless otherwise stated.

Page 16 of 25
Rio Tinto operational data
Rio Tinto interest
2Q 2014
3Q 2014
4Q 2014
1Q 2015
2Q 2015
1H 2014
1H 2015
ALUMINIUM
Primary Aluminium
Primary aluminium production ('000 tonnes)
Australia
Bell Bay smelter - Tasmania 100.0% 47 48 48 46 47 93 94
Boyne Island smelter - Queensland 59.4% 136 143 145 142 145 265 287
Tomago smelter - New South Wales 51.6% 139 142 144 141 145 275 286
Cameroon
Alucam (Edéa) smelter (a) 0.0% 23 24 22 - - 47 -
Canada
Alma smelter - Quebec 100.0% 111 116 116 115 116 223 231
Alouette (Sept-Îles) smelter - Quebec 40.0% 145 146 147 147 152 290 299
Arvida smelter - Quebec 100.0% 43 44 44 43 43 85 86
Arvida AP60 smelter - Quebec 100.0% 15 15 15 14 15 29 29
Bécancour smelter - Quebec 25.1% 111 110 114 105 113 222 218
Grande-Baie smelter - Quebec 100.0% 55 55 55 54 55 111 109
Kitimat smelter - British Columbia 100.0% 35 28 24 20 15 73 35
Laterrière smelter - Quebec 100.0% 61 62 62 60 61 121 121
France
Dunkerque smelter 100.0% 67 68 68 67 68 134 136
Iceland
ISAL (Reykjavik) smelter 100.0% 52 51 52 51 51 102 103
New Zealand
Tiwai Point smelter 79.4% 82 82 82 82 83 163 165
Norway
SØRAL (Husnes) smelter (b) 0.0% 23 23 8 - - 45 -
Oman
Sohar smelter 20.0% 91 92 93 93 94 178 187
United Kingdom
Lochaber smelter 100.0% 10 10 11 12 12 20 23
(a) Rio Tinto sold its 46.7% interest in the Alucam (Edéa) smelter with an effective date of 31 December 2014. Production data are shown up to that date. (b) Rio Tinto sold its 50% interest in the SØRAL (Husnes) smelter with an effective date of 31 October 2014. Production data are shown up to that date.
Rio Tinto percentage interest shown above is at 30 June 2015. The data represent full production and sales on a 100% basis unless otherwise stated.
Page 17 of 25
Rio Tinto operational data
Rio Tinto interest
2Q 2014
3Q 2014
4Q 2014
1Q 2015
2Q 2015
1H 2014
1H 2015
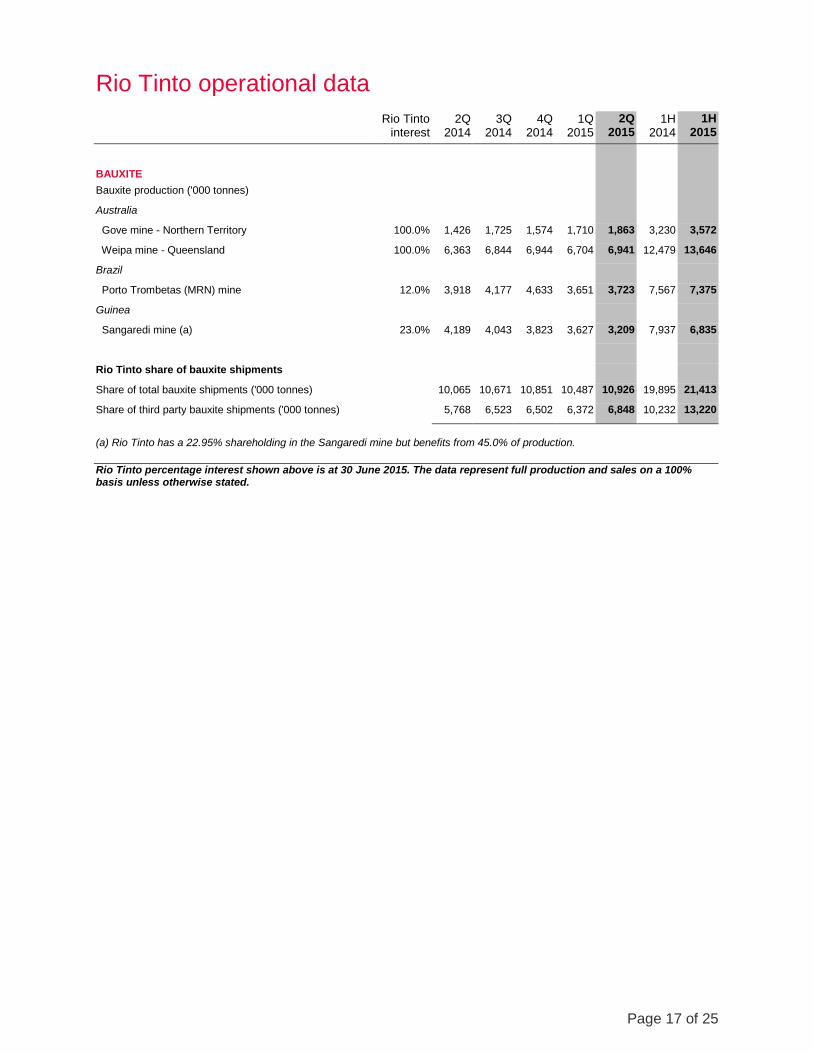
BAUXITE
Bauxite production ('000 tonnes)
Australia
Gove mine - Northern Territory 100.0% 1,426 1,725 1,574 1,710 1,863 3,230 3,572
Weipa mine - Queensland 100.0% 6,363 6,844 6,944 6,704 6,941 12,479 13,646
Brazil
Porto Trombetas (MRN) mine 12.0% 3,918 4,177 4,633 3,651 3,723 7,567 7,375
Guinea
Sangaredi mine (a) 23.0% 4,189 4,043 3,823 3,627 3,209 7,937 6,835
Rio Tinto share of bauxite shipments
Share of total bauxite shipments ('000 tonnes) 10,065 10,671 10,851 10,487 10,926 19,895 21,413
Share of third party bauxite shipments ('000 tonnes) 5,768 6,523 6,502 6,372 6,848 10,232 13,220
(a) Rio Tinto has a 22.95% shareholding in the Sangaredi mine but benefits from 45.0% of production.
Rio Tinto percentage interest shown above is at 30 June 2015. The data represent full production and sales on a 100% basis unless otherwise stated.
Page 18 of 25
Rio Tinto operational data
Rio Tinto interest
2Q 2014
3Q 2014
4Q 2014
1Q 2015
2Q 2015
1H 2014
1H 2015
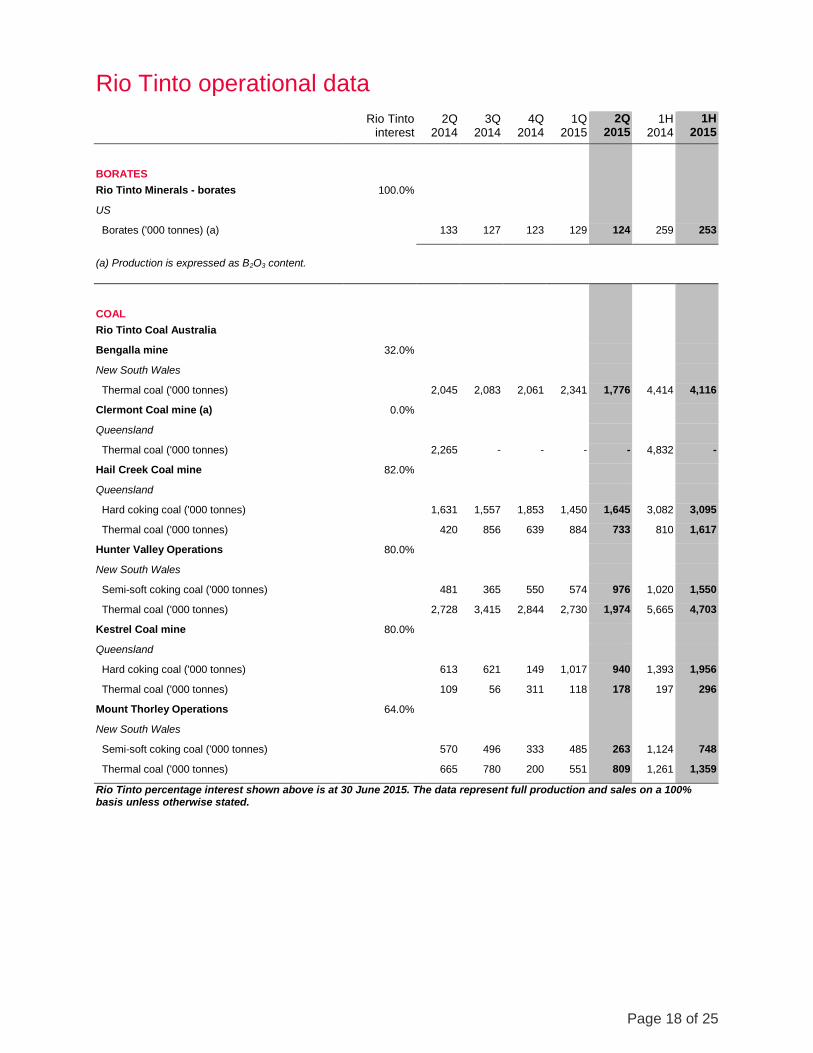
BORATES
Rio Tinto Minerals - borates 100.0%
US
Borates ('000 tonnes) (a) 133 127 123 129 124 259 253
(a) Production is expressed as B2O3 content.
COAL
Rio Tinto Coal Australia
Bengalla mine 32.0%
New South Wales
Thermal coal ('000 tonnes) 2,045 2,083 2,061 2,341 1,776 4,414 4,116
Clermont Coal mine (a) 0.0%
Queensland
Thermal coal ('000 tonnes) 2,265 - - - - 4,832 -
Hail Creek Coal mine 82.0%
Queensland
Hard coking coal ('000 tonnes) 1,631 1,557 1,853 1,450 1,645 3,082 3,095
Thermal coal ('000 tonnes) 420 856 639 884 733 810 1,617
Hunter Valley Operations 80.0%
New South Wales
Semi-soft coking coal ('000 tonnes) 481 365 550 574 976 1,020 1,550
Thermal coal ('000 tonnes) 2,728 3,415 2,844 2,730 1,974 5,665 4,703
Kestrel Coal mine 80.0%
Queensland
Hard coking coal ('000 tonnes) 613 621 149 1,017 940 1,393 1,956
Thermal coal ('000 tonnes) 109 56 311 118 178 197 296
Mount Thorley Operations 64.0%
New South Wales
Semi-soft coking coal ('000 tonnes) 570 496 333 485 263 1,124 748
Thermal coal ('000 tonnes) 665 780 200 551 809 1,261 1,359
Rio Tinto percentage interest shown above is at 30 June 2015. The data represent full production and sales on a 100% basis unless otherwise stated.
Page 19 of 25
Rio Tinto operational data
Rio Tinto interest
2Q 2014
3Q 2014
4Q 2014
1Q 2015
2Q 2015
1H 2014
1H 2015
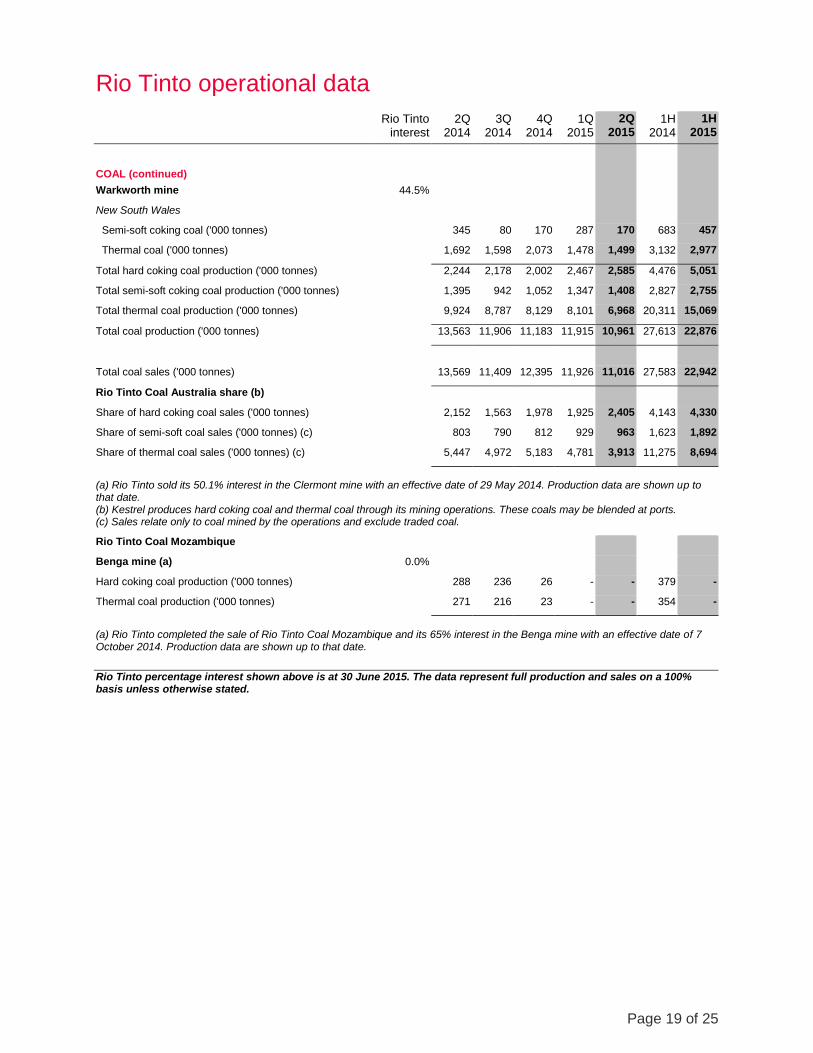
COAL (continued)
Warkworth mine 44.5%
New South Wales
Semi-soft coking coal ('000 tonnes) 345 80 170 287 170 683 457
Thermal coal ('000 tonnes) 1,692 1,598 2,073 1,478 1,499 3,132 2,977
Total hard coking coal production ('000 tonnes) 2,244 2,178 2,002 2,467 2,585 4,476 5,051
Total semi-soft coking coal production ('000 tonnes) 1,395 942 1,052 1,347 1,408 2,827 2,755
Total thermal coal production ('000 tonnes) 9,924 8,787 8,129 8,101 6,968 20,311 15,069
Total coal production ('000 tonnes) 13,563 11,906 11,183 11,915 10,961 27,613 22,876
Total coal sales ('000 tonnes) 13,569 11,409 12,395 11,926 11,016 27,583 22,942
Rio Tinto Coal Australia share (b)
Share of hard coking coal sales ('000 tonnes) 2,152 1,563 1,978 1,925 2,405 4,143 4,330
Share of semi-soft coal sales ('000 tonnes) (c) 803 790 812 929 963 1,623 1,892
Share of thermal coal sales ('000 tonnes) (c) 5,447 4,972 5,183 4,781 3,913 11,275 8,694
(a) Rio Tinto sold its 50.1% interest in the Clermont mine with an effective date of 29 May 2014. Production data are shown up to that date. (b) Kestrel produces hard coking coal and thermal coal through its mining operations. These coals may be blended at ports. (c) Sales relate only to coal mined by the operations and exclude traded coal.
Rio Tinto Coal Mozambique
Benga mine (a) 0.0%
Hard coking coal production ('000 tonnes) 288 236 26 - - 379 -
Thermal coal production ('000 tonnes) 271 216 23 - - 354 -
(a) Rio Tinto completed the sale of Rio Tinto Coal Mozambique and its 65% interest in the Benga mine with an effective date of 7 October 2014. Production data are shown up to that date.
Rio Tinto percentage interest shown above is at 30 June 2015. The data represent full production and sales on a 100% basis unless otherwise stated.

Page 20 of 25
Rio Tinto operational data
Rio Tinto interest
2Q 2014
3Q 2014
4Q 2014
1Q 2015
2Q 2015
1H 2014
1H 2015
COPPER & GOLD
Escondida 30.0%
Chile
Sulphide ore to concentrator ('000 tonnes) 21,438 20,652 18,354 21,382 22,909 42,488 44,291
Average copper grade (%) 1.33 1.20 1.45 1.49 1.32 1.23 1.40
Mill production (metals in concentrates):
Contained copper ('000 tonnes) 235.6 205.5 215.7 270.6 249.6 431.2 520.2
Contained gold ('000 ounces) 27 22 13 21 26 55 47
Contained silver ('000 ounces) 1,439 1,159 958 1,355 1,314 2,765 2,669
Recoverable copper in ore stacked for leaching ('000 tonnes) (a) 62.3 75.3 80.5 83.5 78.5 129.4 162.0
Refined production from leach plants:
Copper cathode production ('000 tonnes) 81.5 69.3 75.0 77.3 88.8 157.3 166.1
(a) The calculation of copper in material mined for leaching is based on ore stacked at the leach pad.
Freeport-McMoRan Copper & Gold
Grasberg mine (a) 0.0% (b)
Papua, Indonesia
Ore treated ('000 tonnes) 9,368 12,488 11,512 14,123 18,269 19,985 32,392
Average mill head grades:
Copper (%) 0.73 0.88 0.79 0.57 0.66 0.72 0.62
Gold (g/t) 0.65 1.28 1.14 0.68 0.69 0.72 0.69
Silver (g/t) 3.08 3.90 3.37 2.13 1.94 3.21 2.02
Production of metals in concentrates:
Copper in concentrates ('000 tonnes) 58.7 97.7 82.3 72.2 104.8 126.2 177.0
Gold in concentrates ('000 ounces) 147 439 366 262 320 362 582
Silver in concentrates ('000 ounces) 499 913 771 558 639 1,057 1,198
Sales of payable metals in concentrates: (c)
Copper in concentrates ('000 tonnes) 54.3 120.0 83.9 70.4 98.8 104.9 169.2
Gold in concentrates ('000 ounces) 136 505 366 260 306 299 566
Silver in concentrates ('000 ounces) 367 889 623 435 483 701 918
(a) Through a joint venture agreement with Freeport-McMoRan (FCX), Rio Tinto is entitled to 40% of additional material mined as a consequence of expansions and developments of the Grasberg facilities since 1998. The 2Q 2015 results show the forecast from FCX's most recent five-year plan, because FCX is not releasing its actual 100% operating data for 2Q 2015 until the release of its 2015 second-quarter results on 23 July 2015. (b) Rio Tinto share of Grasberg production is 40% of the expansion. (c) Net of smelter deductions.
Rio Tinto percentage interest shown above is at 30 June 2015. The data represent full production and sales on a 100% basis unless otherwise stated.

Page 21 of 25
Rio Tinto operational data
Rio Tinto interest
2Q 2014
3Q 2014
4Q 2014
1Q 2015
2Q 2015
1H 2014
1H 2015
COPPER & GOLD (continued)
Kennecott Utah Copper
Barneys Canyon mine (a) 100.0%
Utah, US
Gold produced ('000 ounces) 0.4 0.0 0.0 0.0 0.0 0.4 0.0
Bingham Canyon mine 100.0%
Utah, US
Ore treated ('000 tonnes) 10,480 12,184 6,404 9,819 8,208 22,396 18,026
Average ore grade:
Copper (%) 0.65 0.49 0.37 0.31 0.25 0.65 0.28
Gold (g/t) 0.33 0.33 0.26 0.21 0.17 0.29 0.19
Silver (g/t) 3.26 3.01 2.22 2.22 1.99 2.92 2.11
Molybdenum (%) 0.044 0.069 0.060 0.041 0.046 0.036 0.044
Copper concentrates produced ('000 tonnes) 225 193 82 133 84 524 218
Average concentrate grade (% Cu) 27.5 27.2 24.8 19.9 20.6 25.0 20.2
Production of metals in copper concentrates:
Copper ('000 tonnes) (b) 61.9 52.8 20.5 26.6 17.4 131.0 44.0
Gold ('000 ounces) 77 87 33 45 29 140 74
Silver ('000 ounces) 864 970 356 486 310 1,608 796
Molybdenum concentrates produced ('000 tonnes): 4.6 10.5 4.9 5.2 5.0 6.5 10.3
Molybdenum in concentrates ('000 tonnes) 2.5 5.6 2.6 2.7 2.6 3.4 5.3
(a) Mining operations ceased in the first quarter of 2002. Gold continues to be recovered from leach pads. (b) Includes a small amount of copper in precipitates.
Kennecott smelter & refinery 100.0%
Copper concentrates smelted ('000 tonnes) 309 205 122 148 99 581 247
Copper anodes produced ('000 tonnes) (a) 71.7 50.2 24.9 35.1 19.1 129.1 54.2
Production of refined metal:
Copper ('000 tonnes) 70.1 62.7 18.3 45.0 33.2 123.2 78.2
Gold ('000 ounces) (b) 59.8 79.3 51.1 62.2 51.6 121.8 113.8
Silver ('000 ounces) (b) 818 759 636 698 501 1,417 1,198
(a) New metal excluding recycled material. (b) Includes gold and silver in intermediate products.
Rio Tinto percentage interest shown above is at 30 June 2015. The data represent full production and sales on a 100% basis unless otherwise stated.
Page 22 of 25
Rio Tinto operational data
Rio Tinto interest
2Q 2014
3Q 2014
4Q 2014
1Q 2015
2Q 2015
1H 2014
1H 2015
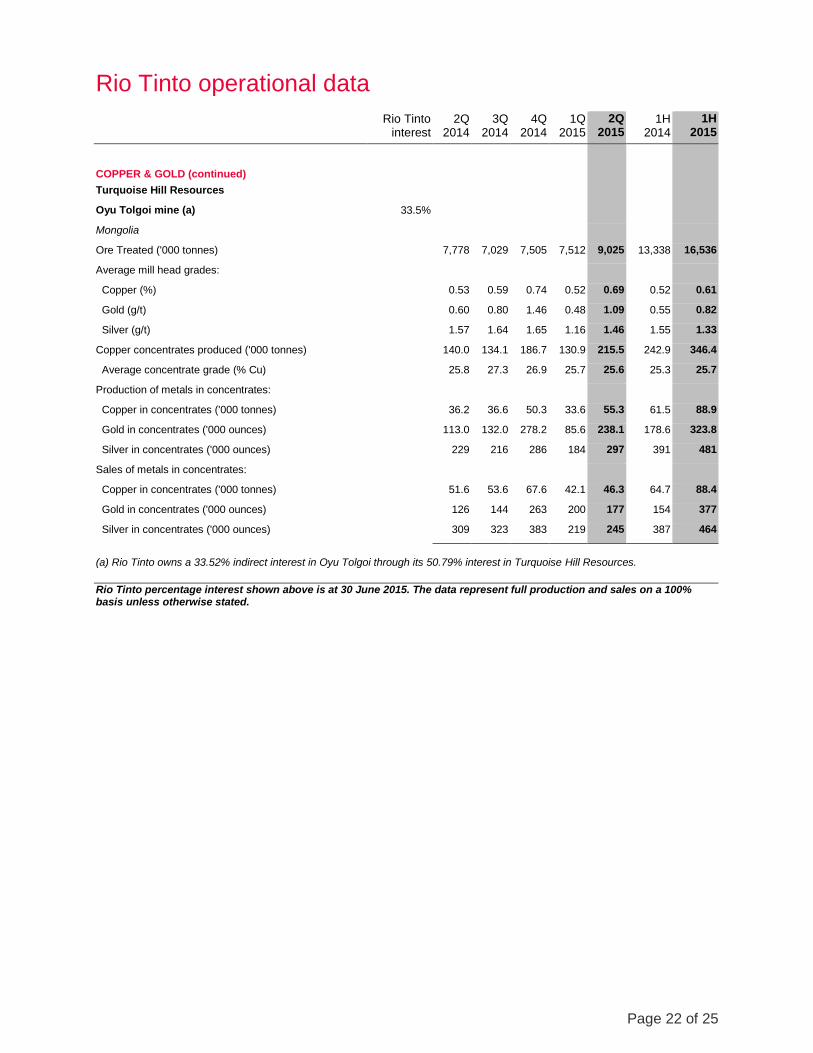
COPPER & GOLD (continued)
Turquoise Hill Resources
Oyu Tolgoi mine (a) 33.5%
Mongolia
Ore Treated ('000 tonnes) 7,778 7,029 7,505 7,512 9,025 13,338 16,536
Average mill head grades:
Copper (%) 0.53 0.59 0.74 0.52 0.69 0.52 0.61
Gold (g/t) 0.60 0.80 1.46 0.48 1.09 0.55 0.82
Silver (g/t) 1.57 1.64 1.65 1.16 1.46 1.55 1.33
Copper concentrates produced ('000 tonnes) 140.0 134.1 186.7 130.9 215.5 242.9 346.4
Average concentrate grade (% Cu) 25.8 27.3 26.9 25.7 25.6 25.3 25.7
Production of metals in concentrates:
Copper in concentrates ('000 tonnes) 36.2 36.6 50.3 33.6 55.3 61.5 88.9
Gold in concentrates ('000 ounces) 113.0 132.0 278.2 85.6 238.1 178.6 323.8
Silver in concentrates ('000 ounces) 229 216 286 184 297 391 481
Sales of metals in concentrates:
Copper in concentrates ('000 tonnes) 51.6 53.6 67.6 42.1 46.3 64.7 88.4
Gold in concentrates ('000 ounces) 126 144 263 200 177 154 377
Silver in concentrates ('000 ounces) 309 323 383 219 245 387 464
(a) Rio Tinto owns a 33.52% indirect interest in Oyu Tolgoi through its 50.79% interest in Turquoise Hill Resources.
Rio Tinto percentage interest shown above is at 30 June 2015. The data represent full production and sales on a 100% basis unless otherwise stated.
Page 23 of 25
Rio Tinto operational data
Rio Tinto interest
2Q 2014
3Q 2014
4Q 2014
1Q 2015
2Q 2015
1H 2014
1H 2015
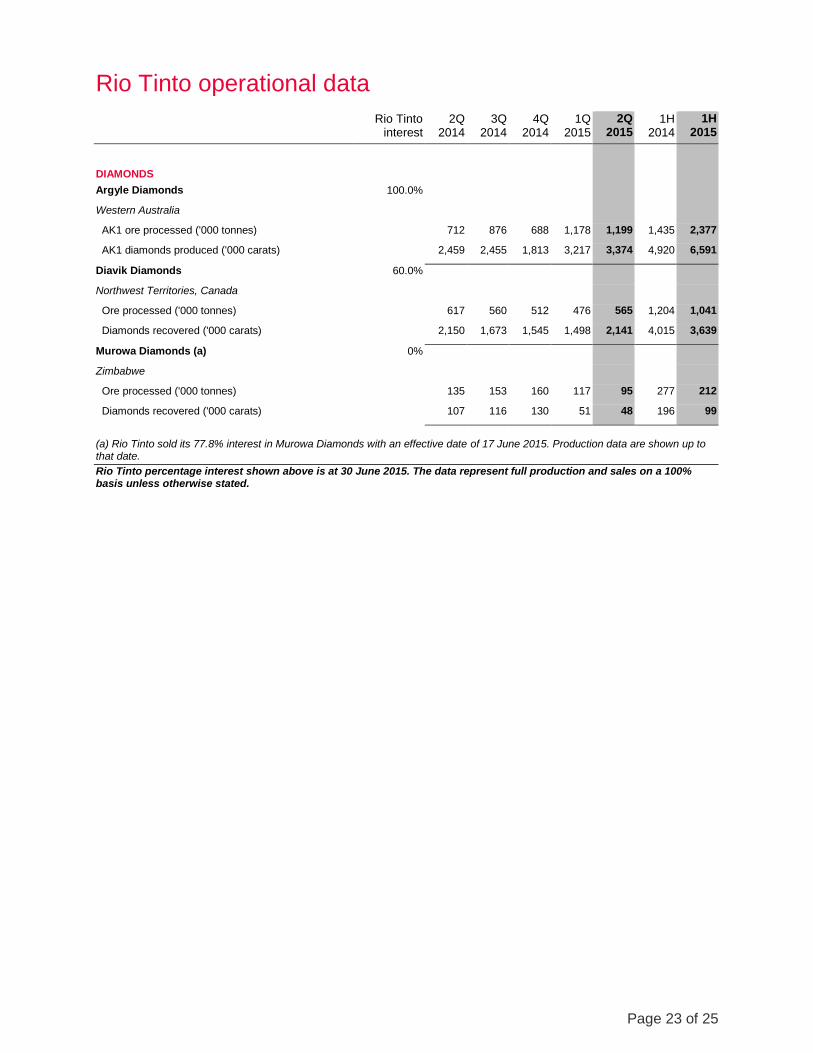
DIAMONDS
Argyle Diamonds 100.0%
Western Australia
AK1 ore processed ('000 tonnes) 712 876 688 1,178 1,199 1,435 2,377
AK1 diamonds produced ('000 carats) 2,459 2,455 1,813 3,217 3,374 4,920 6,591
Diavik Diamonds 60.0%
Northwest Territories, Canada
Ore processed ('000 tonnes) 617 560 512 476 565 1,204 1,041
Diamonds recovered ('000 carats) 2,150 1,673 1,545 1,498 2,141 4,015 3,639
Murowa Diamonds (a) 0%
Zimbabwe
Ore processed ('000 tonnes) 135 153 160 117 95 277 212
Diamonds recovered ('000 carats) 107 116 130 51 48 196 99
(a) Rio Tinto sold its 77.8% interest in Murowa Diamonds with an effective date of 17 June 2015. Production data are shown up to that date.
Rio Tinto percentage interest shown above is at 30 June 2015. The data represent full production and sales on a 100% basis unless otherwise stated.
Page 24 of 25
Rio Tinto operational data
Rio Tinto interest
2Q 2014
3Q 2014
4Q 2014
1Q 2015
2Q 2015
1H 2014
1H 2015
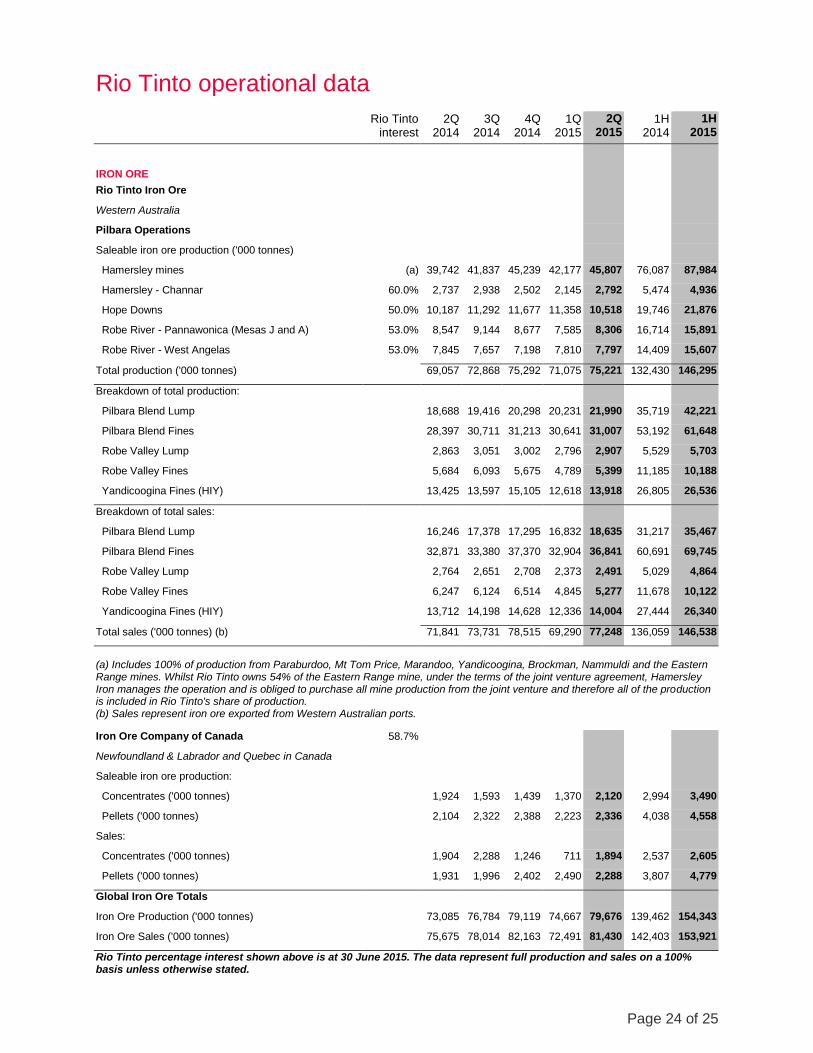
IRON ORE
Rio Tinto Iron Ore
Western Australia
Pilbara Operations
Saleable iron ore production ('000 tonnes)
Hamersley mines (a) 39,742 41,837 45,239 42,177 45,807 76,087 87,984
Hamersley - Channar 60.0% 2,737 2,938 2,502 2,145 2,792 5,474 4,936
Hope Downs 50.0% 10,187 11,292 11,677 11,358 10,518 19,746 21,876
Robe River - Pannawonica (Mesas J and A) 53.0% 8,547 9,144 8,677 7,585 8,306 16,714 15,891
Robe River - West Angelas 53.0% 7,845 7,657 7,198 7,810 7,797 14,409 15,607
Total production ('000 tonnes) 69,057 72,868 75,292 71,075 75,221 132,430 146,295
Breakdown of total production:
Pilbara Blend Lump 18,688 19,416 20,298 20,231 21,990 35,719 42,221
Pilbara Blend Fines 28,397 30,711 31,213 30,641 31,007 53,192 61,648
Robe Valley Lump 2,863 3,051 3,002 2,796 2,907 5,529 5,703
Robe Valley Fines 5,684 6,093 5,675 4,789 5,399 11,185 10,188
Yandicoogina Fines (HIY) 13,425 13,597 15,105 12,618 13,918 26,805 26,536
Breakdown of total sales:
Pilbara Blend Lump 16,246 17,378 17,295 16,832 18,635 31,217 35,467
Pilbara Blend Fines 32,871 33,380 37,370 32,904 36,841 60,691 69,745
Robe Valley Lump 2,764 2,651 2,708 2,373 2,491 5,029 4,864
Robe Valley Fines 6,247 6,124 6,514 4,845 5,277 11,678 10,122
Yandicoogina Fines (HIY) 13,712 14,198 14,628 12,336 14,004 27,444 26,340
Total sales ('000 tonnes) (b) 71,841 73,731 78,515 69,290 77,248 136,059 146,538
(a) Includes 100% of production from Paraburdoo, Mt Tom Price, Marandoo, Yandicoogina, Brockman, Nammuldi and the Eastern Range mines. Whilst Rio Tinto owns 54% of the Eastern Range mine, under the terms of the joint venture agreement, Hamersley Iron manages the operation and is obliged to purchase all mine production from the joint venture and therefore all of the production is included in Rio Tinto's share of production. (b) Sales represent iron ore exported from Western Australian ports.
Iron Ore Company of Canada 58.7%
Newfoundland & Labrador and Quebec in Canada
Saleable iron ore production:
Concentrates ('000 tonnes) 1,924 1,593 1,439 1,370 2,120 2,994 3,490
Pellets ('000 tonnes) 2,104 2,322 2,388 2,223 2,336 4,038 4,558
Sales:
Concentrates ('000 tonnes) 1,904 2,288 1,246 711 1,894 2,537 2,605
Pellets ('000 tonnes) 1,931 1,996 2,402 2,490 2,288 3,807 4,779
Global Iron Ore Totals
Iron Ore Production ('000 tonnes) 73,085 76,784 79,119 74,667 79,676 139,462 154,343
Iron Ore Sales ('000 tonnes) 75,675 78,014 82,163 72,491 81,430 142,403 153,921
Rio Tinto percentage interest shown above is at 30 June 2015. The data represent full production and sales on a 100% basis unless otherwise stated.
Page 25 of 25
Rio Tinto operational data
Rio Tinto interest
2Q 2014
3Q 2014
4Q 2014
1Q 2015
2Q 2015
1H 2014
1H 2015
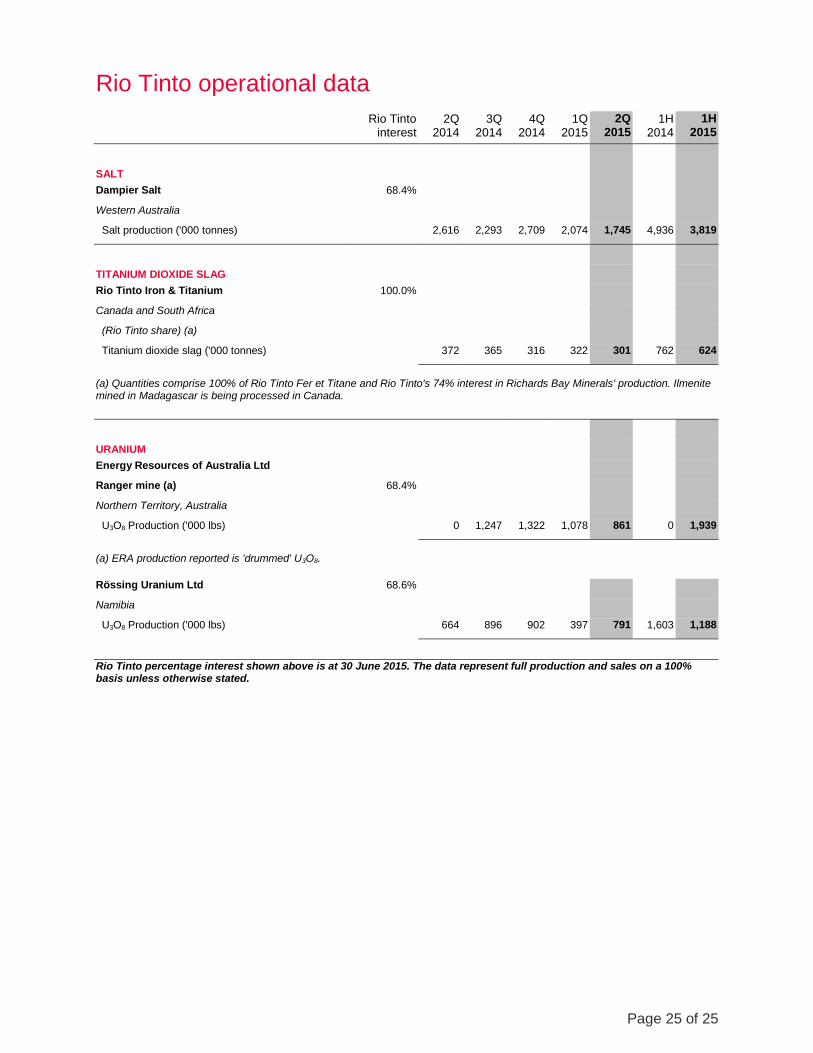
SALT
Dampier Salt 68.4%
Western Australia
Salt production ('000 tonnes) 2,616 2,293 2,709 2,074 1,745 4,936 3,819
TITANIUM DIOXIDE SLAG
Rio Tinto Iron & Titanium 100.0%
Canada and South Africa
(Rio Tinto share) (a)
Titanium dioxide slag ('000 tonnes) 372 365 316 322 301 762 624
(a) Quantities comprise 100% of Rio Tinto Fer et Titane and Rio Tinto's 74% interest in Richards Bay Minerals' production. Ilmenite mined in Madagascar is being processed in Canada.
URANIUM
Energy Resources of Australia Ltd
Ranger mine (a) 68.4%
Northern Territory, Australia
U3O8 Production ('000 lbs) 0 1,247 1,322 1,078 861 0 1,939
(a) ERA production reported is 'drummed' U3O8.
Rössing Uranium Ltd 68.6%
Namibia
U3O8 Production ('000 lbs) 664 896 902 397 791 1,603 1,188
Rio Tinto percentage interest shown above is at 30 June 2015. The data represent full production and sales on a 100% basis unless otherwise stated.