Embed Size (px)
Citation preview
Highlights for the three months ended June 30, 2011
No bank debt, an expanded $US 15 million credit facility available and working capital of $12.8 million, which provides the Trust with substantial financial resources to execute its business plan.
Income of $1.7 million or $0.10 per unit.
Funds flow from operations of $5.0 million, equating to $45.52 per bbl or $0.28 per unit.
Average working interest sales volumes of 1,214 bbls per day of light oil, with field netbacks of $57.42 per bbl.
An updated reserve report showing:
Total proved plus probable reserves at June 30, 2011 of 7.6 million barrels (45% of which are proved), an increase of 8% from December 31, 2010 levels.
Total proved plus probable reserves additions, net of technical revisions, of 1,115,000 barrels over the 13 months since the June 1, 2010 effective date of Eagle US’s acquisition of its interest in the Salt Flat field, resulting in Eagle US replacing 319% of its volumes produced from June 1, 2010 to June 30, 2011.
A US$28 million, or 16%, increase in proved plus probable reserves value (discounted at 10%) since December 31, 2010, after having produced 250,000 bbls.
Nine (7.2 net) horizontal oil wells drilled in the Salt Flat Field during the quarter, with a 100% success rate, and one (0.80) salt water disposal well.
Two (1.6 net) wells brought on-stream in April, one (0.8 net) well brought on-stream in June.
17 horizontal oil wells remaining to be tied in and put on production. Facilities allowing production expected to be in place by early September for substantially all wells, allowing them to be put on production by the beginning of October.
Unitholder distributions of $0.26 per unit for the quarter ($0.0875 per unit per month).
SECOND QUARTER REPORT Q2 2011
EAGLE SECOND QUARTER REPORT 2011
1
Management’s Discussion and Analysis August 11, 2011 This Management’s Discussion and Analysis (“MD&A”) of financial condition and results of operations for Eagle Energy Trust (the “Trust”), dated August 11, 2011, should be read in conjunction with the Trust’s unaudited interim consolidated financial statements and accompanying notes for the period ended June 30, 2011 and the Trust’s audited consolidated financial statements and accompanying notes for the year ended December 31, 2010 and related management’s discussion and analysis and the Trust’s Annual Information Form, all of which are filed on SEDAR at www.sedar.com and are available on the Trust’s website at www.eagleenergytrust.com.
The Trust’s unaudited interim consolidated financial statements have been prepared in accordance with International Financial Reporting Standards (“IFRS”), with specific reference to IAS 34 Interim Financial Statements. Items included in the financial statements of each of the Trust’s subsidiaries are measured using the currency of the primary economic environment in which the entity operates (“the functional currency”). The unaudited interim consolidated financial statements are presented in Canadian dollars, which is the functional and presentation currency of the Trust. Figures within this MD&A are presented in Canadian dollars unless otherwise indicated.
This MD&A contains information that is forward looking. Investors should read the “Note about Forward Looking Statements” section at the end of this MD&A.
Non-IFRS financial measures
Statements throughout this MD&A make reference to the terms “field netback” and “funds flow from operations” which are non-IFRS financial measures that do not have any standardized meaning prescribed by IFRS and are therefore unlikely to be comparable to similar measures presented by other issuers. Management believes that “field netback” and “funds flow from operations” provide useful information to investors and management since such measures reflect the quality of production, the level of profitability, the ability to drive growth through the funding of future capital expenditures and the sustainability of distributions to unitholders. Funds flow from operations is calculated before changes in non-cash working capital. See the “Non-IFRS financial measures” section of this MD&A for a reconciliation of funds flow from operations and field netback to loss for the period, the most directly comparable measure in the Trust’s unaudited interim consolidated financial statements. Other financial data has been prepared in accordance with IFRS.
Overview of the Trust
The Trust is an unincorporated open-ended limited purpose trust established under the laws of the Province of Alberta. The Trust’s activities are restricted to owning property (other than real property or interests in real property), and it does not carry on business. The Trust’s strategy is to invest in operating subsidiaries that will acquire conventional onshore oil and natural gas reserves and production with unexploited low risk development potential, located in certain regions of the U.S., and to pay out a portion of available cash to unitholders of the Trust on a monthly basis. The Trust provides investors with a publicly traded, oil and natural gas focused, distribution producing investment, with favourable tax treatment relative to taxable Canadian corporations.
The Trust was formed July 20, 2010. During November and December 2010, the Trust raised $149.5 million, at an offering price of $10.00 per trust unit, through an initial public offering. Concurrent with closing its initial public offering the Trust acquired, indirectly through its wholly-owned subsidiary, an average 73% interest in the Salt Flat field, a light oil property located in south central Texas, for $127.1 million. Consideration consisted of cash and 2,000,000 trust units valued at $20 million.
Throughout this MD&A, Eagle Energy Trust and its subsidiaries are collectively referred to as “the Trust” for purposes of convenience. In addition, references to the results of operations refer to operations of the Trust’s U.S. subsidiary.
EAGLE SECOND QUARTER REPORT 2011
2
Comparative financial information
Since the Trust was formed July 20, 2010 and closed its initial public offering and commenced operations with the acquisition of the Salt Flat field on November 24, 2010, no comparative financial information is available for presentation in the financial statements and this MD&A.
Highlights for the three month period ended June 30, 2011
No bank debt, an expanded $US 15 million credit facility available and working capital of $12.8 million, which provides the Trust with substantial financial resources to execute its business plan.
Income of $1.7 million or $0.10 per unit.
Funds flow from operations of $5.0 million, equating to $45.52 per bbl or $0.28 per unit.
Average working interest sales volumes of 1,214 bbls per day of light oil, with field netbacks of $57.42 per bbl.
An updated reserve report showing:
Total proved plus probable reserves at June 30, 2011 of 7.6 million barrels (45% of which are proved), an increase of 8% from December 31, 2010 levels.
Total proved plus probable reserves additions, net of technical revisions, of 1,115,000 barrels over the 13 months since the June 1, 2010 effective date of Eagle US’s acquisition of its interest in the Salt Flat field, resulting in Eagle US replacing 319% of its volumes produced from June 1, 2010 to June 30, 2011.
A US$28 million, or 16%, increase in proved plus probable reserves value (discounted at 10%) since December 31, 2010, after having produced 250,000 bbls.
Nine (7.2 net) horizontal oil wells drilled in the Salt Flat Field during the quarter, with a 100% success rate, and one (0.80) salt water disposal well.
Two (1.6 net) wells brought on-stream in April, one (0.8 net) well brought on-stream in June.
17 horizontal oil wells remaining to be tied in and put on production. Facilities allowing production expected to be in place by early September for substantially all wells, allowing them to be put on production by the beginning of October.
Unitholder distributions of $0.26 per unit for the quarter ($0.0875 per unit per month).
Summary of quarterly results
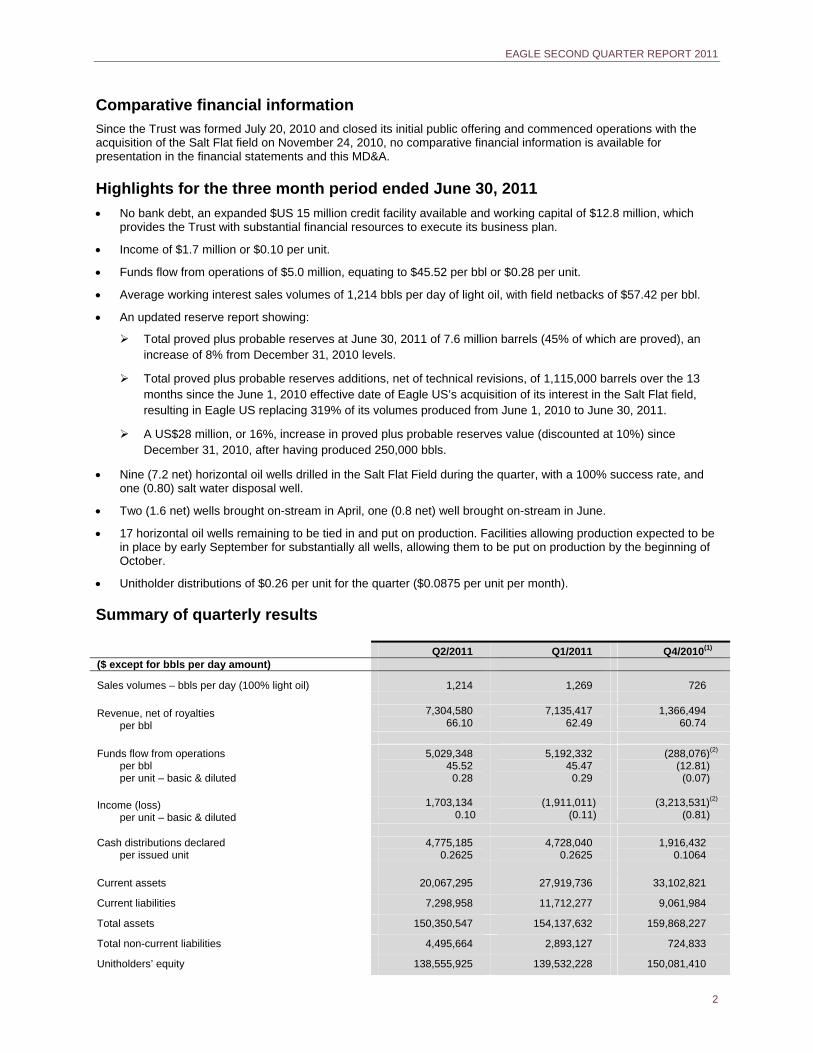
Q2/2011 Q1/2011 Q4/2010(1) ($ except for bbls per day amount)
Sales volumes – bbls per day (100% light oil) 1,214 1,269 726
Revenue, net of royalties per bbl
7,304,580 66.10
7,135,417 62.49
1,366,494 60.74
Funds flow from operations per bbl per unit – basic & diluted
5,029,348 45.52
0.28
5,192,332 45.47
0.29
(288,076)(2) (12.81) (0.07)
Income (loss) per unit – basic & diluted
1,703,134 0.10
(1,911,011) (0.11)
(3,213,531)(2) (0.81)
Cash distributions declared
per issued unit 4,775,185
0.2625 4,728,040
0.2625 1,916,432
0.1064
Current assets 20,067,295 27,919,736 33,102,821
Current liabilities 7,298,958 11,712,277 9,061,984
Total assets 150,350,547 154,137,632 159,868,227
Total non-current liabilities 4,495,664 2,893,127 724,833
Unitholders’ equity 138,555,925 139,532,228 150,081,410
EAGLE SECOND QUARTER REPORT 2011
3
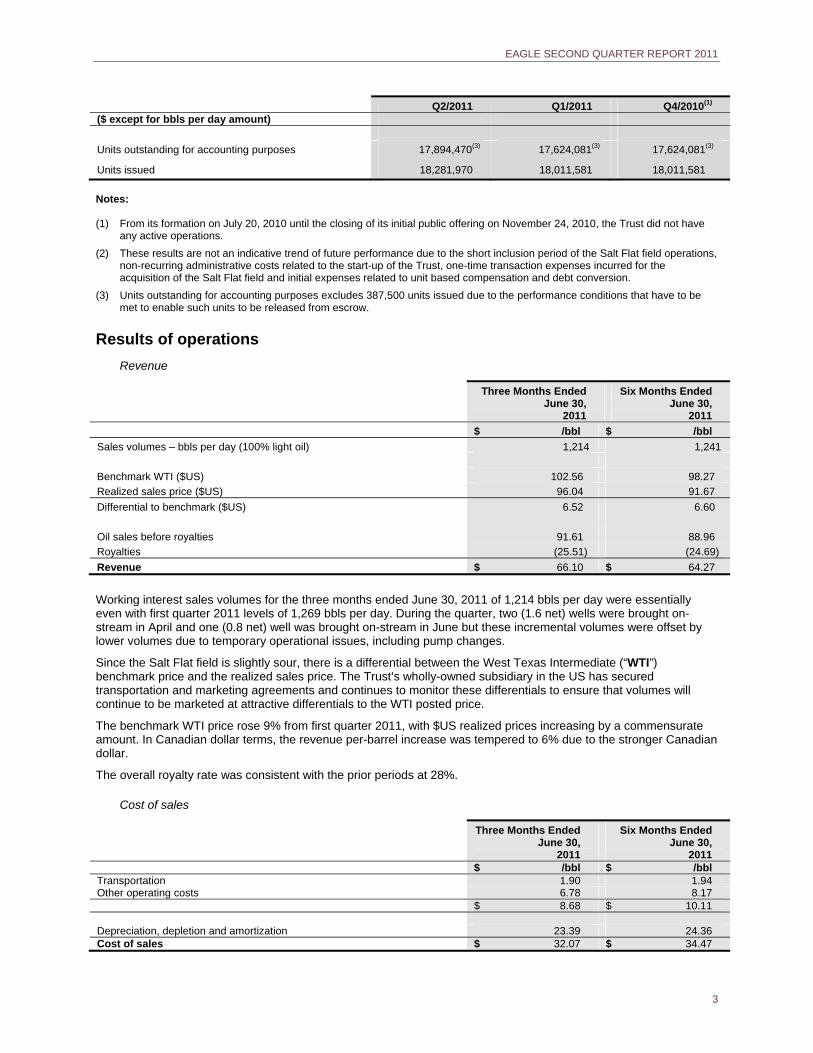
Q2/2011 Q1/2011 Q4/2010(1) ($ except for bbls per day amount)
Units outstanding for accounting purposes 17,894,470(3) 17,624,081(3) 17,624,081(3)
Units issued 18,281,970 18,011,581 18,011,581
Notes: (1) From its formation on July 20, 2010 until the closing of its initial public offering on November 24, 2010, the Trust did not have
any active operations.
(2) These results are not an indicative trend of future performance due to the short inclusion period of the Salt Flat field operations, non-recurring administrative costs related to the start-up of the Trust, one-time transaction expenses incurred for the acquisition of the Salt Flat field and initial expenses related to unit based compensation and debt conversion.
(3) Units outstanding for accounting purposes excludes 387,500 units issued due to the performance conditions that have to be met to enable such units to be released from escrow.
Results of operations
Revenue
Three Months Ended June 30,
2011
Six Months Ended June 30,
2011
$ /bbl $ /bbl
Sales volumes – bbls per day (100% light oil) 1,214 1,241
Benchmark WTI ($US) 102.56 98.27
Realized sales price ($US) 96.04 91.67
Differential to benchmark ($US) 6.52 6.60
Oil sales before royalties 91.61 88.96
Royalties (25.51) (24.69)
Revenue $ 66.10 $ 64.27
Working interest sales volumes for the three months ended June 30, 2011 of 1,214 bbls per day were essentially even with first quarter 2011 levels of 1,269 bbls per day. During the quarter, two (1.6 net) wells were brought on-stream in April and one (0.8 net) well was brought on-stream in June but these incremental volumes were offset by lower volumes due to temporary operational issues, including pump changes.
Since the Salt Flat field is slightly sour, there is a differential between the West Texas Intermediate (“WTI”) benchmark price and the realized sales price. The Trust’s wholly-owned subsidiary in the US has secured transportation and marketing agreements and continues to monitor these differentials to ensure that volumes will continue to be marketed at attractive differentials to the WTI posted price.
The benchmark WTI price rose 9% from first quarter 2011, with $US realized prices increasing by a commensurate amount. In Canadian dollar terms, the revenue per-barrel increase was tempered to 6% due to the stronger Canadian dollar.
The overall royalty rate was consistent with the prior periods at 28%.
Cost of sales
Three Months Ended June 30,
2011
Six Months Ended June 30,
2011 $ /bbl $ /bbl Transportation 1.90 1.94 Other operating costs 6.78 8.17 $ 8.68 $ 10.11 Depreciation, depletion and amortization 23.39 24.36 Cost of sales $ 32.07 $ 34.47
EAGLE SECOND QUARTER REPORT 2011
4
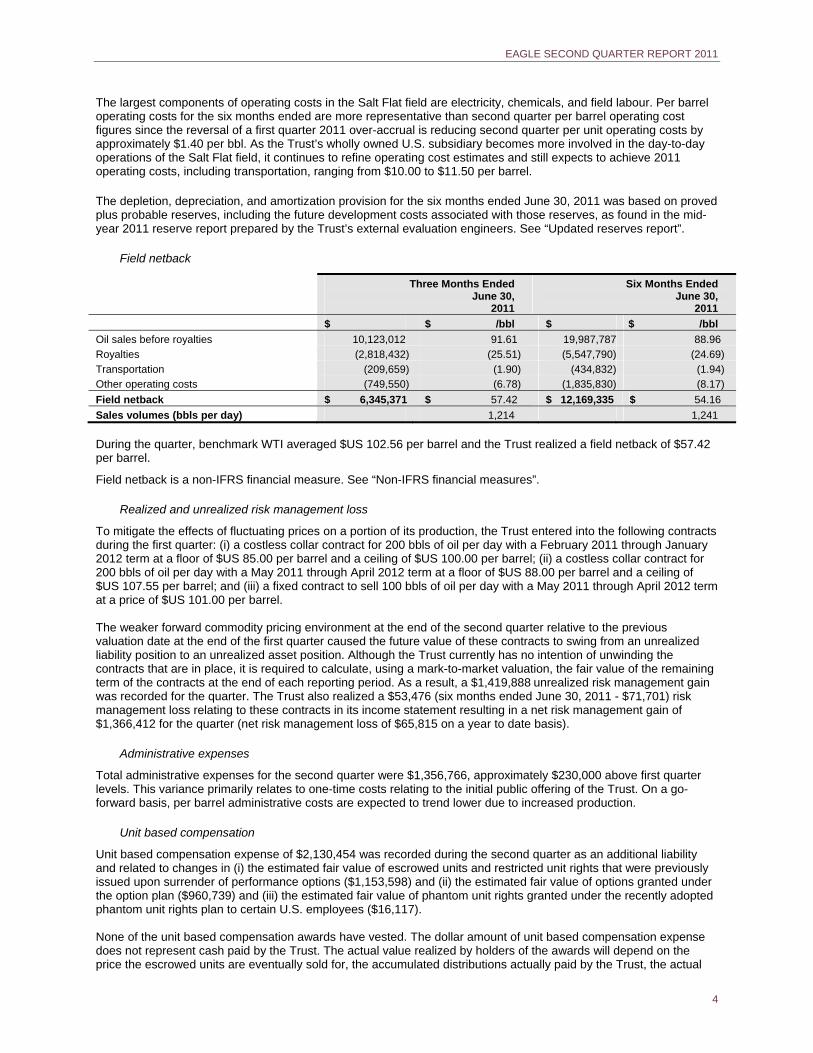
The largest components of operating costs in the Salt Flat field are electricity, chemicals, and field labour. Per barrel operating costs for the six months ended are more representative than second quarter per barrel operating cost figures since the reversal of a first quarter 2011 over-accrual is reducing second quarter per unit operating costs by approximately $1.40 per bbl. As the Trust’s wholly owned U.S. subsidiary becomes more involved in the day-to-day operations of the Salt Flat field, it continues to refine operating cost estimates and still expects to achieve 2011 operating costs, including transportation, ranging from $10.00 to $11.50 per barrel.
The depletion, depreciation, and amortization provision for the six months ended June 30, 2011 was based on proved plus probable reserves, including the future development costs associated with those reserves, as found in the mid-year 2011 reserve report prepared by the Trust’s external evaluation engineers. See “Updated reserves report”.
Field netback
Three Months Ended June 30,
2011
Six Months Ended June 30,
2011
$ $ /bbl $ $ /bbl
Oil sales before royalties 10,123,012 91.61 19,987,787 88.96
Royalties (2,818,432) (25.51) (5,547,790) (24.69)
Transportation (209,659) (1.90) (434,832) (1.94)
Other operating costs (749,550) (6.78) (1,835,830) (8.17)
Field netback $ 6,345,371 $ 57.42 $ 12,169,335 $ 54.16
Sales volumes (bbls per day) 1,214 1,241
During the quarter, benchmark WTI averaged $US 102.56 per barrel and the Trust realized a field netback of $57.42 per barrel.
Field netback is a non-IFRS financial measure. See “Non-IFRS financial measures”.
Realized and unrealized risk management loss
To mitigate the effects of fluctuating prices on a portion of its production, the Trust entered into the following contracts during the first quarter: (i) a costless collar contract for 200 bbls of oil per day with a February 2011 through January 2012 term at a floor of $US 85.00 per barrel and a ceiling of $US 100.00 per barrel; (ii) a costless collar contract for 200 bbls of oil per day with a May 2011 through April 2012 term at a floor of $US 88.00 per barrel and a ceiling of $US 107.55 per barrel; and (iii) a fixed contract to sell 100 bbls of oil per day with a May 2011 through April 2012 term at a price of $US 101.00 per barrel. The weaker forward commodity pricing environment at the end of the second quarter relative to the previous valuation date at the end of the first quarter caused the future value of these contracts to swing from an unrealized liability position to an unrealized asset position. Although the Trust currently has no intention of unwinding the contracts that are in place, it is required to calculate, using a mark-to-market valuation, the fair value of the remaining term of the contracts at the end of each reporting period. As a result, a $1,419,888 unrealized risk management gain was recorded for the quarter. The Trust also realized a $53,476 (six months ended June 30, 2011 - $71,701) risk management loss relating to these contracts in its income statement resulting in a net risk management gain of $1,366,412 for the quarter (net risk management loss of $65,815 on a year to date basis).
Administrative expenses
Total administrative expenses for the second quarter were $1,356,766, approximately $230,000 above first quarter levels. This variance primarily relates to one-time costs relating to the initial public offering of the Trust. On a go-forward basis, per barrel administrative costs are expected to trend lower due to increased production.
Unit based compensation
Unit based compensation expense of $2,130,454 was recorded during the second quarter as an additional liability and related to changes in (i) the estimated fair value of escrowed units and restricted unit rights that were previously issued upon surrender of performance options ($1,153,598) and (ii) the estimated fair value of options granted under the option plan ($960,739) and (iii) the estimated fair value of phantom unit rights granted under the recently adopted phantom unit rights plan to certain U.S. employees ($16,117). None of the unit based compensation awards have vested. The dollar amount of unit based compensation expense does not represent cash paid by the Trust. The actual value realized by holders of the awards will depend on the price the escrowed units are eventually sold for, the accumulated distributions actually paid by the Trust, the actual
EAGLE SECOND QUARTER REPORT 2011
5
year over year price appreciation of the units, the actual price of the units at the time the options are exercised and the actual payments pursuant to the phantom unit rights plan. The Trust is, however, required to re-determine the fair value of the liability relating to the escrowed units, restricted unit rights, options and phantom unit rights at the end of each reporting period and record any changes in fair value through the income statement. From one reporting period to the next, changes in the closing price of the units, accumulated distributions and expected future unit price volatility will increase or decrease the fair values that are derived using the Black-Scholes valuation model and cause corresponding swings in the amount recorded in the income statement. The increase in the liability and associated expense from March 31, 2011 to June 30, 2011 was primarily due to the passage of time (since an expense is recorded in the income statement over the vesting periods of the awards). Since the June 30 unit price was less than the March 31 unit price ($11.30 versus $11.89 per unit, respectively) unit based compensation expense recorded in second quarter was lower than the amount recorded in the first quarter.
Tax horizon
The tax horizon as determined from a full cycle corporate model incorporating cash flows from the year end external engineering report plus all applicable U.S. deductions indicates that no material U.S. taxes are expected to be payable in respect of income attributable to the Salt Flat interest for several years. Management expects to extend this period through continued capital investments and additional acquisitions in the U.S. as we execute our business plan. No taxes are expected to be payable by the Trust in Canada because the Trust will distribute its full taxable income each year to unitholders and will not be a SIFT trust, as defined under the Income Tax Act (Canada), provided that the Trust complies at all times with the investment restrictions as set forth in the Trust Indenture.
Liquidity and capital resources
Generally, three sources of funding are available to the Trust: (i) internally generated funds flow from operations; (ii) debt financing, when appropriate; and (iii) the issuance of additional units, if available on favourable terms, including proceeds obtained from the distribution re-investment programs.
Management’s objective is to maintain a debt to cash flow ratio below 1.5 times.
The Trust believes that its expected funds flow from operations, undrawn credit facility and working capital surplus will be sufficient to fund its planned capital investment program, enable it to meet all current and expected financial requirements and maintain unitholder distributions. Refer to the “Outlook” section for a discussion of the Trust’s future plans. Other than the items noted in the “Commitments” section of this MD&A, capital spending is discretionary.
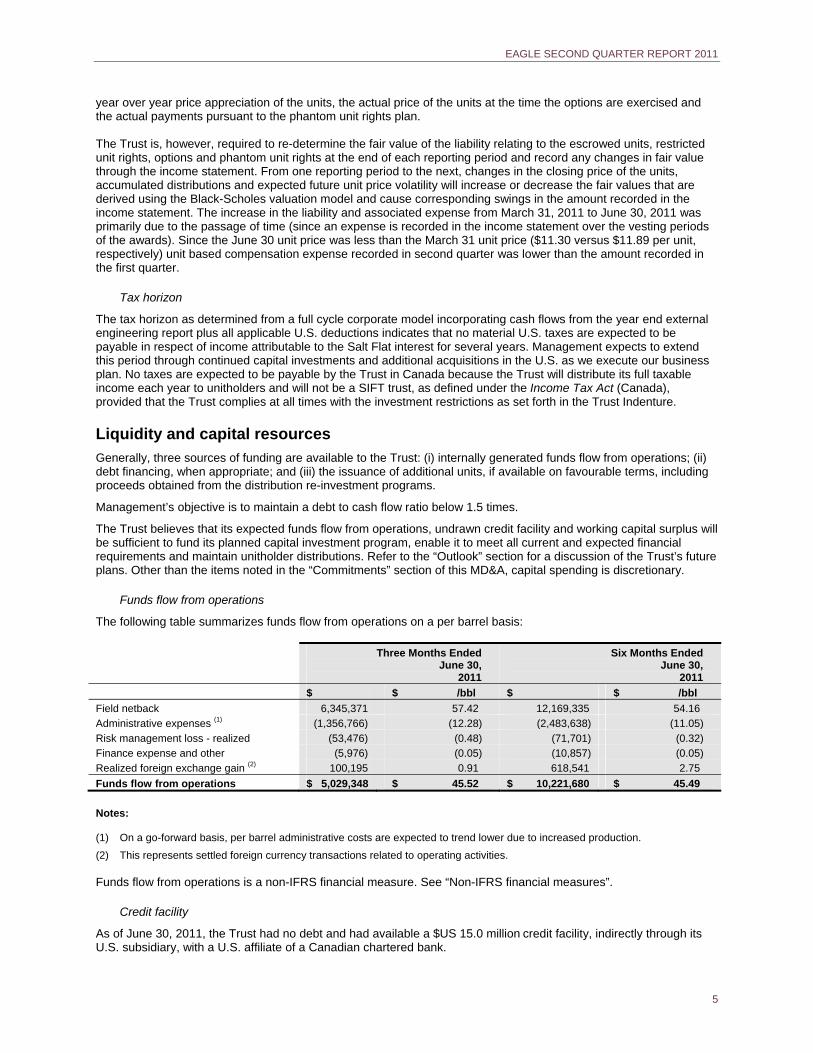
Funds flow from operations
The following table summarizes funds flow from operations on a per barrel basis:
Three Months Ended June 30,
2011
Six Months Ended June 30,
2011
$ $ /bbl $ $ /bbl
Field netback 6,345,371 57.42 12,169,335 54.16
Administrative expenses (1) (1,356,766) (12.28) (2,483,638) (11.05)
Risk management loss - realized (53,476) (0.48) (71,701) (0.32)
Finance expense and other (5,976) (0.05) (10,857) (0.05)
Realized foreign exchange gain (2) 100,195 0.91 618,541 2.75
Funds flow from operations $ 5,029,348 $ 45.52 $ 10,221,680 $ 45.49
Notes: (1) On a go-forward basis, per barrel administrative costs are expected to trend lower due to increased production.
(2) This represents settled foreign currency transactions related to operating activities.
Funds flow from operations is a non-IFRS financial measure. See “Non-IFRS financial measures”.
Credit facility
As of June 30, 2011, the Trust had no debt and had available a $US 15.0 million credit facility, indirectly through its U.S. subsidiary, with a U.S. affiliate of a Canadian chartered bank.
EAGLE SECOND QUARTER REPORT 2011
6
Working capital
At June 30, 2011, the Trust had a working capital surplus, excluding the current portion of its net risk management asset (hedging gains/losses), of $12.8 million and no amounts drawn on its $US 15.0 million bank credit facility.
Unitholders’ Equity
Other than the issuance of units pursuant to the distribution reinvestment plans as detailed below, no additional funds were raised or units issued during the quarter. Management may seek to issue additional units in the future to provide sufficient capital to fund growth, including acquisition opportunities.
As a result of implementing its Premium Distribution™ and Distribution Reinvestment Plan in the second quarter, the Trust received proceeds resulting from the issuance of units from treasury to those unitholders who have opted to participate in the Plan. For the three and six months ended June 30, 2011 270,389 units were issued for total proceeds of approximately $2.9 million at an average price of $10.83 per unit.
Distributions and outstanding unit data
The Trust pays monthly distributions to unitholders at the discretion of the Board of Directors. Distributions paid in the second quarter (for the March, April and May 2011 record dates) totaled approximately $4.8 million (year to date - $9.8 million for the December 2010 through to May 2011 record dates). As at June 30, 2011, the Trust had issued 18,281,970 units. For purposes of the June 30, 2011 unaudited interim consolidated financial statements, 17,894,470 units were shown as outstanding. The 387,500 difference relates to units previously issued on the surrender of performance options but excluded from financial statement figures because IFRS principles exclude units that require a performance condition be met before being released from escrow. Distributions are paid on the units while they are in escrow. As at the date of this MD&A, 18,370,714 units are issued and 1,342,500 options are outstanding.
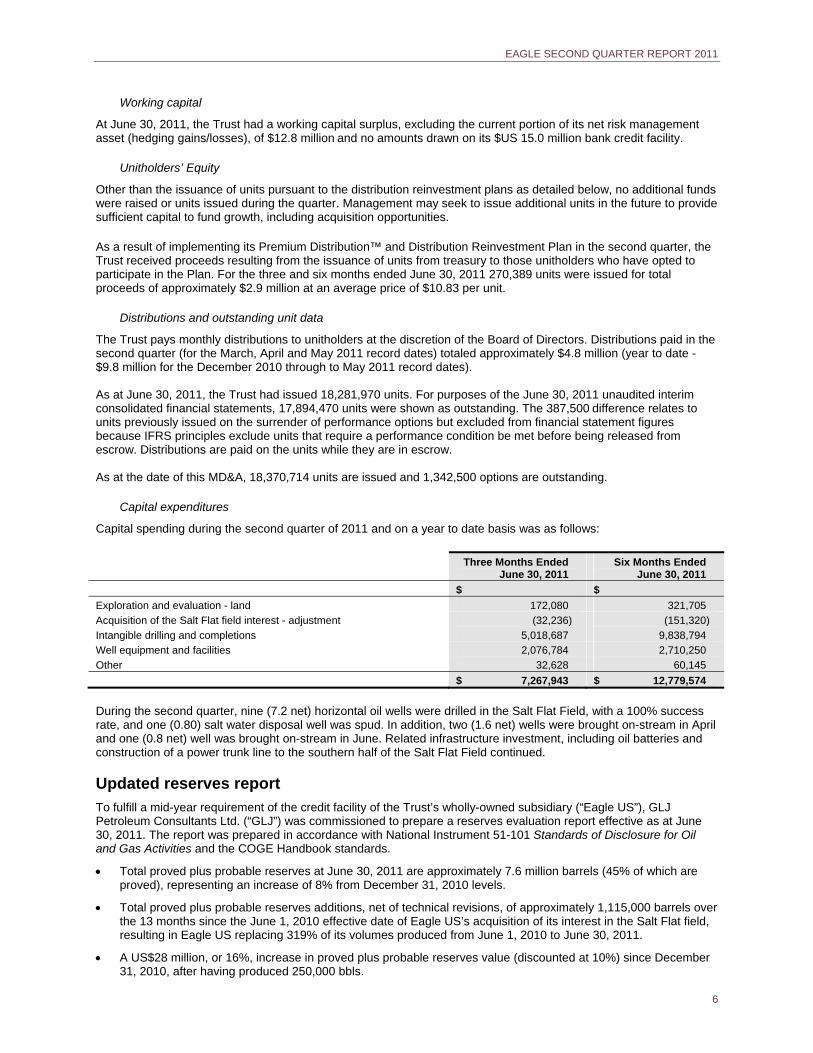
Capital expenditures
Capital spending during the second quarter of 2011 and on a year to date basis was as follows:
Three Months Ended June 30, 2011
Six Months Ended June 30, 2011
$ $
Exploration and evaluation - land 172,080 321,705
Acquisition of the Salt Flat field interest - adjustment
Intangible drilling and completions
(32,236)
5,018,687
(151,320)
9,838,794
Well equipment and facilities 2,076,784 2,710,250
Other 32,628 60,145
$ 7,267,943 $ 12,779,574
During the second quarter, nine (7.2 net) horizontal oil wells were drilled in the Salt Flat Field, with a 100% success rate, and one (0.80) salt water disposal well was spud. In addition, two (1.6 net) wells were brought on-stream in April and one (0.8 net) well was brought on-stream in June. Related infrastructure investment, including oil batteries and construction of a power trunk line to the southern half of the Salt Flat Field continued.
Updated reserves report
To fulfill a mid-year requirement of the credit facility of the Trust’s wholly-owned subsidiary (“Eagle US”), GLJ Petroleum Consultants Ltd. (“GLJ”) was commissioned to prepare a reserves evaluation report effective as at June 30, 2011. The report was prepared in accordance with National Instrument 51-101 Standards of Disclosure for Oil and Gas Activities and the COGE Handbook standards.
Total proved plus probable reserves at June 30, 2011 are approximately 7.6 million barrels (45% of which are proved), representing an increase of 8% from December 31, 2010 levels.
Total proved plus probable reserves additions, net of technical revisions, of approximately 1,115,000 barrels over the 13 months since the June 1, 2010 effective date of Eagle US’s acquisition of its interest in the Salt Flat field, resulting in Eagle US replacing 319% of its volumes produced from June 1, 2010 to June 30, 2011.
A US$28 million, or 16%, increase in proved plus probable reserves value (discounted at 10%) since December 31, 2010, after having produced 250,000 bbls.
EAGLE SECOND QUARTER REPORT 2011
7
A current proved plus probable reserve life index of 17.2 years based on second quarter 2011 working interest average sales volumes of 1,214 bbls/day.
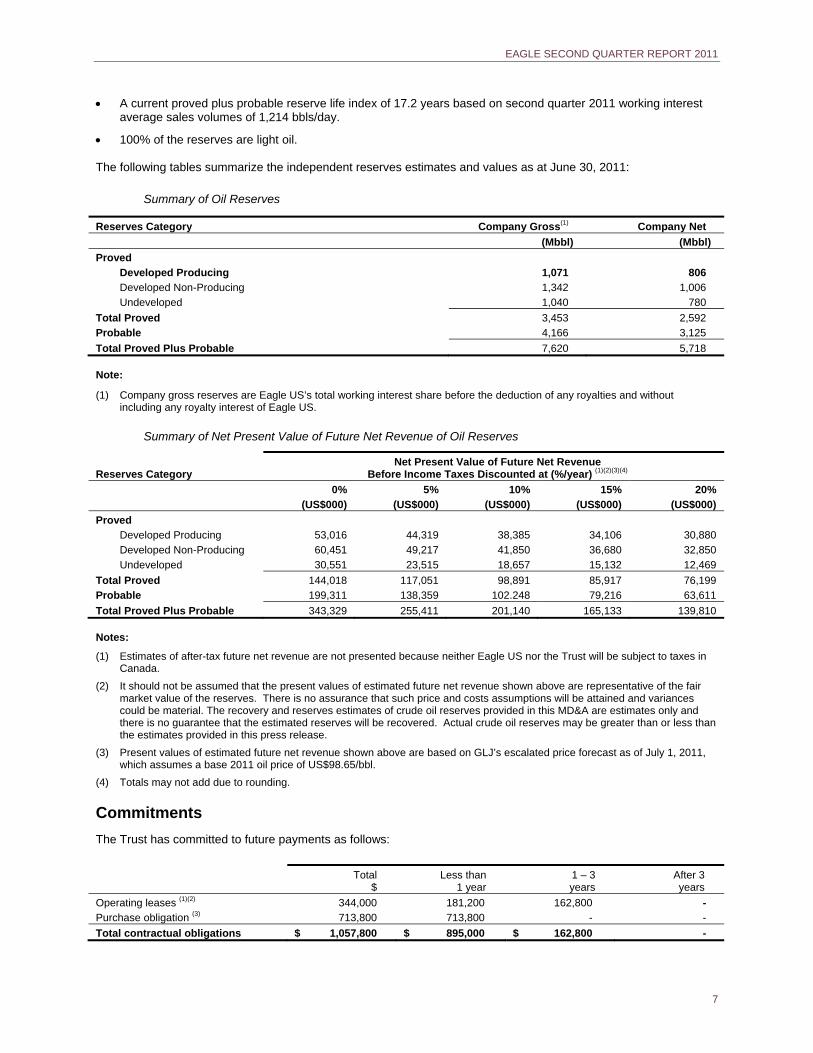
100% of the reserves are light oil. The following tables summarize the independent reserves estimates and values as at June 30, 2011:
Summary of Oil Reserves
Reserves Category Company Gross(1) Company Net
(Mbbl) (Mbbl)
Proved
Developed Producing 1,071 806
Developed Non-Producing 1,342 1,006
Undeveloped 1,040 780
Total Proved 3,453 2,592
Probable 4,166 3,125
Total Proved Plus Probable 7,620 5,718 Note:
(1) Company gross reserves are Eagle US’s total working interest share before the deduction of any royalties and without including any royalty interest of Eagle US.
Summary of Net Present Value of Future Net Revenue of Oil Reserves
Reserves Category
Net Present Value of Future Net Revenue Before Income Taxes Discounted at (%/year) (1)(2)(3)(4)
0% 5% 10% 15% 20%
(US$000) (US$000) (US$000) (US$000) (US$000)
Proved
Developed Producing 53,016 44,319 38,385 34,106 30,880
Developed Non-Producing 60,451 49,217 41,850 36,680 32,850
Undeveloped 30,551 23,515 18,657 15,132 12,469
Total Proved 144,018 117,051 98,891 85,917 76,199
Probable 199,311 138,359 102.248 79,216 63,611
Total Proved Plus Probable 343,329 255,411 201,140 165,133 139,810 Notes:
(1) Estimates of after-tax future net revenue are not presented because neither Eagle US nor the Trust will be subject to taxes in Canada.
(2) It should not be assumed that the present values of estimated future net revenue shown above are representative of the fair market value of the reserves. There is no assurance that such price and costs assumptions will be attained and variances could be material. The recovery and reserves estimates of crude oil reserves provided in this MD&A are estimates only and there is no guarantee that the estimated reserves will be recovered. Actual crude oil reserves may be greater than or less than the estimates provided in this press release.
(3) Present values of estimated future net revenue shown above are based on GLJ’s escalated price forecast as of July 1, 2011, which assumes a base 2011 oil price of US$98.65/bbl.
(4) Totals may not add due to rounding.
Commitments
The Trust has committed to future payments as follows:
Total $
Less than 1 year
1 – 3 years
After 3 years
Operating leases (1)(2) 344,000 181,200 162,800 -
Purchase obligation (3) 713,800 713,800 - -
Total contractual obligations $ 1,057,800 $ 895,000 $ 162,800 -
EAGLE SECOND QUARTER REPORT 2011
8
Notes:
(1) This relates to an amended operating lease commitment for the head office in Calgary, Alberta signed on July 25, 2011. The term of the sub-lease agreement is six months from August 1, 2011 through January 31, 2012. Thereafter the agreement will automatically roll over on a monthly basis, unless either party serves a 30 day notice of termination. Therefore, the agreement is cancellable at the end of the term if notice is provided. Future minimum lease payments during the six month term of the sub-lease are $51,000.
(2) This relates to an operating lease commitment for the office in Houston, Texas. The agreement was entered into on April 1, 2011, has an approximate 30 month term from April 7, 2011 through September 30, 2013. Future minimum lease payments during the term of the sub-lease approximate $US 338,000 with 27 months and approximately $US 304,000 remaining at June 30, 2011. This commitment has been translated at the exchange rate in effect at the balance sheet date of 0.9645 CAD = 1.00 USD to equate to $293,000.
(3) This relates to a six month drilling rig commitment secured to execute the budgeted 2011 capital drilling program. The Trust, through its joint venture relationship in the Salt Flat field, entered into a six month drilling rig commitment agreement effective February 3, 2011. The agreement is then cancellable with a 30 day written notice of termination. The daily rig rate is $US 11,500, resulting in future minimum payments during the six month (180 days) term of the agreement of $US 2,070,000, which is 100% of the commitment. The net commitment to the Trust based upon its approximately 80% interest equates to $US 1,656,000, with $312,800 remaining as at June 30, 2011. This commitment has been translated at the exchange rate in effect at the balance sheet date of 0.9645 CAD = 1.00 USD to equate to $302,000.
On August 3rd, 2011, the drilling rig commitment was amended for the purpose of extending the agreement for an additional 4 wells commencing at rig release of the current well. The new daily rate for the additional 4 wells is $US 13,000. Since there is no specific time frame provided for in the agreement, future minimum payments have been approximated by assuming 10 days per well drilled for a total of 40 days. The future minimum payments can then be estimated to be $US 520,000, which is 100% of the commitment. The net commitment to the Trust based upon its approximate 80% interest equates to $US 416,000. This commitment has been translated at the exchange rate in effect at the balance sheet date of 0.9645 CAD = 1.00 USD to equate to $401,000.
Transactions with related parties
Intercompany transactions
There are certain intercompany transactions among the subsidiaries comprising the audited consolidated financials of Eagle Energy Trust. These transactions have been eliminated upon consolidation.
Head office lease, Calgary, Alberta
The Trust sub-leases office space along with furniture and equipment from a company of which a director of the administrator of the Trust is the President and Chief Operating Officer. Up to June 30, 2011, the monthly rent rate was $8,000 and the terms of the agreement are recorded at the exchange amount. Subsequent to June 30, 2011, an amended operating lease agreement was signed. Refer to the “Commitments” section of this MD&A. No amounts were owing to this related party as at June 30, 2011. For the three months ended June 30, 2011, administrative expenses included $24,000 (six months $48,000) for amounts billed from this related party.
Critical accounting estimates
The Trust makes estimates and judgments concerning the future. The resulting accounting estimates will, by definition, seldom equal the related actual results. Such estimates and judgments are continually evaluated by Management and are based on historical experience and other factors, including expectations of future events that Management believes to be reasonable under the circumstances. The Trust was formed on July 20, 2010 and there have been no changes made to critical accounting estimates since its formation. The estimates and assumptions that have a significant risk of causing a material adjustment to the carrying amounts of assets and liabilities within the next financial year are discussed below.
Estimation of oil and gas reserves
Oil and gas reserves are the estimated quantities of oil and gas which geological and engineering data demonstrate with reasonable certainty to be recoverable in future years from known reservoirs under existing economic and operating conditions. Estimates of oil and gas reserves are inherently imprecise, require the application of judgment and are subject to future revision. Accordingly, financial and accounting measures (such as the impairment calculation, depreciation, depletion and amortization charges, and decommissioning provisions) that are based on reserves are also subject to change.
Capitalized exploration and evaluation expenditures
In making decisions about whether to continue to capitalize exploration and evaluation expenditures, it is necessary to make judgments about the probable commercial reserves and the level of activities that constitute on-going
EAGLE SECOND QUARTER REPORT 2011
9
evaluation determination. If there is an impairment indicator in a subsequent period, then the related capitalized exploration and evaluation expenditure would be expensed in that period, resulting in a charge to income.
Decommissioning provision
Estimates of the amounts of provision for decommissioning recognized are based on current legal and constructive requirements, technology, and price levels. As actual outflows may be different from estimates due to changes in laws, regulations, technology, prices and conditions, and can take place in the future, the carrying amounts of provisions are regularly reviewed and adjusted to take account of such changes. Because the accounting standard is not clear as to the choice of risk-free or risk-adjusted discount rate, the Trust interpreted the accounting standard to use the risk-free discount rate for calculating the present value of the decommissioning obligation.
Impairment calculations
The recoverable amounts of cash-generating units and individual assets have been determined based on the higher of value-in-use calculations and fair values less costs to sell. These calculations require the use of estimates and assumptions. It is reasonably possible that the commodity price assumption may change, which may impact the estimated life of the field which may, in turn, require a material adjustment to the carrying value of assets. The Trust monitors internal and external indicators of impairment relating to its tangible and intangible assets.
Income taxes
The Trust recognizes the net future tax benefit related to deferred income tax assets to the extent that it is probable that the deductible temporary differences will reverse in the foreseeable future. Assessing the recoverability of deferred income tax assets requires the Trust to make significant estimates related to expectations of future taxable income. Estimates of future taxable income are based on forecast cash flows from operations and the application of existing tax laws in each jurisdiction. To the extent that future cash flows and taxable income differ significantly from estimates, the ability of the Trust to realize the net deferred tax assets recorded at the balance sheet date could be impacted. Additionally, future changes in tax laws in the jurisdiction in which the Trust operates could limit the ability of the Trust to obtain tax deductions in future periods.
Derivative financial instruments
As described in the Risk Management section of this MD&A, derivative financial instruments are used by the Trust to manage its exposure to market risks relating to commodity prices. The Trust’s policy is not to use derivative financial instruments for speculative purposes. Derivative financial instruments that do not qualify, or are not designated, as hedges for accounting are recorded at fair value. Instruments are recorded in the balance sheet as either an asset or a liability with changes in fair value recognized in the income statement. The estimate of fair value of all derivative instruments is based on quoted market prices, or in their absence, third-party market indications and forecasts. The estimated fair value of financial assets and liabilities is subject to measurement uncertainty.
Classification of trust units as equity
Trust units issued by income trusts give the holder the right to put the units back to the issuer in exchange for cash. IAS 32 “Financial Instruments: Presentation” establishes the general principle that an instrument which gives the holder the right to put the instrument back to the issuer for cash should be classified as a financial liability, unless such instrument has all of the features and meets the conditions of the IAS 32 “puttable instrument exemption”. If these “puttable instrument exemption” criteria are met, the instrument is classified as equity. The Trust has examined the terms and conditions of its Trust Indenture and classifies its outstanding trust units as equity because the trust units meet the “puttable instrument exemption” criteria as there is no contractual obligation to distribute cash.
Contingencies
By their nature, contingencies will only be resolved when one or more future events occur or fail to occur. The assessment of contingencies inherently involves the exercise of significant judgment and estimates of the outcome of future events.
Accounting standards and interpretations issued but not yet adopted:
At the date of this MD&A, the following standards and interpretations, which have not been applied in these financial statements, were issued by the IASB but not yet in effect. The Trust will be required to adopt these new pronouncements as of January 1, 2013.
IAS 24 (revised) “Related Party Disclosures”
EAGLE SECOND QUARTER REPORT 2011
10
Amendment to IFRIC 14 “Prepayments of a minimum funding requirement” Improvements to IFRSs (2010) IFRS 1, IFRS 3, IFRS 7, IAS 1, IAS 27, IAS 34, and IFRIC 13. IFRS 9, “Financial Instruments” IFRS 10 “Consolidated Financial Statements” IFRS 11 “Joint Arrangements” IFRS 12 “Disclosures of Interests in Other Entities” IFRS 13 “Fair Value Measurement”
Although it is anticipated that the adoption of the above standards and interpretations should not have a material impact on its Consolidated Financial Statements, the Trust is assessing the exact impact. The exact impact will depend on the individual transaction concerned, with potentially different amounts being recognized in the consolidated financial statements than would have previously been the case. The Trust will continue to monitor the adoption efforts of industry participants and the efforts of the CICA and industry groups. Additional adjustments to the Trust’s accounting policies may be required upon completion of a separate IASB framework for extractive industries.
Risk management
For a more detailed description of the risks and uncertainties faced by the Trust, refer to the Trust’s Annual Information Form. The Trust’s activities expose it to a variety of financial risks that arise as a result of its exploitation, development, production, and financing activities such as:
credit risk;
liquidity risk; and
market risk. Credit risk is the risk of financial loss to the Trust if a customer or counterparty to a financial instrument fails to meet its contractual obligations and arises principally from the Trust’s receivables from its oil marketer. Receivables from the Trust’s oil marketer are normally collected in the month following production. The Trust’s policy to mitigate credit risk associated with these balances is to establish marketing relationships with reputable purchasers with good credit and, over time, to spread this risk among as many different marketers as is reasonably feasible. Liquidity risk is the risk that the Trust will not be able to meet its financial obligations as they fall due. At June 30, 2011, the Trust had a working capital surplus, excluding the current portion of its net risk management asset, of $12.8 million and no amounts drawn on its $US 15.0 million bank credit facility. The approach to managing liquidity is to ensure, as far as possible, that the Trust will always have sufficient liquidity to meet its liabilities when due, under both normal and stressed conditions, without incurring unacceptable losses or risking damage to the Trust’s reputation. To better manage its liquidity risk, the Trust prepares annual capital expenditure budgets, which are regularly monitored and updated as considered necessary. Further, the Trust utilizes authorizations for expenditures (“AFEs”) on both operated and non-operated projects to manage capital expenditures. The Trust attempts to match its payment cycle with the collection of its oil and natural gas revenue each month. Market risk is the risk that changes in market prices, such as commodity prices, foreign exchange rates and interest rates will affect the Trust’s income or the value of the financial instruments of the Trust. The objective of market risk management is to manage and control market risk exposures within acceptable parameters, while optimizing returns. Commodity price risk is the risk that the fair value of future cash flows will fluctuate as a result of changes in commodity prices. Commodity prices for oil and natural gas are impacted by various factors, including the exchange rates between the Canadian and United States dollar, and national and international economic events which dictate the levels of supply and demand. The Trust may enter into certain financial derivative instruments periodically to economically hedge some oil and natural gas sales through the use of various financial derivative forward sales contracts and physical sales contracts. All such transactions are conducted within risk management tolerances that are reviewed by the Board of Directors. It is the policy of the Trust to not hedge more than 50% of its near-term net production. For the period ended, and as of June 30, 2011, the Trust has entered into three contracts to mitigate the effect of commodity price fluctuations in the coming 12 months. Refer to the “Realized and unrealized risk management loss” section of this MD&A. Foreign exchange risk is the risk that future cash flows will fluctuate as a result of changes in market foreign exchange rates. The Trust’s operating cash flows are generated in US dollars and distributions are declared in Canadian dollars. As a consequence, there is an element of foreign exchange risk to the Trust. The Trust’s treasury management function is responsible for managing funding requirements and investments, which include banking and
EAGLE SECOND QUARTER REPORT 2011
11
cash flow management. Prices for oil have traditionally been determined by global markets and denominated in US dollars. Generally, an increase in the value of the $CA as compared to the $US will reduce the prices received by the Trust for its petroleum and natural gas sales, but will also reduce the operating expenses associated with those sales as well as reduce the price paid by the subsidiary of the Trust for additional asset acquisitions.
Interest rate risk is the risk that future cash flows will fluctuate as a result of changes in market interest rates. The Trust may be exposed to interest rate risk at both fixed and variable rates as it borrows funds. There have been no draws against the credit facility and no amounts were outstanding under the credit facility as of June 30, 2011. The Trust therefore had no interest rate risk, and as a result, did not hedge against any interest rate exposures.
Outlook
This section includes forward looking information, including information in respect of the Trust’s anticipated drilling plans, tie-in of wells, investment in infrastructure, expected average production and operating costs, and expected results of its business plan for 2011. Refer to the Note about Forward Looking Statements at the end of this MD&A.
Production Update
While the drilling program is progressing at a steady pace, with Eagle US currently drilling its 21st well (comprised of 18 horizontal oil wells and 3 salt water disposal wells) of our expected 28 well (21 horizontal oil wells and 7 salt water disposal wells) Salt Flat Field 2011 program, short-term delays have been experienced in bringing wells on production. Production from the Salt Flat Field requires the disposal of salt water which is produced in association with the oil. The most efficient way to dispose of this salt water is within the Salt Flat Field, as opposed to trucking to an offsite facility. Salt water is injected via salt water disposal (“SWD”) wells into a lower zone of the Edwards formation, using surface disposal pumps. While Eagle US normally obtains permits to drill horizontal oil wells within a few days, permits to re-inject water into a SWD well are currently taking from 3 to 5 months to obtain due to high volumes of drilling activity throughout the state of Texas. In 2010, SWD well permits were normally issued within 1 to 2 months. The slow turnaround in issuing regulatory approvals to drill SWD wells has resulted in Eagle US having an inventory of 17 horizontal oil wells yet to be tied in and put on production. Drilling permits for the 7 salt water disposal wells have been submitted. To date, Eagle has received permits to drill 4 of the SWD wells. It is anticipated that the 4 SWD permits which have been obtained will allow Eagle to tie in the majority of the 17 horizontal oil wells which are not on production at this time. Batteries have been built for the majority of these horizontal wells, with the balance currently being constructed. It is expected that the necessary production facilities for substantially all wells will be in place by early September, thus allowing Eagle to put them on production by the beginning of October.
Guidance
The Board of Directors has approved a revised 2011 capital budget of $US 28.0 million, representing a $US 5.1 million increase from the original budget approved in January. The additional investment can be categorized as follows: (i) $US 1.4 million for two additional SWD wells (for a total of 7 SWD wells) due to changes to the drilling locations of some horizontal oil wells; (ii) $US 0.6 million to retrofit vapor recovery units at existing batteries for elimination of flaring and greenhouse gas emissions; (iii) $US 1.4 million of additional capital on projects which originated in 2010; and (iv) $US 1.7 million relating to increased drilling costs as a result of the rising cost of services and additional directional drilling costs. Despite tie-in delays, the Trust is maintaining its previously stated 2011 guidance of working interest average light oil production ranging from 1,900 to 2,100 bbls per day. The Trust’s estimate of 2011 average operating costs, including transportation, ranging from $10.00 to $11.50 per barrel, remains unchanged. The capital budget excludes additional asset acquisitions, which will be separately considered and evaluated as circumstances arise. The amount and allocation of the Trust’s 2011 capital budget is dependent upon results achieved and is subject to review by Management and the Board of Directors on an ongoing basis throughout the year. The Trust will continue to execute, indirectly through its subsidiaries, its integrated business plan to acquire and develop high quality, long life oil and gas properties in the United States.
Sensitivities
The Trust’s results and ability to generate sufficient amounts of cash to fund ongoing operations are affected by external market factors such as fluctuations in the prices of crude oil as well as movements in foreign-exchange
EAGLE SECOND QUARTER REPORT 2011
12
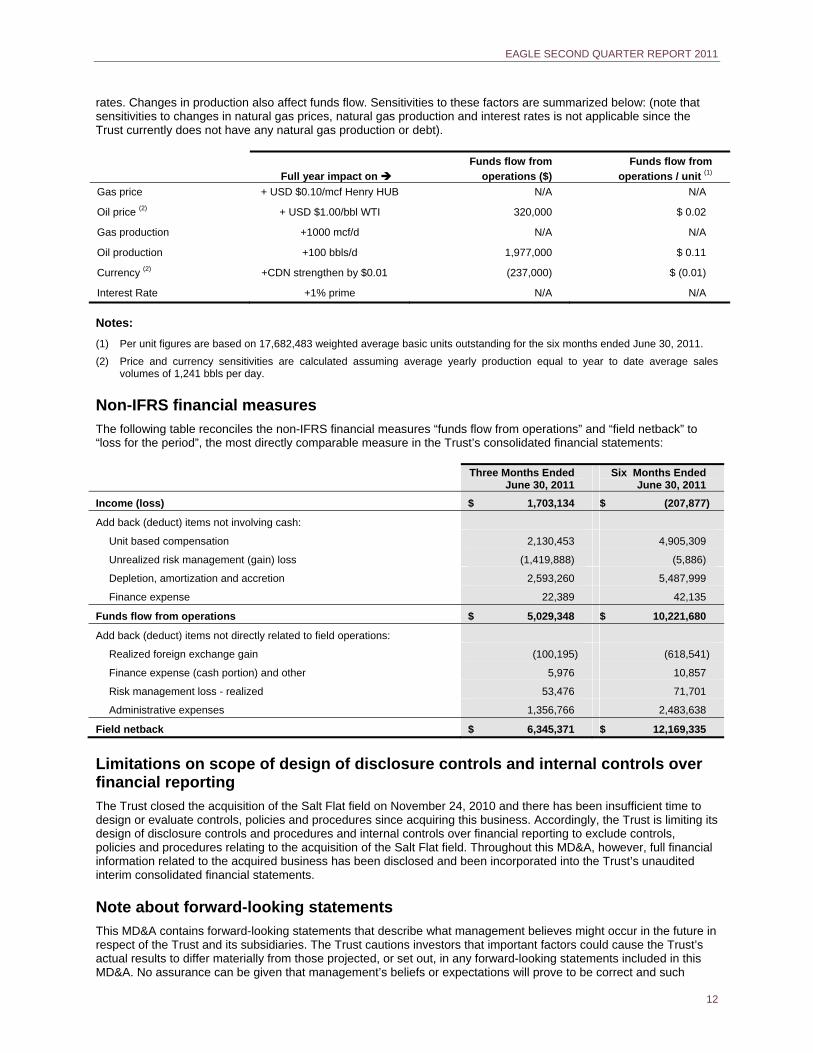
rates. Changes in production also affect funds flow. Sensitivities to these factors are summarized below: (note that sensitivities to changes in natural gas prices, natural gas production and interest rates is not applicable since the Trust currently does not have any natural gas production or debt).
Full year impact on
Funds flow from
operations ($)
Funds flow from
operations / unit (1)
Gas price + USD $0.10/mcf Henry HUB N/A N/A
Oil price (2) + USD $1.00/bbl WTI 320,000 $ 0.02
Gas production +1000 mcf/d N/A N/A
Oil production +100 bbls/d 1,977,000 $ 0.11
Currency (2) +CDN strengthen by $0.01 (237,000) $ (0.01)
Interest Rate +1% prime N/A N/A
Notes:
(1) Per unit figures are based on 17,682,483 weighted average basic units outstanding for the six months ended June 30, 2011.
(2) Price and currency sensitivities are calculated assuming average yearly production equal to year to date average sales volumes of 1,241 bbls per day.
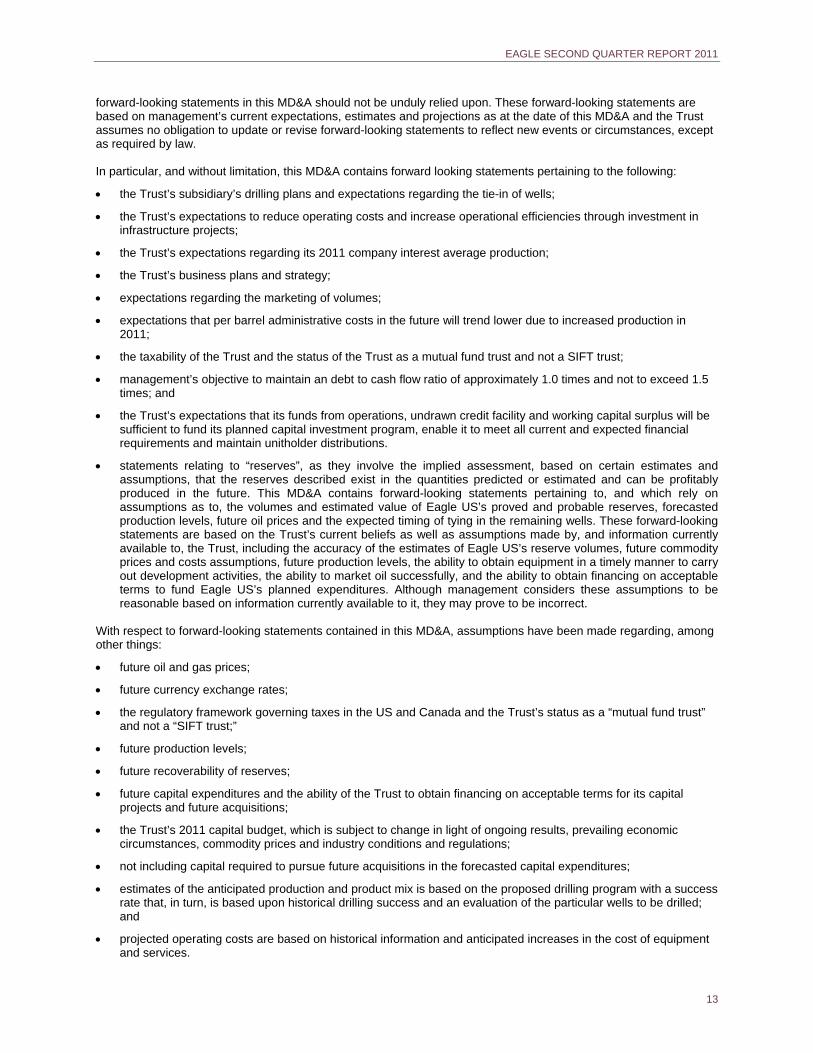
Non-IFRS financial measures
The following table reconciles the non-IFRS financial measures “funds flow from operations” and “field netback” to “loss for the period”, the most directly comparable measure in the Trust’s consolidated financial statements:
Three Months Ended June 30, 2011
Six Months Ended June 30, 2011
Income (loss) $ 1,703,134 $ (207,877)
Add back (deduct) items not involving cash:
Unit based compensation 2,130,453 4,905,309
Unrealized risk management (gain) loss (1,419,888) (5,886)
Depletion, amortization and accretion 2,593,260 5,487,999
Finance expense 22,389 42,135
Funds flow from operations $ 5,029,348 $ 10,221,680
Add back (deduct) items not directly related to field operations:
Realized foreign exchange gain (100,195) (618,541)
Finance expense (cash portion) and other 5,976 10,857
Risk management loss - realized 53,476 71,701
Administrative expenses 1,356,766 2,483,638
Field netback $ 6,345,371 $ 12,169,335
Limitations on scope of design of disclosure controls and internal controls over financial reporting
The Trust closed the acquisition of the Salt Flat field on November 24, 2010 and there has been insufficient time to design or evaluate controls, policies and procedures since acquiring this business. Accordingly, the Trust is limiting its design of disclosure controls and procedures and internal controls over financial reporting to exclude controls, policies and procedures relating to the acquisition of the Salt Flat field. Throughout this MD&A, however, full financial information related to the acquired business has been disclosed and been incorporated into the Trust’s unaudited interim consolidated financial statements.
Note about forward-looking statements
This MD&A contains forward-looking statements that describe what management believes might occur in the future in respect of the Trust and its subsidiaries. The Trust cautions investors that important factors could cause the Trust’s actual results to differ materially from those projected, or set out, in any forward-looking statements included in this MD&A. No assurance can be given that management’s beliefs or expectations will prove to be correct and such
EAGLE SECOND QUARTER REPORT 2011
13
forward-looking statements in this MD&A should not be unduly relied upon. These forward-looking statements are based on management’s current expectations, estimates and projections as at the date of this MD&A and the Trust assumes no obligation to update or revise forward-looking statements to reflect new events or circumstances, except as required by law. In particular, and without limitation, this MD&A contains forward looking statements pertaining to the following:
the Trust’s subsidiary’s drilling plans and expectations regarding the tie-in of wells;
the Trust’s expectations to reduce operating costs and increase operational efficiencies through investment in infrastructure projects;
the Trust’s expectations regarding its 2011 company interest average production;
the Trust’s business plans and strategy;
expectations regarding the marketing of volumes;
expectations that per barrel administrative costs in the future will trend lower due to increased production in 2011;
the taxability of the Trust and the status of the Trust as a mutual fund trust and not a SIFT trust;
management’s objective to maintain an debt to cash flow ratio of approximately 1.0 times and not to exceed 1.5 times; and
the Trust’s expectations that its funds from operations, undrawn credit facility and working capital surplus will be sufficient to fund its planned capital investment program, enable it to meet all current and expected financial requirements and maintain unitholder distributions.
statements relating to “reserves”, as they involve the implied assessment, based on certain estimates and assumptions, that the reserves described exist in the quantities predicted or estimated and can be profitably produced in the future. This MD&A contains forward-looking statements pertaining to, and which rely on assumptions as to, the volumes and estimated value of Eagle US’s proved and probable reserves, forecasted production levels, future oil prices and the expected timing of tying in the remaining wells. These forward-looking statements are based on the Trust’s current beliefs as well as assumptions made by, and information currently available to, the Trust, including the accuracy of the estimates of Eagle US’s reserve volumes, future commodity prices and costs assumptions, future production levels, the ability to obtain equipment in a timely manner to carry out development activities, the ability to market oil successfully, and the ability to obtain financing on acceptable terms to fund Eagle US’s planned expenditures. Although management considers these assumptions to be reasonable based on information currently available to it, they may prove to be incorrect.
With respect to forward-looking statements contained in this MD&A, assumptions have been made regarding, among other things:
future oil and gas prices;
future currency exchange rates;
the regulatory framework governing taxes in the US and Canada and the Trust’s status as a “mutual fund trust” and not a “SIFT trust;”
future production levels;
future recoverability of reserves;
future capital expenditures and the ability of the Trust to obtain financing on acceptable terms for its capital projects and future acquisitions;
the Trust’s 2011 capital budget, which is subject to change in light of ongoing results, prevailing economic circumstances, commodity prices and industry conditions and regulations;
not including capital required to pursue future acquisitions in the forecasted capital expenditures;
estimates of the anticipated production and product mix is based on the proposed drilling program with a success rate that, in turn, is based upon historical drilling success and an evaluation of the particular wells to be drilled; and
projected operating costs are based on historical information and anticipated increases in the cost of equipment and services.
EAGLE SECOND QUARTER REPORT 2011
14
The Trust’s actual results could differ materially from those anticipated in these forward-looking statements as a result of the risk factors set forth below and included in the AIF:
volatility of oil and gas prices;
commodity supply and demand;
fluctuations in currency and interest rates;
inherent risks and changes in costs associated in the development of oil and gas properties;
ultimate recoverability of reserves;
timing, results and costs of drilling activities and pipeline construction;
availability of financing and capital; and
new regulations and legislation. Additional risks and uncertainties affecting the Trust are contained in the Trust’s December 31, 2010 AIF. Actual performance and financial results in 2011 may differ materially from any projections of future performance or results expressed or implied by these forward‐looking statements. The internal projections, expectations or beliefs are based on the Trust’s 2011 capital budget, which is subject to change in light of ongoing results, prevailing economic circumstances, commodity prices and industry conditions and regulations. New factors emerge from time to time, and it is not possible for management to predict all of these factors or to assess in advance the impact of each such factor on the Trust’s business, or the extent to which any factor, or combination of factors, may cause actual results to differ materially from those contained in any forward looking statement.
EAGLE SECOND QUARTER REPORT 2011
Eagle Energy Trust
Interim Consolidated Financial Statements (unaudited) For the Period Ended June 30, 2011
EAGLE SECOND QUARTER REPORT 2011
1
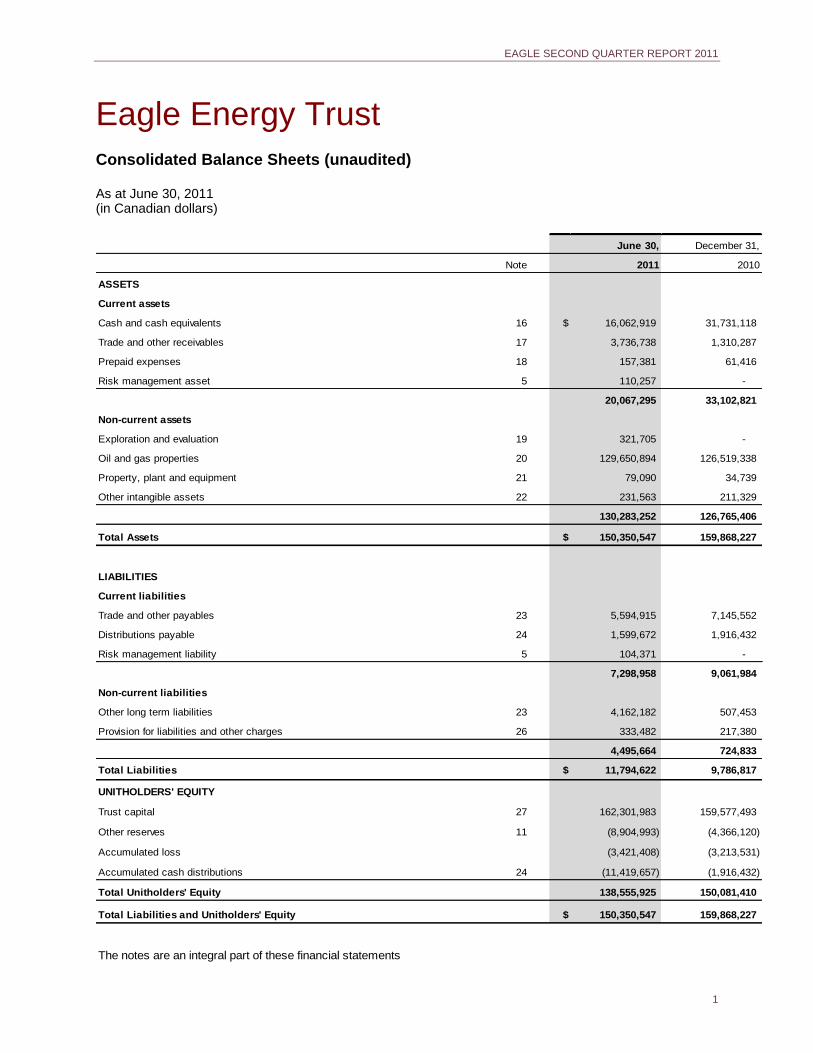
Eagle Energy Trust Consolidated Balance Sheets (unaudited) As at June 30, 2011 (in Canadian dollars)
December 31,
Note 2010
ASSETS
Current assets
Cash and cash equivalents 16 $ 16,062,919 31,731,118
Trade and other receivables 17 3,736,738 1,310,287
Prepaid expenses 18 157,381 61,416
Risk management asset 5 110,257 -
20,067,295 33,102,821
Non-current assets
Exploration and evaluation 19 321,705 -
Oil and gas properties 20 129,650,894 126,519,338
Property, plant and equipment 21 79,090 34,739
Other intangible assets 22 231,563 211,329
130,283,252 126,765,406
Total Assets $ 150,350,547 159,868,227
LIABILITIES
Current liabilities
Trade and other payables 23 5,594,915 7,145,552
Distributions payable 24 1,599,672 1,916,432
Risk management liability 5 104,371 -
7,298,958 9,061,984
Non-current liabilities
Other long term liabilities 23 4,162,182 507,453
Provision for liabilities and other charges 26 333,482 217,380
4,495,664 724,833
Total Liabilities $ 11,794,622 9,786,817
UNITHOLDERS' EQUITY
Trust capital 27 162,301,983 159,577,493
Other reserves 11 (8,904,993) (4,366,120)
Accumulated loss (3,421,408) (3,213,531)
Accumulated cash distributions 24 (11,419,657) (1,916,432)
Total Unitholders' Equity 138,555,925 150,081,410
Total Liabilities and Unitholders' Equity $ 150,350,547 159,868,227
The notes are an integral part of these financial statements
June 30,
2011
EAGLE SECOND QUARTER REPORT 2011
2
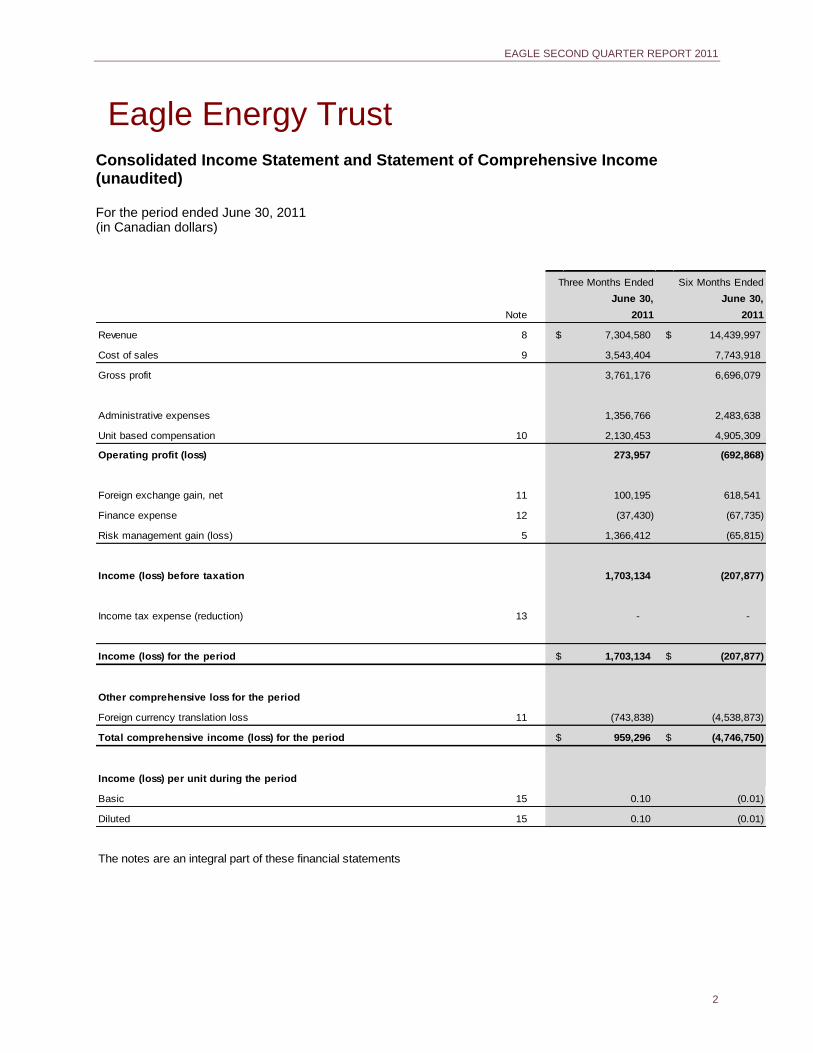
Eagle Energy Trust Consolidated Income Statement and Statement of Comprehensive Income (unaudited) For the period ended June 30, 2011 (in Canadian dollars)
Note 2011 2011
Revenue 8 $ 7,304,580 $ 14,439,997
Cost of sales 9 3,543,404 7,743,918
Gross profit 3,761,176 6,696,079
Administrative expenses 1,356,766 2,483,638
Unit based compensation 10 2,130,453 4,905,309
Operating profit (loss) 273,957 (692,868)
Foreign exchange gain, net 11 100,195 618,541
Finance expense 12 (37,430) (67,735)
Risk management gain (loss) 5 1,366,412 (65,815)
Income (loss) before taxation 1,703,134 (207,877)
Income tax expense (reduction) 13 - -
Income (loss) for the period $ 1,703,134 $ (207,877)
Other comprehensive loss for the period
Foreign currency translation loss 11 (743,838) (4,538,873)
Total comprehensive income (loss) for the period $ 959,296 $ (4,746,750)
Income (loss) per unit during the period
Basic 15 0.10 (0.01)
Diluted 15 0.10 (0.01)
The notes are an integral part of these financial statements
Three Months Ended
June 30,
Six Months Ended
June 30,
EAGLE SECOND QUARTER REPORT 2011
3
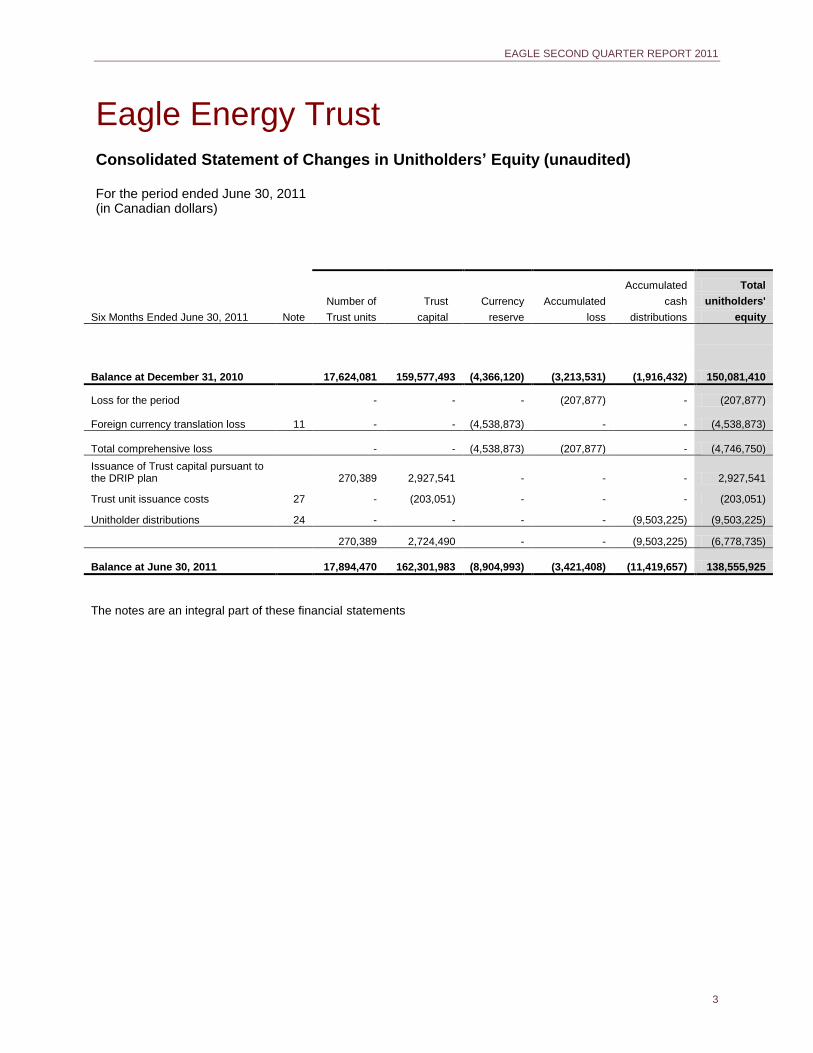
Eagle Energy Trust Consolidated Statement of Changes in Unitholders’ Equity (unaudited) For the period ended June 30, 2011 (in Canadian dollars)
Accumulated Total
Number of Trust Currency Accumulated cash unitholders'
Six Months Ended June 30, 2011 Note Trust units capital reserve loss distributions equity
Balance at December 31, 2010
17,624,081 159,577,493
(4,366,120) (3,213,531) (1,916,432) 150,081,410
Loss for the period
- - - (207,877) - (207,877)
Foreign currency translation loss 11 - -
(4,538,873) - - (4,538,873)
Total comprehensive loss
- -
(4,538,873) (207,877) - (4,746,750)
Issuance of Trust capital pursuant to the DRIP plan 270,389 2,927,541 - - - 2,927,541
Trust unit issuance costs 27 - (203,051) - - - (203,051)
Unitholder distributions 24 - - - - (9,503,225) (9,503,225)
270,389 2,724,490 - - (9,503,225) (6,778,735)
Balance at June 30, 2011
17,894,470 162,301,983
(8,904,993) (3,421,408) (11,419,657) 138,555,925
The notes are an integral part of these financial statements
EAGLE SECOND QUARTER REPORT 2011
4
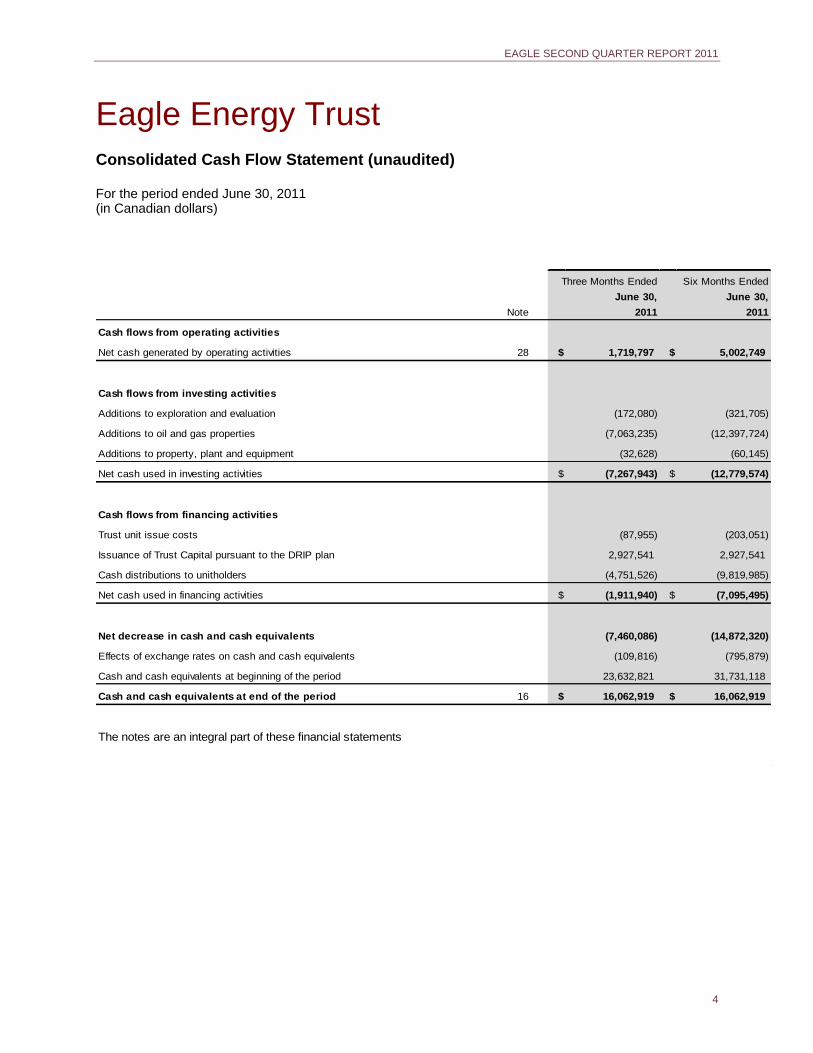
Eagle Energy Trust Consolidated Cash Flow Statement (unaudited) For the period ended June 30, 2011 (in Canadian dollars)
Note 2011 2011
Cash flows from operating activities
Net cash generated by operating activities 28 $ 1,719,797 $ 5,002,749
Cash flows from investing activities
Additions to exploration and evaluation (172,080) (321,705)
Additions to oil and gas properties (7,063,235) (12,397,724)
Additions to property, plant and equipment (32,628) (60,145)
Net cash used in investing activities $ (7,267,943) $ (12,779,574)
Cash flows from financing activities
Trust unit issue costs (87,955) (203,051)
Issuance of Trust Capital pursuant to the DRIP plan 2,927,541 2,927,541
Cash distributions to unitholders (4,751,526) (9,819,985)
Net cash used in financing activities $ (1,911,940) $ (7,095,495)
Net decrease in cash and cash equivalents (7,460,086) (14,872,320)
Effects of exchange rates on cash and cash equivalents (109,816) (795,879)
Cash and cash equivalents at beginning of the period 23,632,821 31,731,118
Cash and cash equivalents at end of the period 16 $ 16,062,919 $ 16,062,919
The notes are an integral part of these financial statements
Three Months Ended
June 30,
Six Months Ended
June 30,
EAGLE SECOND QUARTER REPORT 2011
5
Eagle Energy Trust Notes to Consolidated Financial Statements (unaudited) For the period ended June 30, 2011 (in Canadian dollars)
1. Reporting entity / Structure of the Trust
Eagle Energy Trust’s activities are restricted to owning property (other than real property or interests in real property), and it does not carry on business. Eagle Energy Trust’s subsidiaries are in the business of acquiring, developing and producing oil and natural gas reserves in the United States. Eagle Energy Trust was formed as an unincorporated open-ended limited purpose trust established under the laws of the Province of Alberta on July 20, 2010 and was settled with a 1/10
ounce gold coin and $200 from the initial unitholders. The beneficiaries of the Trust
are the unitholders. Throughout these notes to the consolidated financial statements, Eagle Energy Trust and its subsidiaries are referred to collectively as the “Trust” or “Eagle” for purposes of convenience. For a list of subsidiaries and a detailed description of the structure of the Trust, refer to “Subsidiaries and consolidated entities” note 6. The strategy of the Trust is to acquire and exploit conventional, long-life hydrocarbon reserves in certain on-shore production basins of the United States. The Trust’s subsidiaries do not intend to engage substantively in exploration activities. The Trust intends to make monthly distributions of a portion of its available cash to unitholders and use the remainder of its available cash to reinvest in its subsidiaries to fund growth through additional acquisitions and capital expenditures. Cash flow is provided to the Trust from properties owned and operated by directly and indirectly owned subsidiaries of the Trust. Cash flow is paid to the Trust by way of interest payments, principal debt repayments or partnership distributions. Operations officially commenced on November 24, 2010, concurrent with the closing of the Salt Flat Field acquisition (see “Acquisitions” note 7). The address of the Trust is: 9
th Floor, 639-5
th Avenue SW, Calgary, AB T2P 0M9.
2.1 Basis of preparation
Basis of accounting
The consolidated financial statements were authorized for issue in accordance with a resolution of the Board of Directors made on August 11, 2011. These interim “condensed” Consolidated Financial Statements have been prepared in accordance with International Financial Reporting Standards (“IFRS”) and with International Accounting Standard (“IAS”) 34, “Interim Financial Reporting”, as issued by the International Accounting Standards Board (“IASB”) and do not include all the necessary annual disclosures in accordance with IFRS. The most recent annual consolidated financial statements for the period ended December 31, 2010 were also prepared in accordance with IFRS. These interim financial statements should be read in conjunction with the annual consolidated financial statements for the period ended December 31, 2010 and the interim consolidated financial statements for the period ended March 31, 2011 prepared in accordance with IFRS applicable to interim financial statements. The preparation of financial statements in conformity with IFRS requires Management to make estimates and assumptions that affect the reported amounts of revenues and expenses during the period, assets and liabilities, and the disclosure of contingent liabilities at the date of the financial statements. The key estimates and assumptions are set out in “Critical accounting estimates and judgments” note 3. Such estimates and assumptions are based on historical experience and various other factors that are believed to be reasonable in the circumstances and constitute Management’s best judgment at the date of the financial statements. In the future, actual experience may deviate from these estimates and assumptions. This could affect future financial statements as the original estimates and assumptions are modified, as appropriate, in the year in which the circumstances change. These financial statements have been prepared on the historical cost basis except for those items which are required to be stated at fair value. Historical cost is generally based on the fair value of the consideration given in exchange for the asset. The principal accounting policies adopted are set out below in “Significant accounting policies” note 2.3.
EAGLE SECOND QUARTER REPORT 2011
6
Basis of consolidation
The consolidated financial statements incorporate the financial statements of the Trust and entities controlled by the Trust (including its subsidiaries) up to the balance sheet date. Subsidiaries are all entities over which the Trust has the power to govern the financial and operating policies generally accompanying a security holding of more than one half of the voting rights. The existence and effect of potential voting rights that are currently exercisable or convertible are considered when assessing whether the Trust controls another entity. All subsidiaries of the Trust are directly or indirectly wholly-owned by the Trust. A list of the subsidiaries has been included in “Subsidiaries and consolidated entities” note 6. The activities of subsidiaries are included in the consolidated financial statements from the effective date that control commences until the date that control ceases. Intercompany balances and transactions and any unrealized income and expenses arising from intercompany transactions are eliminated in preparing the consolidated financial statements.
2.2 Adoption of new and revised standards
Accounting standards and interpretations issued but not yet adopted
At the date of authorization of these financial statements, the following standards and interpretations, which have not been applied in these financial statements, were issued by the IASB but not yet in effect. The Trust will be required to adopt these new pronouncements, subject to the comments below regarding IFRS 9, as of January 1, 2013.
IFRS 9, “Financial Instruments”, is the first phase of the IASB’s project to replace IAS 39, “Financial Instruments: Recognition and Measurement”. IFRS 9 replaces the current multiple classification and measurement models for financial assets with a single model that has only two classification categories: amortized cost and fair value, and provides additional guidance for financial liabilities. The standard may be delayed until 2015. It is currently an exposure draft from the IASB. Portions of the standard remain in development and the full impact of the standard will not be known until the project is complete.
IFRS 10, “Consolidated Financial Statements”, is the result of the IASB’s project to replace Standing Interpretations Committee 12, “Consolidation - Special Purpose Entities” and the consolidation requirements of IAS 27, “Consolidated and Separate Financial Statements”. The new standard eliminates the current risk and rewards approach and establishes control as the single basis for determining the consolidation of an entity.
IFRS 11, “Joint Arrangements”, which is the result of the IASB’s project to replace IAS 31, “Interest in Joint Ventures”. The new standard redefines joint operations and joint ventures and requires joint operations to be proportionately consolidated and joint ventures to be equity accounted. Under IAS 31, joint ventures could be proportionately accounted. It is anticipated that existing and future upstream oil and gas arrangements will be characterized as joint operations and proportionately consolidated under the new standard.
IFRS 12, “Disclosures of Interests in Other Entities”, outlines the required disclosures for interests in subsidiaries and joint arrangements. The new disclosures require information that will assist financial statement users in evaluating the nature, risks and financial effects associated with an entity’s interests in subsidiaries and joint arrangements.
IFRS 13, “Fair Value Measurement”, provides a common definition of fair value, establishes a framework for measuring fair value under IFRS and enhances the disclosures required for fair value measurements. The standard applies where fair value measurements are required and does not require new fair value measurements.
Although it is anticipated that the adoption of the above standards and interpretations should not have a material impact on its Consolidated Financial Statements, the Trust is assessing the exact impact. The exact impact will depend on the individual transaction concerned, with potentially different amounts being recognized in the consolidated financial statements than would have previously been the case.
2.3 Significant accounting policies
The accounting policies set out below have been applied consistently to all periods presented in these consolidated financial statements and have been applied consistently by the Trust and its subsidiaries.
EAGLE SECOND QUARTER REPORT 2011
7
Business combinations
The acquisitions method of accounting is used to account for acquisitions of subsidiaries and assets that meet the definition of a business under IFRS. The cost of an acquisition is measured as the fair value of the assets given, equity instruments issued and liabilities incurred or assumed at the date of exchange. Identifiable assets acquired and liabilities and contingent liabilities assumed in a business combination are measured initially at their fair values at the acquisition date. The excess of the cost of acquisition over the fair value of the identifiable assets, liabilities and contingent liabilities acquired is recorded as goodwill. If the cost of acquisition is less than the fair value of the net assets of the subsidiary acquired, the difference is recognized immediately in the income statement. Jointly controlled operations and jointly controlled assets
Many of the Trust’s oil and natural gas activities involve jointly controlled assets. The consolidated financial statements include the Trust’s share of these jointly controlled assets and a proportionate share of the relevant revenue and related costs. Foreign Currency
Items included in the financial statements of each of the Trust’s entities are measured using the currency of the primary economic environment in which the entity operates (the “functional currency”). The consolidated financial statements are presented in “Canadian dollars” (“$CA”), which is the functional and presentation currency of the Trust. Foreign currency transactions are translated into the functional currency using the exchange rates prevailing at the dates of the transactions. Foreign exchange gains and losses resulting from the settlement of such transactions and from the translation at year end exchange rates of monetary assets and liabilities denominated in foreign currencies are recognized in the income statement. Non-monetary assets that are measured at fair value are translated using the exchange rate at the date that the fair value was determined. Translation differences on equities and similar non-monetary items measured at fair value are recognized in profit or loss, except for differences on available-for-sale non-monetary financial assets such as equity shares, which are included in the fair value reserve in equity unless the asset is a hedged item in a fair value hedge. The results and financial position of all the Trust entities (none of which has the currency of a hyper-inflationary economy) that have a functional currency different from the presentation currency are translated into the presentation currency as follows:
(a) assets and liabilities for each balance sheet presented are translated at the closing rate at the date of that balance sheet;
(b) income and expenses for each income statement are translated at average exchange rates (unless the average is not a reasonable approximation of the cumulative effect of the rates prevailing on the transaction dates, in which case income and expenses are translated at the dates of the transactions);
(c) all items included in the statement of changes in equity, other than net profit or loss, for the year, are translated at historical exchange rates; and
(d) all resulting exchange differences are recognized as a separate component of equity. On consolidation, exchange differences arising from the translation of the net investment in foreign entities are taken to unitholders’ equity. When a foreign operation is sold or when control is lost, such exchange differences are recognized in the income statement as part of the gain or loss on sale. Goodwill and fair value adjustments arising on the acquisition of a foreign entity are treated as assets and liabilities of the foreign entity and translated at the closing rate. Financial instruments
Financial assets and financial liabilities are recognized in the balance sheet when the Trust becomes a party to the contractual provisions of the instrument. The effective interest rate method is a method of calculating the amortized cost of a financial asset or liability and allocating interest income or expense over the relevant period. The effective interest rate is the applicable discount rate for the estimated future cash receipts or payments over the expected life of the financial asset or liability. Non-derivative financial instruments
Non-derivative financial instruments are recognized initially at fair value plus, for instruments not at fair value through profit or loss, any directly attributable transaction costs.
EAGLE SECOND QUARTER REPORT 2011
8
An instrument is classified at fair value through profit or loss if it is held for trading or is designated as such upon initial recognition. Financial instruments are designated at fair value through profit or loss if the Trust manages such investments and makes purchase and sale decisions based on their fair value in accordance with the Trust’s risk management or investment strategy. Upon initial recognition, attributable transaction costs are recognized in profit or loss when incurred. Financial instruments at fair value through profit or loss are measured at fair value and changes therein are recognized in profit or loss. Subsequent to initial recognition, non-derivative financial instruments are measured as described below.
(a) Financial assets
Financial assets are classified as loans and receivables. The classification depends on the purpose for which the financial assets were acquired. Management determines the classification of its financial assets at initial recognition.
(i) Loans and receivables
Cash and cash equivalents comprise cash on hand and current balances and deposits with banks or similar institutions which are readily convertible to cash and which are subject to insignificant risk of changes in value. Trade receivables, loans and other receivables which are non-derivative financial assets that have fixed or determinable payments that are not quoted in an active market are classified as loans and receivables. They are included in current assets, except for those with maturities greater than 12 months after the balance sheet date, which are classified as non-current assets. The Trust’s loans and receivables comprise cash and cash equivalents and trade and other receivables.
Loans and receivables are carried at their amortized cost using the effective interest rate method, net of any impairment. Interest income is recognized by applying the effective interest rate method, except for short-term receivables, where the recognition of interest would be immaterial.
(ii) Impairment of financial assets
Financial assets are assessed for impairment at each balance sheet date. Financial assets are impaired when there is objective evidence that the estimated future cash flows of the asset have been impacted. For loans and receivables, the amount of the impairment is the difference between the asset’s carrying amount and the present value of estimated future cash flows, discounted at the original effective interest rate. In the event of impairment, the carrying amount of the financial asset is reduced by the impairment loss, except for trade receivables where the carrying amount is reduced through the use of an allowance account. When a trade receivable is uncollectible, it is written off against the allowance account, and the amount of the loss is recognized in the income statement. Subsequent recoveries of amounts previously written off are credited against the income statement.
(b) Financial liabilities and equity
Financial liabilities and equity instruments are classified in accordance with IAS 32 “Financial Instruments: Presentation”. (i) Trade payables
Trade payables are recognized initially at fair value and subsequently measured at amortized cost using the effective interest rate method. Interest income is recognized by applying the effective interest rate, except for short-term payables when the recognition of interest would be immaterial.
(ii) Borrowings
Borrowings are recognized initially at fair value net of transaction costs incurred, including debt issuance costs in the form of cash payments. Borrowings are subsequently stated at amortized cost; any difference between the proceeds (net of transaction costs) and the redemption value is recognized over the term of the borrowings using the effective interest rate method and charged to the income statement as finance costs. Borrowing costs incurred for the construction of any qualifying asset are capitalized during the period of time that is required to complete and prepare the asset for its intended use. To the extent that the Trust borrows funds generally and uses them for the purpose of obtaining a qualifying asset, the Trust determines the amount of borrowing costs eligible for capitalization by applying a capitalization rate to
EAGLE SECOND QUARTER REPORT 2011
9
the expenditures on that asset. The capitalization rate is the weighted average of the borrowing costs applicable to the borrowings of the Trust that are outstanding during the period, other than borrowings made specifically for the purpose of obtaining a qualifying asset. The amount of borrowing costs that the Trust capitalizes during a period shall not exceed the amount of borrowing costs it incurred during that period. For funds borrowed to obtain a qualifying asset, the borrowing costs eligible for capitalization are the actual borrowing costs incurred during the period less any investment income earned from the temporary investment of the borrowed funds. All other borrowing costs are recognized in profit or loss using the effective interest method. Where an existing financial liability is replaced by another from the same lender on substantially different terms, or the terms of an existing liability are substantially modified, such an exchange or modification is treated as derecognition of the original liability and recognition of a new liability, the difference between the carrying amounts of the original liability and the fair value of the new liability is recognized in the income statement. Borrowings are classified as current liabilities unless the Trust has an unconditional right to defer settlement of the liability for at least 12 months after the balance sheet date.
(iii) Equity instruments
An equity instrument is any contract that evidences a residual interest in the assets of the Trust after deducting all of its liabilities. Equity instruments of the Trust are recorded at the proceeds received, net of incremental costs directly attributable to the issue of new Trust units or options, which are shown as a deduction, net of tax, from the proceeds. Trust units are classified as equity.
(iv) Compound instruments
The exceptions in IAS 32 which allow an entity such as a trust to classify “puttable” instruments as equity do not extend to instruments such as warrants, options and convertible debt that entitle the holder to acquire “puttable” instruments for a fixed price. Such instruments are classified as liabilities in their entirety under IAS 32.22A. Because of the “puttable” nature of trust units, there will always be an embedded derivative and the instrument shown as a liability.
Derivative financial instruments
The Trust enters into certain financial derivative contracts periodically in order to manage its exposure to market risks from fluctuations in commodity prices. These instruments are not used for trading or speculative purposes. The Trust does not designate its financial derivative contracts as effective accounting hedges and thus does not apply hedge accounting (even though the Trust considers all commodity contracts to be economic hedges). As a result, all financial derivative contracts are classified as fair value through profit or loss and are recorded on the balance sheet at fair value. Related transaction costs are recognized in profit or loss when incurred. The Trust may enter into forward physical delivery sales contracts. The policy is to account for these forward physical delivery sales contracts, which are entered into and continue to be held for the purpose of receipt or delivery of non-financial items in accordance with its expected purchase, sale or usage requirements, as executory contracts. As such, these contracts are not considered to be derivative financial instruments and will not be recorded at fair value on the balance sheet. Settlements on these physical sales contracts would be recognized in revenue. Embedded derivatives are separated from the host contract and accounted for separately if: (i) the economic characteristics and risks of the host contract and the embedded derivative are not closely related; (ii) a separate instrument with the same terms as the embedded derivative would meet the definition of a derivative; and (iii) the combined instrument is not measured at fair value through profit or loss. Changes in the fair value of separable embedded derivatives are recognized immediately in profit or loss. Non-current assets held for sale
Non-current assets and disposal groups classified as held for sale are measured at the lower of carrying amount and fair value less costs to sell. Non-current assets and disposal groups are classified as held for sale if their carrying amounts will be recovered through a sale transaction rather than through continuing use. This condition is regarded as met only when the sale is highly probable and the asset or disposal group is available for immediate sale in its present condition. Management must be committed to the sale, which should be expected to qualify for recognition as a completed sale within one year from the date of classification. Oil and gas properties, property, plant and equipment and intangible assets once classified as held for sale are not depreciated.
EAGLE SECOND QUARTER REPORT 2011
10
Exploration and evaluation expenditures
In line with IFRS 6, pre-license costs, defined as those costs incurred before the legal right to explore has been acquired, are expensed in the period in which they are incurred. Exploration and evaluation costs of a type that are not sufficiently closely related to a specific mineral resource to support capitalization are also expensed in the period in which they are incurred. Exploration and evaluation costs associated with oil, gas and mineral exploration and investments are capitalized on a project by project basis (well, field or specific exploration licenses, as appropriate), pending determination of the technical feasibility and commercial viability of the project. Costs incurred include appropriate technical (geological and geophysical, or “G & G”), license acquisition and directly attributable operational overhead. Amounts recorded for these assets represent costs and are not intended to reflect present or future values. The recoverability of all exploration and evaluation expenditures is dependent upon the discovery of economically recoverable reserves and future profitable production or proceeds from the disposition thereof. When proven reserves are assigned, the accumulated costs for the relevant area are transferred from exploration and evaluation assets to oil and gas properties and further classified as either “Developed Oil & Gas Assets” or “Production Facilities and Equipment” (tangible fixed assets), as appropriate. Oil and gas properties
The drilling of development wells (including unsuccessful development or delineation wells) as well as expenditures on the construction, installation or completion of infrastructure facilities such as pipelines are capitalized within oil and gas properties. The initial cost of an asset comprises its purchase price or construction cost, any costs directly attributable to bringing the asset into operation, the initial estimate of the decommissioning obligation, and, for qualifying assets, borrowing costs. The purchase price or construction cost is the aggregate amount paid and the fair value of any other consideration given to acquire the asset. Within oil and gas properties, developed oil and gas assets and production facilities and equipment (tangible fixed assets) are stated at cost less accumulated depletion, depreciation and amortization along with accumulated impairment losses. When significant parts of an item of oil and gas properties have different useful lives, they are accounted for as separate items (componentized) and depreciated at that level. The cost of oil and gas properties is amortized over total estimated proven and probable reserves using the unit-of-production method. Costs are amortized only once commercial reserves associated with a development project can be determined and commercial production has commenced. The unit-of-production rate is calculated by reference to the ratio of production volumes during the period to the related proven and probable reserves, taking into account estimated future development costs necessary to bring those reserves into production. Future development costs are estimated taking into account the level of development required to produce the reserves. Changes in factors such as estimates of proven and probable commercial reserves that affect unit-of-production calculations do not give rise to prior financial period adjustments and are dealt with on a prospective basis.
Impairment - Exploration and evaluation expenditures
Exploration and evaluation assets are assessed for impairment if:
(i) sufficient data exists to determine technical feasibility and commercial viability; or
(ii) facts and circumstances suggest that the carrying amount exceeds the recoverable amount. Sufficient data is considered to exist in order to determine the technical feasibility and commercial viability of extracting a mineral resource when proven reserves are assigned. A review for indicators of impairment on a project by project basis (well, field or specific exploration licenses, as appropriate) is carried out, at least annually, to ascertain whether proven reserves have been assigned. If proven reserves have been assigned, exploration and evaluation assets attributable to those reserves are first tested for impairment (and any resulting impairment loss is recognized) and then reclassified from exploration and evaluation assets to oil and gas properties and amortized over the estimated life of the proven and probable reserves on a unit-of-production basis. Exploration and evaluation costs for which technical feasibility has not yet been determined through the assignment of proven reserves are subject to technical, commercial and management review for indicators of impairment at least once a year to confirm the continued intent to develop or otherwise extract value from the discovery. When this intent no longer exists, such facts and circumstances might indicate that the carrying amount exceeds the recoverable amount. If this is the case, the costs are written off. Costs associated with an exploratory dry hole are expensed immediately if commercially viable quantities of hydrocarbons are not found. Where a license is relinquished or project abandoned, the related costs are written off. Where the Trust maintains an interest in a project, but the value of the project is considered to be impaired, a provision against the relevant capitalized costs will be provided.
EAGLE SECOND QUARTER REPORT 2011
11
For purposes of impairment testing, exploration and evaluation assets are allocated and added to the carrying amount of any oil and gas properties in the same cash-generating unit (“CGU”) and the combined carrying amount is tested for impairment by comparing the carrying amount to the recoverable amount. Impairment – Oil and gas properties
Oil and gas properties (which are further classified as developed oil and gas assets and production facilities and equipment) are reviewed for impairment whenever events or changes in circumstances indicate that the carrying amount may not be recoverable. Oil and gas properties are grouped into CGU’s for impairment testing. The Trust has grouped its oil and gas properties into one CGU, the Salt Flat Field. An impairment loss is recognized for the amount by which the asset’s carrying amount exceeds its recoverable amount. Decommissioning provision
Provision is made for the present value of the future cost of abandonment (dismantling, decommissioning, and site disturbance remediation activities) of oil and gas wells and related facilities using a risk-free rate of 4.0%. This provision is recognized when the legal or constructive obligation to abandon arises. The estimated costs, based upon engineering cost levels prevailing at the balance sheet date, are computed on the basis of the latest assumptions as to the scope and method of abandonment. The corresponding amount is capitalized as part of exploration and evaluation assets or oil and gas properties and is amortized on a unit-of-production basis as part of the depreciation, depletion and amortization charge. The increase in the provision due to the passage of time (“accretion”) is treated as a component of finance costs. Any adjustments to the provision arising from reassessment of the estimated cost of decommissioning are added to, or deducted from, the cost of the related asset in the current period. If a decrease in the liability exceeds the carrying amount of the asset, the excess is recognized immediately in profit or loss.
Property, plant and equipment
Property, plant and equipment is composed of non-oil and gas assets and is stated in the balance sheet at cost, less accumulated depreciation and any provision for impairment. The initial cost of an asset comprises its purchase price or construction cost and any costs directly attributable to bringing the asset into operation. The purchase price or construction cost is the aggregate amount paid and the fair value of any other consideration given to acquire the asset. Property, plant and equipment is depreciated on a straight line basis at rates sufficient to write off the cost, less estimated residual values, of individual assets over their estimated useful lives, as follows: Improvements to leasehold property 2-10 years (or over the remaining life of the lease if shorter)
Office furniture, fixtures and equipment 3-10 years
Computer equipment 2 years The assets’ residual values and useful lives are reviewed, and adjusted if appropriate, at each balance sheet date.
Revenue recognition
Revenue comprises the fair value of the consideration received or receivable for the sale of hydrocarbons in the ordinary course of the Trust’s activities. Revenue is shown net of royalties, and intercompany sales are eliminated during consolidation. With respect to royalties, the Trust is acting as a collection agent on behalf of others. Revenue is recognized when the amount can be reliably measured, it is probable that future economic benefits will flow to the Trust, and when specific criteria have been met as described below. The amount of revenue is not considered to be reliably measurable until all contingencies relating to the sale have been resolved. The Trust bases its estimates on historical results, taking into consideration the type of customer, the type of transaction, the nature of the product and the specifics of each arrangement. Revenues from the sale of crude oil and natural gas sales are recognized when the significant risks of loss and rewards of ownership have transferred, when legal title passes to the third-party purchaser. This is generally at the time the product enters collection facilities or pipeline facilities. The Trust uses the entitlement method to account for revenue whereby revenue recognition is based upon the Trust’s direct ownership interest in the underlying oil and gas properties.
EAGLE SECOND QUARTER REPORT 2011
12
Costs associated with the sale of crude oil and natural gas such as taxes, operating costs and transportation expenses are reflected in cost of sales. Unit-based compensation
The Trust uses the fair value method of valuing compensation expense associated with the Trust’s unit option plan. The units issued pursuant to the option plan are not considered equity settled stock-based compensation since the IAS 32 “puttable instrument exemption” does not extend to unit-based payments made by a Trust. Therefore, options issued subject to the option plan are treated similar to a cash settled stock-based compensation arrangement, with the associated liability being fair-valued at the end of each reporting period and the corresponding change to fair value being recognized in the income statement. The Trust has established other unit-based compensation plans whereby notional units are granted to employees. The fair value of these notional units is estimated and recorded as a cash settled unit-based compensation arrangement. The offsetting amount is recorded as accrued liabilities or other long-term liabilities. A realization of the expense and a resulting reduction in cash provided by operating activities occurs when a cash payment is made.
Finance income and expense
Finance expense comprises interest expense on borrowings, amortization of deferred financing costs, bank fees, and accretion of the discount on the decommissioning provision. Interest income is recognized as it accrues in profit or loss, using the effective interest method.
Unitholder distributions
Unitholder distributions are declared and paid monthly. Unitholders’ equity is reduced by the amount of the declared dividend at the record date.
Taxation
Income tax expense comprises current and deferred tax. Income tax expense is recognized in profit or loss except to the extent that it relates to items recognized directly in equity, in which case it is recognized in equity. Current tax is the expected tax payable on the taxable income for the year, using tax rates enacted or substantively enacted at the reporting date, and any adjustment to tax payable in respect of previous years. Tax on income in interim periods is accrued using the tax rate that would be applicable to expected total annual earnings.
Deferred tax is recognized using the balance sheet method, providing for temporary differences between the carrying amounts of assets and liabilities for financial reporting purposes and the amounts used for taxation purposes. Deferred tax is not recognized on the initial recognition of assets or liabilities in a transaction that is not a business combination. In addition, deferred tax is not recognized for taxable temporary differences arising on the initial recognition of goodwill. Deferred tax is measured at the tax rates that are expected to be applied to temporary differences when they reverse, based on the laws that have been enacted or substantively enacted by the reporting date. The effect of any change in income tax rates is recognized in the current period income. Deferred tax assets and liabilities are offset if there is a legally enforceable right to offset, and they relate to income taxes levied by the same tax authority on the same taxable entity, or on different tax entities, but they intend to settle current tax liabilities and assets on a net basis or their tax assets and liabilities will be realized simultaneously.
A deferred tax asset is recognized to the extent that it is probable that future taxable profits will be available against which the temporary difference can be utilized. Deferred tax assets are reviewed at each reporting date and are reduced to the extent that it is no longer probable that the related tax benefit will be realized. Eagle Energy Trust is a taxable entity under the Income Tax Act (Canada) (“Tax Act”) and is currently taxable only on income that is not distributed or distributable to the unitholders. Eagle Energy Trust distributes all of its taxable income to the unitholders and expects to continue to distribute all of its taxable income to unitholders. The Trust will at no time be a SIFT trust as defined in the Tax Act. Investment restrictions contained in the formation documents provide that the Trust and its subsidiaries will only invest in entities that qualify as a “portfolio investment entity” and will not hold any “non-portfolio property” or “taxable Canadian property”, each as defined in the Tax Act. It also qualifies as a “mutual fund trust” within the meaning of the Tax Act and will not be subject to the limit on non-resident ownership in the Tax Act as it will not own any “taxable Canadian property” as defined in the Tax Act. Eagle Energy Trust’s indirect subsidiary is in the business of acquiring, developing and producing oil and natural gas reserves in the United States. As a general rule, a foreign corporation engaged in a United States trade or business is subject to U.S. federal income tax on income that is effectively connected (effectively connected income, or “ECI”) with the United States trade or business and, if an income tax treaty with the United States applies, is attributable to a permanent establishment maintained by the foreign corporation in the United States. ECI is subject to United
EAGLE SECOND QUARTER REPORT 2011
13
States federal income tax on a net basis at the regular United States federal graduated rates of tax that apply to United States persons. A foreign corporation’s taxable income is computed by claiming deductions that are attributable to the effectively connected gross income on a timely filed return. A foreign corporation that derives ECI (including amounts received as a partner through a partnership or disregarded entity) is generally required to make quarterly payments of estimated United States tax, and is required to file a United States federal income tax return. A subsidiary of Eagle Energy Trust, Eagle Energy Commercial Trust, has elected under applicable United States Treasury Regulations to be treated as a corporation for United States federal income tax purposes effective on the date of formation and is generally subject to United States federal income tax on its net taxable income (including income related to the Salt Flat Interest which is ECI). Eagle Energy Commercial Trust deducts interest paid on certain intercompany notes and other deductible expenses, including intangible drilling and developments costs and depletion in calculating its US taxable income.
Trust unit calculations
The Trust uses the treasury stock method to determine the dilutive effect of Trust unit rights and Trust unit options. Under the treasury stock method, outstanding and exercisable instruments that will have a dilutive effect are included in per-unit diluted calculations, ordered from most dilutive to least dilutive. The dilutive effect of convertible obligations or instruments is determined using the “if-converted” method, whereby the outstanding convertibles at the end of the period are assumed to have been converted at the beginning of the period or at the time of issue if issued during the period. Amounts charged to income or loss which relate to the outstanding convertibles are added back to net income for the diluted calculation. The units issued upon conversion are included in the denominator of per-unit basic calculations from the date of issue.
3. Critical accounting estimates and judgments
The Trust makes estimates and assumptions concerning the future. The resulting accounting estimates will, by definition, seldom equal the related actual results. Such estimates and assumptions are continually evaluated and are based on historical experience and other factors, including expectations of future events that are believed to be reasonable under the circumstances. The estimates and assumptions that have a significant risk of causing a material adjustment to the carrying amounts of assets and liabilities within the next financial year are discussed below. Estimation of oil and gas reserves
Oil and gas reserves are the estimated quantities of oil and gas which geological and engineering data demonstrate with reasonable certainty to be recoverable in future years from known reservoirs under existing economic and operating conditions. Estimates of oil and gas reserves are inherently imprecise, require the application of judgment and are subject to future revision. Accordingly, financial and accounting measures (such as the impairment calculation, depreciation, depletion and amortization charges, and decommissioning provisions) that are based on reserves are also subject to change. Capitalized exploration and evaluation expenditures
In making decisions about whether to continue to capitalize exploration and evaluation expenditures, it is necessary to make judgments about the commercial reserves and the level of activities that constitute on-going evaluation determination. If there is a change in any judgment in a subsequent period, then the related capitalized exploration and evaluation expenditure would be expensed in that period, resulting in a charge to income. Decommissioning provision
Estimates of the amounts of provision for decommissioning recognized are based on current legal and constructive requirements, technology and price levels. As actual outflows may be different from estimates due to changes in laws, regulations, technology, prices, and conditions, and can take place in the future, the carrying amounts of provisions are regularly reviewed and adjusted to take account of such changes. The Trust has interpreted the accounting standard to use the risk-free discount rate for calculating the present value of the decommissioning obligation. Impairment indicators
The recoverable amounts of cash-generating units and individual assets have been determined based on the higher of value-in-use calculations and fair values less costs to sell. These calculations require the use of estimates and assumptions. It is reasonably possible that the commodity price assumption may change, which may impact the estimated life of the asset and may require a material adjustment to the carrying value of assets. The Trust monitors internal and external indicators of impairment relating to its tangible and intangible assets.
EAGLE SECOND QUARTER REPORT 2011
14
Income taxes
The Trust recognizes the net future tax benefit related to deferred income tax assets to the extent that it is probable that the deductible temporary differences will reverse in the foreseeable future. Assessing the recoverability of deferred income tax assets requires the Trust to make significant estimates related to expectations of future taxable income. Estimates of future taxable income are based on forecast cash flows from operations and the application of existing tax laws in each jurisdiction. To the extent that future cash flows and taxable income differ significantly from estimates, the ability of the Trust to realize the net deferred tax assets recorded at the balance sheet date could be impacted. Additionally, future changes in tax laws in the jurisdiction in which the Trust operates could limit the ability of the Trust to obtain tax deductions in future periods. Derivative financial instruments
As described in “Financial risk management” note 5, derivative financial instruments are used by the Trust to manage its exposure to market risks relating to commodity prices. The Trust’s policy is not to use derivative financial instruments for speculative purposes. Derivative financial instruments that do not qualify, or are not designated, as hedges for accounting are recorded at fair value. Instruments are recorded in the balance sheet as either an asset or a liability with changes in fair value recognized in the income statement. The estimate of fair value of all derivative instruments is based on quoted market prices, or in their absence, third-party market indications and forecasts. The estimated fair value of financial assets and liabilities is subject to measurement uncertainty. Classification of Trust units as equity
Trust units issued by the Trust give the holder the right to put the units back to the issuer in exchange for cash. IAS 32 “Financial Instruments: Presentation” establishes the general principle that an instrument which gives the holder the right to put the instrument back to the issuer for cash should be classified as a financial liability, unless such instrument has all of the features and meets the conditions of the IAS 32 “puttable instrument exemption”. If these “puttable instrument exemption” criteria are met, the instrument is classified as equity. The Trust has examined the terms and conditions of its Trust Indenture and classifies its outstanding Trust units as equity because the Trust units meet the “puttable instrument exemption” criteria as there is no contractual obligation to distribute cash.
Contingencies
By their nature, contingencies will only be resolved when one or more future events occur or fail to occur. The assessment of contingencies inherently involves the exercise of significant judgment and estimates of the outcome of future events.
4. Determination of fair values
A review of the financial statements has concluded that there are no significant differences between the book values and fair values of the financial assets and liabilities of the Trust as at June 30, 2011 and December 31, 2010.
5. Financial risk management
The Trust’s activities expose it to a variety of financial risks that arise as a result of its exploration, development, production and financing activities such as:
credit risk;
liquidity risk; and
market risk. This note presents information about the Trust’s exposure to each of the above risks, the Trust’s objectives, policies and processes for measuring and managing risk, and the Trust’s management of capital. Further quantitative disclosures are included throughout these consolidated financial statements. The Trust finances its operations through a combination of cash, loans from banks (lines of credit) and equity. Finance requirements such as equity, debt, and project finance are reviewed by the Board when funds are required for acquisition, exploration, and development projects. The Trust’s treasury management function is responsible for managing funding requirements and investments wh ich include banking and cash flow management. Interest and foreign exchange exposure are key functions of treasury management to ensure adequate liquidity at all times to meet cash requirements.
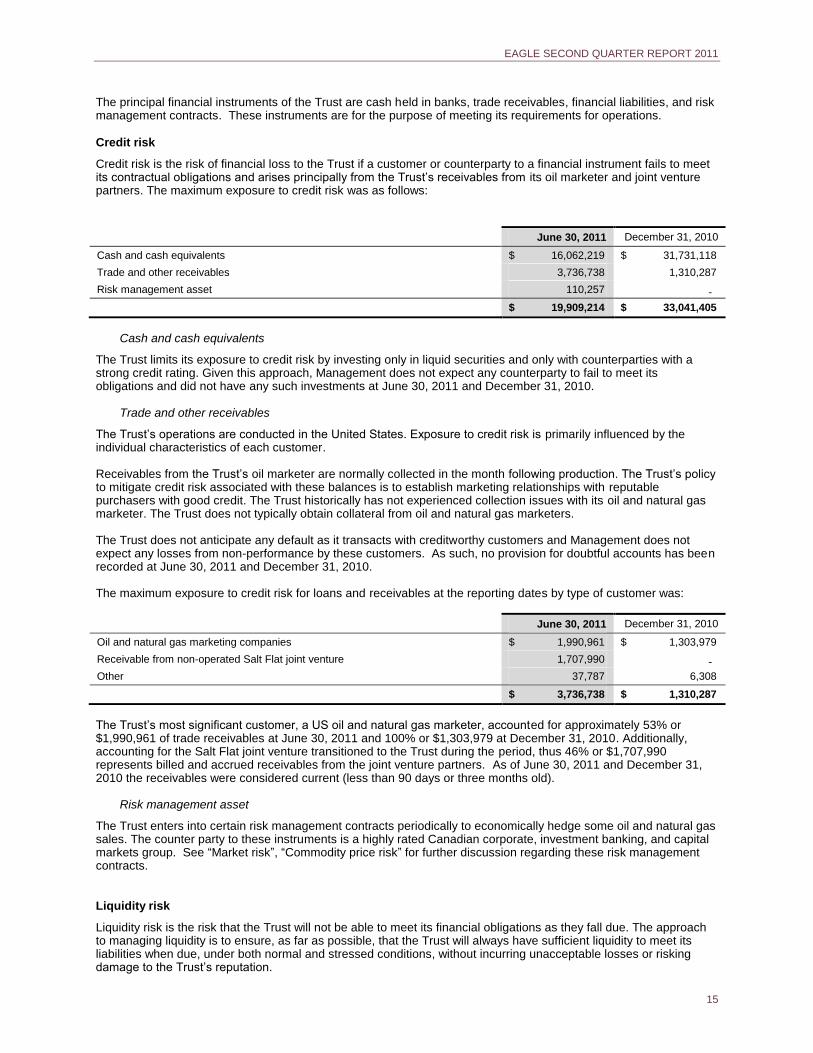
EAGLE SECOND QUARTER REPORT 2011
15
The principal financial instruments of the Trust are cash held in banks, trade receivables, financial liabilities, and risk management contracts. These instruments are for the purpose of meeting its requirements for operations. Credit risk
Credit risk is the risk of financial loss to the Trust if a customer or counterparty to a financial instrument fails to meet its contractual obligations and arises principally from the Trust’s receivables from its oil marketer and joint venture partners. The maximum exposure to credit risk was as follows:
June 30, 2011 December 31, 2010
Cash and cash equivalents $ 16,062,219 $ 31,731,118
Trade and other receivables 3,736,738 1,310,287
Risk management asset 110,257 -
$ 19,909,214 $ 33,041,405
Cash and cash equivalents
The Trust limits its exposure to credit risk by investing only in liquid securities and only with counterparties with a strong credit rating. Given this approach, Management does not expect any counterparty to fail to meet its obligations and did not have any such investments at June 30, 2011 and December 31, 2010.
Trade and other receivables
The Trust’s operations are conducted in the United States. Exposure to credit risk is primarily influenced by the individual characteristics of each customer. Receivables from the Trust’s oil marketer are normally collected in the month following production. The Trust’s policy to mitigate credit risk associated with these balances is to establish marketing relationships with reputable purchasers with good credit. The Trust historically has not experienced collection issues with its oil and natural gas marketer. The Trust does not typically obtain collateral from oil and natural gas marketers. The Trust does not anticipate any default as it transacts with creditworthy customers and Management does not expect any losses from non-performance by these customers. As such, no provision for doubtful accounts has been recorded at June 30, 2011 and December 31, 2010. The maximum exposure to credit risk for loans and receivables at the reporting dates by type of customer was:
June 30, 2011 December 31, 2010
Oil and natural gas marketing companies $ 1,990,961 $ 1,303,979
Receivable from non-operated Salt Flat joint venture 1,707,990 -
Other 37,787 6,308
$ 3,736,738 $ 1,310,287
The Trust’s most significant customer, a US oil and natural gas marketer, accounted for approximately 53% or $1,990,961 of trade receivables at June 30, 2011 and 100% or $1,303,979 at December 31, 2010. Additionally, accounting for the Salt Flat joint venture transitioned to the Trust during the period, thus 46% or $1,707,990 represents billed and accrued receivables from the joint venture partners. As of June 30, 2011 and December 31, 2010 the receivables were considered current (less than 90 days or three months old).
Risk management asset
The Trust enters into certain risk management contracts periodically to economically hedge some oil and natural gas sales. The counter party to these instruments is a highly rated Canadian corporate, investment banking, and capital markets group. See “Market risk”, “Commodity price risk” for further discussion regarding these risk management contracts. Liquidity risk
Liquidity risk is the risk that the Trust will not be able to meet its financial obligations as they fall due. The approach to managing liquidity is to ensure, as far as possible, that the Trust will always have sufficient liquidity to meet its liabilities when due, under both normal and stressed conditions, without incurring unacceptable losses or risking damage to the Trust’s reputation.
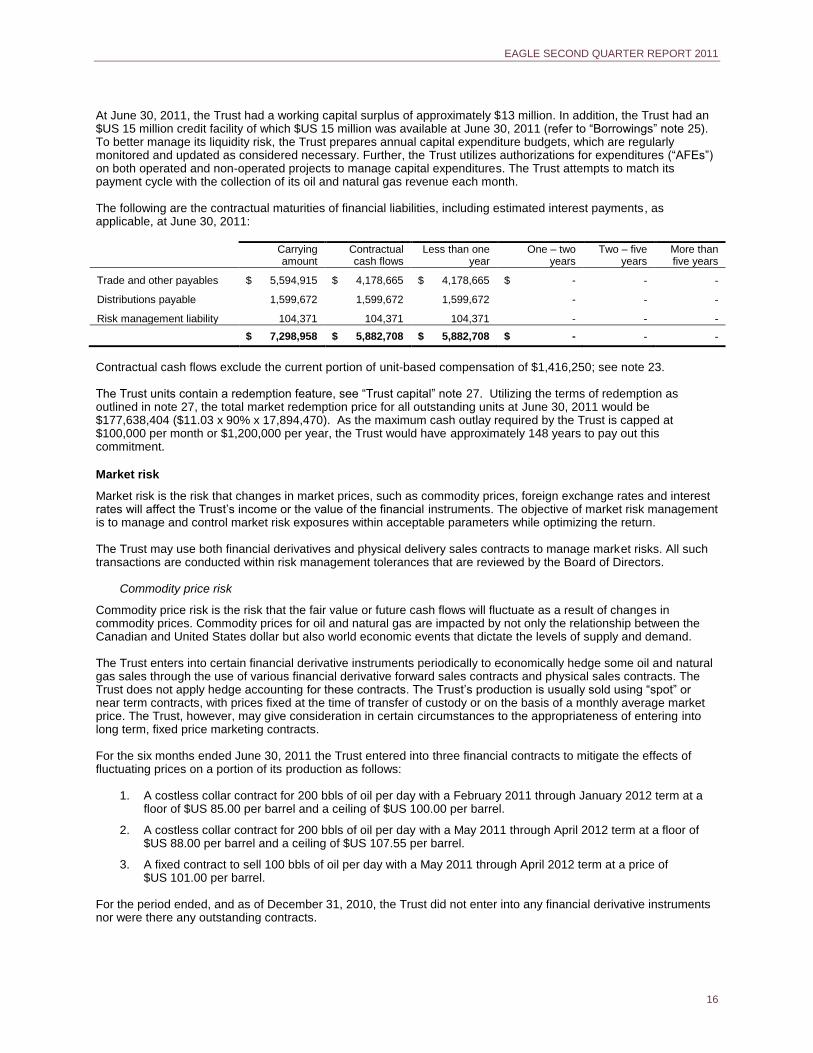
EAGLE SECOND QUARTER REPORT 2011
16
At June 30, 2011, the Trust had a working capital surplus of approximately $13 million. In addition, the Trust had an $US 15 million credit facility of which $US 15 million was available at June 30, 2011 (refer to “Borrowings” note 25). To better manage its liquidity risk, the Trust prepares annual capital expenditure budgets, which are regularly monitored and updated as considered necessary. Further, the Trust utilizes authorizations for expenditures (“AFEs”) on both operated and non-operated projects to manage capital expenditures. The Trust attempts to match its payment cycle with the collection of its oil and natural gas revenue each month. The following are the contractual maturities of financial liabilities, including estimated interest payments, as applicable, at June 30, 2011:
Carrying amount
Contractual cash flows
Less than one year
One – two years
Two – five years
More than five years
Trade and other payables $ 5,594,915 $ 4,178,665 $ 4,178,665 $ - - -
Distributions payable 1,599,672 1,599,672 1,599,672 - - -
Risk management liability 104,371 104,371 104,371 - - -
$ 7,298,958 $ 5,882,708 $ 5,882,708 $ - - -
Contractual cash flows exclude the current portion of unit-based compensation of $1,416,250; see note 23. The Trust units contain a redemption feature, see “Trust capital” note 27. Utilizing the terms of redemption as outlined in note 27, the total market redemption price for all outstanding units at June 30, 2011 would be $177,638,404 ($11.03 x 90% x 17,894,470). As the maximum cash outlay required by the Trust is capped at $100,000 per month or $1,200,000 per year, the Trust would have approximately 148 years to pay out this commitment.
Market risk
Market risk is the risk that changes in market prices, such as commodity prices, foreign exchange rates and interest rates will affect the Trust’s income or the value of the financial instruments. The objective of market risk management is to manage and control market risk exposures within acceptable parameters while optimizing the return. The Trust may use both financial derivatives and physical delivery sales contracts to manage market risks. All such transactions are conducted within risk management tolerances that are reviewed by the Board of Directors.
Commodity price risk
Commodity price risk is the risk that the fair value or future cash flows will fluctuate as a result of changes in commodity prices. Commodity prices for oil and natural gas are impacted by not only the relationship between the Canadian and United States dollar but also world economic events that dictate the levels of supply and demand. The Trust enters into certain financial derivative instruments periodically to economically hedge some oil and natural gas sales through the use of various financial derivative forward sales contracts and physical sales contracts. The Trust does not apply hedge accounting for these contracts. The Trust’s production is usually sold using “spot” or near term contracts, with prices fixed at the time of transfer of custody or on the basis of a monthly average market price. The Trust, however, may give consideration in certain circumstances to the appropriateness of entering into long term, fixed price marketing contracts. For the six months ended June 30, 2011 the Trust entered into three financial contracts to mitigate the effects of fluctuating prices on a portion of its production as follows:
1. A costless collar contract for 200 bbls of oil per day with a February 2011 through January 2012 term at a floor of $US 85.00 per barrel and a ceiling of $US 100.00 per barrel.
2. A costless collar contract for 200 bbls of oil per day with a May 2011 through April 2012 term at a floor of $US 88.00 per barrel and a ceiling of $US 107.55 per barrel.
3. A fixed contract to sell 100 bbls of oil per day with a May 2011 through April 2012 term at a price of $US 101.00 per barrel.
For the period ended, and as of December 31, 2010, the Trust did not enter into any financial derivative instruments nor were there any outstanding contracts.
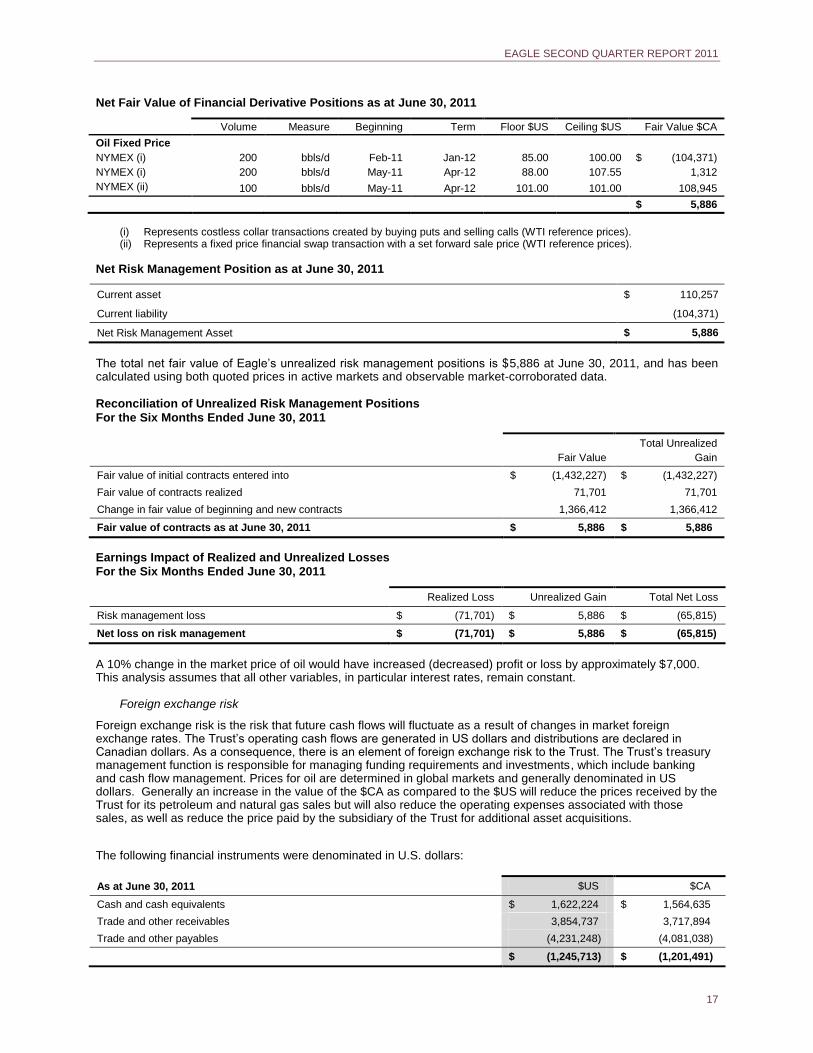
EAGLE SECOND QUARTER REPORT 2011
17
Net Fair Value of Financial Derivative Positions as at June 30, 2011
Volume Measure Beginning Term Floor $US Ceiling $US Fair Value $CA
Oil Fixed Price
NYMEX (i) 200 bbls/d Feb-11 Jan-12 85.00 100.00 $ (104,371)
NYMEX (i) 200 bbls/d May-11 Apr-12 88.00 107.55 1,312
NYMEX (ii) 100 bbls/d May-11 Apr-12 101.00 101.00 108,945
$ 5,886
(i) Represents costless collar transactions created by buying puts and selling calls (WTI reference prices). (ii) Represents a fixed price financial swap transaction with a set forward sale price (WTI reference prices).
Net Risk Management Position as at June 30, 2011
Current asset $ 110,257
Current liability (104,371)
Net Risk Management Asset $ 5,886
The total net fair value of Eagle’s unrealized risk management positions is $5,886 at June 30, 2011, and has been calculated using both quoted prices in active markets and observable market-corroborated data. Reconciliation of Unrealized Risk Management Positions
For the Six Months Ended June 30, 2011
Fair Value
Total Unrealized
Gain
Fair value of initial contracts entered into $ (1,432,227) $ (1,432,227)
Fair value of contracts realized 71,701 71,701
Change in fair value of beginning and new contracts 1,366,412 1,366,412
Fair value of contracts as at June 30, 2011 $ 5,886 $ 5,886
Earnings Impact of Realized and Unrealized Losses
For the Six Months Ended June 30, 2011
Realized Loss Unrealized Gain Total Net Loss
Risk management loss $ (71,701) $ 5,886 $ (65,815)
Net loss on risk management $ (71,701) $ 5,886 $ (65,815)
A 10% change in the market price of oil would have increased (decreased) profit or loss by approximately $7,000. This analysis assumes that all other variables, in particular interest rates, remain constant.
Foreign exchange risk
Foreign exchange risk is the risk that future cash flows will fluctuate as a result of changes in market foreign exchange rates. The Trust’s operating cash flows are generated in US dollars and distributions are declared in Canadian dollars. As a consequence, there is an element of foreign exchange risk to the Trust. The Trust’s treasury management function is responsible for managing funding requirements and investments, which include banking and cash flow management. Prices for oil are determined in global markets and generally denominated in US dollars. Generally an increase in the value of the $CA as compared to the $US will reduce the prices received by the Trust for its petroleum and natural gas sales but will also reduce the operating expenses associated with those sales, as well as reduce the price paid by the subsidiary of the Trust for additional asset acquisitions.
The following financial instruments were denominated in U.S. dollars:
As at June 30, 2011 $US $CA
Cash and cash equivalents $ 1,622,224 $ 1,564,635
Trade and other receivables 3,854,737 3,717,894
Trade and other payables (4,231,248) (4,081,038)
$ (1,245,713) $ (1,201,491)
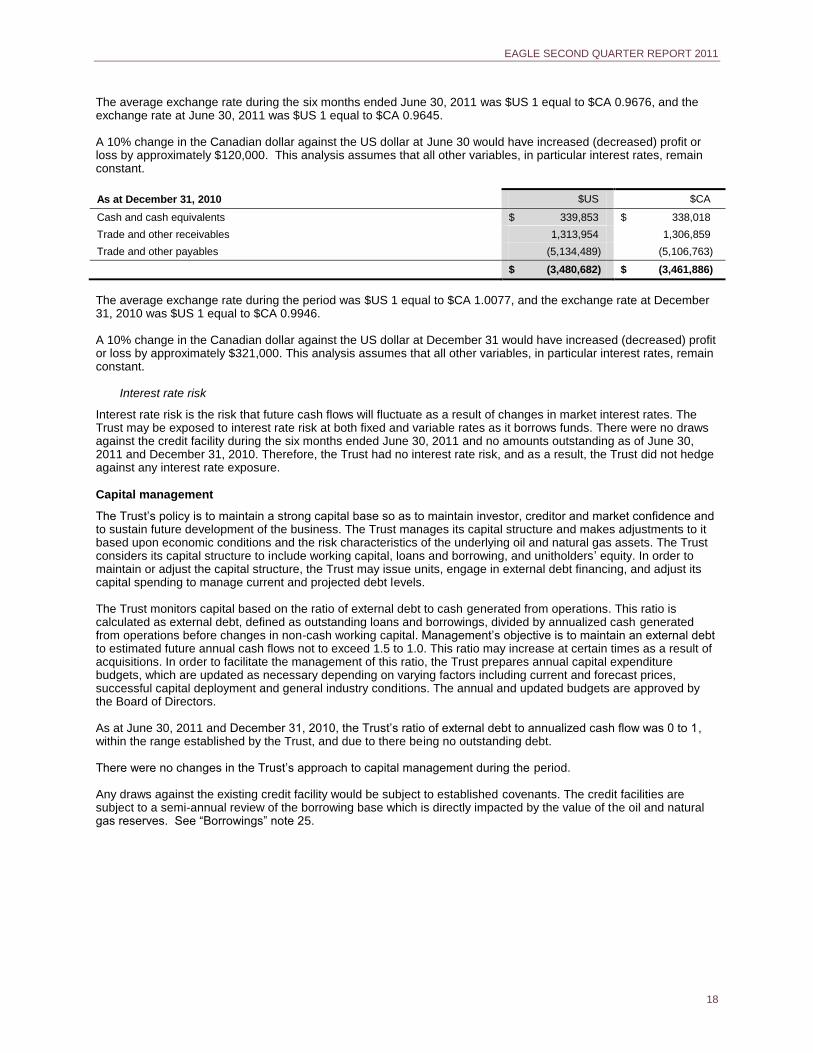
EAGLE SECOND QUARTER REPORT 2011
18
The average exchange rate during the six months ended June 30, 2011 was $US 1 equal to $CA 0.9676, and the exchange rate at June 30, 2011 was $US 1 equal to $CA 0.9645. A 10% change in the Canadian dollar against the US dollar at June 30 would have increased (decreased) profit or loss by approximately $120,000. This analysis assumes that all other variables, in particular interest rates, remain constant.
As at December 31, 2010 $US $CA
Cash and cash equivalents $ 339,853 $ 338,018
Trade and other receivables 1,313,954 1,306,859
Trade and other payables (5,134,489) (5,106,763)
$ (3,480,682) $ (3,461,886)
The average exchange rate during the period was $US 1 equal to $CA 1.0077, and the exchange rate at December 31, 2010 was $US 1 equal to $CA 0.9946. A 10% change in the Canadian dollar against the US dollar at December 31 would have increased (decreased) profit or loss by approximately $321,000. This analysis assumes that all other variables, in particular interest rates, remain constant.
Interest rate risk
Interest rate risk is the risk that future cash flows will fluctuate as a result of changes in market interest rates. The Trust may be exposed to interest rate risk at both fixed and variable rates as it borrows funds. There were no draws against the credit facility during the six months ended June 30, 2011 and no amounts outstanding as of June 30, 2011 and December 31, 2010. Therefore, the Trust had no interest rate risk, and as a result, the Trust did not hedge against any interest rate exposure. Capital management
The Trust’s policy is to maintain a strong capital base so as to maintain investor, creditor and market confidence and to sustain future development of the business. The Trust manages its capital structure and makes adjustments to it based upon economic conditions and the risk characteristics of the underlying oil and natural gas assets. The Trust considers its capital structure to include working capital, loans and borrowing, and unitholders’ equity. In order to maintain or adjust the capital structure, the Trust may issue units, engage in external debt financing, and adjust its capital spending to manage current and projected debt levels. The Trust monitors capital based on the ratio of external debt to cash generated from operations. This ratio is calculated as external debt, defined as outstanding loans and borrowings, divided by annualized cash generated from operations before changes in non-cash working capital. Management’s objective is to maintain an external debt to estimated future annual cash flows not to exceed 1.5 to 1.0. This ratio may increase at certain times as a result of acquisitions. In order to facilitate the management of this ratio, the Trust prepares annual capital expenditure budgets, which are updated as necessary depending on varying factors including current and forecast prices, successful capital deployment and general industry conditions. The annual and updated budgets are approved by the Board of Directors. As at June 30, 2011 and December 31, 2010, the Trust’s ratio of external debt to annualized cash flow was 0 to 1, within the range established by the Trust, and due to there being no outstanding debt. There were no changes in the Trust’s approach to capital management during the period. Any draws against the existing credit facility would be subject to established covenants. The credit facilities are subject to a semi-annual review of the borrowing base which is directly impacted by the value of the oil and natural gas reserves. See “Borrowings” note 25.
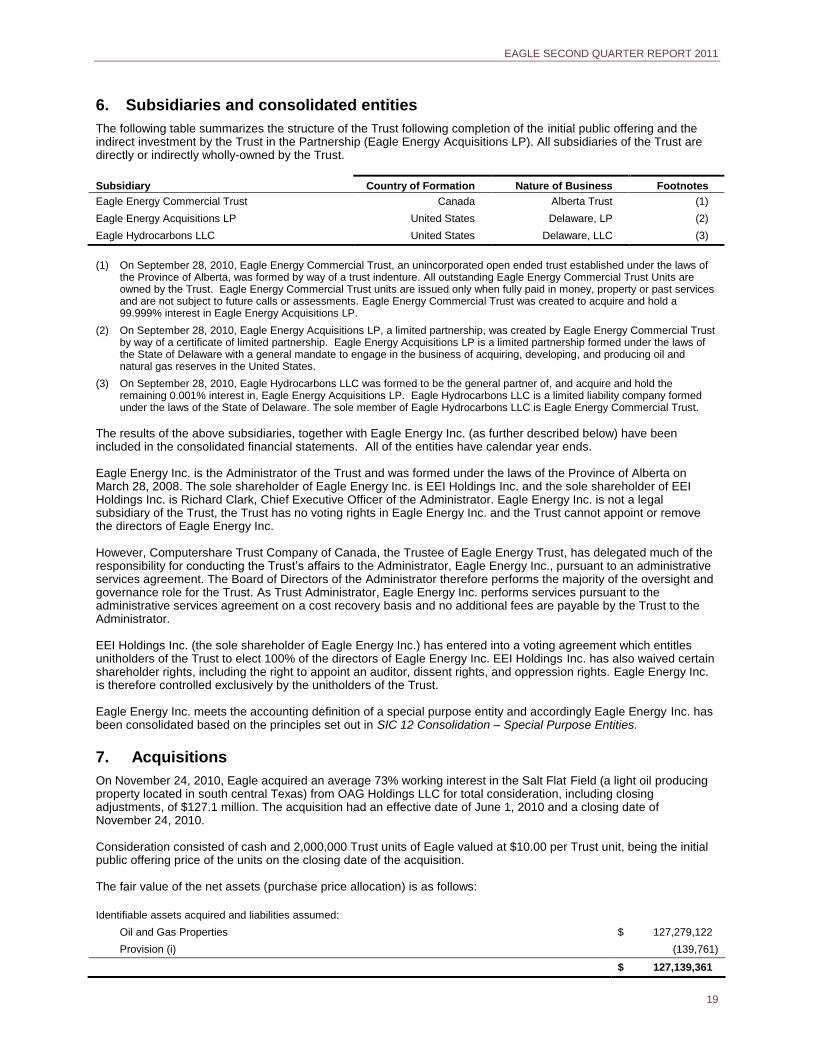
EAGLE SECOND QUARTER REPORT 2011
19
6. Subsidiaries and consolidated entities
The following table summarizes the structure of the Trust following completion of the initial public offering and the indirect investment by the Trust in the Partnership (Eagle Energy Acquisitions LP). All subsidiaries of the Trust are directly or indirectly wholly-owned by the Trust.
Subsidiary Country of Formation Nature of Business Footnotes
Eagle Energy Commercial Trust Canada Alberta Trust (1)
Eagle Energy Acquisitions LP United States Delaware, LP (2)
Eagle Hydrocarbons LLC United States Delaware, LLC (3)
(1) On September 28, 2010, Eagle Energy Commercial Trust, an unincorporated open ended trust established under the laws of
the Province of Alberta, was formed by way of a trust indenture. All outstanding Eagle Energy Commercial Trust Units are owned by the Trust. Eagle Energy Commercial Trust units are issued only when fully paid in money, property or past services and are not subject to future calls or assessments. Eagle Energy Commercial Trust was created to acquire and hold a 99.999% interest in Eagle Energy Acquisitions LP.
(2) On September 28, 2010, Eagle Energy Acquisitions LP, a limited partnership, was created by Eagle Energy Commercial Trust by way of a certificate of limited partnership. Eagle Energy Acquisitions LP is a limited partnership formed under the laws of the State of Delaware with a general mandate to engage in the business of acquiring, developing, and producing oil and natural gas reserves in the United States.
(3) On September 28, 2010, Eagle Hydrocarbons LLC was formed to be the general partner of, and acquire and hold the remaining 0.001% interest in, Eagle Energy Acquisitions LP. Eagle Hydrocarbons LLC is a limited liability company formed under the laws of the State of Delaware. The sole member of Eagle Hydrocarbons LLC is Eagle Energy Commercial Trust.
The results of the above subsidiaries, together with Eagle Energy Inc. (as further described below) have been included in the consolidated financial statements. All of the entities have calendar year ends. Eagle Energy Inc. is the Administrator of the Trust and was formed under the laws of the Province of Alberta on March 28, 2008. The sole shareholder of Eagle Energy Inc. is EEI Holdings Inc. and the sole shareholder of EEI Holdings Inc. is Richard Clark, Chief Executive Officer of the Administrator. Eagle Energy Inc. is not a legal subsidiary of the Trust, the Trust has no voting rights in Eagle Energy Inc. and the Trust cannot appoint or remove the directors of Eagle Energy Inc. However, Computershare Trust Company of Canada, the Trustee of Eagle Energy Trust, has delegated much of the responsibility for conducting the Trust’s affairs to the Administrator, Eagle Energy Inc., pursuant to an administrative services agreement. The Board of Directors of the Administrator therefore performs the majority of the oversight and governance role for the Trust. As Trust Administrator, Eagle Energy Inc. performs services pursuant to the administrative services agreement on a cost recovery basis and no additional fees are payable by the Trust to the Administrator. EEI Holdings Inc. (the sole shareholder of Eagle Energy Inc.) has entered into a voting agreement which entitles unitholders of the Trust to elect 100% of the directors of Eagle Energy Inc. EEI Holdings Inc. has also waived certain shareholder rights, including the right to appoint an auditor, dissent rights, and oppression rights. Eagle Energy Inc. is therefore controlled exclusively by the unitholders of the Trust. Eagle Energy Inc. meets the accounting definition of a special purpose entity and accordingly Eagle Energy Inc. has been consolidated based on the principles set out in SIC 12 Consolidation – Special Purpose Entities.
7. Acquisitions
On November 24, 2010, Eagle acquired an average 73% working interest in the Salt Flat Field (a light oil producing property located in south central Texas) from OAG Holdings LLC for total consideration, including closing adjustments, of $127.1 million. The acquisition had an effective date of June 1, 2010 and a closing date of November 24, 2010. Consideration consisted of cash and 2,000,000 Trust units of Eagle valued at $10.00 per Trust unit, being the initial public offering price of the units on the closing date of the acquisition. The fair value of the net assets (purchase price allocation) is as follows:
Identifiable assets acquired and liabilities assumed:
Oil and Gas Properties $ 127,279,122
Provision (i) (139,761)
$ 127,139,361
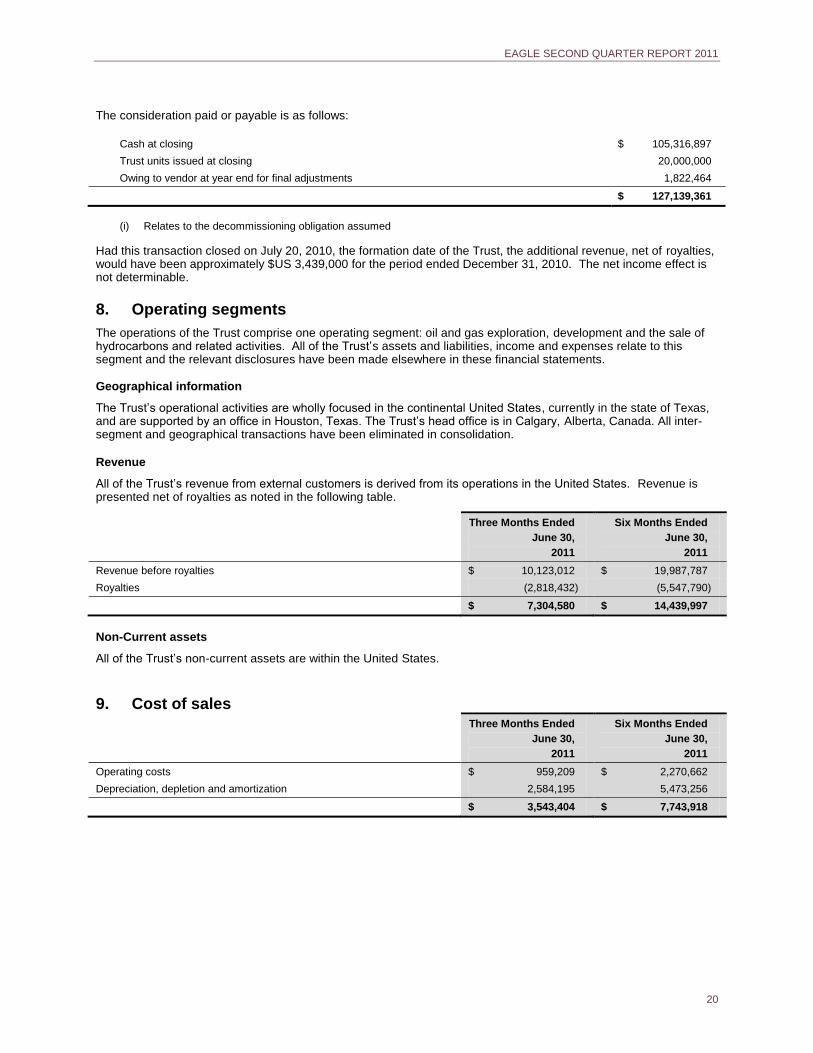
EAGLE SECOND QUARTER REPORT 2011
20
The consideration paid or payable is as follows:
Cash at closing $ 105,316,897
Trust units issued at closing 20,000,000
Owing to vendor at year end for final adjustments 1,822,464
$ 127,139,361
(i) Relates to the decommissioning obligation assumed
Had this transaction closed on July 20, 2010, the formation date of the Trust, the additional revenue, net of royalties, would have been approximately $US 3,439,000 for the period ended December 31, 2010. The net income effect is not determinable.
8. Operating segments
The operations of the Trust comprise one operating segment: oil and gas exploration, development and the sale of hydrocarbons and related activities. All of the Trust’s assets and liabilities, income and expenses relate to this segment and the relevant disclosures have been made elsewhere in these financial statements. Geographical information
The Trust’s operational activities are wholly focused in the continental United States, currently in the state of Texas, and are supported by an office in Houston, Texas. The Trust’s head office is in Calgary, Alberta, Canada. All inter-segment and geographical transactions have been eliminated in consolidation.
Revenue
All of the Trust’s revenue from external customers is derived from its operations in the United States. Revenue is presented net of royalties as noted in the following table.
Three Months Ended
June 30,
2011
Six Months Ended
June 30,
2011
Revenue before royalties $ 10,123,012 $ 19,987,787
Royalties (2,818,432) (5,547,790)
$ 7,304,580 $ 14,439,997
Non-Current assets
All of the Trust’s non-current assets are within the United States.
9. Cost of sales Three Months Ended
June 30,
2011
Six Months Ended
June 30,
2011
Operating costs $ 959,209 $ 2,270,662
Depreciation, depletion and amortization 2,584,195 5,473,256
$ 3,543,404 $ 7,743,918
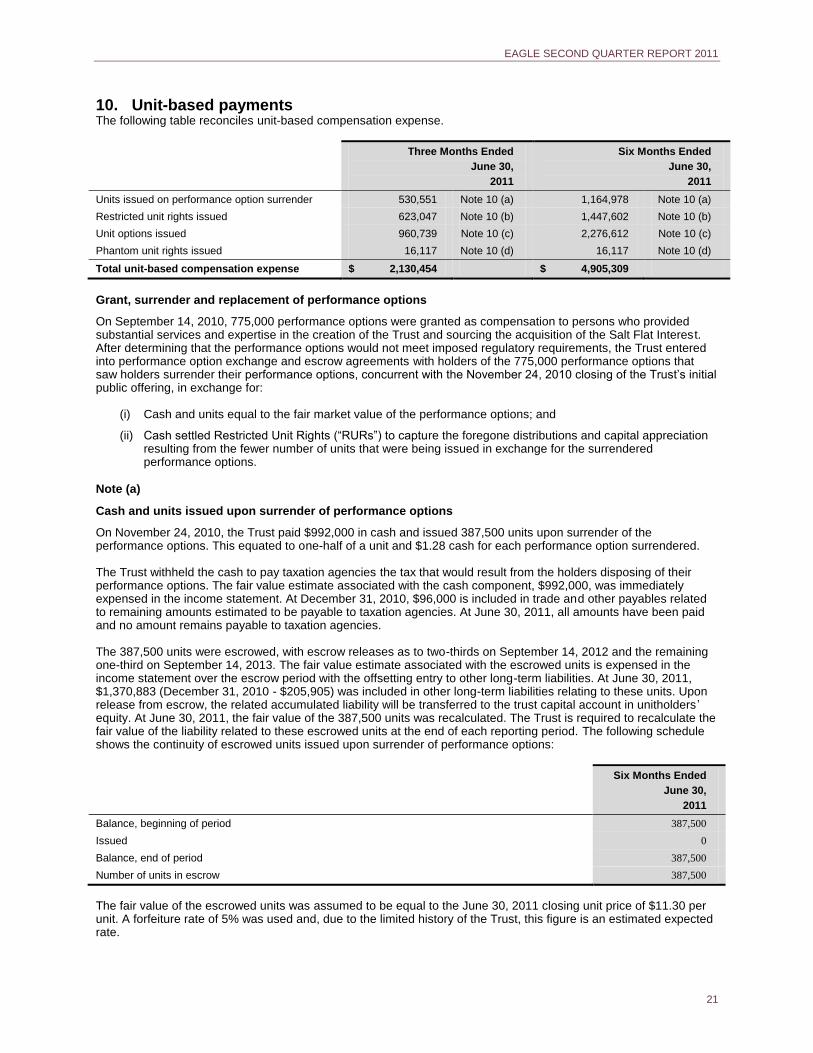
EAGLE SECOND QUARTER REPORT 2011
21
10. Unit-based payments The following table reconciles unit-based compensation expense.
Three Months Ended
June 30,
2011
Six Months Ended
June 30,
2011
Units issued on performance option surrender 530,551 Note 10 (a) 1,164,978 Note 10 (a)
Restricted unit rights issued 623,047 Note 10 (b) 1,447,602 Note 10 (b)
Unit options issued 960,739 Note 10 (c) 2,276,612 Note 10 (c)
Phantom unit rights issued 16,117 Note 10 (d) 16,117 Note 10 (d)
Total unit-based compensation expense $ 2,130,454 $ 4,905,309
Grant, surrender and replacement of performance options
On September 14, 2010, 775,000 performance options were granted as compensation to persons who provided substantial services and expertise in the creation of the Trust and sourcing the acquisition of the Salt Flat Interest. After determining that the performance options would not meet imposed regulatory requirements, the Trust entered into performance option exchange and escrow agreements with holders of the 775,000 performance options that saw holders surrender their performance options, concurrent with the November 24, 2010 closing of the Trust’s initial public offering, in exchange for:
(i) Cash and units equal to the fair market value of the performance options; and
(ii) Cash settled Restricted Unit Rights (“RURs”) to capture the foregone distributions and capital appreciation resulting from the fewer number of units that were being issued in exchange for the surrendered performance options.
Note (a)
Cash and units issued upon surrender of performance options
On November 24, 2010, the Trust paid $992,000 in cash and issued 387,500 units upon surrender of the performance options. This equated to one-half of a unit and $1.28 cash for each performance option surrendered. The Trust withheld the cash to pay taxation agencies the tax that would result from the holders disposing of their performance options. The fair value estimate associated with the cash component, $992,000, was immediately expensed in the income statement. At December 31, 2010, $96,000 is included in trade and other payables related to remaining amounts estimated to be payable to taxation agencies. At June 30, 2011, all amounts have been paid and no amount remains payable to taxation agencies. The 387,500 units were escrowed, with escrow releases as to two-thirds on September 14, 2012 and the remaining one-third on September 14, 2013. The fair value estimate associated with the escrowed units is expensed in the income statement over the escrow period with the offsetting entry to other long-term liabilities. At June 30, 2011, $1,370,883 (December 31, 2010 - $205,905) was included in other long-term liabilities relating to these units. Upon release from escrow, the related accumulated liability will be transferred to the trust capital account in unitholders ’ equity. At June 30, 2011, the fair value of the 387,500 units was recalculated. The Trust is required to recalculate the fair value of the liability related to these escrowed units at the end of each reporting period. The following schedule shows the continuity of escrowed units issued upon surrender of performance options:
Six Months Ended
June 30,
2011
Balance, beginning of period 387,500
Issued 0
Balance, end of period 387,500
Number of units in escrow 387,500
The fair value of the escrowed units was assumed to be equal to the June 30, 2011 closing unit price of $11.30 per unit. A forfeiture rate of 5% was used and, due to the limited history of the Trust, this figure is an estimated expected rate.
EAGLE SECOND QUARTER REPORT 2011
22
Note (b)
Cash settled RURs issued upon surrender of performance options
The Trust issued 775,000 RURs, which equated to one RUR for each performance option. Each RUR entitles the holder to receive cash payments equal to the distributions payable on one unit as well as capital appreciation of units. RURs vest as to two-thirds on September 14, 2012 and the remaining one-third on September 14, 2013. Until vested, RUR payments will be accrued for the benefit of the holders. Holders of the RURs are entitled to receive a cash payment equal to accrued distributions and capital appreciation, once the RURs vest. The fair value estimate associated with the RURs is expensed in the income statement over the vesting period with the offsetting entry to other long-term liabilities. At June 30, 2011, $1,611,091 (December 31, 2010 - $163,489) was included in other long term liabilities relating to these RURs. At June 30, 2011, the fair value of the 775,000 RURs was recalculated. The Trust is required to recalculate the fair value of the liability at the end of each reporting period. The following schedule shows the continuity of cash settled RURs issued upon surrender of performance options:
Six Months Ended
June 30,
2011
Balance, beginning of period 775,000
Issued 0
Balance, end of period 775,000
Number of restricted unit rights vested nil
The Black-Scholes valuation model is used to determine the fair value of the RURs issued by the Trust. Given the limited trading history of the Trust, which commenced trading on November 24, 2010, a representative sample of peer group entities was used in order to determine expected unit price volatility. The fair value of the RURs was estimated using the following weighted average inputs:
June 30, 2011
Fair value at the balance sheet date $ 6.64
Volatility 33%
Life of restricted unit rights 9.5 years
Risk-free interest rate 3.0%
A forfeiture rate of 5% was used and, due to the limited history of the Trust, this figure is an estimated expected rate. Note (c)
Unit option plan
The Trust has an option plan that entitles directors, officers, employees and certain consultants to purchase units of the Trust. The purpose of the option plan is to aid in attracting, retaining and motivating eligible employees and other service providers by enabling such persons to participate in the growth and development of the Trust. Options are granted at a price equal to the fair market value of the units at the time of grant. The option exercise price is reduced by the amount of distributions paid on the units subsequent to the date of grant, subject to certain conditions specified by the option plan. The options have a 10 year term and vest as to one-third on each of the first, second and third anniversaries of the date of grant. Options granted are not subject to any performance criteria apart from, in respect of directors and employees and certain consultants, their continued service with or employment by the Trust. Options are forfeited if the option holder leaves before the options vest.
EAGLE SECOND QUARTER REPORT 2011
23
The number and weighted average exercise prices of unit options are as follows:
Six Months Ended June 30, 2011
Number
of
options
Weighted
average
exercise
price
Outstanding, beginning of period 1,300,000 $ 9.46
Forfeited during the period - -
Exercised during the period - -
Granted during the period 42,500 10.56
Outstanding at end of period 1,342,500 $ 9.50
Exercisable at end of period - $ -
The range of exercise prices of the outstanding options is as follows:
Weighted
average
exercise
price
Weighted
average
contractual
life (years)
$9.46 - $10.56 $ 9.50 9.4
No unit options were exercised during the period. The fair value of the options was estimated using the Black-Scholes model with the following weighted average inputs:
June 30, 2011
Fair value at the balance sheet date $ 5.62
Unit price $ 11.30
Exercise price $ 9.50
Volatility 33%
Option life 9.4 years
Distributions – none estimated, due to declining strike price feature 0%
Risk-free interest rate 3.0%
A forfeiture rate of 5 % was used and due to the limited history of the Trust, this figure is an estimated expected rate. This estimate will be adjusted to the actual forfeiture rate. The fair value estimate associated with the options is expensed in the income statement over the vesting period with the offsetting entry to either trade and other payables or other long-term liabilities. At June 30, 2011, $1,407,459
(December 31, 2010 - $165,670) was included in trade and other payables and $1,172,882 (December 31, 2010 - $138,059) was included in other long-term liabilities relating to this option plan. At June 30, 2011, the fair value of the options was recalculated. The Trust is required to recalculate the fair value of the liability at the end of each reporting period. The closing trading price of the Trust’s units at June 30, 2011 was $11.30 per unit.
Note (d)
Phantom unit rights plan
Effective June 14, 2011, the Trust implemented a cash settled Phantom Unit Rights (“PURs”) plan that entitles United States based directors, officers, employees and certain consultants of Eagle Hydrocarbons LLC (an indirectly held wholly owned subsidiary of the Trust) to participate.
EAGLE SECOND QUARTER REPORT 2011
24
The purpose of the plan is to provide incentive bonus compensation based on the appreciation in value of the units of the Trust and distributions payable in respect of units the Trust until the termination date thereby rewarding efforts in the year of grant and providing additional incentive for continued efforts in promoting the growth and success of the Trust and its affiliates, as well as assisting Eagle Hydrocarbons LLC in attracting and retaining management personnel. The PURs have a 10 year term and vest as to one-third on each of the first, second and third anniversaries of the date of grant. PURs granted are not subject to any performance criteria apart from, in respect of directors and employees and certain consultants, their continued service or employment. PURs are forfeited if the holder leaves before vesting. Until vested, PUR payments will be accrued for the benefit of the holders. Holders of the PURs are entitled to receive cash payments on a calendar year basis once the PURs vest. A present value factor is applied to the amount otherwise payable to the holder of the phantom unit rights to account for the fact that Phantom Unit Rights holders receive their payments earlier than a regular option holder who holds their option to the full term otherwise would. The fair value estimate associated with the PURs is expensed in the income statement over the vesting period with the offsetting entry to either trade and other payables or other long-term liabilities. At June 30, 2011, $8,791
(December 31, 2010 - $nil) was included in trade and other payables and $7,326 (December 31, 2010 - $nil) was included in other long-term liabilities relating to this PUR plan. At June 30, 2011, the fair value of the PURs was initially calculated and the Trust will be required to recalculate the fair value of the liability at the end of each reporting period. The following schedule shows the continuity of cash settled PURs issued:
Six Months Ended
June 30,
2011
Balance, beginning of period 0
Issued 80,000
Balance, end of period 80,000
Number of phantom unit rights vested nil
The Black-Scholes valuation model is used to determine the fair value of the PURs issued by the Trust. Given the limited trading history of the Trust, which commenced trading on November 24, 2010, a representative sample of peer group entities was used in order to determine expected unit price volatility. The fair value of the PURs was estimated using the following weighted average inputs:
June 30, 2011
Fair value at the balance sheet date $ 5.52
Volatility 33%
Life of restricted unit rights 9.6 years
Risk-free interest rate 3.0%
A forfeiture rate of 5% was used and, due to the limited history of the Trust, this figure is an estimated expected rate.
11. Foreign exchange
The Trust has recognized the following in the profit or loss on account of foreign currency fluctuations:
Three Months Ended
June 30,
2011
Six Months Ended
June 30,
2011
Net gain arising on settlement of foreign currency transactions arising out
of operating activities
$ 100,195 $ 618,541
The Trust has recognized the following in unitholders’ equity due to the translation of its US subsidiary, which has a US dollar functional currency, to the presentation currency of the Trust, being the Canadian dollar, for financial statement presentation:
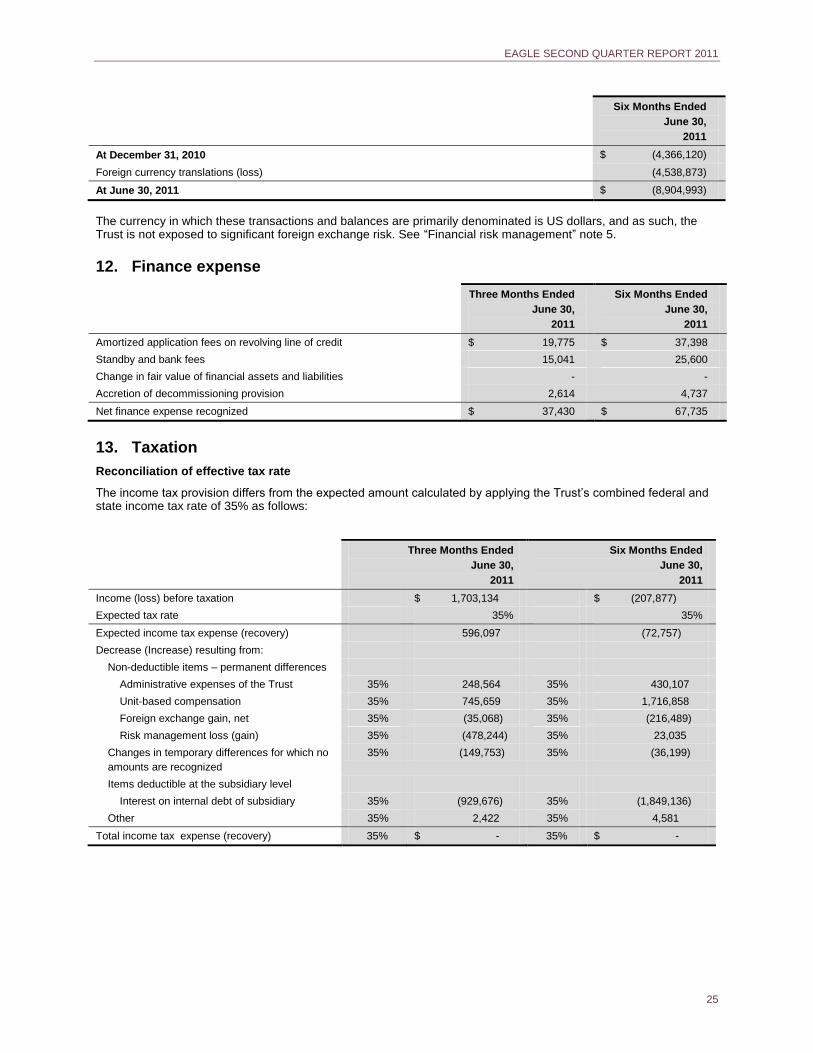
EAGLE SECOND QUARTER REPORT 2011
25
Six Months Ended
June 30,
2011
At December 31, 2010 $ (4,366,120)
Foreign currency translations (loss) (4,538,873)
At June 30, 2011 $ (8,904,993)
The currency in which these transactions and balances are primarily denominated is US dollars, and as such, the Trust is not exposed to significant foreign exchange risk. See “Financial risk management” note 5.
12. Finance expense
Three Months Ended
June 30,
2011
Six Months Ended
June 30,
2011
Amortized application fees on revolving line of credit $ 19,775 $ 37,398
Standby and bank fees 15,041 25,600
Change in fair value of financial assets and liabilities - -
Accretion of decommissioning provision 2,614 4,737
Net finance expense recognized $ 37,430 $ 67,735
13. Taxation
Reconciliation of effective tax rate
The income tax provision differs from the expected amount calculated by applying the Trust’s combined federal and state income tax rate of 35% as follows:
Three Months Ended
June 30,
2011
Six Months Ended
June 30,
2011
Income (loss) before taxation $ 1,703,134 $ (207,877)
Expected tax rate 35% 35%
Expected income tax expense (recovery) 596,097 (72,757)
Decrease (Increase) resulting from:
Non-deductible items – permanent differences
Administrative expenses of the Trust 35% 248,564 35% 430,107
Unit-based compensation 35% 745,659 35% 1,716,858
Foreign exchange gain, net 35% (35,068) 35% (216,489)
Risk management loss (gain) 35% (478,244) 35% 23,035
Changes in temporary differences for which no
amounts are recognized
35% (149,753) 35% (36,199)
Items deductible at the subsidiary level
Interest on internal debt of subsidiary 35% (929,676) 35% (1,849,136)
Other 35% 2,422 35% 4,581
Total income tax expense (recovery) 35% $ - 35% $ -
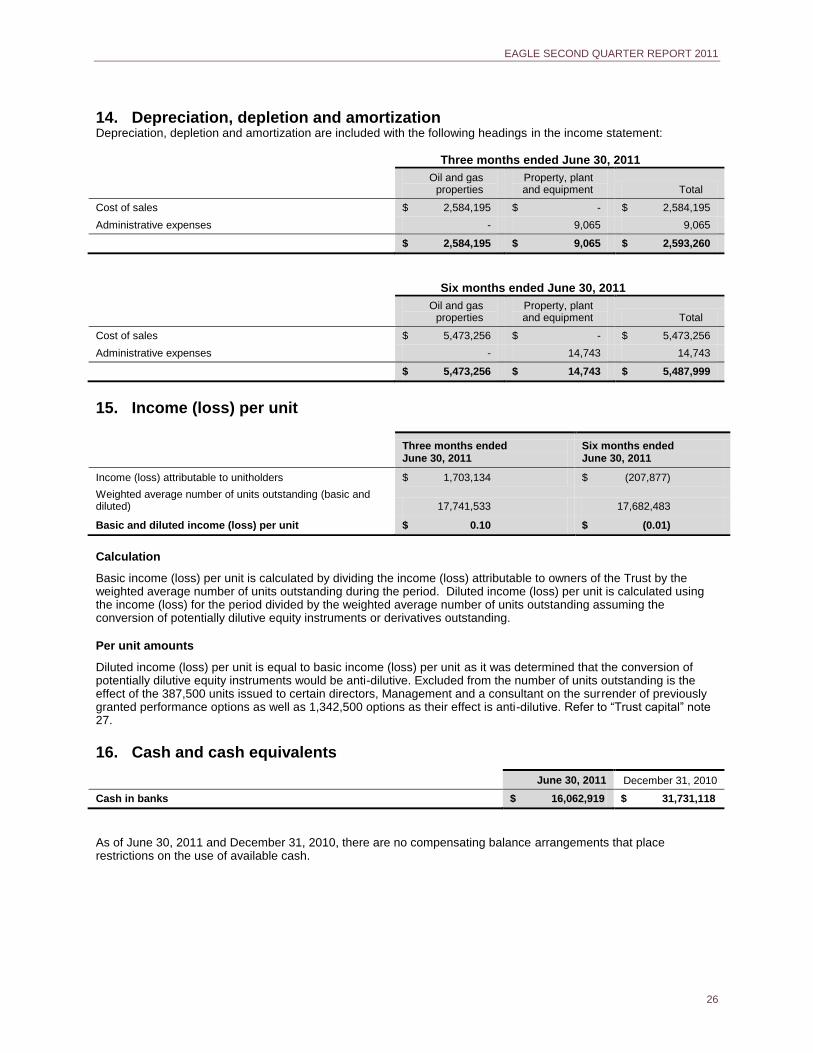
EAGLE SECOND QUARTER REPORT 2011
26
14. Depreciation, depletion and amortization Depreciation, depletion and amortization are included with the following headings in the income statement: Three months ended June 30, 2011
Oil and gas properties
Property, plant and equipment Total
Cost of sales $ 2,584,195 $ - $ 2,584,195
Administrative expenses - 9,065 9,065
$ 2,584,195 $ 9,065 $ 2,593,260
Six months ended June 30, 2011
Oil and gas properties
Property, plant and equipment Total
Cost of sales $ 5,473,256 $ - $ 5,473,256
Administrative expenses - 14,743 14,743
$ 5,473,256 $ 14,743 $ 5,487,999
15. Income (loss) per unit
Calculation
Basic income (loss) per unit is calculated by dividing the income (loss) attributable to owners of the Trust by the weighted average number of units outstanding during the period. Diluted income (loss) per unit is calculated using the income (loss) for the period divided by the weighted average number of units outstanding assuming the conversion of potentially dilutive equity instruments or derivatives outstanding.
Per unit amounts
Diluted income (loss) per unit is equal to basic income (loss) per unit as it was determined that the conversion of potentially dilutive equity instruments would be anti-dilutive. Excluded from the number of units outstanding is the effect of the 387,500 units issued to certain directors, Management and a consultant on the surrender of previously granted performance options as well as 1,342,500 options as their effect is anti-dilutive. Refer to “Trust capital” note 27.
16. Cash and cash equivalents
June 30, 2011 December 31, 2010
Cash in banks $ 16,062,919 $ 31,731,118
As of June 30, 2011 and December 31, 2010, there are no compensating balance arrangements that place restrictions on the use of available cash.
Three months ended June 30, 2011
Six months ended June 30, 2011
Income (loss) attributable to unitholders $ 1,703,134 $ (207,877)
Weighted average number of units outstanding (basic and diluted) 17,741,533 17,682,483
Basic and diluted income (loss) per unit $ 0.10 $ (0.01)
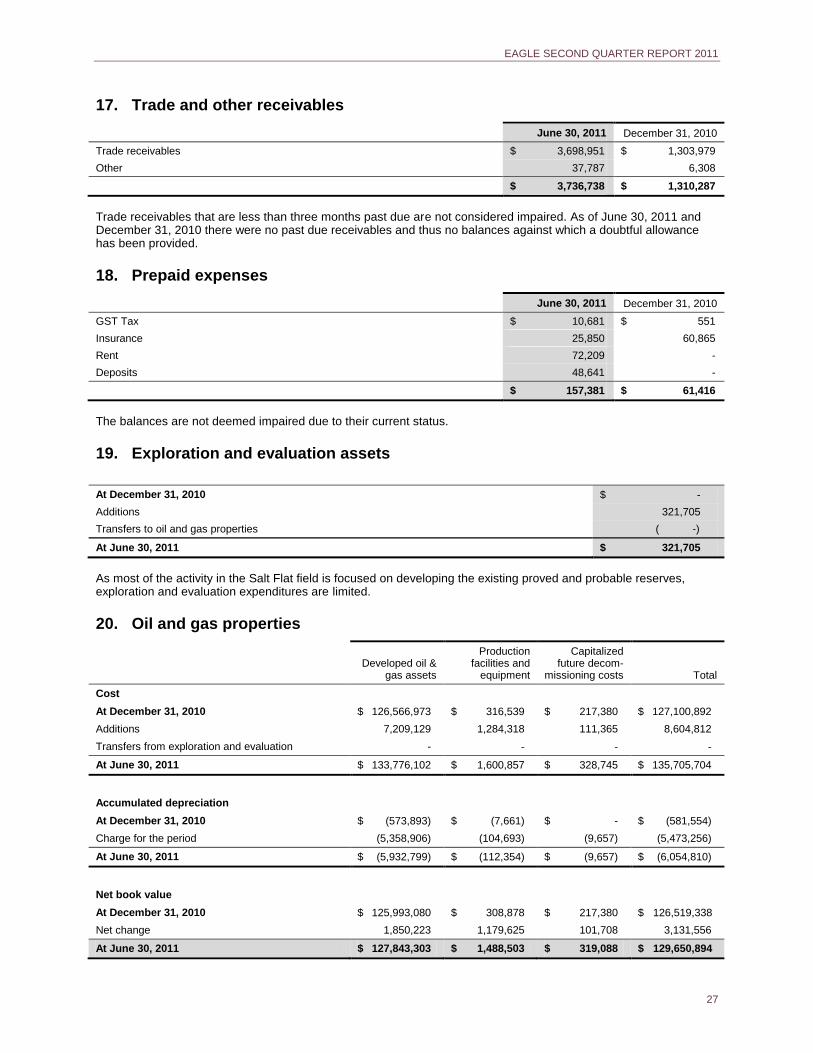
EAGLE SECOND QUARTER REPORT 2011
27
17. Trade and other receivables
June 30, 2011 December 31, 2010
Trade receivables $ 3,698,951 $ 1,303,979
Other 37,787 6,308
$ 3,736,738 $ 1,310,287
Trade receivables that are less than three months past due are not considered impaired. As of June 30, 2011 and December 31, 2010 there were no past due receivables and thus no balances against which a doubtful allowance has been provided.
18. Prepaid expenses
June 30, 2011 December 31, 2010
GST Tax $ 10,681 $ 551
Insurance 25,850 60,865
Rent 72,209 -
Deposits 48,641 -
$ 157,381 $ 61,416
The balances are not deemed impaired due to their current status.
19. Exploration and evaluation assets
At December 31, 2010 $ -
Additions 321,705
Transfers to oil and gas properties ( -)
At June 30, 2011 $ 321,705
As most of the activity in the Salt Flat field is focused on developing the existing proved and probable reserves, exploration and evaluation expenditures are limited.
20. Oil and gas properties
Developed oil &
gas assets
Production facilities and
equipment
Capitalized future decom-
missioning costs Total
Cost
At December 31, 2010 $ 126,566,973 $ 316,539 $ 217,380 $ 127,100,892
Additions 7,209,129 1,284,318 111,365 8,604,812
Transfers from exploration and evaluation - - - -
At June 30, 2011 $ 133,776,102 $ 1,600,857 $ 328,745 $ 135,705,704
Accumulated depreciation
At December 31, 2010 $ (573,893) $ (7,661) $ - $ (581,554)
Charge for the period (5,358,906) (104,693) (9,657) (5,473,256)
At June 30, 2011 $ (5,932,799) $ (112,354) $ (9,657) $ (6,054,810)
Net book value
At December 31, 2010 $ 125,993,080 $ 308,878 $ 217,380 $ 126,519,338
Net change 1,850,223 1,179,625 101,708 3,131,556
At June 30, 2011 $ 127,843,303 $ 1,488,503 $ 319,088 $ 129,650,894
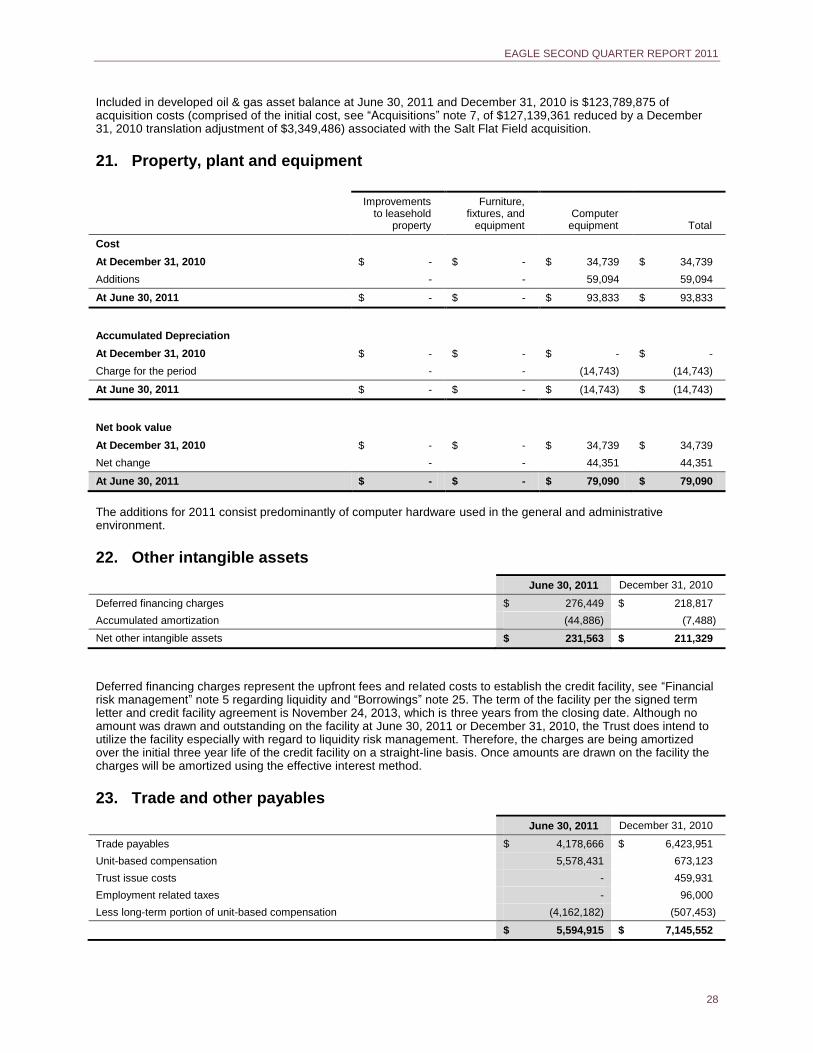
EAGLE SECOND QUARTER REPORT 2011
28
Included in developed oil & gas asset balance at June 30, 2011 and December 31, 2010 is $123,789,875 of acquisition costs (comprised of the initial cost, see “Acquisitions” note 7, of $127,139,361 reduced by a December 31, 2010 translation adjustment of $3,349,486) associated with the Salt Flat Field acquisition.
21. Property, plant and equipment
Improvements to leasehold
property
Furniture, fixtures, and
equipment Computer
equipment Total
Cost
At December 31, 2010 $ - $ - $ 34,739 $ 34,739
Additions - - 59,094 59,094
At June 30, 2011 $ - $ - $ 93,833 $ 93,833
Accumulated Depreciation
At December 31, 2010 $ - $ - $ - $ -
Charge for the period - - (14,743) (14,743)
At June 30, 2011 $ - $ - $ (14,743) $ (14,743)
Net book value
At December 31, 2010 $ - $ - $ 34,739 $ 34,739
Net change - - 44,351 44,351
At June 30, 2011 $ - $ - $ 79,090 $ 79,090
The additions for 2011 consist predominantly of computer hardware used in the general and administrative environment.
22. Other intangible assets
June 30, 2011 December 31, 2010
Deferred financing charges $ 276,449 $ 218,817
Accumulated amortization (44,886) (7,488)
Net other intangible assets $ 231,563 $ 211,329
Deferred financing charges represent the upfront fees and related costs to establish the credit facility, see “Financial risk management” note 5 regarding liquidity and “Borrowings” note 25. The term of the facility per the signed term letter and credit facility agreement is November 24, 2013, which is three years from the closing date. Although no amount was drawn and outstanding on the facility at June 30, 2011 or December 31, 2010, the Trust does intend to utilize the facility especially with regard to liquidity risk management. Therefore, the charges are being amortized over the initial three year life of the credit facility on a straight-line basis. Once amounts are drawn on the facility the charges will be amortized using the effective interest method.
23. Trade and other payables
June 30, 2011 December 31, 2010
Trade payables $ 4,178,666 $ 6,423,951
Unit-based compensation 5,578,431 673,123
Trust issue costs - 459,931
Employment related taxes - 96,000
Less long-term portion of unit-based compensation (4,162,182) (507,453)
$ 5,594,915 $ 7,145,552
EAGLE SECOND QUARTER REPORT 2011
29
Unit-based compensation liability includes both a current and long-term portion. The long-term portion of $4,162,182 and $507,453 is reflected in the balance sheet category “Other long term liabilities”. Refer to “Unit-based payments” note 10.
24. Distributions payable
June 30, 2011 December 31, 2010 Cumulative
Beginning balance $ 1,916,432 $ - $ -
Distributions declared 9,503,225 1,916,432 11,419,657
Less distribution paid (9,819,985) - (9,819,985)
Outstanding distributions declared and payable $ 1,599,672 $ 1,916,432 $ 1,599,672
Distributions are declared and paid monthly. The outstanding balance at June 30, 2011 represents the distribution declared June 15, 2011 that is to be paid July 22, 2011.
25. Borrowings
On November 24, 2010, Eagle Energy Acquisitions LP entered into a credit facility with a U.S. affiliate of a Canadian chartered bank. The credit facility is a $US 150 million three year senior secured revolving facility and had an initial borrowing base set at $US 8 million. Effective May 12, 2011, the borrowing base under the credit facility was increased to $US 15 million. The credit facility provides for a semi-annual evaluation the next of which will take place on or before September 1, 2011. As at June 30, 2011, no amounts have been or are outstanding under this credit facility. Borrowings will be either by way of a LIBOR or base rate option. The LIBOR and base rate margins above LIBOR or the base rate, as applicable, will be subject to a pricing grid based upon the percentage of utilization of the borrowing base, which range from 2.75% to 3.50% and 1.75% to 2.50%, respectively. Eagle Energy Acquisitions LP may only borrow under the credit facility in U.S. dollars. The credit facility is secured by a first priority security interest on substantially all of the oil and gas properties of Eagle Energy Acquisitions LP. Under the credit facility, Eagle Energy Trust, Eagle Energy Commercial Trust, Eagle Hydrocarbons LLC, Eagle Energy Inc. and Eagle Energy Acquisitions LP are required to satisfy certain customary affirmative and negative covenants (including financial covenants).The credit facility provides for customary negative covenants which, among other things, limit the Trust from making distributions of cash flow to its unitholders if any default or event of default has occurred and is continuing or would result from such distribution, or if more than 90% of the lesser of the borrowing base or total commitments under the credit facility has been utilized. The credit facility also includes other customary restrictive covenants including limitations on indebtedness, liens, contingent obligations, investments, dispositions, mergers, consolidations, liquidations and dissolutions and a negative pledge. In addition, a minimum current ratio (the ratio of current assets plus the unused commitment under the credit facility to current liabilities excluding any amounts owing under the credit facility) of not less than 1.00 to 1.00, a minimum coverage of interest expenses of not less than 3.00 to 1.00, and a maximum level of debt to earnings before interest, taxes and depreciation of 3.00 to 1.00 must be maintained. Failure to comply with any of these financial covenants, as well as any of the other affirmative and negative covenants, would result in an event of default which, if not cured or waived, would permit acceleration of the indebtedness pursuant to the credit facility. At June 30, 2011 there were no covenant violations and no amounts outstanding under the $US 15 million borrowing base nor have there been any draws during the period covered by these consolidated financial statements.
26. Provision for liabilities and other charges
Provision for
decommissioning costs
Balance at December 31, 2010 $ 217,380
Additions 111,365
Changes in estimates -
Adjustment for change in risk-free discount rate -
Accretion (unwinding of discount) 4,737
Balance at June 30, 2011 $ 333,482
The decommissioning provision reflects the present value of internal estimates of future decommissioning costs of the Trust’s net ownership position in oil and gas wells and related facilities at the relevant balance sheet date determined using local pricing conditions and requirements. These costs are expected to be incurred between 2011 and 2032. The timing of payments related to provisions is uncertain and is dependent on various items which are not always within Management’s control.
EAGLE SECOND QUARTER REPORT 2011
30
The provision was estimated using existing technology, at current prices (adjusted for inflation assuming 2% inflation rate), and discounted using a risk-free discount rate of 4.0%. Included in the balance at December 31, 2010 is $139,761 of decommissioning liability recorded as part of the Salt Flat acquisition. See “Acquisitions” note 7. The total undiscounted decommissioning liability at June 30, 2011 was $580,048.
27. Trust capital
Authorized
The beneficial interests in the Trust are represented and constituted by one class of units. An unlimited number of common voting Trust units may be issued pursuant to the Trust Indenture. Each unit represents an equal, undivided beneficial interest in the net assets of the Trust, and all units rank equally and rateably with all other units. Each unit entitles the holder to one vote at all meetings of unitholders. Unitholders are entitled to receive non-cumulative distributions from the Trust if, as, and when declared by the Trust. Trust units are redeemable at any time on demand by the holders thereof. Upon receipt of a redemption request by the Trust, the holder is entitled to receive a price per Trust unit (the “Market Redemption Price”) equal to the lesser of: (i) 90% of the volume weighted average trading price of a unit during the last 10 trading days; and (ii) 100% of the volume weighted average trading price of a unit on the redemption date. The aggregate Market Redemption Price payable by the Trust in respect of any units tendered for redemption during any calendar month shall be satisfied by way of a cash payment on or before the fifth business day after the end of the calendar month following the calendar month in which the units were tendered for redemption. Unitholders are not entitled to receive cash upon the redemption of their units if the total amount payable by the Trust in respect of such units and all other units tendered for redemption in the same month exceeds $100,000. If a unitholder is not entitled to receive cash, the redemption may be satisfied by distributing notes having an aggregate principal amount equal to the aggregate Market Redemption Price of the Trust units tendered for redemption. It is anticipated that the redemption right will not be the primary mechanism for unitholders to dispose of their units.
Trust units outstanding
Six Months Ended
June 30,
2011
Number of units Amount
Balance at December 31, 2010 17,624,081 $ 159,577,493
Issuance of Trust capital pursuant to the DRIP plan 270,389 2,927,541
Trust Unit issuance costs (additional costs) - (203,051)
Balance at June 30, 2011 17,894,470 $ 162,301,983
For the period ended December 31, 2010, the Trust incurred unit issue costs, relating to the initial public offering, of $13,513,334. For the six months ended June 30, 2011 the Trust recognized an additional $36,457 of unit issue costs associated with the IPO. Additionally, the Trust incurred $46,053 in conjunction with implementing the unit distribution reinvestment program (“DRIP”). The Trust recognized $120,541 of Trust unit issuance costs for various financing projects in progress. None of these transactions resulted in the issuance of additional units during the period. In the event that any of these financing projects do not proceed, the associated cost of the project will be expensed. Trust units issued, but not classified as outstanding
Refer to note 10 “Unit-based payments”. The 387,500 units issued to certain directors, management and a consultant on the surrender of previously granted performance options have been excluded from units outstanding as a result of IFRS principles which exclude units due to the performance conditions that have to be met in order for the units to be released from escrow. DRIP Plan (Premium Distribution and Dividend Reinvestment Plan)
During the period the DRIP plan was officially established. The plan provides eligible unitholders with the opportunity to reinvest their monthly cash distributions in new trust units at a 5% discount to the average market price (as defined in the plan) on the applicable distribution payment date. At the participant’s election, these new Trust units will either be credited to the participant’s account under the “distribution reinvestment component” of the Plan, or delivered to the designated Plan Broker in exchange for a premium cash payment to the participant equal to 102% of the reinvested distributions under the “Premium Distribution component” of the Plan. Participation in the
EAGLE SECOND QUARTER REPORT 2011
31
Plan by unitholders is optional. Those unitholders who do not enroll in the Plan will still receive monthly cash distributions as declared by the Trust.
28. Cash generated from operations
Summary of non-cash items
Three Months Ended
June 30,
2011
Six Months Ended
June 30,
2011
Operating cash flow
Unit-based compensation $ 2,130,453 $ 4,905,309
Distributions payable-declared not yet paid 1,599,672 1,599,672
Unrealized risk management loss (1,419,888) (5,886)
Investment activities
Depreciation, depletion and amortization $ 2,593,260 $ 5,487,999
Provision for decommissioning costs 60,963 111,365
Accretion of decommissioning provision 2,614 4,737
Financing activities
Finance expense-amortization of deferred financing costs $ 19,775 $ 37,398
Distributions accrued-declared not yet paid (1,599,672) (1,599,672)
29. Related party disclosures
The Trust has no party holding voting control. Key management personnel
The executive officers include the Chief Executive Officer (CEO), the Executive Vice President, Engineering and Geosciences (EVP), and the Chief Financial Officer (CFO).
Three Months Ended
June 30,
2011
Six Months Ended
June 30,
2011
Income (loss) for the period $ 1,703,134 $ (207,877)
Adjustments for:
Depreciation, depletion and amortization 2,593,260 5,487,999
Unit-based compensation 2,130,453 4,905,309
Unrealized risk management gain (1,419,888) (5,886)
Finance expense 22,389 42,135
5,029,348 10,221,680
Changes in working capital:
Trade and other receivables 434,975 (2,473,997)
Prepaid expenses (7,350) (96,371)
Trade and other payables (3,737,176) (2,648,563)
(3,309,551) (5,218,931)
Cash generated from operations 1,719,797 5,002,749
Income taxes paid - -
Net cash generated by operating activities $ 1,719,797 $ 5,002,749
EAGLE SECOND QUARTER REPORT 2011
32
Intercompany transactions
There are certain intercompany transactions among the subsidiaries comprising these consolidated financials of the Trust. These transactions have been eliminated in consolidation. Head office lease in Calgary, Alberta
The Trust sub-leases office space along with furniture and equipment from a company of which a director of the Administrator of the Trust is the President and Chief Operating Officer. The terms of the agreement are recorded at the exchange amount. The monthly rent rate is $8,000. Refer to “Commitments” note 30 regarding operating lease commitments. No amounts were owing to this related party as at June 30, 2011. For the six months ended June 30, 2011 administrative expenses included $48,000 for amounts billed from this related party.
30. Commitments
Operating lease commitment – Head office lease in Calgary, Alberta
The term of the sub-lease agreement is 6 months from January 1, 2011 until June 30, 2011. Thereafter, the agreement will automatically roll over on a monthly basis, unless either party serves a 30 day notice of termination. Therefore, the agreement is cancellable at the end of the term if notice is provided. Future minimum lease payments during the six month term of the sub-lease are $48,000, with $0 remaining as at June 30, 2011. Refer to “Subsequent events” note 31 for details of a new sub-lease signed subsequent to June 30, 2011. Operating lease commitment – Office lease in Houston, Texas
The agreement was entered into on April 1, 2011, and has an approximate 30 month term from April 7, 2011 through September 30, 2013. Future minimum lease payments during the term of the sub-lease approximate $US $338,000, with 27 months and approximately $304,000 remaining at June 30, 2011. In $CA the remaining future minimum lease payments approximate $293,000 translated at the exchange rate in effect at the balance sheet date of $US 1 equal to $CA 0.9645.
Drilling rig commitment
The Trust, through its joint venture relationship in the Salt Flat Field, entered into a six month drilling rig commitment agreement effective February 3, 2011. The agreement is then cancellable given a 30 day written notice. The daily rig rate is $US 11,500, resulting in future minimum payments during the six month (180 days) term of the agreement of $US 2,070,000, which is 100% of the commitment. The net commitment to the Trust based upon its approximately 80% interest equates to $US 1,656,000, with $US 312,800 remaining as at June 30, 2011. In $CA the future minimum lease payments remaining approximate $302,000 translated at the exchange rate in effect at the balance sheet date of $US 1 equal to $CA 0.9645. Refer to “Subsequent events” note 31 for details of an amendment to this agreement signed subsequent to June 30, 2011.
31. Subsequent events
Operating lease commitment – Head office lease in Calgary, Alberta
On July 25th
, 2011, the sub-lease agreement (refer to “Commitments” note 30) was renewed for an additional 6 month period from August 1, 2011 to January 31, 2012 under the same terms as before with the exception of a monthly rent rate of $8,500. Future minimum lease payments during the six month renewal term are $51,000.
Drilling rig commitment
On August 3rd
, 2011 the drilling rig commitment (refer to “Commitments” note 30) was amended for the purpose of extending the agreement for an additional 4 wells commencing at rig release of the current well. The new daily rate for the additional 4 wells is $US 13,000. Since there is no specific time frame provided for in the agreement, future minimum payments have been approximated by assuming 10 days per well drilled for a total of 40 days. The future minimum payments can then be estimated to be $US 520,000, which is 100% of the commitment. The net commitment to the Trust based upon its approximate 80% interest equates to $US 416,000. In $CA the net future minimum commitment approximates $401,000 translated at the exchange rate in effect at the balance sheet date of $US 1.00 equal to $CA 0.9645.
Corporate Information Board of Directors
David M. Fitzpatrick Chairman of the Board Bruce K. Gibson (1) Director Warren D. Steckley (2) Director Joseph W. Blandford (3) Director Richard W. Clark President, Chief Executive Officer and Director
(1) Audit Committee Chair
(2) Reserves & Governance Committee Chair
(3) Compensation Committee Chair
TSX : EGL.UN
Officers
Richard W. Clark President, Chief Executive Officer and Director Peter L. Churcher Executive Vice President, Engineering and Geosciences Kelly A. Tomyn Vice President, Finance and Chief Financial Officer Robert J. Cunningham Vice President, Business Development Dusty J. Dumas U.S. Controller
Auditors
PricewaterhouseCoopers LLC
Trustee and Transfer Agent
Computershare Trust Company of Canada
Engineering Consultants
GLJ Petroleum Consultants Ltd.
Bankers
Bank of Nova Scotia
Legal Counsel
Bennett Jones LLP
Calgary Office Houston Office Eagle Energy Inc. Eagle Hydrocarbons LLC Suite 900, 639 – 5th Avenue SW Suite 3005, 333 Clay Street Calgary, Alberta T2P 0M9 Houston, Texas 77002
Phone: (403) 531-1575 Phone: (713) 300-3245 Fax: (403) 255-4124 Fax: (403) 300-3240 Email: [email protected]
www.eagleenergytrust.com