Embed Size (px)
Citation preview

SECOND QUARTER REPORT TO UNITHOLDERS FOR THE SIX MONTHS ENDED JUNE 30, 2008
W A J A X I N C O M E F U N D 2 0 0 8
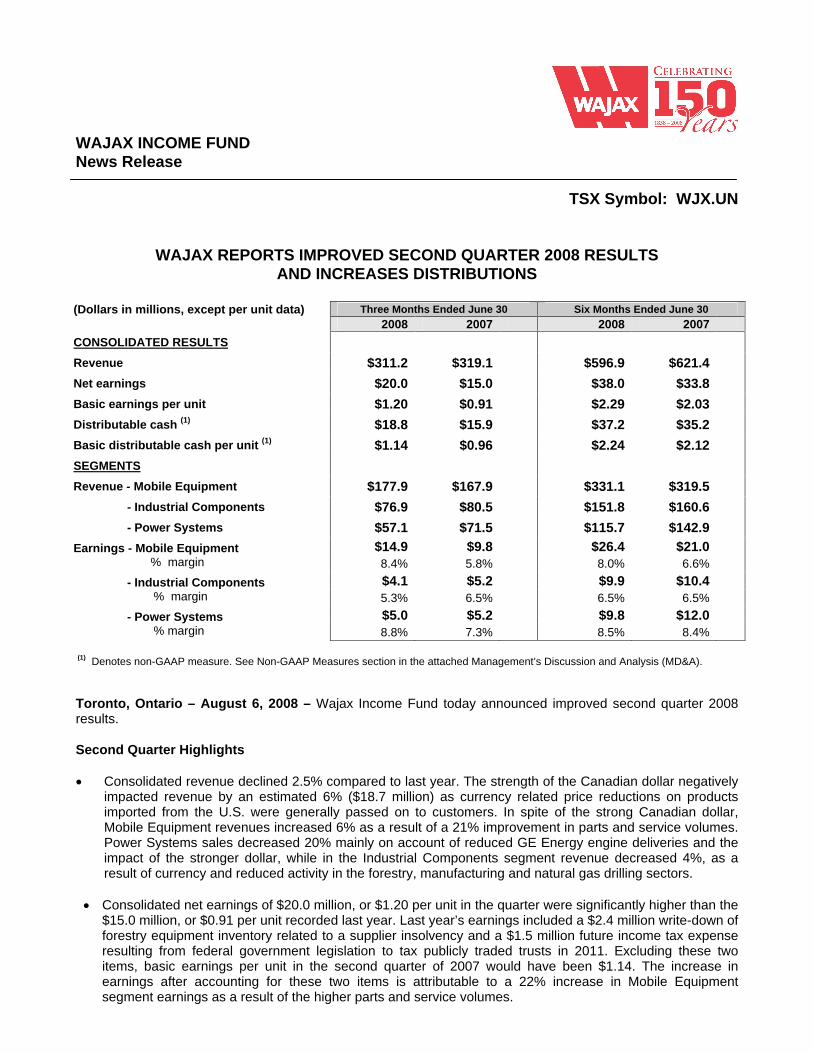
WAJAX INCOME FUND News Release
TSX Symbol: WJX.UN
WAJAX REPORTS IMPROVED SECOND QUARTER 2008 RESULTS AND INCREASES DISTRIBUTIONS
(Dollars in millions, except per unit data) Three Months Ended June 30 Six Months Ended June 30
2008 2007
2008 2007
CONSOLIDATED RESULTS
Revenue $311.2
$319.1
$596.9
$621.4
Net earnings $20.0
$15.0
$38.0
$33.8
Basic earnings per unit $1.20
$0.91
$2.29
$2.03
Distributable cash (1) $18.8
$15.9
$37.2
$35.2
Basic distributable cash per unit (1) $1.14
$0.96
$2.24
$2.12
SEGMENTS
Revenue - Mobile Equipment $177.9
$167.9
$331.1
$319.5
- Industrial Components $76.9
$80.5
$151.8
$160.6
- Power Systems $57.1
$71.5
$115.7
$142.9
Earnings - Mobile Equipment $14.9
$9.8
$26.4
$21.0
% margin 8.4% 5.8% 8.0% 6.6%
- Industrial Components $4.1
$5.2
$9.9
$10.4
% margin 5.3% 6.5% 6.5% 6.5%
- Power Systems $5.0
$5.2
$9.8
$12.0
% margin 8.8% 7.3% 8.5% 8.4%
(1) Denotes non-GAAP measure. See Non-GAAP Measures section in the attached Management’s Discussion and Analysis (MD&A).
Toronto, Ontario – August 6, 2008 – Wajax Income Fund today announced improved second quarter 2008 results.
Second Quarter Highlights
Consolidated revenue declined 2.5% compared to last year. The strength of the Canadian dollar negatively impacted revenue by an estimated 6% ($18.7 million) as currency related price reductions on products imported from the U.S. were generally passed on to customers. In spite of the strong Canadian dollar, Mobile Equipment revenues increased 6% as a result of a 21% improvement in parts and service volumes. Power Systems sales decreased 20% mainly on account of reduced GE Energy engine deliveries and the impact of the stronger dollar, while in the Industrial Components segment revenue decreased 4%, as a result of currency and reduced activity in the forestry, manufacturing and natural gas drilling sectors.
Consolidated net earnings of $20.0 million, or $1.20 per unit in the quarter were significantly higher than the $15.0 million, or $0.91 per unit recorded last year. Last year’s earnings included a $2.4 million write-down of forestry equipment inventory related to a supplier insolvency and a $1.5 million future income tax expense resulting from federal government legislation to tax publicly traded trusts in 2011. Excluding these two items, basic earnings per unit in the second quarter of 2007 would have been $1.14. The increase in earnings after accounting for these two items is attributable to a 22% increase in Mobile Equipment segment earnings as a result of the higher parts and service volumes.
Basic distributable cash (see Non-GAAP Measures section in the MD&A) of $1.14 per unit was higher than the $0.96 per unit recorded the previous year as a result of the higher Mobile Equipment segment earnings and the forestry equipment inventory write-down incurred last year.
The Fund announced a $0.01 per unit increase in monthly distributions for August, September and October to $0.35 per unit per month ($4.20 per unit annualized).
Commenting on the second quarter results and the outlook for the year, Neil Manning, President and CEO, stated “As we anticipated, strong market segments such as mining, including the oil sands, and infrastructure more than offset weaker areas of the Canadian economy. We are particularly pleased with the strength in Mobile Equipment parts and service sales as we benefit from servicing equipment sold in previous years. Looking forward, we continue to be concerned about the strength of several sectors of the Canadian economy, particularly manufacturing, forestry and residential construction. However, we anticipate a continuing benefit from strong sectors such as mining and infrastructure plus further growth in after-market support revenue. As well, management continues to be optimistic that an increase in natural gas drilling activity in western Canada may occur in the latter part of this year. As a result, we expect 2008 full year earnings to show improvement over the previous year.”
Wajax is a diversified income fund that has three core distribution businesses engaged in the sale and after-sales parts and service support of mobile equipment, industrial components and power systems, through a network of over 100 branches across Canada. Its customer base spans natural resources, construction, transportation, manufacturing, industrial processing and utilities.
Wajax will Webcast its Second Quarter Financial Results Conference Call. You are invited to listen to the live Webcast on Wednesday, August 6, 2008 at 1:30 p.m. ET. To access the Webcast, enter www.wajax.com
and click on the link for the Webcast on the Investor Relations page. The archived Webcast will be available at the above mentioned website within 24 hours after the conference call.
This news release contains forward-looking information. Please refer to the “Forward-Looking Statements” section in the accompanying Management Discussion and Analysis.

Management’s Discussion and Analysis – Q2 2008
The following management’s discussion and analysis (“MD&A”) discusses the consolidated financial condition and results of operations of Wajax Income Fund (the “Fund” or “Wajax”) for the quarter ended June 30, 2008. This MD&A should be read in conjunction with the information contained in the Unaudited Interim Consolidated Financial Statements and accompanying notes for the quarter-ended June 30, 2008, the annual Audited Consolidated Financial Statements and accompanying notes of the Fund for the year ended December 31, 2007 and the associated MD&A. Information contained in this MD&A is based on information available to management as of August 6, 2008.
Unless otherwise indicated, all financial information within this MD&A is in millions of dollars, except per unit data.
Responsibility of Management and the Board of Trustees
Management is responsible for the information disclosed in this MD&A and the Consolidated Financial Statements and accompanying notes, and has in place appropriate information systems, procedures and controls to ensure that information used internally by management and disclosed externally is materially complete and reliable. The Fund’s Board of Trustees has approved this MD&A and the interim Consolidated Financial Statements and accompanying notes. In addition, the Fund’s Audit Committee, on behalf of the Board of Trustees, provides an oversight role with respect to all public financial disclosures made by the Fund, and has reviewed this MD&A and the interim Consolidated Financial Statements and accompanying notes.
Disclosure Controls and Procedures and Internal Control over Financial Reporting
The Fund has designed disclosure controls and procedures to provide reasonable assurance that material information relating to the Fund is made known to the Chief Executive Officer and the Chief Financial Officer, particularly during the period in which the interim filings are being prepared. The Fund has designed internal controls over financial reporting to provide reasonable assurance regarding the reliability of financial reporting and the preparation of financial statements for external purposes in accordance with Canadian Generally Accepted Accounting Principles. There has been no change in the Fund’s internal control over financial reporting that occurred during the second quarter of fiscal 2008 that has materially affected, or is reasonably likely to materially affect, the Fund’s internal control over financial reporting.
Wajax Income Fund Overview
Wajax Income Fund is an unincorporated open-ended limited purpose trust established under the laws of the Province of Ontario pursuant to a declaration of trust dated April 27, 2005. The Fund was created to indirectly invest, on June 15, 2005, in substantially all of the assets and business formerly conducted by Wajax Limited.
The Fund intends to make monthly cash distributions, generally payable to unitholders of record on the last business day of each calendar month and to be paid on or about the 20th day of the following month. The Fund may make special cash and/or special non-cash distributions at the end of the year to ensure, as provided in the Fund’s Declaration of Trust, that the Fund’s total distributions for the year are equal to its taxable income for the year. Cash distributions are dependent on, among other things, the cash flow of the Fund.
Wajax has three core distribution businesses engaged in the sale and after-sales parts and service support of mobile equipment, power systems and industrial components, through a network of over 100 branches across Canada. Its customer base spans natural resources, construction, transportation, manufacturing, industrial processing and utilities.
The Fund’s strategy is to grow earnings in all segments through continuous improvement of operating margins and revenue growth while maintaining the Fund’s strong balance sheet. Revenue growth will be achieved through market share gains, new geographic territories and the addition of new complementary product lines either organically or through acquisitions.

Forward-Looking Information
This MD&A contains forward-looking statements. These statements relate to future events or future performance and reflect management’s current expectations and assumptions. Such forward-looking statements reflect management’s current beliefs and are based on information currently available to management of the Fund. A number of factors could cause actual events, performance or results to differ materially from the events, performance and results discussed in the forward-looking statements. These factors include and are not restricted to the risks identified in this MD&A. In addition these factors should be considered carefully and readers should not place undue reliance on the forward-looking statements. The forward-looking statements reflect management’s expectations as of the date hereof and the Fund does not assume any obligation to update or revise them to reflect new events or circumstances, except as required by law.
Consolidated Results
Three months ended June 30
Six months ended June 30
2008
2007
2008
2007
Revenue $311.2
$319.1 $596.9
$621.4
Gross profit Selling and administrative expenses
$71.7
$50.3
$67.3
$49.3
$139.3
$98.4
$136.8 $98.4
Earnings before interest and income taxes $21.4
$18.0
$40.9
$38.4
Interest expense $1.1
$1.3
$2.2
$2.7
Income tax expense $0.3
$1.6
$0.7
$1.9
Net earnings $20.0
$15.0
$38.0
$33.8
Distributable cash (1)
Cash distributions declared
Distributions paid - Monthly - Special
$18.8
$16.8
$16.6
-
$15.9
$15.9
$15.9
-
$37.2
$33.2
$33.0
$7.8
$35.2
$31.8
$31.8 $18.6
Earnings per unit - Basic - Diluted
$1.20
$1.19
$0.91
$0.90
$2.29
$2.27
$2.03
$2.02
Distributable cash per unit (1)
- Basic(2)
- Diluted
$1.14
$1.13
$0.96
$0.95
$2.24
$2.23
$2.12 $2.11
Cash distributions declared per unit (2) $1.01 $0.96 $2.00
$1.92
Distributions paid per unit (2)
- Monthly - Special
$1.00
-
$0.96
-
$1.99
$0.47
$1.92 $1.12
(1) Non-GAAP measure, see the Non-GAAP Measures and Distributable Cash sections. (2) Based on actual number of units outstanding on the relevant record date.
Revenue Revenue in the second quarter of 2008 decreased $7.9 million to $311.2 million from $319.1 million in 2007. The stronger Canadian dollar relative to the U.S. dollar had the effect of decreasing 2008 consolidated quarterly revenue by approximately $18.7 million, or 6%, as the Fund realized lower sales dollars per unit on U.S. sourced
products. Segment revenue increased 6% in Mobile Equipment while revenue fell 4% and 20% in Industrial Components and Power Systems, respectively. For the six months ended June 30, 2008, revenue decreased $24.5 million, or 4%.
Gross profit Gross profit in the second quarter of 2008 increased $4.4 million due to the positive impact of higher gross profit margins offset partially by the negative impact of lower revenues compared to last year. The gross profit margin percentage for the quarter increased to 23.0% in 2008 from 21.1% in 2007 due to a higher proportion of higher margin parts and service volumes, compared to last year, and a $2.4 million inventory write-down of forestry equipment in the Mobile Equipment segment related to a supplier insolvency in 2007. In addition, the gross profit margin was negatively affected by a reclassification of $0.5 million of selling and administrative expenses to cost of sales resulting from adoption of the new CICA Handbook Section 3031, Inventories, effective January 1, 2008 without restatement of 2007 results (“the new inventory accounting standard”). Excluding the impact of the new inventory accounting standard in 2008 and the forestry equipment inventory write-down in 2007, the gross profit percentage increased to 23.2% in the second quarter of 2008 compared to 21.8% in 2007.
For the six months ended June 30, 2008, gross profit increased $2.5 million compared to last year. Excluding the impact of the new inventory accounting standard in 2008 and the forestry equipment inventory write-down in 2007, the gross profit margin percentage increased to 23.7% in 2008 from 22.4% in 2007 compared to last year.
Selling and administrative expenses Selling and administrative expenses increased $1.0 million in the quarter due mainly to higher sales related costs in Mobile Equipment and increased corporate costs, offset partially by a reclassification of $0.7 million of overhead costs to cost of sales ($0.5 million) and inventory ($0.2 million), resulting from adoption of the new inventory accounting standard. Excluding the impact of adoption of the new inventory accounting standard, selling and administrative expenses as a percentage of revenue increased to 16.4% in 2008 from 15.4% in 2007.
For the six months ended June 30, 2008 selling and administrative expenses remained flat compared to last year. Increased personnel costs in Mobile Equipment and Industrial Components were offset mostly by a reclassification of $2.3 million of overhead costs to cost of sales ($2.0 million) and inventory ($0.3 million), resulting from adoption of the new inventory accounting standard. Excluding the impact of adoption of the new inventory accounting standard, selling and administrative expenses as a percentage of revenue increased to 16.9% in 2008 from 15.8% in 2007.
Interest expense Quarterly interest expense of $1.1 million decreased $0.2 million due mainly to lower interest rates compared to last year.
For the six months ended June 30, 2008, interest expense decreased $0.5 million compared to 2007 due primarily to lower interest rates and lower amortization of deferred financing costs.
Income tax expense The effective income tax rate of 1.6% for the quarter decreased from 9.7% the previous year due mainly to a $1.5 million future income tax expense adjustment made in 2007 to reflect temporary differences of the Fund that are estimated to reverse after 2010, tax effected at rates that will apply in the periods the differences are expected to reverse.
For the six months ended June 30, 2008 the effective tax rate decreased to 1.8% from 5.4% the previous year due mainly to a $1.5 million future income tax expense adjustment made in 2007 to reflect temporary differences of the Fund that are estimated to reverse after 2010, tax effected at rates that will apply in the periods the differences are expected to reverse.
The Fund’s effective income tax rate was lower than the Fund’s statutory income tax rate of 33.6% as the majority of the Fund’s income is not subject to tax in the Fund.
The Fund is a “mutual fund trust” as defined under the Income Tax Act (Canada) and is not currently taxable on its income to the extent that it is distributed to its unitholders. Pursuant to the terms of the Declaration of Trust, all income earned by the Fund is distributed to its unitholders. Accordingly, no provision for income taxes is required on income earned by the Fund that is distributed to its unitholders. The Fund’s corporate subsidiaries are subject to tax on their taxable income.

Under legislation enacted on June 22, 2007, the Fund as a publicly traded income trust will pay tax on its income distributed commencing in 2011 at a rate that is substantially equivalent to the general corporate income tax rate. The Fund may become taxable on its distributions prior to 2011 if its equity capital grows beyond certain dollar limits measured by reference to the Fund’s market capitalization on October 31, 2006. The Fund has not exceeded its growth limits at June 30, 2008.
On July 14, 2008, the Department of Finance released draft rules designed to permit income funds to “convert” into public corporations without triggering adverse tax consequences to the income fund and its unitholders. The Fund is currently evaluating the draft rules which provide for alternative methods whereby an income fund can convert to a public corporation. As long as the Fund continues to benefit from the efficient distribution of its taxable income to unitholders and continues to meet the limitations on growth in equity, the current expectation is that the Fund will delay conversion to a corporate structure until January 1, 2011. The Fund will continue to monitor this position on the timing of conversion to a corporation taking into account the factors described above and other capital market considerations.
Net earnings Quarterly net earnings of $20.0 million, or $1.20 per unit, increased $5.0 million from $15.0 million, or $0.91 per unit in 2007. The positive impact of higher gross profit margins, the $2.4 million write-down of forestry equipment inventory in 2007, lower income tax expenses and interest costs were partially offset by the negative impact of lower volumes and higher selling and administrative costs compared to last year. (Net earnings include $0.2 million of income after tax resulting from adoption of the new inventory accounting standard. Please see Changes in Accounting Policy – Inventories section of this MD&A for further details.)
For the six months ended June 30, 2008 net earnings of $38.0 million, or $2.29 per unit, increased $4.2 million from $33.8 million, or $2.03 per unit, in 2007. (Net earnings include $0.3 million of income after tax resulting from adoption of the new inventory accounting standard. Please see Changes in Accounting Policy – Inventories section of this MD&A for further details.)
Comprehensive income Comprehensive income for the quarter of $20.1 million increased $5.0 million from $15.1 million the previous year due to a $5.0 million increase in net earnings. For the six months ended June 30, 2008, comprehensive income of $37.7 million increased $4.1 million from $33.6 million the previous year due to a $4.2 million increase in net earnings offset partially by a $0.2 million increase in other comprehensive loss to $0.3 million in 2008 from $0.1 million in 2007.
Funded net debt Funded debt net of cash (“funded net debt”) of $88.2 million decreased $6.5 million compared to March 31, 2008 as second quarter cash flows from operations of $23.5 million and a decrease in non-cash working capital of $4.8 million more than offset cash distributions of $16.6 million and capital spending of $5.0 million.
Compared to June 30, 2007 funded net debt increased $1.5 million. The Fund’s quarter-end debt-to-equity ratio of 0.43:1 at June 30, 2008 decreased from last quarter’s ratio of 0.47:1 and remains the same as last year’s ratio of 0.43:1.
Distributable cash (see Non-GAAP Measures section) and distributions For the quarter ended June 30, 2008 distributable cash was $18.8 million, or $1.14 per unit, compared to $15.9 million, or $0.96 per unit, the previous year. The $2.9 million increase in distributable cash is due primarily to higher cash flows from operations before changes in non-cash working capital compared to last year. For the same period cash distributions declared were $1.01 per unit (2007 - $0.96 per unit).
Distributable cash in excess of cash distributions declared for the three months ended June 30, 2008 of $2.0 million, or $0.13 per unit, provides the Fund an additional reserve for fluctuations in working capital requirements, growth capital expenditure requirements or future distributions. For the six months ended June 30, 2008 distributable cash was $37.2 million, or $2.24 per unit, compared to $35.2 million, or $2.12 per unit, the previous year. The $2.0 million increase in distributable cash is due primarily to lower accruals for mid-term incentives partially offset by higher maintenance capital expenditures compared to last year. For the same period cash distributions declared were $2.00 per unit (2007 - $1.92 per unit).
Distributable cash in excess of cash distributions declared for the six months ended June 30, 2008 of $4.0 million, or $0.24 per unit, provides the Fund an additional reserve for fluctuations in working capital requirements, growth capital expenditure requirements or future distributions.
On August 6, 2008 the Fund announced a $0.01 per unit increase in monthly distributions to $0.35 per unit ($4.20 annualized) for the months of August, September and October, payable on September 22, 2008, October 20, 2008 and November 20, 2008 to unitholders of record on August 29, 2008, September 30, 2008 and October 31, 2008 respectively.
Quarterly Results of Operations
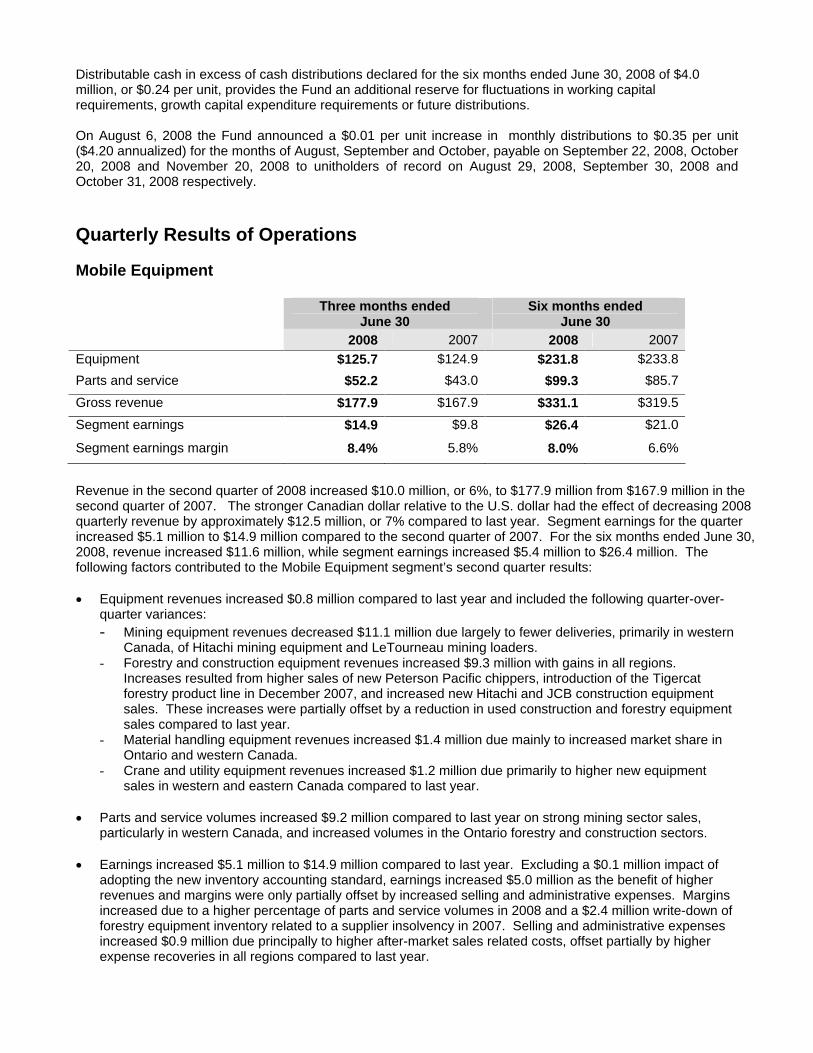
Mobile Equipment
Three months ended June 30
Six months ended June 30
2008
2007
2008
2007
Equipment $125.7
$124.9
$231.8
$233.8
Parts and service $52.2
$43.0
$99.3
$85.7
Gross revenue $177.9
$167.9
$331.1
$319.5
Segment earnings $14.9
$9.8
$26.4
$21.0
Segment earnings margin 8.4%
5.8%
8.0%
6.6%
Revenue in the second quarter of 2008 increased $10.0 million, or 6%, to $177.9 million from $167.9 million in the second quarter of 2007. The stronger Canadian dollar relative to the U.S. dollar had the effect of decreasing 2008 quarterly revenue by approximately $12.5 million, or 7% compared to last year. Segment earnings for the quarter increased $5.1 million to $14.9 million compared to the second quarter of 2007. For the six months ended June 30, 2008, revenue increased $11.6 million, while segment earnings increased $5.4 million to $26.4 million. The following factors contributed to the Mobile Equipment segment’s second quarter results:
Equipment revenues increased $0.8 million compared to last year and included the following quarter-over-quarter variances: - Mining equipment revenues decreased $11.1 million due largely to fewer deliveries, primarily in western
Canada, of Hitachi mining equipment and LeTourneau mining loaders. - Forestry and construction equipment revenues increased $9.3 million with gains in all regions.
Increases resulted from higher sales of new Peterson Pacific chippers, introduction of the Tigercat forestry product line in December 2007, and increased new Hitachi and JCB construction equipment sales. These increases were partially offset by a reduction in used construction and forestry equipment sales compared to last year.
- Material handling equipment revenues increased $1.4 million due mainly to increased market share in Ontario and western Canada.
- Crane and utility equipment revenues increased $1.2 million due primarily to higher new equipment sales in western and eastern Canada compared to last year.
Parts and service volumes increased $9.2 million compared to last year on strong mining sector sales, particularly in western Canada, and increased volumes in the Ontario forestry and construction sectors.
Earnings increased $5.1 million to $14.9 million compared to last year. Excluding a $0.1 million impact of adopting the new inventory accounting standard, earnings increased $5.0 million as the benefit of higher revenues and margins were only partially offset by increased selling and administrative expenses. Margins increased due to a higher percentage of parts and service volumes in 2008 and a $2.4 million write-down of forestry equipment inventory related to a supplier insolvency in 2007. Selling and administrative expenses increased $0.9 million due principally to higher after-market sales related costs, offset partially by higher expense recoveries in all regions compared to last year.

Industrial Components – Kinecor
Three months ended June 30
Six months ended June 30
2008
2007
2008
2007
Gross revenue $76.9
$80.5
$151.8
$160.6
Segment earnings $4.1
$5.2
$9.9
$10.4
Segment earnings margin 5.3%
6.5%
6.5%
6.5%
Revenue at Kinecor of $76.9 million decreased 4%, or $3.6 million from $80.5 million in the second quarter of 2007. The stronger Canadian dollar relative to the U.S. dollar had the effect of decreasing 2008 quarterly revenue by approximately $2.8 million, or 3% compared to last year. Segment earnings decreased $1.1 million to $4.1 million, compared to $5.2 million the previous year. For the six months ended June 30, 2008, revenue declined $8.8 million, while segment earnings decreased $0.5 million to $9.9 million compared to the same period last year. The following factors contributed to the segment’s second quarter results:
Bearings and power transmission parts sales decreased $1.0 million compared to last year, as decreased volumes in the forestry sector in eastern Canada and Ontario more than offset increased sales to manufacturing based customers across all regions.
Fluid power parts and service revenue declined $2.6 million primarily as a result of reduced natural gas drilling activity in western Canada, lower sales to transportation and manufacturing based customers, and reduced forestry sector sales compared to last year. Offsetting these revenue declines were gains made to utilities & government, metal processing and mining sector customers.
Segment earnings decreased $1.1 million to $4.1 million compared to last year, as the negative impact of lower volumes and higher selling and administrative expenses more than offset higher margins. Margins increased due to a modification of pricing strategies and a reduction in lower margin forestry sector volumes compared to last year. Selling and administrative expenses increased $0.8 million compared to last year due mainly to higher personnel related costs and consulting costs associated with the new computer system conversion.
The new computer system, currently being implemented in Kinecor, will provide additional functionality and capacity which will accommodate the segment’s future growth. The system will be implemented into Kinecor’s operations across Canada in four stages during 2008 and the first half of 2009.
Power Systems
Three months ended
June 30 Six months ended
June 30 2008
2007
2008
2007
Equipment $23.0
$37.8
$46.9
$74.2
Parts and service $34.1
$33.7
$68.8
$68.7
Gross revenue $57.1
$71.5
$115.7
$142.9
Segment earnings $5.0
$5.2
$9.8
$12.0
Segment earnings margin 8.8%
7.3%
8.5%
8.4%
Revenue in the second quarter decreased 20%, or $14.4 million, to $57.1 million compared to $71.5 million in 2007. The stronger Canadian dollar relative to the U.S. dollar had the effect of decreasing 2008 quarterly revenue by approximately $3.4 million, or 5% compared to last year. Segment earnings decreased $0.2 million
to $5.0 million in the quarter compared to the previous year. For the six months ended June 30, 2008, revenue decreased $27.2 million, or 19%, to $115.7 million, while earnings decreased $2.2 million to $9.8 million compared to $12.0 million in 2007. The following factors impacted quarterly revenues and earnings:
Revenue at Waterous Power Systems (“Waterous”) in western Canada was down $1.9 million compared to last year as a decline in equipment sales of $2.8 million, attributable to reduced natural gas drilling activity, was partially offset by a $0.9 million increase in parts and service revenues.
Revenue at the eastern Canada operation, DDACE Power Systems (“DDACE”) decreased $12.5 million compared to 2007. Equipment sales decreased $11.9 million, due principally to lower GE Energy engine deliveries. Parts and service revenues decreased $0.6 million compared to last year.
Segment earnings decreased $0.2 million to $5.0 million compared to last year as the negative impact of lower volumes was almost entirely mitigated by higher margins and a reduction in selling and administrative expenses compared to last year. Margins increased due primarily to a higher proportion of higher margin parts and service revenues and improved margins on DDACE new equipment and generator set sales compared to last year.
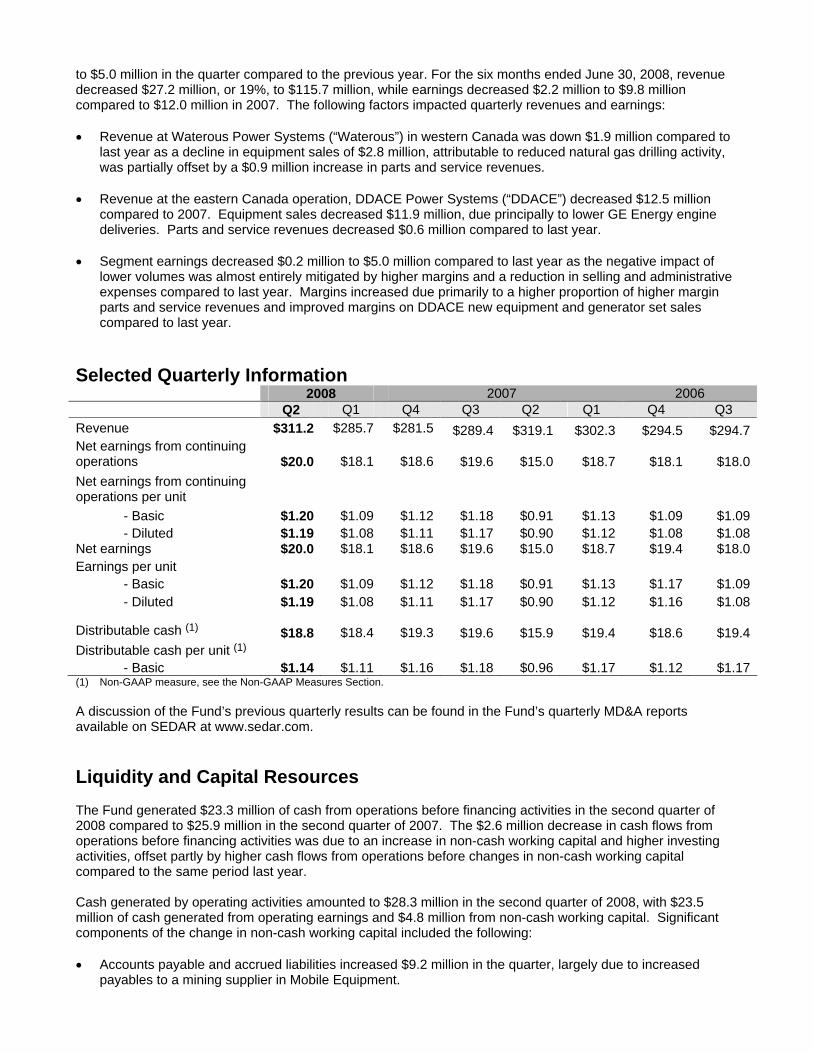
Selected Quarterly Information
2008 2007 2006
Q2 Q1 Q4 Q3 Q2 Q1 Q4 Q3 Revenue $311.2
$285.7
$281.5
$289.4
$319.1
$302.3
$294.5
$294.7
Net earnings from continuing operations
$20.0
$18.1
$18.6
$19.6
$15.0
$18.7
$18.1
$18.0
Net earnings from continuing operations per unit
- Basic $1.20
$1.09
$1.12
$1.18
$0.91
$1.13
$1.09
$1.09
- Diluted $1.19
$1.08
$1.11
$1.17
$0.90
$1.12
$1.08
$1.08
Net earnings $20.0
$18.1
$18.6
$19.6
$15.0
$18.7
$19.4
$18.0
Earnings per unit - Basic $1.20
$1.09
$1.12
$1.18
$0.91
$1.13
$1.17
$1.09
- Diluted $1.19
$1.08
$1.11
$1.17
$0.90
$1.12
$1.16
$1.08
Distributable cash (1)
$18.8
$18.4
$19.3
$19.6
$15.9
$19.4
$18.6
$19.4
Distributable cash per unit (1)
- Basic $1.14
$1.11
$1.16
$1.18
$0.96
$1.17
$1.12
$1.17
(1) Non-GAAP measure, see the Non-GAAP Measures Section.
A discussion of the Fund’s previous quarterly results can be found in the Fund’s quarterly MD&A reports available on SEDAR at www.sedar.com.
Liquidity and Capital Resources
The Fund generated $23.3 million of cash from operations before financing activities in the second quarter of 2008 compared to $25.9 million in the second quarter of 2007. The $2.6 million decrease in cash flows from operations before financing activities was due to an increase in non-cash working capital and higher investing activities, offset partly by higher cash flows from operations before changes in non-cash working capital compared to the same period last year.
Cash generated by operating activities amounted to $28.3 million in the second quarter of 2008, with $23.5 million of cash generated from operating earnings and $4.8 million from non-cash working capital. Significant components of the change in non-cash working capital included the following:
Accounts payable and accrued liabilities increased $9.2 million in the quarter, largely due to increased payables to a mining supplier in Mobile Equipment.
Inventory increased $8.4 million, reflecting higher inventory levels in all business segments including higher levels of JCB equipment, due in part to the Greer acquisition in the first quarter of 2008, and Tigercat forestry equipment due to the introduction of the line in December 2007.
Accounts receivable declined $6.1 million resulting from improved collections in Power Systems compared to the last quarter.
Prepaid expenses increased $2.1 million as a result of an increase in the amount of deposits with suppliers.
During the quarter the Fund invested a net amount of $5.0 million. The investing activities included $2.2 million of lift truck rental fleet additions, net of disposals, $2.4 million of other various capital asset additions (including $1.3 million relating to Kinecor’s new computer system), net of disposals, and a $0.3 million post closing adjustment related to the acquisition of Baytec Fluid Power Limited in March 2006.
Funded net debt decreased $6.5 million compared to March 31, 2008 as second quarter cash flows from operations of $23.5 million and a decrease in non-cash working capital of $4.8 million more than offset cash distributions of $16.6 million and capital spending of $5.0 million. Compared to June 30, 2007 funded net debt increased $1.5 million. The Fund’s quarter-end debt-to-equity ratio of 0.43:1 at June 30, 2008 decreased from last quarter’s ratio of 0.47:1 and remains the same as last year’s ratio of 0.43:1. At June 30, 2008 the Fund had borrowed $89.2 million and issued $4.0 million of letters of credit for a total utilization of $93.2 million of its $175 million bank credit facility and had no utilization of its $15 million equipment financing facility.
The Fund’s $175 million bank credit facility along with its $15 million equipment financing demand facility should be sufficient to meet the Fund’s short-term working capital, maintenance capital and growth capital requirements. In the long-term the Fund may be required to access the equity or debt markets in order to fund significant acquisitions and growth related working capital and capital expenditures requirements.
Financial Instruments
The Fund uses derivative financial instruments in the management of its foreign currency and interest rate exposures. The Fund’s policy is not to utilize derivative financial instruments for trading or speculative purposes. Significant derivative financial instrument transactions and those outstanding at the end of the quarter were as follows:
On June 7, 2008 the delayed interest rate swap (entered into on May 9, 2007 with two of its lenders) became effective such that in total the interest rate on the $30 million non-revolving term portion of the bank credit facility is effectively fixed at 4.60% plus applicable margins until expiry of the facility on December 31, 2011. Margins depend on the Fund’s Leverage Ratio and range between 0.75% and 2.50%.
The Fund enters into short-term currency forward contracts to fix the cost of certain inbound inventory and to hedge certain foreign currency-denominated sales to, or receivables from, customers as part of its normal course of business. As at June 30, 2008, the Fund had contracts outstanding to buy US$15.2 million and €0.2 million (June 30, 2007 – to buy US$7.0 million and €1.3 million). These include contracts expiring between July 2008 and October 2009, with U.S. dollar rates ranging from 0.9880 to 1.0300 and Euro dollar rates ranging from 1.4934 to 1.5711.
Contractual Obligations
There have been no material changes to contractual obligations since December 31, 2007.
Off Balance Sheet Financing
The Mobile Equipment segment had $51.3 million of consigned inventory on-hand from a major manufacturer as at June 30, 2008 compared to $60.9 million the previous year. In the normal course of business, Wajax receives inventory on consignment from this manufacturer which is generally sold to customers or purchased by Wajax. This consigned inventory is not included in the Fund’s inventory as the manufacturer retains title to the goods.
The Fund’s off balance sheet financing arrangements with Wajax Finance (a “private label” financing operation of CIT Financial Ltd.) include operating lease contracts in relation to the Fund’s long-term lift truck rental fleet in the Mobile Equipment segment. At June 30, 2008, the non-discounted operating lease commitment for the rental fleet was $10.9 million (June 30, 2007 - $15.8 million).
Non-GAAP Measures
To supplement the consolidated financial statements, the Fund uses non-GAAP financial measures that do not have standardized meaning prescribed by Canadian GAAP and are therefore unlikely to be comparable to similar measures used by other entities.
“Distributable cash” and “Distributable cash per unit” are not recognized measures under GAAP, and the method of calculation adopted by the Fund may differ from methods used by other entities. Accordingly, “Distributable cash” and “Distributable cash per unit” as presented may not be comparable to similar measures presented by other entities. The Fund believes that “Distributable cash” and “Distributable cash per unit” are useful financial metrics as they represent the key determination of cash flow available for distribution to unitholders. “Distributable cash” and “Distributable cash per unit” should not be construed as an alternative to net earnings as determined by GAAP. Distributable cash is calculated as cash flows from operating activities from continuing operations adjusted for changes in non-cash working capital, less maintenance capital expenditures and amortization of deferred financing costs. Changes in non-cash working capital are excluded from distributable cash as the Fund currently has a $175 million bank credit facility which is available for use to fund general corporate requirements including working capital requirements, subject to borrowing capacity restrictions dependent on the level of the Fund’s inventories on-hand and outstanding trade accounts receivable, and a $15 million demand inventory equipment financing facility with a non-bank lender. In addition, the Fund will periodically finance equipment inventory on a non-interest bearing basis through Wajax Finance, a “private label” financing operation of CIT Financial Ltd. See the Distributable Cash section below for the method of calculating the Fund’s “Distributable cash”.
“Maintenance capital expenditures” is not a recognized measure under GAAP, and the method of calculation adopted by the Fund may differ from methods used by other entities. The Fund believes that “Maintenance capital expenditures” represents cash expenditures required to maintain normal operations. “Maintenance capital expenditures” exclude business acquisitions and land and building additions as they are considered to be expenditures that are not required to maintain normal operations. See the Distributable Cash and Estimated Distributable Cash sections below for the method of calculating “Maintenance capital expenditures”.
“Standardized distributable cash” and “Standardized distributable cash per unit” are not recognized measures under GAAP. However, “Standardized distributable cash” has been calculated following the guidance provided in the CICA publication: Standardized Distributable Cash in Income Trusts and Other Flow-Through Entities: Guidance on Preparation and Disclosure. While the Fund has followed the principles of this guidance, the Fund has made assumptions and judgments in determining how such guidance is to be applied. In this respect, the Fund’s calculation may differ from similar calculations done by other entities. See the Standardized Distributable Cash and Reconciliation to Distributable Cash section for the method of calculating the Fund’s “Standardized distributable cash”.
“EBIT” is not a recognized measure under GAAP, and has been calculated as earnings before, interest and taxes and may differ from methods used by other entities.
Distributions
The Fund intends to make monthly cash distributions, generally payable to unitholders of record on the last business day of each calendar month and to be paid on or about the 20th day of the following month. The Fund may make special cash and/or special non-cash distributions at the end of the year to ensure, as provided in the Fund’s Declaration of Trust, that the Fund’s total distributions for the year are equal to its taxable income for the year.
Distributions are based on distributable cash (see Non-GAAP Measures and Distributable Cash sections) and dependent on, among other things, the cash flow generated from operations before changes in non-cash working capital and after providing for maintenance capital expenditures (see Non-GAAP Measures section) and any amount that the Trustees may reasonably consider to be necessary to provide for the payment of costs or other obligations that have been or are reasonably expected to be incurred by the Fund. See Distributable Cash section below.
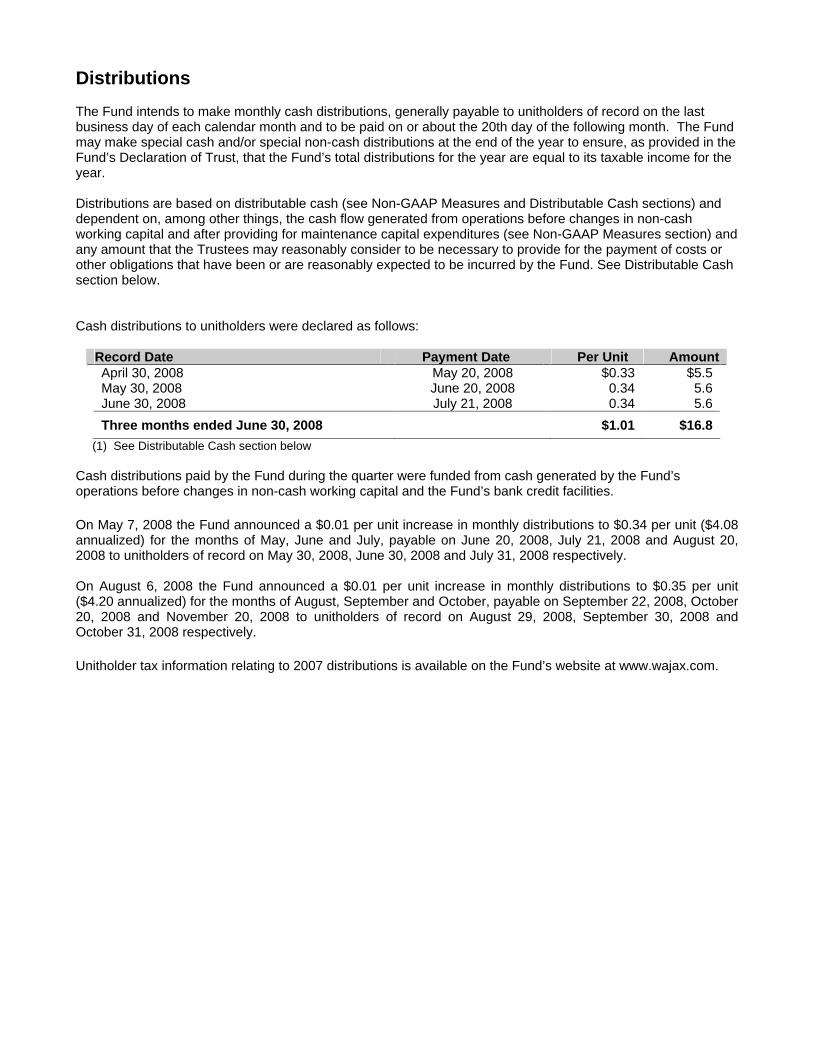
Cash distributions to unitholders were declared as follows:
Record Date Payment Date Per Unit Amount April 30, 2008 May 20, 2008 $0.33 $5.5 May 30, 2008 June 20, 2008 0.34 5.6 June 30, 2008 July 21, 2008 0.34 5.6
Three months ended June 30, 2008 $1.01 $16.8
(1) See Distributable Cash section below
Cash distributions paid by the Fund during the quarter were funded from cash generated by the Fund’s operations before changes in non-cash working capital and the Fund’s bank credit facilities.
On May 7, 2008 the Fund announced a $0.01 per unit increase in monthly distributions to $0.34 per unit ($4.08 annualized) for the months of May, June and July, payable on June 20, 2008, July 21, 2008 and August 20, 2008 to unitholders of record on May 30, 2008, June 30, 2008 and July 31, 2008 respectively.
On August 6, 2008 the Fund announced a $0.01 per unit increase in monthly distributions to $0.35 per unit ($4.20 annualized) for the months of August, September and October, payable on September 22, 2008, October 20, 2008 and November 20, 2008 to unitholders of record on August 29, 2008, September 30, 2008 and October 31, 2008 respectively.
Unitholder tax information relating to 2007 distributions is available on the Fund’s website at www.wajax.com.
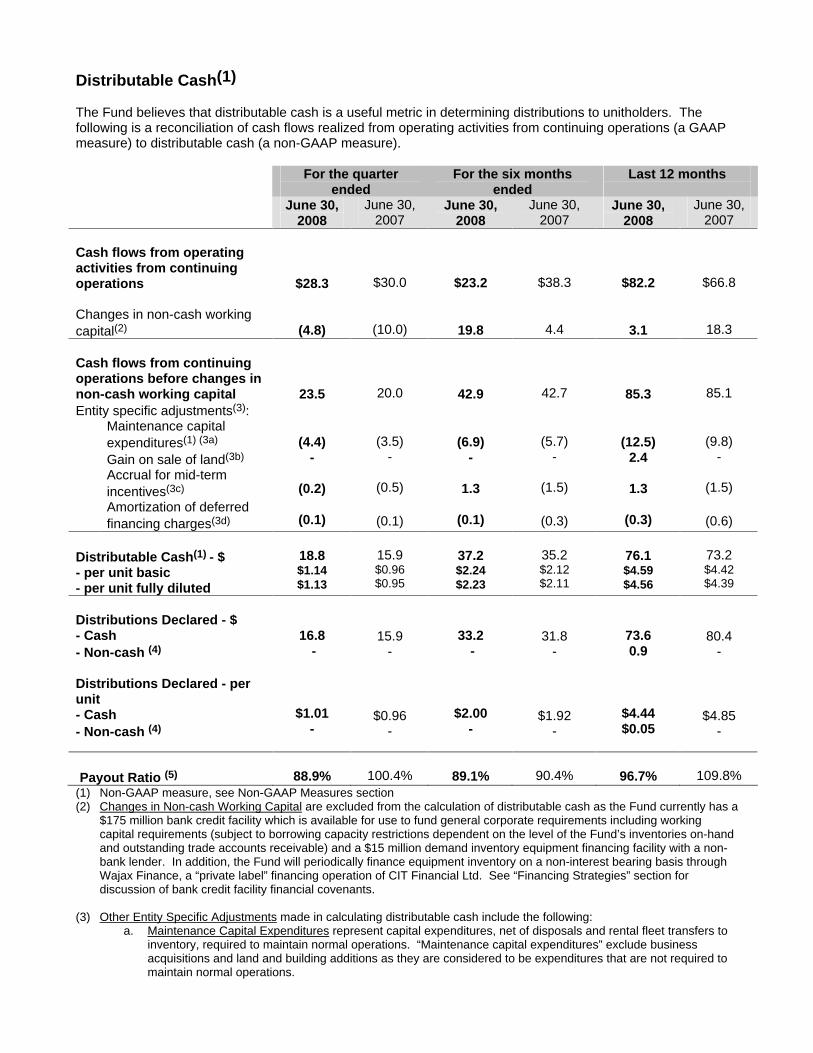
Distributable Cash(1)
The Fund believes that distributable cash is a useful metric in determining distributions to unitholders. The following is a reconciliation of cash flows realized from operating activities from continuing operations (a GAAP measure) to distributable cash (a non-GAAP measure).
For the quarter ended
For the six months ended
Last 12 months
June 30,
2008 June 30,
2007 June 30,
2008 June 30,
2007 June 30,
2008 June 30,
2007
Cash flows from operating activities from continuing operations $28.3 $30.0 $23.2 $38.3 $82.2 $66.8
Changes in non-cash working capital(2) (4.8) (10.0) 19.8 4.4 3.1 18.3
Cash flows from continuing operations before changes in non-cash working capital 23.5 20.0 42.9 42.7 85.3 85.1 Entity specific adjustments(3):
Maintenance capital expenditures(1) (3a)
Gain on sale of land(3b)
Accrual for mid-term incentives(3c)
Amortization of deferred financing charges(3d)
(4.4) -
(0.2)
(0.1)
(3.5) -
(0.5)
(0.1)
(6.9) -
1.3
(0.1)
(5.7) -
(1.5)
(0.3)
(12.5) 2.4
1.3
(0.3)
(9.8) -
(1.5)
(0.6)
Distributable Cash(1) - $ - per unit basic - per unit fully diluted
18.8 $1.14 $1.13
15.9 $0.96 $0.95
37.2 $2.24 $2.23
35.2 $2.12 $2.11
76.1 $4.59 $4.56
73.2 $4.42 $4.39
Distributions Declared - $ - Cash - Non-cash (4)
Distributions Declared - per unit - Cash - Non-cash (4)
16.8 -
$1.01 -
15.9 -
$0.96 -
33.2 -
$2.00 -
31.8 -
$1.92 -
73.6 0.9
$4.44 $0.05
80.4 -
$4.85 -
Payout Ratio (5) 88.9% 100.4% 89.1% 90.4% 96.7% 109.8% (1) Non-GAAP measure, see Non-GAAP Measures section (2) Changes in Non-cash Working Capital are excluded from the calculation of distributable cash as the Fund currently has a
$175 million bank credit facility which is available for use to fund general corporate requirements including working capital requirements (subject to borrowing capacity restrictions dependent on the level of the Fund’s inventories on-hand and outstanding trade accounts receivable) and a $15 million demand inventory equipment financing facility with a non-bank lender. In addition, the Fund will periodically finance equipment inventory on a non-interest bearing basis through Wajax Finance, a “private label” financing operation of CIT Financial Ltd. See “Financing Strategies” section for discussion of bank credit facility financial covenants.
(3) Other Entity Specific Adjustments made in calculating distributable cash include the following: a. Maintenance Capital Expenditures represent capital expenditures, net of disposals and rental fleet transfers to
inventory, required to maintain normal operations. “Maintenance capital expenditures” exclude business acquisitions and land and building additions as they are considered to be expenditures that are not required to maintain normal operations.
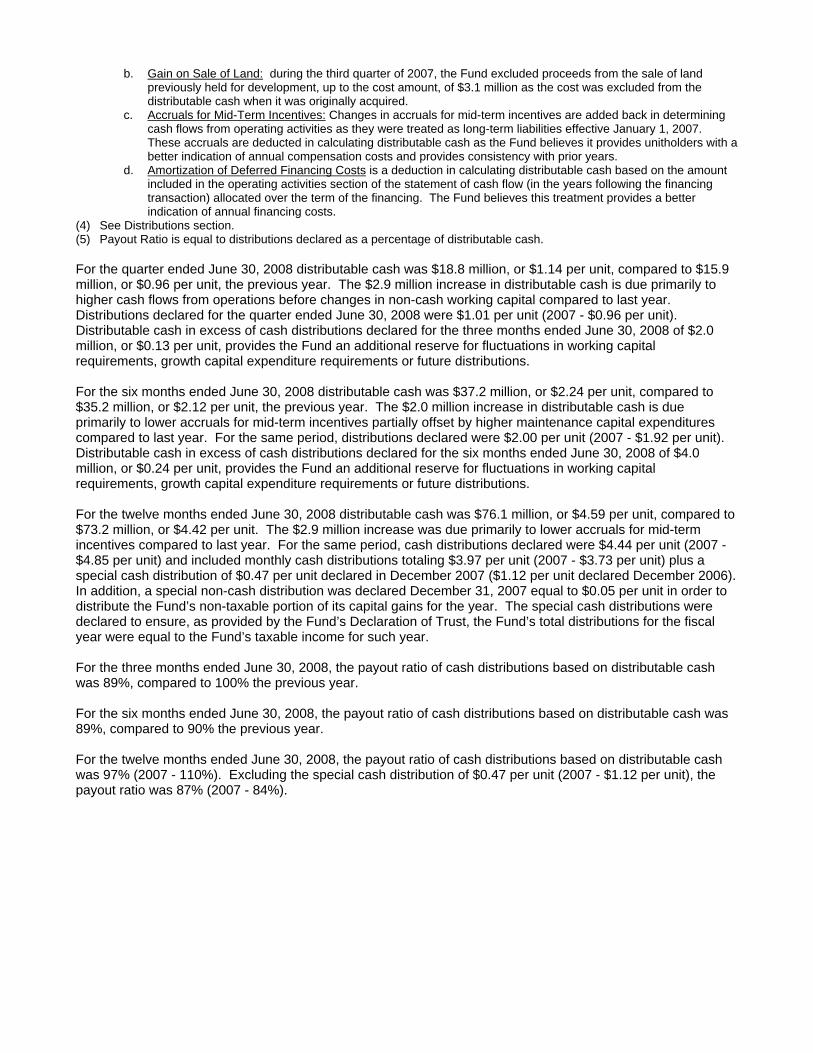
b. Gain on Sale of Land: during the third quarter of 2007, the Fund excluded proceeds from the sale of land
previously held for development, up to the cost amount, of $3.1 million as the cost was excluded from the distributable cash when it was originally acquired.
c. Accruals for Mid-Term Incentives: Changes in accruals for mid-term incentives are added back in determining cash flows from operating activities as they were treated as long-term liabilities effective January 1, 2007. These accruals are deducted in calculating distributable cash as the Fund believes it provides unitholders with a better indication of annual compensation costs and provides consistency with prior years.
d. Amortization of Deferred Financing Costs is a deduction in calculating distributable cash based on the amount included in the operating activities section of the statement of cash flow (in the years following the financing transaction) allocated over the term of the financing. The Fund believes this treatment provides a better indication of annual financing costs.
(4) See Distributions section. (5) Payout Ratio is equal to distributions declared as a percentage of distributable cash.
For the quarter ended June 30, 2008 distributable cash was $18.8 million, or $1.14 per unit, compared to $15.9 million, or $0.96 per unit, the previous year. The $2.9 million increase in distributable cash is due primarily to higher cash flows from operations before changes in non-cash working capital compared to last year. Distributions declared for the quarter ended June 30, 2008 were $1.01 per unit (2007 - $0.96 per unit). Distributable cash in excess of cash distributions declared for the three months ended June 30, 2008 of $2.0 million, or $0.13 per unit, provides the Fund an additional reserve for fluctuations in working capital requirements, growth capital expenditure requirements or future distributions.
For the six months ended June 30, 2008 distributable cash was $37.2 million, or $2.24 per unit, compared to $35.2 million, or $2.12 per unit, the previous year. The $2.0 million increase in distributable cash is due primarily to lower accruals for mid-term incentives partially offset by higher maintenance capital expenditures compared to last year. For the same period, distributions declared were $2.00 per unit (2007 - $1.92 per unit). Distributable cash in excess of cash distributions declared for the six months ended June 30, 2008 of $4.0 million, or $0.24 per unit, provides the Fund an additional reserve for fluctuations in working capital requirements, growth capital expenditure requirements or future distributions.
For the twelve months ended June 30, 2008 distributable cash was $76.1 million, or $4.59 per unit, compared to $73.2 million, or $4.42 per unit. The $2.9 million increase was due primarily to lower accruals for mid-term incentives compared to last year. For the same period, cash distributions declared were $4.44 per unit (2007 - $4.85 per unit) and included monthly cash distributions totaling $3.97 per unit (2007 - $3.73 per unit) plus a special cash distribution of $0.47 per unit declared in December 2007 ($1.12 per unit declared December 2006). In addition, a special non-cash distribution was declared December 31, 2007 equal to $0.05 per unit in order to distribute the Fund’s non-taxable portion of its capital gains for the year. The special cash distributions were declared to ensure, as provided by the Fund’s Declaration of Trust, the Fund’s total distributions for the fiscal year were equal to the Fund’s taxable income for such year.
For the three months ended June 30, 2008, the payout ratio of cash distributions based on distributable cash was 89%, compared to 100% the previous year.
For the six months ended June 30, 2008, the payout ratio of cash distributions based on distributable cash was 89%, compared to 90% the previous year.
For the twelve months ended June 30, 2008, the payout ratio of cash distributions based on distributable cash was 97% (2007 - 110%). Excluding the special cash distribution of $0.47 per unit (2007 - $1.12 per unit), the payout ratio was 87% (2007 - 84%).
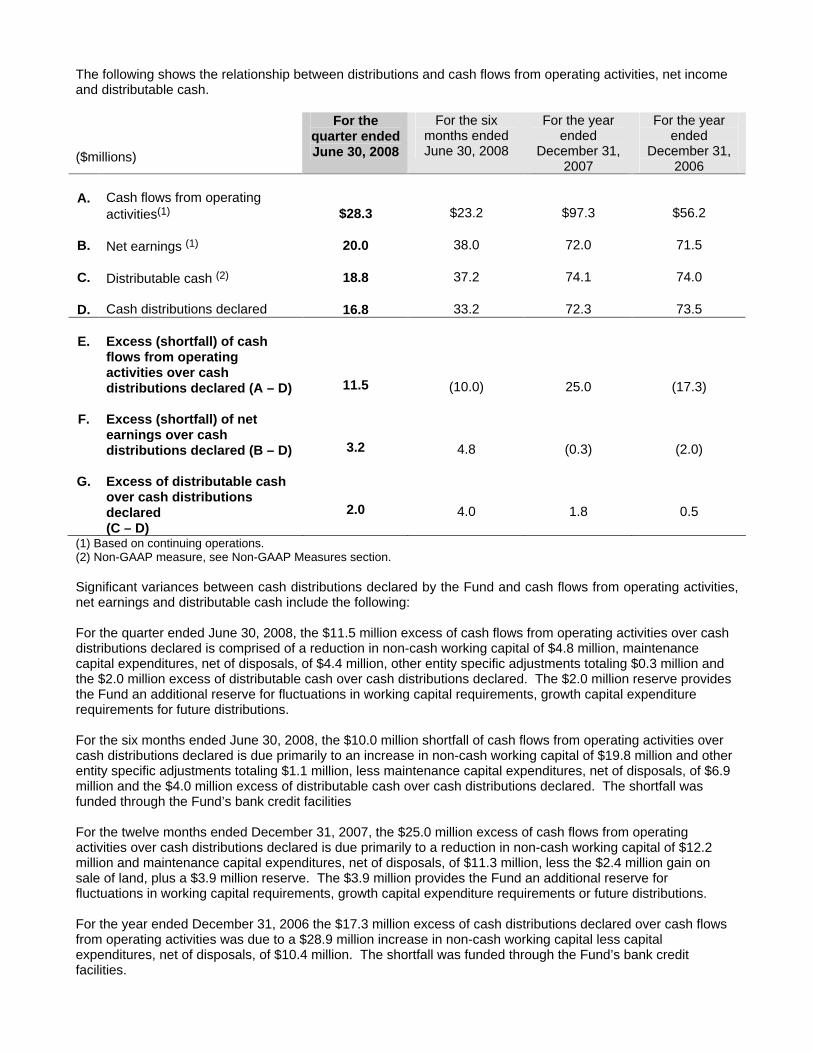
The following shows the relationship between distributions and cash flows from operating activities, net income and distributable cash.
($millions)
For the quarter ended June 30, 2008
For the six months ended June 30, 2008
For the year ended
December 31, 2007
For the year ended
December 31, 2006
A. Cash flows from operating activities(1) $28.3 $23.2 $97.3 $56.2
B. Net earnings (1) 20.0 38.0 72.0 71.5
C. Distributable cash (2) 18.8 37.2 74.1 74.0
D. Cash distributions declared 16.8 33.2 72.3 73.5
E. Excess (shortfall) of cash flows from operating activities over cash distributions declared (A – D) 11.5 (10.0) 25.0 (17.3)
F. Excess (shortfall) of net earnings over cash distributions declared (B – D) 3.2 4.8 (0.3) (2.0)
G. Excess of distributable cash over cash distributions declared (C – D)
2.0 4.0 1.8 0.5
(1) Based on continuing operations. (2) Non-GAAP measure, see Non-GAAP Measures section.
Significant variances between cash distributions declared by the Fund and cash flows from operating activities, net earnings and distributable cash include the following:
For the quarter ended June 30, 2008, the $11.5 million excess of cash flows from operating activities over cash distributions declared is comprised of a reduction in non-cash working capital of $4.8 million, maintenance capital expenditures, net of disposals, of $4.4 million, other entity specific adjustments totaling $0.3 million and the $2.0 million excess of distributable cash over cash distributions declared. The $2.0 million reserve provides the Fund an additional reserve for fluctuations in working capital requirements, growth capital expenditure requirements for future distributions.
For the six months ended June 30, 2008, the $10.0 million shortfall of cash flows from operating activities over cash distributions declared is due primarily to an increase in non-cash working capital of $19.8 million and other entity specific adjustments totaling $1.1 million, less maintenance capital expenditures, net of disposals, of $6.9 million and the $4.0 million excess of distributable cash over cash distributions declared. The shortfall was funded through the Fund’s bank credit facilities
For the twelve months ended December 31, 2007, the $25.0 million excess of cash flows from operating activities over cash distributions declared is due primarily to a reduction in non-cash working capital of $12.2 million and maintenance capital expenditures, net of disposals, of $11.3 million, less the $2.4 million gain on sale of land, plus a $3.9 million reserve. The $3.9 million provides the Fund an additional reserve for fluctuations in working capital requirements, growth capital expenditure requirements or future distributions.
For the year ended December 31, 2006 the $17.3 million excess of cash distributions declared over cash flows from operating activities was due to a $28.9 million increase in non-cash working capital less capital expenditures, net of disposals, of $10.4 million. The shortfall was funded through the Fund’s bank credit facilities.
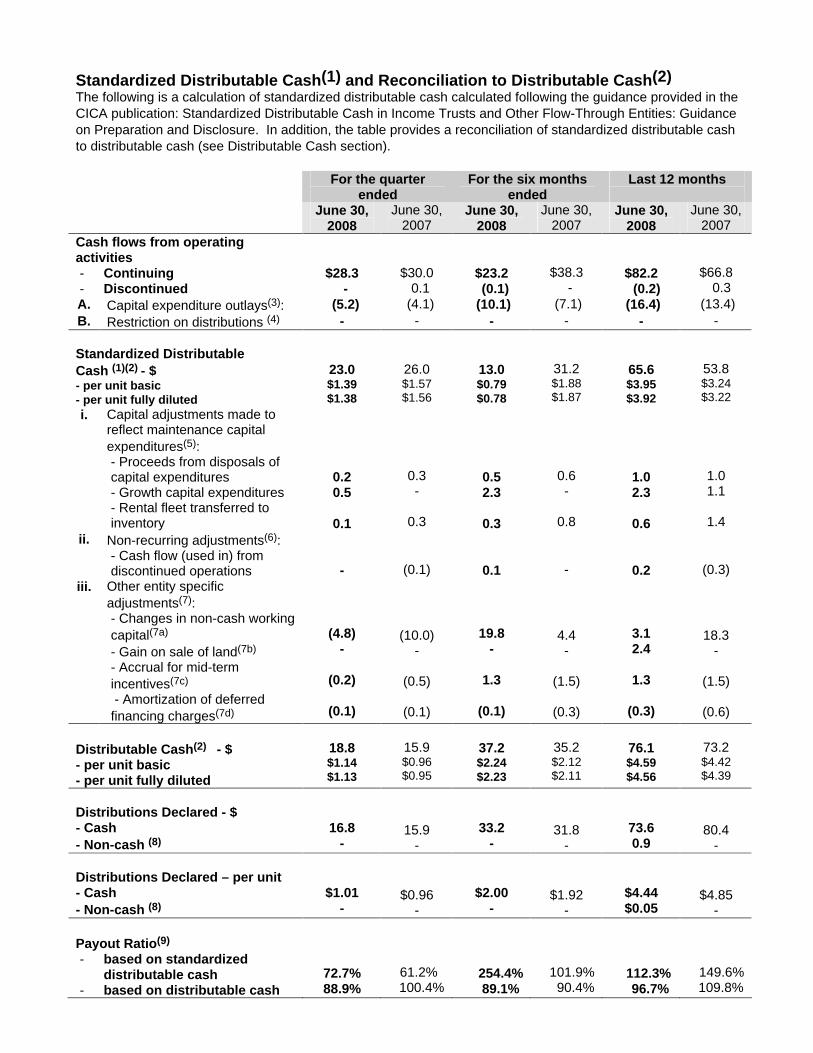
Standardized Distributable Cash(1) and Reconciliation to Distributable Cash(2) The following is a calculation of standardized distributable cash calculated following the guidance provided in the CICA publication: Standardized Distributable Cash in Income Trusts and Other Flow-Through Entities: Guidance on Preparation and Disclosure. In addition, the table provides a reconciliation of standardized distributable cash to distributable cash (see Distributable Cash section).
For the quarter ended
For the six months ended
Last 12 months
June 30,
2008 June 30,
2007 June 30,
2008 June 30,
2007 June 30,
2008 June 30,
2007 Cash flows from operating activities - Continuing - Discontinued
$28.3 -
$30.0 0.1
$23.2 (0.1)
$38.3 -
$82.2 (0.2)
$66.8 0.3
A. Capital expenditure outlays(3): (5.2) (4.1) (10.1) (7.1) (16.4) (13.4) B. Restriction on distributions (4) - - - - - -
Standardized Distributable Cash (1)(2) - $ - per unit basic - per unit fully diluted
23.0 $1.39 $1.38
26.0 $1.57 $1.56
13.0 $0.79 $0.78
31.2 $1.88 $1.87
65.6 $3.95 $3.92
53.8 $3.24 $3.22
i. Capital adjustments made to reflect maintenance capital expenditures(5): - Proceeds from disposals of capital expenditures - Growth capital expenditures - Rental fleet transferred to inventory
0.2 0.5
0.1
0.3 -
0.3
0.5 2.3
0.3
0.6 -
0.8
1.0 2.3
0.6
1.0 1.1
1.4 ii. Non-recurring adjustments(6):
- Cash flow (used in) from discontinued operations - (0.1) 0.1 - 0.2 (0.3)
iii. Other entity specific adjustments(7): - Changes in non-cash working capital(7a)
- Gain on sale of land(7b)
- Accrual for mid-term incentives(7c)
- Amortization of deferred financing charges(7d)
(4.8) -
(0.2)
(0.1)
(10.0) -
(0.5)
(0.1)
19.8 -
1.3
(0.1)
4.4 -
(1.5)
(0.3)
3.1 2.4
1.3
(0.3)
18.3 -
(1.5)
(0.6)
Distributable Cash(2) - $ - per unit basic - per unit fully diluted
18.8 $1.14 $1.13
15.9 $0.96 $0.95
37.2 $2.24 $2.23
35.2 $2.12 $2.11
76.1 $4.59 $4.56
73.2 $4.42 $4.39
Distributions Declared - $ - Cash - Non-cash (8)
16.8 -
15.9 -
33.2 -
31.8 -
73.6 0.9
80.4 -
Distributions Declared – per unit - Cash - Non-cash (8)
$1.01 -
$0.96 -
$2.00 -
$1.92 -
$4.44 $0.05
$4.85 -
Payout Ratio(9)
- based on standardized distributable cash
- based on distributable cash 72.7% 88.9%
61.2% 100.4%
254.4%
89.1% 101.9% 90.4%
112.3% 96.7%
149.6% 109.8%
(1) Standardized distributable cash is a non-GAAP measure calculated following the guidance provided in the CICA
publication: Standardized Distributable Cash in Income Trusts and Other Flow-Through Entities: Guidance on Preparation and Disclosure.
(2) Non-GAAP measure, see Non-GAAP Measures section. (3) Capital expenditure outlays include both maintenance capital expenditure outlays and growth capital expenditure
outlays deducted in calculating standardized distributable cash. See Productivity Capacity and Productivity Capacity Management section.
(4) There are currently no restrictions on distributions arising from compliance with financial covenants. See Financing Strategies section.
(5) Capital adjustments are made to adjust capital expenditure outlays (deducted in computing standardized distributable cash) to reflect maintenance capital expenditures, net of disposals, as a deduction in computing distributable cash. These adjustments include: the exclusion of growth capital, the inclusion of proceeds from the disposal of capital expenditures and rental fleet transferred to inventory. See Non-GAAP Measures and Productivity Capacity and Productivity Capacity Management sections for calculation of maintenance capital expenditures.
(6) Non-recurring adjustments include the exclusion of cash flows (used in) from discontinued operations in calculating distributable cash as they are not a reflection of the Fund’s expected future cash flows.
(7) Other Entity Specific Adjustments made in calculating distributable cash include the following: a. Changes in Non-cash Working Capital see Distributable Cash section. b. Gain on Sale of Land see Distributable Cash section. c. Accruals for Mid-Term Incentives see Distributable Cash section. d. Amortization of Deferred Financing Costs see Distributable Cash section.
(8) See Distributions section. (9) Payout ratio is equal to distributions declared as a percentage of distributable cash.
For the quarter ended June 30, 2008 standardized distributable cash was $23.0 million, or $1.39 per unit, compared to $26.0 million, or $1.57 per unit, the previous year. The $3.0 million reduction was due primarily to the $1.7 million increase in non-cash working capital usage and $1.1 million higher capital expenditures.
For the six months ended June 30, 2008 standardized distributable cash was $13.0 million, or $0.79 per unit, compared to $31.2 million, or $1.88 per unit, the previous year. The $18.2 million reduction was due primarily to the $15.4 million increase in non-cash working capital usage, offset partially by $3.0 million lower capital expenditures.
Since the conversion of Wajax Limited to Wajax Income Fund on June 15, 2005, the payout ratio of cash distributions based on standardized distributable cash and distributable cash is 130.8% and 96.1%, respectively. The difference is due primarily to changes in non-cash working capital of $42.5 million, capital adjustments and other entity specific adjustments since conversion that have been funded through the Fund’s bank credit facility. See Financing Strategies section.
Productive Capacity and Productive Capacity Management
Wajax is a distributor and service support provider. As such, the Fund’s productive capacity is determined primarily by its branch infrastructure across Canada, manufacturer relationships and other maintenance and growth capital employed.
Wajax operates from 103 facilities throughout Canada, of which 72 are leased. Wajax’s principal properties are primarily sales and service outlets. (At December 31, 2007, the non-discounted operating lease commitments for facilities totaled $59.2 million.)
The Fund seeks to distribute leading product lines in each of its regional markets and its success is dependent upon continuing relations with the manufacturers it represents. The Fund endeavours to align itself in long-term relationships with manufacturers that are committed to achieving a competitive advantage and long-term market leadership in their targeted market segments. In the mobile equipment, power systems, and hydraulics and process pumps businesses, manufacturer relationships are generally governed through effectively exclusive distribution agreements. Distribution agreements are for the most part open-ended, but are cancellable within a relatively short notification period specified in the agreement.

Maintenance capital employed includes rental fleet primarily in the Mobile Equipment segment, which will vary with market demand, and other capital which is employed primarily to support and maintain the branch network operations.
In addition, the Fund enters into off balance sheet financing arrangements including operating lease contracts entered into for the long-term lift truck rental fleet in Mobile Equipment with Wajax Finance, vehicles and other equipment. (At December 31, 2007, the non-discounted operating lease commitments for rental fleet totaled $13.1 million, vehicles $0.6 million and other equipment $1.6 million.)
Growth capital expenditures include acquisitions of land and building that are not required to maintain normal operations.
For the seven year period from 2000 to 2007, average annual maintenance capital expenditures, net of proceeds from disposals, (including rental fleet but excluding discontinued operations and an ERP computer system abandoned in 2002), were $8.9 million. The annual maintenance capital expenditures varied between $3.4 million and $12.0 million during the period. Management’s expectation for future annual maintenance capital expenditures is between $8 million and $14 million.
Financing Strategies
The Fund’s $175 million bank credit facility along with the $15 million demand inventory equipment financing facility should be sufficient to meet the Fund’s short-term working capital, maintenance capital and growth capital requirements.
In the long-term the Fund may be required to access the equity or debt markets or reduce distributions in order to fund significant acquisitions and growth related working capital and capital expenditures.
The Fund’s short-term working capital requirements can swing widely quarter-to-quarter due to timing of large inventory purchases and/or sales and changes in market activity. In general, as Wajax experiences growth, there is a need for additional working capital as was the case in 2006 and in the first quarter of 2008. Conversely, as Wajax experiences economic slowdowns working capital reduces, reflecting the lower activity levels. This can result in standardized distributable cash increasing in years of declining activity and decreasing in years of growth. Fluctuations in working capital are generally funded by, or used to repay, the bank credit facilities. Therefore, for the reasons noted the Fund adjusts for changes in non-cash working capital in calculating distributable cash in periods where the Fund has capacity under its credit facility to fund the changes in non-cash working capital.
The bank credit facility contains covenants that could restrict the ability of the Fund to make cash distributions, if (i) an event of default exists or would exist as a result of a cash distribution, and (ii) the leverage ratio (Debt to EBITDA) is greater than 3.0. If the leverage ratio is less than or equal to 3.0, then the aggregate cash distributions by the borrowers in each fiscal quarter may not exceed 115% of distributable cash for the trailing four fiscal quarters. Notwithstanding the restrictions relating to the leverage ratio, a special cash distribution in the first quarter of each fiscal year is permitted in an amount not to exceed the amount by which distributable cash for the preceding fiscal year exceeds declared cash distributions for the preceding fiscal year plus any excess cumulative distributable cash over cash distributions of prior years. In addition, borrowing capacity under the bank credit facility is dependent on the level of the Fund’s inventories on-hand and outstanding trade accounts receivables. For further detail, the Fund’s bank credit facility is available on SEDAR at www.sedar.com.
Unit Capital
The trust units of the Fund issued are included in unitholders’ equity on the balance sheet as follows:
Issued and fully paid Trust Units as at June 30, 2008
Number Amount Balance at the beginning of quarter Rights exercised
16,585,206 -
$104.9
-
Balance at end of quarter
16,585,206
$104.9

The Fund has two unit rights plans that issue rights to the participants which are settled by issuing Wajax Income Fund units: the Wajax Unit Ownership Plan in which certain members of management participate and the Trustees’ Deferred Unit Plan. Compensation expense is determined based upon the fair value of the rights when issued and recognized over the vesting period. The Fund recorded compensation cost of $559 thousand for the quarter (2007 - $302 thousand) and $1,024 thousand for the year to date (2007 - $620 thousand) in respect of these plans.
Critical Accounting Estimates
Critical accounting estimates used by the Fund’s management are discussed in detail in the MD&A for the year ended December 31, 2007 which can be found on SEDAR at www.sedar.com.
Changes in Accounting Policy
The following is a summary of the relevant Canadian Institute of Chartered Accountants (“CICA”) Handbook revisions that were adopted by the Fund on January 1, 2008.
Capital Disclosures CICA Handbook Section 1535, Capital Disclosures, establishes standards for disclosure of information regarding an entity’s capital and how it is managed. It requires disclosure of an entity’s objectives, policies and processes for managing capital. In addition, disclosures are to be included whether companies have complied with externally imposed capital requirements and the consequences of any non-compliance. This standard has no impact on the recognition and measurement of amounts included in the financial statements.
Inventories CICA Handbook Section 3031, Inventories, changes the standards for the measurement and disclosure of inventories. The measurement changes include the elimination of the last in first out method, the requirement to measure inventories at the lower of cost and net realizable value, the allocation of overhead based on normal capacity, the use of the specific cost method for inventories that are not ordinarily interchangeable or goods and services produced for specific purposes, the requirement for an entity to use a consistent cost formula for inventory of a similar nature and use, and the reversal of previous write-downs to net realizable value when there is a subsequent increase in the value of inventories. The Fund retrospectively adopted the new inventory requirements without restatement. It reassessed the method whereby it was allocating service department overhead to cost of conversion resulting in an increase in the carrying value of work in process inventory of $0.7 million and an adjustment of $0.6 million (net of tax of $0.1 million) which was recorded directly to opening accumulated retained earnings. Disclosures of inventories have also been enhanced. Inventory policies, carrying amounts, amounts recognized as an expense, write-downs and the reversals of write-downs are required to be disclosed.
Financial Instruments – Disclosures and Financial Instruments - Presentation CICA Handbook Sections 3862 and 3863 increase the emphasis on the risks associated with both recognized and unrecognized financial instruments and how those risks are managed. The new presentation standards carry forward the former presentation requirements. The above standard has no impact on the recognition and measurement of amounts included in the financial statements.
Goodwill and Intangible Assets In February 2008, the CICA issued Handbook Section 3064, Goodwill and Intangible Assets, replacing Section 3062, Goodwill and Other Intangible Assets, and Section 3450, Research and Development Costs. New Section 3064 provides new guidelines for recognition, measurement, presentation and disclosure of goodwill and intangible assets. The Section also issued amendments to Section 1000, Financial Statement Concepts. These changes are effective for fiscal years beginning on or after October 1, 2008, with earlier adoption encouraged. Collectively, these changes bring Canadian practice closer to International Financial Reporting Standards and U.S. GAAP by eliminating the practice of recognizing as assets a variety of startup, pre-production and similar costs that do not meet the definition and recognition criteria of an asset. The Fund has decided to early adopt CICA 3064. Adoption of this standard has no impact on the recognition and measurement of amounts included in the financial statements and no additional disclosure is necessary.
The following is a summary of new standards which will impact the Fund:

In February 2008, The Canadian Accounting Standards Board confirmed that the use of International Financial Reporting Standards (IFRS) will be required in Canada for publicly accountable profit oriented enterprises for fiscal years beginning on or after January 1, 2011. The Fund will be required to report using IFRS beginning January 1, 2011. IFRS uses a conceptual framework similar to current Canadian GAAP, but there are significant differences in recognition, measurement and disclosures.
We are currently in the process of evaluating the potential impact of IFRS on our consolidated financial statements. Our project will consist of four phases: awareness, assessment, design and implementation. We have substantially completed the awareness phase. During the assessment phase, which we anticipate to have substantially completed by the end of 2008, we will determine major recognition, measurement and reporting differences and assess impacts on business process and information systems. Subsequently, the design phase will involve selection of accounting policies where choices exist and development of appropriate disclosures. We will then implement the revised accounting policies based on the choices made, change business processes and information systems and execute training and communications programs.
Risks and Uncertainties
As with most businesses, the Fund is subject to a number of marketplace and industry related risks and uncertainties which could have a material impact on operating results. The Fund attempts to minimize many of these risks through diversification of core businesses and through the geographic diversity of its operations. There are however, a number of risks that deserve particular comment which are discussed in detail in the MD&A for the year ended December 31, 2007 which can be found on SEDAR at www.sedar.com. For the period January 1, 2008 to August 6, 2008 there have been no material changes to the business of the Fund that require an update to the discussion of the applicable risks discussed in the MD&A for the year ended December 31, 2007.
Outlook
As expected, strong market segments such as mining, including the oil sands, and infrastructure more than offset weaker areas of the Canadian economy in the quarter. Strong Mobile Equipment parts and service sales benefited from servicing equipment sold in previous years. Looking forward, management continues to be concerned about the strength of several sectors of the Canadian economy, particularly manufacturing, forestry and residential construction. However, management anticipates a continuing benefit from strong sectors such as mining and infrastructure plus further growth in after-market support revenue. As well, management continues to be optimistic that an increase in natural gas drilling activity in western Canada may occur in the latter part of this year. As a result, management expects 2008 full year earnings to show improvement over the previous year.
Additional information, including the Fund’s Annual Report and Annual Information Form, are available on SEDAR at www.sedar.com.

WAJAX INCOME FUND
Unaudited Consolidated Financial Statements
For the six months ended June 30, 2008
Notice required under National Instrument 51-102, “Continuous Disclosure Obligations” Part 4.3(3) (a):
The attached consolidated financial statements have been prepared by Management of Wajax Income Fund and have not been reviewed by the Fund’s auditors.
WAJAX INCOME FUND
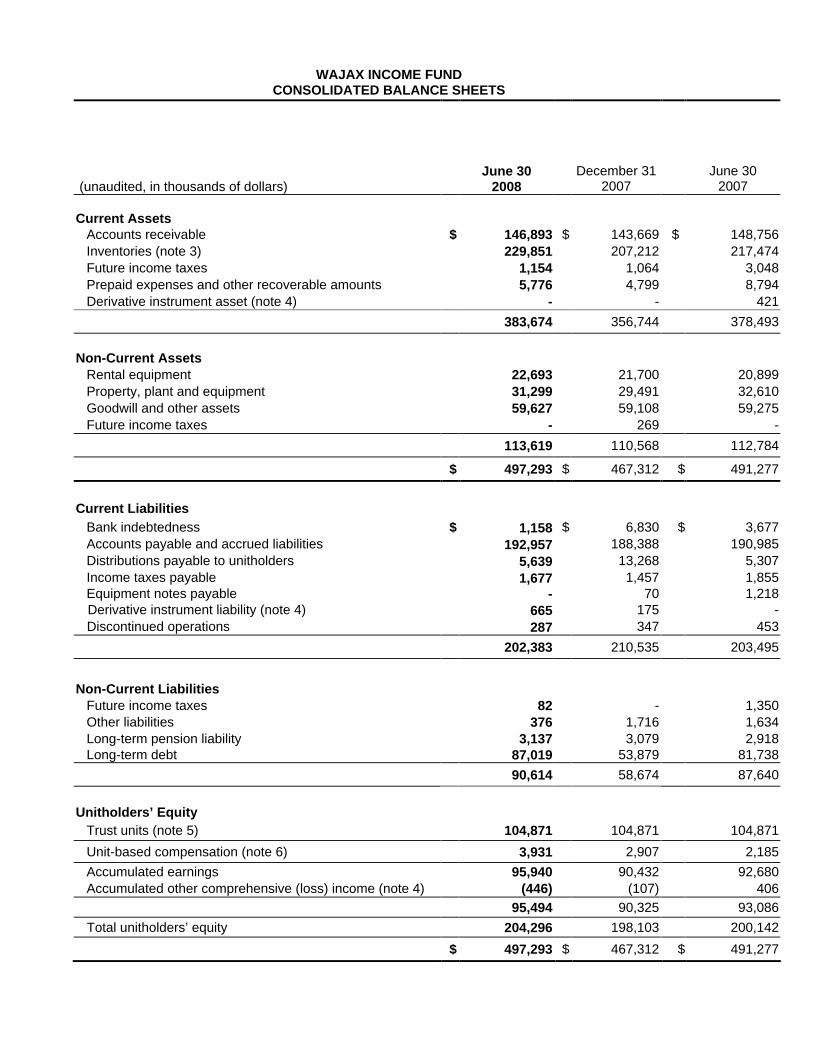
CONSOLIDATED BALANCE SHEETS
(unaudited, in thousands of dollars)
June 30
2008
December 31
2007
June 30 2007
Current Assets
Accounts receivable $
146,893
$
143,669
$
148,756
Inventories (note 3)
229,851
207,212
217,474
Future income taxes
1,154
1,064
3,048
Prepaid expenses and other recoverable amounts
5,776
4,799
8,794
Derivative instrument asset (note 4)
-
-
421
383,674
356,744
378,493
Non-Current Assets
Rental equipment
22,693
21,700
20,899
Property, plant and equipment
31,299
29,491
32,610
Goodwill and other assets
59,627
59,108
59,275
Future income taxes
-
269
-
113,619
110,568
112,784
$
497,293
$
467,312
$ 491,277
Current Liabilities
Bank indebtedness $
1,158
$
6,830
$ 3,677
Accounts payable and accrued liabilities
192,957
188,388
190,985
Distributions payable to unitholders
5,639
13,268
5,307
Income taxes payable
1,677
1,457
1,855
Equipment notes payable
-
70
1,218
Derivative instrument liability (note 4)
665
175
-
Discontinued operations
287
347
453
202,383
210,535
203,495
Non-Current Liabilities
Future income taxes
82
-
1,350
Other liabilities
376
1,716
1,634
Long-term pension liability
3,137
3,079
2,918
Long-term debt
87,019
53,879
81,738
90,614
58,674
87,640
Unitholders’ Equity
Trust units (note 5)
104,871
104,871
104,871
Unit-based compensation (note 6)
3,931
2,907
2,185
Accumulated earnings
95,940
90,432
92,680
Accumulated other comprehensive (loss) income (note 4)
(446)
(107)
406
95,494
90,325
93,086
Total unitholders’ equity
204,296
198,103
200,142
$
497,293
$
467,312
$ 491,277
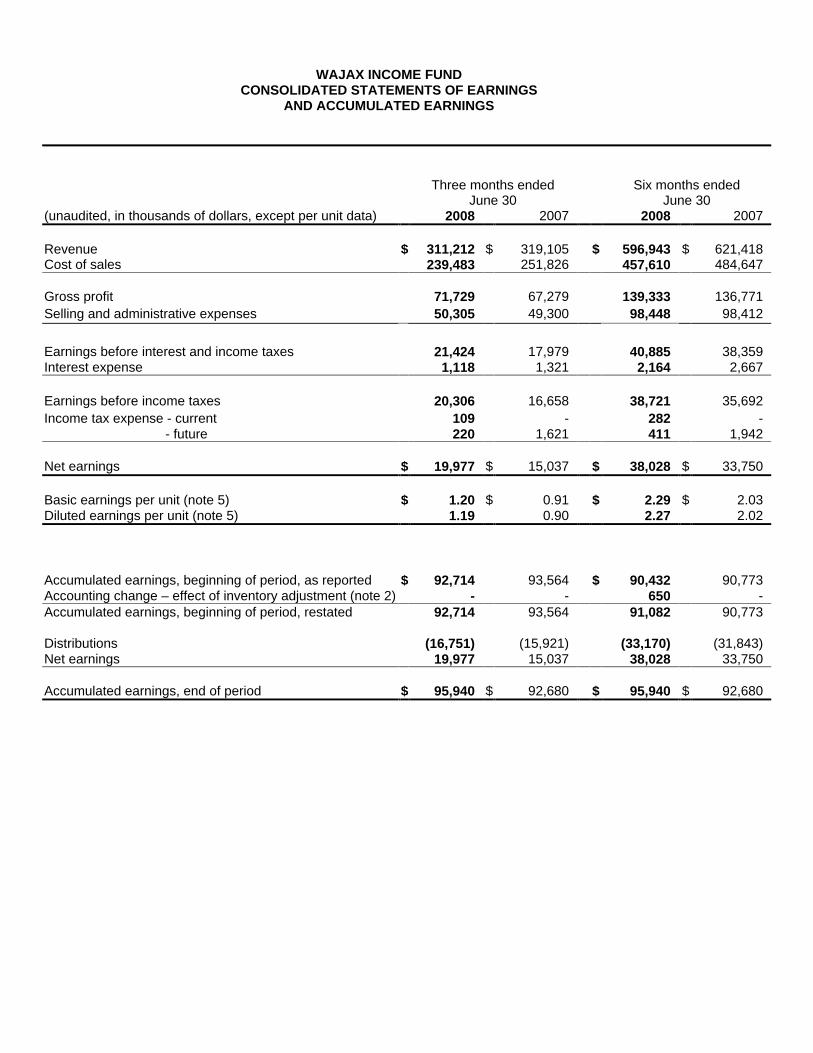
WAJAX INCOME FUND
CONSOLIDATED STATEMENTS OF EARNINGS AND ACCUMULATED EARNINGS
Three months ended
June 30
Six months ended
June 30 (unaudited, in thousands of dollars, except per unit data)
2008
2007
2008
2007
Revenue Cost of sales
$
311,212 239,483
$
319,105 251,826
$
596,943 457,610
$
621,418 484,647
Gross profit
71,729
67,279
139,333
136,771 Selling and administrative expenses
50,305
49,300
98,448
98,412
Earnings before interest and income taxes
21,424
17,979
40,885
38,359 Interest expense
1,118
1,321
2,164
2,667
Earnings before income taxes
20,306
16,658
38,721
35,692 Income tax expense - current
109
-
282
- - future
220
1,621
411
1,942
Net earnings $
19,977 $
15,037
$
38,028 $
33,750
Basic earnings per unit (note 5) $
1.20 $
0.91
$
2.29 $
2.03 Diluted earnings per unit (note 5)
1.19
0.90
2.27
2.02
Accumulated earnings, beginning of period, as reported $
92,714
93,564
$
90,432
90,773 Accounting change – effect of inventory adjustment (note 2)
-
-
650
- Accumulated earnings, beginning of period, restated
92,714
93,564
91,082
90,773
Distributions
(16,751)
(15,921)
(33,170)
(31,843) Net earnings
19,977
15,037
38,028
33,750
Accumulated earnings, end of period $
95,940 $
92,680
$
95,940 $
92,680
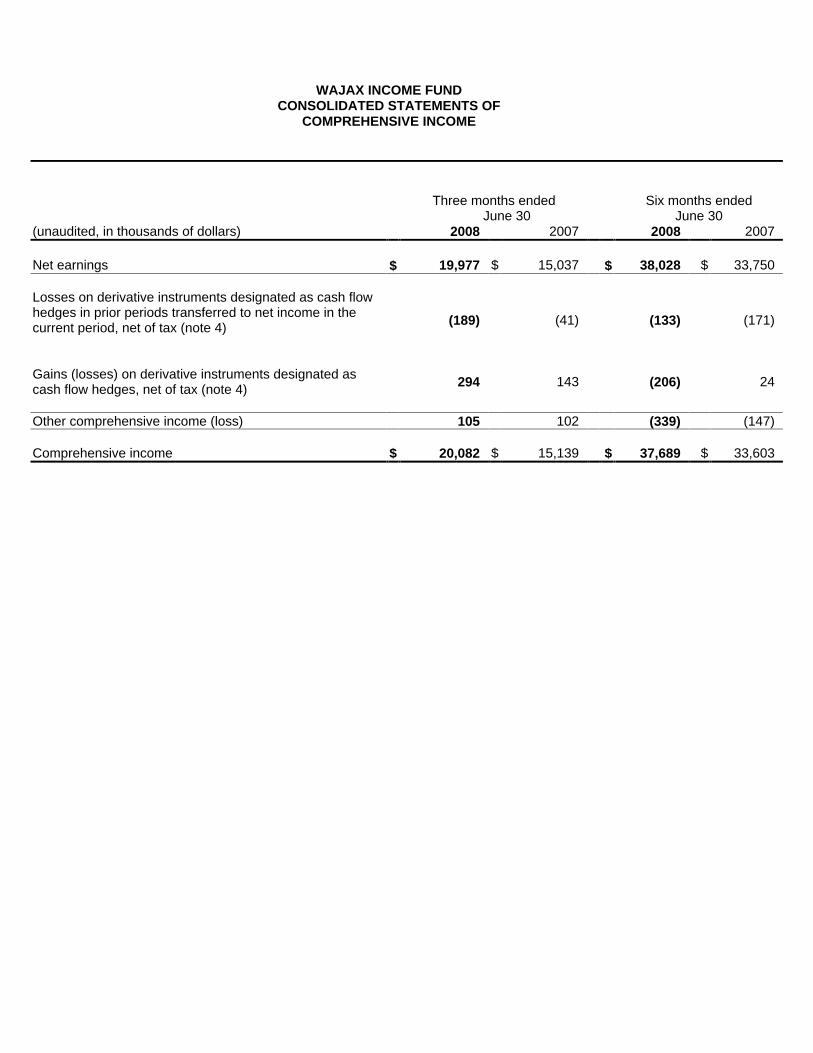
WAJAX INCOME FUND
CONSOLIDATED STATEMENTS OF COMPREHENSIVE INCOME
Three months ended
June 30
Six months ended
June 30 (unaudited, in thousands of dollars)
2008
2007
2008 2007
Net earnings $
19,977 $
15,037
$
38,028 $
33,750
Losses on derivative instruments designated as cash flow hedges in prior periods transferred to net income in the current period, net of tax (note 4)
(189)
(41)
(133)
(171)
Gains (losses) on derivative instruments designated as cash flow hedges, net of tax (note 4)
294
143
(206)
24
Other comprehensive income (loss)
105
102
(339)
(147)
Comprehensive income $
20,082 $
15,139
$
37,689 $
33,603
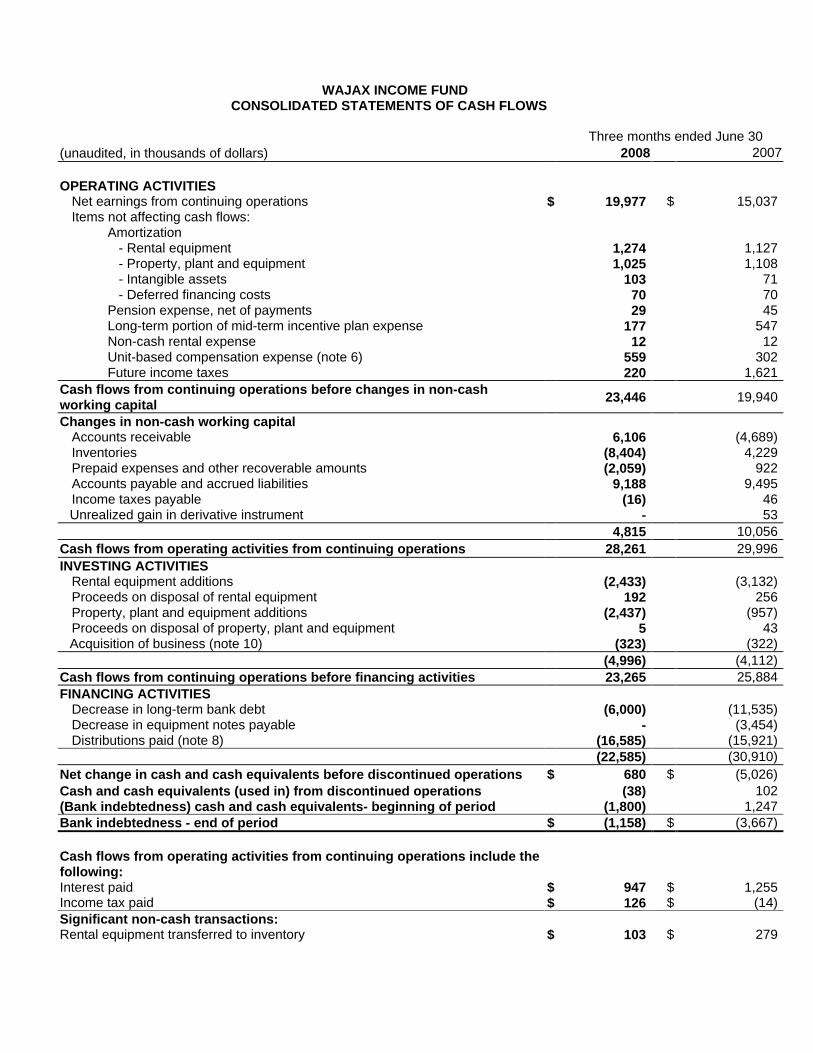
WAJAX INCOME FUND
CONSOLIDATED STATEMENTS OF CASH FLOWS
Three months ended June 30
(unaudited, in thousands of dollars)
2008
2007
OPERATING ACTIVITIES
Net earnings from continuing operations $
19,977
$
15,037
Items not affecting cash flows:
Amortization
- Rental equipment
1,274
1,127
- Property, plant and equipment
1,025
1,108
- Intangible assets
103
71
- Deferred financing costs
70
70
Pension expense, net of payments
29
45
Long-term portion of mid-term incentive plan expense
177
547
Non-cash rental expense
12
12
Unit-based compensation expense (note 6)
559
302
Future income taxes
220
1,621
Cash flows from continuing operations before changes in non-cash working capital
23,446
19,940
Changes in non-cash working capital
Accounts receivable
6,106
(4,689)
Inventories
(8,404)
4,229
Prepaid expenses and other recoverable amounts
(2,059)
922
Accounts payable and accrued liabilities
9,188
9,495
Income taxes payable
(16)
46
Unrealized gain in derivative instrument
-
53
4,815
10,056
Cash flows from operating activities from continuing operations
28,261
29,996
INVESTING ACTIVITIES
Rental equipment additions
(2,433)
(3,132)
Proceeds on disposal of rental equipment
192
256
Property, plant and equipment additions
(2,437)
(957)
Proceeds on disposal of property, plant and equipment
5
43
Acquisition of business (note 10)
(323)
(322)
(4,996)
(4,112)
Cash flows from continuing operations before financing activities
23,265
25,884
FINANCING ACTIVITIES
Decrease in long-term bank debt
(6,000)
(11,535)
Decrease in equipment notes payable
-
(3,454)
Distributions paid (note 8)
(16,585)
(15,921)
(22,585)
(30,910)
Net change in cash and cash equivalents before discontinued operations $
680
$
(5,026)
Cash and cash equivalents (used in) from discontinued operations
(38)
102
(Bank indebtedness) cash and cash equivalents- beginning of period
(1,800)
1,247
Bank indebtedness - end of period $
(1,158)
$
(3,667)
Cash flows from operating activities from continuing operations include the following:
Interest paid Income tax paid
$
$
947
126
$
$
1,255
(14)
Significant non-cash transactions:
Rental equipment transferred to inventory $
103
$
279

WAJAX INCOME FUND
CONSOLIDATED STATEMENTS OF CASH FLOWS
Six months ended June 30
(unaudited, in thousands of dollars)
2008
2007
OPERATING ACTIVITIES
Net earnings from continuing operations $
38,028
$
33,750
Items not affecting cash flows:
Amortization
- Rental equipment
2,421
2,150
- Property, plant and equipment
1,970
2,224
- Intangible assets
174
143
- Deferred financing costs
140
250
Pension expense, net of payments
89
26
Long-term portion of mid-term incentive plan expense
(1,340)
1,514
Non-cash rental expense
24
43
Unit-based compensation expense (note 6)
1,024
620
Future income taxes
411
1,942
Cash flows from continuing operations before changes in non-cash working capital
42,941
42,662
Changes in non-cash working capital
Accounts receivable
(3,224)
(3,173)
Inventories
(19,581)
15,664
Prepaid expenses and other recoverable amounts
(977)
(1,343)
Accounts payable and accrued liabilities
3,781
(15,076)
Income taxes payable
222
(494)
Unrealized gain in derivative instrument
-
42
(19,779)
(4,380)
Cash flows from operating activities from continuing operations
23,162
38,282
INVESTING ACTIVITIES
Rental equipment additions
(4,172)
(5,470)
Proceeds on disposal of rental equipment
461
494
Property, plant and equipment additions
(3,744)
(1,607)
Proceeds on disposal of property, plant and equipment
41
53
Acquisition of business (note 10)
(2,147)
(322)
(9,561)
(6,852)
Cash flows from continuing operations before financing activities
13,601
31,430
FINANCING ACTIVITIES
Increase in long-term bank debt
33,000
22,465
Decrease in equipment notes payable
(70)
(1,516)
Distributions paid (note 8)
(40,799)
(50,419)
(7,869)
(29,470)
Net change in cash and cash equivalents before discontinued operations $
5,732
$
1,960
Cash and cash equivalents (used in) from discontinued operations
(60)
31
Bank indebtedness - beginning of period
(6,830)
(5,668)
Bank indebtedness - end of period $
(1,158)
$
(3,677)
Cash flows from operating activities from continuing operations include the following:
Interest paid Income tax paid
$
$
1,921
126
$
$
2,452
503
Significant non-cash transactions:
Rental equipment transferred to inventory $
297
$
820
WAJAX INCOME FUND
NOTES TO CONSOLIDATED FINANCIAL STATEMENTS (Amounts in thousands of dollars, except unit and per unit data or where otherwise noted)
(unaudited)
Note 1 Structure of the trust and basis of presentation
Wajax Income Fund (the “Fund”) is an unincorporated, open-ended, limited purpose investment trust governed by the laws of Ontario pursuant to the declaration of trust dated April 27, 2005. The Fund was created to indirectly acquire all the outstanding shares of Wajax Limited and exchange those on an equal basis for Wajax Trust Units (“Units”) in the Fund pursuant to a Plan of Arrangement effective June 15, 2005. The Fund is authorized to issue an unlimited number of units and each Unitholder participates pro-rata in any distribution from the Fund.
These unaudited interim consolidated financial statements do not include all of the disclosures included in the audited annual consolidated financial statements. Accordingly, these unaudited interim financial statements should be read in conjunction with the annual consolidated financial statements of the Fund for the year ended December 31, 2007. The significant accounting policies follow those disclosed in the most recently reported annual financial statements, except as described in note 2.
Additional information, including the Fund’s Annual Report and Annual Information Form, may be found on SEDAR at www.sedar.com.
Note 2 Changes in accounting policies
Effective January 1, 2008, the Fund adopted the following standards:
Capital Disclosures CICA Handbook Section 1535, Capital Disclosures, establishes standards for disclosure of information regarding an entity’s capital and how it is managed. It requires disclosure of an entity’s objectives, policies and processes for managing capital. In addition, disclosures are to include whether companies have complied with externally imposed capital requirements and the consequences of any non-compliance. These new disclosures are included in note 12.
The above standard has no impact on the recognition and measurement of amounts included in the financial statements.
Inventories CICA Handbook Section 3031, Inventories, changes the standards for the measurement and disclosure of inventories. The measurement changes include the elimination of the last in first out method, the requirement to measure inventories at the lower of cost and net realizable value, the allocation of overhead based on normal capacity, the use of the specific cost method for inventories that are not ordinarily interchangeable or goods and services produced for specific purposes, the requirement for an entity to use a consistent cost formula for inventory of a similar nature and use, and the reversal of previous write-downs to net realizable value when there is a subsequent increase in the value of inventories.
The Fund retrospectively adopted the new inventory requirements without restatement. It reassessed the method whereby it was allocating service department overhead to cost of conversion resulting in an increase in the carrying value of inventory of $0.7 million and an adjustment of $0.6 million (net of tax of $0.1 million) which was recorded directly to opening accumulated earnings.
Disclosures of inventories have also been enhanced. Inventory policies, carrying amounts, amounts recognized as an expense, write-downs and the reversals of write-downs are required to be disclosed. These new disclosures are included in note 3.

Financial Instruments – Disclosures and Financial Instruments – Presentation Handbook Sections 3862 and 3863 increase the emphasis on the risks associated with both recognized and unrecognized financial instruments and how those risks are managed. The new presentation standards carry forward the former presentation requirements. These new disclosures are included in note 9.
The above standard has no impact on the recognition and measurement of amounts included in the financial statements.
Goodwill and Intangible Assets In February 2008, the Canadian Institute of Chartered Accountants issued Handbook Section 3064, Goodwill and Intangible Assets, replacing Section 3062, Goodwill and Other Intangible Assets, and Section 3450, Research and Development Costs. Section 3064 provides new guidelines for recognition, measurement, presentation and disclosure of goodwill and intangible assets. The Section also issued amendments to Section 1000, Financial Statement Concepts. These changes are effective for fiscal years beginning on or after October 1, 2008, with earlier adoption encouraged. Collectively, these changes bring Canadian practice closer to International Financial Reporting Standards and U.S. GAAP by eliminating the practice of recognizing as assets a variety of startup, pre-production and similar costs that do not meet the definition and recognition criteria of an asset.
The Fund has decided to early adopt CICA 3064. Adoption of this standard has no impact on the recognition and measurement of amounts included in the financial statements and no additional disclosure is necessary.
New Standards Issued but not yet Effective
In February 2008, The Canadian Accounting Standards Board confirmed that the use of International Financial Reporting Standards (IFRS) will be required in Canada for publicly accountable profit oriented enterprises for fiscal years beginning on or after January 1, 2011. The Fund will be required to report using IFRS beginning January 1, 2011. The Fund is currently in the process of evaluating the impact of the change to IFRS.
Note 3 Inventories
Inventories are valued at the lower of cost and estimated net realizable value.
Cost of equipment and parts include purchase cost, conversion cost and cost incurred in bringing inventory to its present location and condition.
Cost of conversion includes cost of direct labour, direct materials and a portion of direct and indirect overheads, allocated based on normal capacity.
Cost of inventories includes the associated gains or losses transferred from accumulated comprehensive income relating to forward contracts hedging the purchase of inventory.
Net realizable value is the estimated selling price in the ordinary course of business, less the estimated costs of sale.
All amounts shown are net of applicable reserves.
The Fund recognized $233.4 million of inventory as an expense which is included in cost of sales during the quarter (2007 - $245.9 million) and $447.3 million year to date (2007 - $474.2 million). During the quarter $0.9
Cost Formula
June 30 2008
December 31
2007 June 30
2007
Equipment Specific item $
110,596
$
102,245
$
105,186
Parts Weighted average
96,644
89,893
94,557
Work in process Specific item
22,611
15,074
17,731
Total inventories $
229,851
$
207,212
$
217,474
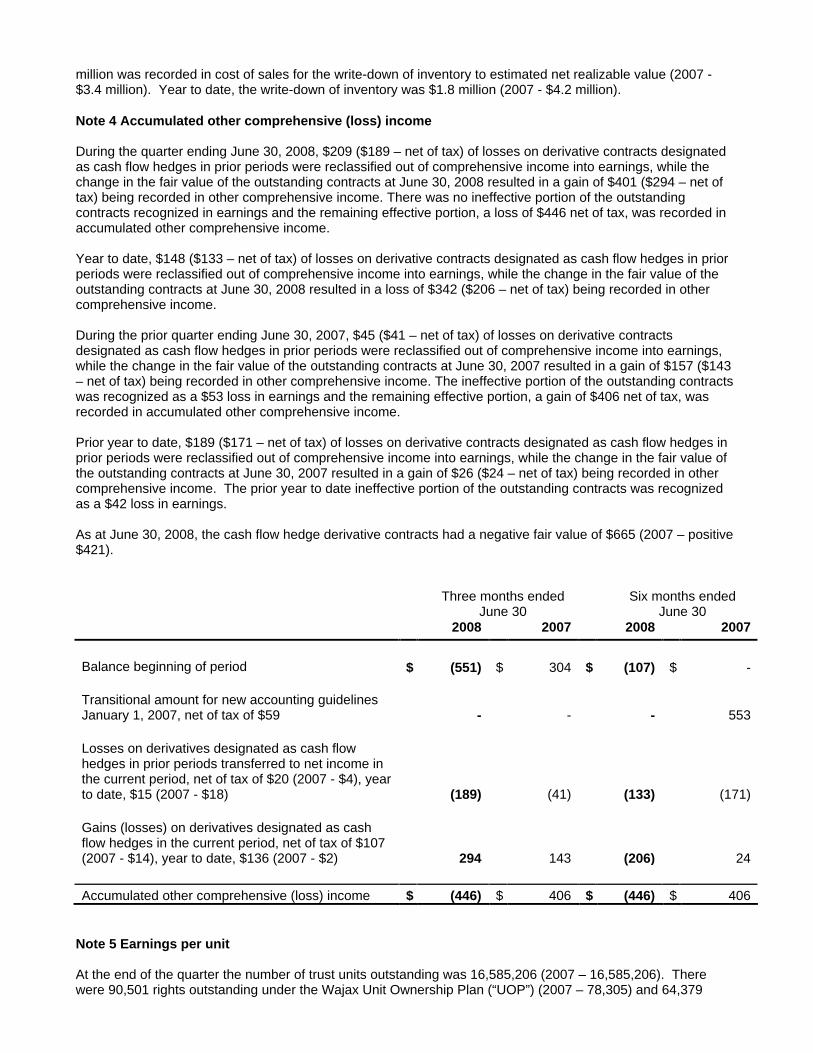
million was recorded in cost of sales for the write-down of inventory to estimated net realizable value (2007 - $3.4 million). Year to date, the write-down of inventory was $1.8 million (2007 - $4.2 million).
Note 4 Accumulated other comprehensive (loss) income
During the quarter ending June 30, 2008, $209 ($189 – net of tax) of losses on derivative contracts designated as cash flow hedges in prior periods were reclassified out of comprehensive income into earnings, while the change in the fair value of the outstanding contracts at June 30, 2008 resulted in a gain of $401 ($294 – net of tax) being recorded in other comprehensive income. There was no ineffective portion of the outstanding contracts recognized in earnings and the remaining effective portion, a loss of $446 net of tax, was recorded in accumulated other comprehensive income.
Year to date, $148 ($133 – net of tax) of losses on derivative contracts designated as cash flow hedges in prior periods were reclassified out of comprehensive income into earnings, while the change in the fair value of the outstanding contracts at June 30, 2008 resulted in a loss of $342 ($206 – net of tax) being recorded in other comprehensive income.
During the prior quarter ending June 30, 2007, $45 ($41 – net of tax) of losses on derivative contracts designated as cash flow hedges in prior periods were reclassified out of comprehensive income into earnings, while the change in the fair value of the outstanding contracts at June 30, 2007 resulted in a gain of $157 ($143 – net of tax) being recorded in other comprehensive income. The ineffective portion of the outstanding contracts was recognized as a $53 loss in earnings and the remaining effective portion, a gain of $406 net of tax, was recorded in accumulated other comprehensive income.
Prior year to date, $189 ($171 – net of tax) of losses on derivative contracts designated as cash flow hedges in prior periods were reclassified out of comprehensive income into earnings, while the change in the fair value of the outstanding contracts at June 30, 2007 resulted in a gain of $26 ($24 – net of tax) being recorded in other comprehensive income. The prior year to date ineffective portion of the outstanding contracts was recognized as a $42 loss in earnings.
As at June 30, 2008, the cash flow hedge derivative contracts had a negative fair value of $665 (2007 – positive $421).
Three months ended June 30
Six months ended June 30
2008
2007
2008
2007
Balance beginning of period $
(551)
$
304
$
(107)
$
-
Transitional amount for new accounting guidelines January 1, 2007, net of tax of $59
-
-
-
553
Losses on derivatives designated as cash flow hedges in prior periods transferred to net income in the current period, net of tax of $20 (2007 - $4), year to date, $15 (2007 - $18)
(189)
(41)
(133)
(171)
Gains (losses) on derivatives designated as cash flow hedges in the current period, net of tax of $107 (2007 - $14), year to date, $136 (2007 - $2)
294
143
(206)
24
Accumulated other comprehensive (loss) income $
(446) $
406 $
(446) $
406
Note 5 Earnings per unit
At the end of the quarter the number of trust units outstanding was 16,585,206 (2007 – 16,585,206). There were 90,501 rights outstanding under the Wajax Unit Ownership Plan (“UOP”) (2007 – 78,305) and 64,379

rights outstanding under the Trustees’ Deferred Unit Plan (“TDUP”) (2007 – 43,620). No options or unit rights were excluded from the earnings per unit calculations as none were anti-dilutive.
The following table sets forth the computation of basic and diluted earnings per unit:
Three months ended June 30
Six months ended June 30
2008
2007
2008
2007
Numerator for basic and diluted earnings per unit:
– net earnings $
19,977
$
15,037
$
38,028
$
33,750
Denominator for basic earnings per unit: – weighted average units
16,585,206
16,585,206
16,585,206
16,585,206
Denominator for diluted earnings per unit:
– weighted average units
16,585,206
16,585,206
16,585,206
16,585,206
– effect of dilutive unit rights
149,204
117,772
144,873
113,643
Denominator for diluted earnings per unit
16,734,410
16,702,978
16,730,079
16,698,849
Basic earnings per unit $
1.20
$
0.91
$
2.29
$
2.03
Diluted earnings per unit $
1.19
$
0.90
$
2.27
$
2.02
Note 6 Unit-based compensation plans
The Fund has three unit-based compensation plans: the UOP, the TDUP and the Mid-Term Incentive Plan (“MTIP”). UOP and TDUP rights are issued to the participants and are settled by issuing Wajax Income Fund units, while the MTIP consists of an annual grant that is settled in cash, vests over three years and is based upon performance vesting criteria, a portion of which is determined by the price of Fund units. Compensation expense for the UOP and the TDUP is determined based upon the fair value of the rights at the date of grant and charged to operations on a straight-line basis over the vesting period, with an offsetting adjustment to unitholders’ equity. Compensation expense for the MTIP varies with the price of Fund units and is recognized over the 3 year vesting period.
During the quarter 2,720 rights (2007 – 3,697) were granted under the UOP and 5,082 rights (2007 – 3,568) were granted under the TDUP.
Year to date 7,272 rights (2007 – 8,088) were granted under the UOP and 11,311 rights (2007 – 8,634) were granted under the TDUP.
The Fund recorded compensation cost of $559 for the quarter (2007 – $302) and $1,024 for the year to date (2007 - $620) in respect of unit rights plans and $460 for the quarter (2007 – $293) and $974 for the year to date (2007 - $477) in respect of the unit based MTIP.
Note 7 Income taxes
The Fund is a “mutual fund trust” as defined under the Income Tax Act (Canada) and is not taxable on its income to the extent that it is distributed to its unitholders.
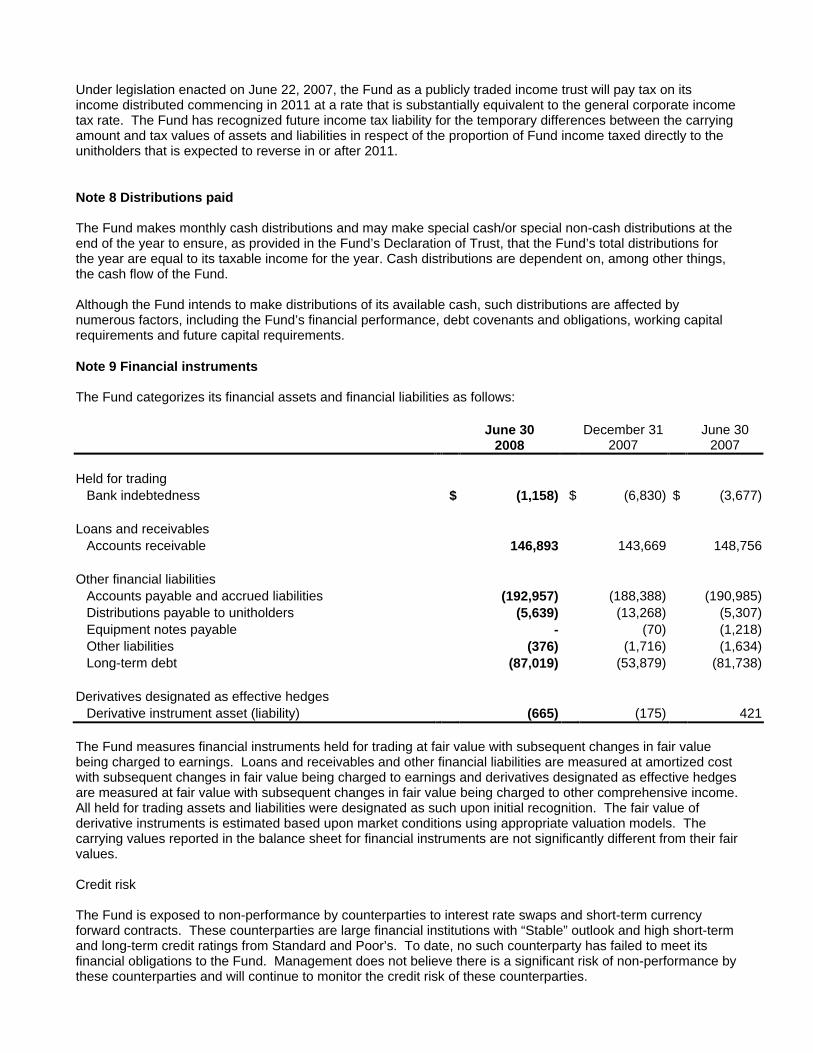
Under legislation enacted on June 22, 2007, the Fund as a publicly traded income trust will pay tax on its income distributed commencing in 2011 at a rate that is substantially equivalent to the general corporate income tax rate. The Fund has recognized future income tax liability for the temporary differences between the carrying amount and tax values of assets and liabilities in respect of the proportion of Fund income taxed directly to the unitholders that is expected to reverse in or after 2011.
Note 8 Distributions paid
The Fund makes monthly cash distributions and may make special cash/or special non-cash distributions at the end of the year to ensure, as provided in the Fund’s Declaration of Trust, that the Fund’s total distributions for the year are equal to its taxable income for the year. Cash distributions are dependent on, among other things, the cash flow of the Fund.
Although the Fund intends to make distributions of its available cash, such distributions are affected by numerous factors, including the Fund’s financial performance, debt covenants and obligations, working capital requirements and future capital requirements.
Note 9 Financial instruments
The Fund categorizes its financial assets and financial liabilities as follows:
The Fund measures financial instruments held for trading at fair value with subsequent changes in fair value being charged to earnings. Loans and receivables and other financial liabilities are measured at amortized cost with subsequent changes in fair value being charged to earnings and derivatives designated as effective hedges are measured at fair value with subsequent changes in fair value being charged to other comprehensive income. All held for trading assets and liabilities were designated as such upon initial recognition. The fair value of derivative instruments is estimated based upon market conditions using appropriate valuation models. The carrying values reported in the balance sheet for financial instruments are not significantly different from their fair values.
Credit risk
The Fund is exposed to non-performance by counterparties to interest rate swaps and short-term currency forward contracts. These counterparties are large financial institutions with “Stable” outlook and high short-term and long-term credit ratings from Standard and Poor’s. To date, no such counterparty has failed to meet its financial obligations to the Fund. Management does not believe there is a significant risk of non-performance by these counterparties and will continue to monitor the credit risk of these counterparties.
June 30 2008
December 31
2007 June 30
2007
Held for trading
Bank indebtedness
$
(1,158)
$
(6,830)
$
(3,677)
Loans and receivables
Accounts receivable
146,893
143,669
148,756
Other financial liabilities
Accounts payable and accrued liabilities
(192,957)
(188,388)
(190,985)
Distributions payable to unitholders
(5,639)
(13,268)
(5,307)
Equipment notes payable
-
(70)
(1,218)
Other liabilities
(376)
(1,716)
(1,634)
Long-term debt
(87,019)
(53,879)
(81,738)
Derivatives designated as effective hedges
Derivative instrument asset (liability)
(665)
(175)
421
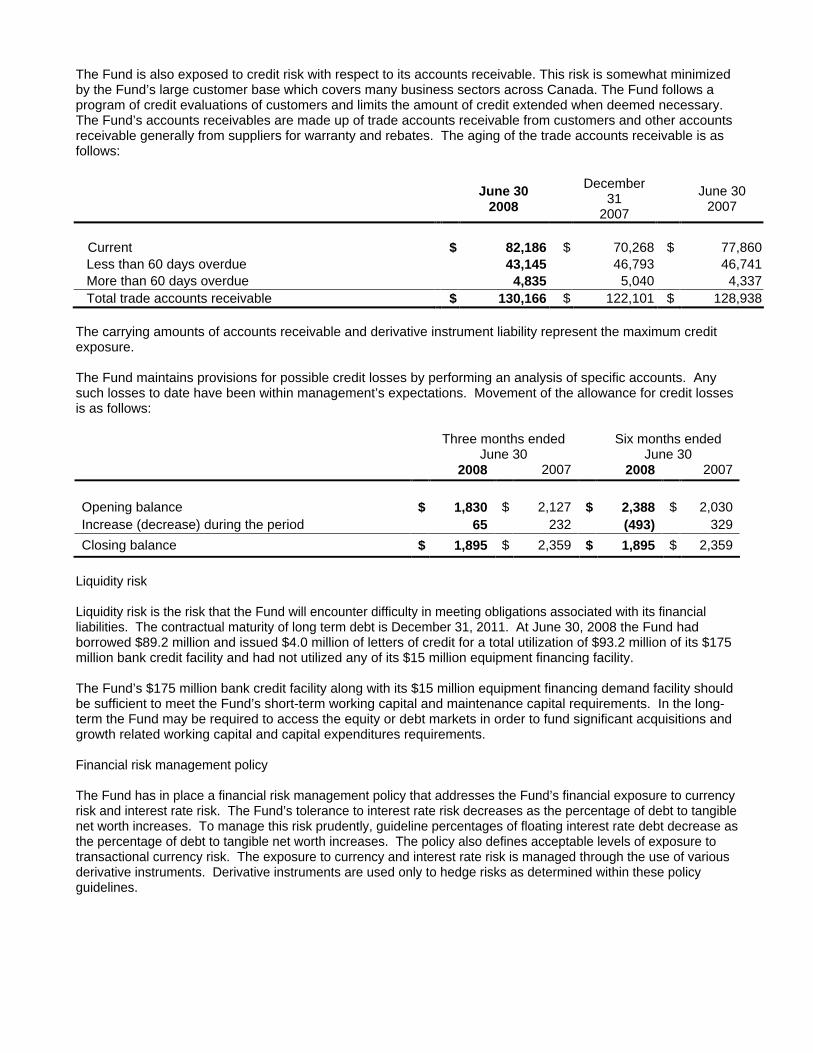
The Fund is also exposed to credit risk with respect to its accounts receivable. This risk is somewhat minimized by the Fund’s large customer base which covers many business sectors across Canada. The Fund follows a program of credit evaluations of customers and limits the amount of credit extended when deemed necessary. The Fund’s accounts receivables are made up of trade accounts receivable from customers and other accounts receivable generally from suppliers for warranty and rebates. The aging of the trade accounts receivable is as follows:
The carrying amounts of accounts receivable and derivative instrument liability represent the maximum credit exposure.
The Fund maintains provisions for possible credit losses by performing an analysis of specific accounts. Any such losses to date have been within management’s expectations. Movement of the allowance for credit losses is as follows:
Three months ended June 30
Six months ended June 30
2008
2007
2008
2007
Opening balance $
1,830
$
2,127
$
2,388
$
2,030
Increase (decrease) during the period
65
232
(493)
329
Closing balance $
1,895
$
2,359
$
1,895
$
2,359
Liquidity risk
Liquidity risk is the risk that the Fund will encounter difficulty in meeting obligations associated with its financial liabilities. The contractual maturity of long term debt is December 31, 2011. At June 30, 2008 the Fund had borrowed $89.2 million and issued $4.0 million of letters of credit for a total utilization of $93.2 million of its $175 million bank credit facility and had not utilized any of its $15 million equipment financing facility.
The Fund’s $175 million bank credit facility along with its $15 million equipment financing demand facility should be sufficient to meet the Fund’s short-term working capital and maintenance capital requirements. In the long-term the Fund may be required to access the equity or debt markets in order to fund significant acquisitions and growth related working capital and capital expenditures requirements.
Financial risk management policy
The Fund has in place a financial risk management policy that addresses the Fund’s financial exposure to currency risk and interest rate risk. The Fund’s tolerance to interest rate risk decreases as the percentage of debt to tangible net worth increases. To manage this risk prudently, guideline percentages of floating interest rate debt decrease as the percentage of debt to tangible net worth increases. The policy also defines acceptable levels of exposure to transactional currency risk. The exposure to currency and interest rate risk is managed through the use of various derivative instruments. Derivative instruments are used only to hedge risks as determined within these policy guidelines.
June 30
2008
December
31 2007
June 30 2007
Current
$
82,186
$
70,268
$
77,860
Less than 60 days overdue
43,145
46,793
46,741
More than 60 days overdue
4,835
5,040
4,337
Total trade accounts receivable
$
130,166
$
122,101
$
128,938
Currency risk
The Fund’s operating results are reported in Canadian dollars. While the Fund's sales are primarily denominated in Canadian dollars, significant portions of its purchases are in U.S. dollars. Changes in the U.S. dollar exchange rate can have a negative or positive impact on the Fund's revenues, margins and working capital balances. The Fund enters into short-term currency forward contracts to fix the cost of certain inbound inventory and to hedge certain foreign currency-denominated sales to (receivables from) customers as part of its normal course of business. As at June 30, 2008, the Fund had contracts outstanding to buy US$15.2 million and €0.2 million (June 30, 2007 – to buy US$7.0 million and €1.3 million). These include contracts expiring between July 2008 and October 2009, with U.S. dollar rates from 0.9880 to 1.0300 and Euro rates from 1.4934 to 1.5711.
The Fund will periodically institute price increases to offset the negative impact of foreign exchange rate increases on imported goods.
A declining U.S. dollar relative to the Canadian dollar can have a negative effect on the Fund's revenues and cash flows as a result of certain products being imported from the U.S. market conditions generally require the Fund to lower its selling prices as the U.S. dollar declines. As well, many of the Fund's customers export products to the U.S., and a strengthening Canadian dollar can negatively impact their overall competitiveness and demand for their products, which in turn may reduce product purchases from the Fund.
The Fund maintains a conservative hedging policy whereby significant transactional currency risks are identified and hedged. As such there is not a material currency transaction exposure.
Interest rate risk
The Fund’s borrowing costs are impacted by changes in interest rates. In order to manage this risk to an acceptable level the Fund entered into interest rate swap contracts with its lenders such that the interest rate on the $30 million non-revolving term portion of the bank credit facility was effectively fixed at 3.47% plus applicable margins until June 7, 2008 and at 4.60% plus applicable margins from June 8, 2008 until December 31, 2011.
A 0.75 percentage point decrease in interest rates, which is indicative of the change in the prime lending rate over the preceding twelve-month period would, all things being equal, have resulted in an insignificant increase to earnings before income taxes and an increase to other comprehensive income of $1.0 million for the period as a result of the change in fair values of the interest rate swaps. The magnitude of the impact on earnings before income taxes and other comprehensive income is the same whether interest rates increase or decrease.
Note 10 Acquisition of business
During the quarter, conditions were met such that the Fund paid out $0.3 million to complete the acquisition of Baytec Fluid Power Limited as per the Agreement of Purchase and Sale. This additional amount has been recorded as goodwill.
On March 17, 2008 the Fund’s Mobile Equipment segment acquired certain assets of Dan Greer Enterprises Limited (“Greer”), the JCB dealer in the Ontario area from Mississauga to Niagara Falls, including Hamilton, for approximately $1.8 million.
The results of operations from the acquisition have been included in the consolidated financial statements of the Fund as of the effective date.
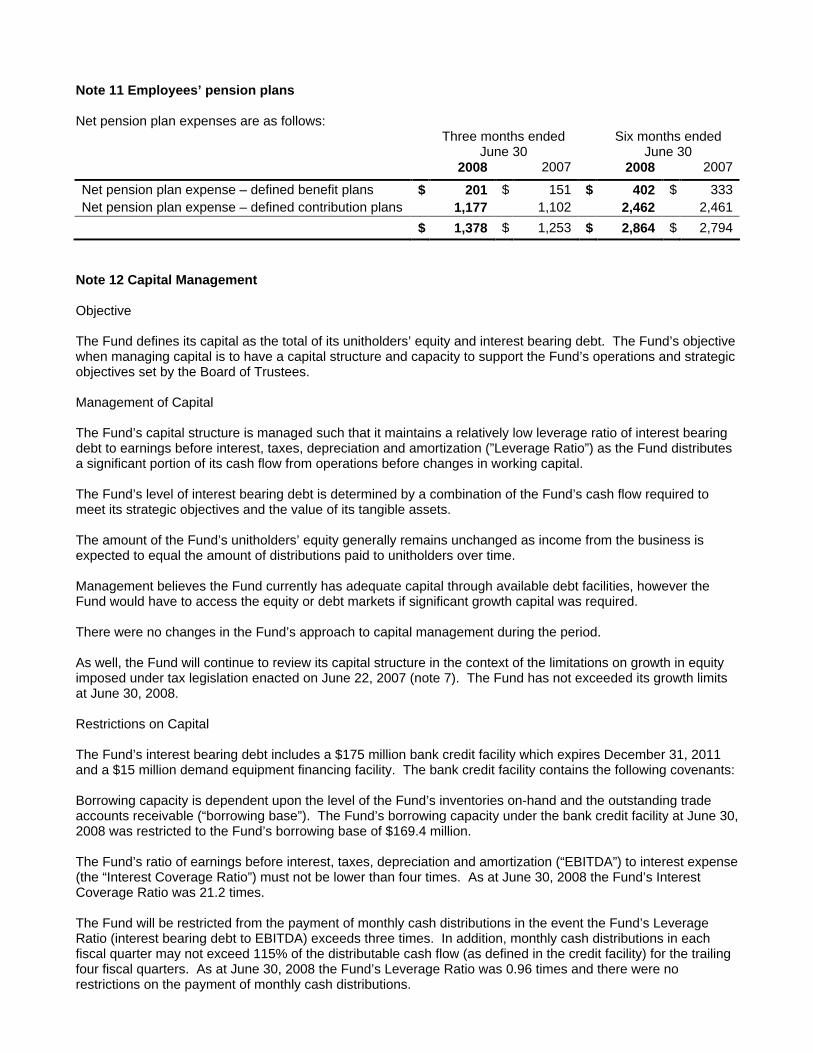
Note 11 Employees’ pension plans
Net pension plan expenses are as follows: Three months ended
June 30 Six months ended
June 30
2008
2007
2008
2007
Net pension plan expense – defined benefit plans $
201
$
151
$
402
$
333
Net pension plan expense – defined contribution plans
1,177
1,102
2,462
2,461
$
1,378
$
1,253
$
2,864
$
2,794
Note 12 Capital Management
Objective
The Fund defines its capital as the total of its unitholders’ equity and interest bearing debt. The Fund’s objective when managing capital is to have a capital structure and capacity to support the Fund’s operations and strategic objectives set by the Board of Trustees.
Management of Capital
The Fund’s capital structure is managed such that it maintains a relatively low leverage ratio of interest bearing debt to earnings before interest, taxes, depreciation and amortization (”Leverage Ratio”) as the Fund distributes a significant portion of its cash flow from operations before changes in working capital.
The Fund’s level of interest bearing debt is determined by a combination of the Fund’s cash flow required to meet its strategic objectives and the value of its tangible assets.
The amount of the Fund’s unitholders’ equity generally remains unchanged as income from the business is expected to equal the amount of distributions paid to unitholders over time.
Management believes the Fund currently has adequate capital through available debt facilities, however the Fund would have to access the equity or debt markets if significant growth capital was required.
There were no changes in the Fund’s approach to capital management during the period.
As well, the Fund will continue to review its capital structure in the context of the limitations on growth in equity imposed under tax legislation enacted on June 22, 2007 (note 7). The Fund has not exceeded its growth limits at June 30, 2008.
Restrictions on Capital
The Fund’s interest bearing debt includes a $175 million bank credit facility which expires December 31, 2011 and a $15 million demand equipment financing facility. The bank credit facility contains the following covenants:
Borrowing capacity is dependent upon the level of the Fund’s inventories on-hand and the outstanding trade accounts receivable (“borrowing base”). The Fund’s borrowing capacity under the bank credit facility at June 30, 2008 was restricted to the Fund’s borrowing base of $169.4 million.
The Fund’s ratio of earnings before interest, taxes, depreciation and amortization (“EBITDA”) to interest expense (the “Interest Coverage Ratio”) must not be lower than four times. As at June 30, 2008 the Fund’s Interest Coverage Ratio was 21.2 times.
The Fund will be restricted from the payment of monthly cash distributions in the event the Fund’s Leverage Ratio (interest bearing debt to EBITDA) exceeds three times. In addition, monthly cash distributions in each fiscal quarter may not exceed 115% of the distributable cash flow (as defined in the credit facility) for the trailing four fiscal quarters. As at June 30, 2008 the Fund’s Leverage Ratio was 0.96 times and there were no restrictions on the payment of monthly cash distributions.
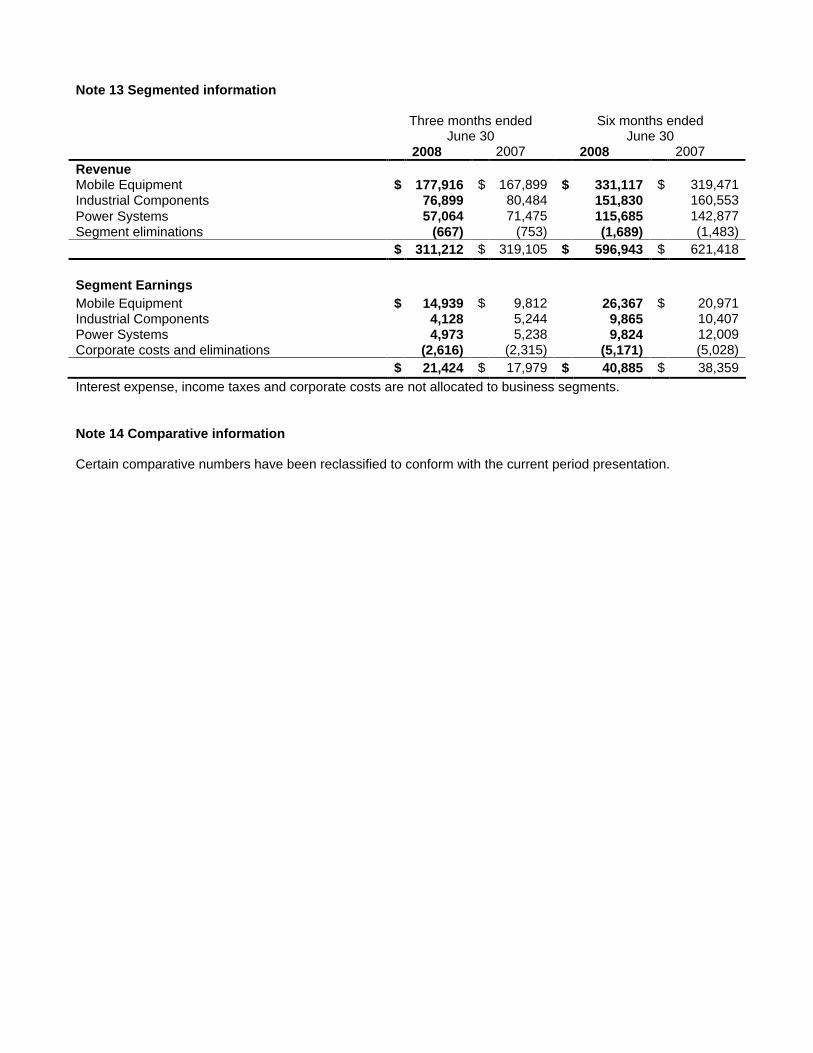
Note 13 Segmented information
Three months ended June 30
Six months ended June 30
2008 2007 2008 2007 Revenue
Mobile Equipment $
177,916
$
167,899
$
331,117
$
319,471
Industrial Components
76,899
80,484
151,830
160,553
Power Systems
57,064
71,475
115,685
142,877
Segment eliminations
(667)
(753)
(1,689)
(1,483)
$
311,212
$
319,105
$
596,943
$
621,418
Segment Earnings
Mobile Equipment $
14,939
$
9,812
26,367
$
20,971
Industrial Components
4,128
5,244
9,865
10,407
Power Systems
4,973
5,238
9,824
12,009
Corporate costs and eliminations
(2,616)
(2,315)
(5,171)
(5,028)
$
21,424
$
17,979
$
40,885
$
38,359
Interest expense, income taxes and corporate costs are not allocated to business segments.
Note 14 Comparative information
Certain comparative numbers have been reclassified to conform with the current period presentation.