Embed Size (px)
Citation preview
• Operational EBIT of EUR 49 million. Financial EBIT of EUR 39 million• Second wave of Covid-19 and high seasonal supply significantly impacted spot prices in Farming• All-time high harvest volumes for a quarter and for the full year• Farming cost per kg improved from Q4 2019• Record high quarter and full-year volumes in Consumer Products and Feed• Divestment of shares in DESS Aquaculture Shipping in January 2021 with a realised gain of EUR 54 million• Quarterly ordinary dividend of NOK 0.32 per share in accordance with adjusted dividend policy
Harvest volumeGWT
116 314
83 119
104 303
125 773 126 634
Q4 19Q1 2
0
Q2 20
Q3 20
Q4 20
Operational EBITEUR million
166
10999
80
49
Q4 19Q1 2
0
Q2 20
Q3 20
Q4 20
Operational EBITEUR per kg
0.75
1.57
-1.13
-0.49
2.62
-0.77
0.39
NorwayScotland
CanadaChile
IrelandFaroes
Group
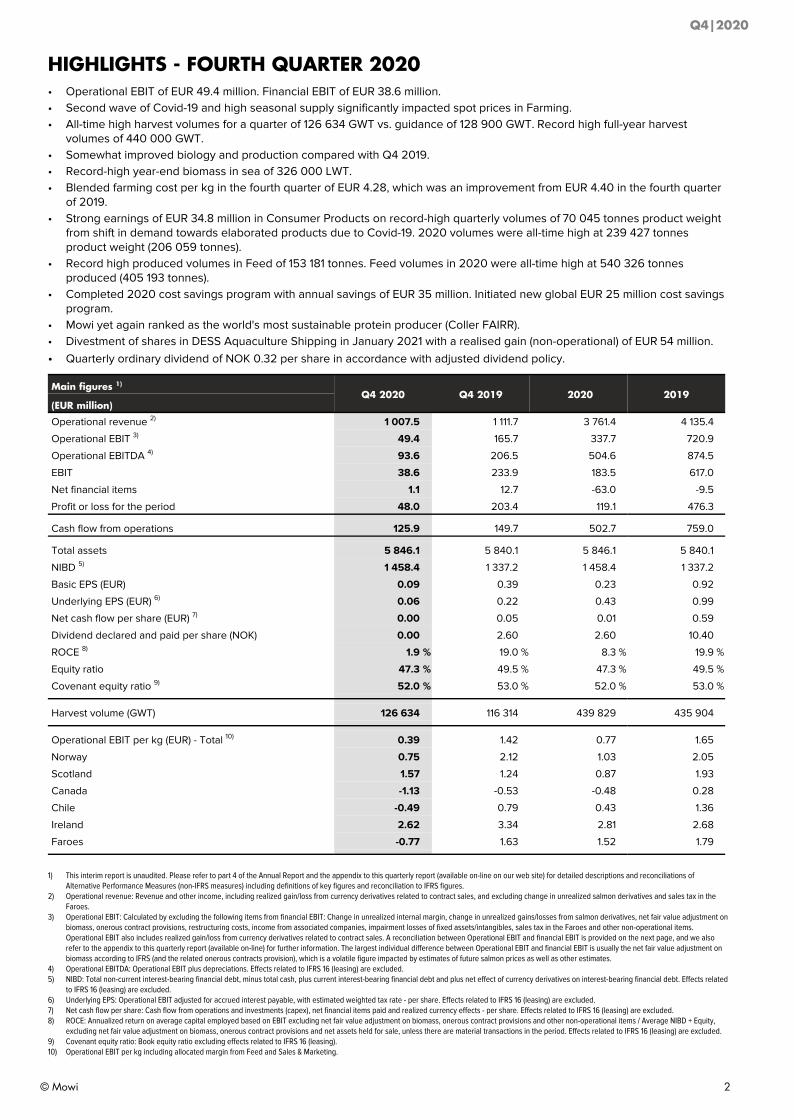
HIGHLIGHTS - FOURTH QUARTER 2020• Operational EBIT of EUR 49.4 million. Financial EBIT of EUR 38.6 million.• Second wave of Covid-19 and high seasonal supply significantly impacted spot prices in Farming.• All-time high harvest volumes for a quarter of 126 634 GWT vs. guidance of 128 900 GWT. Record high full-year harvest
volumes of 440 000 GWT.• Somewhat improved biology and production compared with Q4 2019. • Record-high year-end biomass in sea of 326 000 LWT. • Blended farming cost per kg in the fourth quarter of EUR 4.28, which was an improvement from EUR 4.40 in the fourth quarter
of 2019.• Strong earnings of EUR 34.8 million in Consumer Products on record-high quarterly volumes of 70 045 tonnes product weight
from shift in demand towards elaborated products due to Covid-19. 2020 volumes were all-time high at 239 427 tonnes product weight (206 059 tonnes).
• Record high produced volumes in Feed of 153 181 tonnes. Feed volumes in 2020 were all-time high at 540 326 tonnes produced (405 193 tonnes).
• Completed 2020 cost savings program with annual savings of EUR 35 million. Initiated new global EUR 25 million cost savings program.
• Mowi yet again ranked as the world's most sustainable protein producer (Coller FAIRR).• Divestment of shares in DESS Aquaculture Shipping in January 2021 with a realised gain (non-operational) of EUR 54 million.• Quarterly ordinary dividend of NOK 0.32 per share in accordance with adjusted dividend policy.
Main figures 1)
Q4 2020 Q4 2019 2020 2019(EUR million)
Operational revenue 2) 1 007.5 1 111.7 3 761.4 4 135.4
Operational EBIT 3) 49.4 165.7 337.7 720.9
Operational EBITDA 4) 93.6 206.5 504.6 874.5
EBIT 38.6 233.9 183.5 617.0
Net financial items 1.1 12.7 -63.0 -9.5
Profit or loss for the period 48.0 203.4 119.1 476.3
Cash flow from operations 125.9 149.7 502.7 759.0
Total assets 5 846.1 5 840.1 5 846.1 5 840.1
NIBD 5) 1 458.4 1 337.2 1 458.4 1 337.2
Basic EPS (EUR) 0.09 0.39 0.23 0.92
Underlying EPS (EUR) 6) 0.06 0.22 0.43 0.99
Net cash flow per share (EUR) 7) 0.00 0.05 0.01 0.59
Dividend declared and paid per share (NOK) 0.00 2.60 2.60 10.40
ROCE 8) 1.9 % 19.0 % 8.3 % 19.9 %
Equity ratio 47.3 % 49.5 % 47.3 % 49.5 %
Covenant equity ratio 9) 52.0 % 53.0 % 52.0 % 53.0 %
Harvest volume (GWT) 126 634 116 314 439 829 435 904
Operational EBIT per kg (EUR) - Total 10) 0.39 1.42 0.77 1.65
Norway 0.75 2.12 1.03 2.05
Scotland 1.57 1.24 0.87 1.93
Canada -1.13 -0.53 -0.48 0.28
Chile -0.49 0.79 0.43 1.36
Ireland 2.62 3.34 2.81 2.68
Faroes -0.77 1.63 1.52 1.79
1) This interim report is unaudited. Please refer to part 4 of the Annual Report and the appendix to this quarterly report (available on-line on our web site) for detailed descriptions and reconciliations of Alternative Performance Measures (non-IFRS measures) including definitions of key figures and reconciliation to IFRS figures.
2) Operational revenue: Revenue and other income, including realized gain/loss from currency derivatives related to contract sales, and excluding change in unrealized salmon derivatives and sales tax in the Faroes.
3) Operational EBIT: Calculated by excluding the following items from financial EBIT: Change in unrealized internal margin, change in unrealized gains/losses from salmon derivatives, net fair value adjustment on biomass, onerous contract provisions, restructuring costs, income from associated companies, impairment losses of fixed assets/intangibles, sales tax in the Faroes and other non-operational items. Operational EBIT also includes realized gain/loss from currency derivatives related to contract sales. A reconciliation between Operational EBIT and financial EBIT is provided on the next page, and we also refer to the appendix to this quarterly report (available on-line) for further information. The largest individual difference between Operational EBIT and financial EBIT is usually the net fair value adjustment on biomass according to IFRS (and the related onerous contracts provision), which is a volatile figure impacted by estimates of future salmon prices as well as other estimates.
4) Operational EBITDA: Operational EBIT plus depreciations. Effects related to IFRS 16 (leasing) are excluded.5) NIBD: Total non-current interest-bearing financial debt, minus total cash, plus current interest-bearing financial debt and plus net effect of currency derivatives on interest-bearing financial debt. Effects related
to IFRS 16 (leasing) are excluded.6) Underlying EPS: Operational EBIT adjusted for accrued interest payable, with estimated weighted tax rate - per share. Effects related to IFRS 16 (leasing) are excluded.7) Net cash flow per share: Cash flow from operations and investments (capex), net financial items paid and realized currency effects - per share. Effects related to IFRS 16 (leasing) are excluded.8) ROCE: Annualized return on average capital employed based on EBIT excluding net fair value adjustment on biomass, onerous contract provisions and other non-operational items / Average NIBD + Equity,
excluding net fair value adjustment on biomass, onerous contract provisions and net assets held for sale, unless there are material transactions in the period. Effects related to IFRS 16 (leasing) are excluded.9) Covenant equity ratio: Book equity ratio excluding effects related to IFRS 16 (leasing).10) Operational EBIT per kg including allocated margin from Feed and Sales & Marketing.
Q4|2020
© Mowi 2
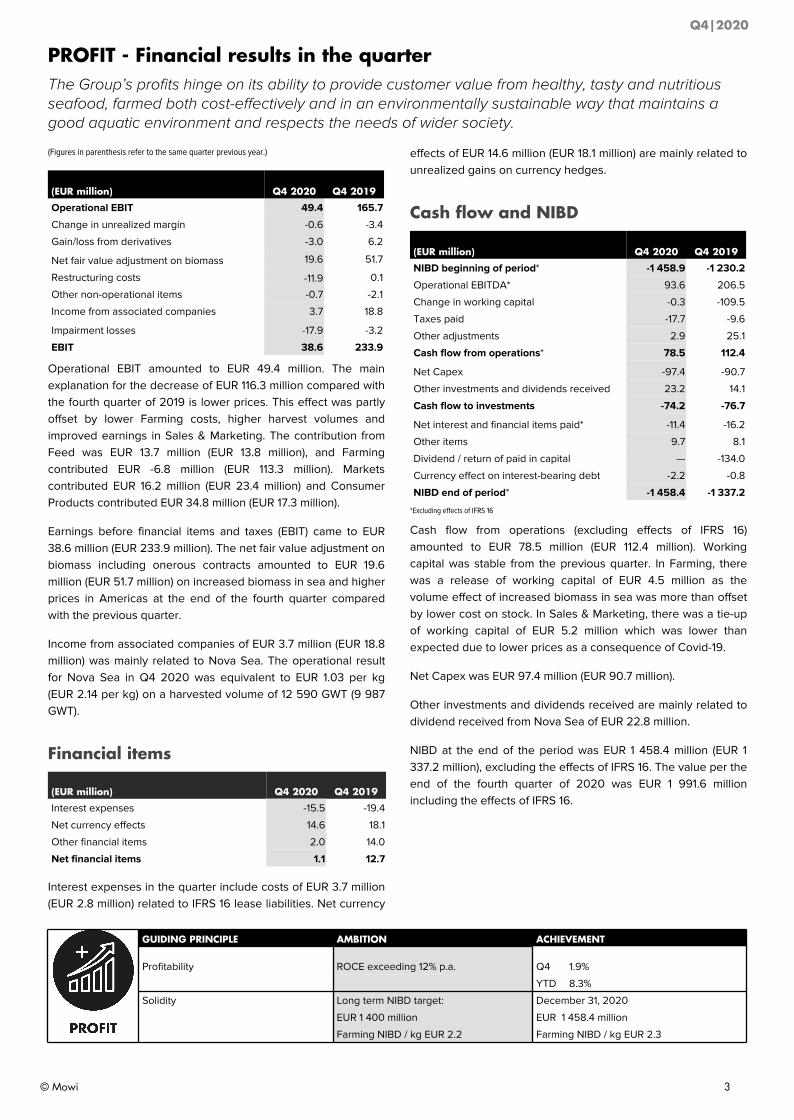
PROFIT - Financial results in the quarter The Group’s profits hinge on its ability to provide customer value from healthy, tasty and nutritious seafood, farmed both cost-effectively and in an environmentally sustainable way that maintains a good aquatic environment and respects the needs of wider society.
(Figures in parenthesis refer to the same quarter previous year.)
(EUR million) Q4 2020 Q4 2019
Operational EBIT 49.4 165.7
Change in unrealized margin -0.6 -3.4
Gain/loss from derivatives -3.0 6.2
Net fair value adjustment on biomass 19.6 51.7
Restructuring costs -11.9 0.1
Other non-operational items -0.7 -2.1
Income from associated companies 3.7 18.8
Impairment losses -17.9 -3.2
EBIT 38.6 233.9
Operational EBIT amounted to EUR 49.4 million. The main explanation for the decrease of EUR 116.3 million compared with the fourth quarter of 2019 is lower prices. This effect was partly offset by lower Farming costs, higher harvest volumes and improved earnings in Sales & Marketing. The contribution from Feed was EUR 13.7 million (EUR 13.8 million), and Farming contributed EUR -6.8 million (EUR 113.3 million). Markets contributed EUR 16.2 million (EUR 23.4 million) and Consumer Products contributed EUR 34.8 million (EUR 17.3 million).
Earnings before financial items and taxes (EBIT) came to EUR 38.6 million (EUR 233.9 million). The net fair value adjustment on biomass including onerous contracts amounted to EUR 19.6 million (EUR 51.7 million) on increased biomass in sea and higher prices in Americas at the end of the fourth quarter compared with the previous quarter.
Income from associated companies of EUR 3.7 million (EUR 18.8 million) was mainly related to Nova Sea. The operational result for Nova Sea in Q4 2020 was equivalent to EUR 1.03 per kg (EUR 2.14 per kg) on a harvested volume of 12 590 GWT (9 987 GWT).
Financial items
(EUR million) Q4 2020 Q4 2019
Interest expenses -15.5 -19.4
Net currency effects 14.6 18.1
Other financial items 2.0 14.0
Net financial items 1.1 12.7
Interest expenses in the quarter include costs of EUR 3.7 million (EUR 2.8 million) related to IFRS 16 lease liabilities. Net currency
effects of EUR 14.6 million (EUR 18.1 million) are mainly related to unrealized gains on currency hedges.
Cash flow and NIBD
(EUR million) Q4 2020 Q4 2019
NIBD beginning of period* -1 458.9 -1 230.2
Operational EBITDA* 93.6 206.5
Change in working capital -0.3 -109.5
Taxes paid -17.7 -9.6
Other adjustments 2.9 25.1
Cash flow from operations* 78.5 112.4
Net Capex -97.4 -90.7
Other investments and dividends received 23.2 14.1
Cash flow to investments -74.2 -76.7
Net interest and financial items paid* -11.4 -16.2
Other items 9.7 8.1
Dividend / return of paid in capital — -134.0
Currency effect on interest-bearing debt -2.2 -0.8
NIBD end of period* -1 458.4 -1 337.2
*Excluding effects of IFRS 16
Cash flow from operations (excluding effects of IFRS 16) amounted to EUR 78.5 million (EUR 112.4 million). Working capital was stable from the previous quarter. In Farming, there was a release of working capital of EUR 4.5 million as the volume effect of increased biomass in sea was more than offset by lower cost on stock. In Sales & Marketing, there was a tie-up of working capital of EUR 5.2 million which was lower than expected due to lower prices as a consequence of Covid-19.
Net Capex was EUR 97.4 million (EUR 90.7 million).
Other investments and dividends received are mainly related to dividend received from Nova Sea of EUR 22.8 million.
NIBD at the end of the period was EUR 1 458.4 million (EUR 1 337.2 million), excluding the effects of IFRS 16. The value per the end of the fourth quarter of 2020 was EUR 1 991.6 million including the effects of IFRS 16.
GUIDING PRINCIPLE AMBITION ACHIEVEMENT
Profitability ROCE exceeding 12% p.a. Q4 1.9%
YTD 8.3%
Solidity Long term NIBD target: December 31, 2020
EUR 1 400 million EUR 1 458.4 million
Farming NIBD / kg EUR 2.2 Farming NIBD / kg EUR 2.3
Q4|2020
© Mowi 3
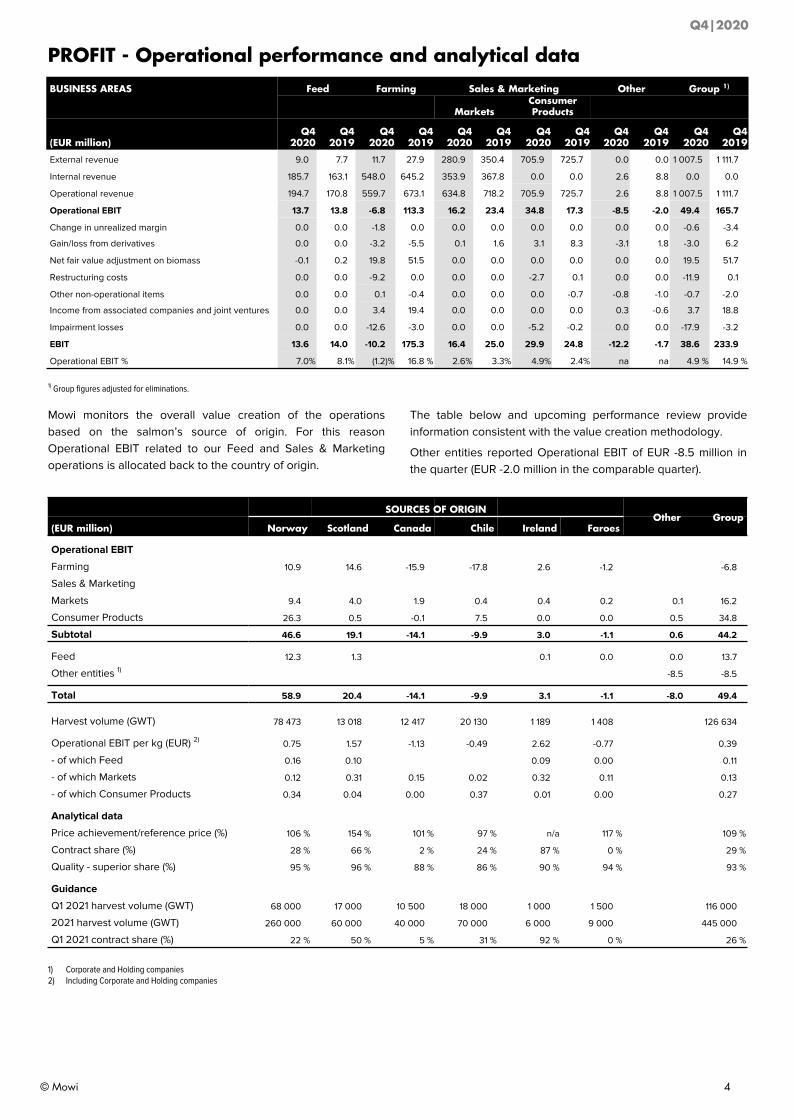
PROFIT - Operational performance and analytical dataBUSINESS AREAS Feed Farming Sales & Marketing Other Group 1)
MarketsConsumer Products
(EUR million)Q4
2020Q4
2019Q4
2020Q4
2019Q4
2020Q4
2019Q4
2020Q4
2019Q4
2020Q4
2019Q4
2020Q4
2019
External revenue 9.0 7.7 11.7 27.9 280.9 350.4 705.9 725.7 0.0 0.0 1 007.5 1 111.7
Internal revenue 185.7 163.1 548.0 645.2 353.9 367.8 0.0 0.0 2.6 8.8 0.0 0.0
Operational revenue 194.7 170.8 559.7 673.1 634.8 718.2 705.9 725.7 2.6 8.8 1 007.5 1 111.7
Operational EBIT 13.7 13.8 -6.8 113.3 16.2 23.4 34.8 17.3 -8.5 -2.0 49.4 165.7
Change in unrealized margin 0.0 0.0 -1.8 0.0 0.0 0.0 0.0 0.0 0.0 0.0 -0.6 -3.4
Gain/loss from derivatives 0.0 0.0 -3.2 -5.5 0.1 1.6 3.1 8.3 -3.1 1.8 -3.0 6.2
Net fair value adjustment on biomass -0.1 0.2 19.8 51.5 0.0 0.0 0.0 0.0 0.0 0.0 19.5 51.7
Restructuring costs 0.0 0.0 -9.2 0.0 0.0 0.0 -2.7 0.1 0.0 0.0 -11.9 0.1
Other non-operational items 0.0 0.0 0.1 -0.4 0.0 0.0 0.0 -0.7 -0.8 -1.0 -0.7 -2.0
Income from associated companies and joint ventures 0.0 0.0 3.4 19.4 0.0 0.0 0.0 0.0 0.3 -0.6 3.7 18.8
Impairment losses 0.0 0.0 -12.6 -3.0 0.0 0.0 -5.2 -0.2 0.0 0.0 -17.9 -3.2
EBIT 13.6 14.0 -10.2 175.3 16.4 25.0 29.9 24.8 -12.2 -1.7 38.6 233.9
Operational EBIT % 7.0 % 8.1 % (1.2) % 16.8 % 2.6 % 3.3 % 4.9 % 2.4 % na na 4.9 % 14.9 %
1) Group figures adjusted for eliminations.
Mowi monitors the overall value creation of the operations based on the salmon’s source of origin. For this reason Operational EBIT related to our Feed and Sales & Marketing operations is allocated back to the country of origin.
The table below and upcoming performance review provide information consistent with the value creation methodology.
Other entities reported Operational EBIT of EUR -8.5 million in the quarter (EUR -2.0 million in the comparable quarter).
SOURCES OF ORIGINOther Group
(EUR million) Norway Scotland Canada Chile Ireland Faroes
Operational EBIT
Farming 10.9 14.6 -15.9 -17.8 2.6 -1.2 -6.8
Sales & Marketing
Markets 9.4 4.0 1.9 0.4 0.4 0.2 0.1 16.2
Consumer Products 26.3 0.5 -0.1 7.5 0.0 0.0 0.5 34.8
Subtotal 46.6 19.1 -14.1 -9.9 3.0 -1.1 0.6 44.2
Feed 12.3 1.3 0.1 0.0 0.0 13.7
Other entities 1) -8.5 -8.5
Total 58.9 20.4 -14.1 -9.9 3.1 -1.1 -8.0 49.4
Harvest volume (GWT) 78 473 13 018 12 417 20 130 1 189 1 408 126 634
Operational EBIT per kg (EUR) 2) 0.75 1.57 -1.13 -0.49 2.62 -0.77 0.39
- of which Feed 0.16 0.10 0.09 0.00 0.11
- of which Markets 0.12 0.31 0.15 0.02 0.32 0.11 0.13
- of which Consumer Products 0.34 0.04 0.00 0.37 0.01 0.00 0.27
Analytical data
Price achievement/reference price (%) 106 % 154 % 101 % 97 % n/a 117 % 109 %
Contract share (%) 28 % 66 % 2 % 24 % 87 % 0 % 29 %
Quality - superior share (%) 95 % 96 % 88 % 86 % 90 % 94 % 93 %
Guidance
Q1 2021 harvest volume (GWT) 68 000 17 000 10 500 18 000 1 000 1 500 116 000
2021 harvest volume (GWT) 260 000 60 000 40 000 70 000 6 000 9 000 445 000
Q1 2021 contract share (%) 22 % 50 % 5 % 31 % 92 % 0 % 26 %
1) Corporate and Holding companies2) Including Corporate and Holding companies
Q4|2020
© Mowi 4
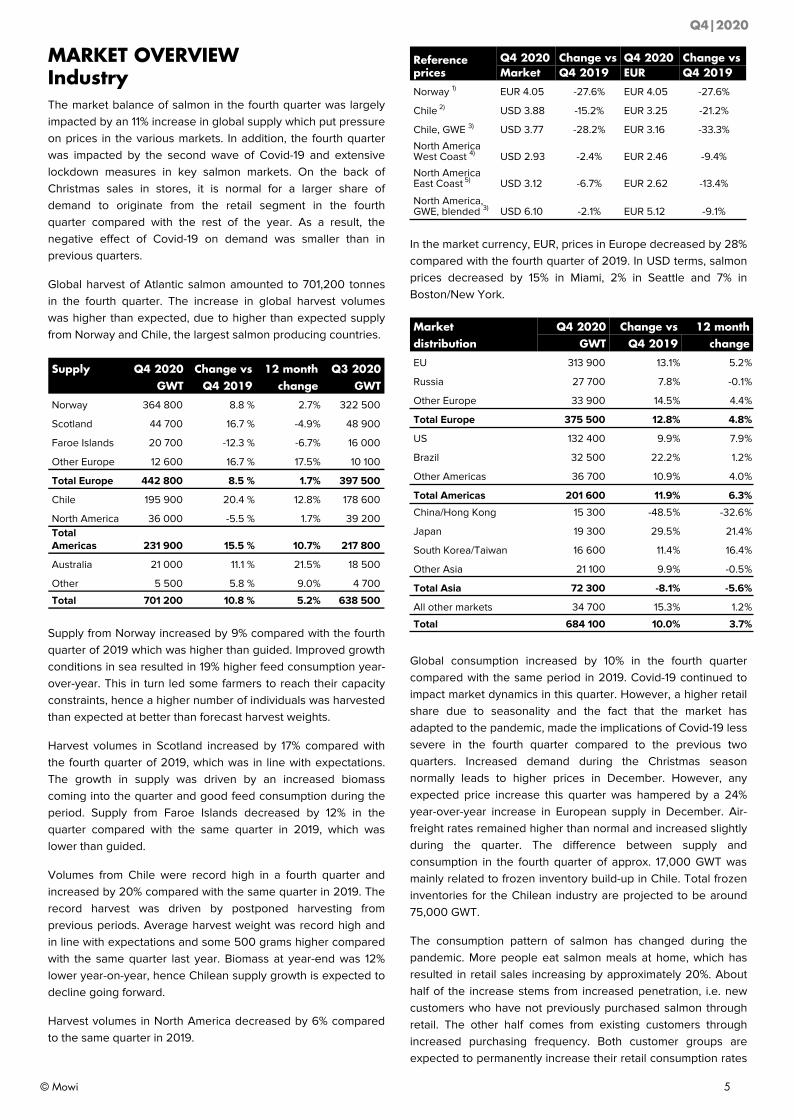
MARKET OVERVIEWIndustryThe market balance of salmon in the fourth quarter was largely impacted by an 11% increase in global supply which put pressure on prices in the various markets. In addition, the fourth quarter was impacted by the second wave of Covid-19 and extensive lockdown measures in key salmon markets. On the back of Christmas sales in stores, it is normal for a larger share of demand to originate from the retail segment in the fourth quarter compared with the rest of the year. As a result, the negative effect of Covid-19 on demand was smaller than in previous quarters.
Global harvest of Atlantic salmon amounted to 701,200 tonnes in the fourth quarter. The increase in global harvest volumes was higher than expected, due to higher than expected supply from Norway and Chile, the largest salmon producing countries.
Supply Q4 2020 Change vs 12 month Q3 2020GWT Q4 2019 change GWT
Norway 364 800 8.8 % 2.7 % 322 500
Scotland 44 700 16.7 % -4.9 % 48 900
Faroe Islands 20 700 -12.3 % -6.7 % 16 000
Other Europe 12 600 16.7 % 17.5 % 10 100
Total Europe 442 800 8.5 % 1.7 % 397 500
Chile 195 900 20.4 % 12.8 % 178 600
North America 36 000 -5.5 % 1.7 % 39 200 Total Americas 231 900 15.5 % 10.7 % 217 800
Australia 21 000 11.1 % 21.5 % 18 500
Other 5 500 5.8 % 9.0 % 4 700
Total 701 200 10.8 % 5.2 % 638 500
Supply from Norway increased by 9% compared with the fourth quarter of 2019 which was higher than guided. Improved growth conditions in sea resulted in 19% higher feed consumption year-over-year. This in turn led some farmers to reach their capacity constraints, hence a higher number of individuals was harvested than expected at better than forecast harvest weights.
Harvest volumes in Scotland increased by 17% compared with the fourth quarter of 2019, which was in line with expectations. The growth in supply was driven by an increased biomass coming into the quarter and good feed consumption during the period. Supply from Faroe Islands decreased by 12% in the quarter compared with the same quarter in 2019, which was lower than guided.
Volumes from Chile were record high in a fourth quarter and increased by 20% compared with the same quarter in 2019. The record harvest was driven by postponed harvesting from previous periods. Average harvest weight was record high and in line with expectations and some 500 grams higher compared with the same quarter last year. Biomass at year-end was 12% lower year-on-year, hence Chilean supply growth is expected to decline going forward.
Harvest volumes in North America decreased by 6% compared to the same quarter in 2019.
Reference prices
Q4 2020 Change vs Q4 2020 Change vsMarket Q4 2019 EUR Q4 2019
Norway 1) EUR 4.05 -27.6% EUR 4.05 -27.6%
Chile 2) USD 3.88 -15.2% EUR 3.25 -21.2%
Chile, GWE 3) USD 3.77 -28.2% EUR 3.16 -33.3%
North America West Coast 4) USD 2.93 -2.4% EUR 2.46 -9.4%
North America East Coast 5) USD 3.12 -6.7% EUR 2.62 -13.4%
North America, GWE, blended 3) USD 6.10 -2.1% EUR 5.12 -9.1%
In the market currency, EUR, prices in Europe decreased by 28% compared with the fourth quarter of 2019. In USD terms, salmon prices decreased by 15% in Miami, 2% in Seattle and 7% in Boston/New York.
Market Q4 2020 Change vs 12 monthdistribution GWT Q4 2019 change
EU 313 900 13.1 % 5.2 %
Russia 27 700 7.8 % -0.1 %
Other Europe 33 900 14.5 % 4.4 %
Total Europe 375 500 12.8 % 4.8 %
US 132 400 9.9 % 7.9 %
Brazil 32 500 22.2 % 1.2 %
Other Americas 36 700 10.9 % 4.0 %
Total Americas 201 600 11.9 % 6.3 %
China/Hong Kong 15 300 -48.5 % -32.6 %
Japan 19 300 29.5 % 21.4 %
South Korea/Taiwan 16 600 11.4 % 16.4 %
Other Asia 21 100 9.9 % -0.5 %
Total Asia 72 300 -8.1 % -5.6 %
All other markets 34 700 15.3 % 1.2 %
Total 684 100 10.0 % 3.7 %
Global consumption increased by 10% in the fourth quarter compared with the same period in 2019. Covid-19 continued to impact market dynamics in this quarter. However, a higher retail share due to seasonality and the fact that the market has adapted to the pandemic, made the implications of Covid-19 less severe in the fourth quarter compared to the previous two quarters. Increased demand during the Christmas season normally leads to higher prices in December. However, any expected price increase this quarter was hampered by a 24% year-over-year increase in European supply in December. Air-freight rates remained higher than normal and increased slightly during the quarter. The difference between supply and consumption in the fourth quarter of approx. 17,000 GWT was mainly related to frozen inventory build-up in Chile. Total frozen inventories for the Chilean industry are projected to be around 75,000 GWT.
The consumption pattern of salmon has changed during the pandemic. More people eat salmon meals at home, which has resulted in retail sales increasing by approximately 20%. About half of the increase stems from increased penetration, i.e. new customers who have not previously purchased salmon through retail. The other half comes from existing customers through increased purchasing frequency. Both customer groups are expected to permanently increase their retail consumption rates
Q4|2020
© Mowi 5
post Covid-19, even as the foodservice segment gradually re-opens in due course.
Consumption in the EU increased by 13% in the quarter. A second wave of Covid-19 hit Europe in the quarter and strict lockdown measures were introduced in many of the main markets; the resulting closure of restaurants and cafes eliminated most foodservice demand. Retail continued its strong performance, driven by increased promotional activities which were helped by lower salmon prices. Within the retail channel sales grew strongly in all the main markets across all key products, with fresh prepacked being the winner.
Consumption in the USA increased by 10% compared with the same quarter in 2019. Despite increased restrictions following a resurgence of Covid-19, market prices for Chilean salmon increased towards year-end which was very positive. Demand developments in Brazil and Latin America were favourable with good development of retail and e-commerce sales. Although restrictions were in place which limited foodservice market activity, the channel experienced a modest level of consumption from outdoor dining during the quarter.
Consumption in Asia decreased by 8% in the quarter compared with the same period last year. Consumption in China was half of what it was before Covid-19 due to various restrictions on imported food and low consumer confidence in imported seafood. Chilean salmon destined for the Chinese market was particularly impacted despite good availability, mainly due to competitive prices from Norway and Tasmania. Japan demonstrated a healthy increase of 30% due to increased demand in the retail segment. Consumption in Korea/Taiwan grew by 11% compared to last year, and other Asia grew by 10% driven by frozen volumes on low prices compared with last year.
Source: Kontali and Mowi
Notes to the reference price table:1) NASDAQ average superior GWE/kg (gutted weight equivalent)2) Urner Barry average D trim 3-4 lbs FOB Miami3) Reference price converted back-to-plant equivalent in GWE/kg4) Urner Barry average GWE 10-12 lbs FOB Seattle5) Urner Barry average GWE 10-12 lbs FOB Boston/New York
Q4|2020
© Mowi 6
Mowi
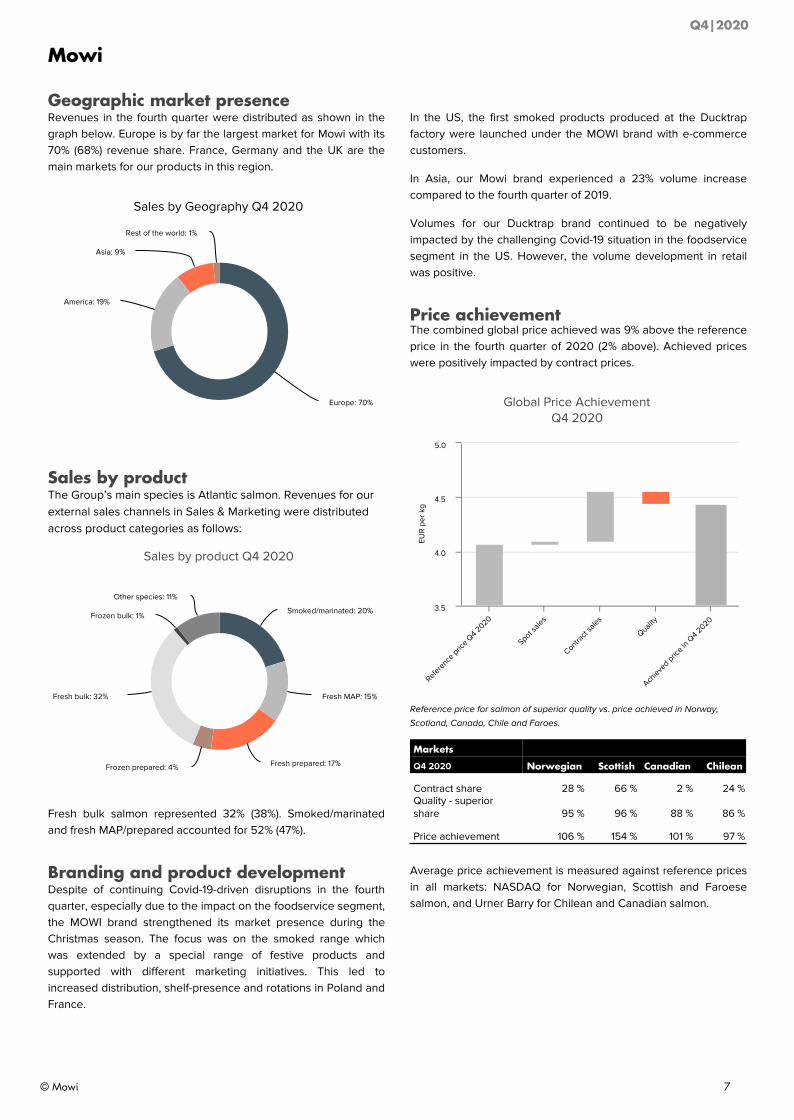
Geographic market presence Revenues in the fourth quarter were distributed as shown in the graph below. Europe is by far the largest market for Mowi with its 70% (68%) revenue share. France, Germany and the UK are the main markets for our products in this region.
Sales by Geography Q4 2020
Europe: 70%
America: 19%
Asia: 9%
Rest of the world: 1%
Sales by productThe Group’s main species is Atlantic salmon. Revenues for our external sales channels in Sales & Marketing were distributed across product categories as follows:
Sales by product Q4 2020
Smoked/marinated: 20%
Fresh MAP: 15%
Fresh prepared: 17%Frozen prepared: 4%
Fresh bulk: 32%
Frozen bulk: 1%
Other species: 11%
Fresh bulk salmon represented 32% (38%). Smoked/marinated and fresh MAP/prepared accounted for 52% (47%).
Branding and product development Despite of continuing Covid-19-driven disruptions in the fourth quarter, especially due to the impact on the foodservice segment, the MOWI brand strengthened its market presence during the Christmas season. The focus was on the smoked range which was extended by a special range of festive products and supported with different marketing initiatives. This led to increased distribution, shelf-presence and rotations in Poland and France.
In the US, the first smoked products produced at the Ducktrap factory were launched under the MOWI brand with e-commerce customers.
In Asia, our Mowi brand experienced a 23% volume increase compared to the fourth quarter of 2019.
Volumes for our Ducktrap brand continued to be negatively impacted by the challenging Covid-19 situation in the foodservice segment in the US. However, the volume development in retail was positive.
Price achievementThe combined global price achieved was 9% above the reference price in the fourth quarter of 2020 (2% above). Achieved prices were positively impacted by contract prices.
EUR
per
kg
Global Price AchievementQ4 2020
Refere
nce pric
e Q4 2
020
Spot sale
s
Contract
sales
Quality
Achieve
d price in
Q4 2
020
3.5
4.0
4.5
5.0
Reference price for salmon of superior quality vs. price achieved in Norway,
Scotland, Canada, Chile and Faroes.
Markets
Q4 2020 Norwegian Scottish Canadian Chilean
Contract share 28 % 66 % 2 % 24 %Quality - superior share 95 % 96 % 88 % 86 %
Price achievement 106 % 154 % 101 % 97 %
Average price achievement is measured against reference prices in all markets: NASDAQ for Norwegian, Scottish and Faroese salmon, and Urner Barry for Chilean and Canadian salmon.
Q4|2020
© Mowi 7
PROFIT - Operational performance
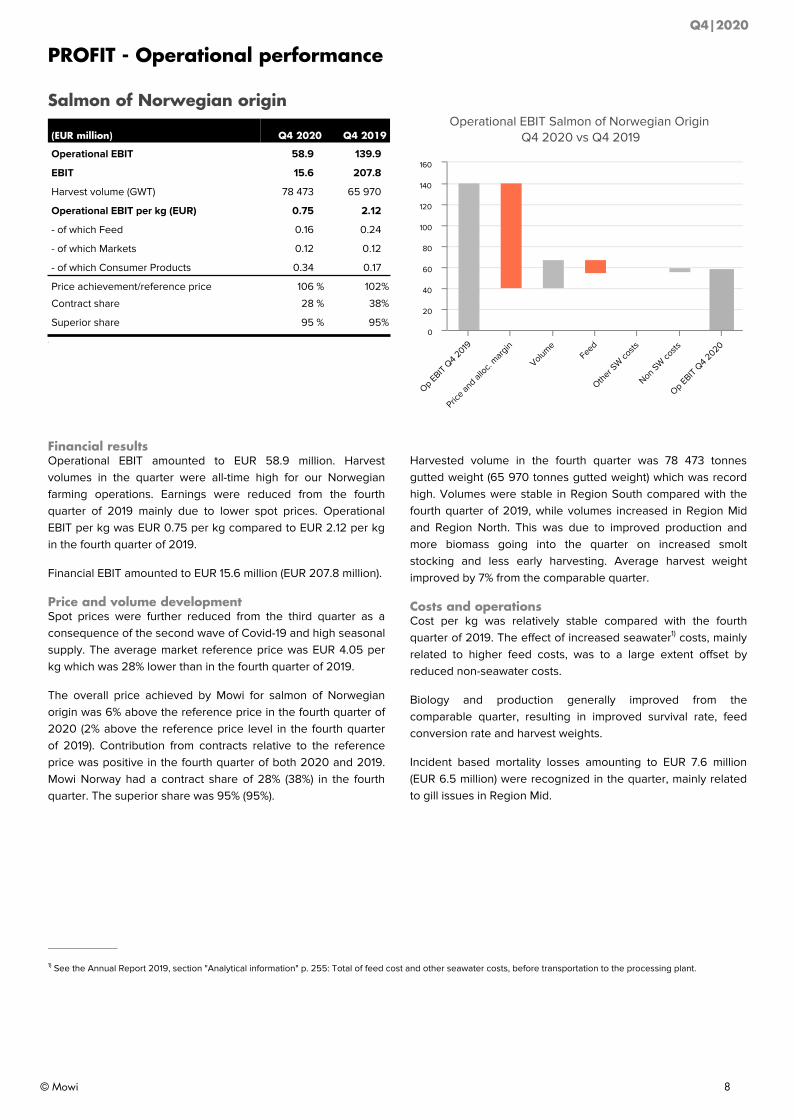
Salmon of Norwegian origin
(EUR million) Q4 2020 Q4 2019
Operational EBIT 58.9 139.9
EBIT 15.6 207.8
Harvest volume (GWT) 78 473 65 970
Operational EBIT per kg (EUR) 0.75 2.12
- of which Feed 0.16 0.24
- of which Markets 0.12 0.12
- of which Consumer Products 0.34 0.17
Price achievement/reference price 106 % 102 %
Contract share 28 % 38 %
Superior share 95 % 95 %
0
Financial resultsOperational EBIT amounted to EUR 58.9 million. Harvest volumes in the quarter were all-time high for our Norwegian farming operations. Earnings were reduced from the fourth quarter of 2019 mainly due to lower spot prices. Operational EBIT per kg was EUR 0.75 per kg compared to EUR 2.12 per kg in the fourth quarter of 2019.
Financial EBIT amounted to EUR 15.6 million (EUR 207.8 million).
Price and volume developmentSpot prices were further reduced from the third quarter as a consequence of the second wave of Covid-19 and high seasonal supply. The average market reference price was EUR 4.05 per kg which was 28% lower than in the fourth quarter of 2019.
The overall price achieved by Mowi for salmon of Norwegian origin was 6% above the reference price in the fourth quarter of 2020 (2% above the reference price level in the fourth quarter of 2019). Contribution from contracts relative to the reference price was positive in the fourth quarter of both 2020 and 2019. Mowi Norway had a contract share of 28% (38%) in the fourth quarter. The superior share was 95% (95%).
Operational EBIT Salmon of Norwegian Origin Q4 2020 vs Q4 2019
Op EBIT Q4 2
019
Price an
d alloc.
margin
VolumeFeed
Other S
W co
sts
Non SW
costs
Op EBIT Q4 2
020
0
20
40
60
80
100
120
140
160
Harvested volume in the fourth quarter was 78 473 tonnes gutted weight (65 970 tonnes gutted weight) which was record high. Volumes were stable in Region South compared with the fourth quarter of 2019, while volumes increased in Region Mid and Region North. This was due to improved production and more biomass going into the quarter on increased smolt stocking and less early harvesting. Average harvest weight improved by 7% from the comparable quarter.
Costs and operationsCost per kg was relatively stable compared with the fourth quarter of 2019. The effect of increased seawater1) costs, mainly related to higher feed costs, was to a large extent offset by reduced non-seawater costs.
Biology and production generally improved from the comparable quarter, resulting in improved survival rate, feed conversion rate and harvest weights.
Incident based mortality losses amounting to EUR 7.6 million (EUR 6.5 million) were recognized in the quarter, mainly related to gill issues in Region Mid.
1) See the Annual Report 2019, section "Analytical information" p. 255: Total of feed cost and other seawater costs, before transportation to the processing plant.
Q4|2020
© Mowi 8
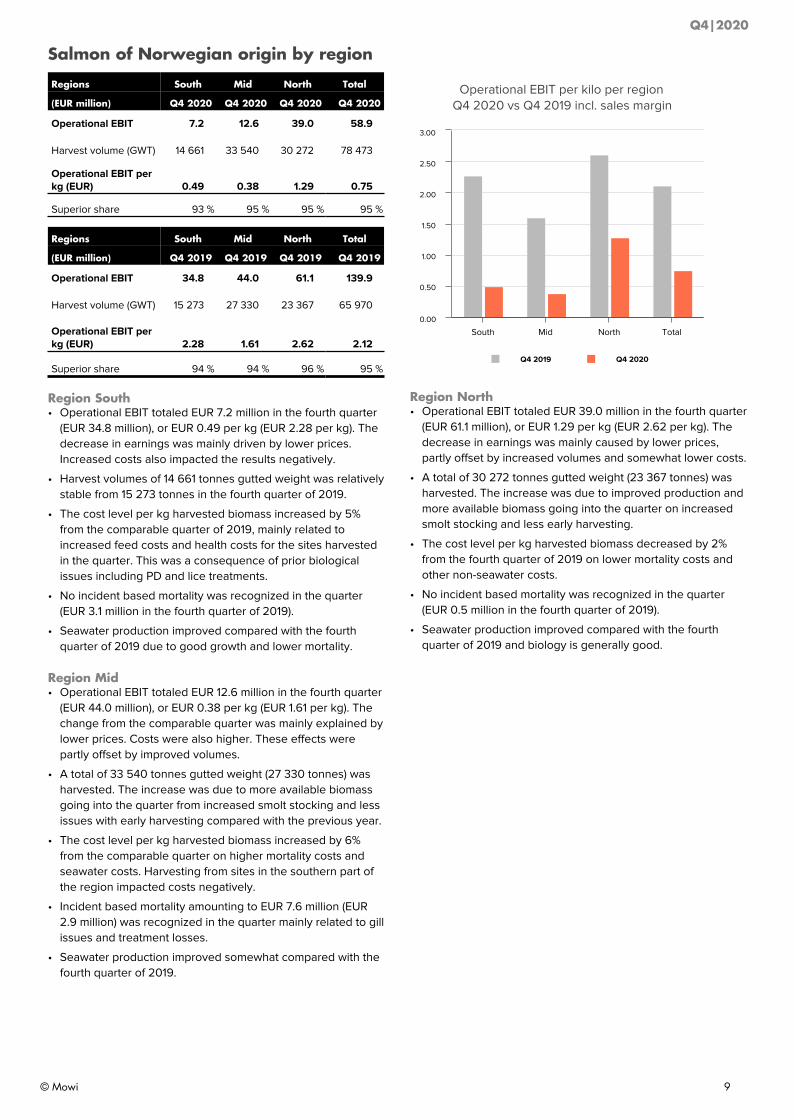
Salmon of Norwegian origin by region
Regions South Mid North Total
(EUR million) Q4 2020 Q4 2020 Q4 2020 Q4 2020
Operational EBIT 7.2 12.6 39.0 58.9
Harvest volume (GWT) 14 661 33 540 30 272 78 473
Operational EBIT per kg (EUR) 0.49 0.38 1.29 0.75
Superior share 93 % 95 % 95 % 95 %
Regions South Mid North Total
(EUR million) Q4 2019 Q4 2019 Q4 2019 Q4 2019
Operational EBIT 34.8 44.0 61.1 139.9
Harvest volume (GWT) 15 273 27 330 23 367 65 970
Operational EBIT per kg (EUR) 2.28 1.61 2.62 2.12
Superior share 94 % 94 % 96 % 95 %
Region South• Operational EBIT totaled EUR 7.2 million in the fourth quarter
(EUR 34.8 million), or EUR 0.49 per kg (EUR 2.28 per kg). The decrease in earnings was mainly driven by lower prices. Increased costs also impacted the results negatively.
• Harvest volumes of 14 661 tonnes gutted weight was relatively stable from 15 273 tonnes in the fourth quarter of 2019.
• The cost level per kg harvested biomass increased by 5% from the comparable quarter of 2019, mainly related to increased feed costs and health costs for the sites harvested in the quarter. This was a consequence of prior biological issues including PD and lice treatments.
• No incident based mortality was recognized in the quarter (EUR 3.1 million in the fourth quarter of 2019).
• Seawater production improved compared with the fourth quarter of 2019 due to good growth and lower mortality.
Region Mid• Operational EBIT totaled EUR 12.6 million in the fourth quarter
(EUR 44.0 million), or EUR 0.38 per kg (EUR 1.61 per kg). The change from the comparable quarter was mainly explained by lower prices. Costs were also higher. These effects were partly offset by improved volumes.
• A total of 33 540 tonnes gutted weight (27 330 tonnes) was harvested. The increase was due to more available biomass going into the quarter from increased smolt stocking and less issues with early harvesting compared with the previous year.
• The cost level per kg harvested biomass increased by 6% from the comparable quarter on higher mortality costs and seawater costs. Harvesting from sites in the southern part of the region impacted costs negatively.
• Incident based mortality amounting to EUR 7.6 million (EUR 2.9 million) was recognized in the quarter mainly related to gill issues and treatment losses.
• Seawater production improved somewhat compared with the fourth quarter of 2019.
Operational EBIT per kilo per regionQ4 2020 vs Q4 2019 incl. sales margin
Q4 2019 Q4 2020
South Mid North Total0.00
0.50
1.00
1.50
2.00
2.50
3.00
Region North• Operational EBIT totaled EUR 39.0 million in the fourth quarter
(EUR 61.1 million), or EUR 1.29 per kg (EUR 2.62 per kg). The decrease in earnings was mainly caused by lower prices, partly offset by increased volumes and somewhat lower costs.
• A total of 30 272 tonnes gutted weight (23 367 tonnes) was harvested. The increase was due to improved production and more available biomass going into the quarter on increased smolt stocking and less early harvesting.
• The cost level per kg harvested biomass decreased by 2% from the fourth quarter of 2019 on lower mortality costs and other non-seawater costs.
• No incident based mortality was recognized in the quarter (EUR 0.5 million in the fourth quarter of 2019).
• Seawater production improved compared with the fourth quarter of 2019 and biology is generally good.
Q4|2020
© Mowi 9
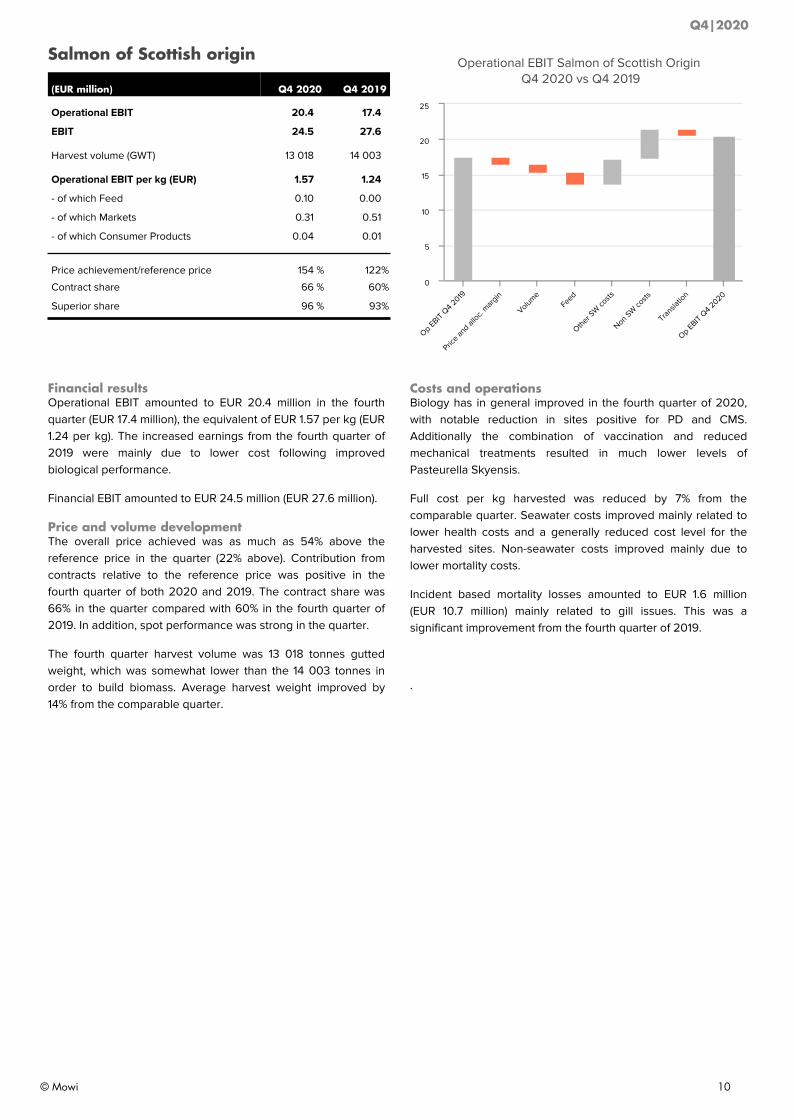
Salmon of Scottish origin
(EUR million) Q4 2020 Q4 2019
Operational EBIT 20.4 17.4
EBIT 24.5 27.6
Harvest volume (GWT) 13 018 14 003
Operational EBIT per kg (EUR) 1.57 1.24
- of which Feed 0.10 0.00
- of which Markets 0.31 0.51
- of which Consumer Products 0.04 0.01
Price achievement/reference price 154 % 122 %
Contract share 66 % 60 %
Superior share 96 % 93 %
Financial resultsOperational EBIT amounted to EUR 20.4 million in the fourth quarter (EUR 17.4 million), the equivalent of EUR 1.57 per kg (EUR 1.24 per kg). The increased earnings from the fourth quarter of 2019 were mainly due to lower cost following improved biological performance.
Financial EBIT amounted to EUR 24.5 million (EUR 27.6 million).
Price and volume developmentThe overall price achieved was as much as 54% above the reference price in the quarter (22% above). Contribution from contracts relative to the reference price was positive in the fourth quarter of both 2020 and 2019. The contract share was 66% in the quarter compared with 60% in the fourth quarter of 2019. In addition, spot performance was strong in the quarter.
The fourth quarter harvest volume was 13 018 tonnes gutted weight, which was somewhat lower than the 14 003 tonnes in order to build biomass. Average harvest weight improved by 14% from the comparable quarter.
Operational EBIT Salmon of Scottish Origin Q4 2020 vs Q4 2019
Op EBIT Q4 2
019
Price an
d alloc.
margin
VolumeFeed
Other S
W co
sts
Non SW
costs
Transla
tion
Op EBIT Q4 2
020
0
5
10
15
20
25
Costs and operationsBiology has in general improved in the fourth quarter of 2020, with notable reduction in sites positive for PD and CMS. Additionally the combination of vaccination and reduced mechanical treatments resulted in much lower levels of Pasteurella Skyensis.
Full cost per kg harvested was reduced by 7% from the comparable quarter. Seawater costs improved mainly related to lower health costs and a generally reduced cost level for the harvested sites. Non-seawater costs improved mainly due to lower mortality costs.
Incident based mortality losses amounted to EUR 1.6 million (EUR 10.7 million) mainly related to gill issues. This was a significant improvement from the fourth quarter of 2019.
.
Q4|2020
© Mowi 10
Salmon of Canadian origin
(EUR million) Q4 2020 Q4 2019
Operational EBIT -14.1 -8.7
EBIT -43.1 -12.7
Harvest volume (GWT) 12 417 16 246
Operational EBIT per kg (EUR) -1.13 -0.53
- of which Markets 0.15 0.38
- of which Consumer Products 0.00 0.00
Price achievement/reference price 101 % 85 %
Contract share 2 % 0 %
Superior share 88 % 74 %
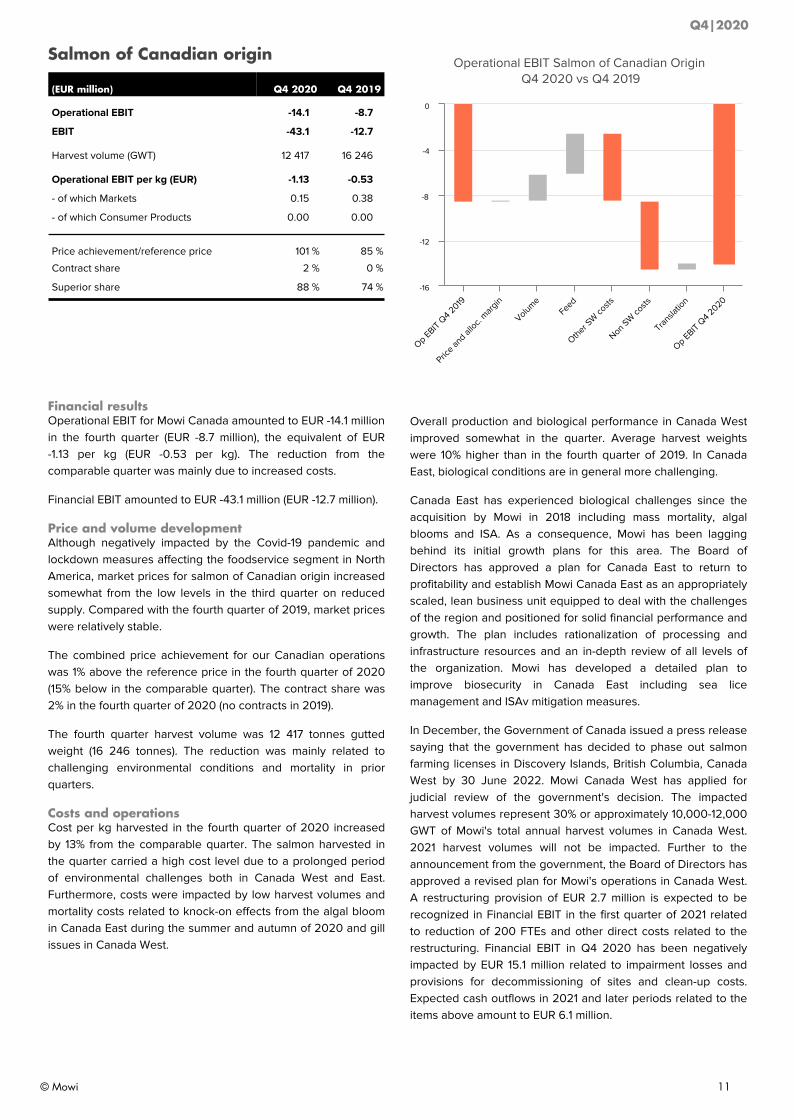
Financial resultsOperational EBIT for Mowi Canada amounted to EUR -14.1 million in the fourth quarter (EUR -8.7 million), the equivalent of EUR -1.13 per kg (EUR -0.53 per kg). The reduction from the comparable quarter was mainly due to increased costs.
Financial EBIT amounted to EUR -43.1 million (EUR -12.7 million).
Price and volume developmentAlthough negatively impacted by the Covid-19 pandemic and lockdown measures affecting the foodservice segment in North America, market prices for salmon of Canadian origin increased somewhat from the low levels in the third quarter on reduced supply. Compared with the fourth quarter of 2019, market prices were relatively stable.
The combined price achievement for our Canadian operations was 1% above the reference price in the fourth quarter of 2020 (15% below in the comparable quarter). The contract share was 2% in the fourth quarter of 2020 (no contracts in 2019).
The fourth quarter harvest volume was 12 417 tonnes gutted weight (16 246 tonnes). The reduction was mainly related to challenging environmental conditions and mortality in prior quarters.
Costs and operationsCost per kg harvested in the fourth quarter of 2020 increased by 13% from the comparable quarter. The salmon harvested in the quarter carried a high cost level due to a prolonged period of environmental challenges both in Canada West and East. Furthermore, costs were impacted by low harvest volumes and mortality costs related to knock-on effects from the algal bloom in Canada East during the summer and autumn of 2020 and gill issues in Canada West.
Operational EBIT Salmon of Canadian Origin Q4 2020 vs Q4 2019
Op EBIT Q4 2
019
Price an
d alloc.
margin
VolumeFeed
Other S
W co
sts
Non SW
costs
Transla
tion
Op EBIT Q4 2
020
-16
-12
-8
-4
0
Overall production and biological performance in Canada West improved somewhat in the quarter. Average harvest weights were 10% higher than in the fourth quarter of 2019. In Canada East, biological conditions are in general more challenging.
Canada East has experienced biological challenges since the acquisition by Mowi in 2018 including mass mortality, algal blooms and ISA. As a consequence, Mowi has been lagging behind its initial growth plans for this area. The Board of Directors has approved a plan for Canada East to return to profitability and establish Mowi Canada East as an appropriately scaled, lean business unit equipped to deal with the challenges of the region and positioned for solid financial performance and growth. The plan includes rationalization of processing and infrastructure resources and an in-depth review of all levels of the organization. Mowi has developed a detailed plan to improve biosecurity in Canada East including sea lice management and ISAv mitigation measures.
In December, the Government of Canada issued a press release saying that the government has decided to phase out salmon farming licenses in Discovery Islands, British Columbia, Canada West by 30 June 2022. Mowi Canada West has applied for judicial review of the government's decision. The impacted harvest volumes represent 30% or approximately 10,000-12,000 GWT of Mowi's total annual harvest volumes in Canada West. 2021 harvest volumes will not be impacted. Further to the announcement from the government, the Board of Directors has approved a revised plan for Mowi's operations in Canada West. A restructuring provision of EUR 2.7 million is expected to be recognized in Financial EBIT in the first quarter of 2021 related to reduction of 200 FTEs and other direct costs related to the restructuring. Financial EBIT in Q4 2020 has been negatively impacted by EUR 15.1 million related to impairment losses and provisions for decommissioning of sites and clean-up costs. Expected cash outflows in 2021 and later periods related to the items above amount to EUR 6.1 million.
Q4|2020
© Mowi 11
Salmon of Chilean origin
(EUR million) Q4 2020 Q4 2019
Operational EBIT -9.9 13.2
EBIT 52.7 -1.2
Harvest volume (GWT) 20 130 16 623
Operational EBIT per kg (EUR) -0.49 0.79
- of which Markets 0.02 0.07
- of which Consumer Products 0.37 0.30
Price achievement/reference price 97 % 100 %
Contract share 24 % 24 %
Superior share 86 % 88 %
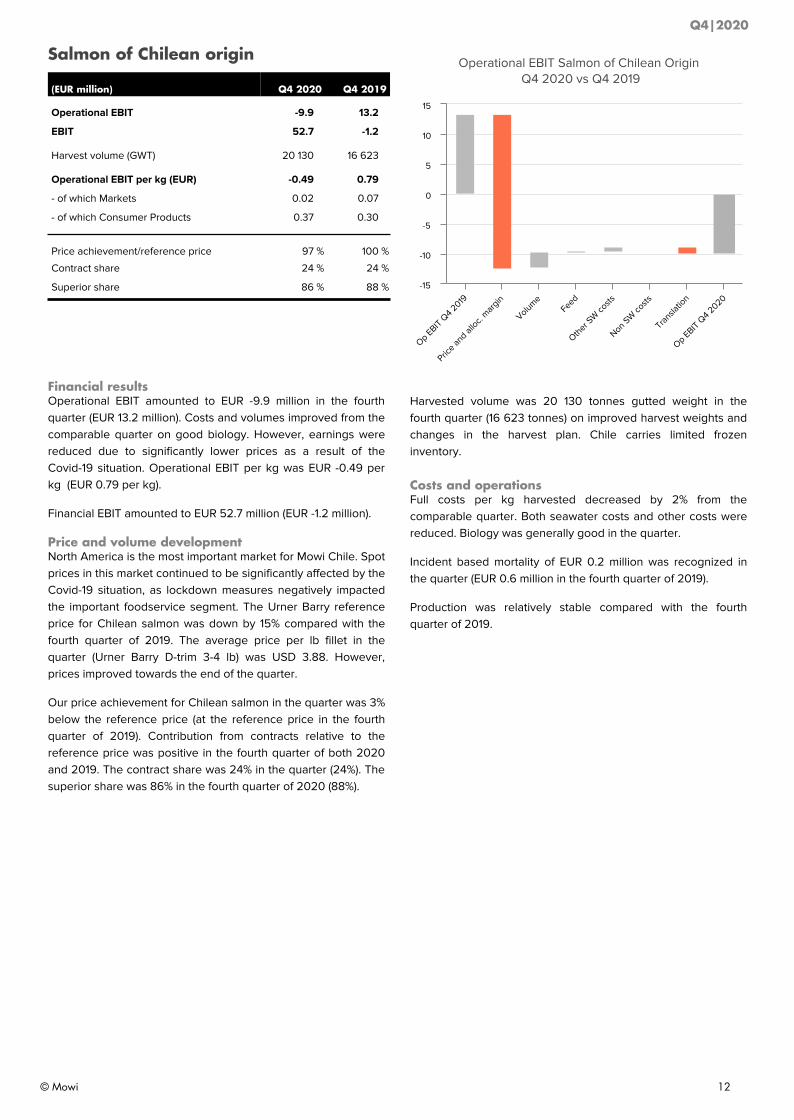
Financial resultsOperational EBIT amounted to EUR -9.9 million in the fourth quarter (EUR 13.2 million). Costs and volumes improved from the comparable quarter on good biology. However, earnings were reduced due to significantly lower prices as a result of the Covid-19 situation. Operational EBIT per kg was EUR -0.49 per kg (EUR 0.79 per kg).
Financial EBIT amounted to EUR 52.7 million (EUR -1.2 million).
Price and volume developmentNorth America is the most important market for Mowi Chile. Spot prices in this market continued to be significantly affected by the Covid-19 situation, as lockdown measures negatively impacted the important foodservice segment. The Urner Barry reference price for Chilean salmon was down by 15% compared with the fourth quarter of 2019. The average price per lb fillet in the quarter (Urner Barry D-trim 3-4 lb) was USD 3.88. However, prices improved towards the end of the quarter.
Our price achievement for Chilean salmon in the quarter was 3% below the reference price (at the reference price in the fourth quarter of 2019). Contribution from contracts relative to the reference price was positive in the fourth quarter of both 2020 and 2019. The contract share was 24% in the quarter (24%). The superior share was 86% in the fourth quarter of 2020 (88%).
Operational EBIT Salmon of Chilean Origin Q4 2020 vs Q4 2019
Op EBIT Q4 2
019
Price an
d alloc.
margin
VolumeFeed
Other S
W co
sts
Non SW
costs
Transla
tion
Op EBIT Q4 2
020
-15
-10
-5
0
5
10
15
Harvested volume was 20 130 tonnes gutted weight in the fourth quarter (16 623 tonnes) on improved harvest weights and changes in the harvest plan. Chile carries limited frozen inventory.
Costs and operationsFull costs per kg harvested decreased by 2% from the comparable quarter. Both seawater costs and other costs were reduced. Biology was generally good in the quarter.
Incident based mortality of EUR 0.2 million was recognized in the quarter (EUR 0.6 million in the fourth quarter of 2019).
Production was relatively stable compared with the fourth quarter of 2019.
Q4|2020
© Mowi 12
Salmon of Irish origin
(EUR million) Q4 2020 Q4 2019
Operational EBIT 3.1 3.8
EBIT 4.8 3.8
Harvest volume (GWT) 1 189 1 127
Operational EBIT per kg (EUR) 2.62 3.34
- of which Feed 0.09 0.00
- of which Markets 0.32 0.02
- of which Consumer Products 0.01 0.60
Price achievement/reference price n/a n/a
Contract share 87 % 98 %
Superior share 90 % 89 %
Operational EBIT amounted to EUR 3.1 million in the fourth quarter (EUR 3.8 million). Lower prices and allocated margin as well as somewhat increased costs negatively affected the earnings. Although the quarterly results were somewhat reduced from Q4 2019, full year earnings for 2020 were the second best ever for our Irish operations.
Financial EBIT amounted to EUR 4.8 million (EUR 3.8 million).
Harvest volume was 1 189 tonnes gutted weight, which was stable compared with the fourth quarter of 2019 (1 127 tonnes).
Achieved prices including allocated margin from Sales & Marketing were lower in the fourth quarter of 2020 compared with the fourth quarter of 2019.
Cost per kg harvested in our Irish operations increased somewhat in the fourth quarter compared with the same quarter in 2019.
Salmon of Faroese origin
(EUR million) Q4 2020 Q4 2019
Operational EBIT -1.1 3.8
EBIT -0.6 6.2
Harvest volume (GWT) 1 408 2 345
Operational EBIT per kg (EUR) -0.77 1.63
- of which Feed 0.00 0.00
- of which Markets 0.11 0.34
- of which Consumer Products 0.00 0.01
Price achievement/reference price 117 % 114 %
Contract share 0 % 0 %
Superior share 94 % 87 %
Operational EBIT amounted to EUR -1.1 million (EUR 3.8 million), equivalent to EUR (0.77) per kg (EUR 1.63 per kg). Earnings were negatively impacted by lower volumes, reduced prices and higher costs.
Financial EBIT amounted to EUR -0.6 million (EUR 6.2 million).
Harvest volume was 1 408 tonnes gutted weight in the fourth quarter (2 345 tonnes). This is due to the low number of sites in our Faroese operations.
Price achievement was 17% above the reference price (14% above in the comparable quarter), as the majority of Mowi's salmon of Faroese origin was sold to customers in Russia at higher prices.
Costs per kg harvested biomass increased compared with the fourth quarter of 2019 on lower volumes and harvesting from the Sandsvág site which carries a higher cost level. In the comparable quarter, Mowi Faroes harvested from the site Haldórsvík.
Q4|2020
© Mowi 13
Consumer Products
(EUR million) Q4 2020 Q4 2019
Operating revenues 1) 705.9 725.7
Operational EBIT 2) 34.8 17.3
Operational EBIT % 4.9 % 2.4 %
Operational EBIT % VAP only 5.3 % 2.4 %
EBIT 3) 26.8 16.5
Volume sold (tonnes product weight) 70 045 61 574
1) The reporting segment includes Consumer Products in Europe, Asia and Americas.2) Operational EBIT for salmon in Consumer Products is also included in the results per country of origin.3) After elimination of unrealized gain/loss on group-internal hedging contracts.
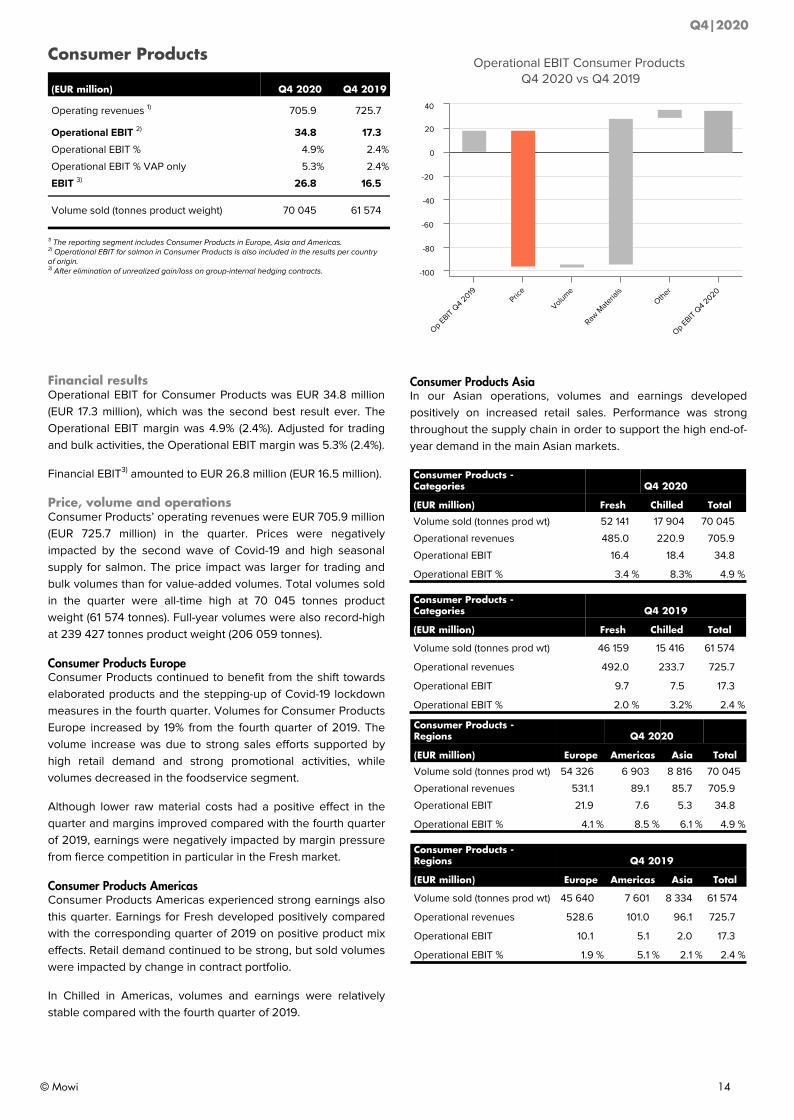
Financial resultsOperational EBIT for Consumer Products was EUR 34.8 million (EUR 17.3 million), which was the second best result ever. The Operational EBIT margin was 4.9% (2.4%). Adjusted for trading and bulk activities, the Operational EBIT margin was 5.3% (2.4%).
Financial EBIT3) amounted to EUR 26.8 million (EUR 16.5 million).
Price, volume and operationsConsumer Products’ operating revenues were EUR 705.9 million (EUR 725.7 million) in the quarter. Prices were negatively impacted by the second wave of Covid-19 and high seasonal supply for salmon. The price impact was larger for trading and bulk volumes than for value-added volumes. Total volumes sold in the quarter were all-time high at 70 045 tonnes product weight (61 574 tonnes). Full-year volumes were also record-high at 239 427 tonnes product weight (206 059 tonnes).
Consumer Products EuropeConsumer Products continued to benefit from the shift towards elaborated products and the stepping-up of Covid-19 lockdown measures in the fourth quarter. Volumes for Consumer Products Europe increased by 19% from the fourth quarter of 2019. The volume increase was due to strong sales efforts supported by high retail demand and strong promotional activities, while volumes decreased in the foodservice segment.
Although lower raw material costs had a positive effect in the quarter and margins improved compared with the fourth quarter of 2019, earnings were negatively impacted by margin pressure from fierce competition in particular in the Fresh market.
Consumer Products AmericasConsumer Products Americas experienced strong earnings also this quarter. Earnings for Fresh developed positively compared with the corresponding quarter of 2019 on positive product mix effects. Retail demand continued to be strong, but sold volumes were impacted by change in contract portfolio.
In Chilled in Americas, volumes and earnings were relatively stable compared with the fourth quarter of 2019.
Operational EBIT Consumer Products Q4 2020 vs Q4 2019
Op EBIT Q4 2
019Pric
e
Volume
Raw M
ateria
lsOth
er
Op EBIT Q4 2
020
-100
-80
-60
-40
-20
0
20
40
Consumer Products AsiaIn our Asian operations, volumes and earnings developed positively on increased retail sales. Performance was strong throughout the supply chain in order to support the high end-of-year demand in the main Asian markets.
Consumer Products - Categories Q4 2020
(EUR million) Fresh Chilled Total
Volume sold (tonnes prod wt) 52 141 17 904 70 045
Operational revenues 485.0 220.9 705.9
Operational EBIT 16.4 18.4 34.8
Operational EBIT % 3.4 % 8.3 % 4.9 %
Consumer Products - Categories Q4 2019
(EUR million) Fresh Chilled Total
Volume sold (tonnes prod wt) 46 159 15 416 61 574
Operational revenues 492.0 233.7 725.7
Operational EBIT 9.7 7.5 17.3
Operational EBIT % 2.0 % 3.2 % 2.4 %
Consumer Products - Regions Q4 2020
(EUR million) Europe Americas Asia Total
Volume sold (tonnes prod wt) 54 326 6 903 8 816 70 045
Operational revenues 531.1 89.1 85.7 705.9
Operational EBIT 21.9 7.6 5.3 34.8
Operational EBIT % 4.1 % 8.5 % 6.1 % 4.9 %
Consumer Products - Regions Q4 2019
(EUR million) Europe Americas Asia Total
Volume sold (tonnes prod wt) 45 640 7 601 8 334 61 574
Operational revenues 528.6 101.0 96.1 725.7
Operational EBIT 10.1 5.1 2.0 17.3
Operational EBIT % 1.9 % 5.1 % 2.1 % 2.4 %
Q4|2020
© Mowi 14
Feed
(EUR million) Q4 2020 Q4 2019
Operating revenues 194.7 170.8
Operational EBIT 13.7 13.8
Operational EBIT % 7.0 % 8.1 %
EBIT 13.6 14.0
Feed sold volume (tonnes) 153 466 130 034
Feed produced volume (tonnes) 153 181 112 277
Operational EBIT for Feed is also included in the results per country of origin.
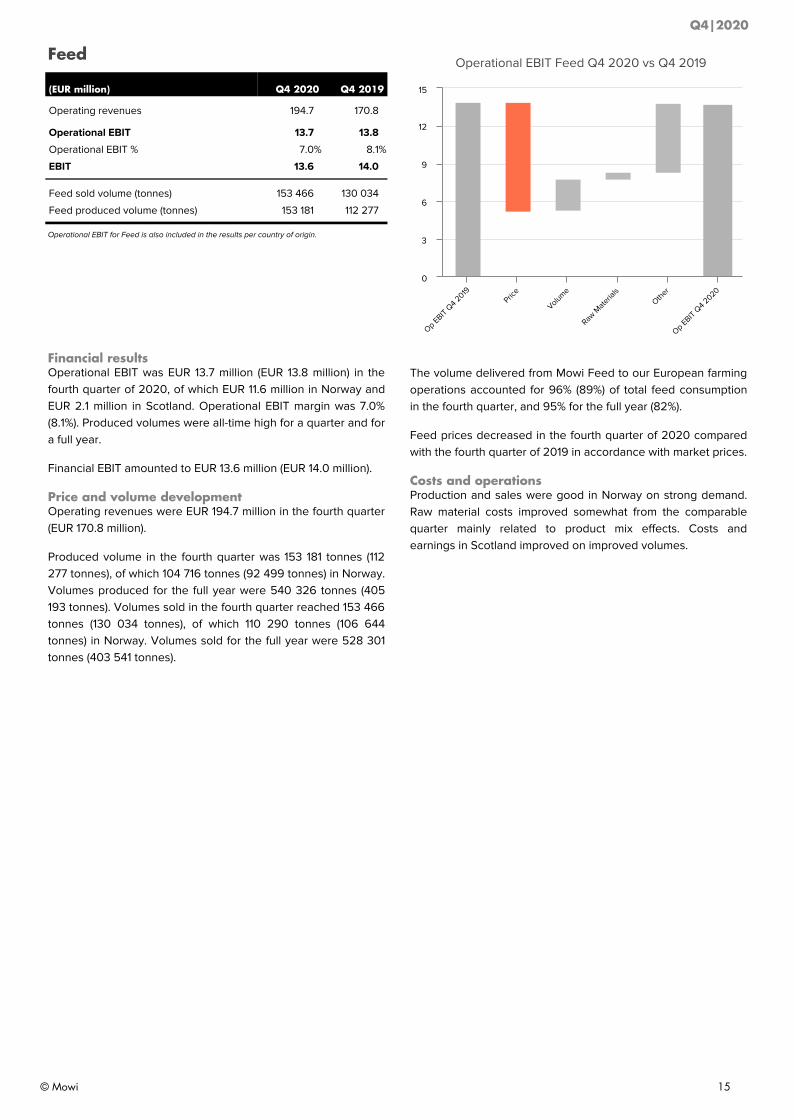
Financial resultsOperational EBIT was EUR 13.7 million (EUR 13.8 million) in the fourth quarter of 2020, of which EUR 11.6 million in Norway and EUR 2.1 million in Scotland. Operational EBIT margin was 7.0% (8.1%). Produced volumes were all-time high for a quarter and for a full year.
Financial EBIT amounted to EUR 13.6 million (EUR 14.0 million).
Price and volume developmentOperating revenues were EUR 194.7 million in the fourth quarter (EUR 170.8 million).
Produced volume in the fourth quarter was 153 181 tonnes (112 277 tonnes), of which 104 716 tonnes (92 499 tonnes) in Norway. Volumes produced for the full year were 540 326 tonnes (405 193 tonnes). Volumes sold in the fourth quarter reached 153 466 tonnes (130 034 tonnes), of which 110 290 tonnes (106 644 tonnes) in Norway. Volumes sold for the full year were 528 301 tonnes (403 541 tonnes).
Operational EBIT Feed Q4 2020 vs Q4 2019
Op EBIT Q4 2
019Pric
e
Volume
Raw M
ateria
lsOth
er
Op EBIT Q4 2
020
0
3
6
9
12
15
The volume delivered from Mowi Feed to our European farming operations accounted for 96% (89%) of total feed consumption in the fourth quarter, and 95% for the full year (82%).
Feed prices decreased in the fourth quarter of 2020 compared with the fourth quarter of 2019 in accordance with market prices.
Costs and operationsProduction and sales were good in Norway on strong demand. Raw material costs improved somewhat from the comparable quarter mainly related to product mix effects. Costs and earnings in Scotland improved on improved volumes.
Q4|2020
© Mowi 15
PLANET - Sustainable and responsible developmentOur operations and long-term profitability ultimately depend on sustainable and environmentally responsible interactions with the natural environment. We rely on qualified personnel to maintain fish health, avoid escapes and minimize the environmental impact of our operations.
Escape preventionMowi has a target of zero fish escapes and is constantly striving to prevent escapes and improve methods, equipment and procedures that can minimize or eliminate escapes. In the fourth quarter, there were 2 incidents with a total number of escapees of 22 027; 1 incident in Norway Region South with 5 escaped fish and one incident in the Faroes with a total number of escapees of 22 022. In the fourth quarter of 2019, there were 4 incidents with a total number of escapees of 47 583.
Fish healthPancreas Disease (PD): 1 new site were diagnosed with PD in the fourth quarter, in Norway. 10 sites in the corresponding quarter of 2019, 7 in Norway, 2 in Scotland and 1 in Ireland.
Infectious Salmon Anaemia (ISA): In the fourth quarter of 2020, the ISA virus was detected at 3 sites in Newfoundland, Canada East. In the comparable quarter of 2019, 1 new site was diagnosed with ISA in Norway. There is no effective treatment for ISA so prevention is the only means of controlling the disease. Our monitoring and surveillance continue and we maintain the strictest measures according to regulatory requirements.
Cardiomyopathy Syndrome (CMS): CMS is a concern in our farming operations in Norway, Scotland and Ireland. CMS is caused by a virus and affects the heart of the fish, and may cause mortality. Currently there is no vaccine. Control is achieved by applying bio security measures to prevent transmission or early harvesting of fish.
Lice management Mowi is actively working to reduce the sea lice load in all farming units. Employment of non-medicinal solutions has increased in the operating units, and extensive development and testing of non-medicinal tools and methods continues in collaboration between Mowi's Global R&D and Technical department and the operating units. As per the end of the fourth quarter, the share of fish undergoing medicinal treatments against sea lice was relatively stable compared to the same quarter of 2019. Mowi continues to work on reducing the dependency on medicinal treatments.
SRS in ChileSRS (Salmonid Rickettsial Septicaemia) is caused by an intracellular bacterium which occurs mainly in Chile. Mortality caused by SRS is still a challenge in Chilean salmon farming. In the fourth quarter of 2020, reported mortality due to SRS was higher than in the comparable quarter of 2019. Mowi continues to assess an vaccine for SRS under commercial conditions.
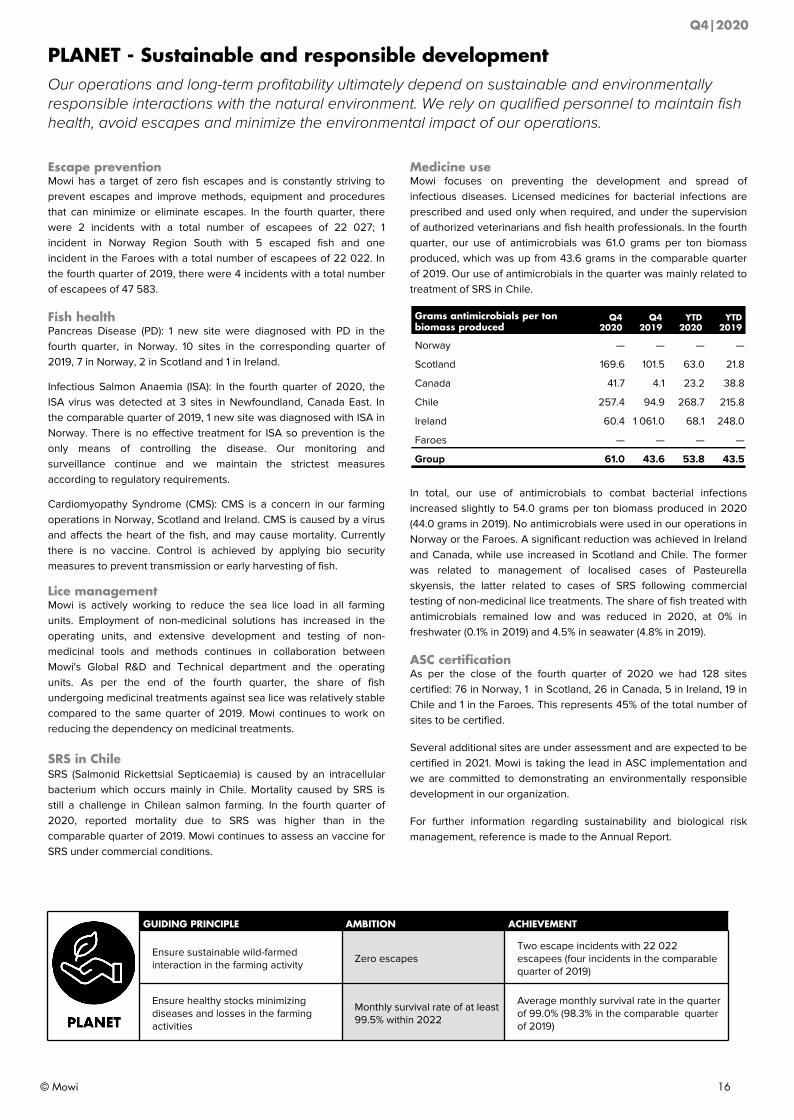
Medicine useMowi focuses on preventing the development and spread of infectious diseases. Licensed medicines for bacterial infections are prescribed and used only when required, and under the supervision of authorized veterinarians and fish health professionals. In the fourth quarter, our use of antimicrobials was 61.0 grams per ton biomass produced, which was up from 43.6 grams in the comparable quarter of 2019. Our use of antimicrobials in the quarter was mainly related to treatment of SRS in Chile.
Grams antimicrobials per ton biomass produced
Q4 2020
Q4 2019
YTD 2020
YTD 2019
Norway — — — —
Scotland 169.6 101.5 63.0 21.8
Canada 41.7 4.1 23.2 38.8
Chile 257.4 94.9 268.7 215.8
Ireland 60.4 1 061.0 68.1 248.0
Faroes — — — —
Group 61.0 43.6 53.8 43.5
In total, our use of antimicrobials to combat bacterial infections increased slightly to 54.0 grams per ton biomass produced in 2020 (44.0 grams in 2019). No antimicrobials were used in our operations in Norway or the Faroes. A significant reduction was achieved in Ireland and Canada, while use increased in Scotland and Chile. The former was related to management of localised cases of Pasteurella skyensis, the latter related to cases of SRS following commercial testing of non-medicinal lice treatments. The share of fish treated with antimicrobials remained low and was reduced in 2020, at 0% in freshwater (0.1% in 2019) and 4.5% in seawater (4.8% in 2019).
ASC certificationAs per the close of the fourth quarter of 2020 we had 128 sites certified: 76 in Norway, 1 in Scotland, 26 in Canada, 5 in Ireland, 19 in Chile and 1 in the Faroes. This represents 45% of the total number of sites to be certified.
Several additional sites are under assessment and are expected to be certified in 2021. Mowi is taking the lead in ASC implementation and we are committed to demonstrating an environmentally responsible development in our organization.
For further information regarding sustainability and biological risk management, reference is made to the Annual Report.
GUIDING PRINCIPLE AMBITION ACHIEVEMENT
Ensure sustainable wild-farmed interaction in the farming activity
Zero escapesTwo escape incidents with 22 022 escapees (four incidents in the comparable quarter of 2019)
Ensure healthy stocks minimizing diseases and losses in the farming activities
Monthly survival rate of at least 99.5% within 2022
Average monthly survival rate in the quarter of 99.0% (98.3% in the comparable quarter of 2019)
Q4|2020
© Mowi 16
PEOPLE - Safe and meaningful jobs The safety, self-respect and personal pride of our employees cannot be compromised if Mowi is to succeed as a company and maintain good relationships with local communities.
Employee Health and Safety In the fourth quarter, the Group recorded 22 Lost Time Incidents (LTIs), which is a increase from 18 in the comparable quarter of 2019.
Measured in LTIs per million hours worked (rolling average), the figure has improved to 2.69 from 4.27 in the comparable quarter of 2019. Absenteeism was 4.9% in the quarter, somewhat up from 3.8% in the comparable quarter due to Covid-19.
GUIDING PRINCIPLE AMBITION ACHIEVEMENT
Safe jobs No lost time incidents (LTI)LTIs per million hours worked was 2.69 Programs are in place to reduce the number.
Healthy working environment Absenteeism < 4% Absenteeism of 4.9% in the quarter.
PRODUCT - Tasty and healthy seafoodWe aim to continually deliver healthy, tasty and responsibly produced seafood to our customers in order to deliver long-term financial profitability.
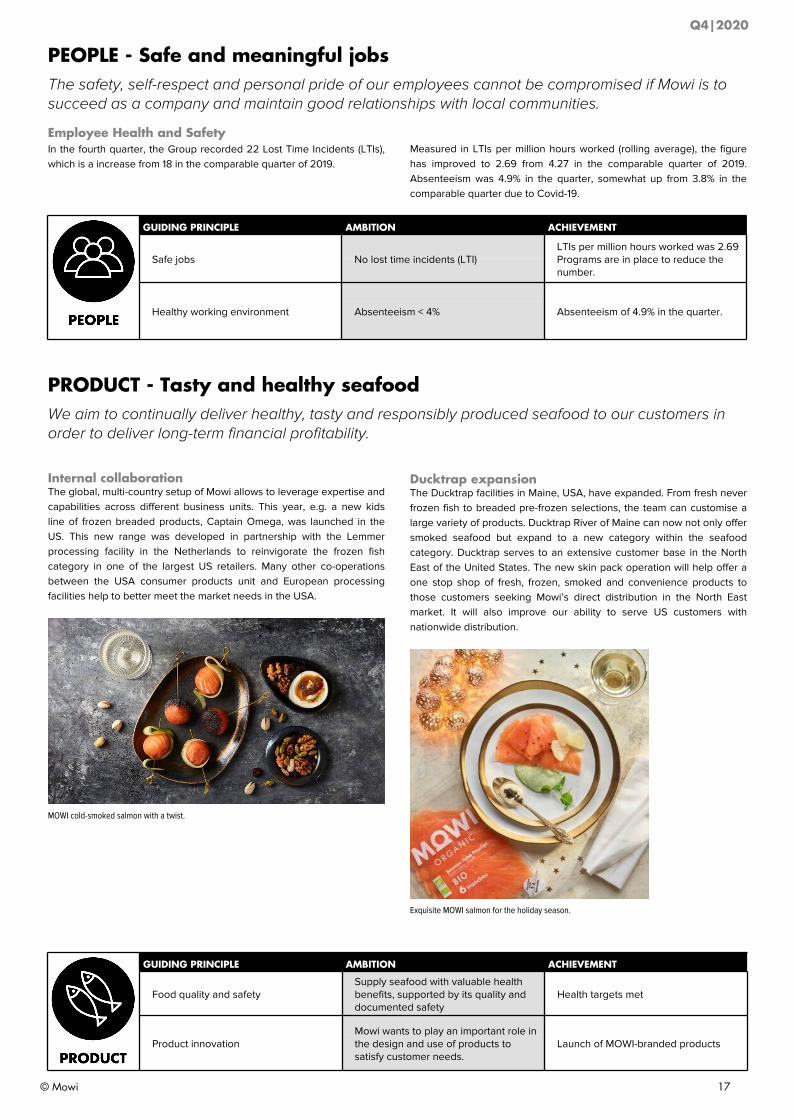
Internal collaborationThe global, multi-country setup of Mowi allows to leverage expertise and capabilities across different business units. This year, e.g. a new kids line of frozen breaded products, Captain Omega, was launched in the US. This new range was developed in partnership with the Lemmer processing facility in the Netherlands to reinvigorate the frozen fish category in one of the largest US retailers. Many other co-operations between the USA consumer products unit and European processing facilities help to better meet the market needs in the USA.
MOWI cold-smoked salmon with a twist.
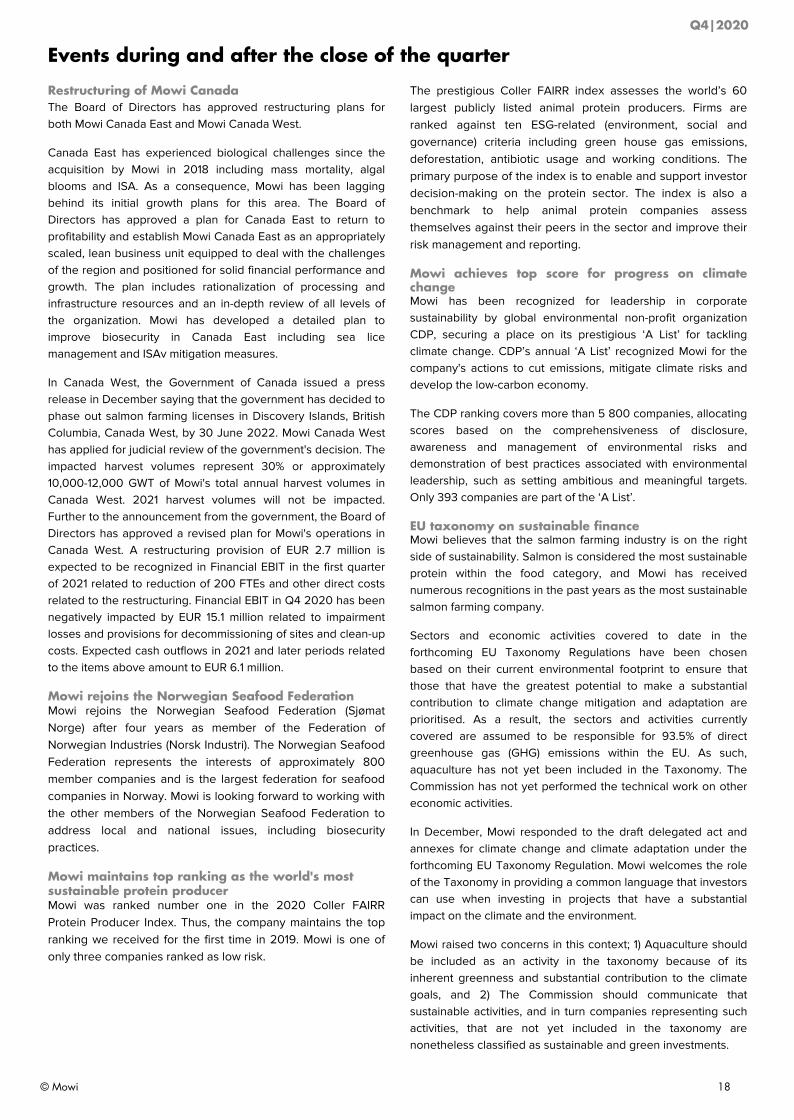
Ducktrap expansionThe Ducktrap facilities in Maine, USA, have expanded. From fresh never frozen fish to breaded pre-frozen selections, the team can customise a large variety of products. Ducktrap River of Maine can now not only offer smoked seafood but expand to a new category within the seafood category. Ducktrap serves to an extensive customer base in the North East of the United States. The new skin pack operation will help offer a one stop shop of fresh, frozen, smoked and convenience products to those customers seeking Mowi’s direct distribution in the North East market. It will also improve our ability to serve US customers with nationwide distribution.
Exquisite MOWI salmon for the holiday season.
GUIDING PRINCIPLE AMBITION ACHIEVEMENT
Food quality and safetySupply seafood with valuable health benefits, supported by its quality and documented safety
Health targets met
Product innovationMowi wants to play an important role in the design and use of products to satisfy customer needs.
Launch of MOWI-branded products
Q4|2020
© Mowi 17
Events during and after the close of the quarter
Restructuring of Mowi Canada The Board of Directors has approved restructuring plans for both Mowi Canada East and Mowi Canada West.
Canada East has experienced biological challenges since the acquisition by Mowi in 2018 including mass mortality, algal blooms and ISA. As a consequence, Mowi has been lagging behind its initial growth plans for this area. The Board of Directors has approved a plan for Canada East to return to profitability and establish Mowi Canada East as an appropriately scaled, lean business unit equipped to deal with the challenges of the region and positioned for solid financial performance and growth. The plan includes rationalization of processing and infrastructure resources and an in-depth review of all levels of the organization. Mowi has developed a detailed plan to improve biosecurity in Canada East including sea lice management and ISAv mitigation measures.
In Canada West, the Government of Canada issued a press release in December saying that the government has decided to phase out salmon farming licenses in Discovery Islands, British Columbia, Canada West, by 30 June 2022. Mowi Canada West has applied for judicial review of the government's decision. The impacted harvest volumes represent 30% or approximately 10,000-12,000 GWT of Mowi's total annual harvest volumes in Canada West. 2021 harvest volumes will not be impacted. Further to the announcement from the government, the Board of Directors has approved a revised plan for Mowi's operations in Canada West. A restructuring provision of EUR 2.7 million is expected to be recognized in Financial EBIT in the first quarter of 2021 related to reduction of 200 FTEs and other direct costs related to the restructuring. Financial EBIT in Q4 2020 has been negatively impacted by EUR 15.1 million related to impairment losses and provisions for decommissioning of sites and clean-up costs. Expected cash outflows in 2021 and later periods related to the items above amount to EUR 6.1 million.
Mowi rejoins the Norwegian Seafood FederationMowi rejoins the Norwegian Seafood Federation (Sjømat Norge) after four years as member of the Federation of Norwegian Industries (Norsk Industri). The Norwegian Seafood Federation represents the interests of approximately 800 member companies and is the largest federation for seafood companies in Norway. Mowi is looking forward to working with the other members of the Norwegian Seafood Federation to address local and national issues, including biosecurity practices.
Mowi maintains top ranking as the world's most sustainable protein producerMowi was ranked number one in the 2020 Coller FAIRR Protein Producer Index. Thus, the company maintains the top ranking we received for the first time in 2019. Mowi is one of only three companies ranked as low risk.
The prestigious Coller FAIRR index assesses the world’s 60 largest publicly listed animal protein producers. Firms are ranked against ten ESG-related (environment, social and governance) criteria including green house gas emissions, deforestation, antibiotic usage and working conditions. The primary purpose of the index is to enable and support investor decision-making on the protein sector. The index is also a benchmark to help animal protein companies assess themselves against their peers in the sector and improve their risk management and reporting.
Mowi achieves top score for progress on climate changeMowi has been recognized for leadership in corporate sustainability by global environmental non-profit organization CDP, securing a place on its prestigious ‘A List’ for tackling climate change. CDP’s annual ‘A List’ recognized Mowi for the company's actions to cut emissions, mitigate climate risks and develop the low-carbon economy.
The CDP ranking covers more than 5 800 companies, allocating scores based on the comprehensiveness of disclosure, awareness and management of environmental risks and demonstration of best practices associated with environmental leadership, such as setting ambitious and meaningful targets. Only 393 companies are part of the ‘A List’.
EU taxonomy on sustainable financeMowi believes that the salmon farming industry is on the right side of sustainability. Salmon is considered the most sustainable protein within the food category, and Mowi has received numerous recognitions in the past years as the most sustainable salmon farming company.
Sectors and economic activities covered to date in the forthcoming EU Taxonomy Regulations have been chosen based on their current environmental footprint to ensure that those that have the greatest potential to make a substantial contribution to climate change mitigation and adaptation are prioritised. As a result, the sectors and activities currently covered are assumed to be responsible for 93.5% of direct greenhouse gas (GHG) emissions within the EU. As such, aquaculture has not yet been included in the Taxonomy. The Commission has not yet performed the technical work on other economic activities.
In December, Mowi responded to the draft delegated act and annexes for climate change and climate adaptation under the forthcoming EU Taxonomy Regulation. Mowi welcomes the role of the Taxonomy in providing a common language that investors can use when investing in projects that have a substantial impact on the climate and the environment.
Mowi raised two concerns in this context; 1) Aquaculture should be included as an activity in the taxonomy because of its inherent greenness and substantial contribution to the climate goals, and 2) The Commission should communicate that sustainable activities, and in turn companies representing such activities, that are not yet included in the taxonomy are nonetheless classified as sustainable and green investments.
Q4|2020
© Mowi 18
Divestment of shares in DESS Aquaculture ShippingIn January 2021, Mowi successfully completed the divestment of its shares in the joint venture DESS Aquaculture Shipping. The shares have been sold to an entity controlled by Antin Infrastructure Partners. Mowi has invested EUR 60 million in DESS Aquaculture Shipping to date and our share of proceeds is EUR 115 million. Mowi will recognize a gain of approximately EUR 54 million (non-operational) in the first quarter of 2021.
Capital Markets Day 2021Mowi will arrange a Capital Markets Day on 17 March 2021. Because of the current Covid-19 situation the Capital Markets Day will be digital, please refer to our web site www.mowi.com for details. Presentations will be held by group management and will include an update on Mowi's strategy.
Best annual report for listed companiesFor the second year in a row, Mowi was awarded gold in the Farmand Award, the annual event to name the best annual report in Norway. This was our third gold in four years and the seventh successive year that Mowi was on the podium.
Dividend policy from Q4 2020Mowi’s ambition is to create long-term value for the shareholder through both positive share price development and a growing dividend in line with long-term earnings. Dividend has been an important component of Mowi's financial strategy and to make dividend payments more predictable and transparent the Board has decided to operationalise the dividend policy by introducing ordinary and extraordinary dividends. Quarterly ordinary dividends shall under normal circumstances be at least 50% of underlying earnings per share (EPS). Excess capital will be paid out as extraordinary dividends. When deciding excess capital the Board will take into consideration expected cash flow, capital expenditure plans, financing requirements and appropriate financial flexibility. Further to this a long-term target level for net interest-bearing debt is determined, reviewed and updated on a regular basis.
Shareholder returns are distributed primarily as cash dividends with the option of using share buy-back as a complementary supplement on an ad hoc basis.
In accordance with the adjusted dividend policy, the Board of Directors has decided to pay out a dividend of NOK 0.32 per share, equivalent to 50% of underlying EPS, to the shareholders as ordinary dividend for the fourth quarter.
Q4|2020
© Mowi 19
Outlook statement from the Board of Directors
Results in the fourth quarter were significantly impacted by the second wave of Covid-19 and extensive lockdown measures, together with seasonal high supply. The pandemic still impacts out-of-home consumption to a large degree, and although retail sales are strong and offset some of the demand shortfall, overall demand was down by approximately 5% compared with the same period last year. As a result, spot prices in the market currencies EUR and USD declined in all markets during the quarter and reduced Farming profits accordingly. Farming recorded all-time high harvest volumes for the quarter and for the full year. Consumer Products continued to benefit from the shift in demand towards elaborated products, and delivered all-time high quarterly and full-year volumes. Feed also delivered another good set of results, and similarly to Consumer Products delivered record quarterly and full-year volumes.
The Board commends the organisation for delivering on its many cost initiatives in 2020 and for the achievement of EUR 35 million in annualised savings. A number of successful cost reduction measures have been introduced in recent years, resulting in EUR 137 million of savings for Mowi since 2018. Addressing cost remains a key priority, and the Board is pleased that the organisation has initiated another global cost savings program for 2021, with a target of EUR 25 million of savings per annum.
Adjusted for inflation, blended cost per kg has been stable for Mowi Farming during the past five years. Although the Board takes some comfort in relatively stable cost development and the fact that Mowi’s Farming costs relative to peers over time have been the best or second best in all of the geographical regions where the company operates, the absolute cost level is still too high and gives cause for concern. It is crucial that Mowi reduces its cost level and that new inshore farming technologies are further developed and implemented in order to drive down cost, while at the same time enabling more volume growth in an environmentally friendly manner.
Mowi harvested a record high 127,000 GWT in the quarter, equivalent to 9% growth compared with one year ago. Our harvest volume for 2020 reached 440,000 GWT, and is somewhat higher than the 2019 harvest volume of 436,000 GWT which was record high at that time. Volumes in Norway, our largest farming region, reached a record high of 262,000 GWT in 2020 and the Board is pleased that our license utilisation in Norway has improved again in 2020. However, further improvements are still possible, particularly in Region South and Region Mid.
Biomass in sea of 326,000 LW tonnes, equivalent to 11% increase year-on-year, is record high and supportive of increased harvest volumes in the periods to come. Harvest volume guidance of 445,000 GWT for 2021 is maintained and represents relatively stable volumes in Norway, and higher volumes in Scotland and Chile. Environmental challenges in Canada have, however, resulted in less biomass in sea and a temporary set-back to our operations and growth trajectory.
Further to the announcement from the Government of Canada in December 2020 to phase out farming licenses in Discovery Islands, British Columbia, the Board has approved a revised plan for Mowi’s operations in Canada West. Although 2021 harvest volumes will not be impacted, annual volumes from 2022 onwards will be reduced by approximately 10,000-12,000 GWT.
Farming operations in Canada East have experienced biological challenges since the acquisition by Mowi in 2018 including mass mortality, algal blooms and ISA. As a consequence, Mowi has been lagging behind its initial growth plans for this area. The Board of Directors has approved a plan for Canada East to return to profitability and establish Mowi Canada East as an appropriately scaled, lean business unit equipped to deal with the challenges of the region and positioned for solid financial performance and growth. The plan includes rationalisation of processing and infrastructure resources and an in-depth review of all levels of the organisation. Mowi has developed a detailed plan to improve biosecurity in Canada East including sea lice management and ISAv mitigation measures. The volume growth potential in East Canada remains significant and more details will be shared at the Capital Markets Day on 17 March 2021.
Feed had another good operational quarter with seasonal all-time high production volumes. Operations of the Norwegian plant was solid on good seasonal demand. In 2020 the Norwegian plant delivered approx. 390,000 tonnes, close to full capacity of 400,000 tonnes, with good margins. The Scottish feed plant continued with its ramp-up phase, and volumes are expected to grow in the years to come from approx. 150,000 tonnes in 2020 towards full capacity of 240,000 tonnes. Mowi is now self-sufficient with its feed requirements in Europe and will continue to sell some feed externally in the years to come.
Although Covid-19 continued to impact market dynamics in the quarter, a higher retail share due to seasonality and the fact that the market has adapted to the pandemic made the implications of Covid-19 less severe in the fourth quarter than in the prior six months. The strength of Mowi’s integrated value chain during these unprecedented times was demonstrated yet again as our Consumer Products division continued to capitalise on the shift in consumer demand from foodservice to retail. The company produced more value-added products than ever through our downstream facilities, and the development in the US retail market continues to be particularly strong.
The consumption pattern of salmon has changed during the pandemic. More people eat salmon meals at home, which has resulted in retail sales increasing by approximately 20%. About half of the increase stems from increased penetration, i.e. new customers who have not previously purchased salmon through retail. The other half comes from existing customers through increased purchasing frequency. Both customer groups are expected to permanently increase their retail consumption rates post Covid-19, even as the foodservice segment gradually re-opens in due course.
The Board is very pleased that Mowi was once again ranked the most sustainable animal protein producer in the world in the 2020 Coller FAIRR Protein Producer Index. The FAIRR Initiative has developed an index to analyse the largest global
Q4|2020
© Mowi 20
aquaculture, dairy and meat producers by combining nine environmental, social and governance (ESG) risk factors with the Sustainable Development Goals (SDGs). The Board is also pleased that Mowi achieved top score for its progress on climate change. Sustainability will be even more important going forward for both Mowi and the salmon farming industry, and the Board strongly believes that as Mowi and the industry produce healthy and delicious food in the most sustainable manner, we are part of the solution and should be classified as green in EU’s Taxonomy framework.
In 2021 Mowi will continue to invest across its value chain to support further organic growth and strengthen the asset base. The capital expenditure budget for 2021 is approximately EUR 265 million. Freshwater investments continue in Norway, Canada East and Chile. Selected sea water expansions in Norway, Scotland, Ireland, Faroes, Canada and Chile will also be undertaken. Furthermore, Consumer Products expects to undertake several automation projects in Europe, US and in Asia, in addition to completing a new value-added processing facility in France.
Working capital tie-up was lower than guided in the fourth quarter mainly due to less than expected tie-up in Sales & Marketing as a result of Covid-19. The Board believes that the salmon market will gradually recover in 2021, hence more than normal working capital tie-up within the downstream operations should be expected. In addition, Mowi has potential to grow its farming volumes further based on the existing license footprint. As such, working capital investments of EUR 110 million in 2021 should be expected.
Dividend has been an important component of Mowi's financial strategy and to make dividend payments more predictable and transparent the Board has decided to operationalise the dividend policy by introducing ordinary and extraordinary dividends. Mowi’s ambition is to create long-term value for the shareholder through both positive share price development and a growing dividend in line with long-term earnings. Quarterly ordinary dividends shall under normal circumstances be at least 50% of underlying earnings per share (“EPS”). Excess capital will be paid out as extraordinary dividends. When deciding excess capital the Board will take into consideration expected cash flow, capital expenditure plans, financing requirements and appropriate financial flexibility. Further to this a long-term target level for net interest-bearing debt is determined, reviewed and updated on a regular basis.
Shareholder returns are distributed primarily as cash dividends with the option of using share buy-back as a complementary supplement on an ad hoc basis.
On this basis, the Board has decided to pay NOK 0.32 per share in ordinary dividend in the first quarter of 2021, equivalent to 50% of underlying EPS in the fourth quarter of 2020.
According to Kontali Analyse global supply growth in 2021 is forecast to be 2% which would under normal circumstances be very supportive of strong salmon prices. Whilst Covid-19 has significantly impacted the salmon market and prices in the short-term, the Board still strongly believes in the positive long-term outlook for the industry, and for Mowi in particular.
Q4|2020
© Mowi 21
Summary year to date • Operational EBIT of EUR 337.7 million. Financial EBIT of
EUR 183.5 million. • Operations have been running close to normal despite
Covid-19.• Farming spot prices subject to significant downward
pressure mainly due to Covid-19 lockdown measures.• Although improved through the course of the year,
blended Farming costs per kg increased somewhat from 2019 on higher feed prices and a lower performing generation harvested in the first half of the year.
• All-time high harvest volume of 439 829 GWT slightly below guidance of 442 000 GWT.
• Year-end biomass in sea of 326 000 LWT which is record high.
• Second best year ever for Consumer Products with Operational EBIT of EUR 81.8 million (EUR 45.4 million) on shift in demand towards elaborated products due to Covid-19. All-time high volumes sold of 239 427 tonnes (206 059 tonnes)
• Feed with record high earnings of EUR 31.2 million (EUR 22.4 million) on good demand in Norway and the
first year with operations in the new feed factory in Scotland. All-time high produced volumes of 540 326 tonnes (405 193 tonnes) and sold volumes of 528 301 tonnes (403 541 tonnes).
• Mowi ranked the most sustainable protein producer in the world (Coller FAIRR) for the second year in a row.
• MOWI brand launched in US e-commerce and the retail segment in France.
• Completed 2020 cost savings program with annual savings of EUR 35 million. Initiated new global EUR 25 million cost savings program.
• 5-year EUR 200 million green bond issuance in January 2020 with coupon of EURIBOR + 160 bps.
• Divestment of Mowi’s 50% stake in DESS Aquaculture Shipping in January 2021 with a gain of EUR 54 million.
• Dividend of NOK 2.60 per share has been paid out in 2020. Due to Covid-19, no quarterly dividend was distributed for the three first quarters of 2020.
• Return on capital employed (ROCE) of 8.3%.• Net cash flow per share of EUR 0.01. • Underlying earnings per share of EUR 0.43 and EPS of
EUR 0.23.
RISKSMowi has not identified any additional risk exposure beyond the risks described in note 3 of this report and the 2019 Annual Report.
Reference is also made to the Planet section and the Outlook section of this report for other comments to Mowi's risk exposure.
Bergen, February 16, 2021
The Board of Directors of Mowi ASA
Ole-Eirik Lerøy Alf-Helge Aarskog Cecilie Fredriksen Lisbet K. Nærø
CHAIR OF THE BOARD DEPUTY CHAIR OF THE BOARD
Kristian Melhuus Bjarne P. Tellmann Solveig Strand Anders Sæther
Kari Bjørgan Hans Jakob Lande Ivan Vindheim
CHIEF EXECUTIVE OFFICER
Q4|2020
© Mowi 22
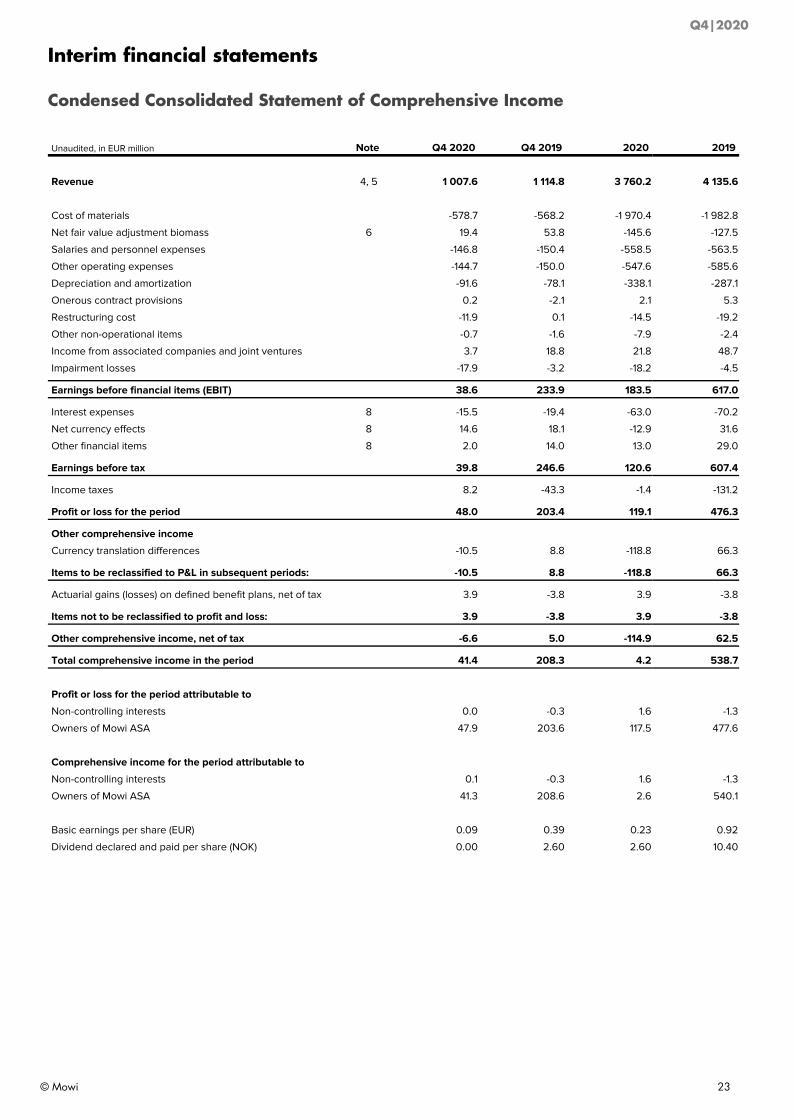
Interim financial statements
Condensed Consolidated Statement of Comprehensive Income
Unaudited, in EUR million Note Q4 2020 Q4 2019 2020 2019
Revenue 4, 5 1 007.6 1 114.8 3 760.2 4 135.6
Cost of materials -578.7 -568.2 -1 970.4 -1 982.8
Net fair value adjustment biomass 6 19.4 53.8 -145.6 -127.5
Salaries and personnel expenses -146.8 -150.4 -558.5 -563.5
Other operating expenses -144.7 -150.0 -547.6 -585.6
Depreciation and amortization -91.6 -78.1 -338.1 -287.1
Onerous contract provisions 0.2 -2.1 2.1 5.3
Restructuring cost -11.9 0.1 -14.5 -19.2
Other non-operational items -0.7 -1.6 -7.9 -2.4
Income from associated companies and joint ventures 3.7 18.8 21.8 48.7
Impairment losses -17.9 -3.2 -18.2 -4.5
Earnings before financial items (EBIT) 38.6 233.9 183.5 617.0
Interest expenses 8 -15.5 -19.4 -63.0 -70.2
Net currency effects 8 14.6 18.1 -12.9 31.6
Other financial items 8 2.0 14.0 13.0 29.0
Earnings before tax 39.8 246.6 120.6 607.4
Income taxes 8.2 -43.3 -1.4 -131.2
Profit or loss for the period 48.0 203.4 119.1 476.3
Other comprehensive income
Currency translation differences -10.5 8.8 -118.8 66.3
Items to be reclassified to P&L in subsequent periods: -10.5 8.8 -118.8 66.3
Actuarial gains (losses) on defined benefit plans, net of tax 3.9 -3.8 3.9 -3.8
Items not to be reclassified to profit and loss: 3.9 -3.8 3.9 -3.8
Other comprehensive income, net of tax -6.6 5.0 -114.9 62.5
Total comprehensive income in the period 41.4 208.3 4.2 538.7
Profit or loss for the period attributable to
Non-controlling interests 0.0 -0.3 1.6 -1.3
Owners of Mowi ASA 47.9 203.6 117.5 477.6
Comprehensive income for the period attributable to
Non-controlling interests 0.1 -0.3 1.6 -1.3
Owners of Mowi ASA 41.3 208.6 2.6 540.1
Basic earnings per share (EUR) 0.09 0.39 0.23 0.92
Dividend declared and paid per share (NOK) 0.00 2.60 2.60 10.40
Q4|2020
© Mowi 23
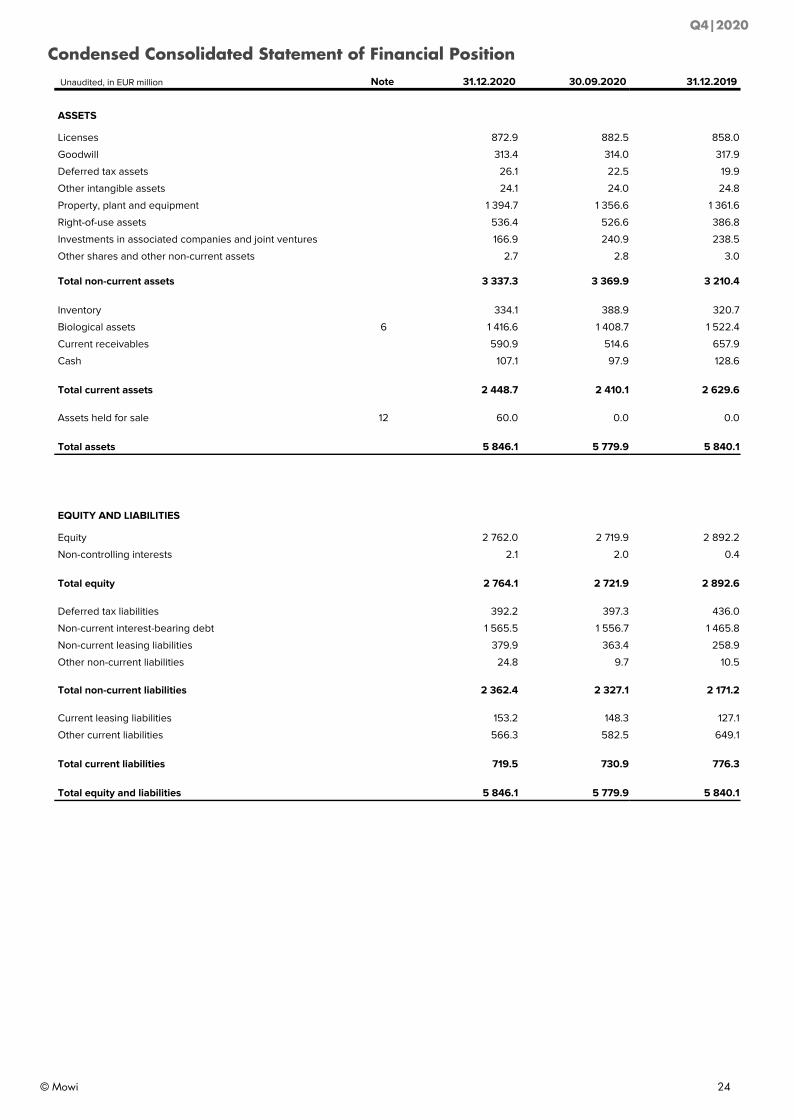
Condensed Consolidated Statement of Financial Position Unaudited, in EUR million Note 31.12.2020 30.09.2020 31.12.2019
ASSETS
Licenses 872.9 882.5 858.0
Goodwill 313.4 314.0 317.9
Deferred tax assets 26.1 22.5 19.9
Other intangible assets 24.1 24.0 24.8
Property, plant and equipment 1 394.7 1 356.6 1 361.6
Right-of-use assets 536.4 526.6 386.8
Investments in associated companies and joint ventures 166.9 240.9 238.5
Other shares and other non-current assets 2.7 2.8 3.0
Total non-current assets 3 337.3 3 369.9 3 210.4
Inventory 334.1 388.9 320.7
Biological assets 6 1 416.6 1 408.7 1 522.4
Current receivables 590.9 514.6 657.9
Cash 107.1 97.9 128.6
Total current assets 2 448.7 2 410.1 2 629.6
Assets held for sale 12 60.0 0.0 0.0
Total assets 5 846.1 5 779.9 5 840.1
EQUITY AND LIABILITIES
Equity 2 762.0 2 719.9 2 892.2
Non-controlling interests 2.1 2.0 0.4
Total equity 2 764.1 2 721.9 2 892.6
Deferred tax liabilities 392.2 397.3 436.0
Non-current interest-bearing debt 1 565.5 1 556.7 1 465.8
Non-current leasing liabilities 379.9 363.4 258.9
Other non-current liabilities 24.8 9.7 10.5
Total non-current liabilities 2 362.4 2 327.1 2 171.2
Current leasing liabilities 153.2 148.3 127.1
Other current liabilities 566.3 582.5 649.1
Total current liabilities 719.5 730.9 776.3
Total equity and liabilities 5 846.1 5 779.9 5 840.1
Q4|2020
© Mowi 24
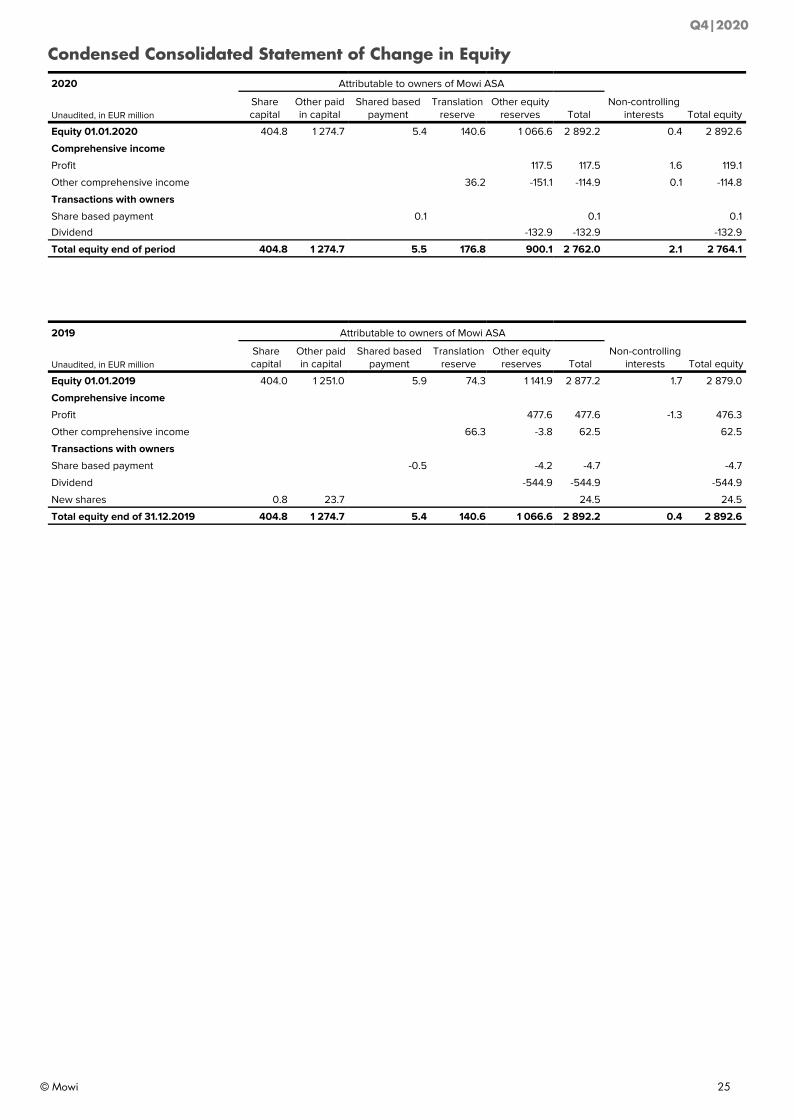
Condensed Consolidated Statement of Change in Equity
2020 Attributable to owners of Mowi ASA
Non-controlling interests Total equityUnaudited, in EUR million
Share capital
Other paid in capital
Shared based payment
Translation reserve
Other equity reserves Total
Equity 01.01.2020 404.8 1 274.7 5.4 140.6 1 066.6 2 892.2 0.4 2 892.6
Comprehensive income
Profit 117.5 117.5 1.6 119.1
Other comprehensive income 36.2 -151.1 -114.9 0.1 -114.8
Transactions with owners
Share based payment 0.1 0.1 0.1
Dividend -132.9 -132.9 -132.9
Total equity end of period 404.8 1 274.7 5.5 176.8 900.1 2 762.0 2.1 2 764.1
2019 Attributable to owners of Mowi ASA
Non-controlling interests Total equityUnaudited, in EUR million
Share capital
Other paid in capital
Shared based payment
Translation reserve
Other equity reserves Total
Equity 01.01.2019 404.0 1 251.0 5.9 74.3 1 141.9 2 877.2 1.7 2 879.0
Comprehensive income
Profit 477.6 477.6 -1.3 476.3
Other comprehensive income 66.3 -3.8 62.5 62.5
Transactions with owners
Share based payment -0.5 -4.2 -4.7 -4.7
Dividend -544.9 -544.9 -544.9
New shares 0.8 23.7 24.5 24.5
Total equity end of 31.12.2019 404.8 1 274.7 5.4 140.6 1 066.6 2 892.2 0.4 2 892.6
Q4|2020
© Mowi 25
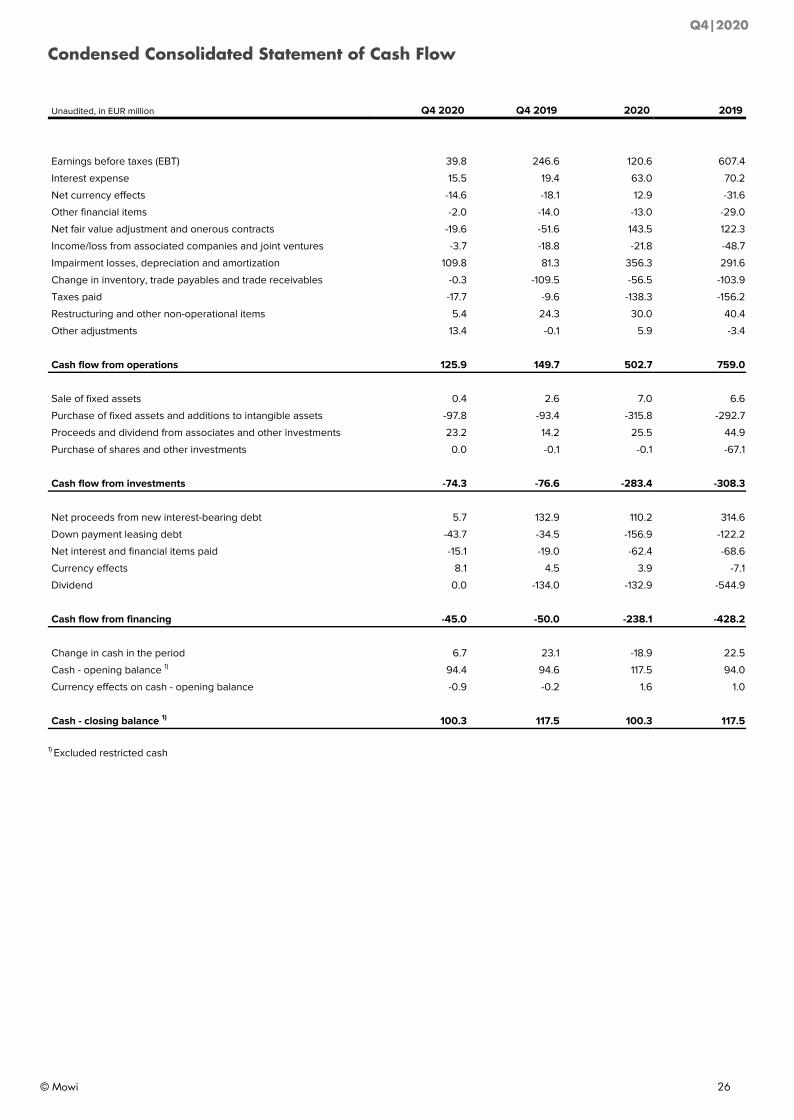
Condensed Consolidated Statement of Cash Flow
Unaudited, in EUR million Q4 2020 Q4 2019 2020 2019
Earnings before taxes (EBT) 39.8 246.6 120.6 607.4
Interest expense 15.5 19.4 63.0 70.2
Net currency effects -14.6 -18.1 12.9 -31.6
Other financial items -2.0 -14.0 -13.0 -29.0
Net fair value adjustment and onerous contracts -19.6 -51.6 143.5 122.3
Income/loss from associated companies and joint ventures -3.7 -18.8 -21.8 -48.7
Impairment losses, depreciation and amortization 109.8 81.3 356.3 291.6
Change in inventory, trade payables and trade receivables -0.3 -109.5 -56.5 -103.9
Taxes paid -17.7 -9.6 -138.3 -156.2
Restructuring and other non-operational items 5.4 24.3 30.0 40.4
Other adjustments 13.4 -0.1 5.9 -3.4
Cash flow from operations 125.9 149.7 502.7 759.0
Sale of fixed assets 0.4 2.6 7.0 6.6
Purchase of fixed assets and additions to intangible assets -97.8 -93.4 -315.8 -292.7
Proceeds and dividend from associates and other investments 23.2 14.2 25.5 44.9
Purchase of shares and other investments 0.0 -0.1 -0.1 -67.1
Cash flow from investments -74.3 -76.6 -283.4 -308.3
Net proceeds from new interest-bearing debt 5.7 132.9 110.2 314.6
Down payment leasing debt -43.7 -34.5 -156.9 -122.2
Net interest and financial items paid -15.1 -19.0 -62.4 -68.6
Currency effects 8.1 4.5 3.9 -7.1
Dividend 0.0 -134.0 -132.9 -544.9
Cash flow from financing -45.0 -50.0 -238.1 -428.2
Change in cash in the period 6.7 23.1 -18.9 22.5
Cash - opening balance 1) 94.4 94.6 117.5 94.0
Currency effects on cash - opening balance -0.9 -0.2 1.6 1.0
Cash - closing balance 1) 100.3 117.5 100.3 117.5
1) Excluded restricted cash
Q4|2020
© Mowi 26
SELECTED NOTES TO THE INTERIM FINANCIAL STATEMENTSNote 1 GENERAL INFORMATION
Mowi (the Group) consists of Mowi ASA and its subsidiaries, including the Group’s interests in associated companies.
These interim financial statements are prepared in accordance with International Accounting Standard 34 Interim Financial Reporting as issued by the International Accounting Standards Board (IASB) and as adopted by the European Union (EU). The interim financial statements do not include all of the information and disclosures required by International Financial Reporting Standards (IFRSs) for a complete set of financial statements, and these interim financial statements should be read in conjunction with the annual financial statements. The interim report is unaudited.
Note 2 ACCOUNTING PRINCIPLES
All significant accounting principles applied in the consolidated financial statements are described in the Annual Report for 2019 (as published on the Oslo Stock Exchange on March 25, 2020). No new standards have been applied in 2020.
Significant fair value measurements in accordance with IFRS 13:
Biological assetsBiological assets are, in accordance with IAS 41, measured at fair value, unless the fair value cannot be measured reliably. Broodstock and smolt are measured at cost less impairment losses, as the fair value cannot be measured reliably. Fair value of biological assets is calculated based on a cash flow-based present value model, which does not rely on historical cost. Cash inflows are calculated as functions of estimated volume multiplied with estimated price. Fish ready for harvest (mature fish) is valued at expected sales price with a deduction of cost related to harvest, transport etc. Sales costs are not deducted. For fish not ready for harvest (immature fish), the model uses an interpolation methodology where the known data points are the value of the fish when put to sea and when recognized as mature fish.
In accordance with IAS 41.16, a provision for onerous contracts is recorded by assessing if there are contracts in which the unavoidable costs of meeting the Group's obligations under the contract (where fair value adjustment of biological assets is included in the unavoidable costs) exceed the economic benefits expected to be received.
Note 3 ESTIMATES AND RISK EXPOSURE
The preparation of financial statements in accordance with IFRS requires management to make judgments, estimates and assumptions that affect the application of accounting principles and recognized amounts of assets, liabilities, income and expenses. The most significant estimates relate to the valuation of biological assets and intangible assets. Estimates and underlying assumptions are reviewed on an ongoing basis, and are based on the management’s best assessment at the time of reporting. All changes in estimates are reflected in the financial statements as they occur.
Mowi is exposed to a number of risk factors: Operational risks, strategic risk, reporting risk and compliance risk. The Risk Management section in the Annual Report contains a detailed description of risks and mitigation actions.
Q4|2020
© Mowi 27
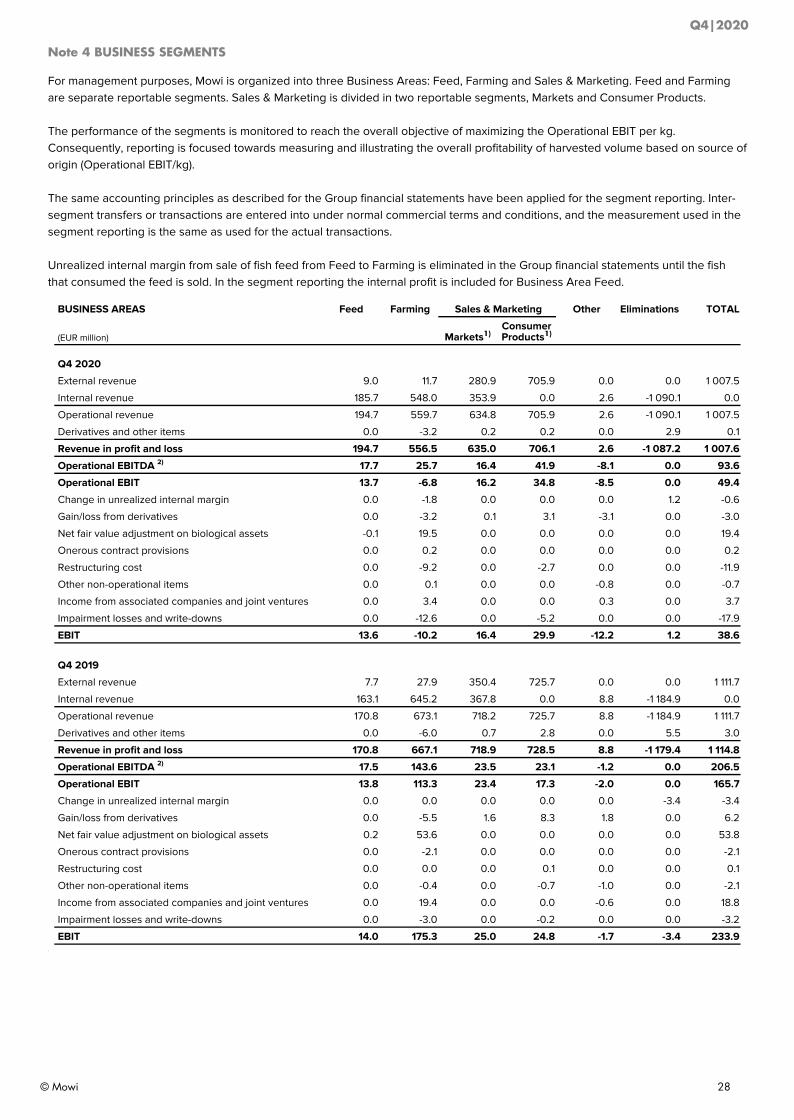
Note 4 BUSINESS SEGMENTS
For management purposes, Mowi is organized into three Business Areas: Feed, Farming and Sales & Marketing. Feed and Farming are separate reportable segments. Sales & Marketing is divided in two reportable segments, Markets and Consumer Products.
The performance of the segments is monitored to reach the overall objective of maximizing the Operational EBIT per kg. Consequently, reporting is focused towards measuring and illustrating the overall profitability of harvested volume based on source of origin (Operational EBIT/kg).
The same accounting principles as described for the Group financial statements have been applied for the segment reporting. Inter-segment transfers or transactions are entered into under normal commercial terms and conditions, and the measurement used in the segment reporting is the same as used for the actual transactions.
Unrealized internal margin from sale of fish feed from Feed to Farming is eliminated in the Group financial statements until the fish that consumed the feed is sold. In the segment reporting the internal profit is included for Business Area Feed.
BUSINESS AREAS Feed Farming Sales & Marketing Other Eliminations TOTAL
(EUR million) Markets1)Consumer Products1)
Q4 2020
External revenue 9.0 11.7 280.9 705.9 0.0 0.0 1 007.5
Internal revenue 185.7 548.0 353.9 0.0 2.6 -1 090.1 0.0
Operational revenue 194.7 559.7 634.8 705.9 2.6 -1 090.1 1 007.5
Derivatives and other items 0.0 -3.2 0.2 0.2 0.0 2.9 0.1
Revenue in profit and loss 194.7 556.5 635.0 706.1 2.6 -1 087.2 1 007.6
Operational EBITDA 2) 17.7 25.7 16.4 41.9 -8.1 0.0 93.6
Operational EBIT 13.7 -6.8 16.2 34.8 -8.5 0.0 49.4
Change in unrealized internal margin 0.0 -1.8 0.0 0.0 0.0 1.2 -0.6
Gain/loss from derivatives 0.0 -3.2 0.1 3.1 -3.1 0.0 -3.0
Net fair value adjustment on biological assets -0.1 19.5 0.0 0.0 0.0 0.0 19.4
Onerous contract provisions 0.0 0.2 0.0 0.0 0.0 0.0 0.2
Restructuring cost 0.0 -9.2 0.0 -2.7 0.0 0.0 -11.9
Other non-operational items 0.0 0.1 0.0 0.0 -0.8 0.0 -0.7
Income from associated companies and joint ventures 0.0 3.4 0.0 0.0 0.3 0.0 3.7
Impairment losses and write-downs 0.0 -12.6 0.0 -5.2 0.0 0.0 -17.9
EBIT 13.6 -10.2 16.4 29.9 -12.2 1.2 38.6
Q4 2019
External revenue 7.7 27.9 350.4 725.7 0.0 0.0 1 111.7
Internal revenue 163.1 645.2 367.8 0.0 8.8 -1 184.9 0.0
Operational revenue 170.8 673.1 718.2 725.7 8.8 -1 184.9 1 111.7
Derivatives and other items 0.0 -6.0 0.7 2.8 0.0 5.5 3.0
Revenue in profit and loss 170.8 667.1 718.9 728.5 8.8 -1 179.4 1 114.8
Operational EBITDA 2) 17.5 143.6 23.5 23.1 -1.2 0.0 206.5
Operational EBIT 13.8 113.3 23.4 17.3 -2.0 0.0 165.7
Change in unrealized internal margin 0.0 0.0 0.0 0.0 0.0 -3.4 -3.4
Gain/loss from derivatives 0.0 -5.5 1.6 8.3 1.8 0.0 6.2
Net fair value adjustment on biological assets 0.2 53.6 0.0 0.0 0.0 0.0 53.8
Onerous contract provisions 0.0 -2.1 0.0 0.0 0.0 0.0 -2.1
Restructuring cost 0.0 0.0 0.0 0.1 0.0 0.0 0.1
Other non-operational items 0.0 -0.4 0.0 -0.7 -1.0 0.0 -2.1
Income from associated companies and joint ventures 0.0 19.4 0.0 0.0 -0.6 0.0 18.8
Impairment losses and write-downs 0.0 -3.0 0.0 -0.2 0.0 0.0 -3.2
EBIT 14.0 175.3 25.0 24.8 -1.7 -3.4 233.9 +6
Q4|2020
© Mowi 28
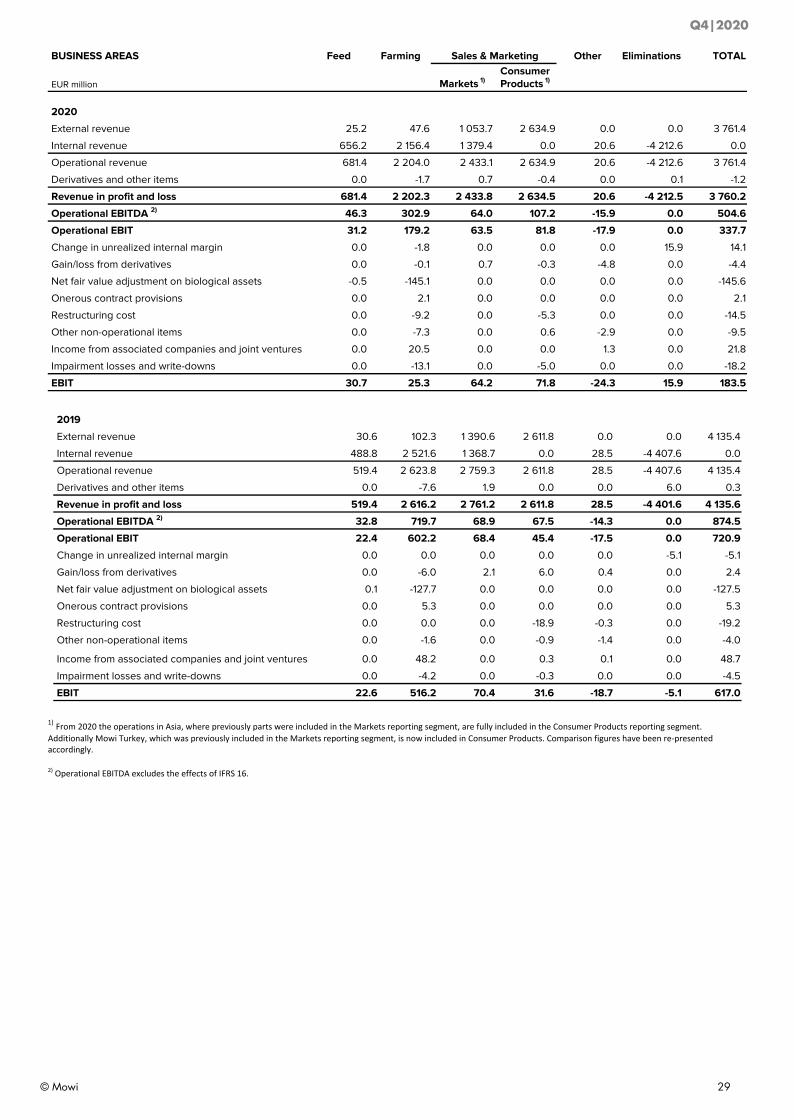
BUSINESS AREAS Feed Farming Sales & Marketing Other Eliminations TOTAL
EUR million Markets 1)Consumer Products 1)
2020
External revenue 25.2 47.6 1 053.7 2 634.9 0.0 0.0 3 761.4
Internal revenue 656.2 2 156.4 1 379.4 0.0 20.6 -4 212.6 0.0
Operational revenue 681.4 2 204.0 2 433.1 2 634.9 20.6 -4 212.6 3 761.4
Derivatives and other items 0.0 -1.7 0.7 -0.4 0.0 0.1 -1.2
Revenue in profit and loss 681.4 2 202.3 2 433.8 2 634.5 20.6 -4 212.5 3 760.2
Operational EBITDA 2) 46.3 302.9 64.0 107.2 -15.9 0.0 504.6
Operational EBIT 31.2 179.2 63.5 81.8 -17.9 0.0 337.7
Change in unrealized internal margin 0.0 -1.8 0.0 0.0 0.0 15.9 14.1
Gain/loss from derivatives 0.0 -0.1 0.7 -0.3 -4.8 0.0 -4.4
Net fair value adjustment on biological assets -0.5 -145.1 0.0 0.0 0.0 0.0 -145.6
Onerous contract provisions 0.0 2.1 0.0 0.0 0.0 0.0 2.1
Restructuring cost 0.0 -9.2 0.0 -5.3 0.0 0.0 -14.5
Other non-operational items 0.0 -7.3 0.0 0.6 -2.9 0.0 -9.5
Income from associated companies and joint ventures 0.0 20.5 0.0 0.0 1.3 0.0 21.8
Impairment losses and write-downs 0.0 -13.1 0.0 -5.0 0.0 0.0 -18.2
EBIT 30.7 25.3 64.2 71.8 -24.3 15.9 183.5
2019
External revenue 30.6 102.3 1 390.6 2 611.8 0.0 0.0 4 135.4
Internal revenue 488.8 2 521.6 1 368.7 0.0 28.5 -4 407.6 0.0
Operational revenue 519.4 2 623.8 2 759.3 2 611.8 28.5 -4 407.6 4 135.4
Derivatives and other items 0.0 -7.6 1.9 0.0 0.0 6.0 0.3
Revenue in profit and loss 519.4 2 616.2 2 761.2 2 611.8 28.5 -4 401.6 4 135.6
Operational EBITDA 2) 32.8 719.7 68.9 67.5 -14.3 0.0 874.5
Operational EBIT 22.4 602.2 68.4 45.4 -17.5 0.0 720.9
Change in unrealized internal margin 0.0 0.0 0.0 0.0 0.0 -5.1 -5.1
Gain/loss from derivatives 0.0 -6.0 2.1 6.0 0.4 0.0 2.4
Net fair value adjustment on biological assets 0.1 -127.7 0.0 0.0 0.0 0.0 -127.5
Onerous contract provisions 0.0 5.3 0.0 0.0 0.0 0.0 5.3
Restructuring cost 0.0 0.0 0.0 -18.9 -0.3 0.0 -19.2
Other non-operational items 0.0 -1.6 0.0 -0.9 -1.4 0.0 -4.0
Income from associated companies and joint ventures 0.0 48.2 0.0 0.3 0.1 0.0 48.7
Impairment losses and write-downs 0.0 -4.2 0.0 -0.3 0.0 0.0 -4.5
EBIT 22.6 516.2 70.4 31.6 -18.7 -5.1 617.0
1)From2020theoperationsinAsia,wherepreviouslypartswereincludedintheMarketsreportingsegment,arefullyincludedintheConsumerProductsreportingsegment.AdditionallyMowiTurkey,whichwaspreviouslyincludedintheMarketsreportingsegment,isnowincludedinConsumerProducts.Comparisonfigureshavebeenre-presentedaccordingly.
2)OperationalEBITDAexcludestheeffectsofIFRS16.
Q4|2020
© Mowi 29
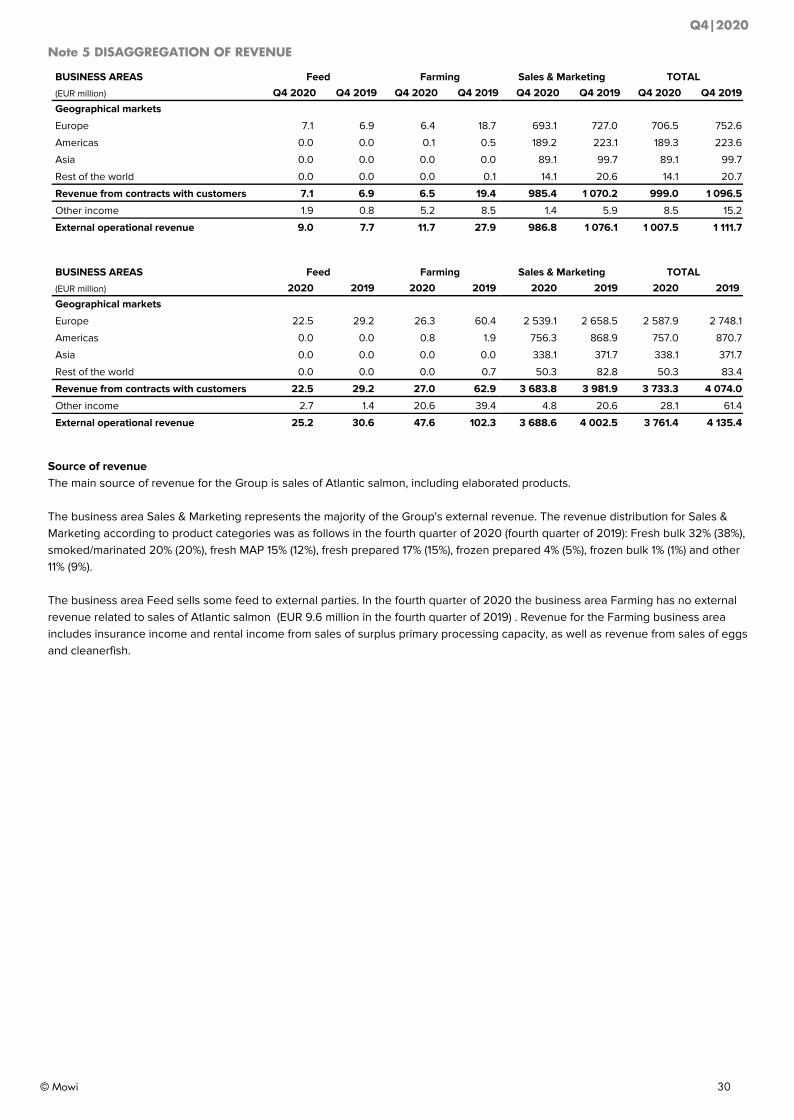
Note 5 DISAGGREGATION OF REVENUE
BUSINESS AREAS Feed Farming Sales & Marketing TOTAL
(EUR million) Q4 2020 Q4 2019 Q4 2020 Q4 2019 Q4 2020 Q4 2019 Q4 2020 Q4 2019
Geographical markets
Europe 7.1 6.9 6.4 18.7 693.1 727.0 706.5 752.6
Americas 0.0 0.0 0.1 0.5 189.2 223.1 189.3 223.6
Asia 0.0 0.0 0.0 0.0 89.1 99.7 89.1 99.7
Rest of the world 0.0 0.0 0.0 0.1 14.1 20.6 14.1 20.7
Revenue from contracts with customers 7.1 6.9 6.5 19.4 985.4 1 070.2 999.0 1 096.5
Other income 1.9 0.8 5.2 8.5 1.4 5.9 8.5 15.2
External operational revenue 9.0 7.7 11.7 27.9 986.8 1 076.1 1 007.5 1 111.7
BUSINESS AREAS Feed Farming Sales & Marketing TOTAL
(EUR million) 2020 2019 2020 2019 2020 2019 2020 2019
Geographical markets
Europe 22.5 29.2 26.3 60.4 2 539.1 2 658.5 2 587.9 2 748.1
Americas 0.0 0.0 0.8 1.9 756.3 868.9 757.0 870.7
Asia 0.0 0.0 0.0 0.0 338.1 371.7 338.1 371.7
Rest of the world 0.0 0.0 0.0 0.7 50.3 82.8 50.3 83.4
Revenue from contracts with customers 22.5 29.2 27.0 62.9 3 683.8 3 981.9 3 733.3 4 074.0
Other income 2.7 1.4 20.6 39.4 4.8 20.6 28.1 61.4
External operational revenue 25.2 30.6 47.6 102.3 3 688.6 4 002.5 3 761.4 4 135.4
Source of revenueThe main source of revenue for the Group is sales of Atlantic salmon, including elaborated products.
The business area Sales & Marketing represents the majority of the Group's external revenue. The revenue distribution for Sales & Marketing according to product categories was as follows in the fourth quarter of 2020 (fourth quarter of 2019): Fresh bulk 32% (38%), smoked/marinated 20% (20%), fresh MAP 15% (12%), fresh prepared 17% (15%), frozen prepared 4% (5%), frozen bulk 1% (1%) and other 11% (9%).
The business area Feed sells some feed to external parties. In the fourth quarter of 2020 the business area Farming has no external revenue related to sales of Atlantic salmon (EUR 9.6 million in the fourth quarter of 2019) . Revenue for the Farming business area includes insurance income and rental income from sales of surplus primary processing capacity, as well as revenue from sales of eggs and cleanerfish.
Q4|2020
© Mowi 30
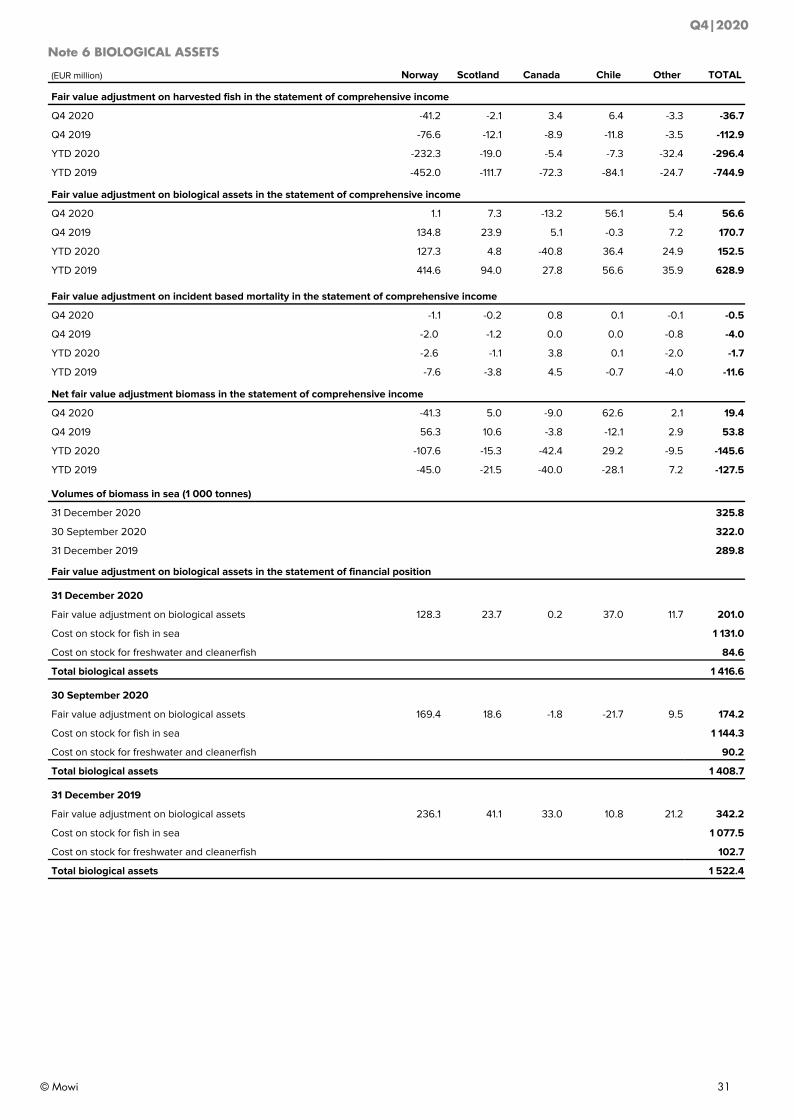
Note 6 BIOLOGICAL ASSETS
(EUR million) Norway Scotland Canada Chile Other TOTAL
Fair value adjustment on harvested fish in the statement of comprehensive income
Q4 2020 -41.2 -2.1 3.4 6.4 -3.3 -36.7
Q4 2019 -76.6 -12.1 -8.9 -11.8 -3.5 -112.9
YTD 2020 -232.3 -19.0 -5.4 -7.3 -32.4 -296.4
YTD 2019 -452.0 -111.7 -72.3 -84.1 -24.7 -744.9
Fair value adjustment on biological assets in the statement of comprehensive income
Q4 2020 1.1 7.3 -13.2 56.1 5.4 56.6
Q4 2019 134.8 23.9 5.1 -0.3 7.2 170.7
YTD 2020 127.3 4.8 -40.8 36.4 24.9 152.5
YTD 2019 414.6 94.0 27.8 56.6 35.9 628.9
Fair value adjustment on incident based mortality in the statement of comprehensive income
Q4 2020 -1.1 -0.2 0.8 0.1 -0.1 -0.5
Q4 2019 -2.0 -1.2 0.0 0.0 -0.8 -4.0
YTD 2020 -2.6 -1.1 3.8 0.1 -2.0 -1.7
YTD 2019 -7.6 -3.8 4.5 -0.7 -4.0 -11.6
Net fair value adjustment biomass in the statement of comprehensive income
Q4 2020 -41.3 5.0 -9.0 62.6 2.1 19.4
Q4 2019 56.3 10.6 -3.8 -12.1 2.9 53.8
YTD 2020 -107.6 -15.3 -42.4 29.2 -9.5 -145.6
YTD 2019 -45.0 -21.5 -40.0 -28.1 7.2 -127.5
Volumes of biomass in sea (1 000 tonnes)
31 December 2020 325.8
30 September 2020 322.0
31 December 2019 289.8
Fair value adjustment on biological assets in the statement of financial position
31 December 2020
Fair value adjustment on biological assets 128.3 23.7 0.2 37.0 11.7 201.0
Cost on stock for fish in sea 1 131.0
Cost on stock for freshwater and cleanerfish 84.6
Total biological assets 1 416.6
30 September 2020
Fair value adjustment on biological assets 169.4 18.6 -1.8 -21.7 9.5 174.2
Cost on stock for fish in sea 1 144.3
Cost on stock for freshwater and cleanerfish 90.2
Total biological assets 1 408.7
31 December 2019
Fair value adjustment on biological assets 236.1 41.1 33.0 10.8 21.2 342.2
Cost on stock for fish in sea 1 077.5
Cost on stock for freshwater and cleanerfish 102.7
Total biological assets 1 522.4
Q4|2020
© Mowi 31
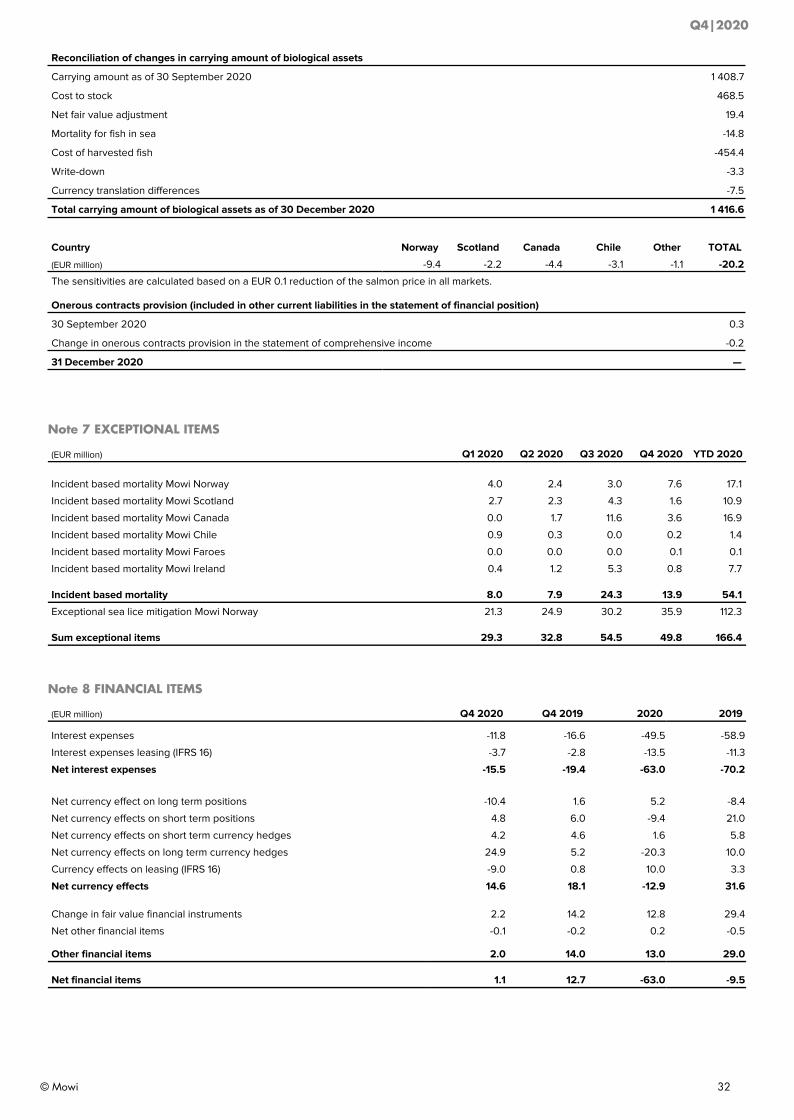
Reconciliation of changes in carrying amount of biological assets
Carrying amount as of 30 September 2020 1 408.7
Cost to stock 468.5
Net fair value adjustment 19.4
Mortality for fish in sea -14.8
Cost of harvested fish -454.4
Write-down -3.3
Currency translation differences -7.5
Total carrying amount of biological assets as of 30 December 2020 1 416.6
Country Norway Scotland Canada Chile Other TOTAL
(EUR million) -9.4 -2.2 -4.4 -3.1 -1.1 -20.2
The sensitivities are calculated based on a EUR 0.1 reduction of the salmon price in all markets.
Onerous contracts provision (included in other current liabilities in the statement of financial position)
30 September 2020 0.3
Change in onerous contracts provision in the statement of comprehensive income -0.2
31 December 2020 —
Note 7 EXCEPTIONAL ITEMS
(EUR million) Q1 2020 Q2 2020 Q3 2020 Q4 2020 YTD 2020
Incident based mortality Mowi Norway 4.0 2.4 3.0 7.6 17.1
Incident based mortality Mowi Scotland 2.7 2.3 4.3 1.6 10.9
Incident based mortality Mowi Canada 0.0 1.7 11.6 3.6 16.9
Incident based mortality Mowi Chile 0.9 0.3 0.0 0.2 1.4
Incident based mortality Mowi Faroes 0.0 0.0 0.0 0.1 0.1
Incident based mortality Mowi Ireland 0.4 1.2 5.3 0.8 7.7
Incident based mortality 8.0 7.9 24.3 13.9 54.1
Exceptional sea lice mitigation Mowi Norway 21.3 24.9 30.2 35.9 112.3
Sum exceptional items 29.3 32.8 54.5 49.8 166.4
Note 8 FINANCIAL ITEMS
(EUR million) Q4 2020 Q4 2019 2020 2019
Interest expenses -11.8 -16.6 -49.5 -58.9
Interest expenses leasing (IFRS 16) -3.7 -2.8 -13.5 -11.3
Net interest expenses -15.5 -19.4 -63.0 -70.2
Net currency effect on long term positions -10.4 1.6 5.2 -8.4
Net currency effects on short term positions 4.8 6.0 -9.4 21.0
Net currency effects on short term currency hedges 4.2 4.6 1.6 5.8
Net currency effects on long term currency hedges 24.9 5.2 -20.3 10.0
Currency effects on leasing (IFRS 16) -9.0 0.8 10.0 3.3
Net currency effects 14.6 18.1 -12.9 31.6
Change in fair value financial instruments 2.2 14.2 12.8 29.4
Net other financial items -0.1 -0.2 0.2 -0.5
Other financial items 2.0 14.0 13.0 29.0
Net financial items 1.1 12.7 -63.0 -9.5
Q4|2020
© Mowi 32
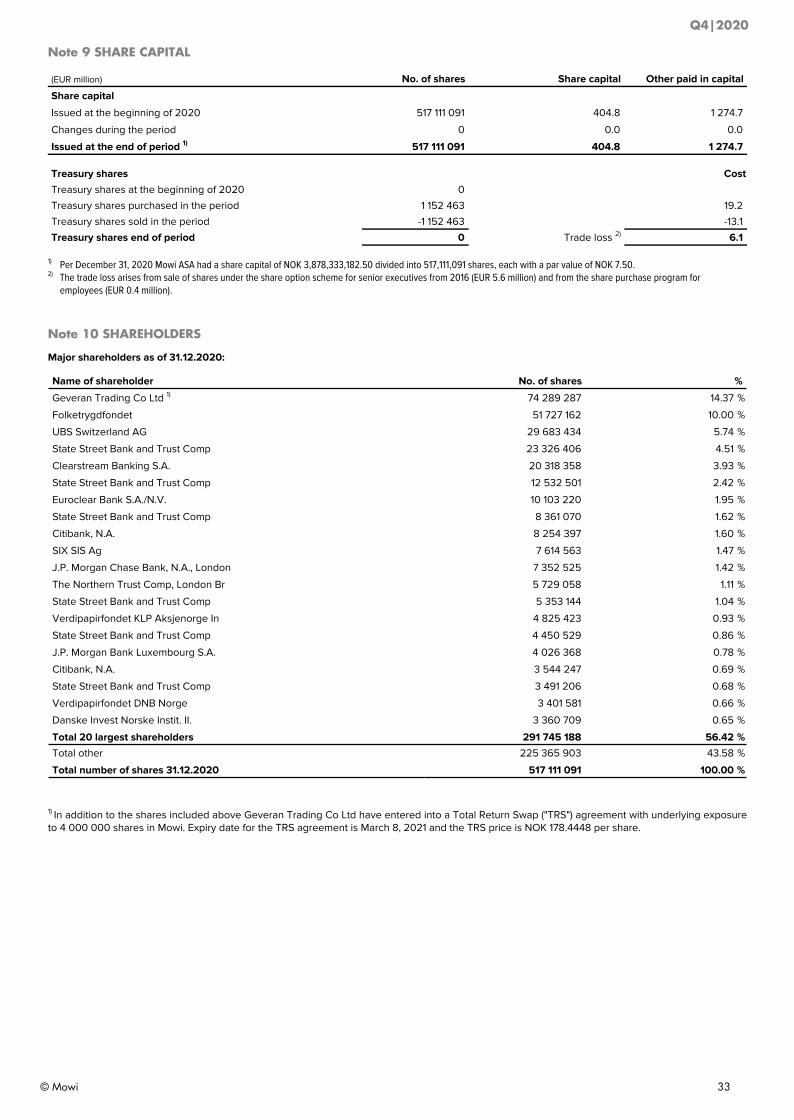
Note 9 SHARE CAPITAL
(EUR million) No. of shares Share capital Other paid in capital
Share capital
Issued at the beginning of 2020 517 111 091 404.8 1 274.7
Changes during the period 0 0.0 0.0
Issued at the end of period 1) 517 111 091 404.8 1 274.7
Treasury shares Cost
Treasury shares at the beginning of 2020 0
Treasury shares purchased in the period 1 152 463 19.2
Treasury shares sold in the period -1 152 463 -13.1
Treasury shares end of period 0 Trade loss 2) 6.1
1) Per December 31, 2020 Mowi ASA had a share capital of NOK 3,878,333,182.50 divided into 517,111,091 shares, each with a par value of NOK 7.50. 2) The trade loss arises from sale of shares under the share option scheme for senior executives from 2016 (EUR 5.6 million) and from the share purchase program for
employees (EUR 0.4 million).
Note 10 SHAREHOLDERS
Major shareholders as of 31.12.2020:
Name of shareholder No. of shares %
Geveran Trading Co Ltd 1) 74 289 287 14.37 %
Folketrygdfondet 51 727 162 10.00 %
UBS Switzerland AG 29 683 434 5.74 %
State Street Bank and Trust Comp 23 326 406 4.51 %
Clearstream Banking S.A. 20 318 358 3.93 %
State Street Bank and Trust Comp 12 532 501 2.42 %
Euroclear Bank S.A./N.V. 10 103 220 1.95 %
State Street Bank and Trust Comp 8 361 070 1.62 %
Citibank, N.A. 8 254 397 1.60 %
SIX SIS Ag 7 614 563 1.47 %
J.P. Morgan Chase Bank, N.A., London 7 352 525 1.42 %
The Northern Trust Comp, London Br 5 729 058 1.11 %
State Street Bank and Trust Comp 5 353 144 1.04 %
Verdipapirfondet KLP Aksjenorge In 4 825 423 0.93 %
State Street Bank and Trust Comp 4 450 529 0.86 %
J.P. Morgan Bank Luxembourg S.A. 4 026 368 0.78 %
Citibank, N.A. 3 544 247 0.69 %
State Street Bank and Trust Comp 3 491 206 0.68 %
Verdipapirfondet DNB Norge 3 401 581 0.66 %
Danske Invest Norske Instit. II. 3 360 709 0.65 %
Total 20 largest shareholders 291 745 188 56.42 %
Total other 225 365 903 43.58 %
Total number of shares 31.12.2020 517 111 091 100.00 %
1) In addition to the shares included above Geveran Trading Co Ltd have entered into a Total Return Swap ("TRS") agreement with underlying exposure to 4 000 000 shares in Mowi. Expiry date for the TRS agreement is March 8, 2021 and the TRS price is NOK 178.4448 per share.
Q4|2020
© Mowi 33
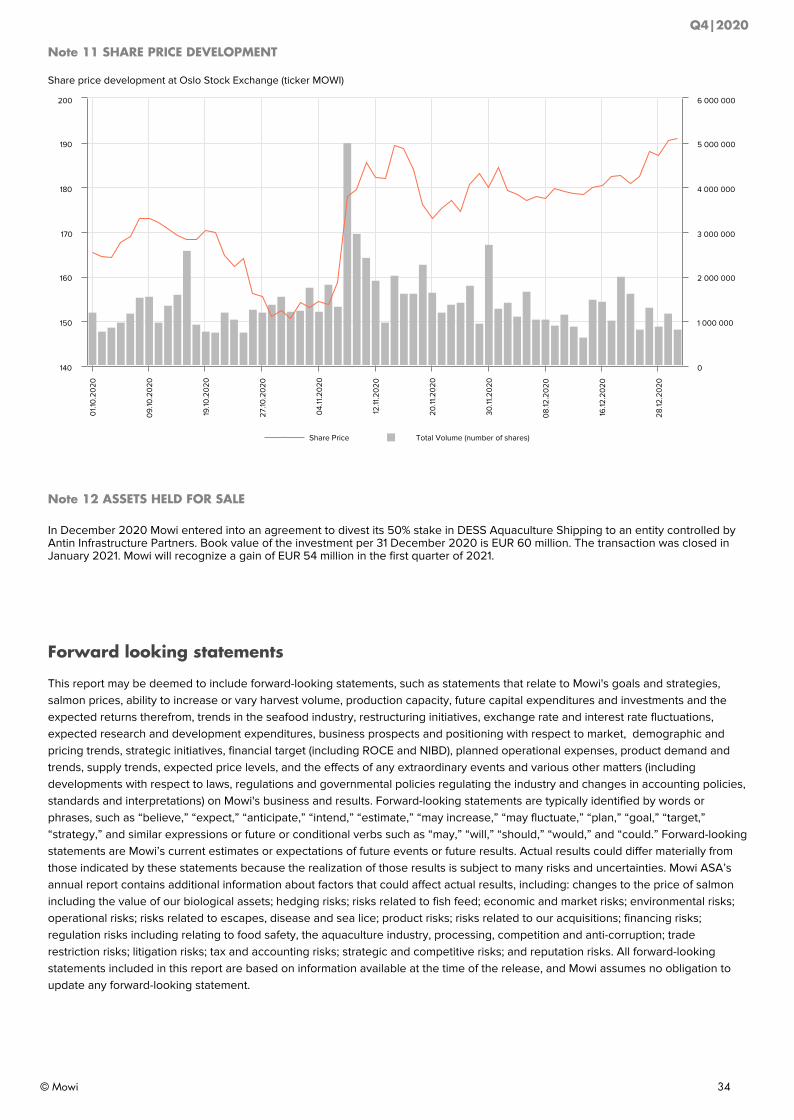
Note 11 SHARE PRICE DEVELOPMENT
Share price development at Oslo Stock Exchange (ticker MOWI)
Share Price Total Volume (number of shares)
01.1
0.2
020
09
.10.2
020
19.10
.20
20
27.10
.20
20
04.
11.2
020
12.11
.20
20
20.11
.20
20
30.11
.20
20
08.
12.2
020
16.12
.20
20
28.12
.20
20
140
150
160
170
180
190
200
0
1 000 000
2 000 000
3 000 000
4 000 000
5 000 000
6 000 000
Note 12 ASSETS HELD FOR SALE
In December 2020 Mowi entered into an agreement to divest its 50% stake in DESS Aquaculture Shipping to an entity controlled by Antin Infrastructure Partners. Book value of the investment per 31 December 2020 is EUR 60 million. The transaction was closed in January 2021. Mowi will recognize a gain of EUR 54 million in the first quarter of 2021.
Forward looking statements
This report may be deemed to include forward-looking statements, such as statements that relate to Mowi's goals and strategies, salmon prices, ability to increase or vary harvest volume, production capacity, future capital expenditures and investments and the expected returns therefrom, trends in the seafood industry, restructuring initiatives, exchange rate and interest rate fluctuations, expected research and development expenditures, business prospects and positioning with respect to market, demographic and pricing trends, strategic initiatives, financial target (including ROCE and NIBD), planned operational expenses, product demand and trends, supply trends, expected price levels, and the effects of any extraordinary events and various other matters (including developments with respect to laws, regulations and governmental policies regulating the industry and changes in accounting policies, standards and interpretations) on Mowi's business and results. Forward-looking statements are typically identified by words or phrases, such as “believe,” “expect,” “anticipate,” “intend,” “estimate,” “may increase,” “may fluctuate,” “plan,” “goal,” “target,” “strategy,” and similar expressions or future or conditional verbs such as “may,” “will,” “should,” “would,” and “could.” Forward-looking statements are Mowi’s current estimates or expectations of future events or future results. Actual results could differ materially from those indicated by these statements because the realization of those results is subject to many risks and uncertainties. Mowi ASA’s annual report contains additional information about factors that could affect actual results, including: changes to the price of salmon including the value of our biological assets; hedging risks; risks related to fish feed; economic and market risks; environmental risks; operational risks; risks related to escapes, disease and sea lice; product risks; risks related to our acquisitions; financing risks; regulation risks including relating to food safety, the aquaculture industry, processing, competition and anti-corruption; trade restriction risks; litigation risks; tax and accounting risks; strategic and competitive risks; and reputation risks. All forward-looking statements included in this report are based on information available at the time of the release, and Mowi assumes no obligation to update any forward-looking statement.
Q4|2020
© Mowi 34