Embed Size (px)
Citation preview

Atmos. Chem. Phys., 14, 4661–4678, 2014www.atmos-chem-phys.net/14/4661/2014/doi:10.5194/acp-14-4661-2014© Author(s) 2014. CC Attribution 3.0 License.
Atmospheric Chemistry
and PhysicsO
pen Access
Secondary organic aerosol formation exceeds primary particulatematter emissions for light-duty gasoline vehicles
T. D. Gordon1,2,*,** , A. A. Presto1, A. A. May1,*** , N. T. Nguyen1, E. M. Lipsky 3, N. M. Donahue1,2, A. Gutierrez4,M. Zhang4, C. Maddox5, P. Rieger5, S. Chattopadhyay6, H. Maldonado7, M. M. Maricq 8, and A. L. Robinson1,2
1Center for Atmospheric Particle Studies, Carnegie Mellon University, Pittsburgh, PA 15213, USA2Engineering and Public Policy, Carnegie Mellon University, Pittsburgh, PA 15213, USA3Department of Engineering, Penn State Greater Allegheny, McKeesport, PA 15131, USA4Mobile Source Operations, California Air Resources Board, El Monte, CA 91731, USA5Monitoring and Laboratory, California Air Resources Board, El Monte, CA 91731, USA6Planning and Technical Support, California Air Resources Board, El Monte, CA 91731, USA7Research Division, California Air Resources Board, Sacramento, CA 95814, USA8Research and Advanced Engineering, Ford Motor Company, Dearborn, MI 48120, USA* now at: National Oceanic and Atmospheric Administration Earth System Research Laboratory, Chemical Sciences Division,325 Broadway, Boulder, CO 80305, USA** now at: Cooperative Institute for Research in Environmental Sciences, University of Colorado, 216 UCB, Boulder, CO80309, USA*** now at: Department of Atmospheric Science, Colorado State University, Fort Collins, CO 80523, USA
Correspondence to:A. Robinson ([email protected])
Received: 1 August 2013 – Published in Atmos. Chem. Phys. Discuss.: 4 September 2013Revised: 26 February 2014 – Accepted: 4 March 2014 – Published: 13 May 2014
Abstract. The effects of photochemical aging on emissionsfrom 15 light-duty gasoline vehicles were investigated us-ing a smog chamber to probe the critical link between thetailpipe and ambient atmosphere. The vehicles were recruitedfrom the California in-use fleet; they represent a wide rangeof model years (1987 to 2011), vehicle types and emissioncontrol technologies. Each vehicle was tested on a chas-sis dynamometer using the unified cycle. Dilute emissionswere sampled into a portable smog chamber and then photo-chemically aged under urban-like conditions. For every ve-hicle, substantial secondary organic aerosol (SOA) forma-tion occurred during cold-start tests, with the emissions fromsome vehicles generating as much as 6 times the amount ofSOA as primary particulate matter (PM) after 3 h of oxida-tion inside the chamber at typical atmospheric oxidant lev-els (and 5 times the amount of SOA as primary PM after5× 106 molecules cm−3 h of OH exposure). Therefore, thecontribution of light-duty gasoline vehicle exhaust to ambi-ent PM levels is likely dominated by secondary PM produc-tion (SOA and nitrate). Emissions from hot-start tests formed
about a factor of 3–7 less SOA than cold-start tests. There-fore, catalyst warm-up appears to be an important factor incontrolling SOA precursor emissions. The mass of SOA gen-erated by photooxidizing exhaust from newer (LEV2) vehi-cles was a factor of 3 lower than that formed from exhaustemitted by older (pre-LEV) vehicles, despite much largerreductions (a factor of 11–15) in nonmethane organic gasemissions. These data suggest that a complex and nonlin-ear relationship exists between organic gas emissions andSOA formation, which is not surprising since SOA precur-sors are only one component of the exhaust. Except for theoldest (pre-LEV) vehicles, the SOA production could not befully explained by the measured oxidation of speciated (tra-ditional) SOA precursors. Over the timescale of these exper-iments, the mixture of organic vapors emitted by newer vehi-cles appears to be more efficient (higher yielding) in produc-ing SOA than the emissions from older vehicles. About 30 %of the nonmethane organic gas emissions from the newer(LEV1 and LEV2) vehicles could not be speciated, and themajority of the SOA formed from these vehicles appears to
Published by Copernicus Publications on behalf of the European Geosciences Union.

4662 T. D. Gordon et al.: SOA formation exceeds primary PM emissions for gasoline vehicles
be associated with these unspeciated organics. By compar-ing this study with a companion study of diesel trucks, weconclude that both primary PM emissions and SOA produc-tion for light-duty gasoline vehicles are much greater than forlate-model (2007 and later) on-road heavy-duty diesel trucks.
1 Introduction
Ambient fine particulate matter (PM) is comprised of a com-plex mixture of constituents, including sulfates, nitrate, am-monium, organic material (organic aerosols), elemental car-bon (EC), crustal materials, trace elements, and water. Or-ganic aerosols often contribute a third or more of fine PMmass, but their sources are poorly understood (Kanakidou etal., 2005; Turpin et al., 2000). Primary organic aerosol (POA)is emitted directly “from the tailpipe”; secondary organicaerosol (SOA) is formed in the atmosphere from the oxi-dation of gaseous precursors. Numerous reports have shownthat the secondary fraction of fine organic PM (SOA) dom-inates POA, even in urban areas with substantial fresh POAemissions (Jimenez et al., 2009; Subramanian et al., 2007;Stone et al., 2009). However, chemical transport models sys-tematically underpredict SOA levels (de Gouw et al., 2005;Heald et al., 2005; Volkamer et al., 2006), especially dur-ing photochemical episodes (Vutukuru et al., 2006). Motorvehicle emissions contribute to both POA and SOA concen-trations.
Recent smog chamber studies of dilute exhaust from dif-ferent combustion processes – including diesel generators,medium- and heavy-duty diesel vehicles, biomass burningand jet aircraft – have demonstrated that the mass of SOAgenerated from the oxidation of vapor emissions often ex-ceeds the mass of POA (Weitkamp et al., 2007; Samy andZielinska, 2010; Chirico et al., 2010; Miracolo et al., 2011;Hennigan et al., 2011; Gordon et al., 2013a). Therefore, SOAproduction from gaseous precursors may represent the ma-jority of the contribution from these sources to atmosphericorganic fine PM. Although much is known about primaryemissions from light-duty gasoline vehicles (LDGVs), thereare few published reports on SOA formation from LDGVs(Nordin et al., 2013; Platt et al., 2013). Previous studies em-ploy (1) driving cycles that are not relevant to in-use drivingpatterns and/or (2) a small sample size (in one study only asingle vehicle is used), both of which complicate extrapola-tion of the results to the in-use vehicle fleet. LDGVs emita mixture of thousands of organic gases, some of which areknown SOA precursors, such as single-ring aromatics, butthe complexity of these emissions coupled with uncertaintyin SOA formation mechanisms means that the contributionof LDGVs to ambient PM is not well understood.
This paper describes smog chamber experiments con-ducted to investigate the SOA formation from dilute LDGVexhaust. Experiments were performed on 15 LDGVs re-
cruited from the California in-use fleet. The vehicles spanneda range of types, model years and emission standards. Thevehicles were operated over cold- and hot-start driving cy-cles designed to represent typical urban driving patterns.The dilute emissions were injected into a smog chamberand photooxidized to quantify the secondary PM formation.Major goals of these experiments were to understand thefraction of the emissions (yield) that form SOA and to as-sess the relative importance of primary PM emissions ver-sus SOA formation. The research was conducted as part ofa large project investigating the link between tailpipe emis-sions from mobile sources and ambient PM. Companionpapers describe primary emissions from on-road vehicles(May et al., 2014), gas-particle partitioning of POA emis-sions (May et al., 2013a, b), primary PM emission and SOAformation from off-road gasoline and diesel engines (Gor-don et al., 2013b) and SOA production from diesel vehicles(Gordon et al., 2013a).
2 Materials and methods
2.1 Experimental setup and procedure
Emission characterization and photochemical aging exper-iments were conducted at the California Air ResourcesBoard’s (CARB) Haagen-Smit Laboratory (HSL) in ElMonte, California (Pisano et al., 2011). Twenty-nine smogchamber experiments were performed with 15 differentLDGVs recruited from the California in-use fleet (modelyears 1987 to 2011). The fleet was not designed to representthe distribution of vehicles in the current, in-use Californiafleet; instead, vehicles (from private owners located within 50miles of HSL) were selected to span a wide range of modelyears, vehicle types, engine technologies, and emission con-trol technologies. All vehicles were port fuel injected exceptfor one LEV2 vechicle (vehicle ID: LEV2-4), which was anearly-generation gasoline direct-injected vehicle. Additionaldetails on the individual vehicles are provided in Table S1 inthe Supplement.
For discussion, the vehicles are grouped based on modelyear: “pre-LEV” vehicles were manufactured prior to 1995;“LEV1” vehicles were manufactured between 1995 and2003; and “LEV2” vehicles were manufactured 2004 or later.In this work, the LEV designation simply refers to a range ofmodel years; it does not refer to the emissions certificationstandard. For example, some of the LEV1 vehicles were cer-tified as Tier 1 vehicles. The certification standard for eachvehicle is listed in Table S1. The smog chamber test fleet wascomprised of three pre-LEV, six LEV1, and six LEV2 vehi-cles. All of the vehicles were operated on the same Californiacommercial summertime gasoline; details of its compositionare provided in Tables S2 and S3 in the Supplement.
Figure 1 illustrates the experimental setup. The vehicleswere driven on a Clayton (Model AC-48) 48 inch (1.22 m)
Atmos. Chem. Phys., 14, 4661–4678, 2014 www.atmos-chem-phys.net/14/4661/2014/

T. D. Gordon et al.: SOA formation exceeds primary PM emissions for gasoline vehicles 4663
Gas monitors: NOx, CO
7m3 smogchamber
UV lights
Heated transfer
line Constant volumesampler
Q-AMS
TDUV lights SMPS
PTRMS
OC / EC
CO2, SO2
Dekati dilutor(heated air in)
Aethalo-meter
Chassis dynamometer&
test vehicleTHC, NOx, CO, CO2
Speciated hydrocarbons
PM2.5 mass
OC/EC
Exhaust
Fig. 1. Experimental setup used to characterize the primary and secondary particulate matter and gas-phase products from motor vehicleemissions. Not to scale. TD = thermodenuder; SMPS = scanning mobility particle sizer; Q-AMS = quadrupole aerosol mass spectrometer;PTRMS = proton transfer reaction mass spectrometer.
single-roll electric chassis dynamometer. Every vehicle wastested using the cold-start Unified Cycle (UC) driving sched-ule (Fig. S1), which was designed to simulate driving pat-terns in southern California. It has a three-bag structure sim-ilar to the Federal Test Procedure (FTP) but is a more ag-gressive cycle with higher speeds, higher acceleration, fewerstops per mile, and less idle time (Table S4 in the Supple-ment). Emissions from vehicles operated over the UC aregenerally higher than when operated over the FTP (Robertet al., 2007). Four hot-start UC tests were also run (one pre-LEV, one LEV1 and two LEV2 experiments) to investigatethe effects of the temperatures of the engine and emissioncontrol system on SOA formation. In the hot-start experi-ments the vehicle was conditioned by driving over the 5 minfirst phase (“bag one”) of the UC, after which sampling com-menced and the vehicle was immediately driven over thestandard three-bag UC.
The entire exhaust flow was sampled using a Horiba con-stant volume sampling (CVS) system, and the dilute emis-sions were characterized following CFR (Code of FederalRegulations) Title 40 Part 86 procedures. Gas-phase emis-sions were measured using an AVL-AMA 4000 system, in-cluding total hydrocarbons by flame ionization detection(FID), methane (CH4) by FID–gas chromatography (GC),and carbon monoxide (CO), NOx by chemiluminescenceand carbon dioxide (CO2) by nondispersive infrared (NDIR)detectors. Accuracy, drift (8 h), noise and linearity for theAVL-AMA 4000 are all within 1 % of full scale, and re-peatability is within 0.5 % of full scale. Nonmethane or-ganic gases (NMOG) were calculated from the differencebetween total hydrocarbons and methane. PM mass emis-sions were measured by gravimetric analysis of Teflon®
membrane filters. Carbonaceous PM emissions were mea-sured using samples collected on pre-fired quartz filters. Thequartz filters were analyzed using a Sunset Laboratory Or-ganic Carbon/Elemental Carbon (OC / EC) Analyzer usingthe IMPROVE-A protocol (Chow et al., 1993). During sam-pling, the filter trains were maintained at 47± 5◦C.
Comprehensive speciation was performed to quantifyemissions of 203 individual organic compounds (see Ta-ble S5 in the Supplement). Samples from the CVS werecollected in Tedlar® bags and analyzed offline for individ-ual light hydrocarbons (< C5) and mid-weight hydrocarbons(C5 to C12), using standard gas-chromatography-based an-alytical procedures (California Air Resources Board, 2001,2004, 2006). Carbonyl emissions were determined fromsamples collected on 1,4-dinitrophenylhydrazine (DNPH)-impregnated cartridges analyzed by high-performanceliquid chromatography (http://www.arb.ca.gov/testmeth/slb/sop104v3.pdf).
Dilute emissions from the CVS were also transferred viaan electrically heated (47◦C) 0.5-in-outer-diameter (o.d.)Silcosteel® (i.e., passivated internal bore) stainless steel tub-ing to a 7 m3 Teflon® smog chamber where they were pho-tochemically aged (Hennigan et al., 2011). Before each ex-periment the chamber was cleaned by flushing with high-efficiency particulate air (HEPA)- and activated-carbon-filtered air overnight. For most experiments (listed in Ta-ble S1 in the Supplement), the chamber was seeded to min-imize nucleation; approximately 10 µg m−3 of ammoniumsulfate was injected into the chamber just before the vehi-cle was started. The smog chamber was located indoors, in alarge air-conditioned space; its temperature and relative hu-midity varied within the ranges of 25–30◦C and 30–50 %.Due to these low relative humidities and the fact that pri-mary vehicle emissions are relatively hydrophobic (Dua etal., 1999; Weingartner et al., 1997), it is unlikely that aque-ous SOA formation was important in these experiments.
Vehicle emissions were added to the chamber over theentire UC (but not during the 10 min hot-soak period);thus, these experiments represent trip-average emissions.The chamber was covered (dark) during filling to preventphotochemistry. During filling, the exhaust was diluted bya factor of 200–300 compared to the tailpipe in three stages:first, it was diluted approximately 10 : 1 (average over driv-ing cycle) with ambient-temperature HEPA-filtered air inthe CVS; it was then diluted another 8–10 : 1 with 47◦C
www.atmos-chem-phys.net/14/4661/2014/ Atmos. Chem. Phys., 14, 4661–4678, 2014

4664 T. D. Gordon et al.: SOA formation exceeds primary PM emissions for gasoline vehicles
HEPA- and activated-carbon-filtered air using Dekati ejectordiluters in the transfer line; finally, it was diluted another 2–3 : 1 with ambient-temperature HEPA- and activated-carbon-filtered air in the smog chamber.
After adding exhaust, HONO (nitrous acid) was intro-duced into the chamber as an OH (hydroxyl) radical sourceby bubbling dry air through a 1 : 2 solution (volume) of0.1 M NaNO2 and 0.05 M H2SO4 for ∼30 min. If neces-sary, the VOC / NOx ratios were adjusted to approximately3 : 1 ppbC ppbNO−1
x (typical of many urban environments)by adding propene (0.0–1.00 ppm). In 21 of the 29 experi-ments 0.06 ppm of deuterated butanol was also injected intothe chamber as a hydroxyl radical (OH) tracer. After char-acterizing the primary emissions in the dark for∼45 min,the emissions were photooxidized by exposing them to UVlights (Model F40BL UVA, General Electric) continuouslyfor 3 h.
A suite of instruments was used to characterize gas-and particulate-phase pollutants inside the chamber. Particlenumber distributions were measured with a scanning mobil-ity particle sizer (SMPS, TSI, Inc., classifier model 3080,CPC model 3772). Nonrefractory submicron aerosol massand chemical composition were measured with a quadrupoleaerosol mass spectrometer (AMS, Aerodyne, Inc.). Gas-phase organic species were measured with a proton transferreaction mass spectrometer (PTR-MS, Ionicon) that was cali-brated daily using a custom gas standard from Spectra Gases.Dedicated gas monitors were used to measure CO2 (LI-820,Li-Cor Biosciences), SO2, NOx, CO, and O3 (API-TeledyneModels 100E, 200A, 300A and 400E); monitors were ze-roed daily and calibrated at least weekly. A seven-channelAethalometer (Magee Scientific, Model AE-31) measuredblack carbon (BC); the Aethalometer data were corrected forparticle loading effects using the method of Kirchstetter andNovakov (2007).
It is impossible to exactly reproduce all atmospheric con-ditions inside a smog chamber. Therefore, we focused onmaintaining at urban-like values several key parameters (e.g.,PM concentrations and VOC / NOx ratios) known to stronglyinfluence SOA formation. In most experiments, we addedpropene (which does not form SOA; Kroll and Seinfeld,2008) to the chamber to adjust the VOC / NOx ratio to matcha typical urban level of∼3 : 1 ppbC ppbNO−1
x . This helps en-sure that the important radical branching channels such as thefate of organoperoxy radicals (RO2) are similar to those inthe atmosphere (Presto et al., 2005; Lim and Ziemann, 2009;Ng et al., 2007). However, values of other parameters wereoutside of typical atmospheric ranges. Mixing ratios of indi-vidual organic gases were typically less than 1 ppb, but wereas high as 20 ppbv for the highest-emitting vehicle. NOx lev-els were between 0.1 and 2.4 ppmv. In addition, the mix oforganics inside the chamber (gasoline exhaust+ propene)is different than a typical urban atmosphere. However, ourgoal is to understand the fraction of the emissions (yield) thatform SOA, which is less sensitive to absolute concentrations,
especially if the organic aerosol levels in the chamber are at-mospherically relevant. Initial concentrations for select pol-lutants (NO, NO2, CO2, etc.) for all the chamber experimentsare listed in Table S1 in the Supplement.
2.2 Data analysis
Pollutant data are reported on a fuel basis (mg-pollutant kg-fuel−1):
EF= [P] ·
(MWCO2
[1CO2]+
MWCO
[1CO]+
MWNMOG
[1NMOG]
)·
Cf
MWC, (1)
where [P] is the background-corrected pollutant concentra-tion in µg m−3; [CO2], [CO], [NMOG] are the background-corrected concentrations of CO2, CO and nonmethane or-ganic gases in the chamber in µg m−3; and MWC, MWCO2,MWCO, and MWNMOG are the molecular weights of C, CO2,CO and NMOG. Cf is the measured mass fraction of carbonin the gasoline (0.85 kg C kg fuel−1, Table S3 in the Supple-ment).
The fragmentation table from Allan et al. (2004) was usedto interpret AMS data. The contribution of gas-phase CO2 tothe AMS m/z 44 signal was corrected using the measuredCO2 concentrations as a function of time. Maximum CO2levels in the chamber after exhaust injection ranged from 515to 890 ppmv. There was no evidence of organic particle sig-nal atm/z 28 (CO+). The approach of Farmer et al. (2010)indicates that only a minor fraction (typically< 5 %) of thenitrate mass (which was usually quite small) was attributableto organics.
To quantify SOA production the smog chamber data werecorrected for the loss of particles and vapors to the cham-ber walls. Details of this correction are contained in the Sup-plement. The loss of organic particulate mass to the walls iswell constrained. It is treated as a first-order process (Mc-Murry and Grosjean, 1985) with a rate constant determinedby fitting the BC data measured using the Aethalometer.The wall-loss rate constant was determined separately foreach experiment because it depends on the size and shapeof the chamber, turbulence in the chamber and the parti-cle size and charge distribution (Presto et al., 2005). Theaverage particle wall-loss rate for all the experiments was0.40± 0.095 h−1 (i.e., after approximately 2.5 h the BC con-centration decreased to 37 % of its initial value). For vehi-cles with low BC emissions the rate constant was determinedfrom the measured loss of sulfate seed particles.
Using BC (or any of the other species) as a tracer for par-ticle wall loss assumes that it is internally mixed with theorganic aerosol. This assumption was evaluated using parti-cle size distribution data measured with the SMPS and AMS,which showed that during most experiments the SOA con-densed onto the primary-mode aerosol to create an internallymixed system. However, in a few experiments significant par-ticle mass was formed from nucleation. In these experimentsit was necessary to adjust the wall-loss rate to account for the
Atmos. Chem. Phys., 14, 4661–4678, 2014 www.atmos-chem-phys.net/14/4661/2014/

T. D. Gordon et al.: SOA formation exceeds primary PM emissions for gasoline vehicles 4665
10 0
10 1
10
(a)
2
10 3
pre-LEV LEV-1 LEV-2
prim
ary
PM (m
g/kg
-fuel
)
10 -1
10 0
10 1
10 2
10 3
pre-LEV LEV-1 LEV-2
OC
(mg-
C/kg
-fuel
)10 0
10 1
10 2
10 3
pre-LEV LEV-1 LEV-2
EC (m
g-C/
kg-fu
el)
10 2
10 3
10 4
10 5
pre-LEV LEV-1 LEV-2N
MO
G (m
g/kg
-fuel
)
(b)
(c) (d)
Fig. 2.Cold-start primary emissions from light-duty gasoline vehicles tested in the smog chamber shown as individual data points overlayingboxplots of the data from entire test fleet (May et al., 2014). The primary emissions are measured from the constant volume sampler (CVS):(a) total primary PM from gravimetric analysis,(b) OC and(c) EC components of primary PM from thermal-optical analysis of quartz filtersand(d) nonmethane organic gases. The 15 chamber vehicles include 3 unique pre-LEV vehicles (black circles), 6 unique LEV1 vehicles(blue circles) and 6 unique LEV2 vehicles (red circles). The central marks on the boxplots are medians, the edges of the boxes are the 25thand 75th percentiles, the whiskers extend to the most extreme data points not considered outliers, and outliers (>1.5× interquartile range)are plotted individually with the “+” symbol.
more rapid loss of smaller nucleation mode particles. Thiscorrection is discussed in the Supplement.
The loss of condensable organic vapors to wall-bound par-ticles is estimated for two cases (Weitkamp et al., 2007). Alower bound estimate assumes no loss of vapors to the cham-ber walls – essentially that the mass transfer resistance tothe walls is much greater than to the suspended particles.It is equivalent to the “ω = 0” correction utilized in previ-ous studies (Weitkamp et al., 2007; Miracolo et al., 2011).The second estimate assumes that the particles lost to thewalls during an experiment remain in equilibrium with thevapor phase (“ω = 1” correction; Weitkamp et al., 2007);therefore, the loss of organic vapors scales with the ratioof the mass of particles on the walls to particles in suspen-sion. The two vapor loss estimates diverge as more particlemass is lost to the chamber walls, increasing the uncertaintyin the wall-loss-corrected SOA mass as an experiment pro-gresses (Hildebrandt et al., 2009). With one vehicle (experi-ments pre-LEV3.2 and pre-LEV3.3) we imposed a 5: 1 up-per bound on the ratio of OA on the wall to suspended OA.In our judgment OA estimates beyond this ratio become toouncertain; therefore, we assumed that these two experimentswere complete when this ratio was reached. If we had cho-
sen a higher limit (or no limit), our estimate of the SOA pro-duction from this vehicle would have been greater, but thiswould not change any of the conclusions of the paper. We donot consider the loss of organic vapors directly to the cham-ber walls (in distinction to their loss to wall-bound particles)(Matsunaga and Ziemann, 2010). This is highly uncertain; ifincluded, it would increase our estimated SOA production.
3 Results
Figure 2 presents primary emissions data measured from theCVS, including gravimetric PM mass, organic carbon, ele-mental carbon, and NMOG. Data for the 15 vehicles used forthe smog chamber experiments are indicated by the filled cir-cles. The chamber vehicles shown in Fig. 2 are a subset of alarger test fleet of 63 LDGVs (May et al., 2014). To evaluatethe representativeness of the emissions from smog chambervehicles, box-whisker plots of the data from the entire vehi-cle fleet are shown overlaying the individual data points forthe smog chamber experiments in Fig. 2.
Despite some vehicle-to-vehicle variability, Fig. 2 indi-cates that for most pollutants there is a clear reduction inemissions from newer, lower-mileage vehicles that met more
www.atmos-chem-phys.net/14/4661/2014/ Atmos. Chem. Phys., 14, 4661–4678, 2014

4666 T. D. Gordon et al.: SOA formation exceeds primary PM emissions for gasoline vehicles
stringent emission standards relative to older vehicles. Forexample, the NMOG emissions from the median LEV2 vehi-cle are about an order of magnitude lower than the emissionsfrom the median pre-LEV vehicle. However, emissions ofsome pollutants do not exhibit a downward trend with modelyear grouping; for example, there is no statistically signifi-cant trend (p = 0.389) in the EC emissions. The lack of atrend in the EC emissions with vehicle age is not surprising.LEV1 gasoline vehicles already met the LEV2 PM emissionsstandard; therefore, changes to engine control/aftertreatmentfrom LEV1 to LEV2 were not aimed at reducing nonvolatileEC particles or primary PM more broadly, and this fact isreflected in the relatively constant EC value shown in Fig. 2across the LEV classes.
Figure 2 demonstrates that emissions from the vehiclesused for smog chamber experiments are reasonably repre-sentative of the larger test fleet. From the perspective of SOAformation, the NMOG emissions are presumably the mostimportant metric. The NMOG emissions from most of thesmog chamber vehicles cluster around the median vehicle fora given model year range. There was more variability in theprimary PM emissions; for example, two of the LEV1 cham-ber vehicles (LEV1-1 and LEV1-6) had the highest and low-est emissions for the entire set of LEV1 vehicles. There werealso some systematic differences in the EC emissions fromthe chamber vehicles relative to the overall vehicle fleet. TheEC emissions from the LEV1 chamber vehicles were sys-tematically lower than the overall LEV1 fleet, while the ECemissions from the LEV2 chamber vehicles were systemati-cally higher than the overall LEV2 fleet.
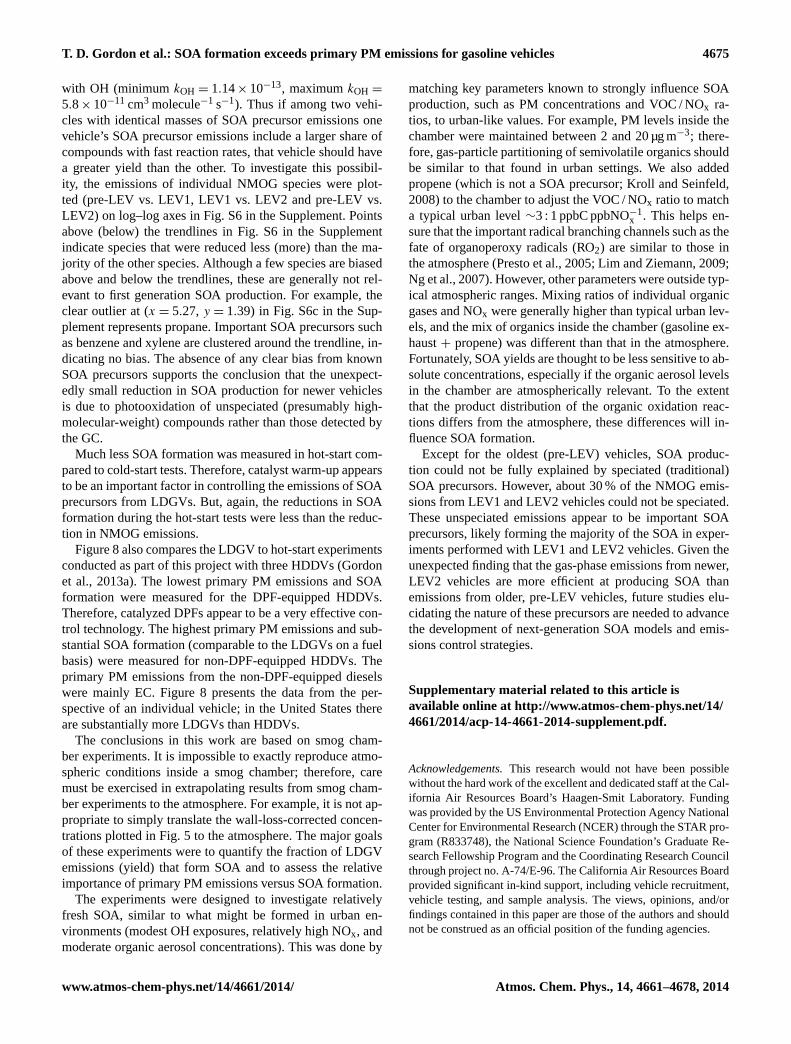
An important objective of this work was to quantify theSOA formation. To better understand the SOA precursoremissions, comprehensive speciation was performed on thevolatile organic compound emissions. Figure 3 presents themedian data for each vehicle class, which are representativeof the larger fleet. Instead of presenting results for individ-ual compounds, the speciation results are classified into threecategories: speciated SOA precursors, speciated non-SOAprecursors, and unspeciated NMOG. The mapping of indi-vidual compounds to these categories is summarized in Ta-ble S5 in the Supplement. Briefly, speciated SOA precursorsinclude single-ring aromatics (C6 to C12) and mid-weightVOCs (C9 to C12). The higher-molecular-weight compounds(C9 and larger) are less volatile than the lighter (C8 andsmaller) compounds, and are, therefore, more likely to con-dense into the solid or liquid phase as a result of photooxida-tion. Speciated non-SOA precursors include all of the otherspeciated compounds. The unspeciated mass is the differencebetween the total NMOG emissions and the sum of the speci-ated compounds. Figure 3 indicates that∼70 % of the massof the NMOG emissions from the LEV1 and LEV2 vehi-cles was speciated. This level of mass closure is similar to orslightly better than that of Schauer et al. (1999, 2002).
The absolute emissions of speciated SOA precursors, spe-ciated non-SOA precursors and unspeciated NMOGs are
0.0
2.0
4.0
6.0
8.0
pre-LEV LEV-1 LEV-2
non-
met
hane
org
anic
gas
es (g
/kg-
fuel
)
unspeciated
speciated non-SOA precursors
speciated SOA precursors
26±6%20±5%21±3%
56±13%
61±7%
53±12%
29±15%30±15%
12±11%
Fig. 3. Median nonmethane organic gas (NMOG) emissions foreach class of light-duty gasoline vehicles. The emissions have beenlumped into three broad categories: (1) “speciated SOA precursors,”including single-ring aromatics (C6 to C12), mid-weight VOCs (C9to C12); (2) all other speciated compounds (“speciated non-SOAprecursors”); and (3) “unspeciated” compounds, defined as the dif-ference between the total NMOG and the speciated emissions. Thebars represent the median absolute values; the values next to thebars represent the median (± 1σ ) fractional contribution of eachemission category (i.e., precursor, nonprecursor, unspeciated) to thetotal NMOG for each vehicle class.
lower from newer vehicles. In addition, the relative amountof speciated SOA precursors has remained approximatelyconstant as a function of LEV class at about 20–26 % of theNMOG mass. Therefore, despite large vehicle-to-vehicle dif-ferences in the absolute magnitude of the NMOG emissions,vehicle-to-vehicle differences in the relative amounts of spe-ciated emissions were modest. However, on average, a largerfraction of the NMOG emissions from the newer (LEV1 andLEV2) vehicles could not be speciated (∼30 % on a massbasis) compared to the older (pre-LEV) vehicles (∼12 %).
The primary emissions data alone provide a preliminaryestimate of the relative importance of primary PM emissionsversus SOA formation. Combining the data in Figs. 2d and3 indicates that emissions of speciated SOA precursors areabout 50 times higher than the POA emissions for all pre-LEV and LEV1 categories and about 30 times higher forLEV2 vehicles (assuming the ratio of organic mass to or-ganic carbon is 1.4; Lipsky and Robinson, 2006). Yields foraromatics and largen-alkanes are around 10 % for typicalatmospheric conditions (Hildebrandt et al., 2009; Ng et al.,2007; Presto et al., 2010; Tkacik et al., 2012). Therefore,the emissions data themselves indicate that the SOA formedfrom vehicle emissions will likely exceed the POA. This con-clusion becomes even stronger if the unspeciated emissionsalso form SOA and one accounts for sampling artifacts andpartitioning biases in the quartz filter POA data plotted inFig. 2b (May et al., 2013b). The smog chamber experimentsprovide a direct test of this hypothesis.
Atmos. Chem. Phys., 14, 4661–4678, 2014 www.atmos-chem-phys.net/14/4661/2014/

T. D. Gordon et al.: SOA formation exceeds primary PM emissions for gasoline vehicles 4667
0
4
8
12
16
mas
s con
cent
rati
on (μ
g m
-3)
Wall loss corr. BC
BC
Organicaerosol
0
100
200
300
400
500
600
0
200
400
600
800
1000
CO2 c
once
ntra
tion
(ppm
)
conc
entr
atio
n (p
pb)
NO
NO2
CO2
O3
(c)
0
4
8
12
16
20
conc
entr
atio
n (p
pb)
xyleneTMBacetoneMEK
(b)
time since lights on (h)-1.5 -0.5 0.5 1.5 2.5
(a)
time since lights on (h)-1.5 -0.5 0.5 1.5 2.5
time since lights on (h)-1.5 -0.5 0.5 1.5 2.5
(d)
0
2
4
6
8
10
12
[OH] x time (molecules cm-3 h)
SOA vs. time
seco
ndar
y or
g. a
eros
ol (µ
g m
-3)
2x1060 4x10⁶ 6x10⁶ 8x10⁶
SOA vs. ([OH] x time)
time since lights on (h)-1.5 -0.5 0.5 1.5 2.5
Range of estimates for wall-loss
corrected organics
Fig. 4. Measured gas and particle evolution during a typical smog chamber experiment (LEV1-6.2 experiment):(a) NOx, O3 and CO2;(b) selected primary (xylene and trimethylbenzene, TMB) and secondary (acetone and methyl ethyl ketone, MEK) organic gases;(c) mea-sured and wall-loss-corrected black carbon (BC) and organic aerosol concentrations; and(d) wall-loss-corrected SOA production (average oftwo correction methods) as a function of time (black, lowerx axis) and OH exposure (red, upperx axis). Within the range of−1.5 h< time< −1.0 h, the chamber was filled with diluted emissions from the vehicle; for−1.0 h< time< 0 h, the primary PM was characterized; attime >0 h the UV lights were on and photooxidation generated SOA. The grey shaded area in(c) indicates the range of wall-loss correctionestimates discussed in the text. A four-period moving average is used to smooth both data sets in(d).
3.1 Secondary organic aerosol formation
Figure 4 plots the temporal evolution of both particle- andgas-phase species measured during a typical cold-start smogchamber experiment. First, vehicle emissions were added tothe chamber throughout the entire UC test, increasing thepollutant concentrations inside the chamber. The UC cyclewas completed and engine shut off at time =−1.0 h. HONOwas added to the chamber at approximately time =−0.5 h,modestly increasing NO2 concentrations. Propene was alsoadded at this time to adjust the VOC / NOx ratio to about3 : 1 ppbC ppbNO−1
x . The loss of POA to the walls of thechamber is evident from the decay of the organic signal mea-sured with the AMS (blue points in Fig. 4c) occurring be-tween the time when the engine is turned off and before thelights are turned on (time = 0 h).
After the UV lights were turned on, the measured organicaerosol concentrations increased for about an hour and a half,indicating substantial SOA formation. In contrast, the mea-sured concentration of nonreactive BC decreased. (Due tointerference during the HONO addition, BC measurementsbefore lights were turned on are not shown; the wall-loss cor-
rection was extrapolated back in time to when the emissionswere first injected.) The grey shaded region in Fig. 4c showsthe range of wall-loss correction estimates, which becomemore uncertain as the experiment progresses and more par-ticle mass is lost to the chamber walls (Hildebrandt et al.,2009). After 3 h of photooxidation the wall-loss-correctedorganic aerosol concentration increased by roughly a fac-tor of 6 from∼2 µg m−3 at the beginning of the experimentto ∼12 µg m−3 at the end. During the 3 h of UV irradiationmuch of the NO and primary hydrocarbons are oxidized toNO2 and more oxygenated organics, respectively (Fig. 4a,b).
In a few experiments there was significant inorganic ni-trate formation (comparable to the SOA mass). This requiresammonia to neutralize the nitric acid formed from the oxida-tion of NOx. We hypothesize that organic nitrate formed inexperiments with vehicles that emitted significant amountsof ammonia, but the ammonia concentrations in the chamberwere not measured.
Hydroxyl radical (OH) levels in the chamber were inferredfrom the decay of individual VOCs (e.g., deuterated butanol,toluene, xylenes, trimethylbenzene and propene) measured
www.atmos-chem-phys.net/14/4661/2014/ Atmos. Chem. Phys., 14, 4661–4678, 2014

4668 T. D. Gordon et al.: SOA formation exceeds primary PM emissions for gasoline vehicles
pre-LEV
SOA
at 3
hr (µg
m-3
)N
MO
G bkgd
/ NM
OG to
tal
LEV-1 hot start blanksLEV-2
vehicle#.experiment#
pre-LEV median = 1%
LEV-1 median = 9%
LEV-2 median = 16%
0
2
4
6
8
min. detection limit
10
20
30
40
50
2.11.1 2.2 3.2 3.3 2.11.5 2.2 3.2 3.4 5.24.1 6.1 6.2 1.2 3.11.6 3.2 2.1 4.2 6.36.2 5.1 5.2
DPF1
.1
DPF1
.7
DPF1
.4
DPF1
.10
DPF1
.11
DPF1
.14
DPF2
.7
DPF2
.8
DPF2
.12
LEV1
-2.3
LEV2
-3.3
LEV2
-3.4
blan
k.1
blan
k.2
0.0
0.2
0.4
0.6
0.8
1.0
(a)
(b)
Fig. 5. (a) Measured wall-loss-corrected SOA concentration (assuming no blank correction) after 3 h of photooxidation and(b) fractionalcontribution of background NMOG to smog chamber. Blue bars in(a) show the average SOA based on the two different wall-loss correctionmethods, and the range of these estimates is shown by the error bars. The red braces in(a) indicate duplicate experiments. Hot-start andnormal UC driving cycle experiments with two vehicles (LEV1-2 and LEV2-3) are denoted by the horizontal and diagonal black lines insideof the bars, respectively. (SOA from the pre-LEV hot-start experiment was not measured due to instrument failure.) The horizontal dashedred line in(a) indicates the minimum SOA detectible by the instruments. “Blanks” included two dynamic blanks and nine experiments withdiesel-particulate-filter-equipped heavy-duty diesel trucks (Gordon et al., 2013a). The dashed black lines in(b) indicate the median values ofNMOGbkgd/ NMOGtotal for the three LEV classes.
with the PTR-MS (Atkinson and Arey, 2003). OH exposures(OH multiplied by time) were calculated based on the loss ofVOCs via reaction with OH as described by the rate law
d
dt[VOC] = −k [OH] [VOC] .
After integrating fromt0 to t , OH exposure is given by
[OH] · t = −1
kln
([VOC]t[VOC]0
).
We calculated the OH exposure according to the equa-tion above using concentrations of three to six differ-ent VOCs (toluene, benzene, xylenes, trimethylbenzene,propene and butanol) measured with a PTR-MS. The dif-ferent estimates were then fit to derive the OH exposure.
Average OH levels during photooxidation were roughly5× 106 molecules cm−3, which is representative of summerdaytime atmospheric concentrations (Seinfeld and Pandis,1998). The trends in Fig. 4b indicate that OH levels weremuch higher during the initial stages of the photooxidationphase of the experiment and then fell as the HONO was con-sumed by photolysis. Table S1 in the Supplement summa-rizes the OH data for all of the experiments.
Figure 4c shows that the wall-loss-corrected organicaerosol concentrations level off at a constant value as theexperiment progresses, potentially indicating that SOA for-mation was complete. However, the xylene and trimethyl-benzene concentrations also stopped decaying after∼ 1.5–2 h, which suggests that the slowing of the SOA productionis probably due to decreased oxidant concentrations, rather
Atmos. Chem. Phys., 14, 4661–4678, 2014 www.atmos-chem-phys.net/14/4661/2014/

T. D. Gordon et al.: SOA formation exceeds primary PM emissions for gasoline vehicles 4669
than exhaustion of the SOA precursors. Figure 4d presentsthe SOA data as a function of OH exposure (i.e., [OH] mul-tiplied by the exposure time) and as a function of time. TheSOA production increased linearly with OH exposure, indi-cating that the SOA formation was not completed after 3 h ofphotooxidation.
Summer daytime OH concentrations are typically in therange of 5–10× 106 molecules cm−3 (Seinfeld and Pandis,1998); therefore, these experiments correspond to approxi-mately 1.5–3 h of atmospheric aging under typical summer-time conditions. Measurements made downwind of urban ar-eas suggest that SOA production continues for about 48 h atan OH concentration of 3× 10⁶ molecules cm−3 (de Gouw etal., 2005). If this is true for LDGV exhaust, then our chamberexperiments might substantially underestimate the ultimateSOA formation potential of LDGV emissions.
Figure 5 compiles the wall-loss-corrected SOA concentra-tions measured at the end of each experiment (after 3 h ofphotooxidation). Data are shown for 24 cold-start LDGV ex-periments, 3 hot-start LDGV experiments, 2 chamber blankexperiments, and 9 hot-start experiments performed with cat-alyzed diesel particulate filter (DPF)-equipped heavy-dutydiesel vehicles (Gordon et al., 2013a). The chamber blankand hot-start DPF-equipped vehicle data quantify the poten-tial contribution of contamination to the measured SOA for-mation. A chamber blank followed the same procedures asan actual vehicle test except that the chamber was filled withCVS dilution air only (no vehicle emissions) for the sameperiod of time as the UC. HONO, propene, deuterated bu-tanol and ammonium sulfate seed particles were then addedto the chamber and the UV lights were turned on for 3 h.The decay of butanol and propene were monitored with thePTR-MS to verify similar amounts of oxidation (OH expo-sure) to those in experiments with vehicle exhaust. The DPF-equipped vehicle experiments followed the same procedureas LDGV and chamber blank tests (Gordon et al., 2013a).Both primary particle and NMOG emissions from the hot-start DPF-equipped vehicle experiments were extremely low,often below ambient levels (Gordon et al., 2013a).
The average wall-loss-corrected SOA mass (assuming noblank correction) for all the cold-start UC chamber experi-ments plotted in Fig. 5a is 12± 8.4 µg m−3, which is withinthe range of typical urban PM concentrations. Therefore thegas-particle partitioning inside the chamber should be rep-resentative of the urban atmosphere. The average wall-loss-corrected SOA concentration for the hot-start experimentswas much lower, 3.7± 1.4 µg m−3. Only 1.4± 1.2 µg m−3
of wall-loss-corrected SOA formed during blank or DPF-equipped vehicle experiments. Therefore the blank corre-sponded to 12 % of the SOA formed in the average cold-startUC experiment, but a much larger fraction of the SOA inthe hot-start experiments. We defined the minimum detectionlimit (MDL) as 3 times the standard deviation of the SOAmeasured in the two blank and nine hot-start DPF-equippedvehicle experiments. The end-of-experiment MDL for SOA
was 3.8 µg m−3 (dashed red line in Fig. 5a). All but two ofthe LDGV experiments lie above the MDL; therefore, thetrends in Fig. 5 are due to the addition of dilute LDGV ex-haust to the chamber, and they are not primarily a result ofSOA produced from the photooxidation of background gas-phase components.
The SOA measured during blank experiments presumablyforms from background organic gases in the CVS dilutionair (HEPA-filtered ambient air) and/or organic vapors thatdesorb from the CVS, transfer line and/or chamber walls.Figure 5b plots the estimated fractional contribution of thebackground organic gases to the chamber based on measure-ments made at the inlet and exit of the CVS tunnel. Duringthe blank and DPF-equipped experiments, the CVS-dilutionair contributed essentially the entire NMOG burden in thechamber. In contrast, during the median pre-LEV, LEV1 andLEV2 experiments, organics in the CVS dilution air typicallycontributed 1, 9 and 16 % (on a mass basis), respectively, ofthe total NMOG burden. Therefore, the vast majority of theorganic gases inside the chamber during all of the cold-startLDGV experiments were vehicle emissions.
One issue that the blank experiments do not address is thepossible contribution of heat-released contamination. For ex-ample, the heat release of hydrocarbons adsorbed from thewalls of the transfer tube used to conduct exhaust from thevehicle to the CVS tunnel has been shown to cause nucle-ation (Maricq et al., 1999). The potential contribution of thismechanism to the SOA precursor burden in the smog cham-ber is not known. However, Fig. 5 indicates that heat-releasecontamination was not a significant source of SOA precur-sors for the DPF-equipped vehicle experiments (althoughthese experiments were conducted in a different facility thanthe LDGV experiments).
Figure 5 also compares results from 10 sets of dupli-cate chamber experiments – 2 different pre-LEV, 3 LEV1,4 LEV2 and 1 set of duplicate LEV2 hot-start experiments.There is good agreement (± 25 % of the average of each du-plicate pair) in SOA production for 7 of the 10 pairs of du-plicate experiments. SOA production for the LEV1-6.1 andLEV1-6.2 experiments differed substantially. This was pri-marily due to high experiment-to-experiment variability inthe emissions from the LEV1-6 vehicle, not measurementuncertainty. LEV1-6 had a malfunctioning oxygen sensor,which resulted in highly variable and high emissions (see Ta-ble S1 in the Supplement). This vehicle was the upper outlierin Fig. 2. The reason for the very large difference in SOA pro-duced during duplicate experiments with LEV1-2 and LEV2-5 is not known. There was poor agreement between the twoduplicate hot-start experiments with LEV2-3 (± 56 % of theaverage of the duplicates), but this may be due to the lowlevels of SOA production. Duplicate cold-start experimentswith this vehicle (which produced nearly an order of magni-tude more SOA) agreed to within 1 %.
www.atmos-chem-phys.net/14/4661/2014/ Atmos. Chem. Phys., 14, 4661–4678, 2014

4670 T. D. Gordon et al.: SOA formation exceeds primary PM emissions for gasoline vehicles
0
5
10
15
20
25
30
35
40x103
NMOG
mg
kg-fu
el-1
pre-LEV
LEV-1
LEV-2
(a) (b)
(c)
mg
kg-fu
el-1
1.6
OH exposure
1.0
1.2
1.4
0.8
0.2
0.4
0.6
0
mol
ecul
es c
m-3
hr
x107
0
20
40
60
80
100
120
140
160
CVS POA primary PM SOASOA (3 h)(5x10⁶ molec cm-3 hr)
hot-start
n=5 (3 vehicles)
n=6 (5 vehicles)
n=10 (6 vehicles)
n=3 (2 vehicles)
0
1
2
3
5
10
15
20
0
1
2
3
SOACVS POA
SOAprimary PM
SOA CO
µg S
OA
m -3
(ppm
v CO
)-1
ratio
(d) (e)
Fig. 6. Primary emissions and chamber data for hot- and cold-start UC chamber experiments with vehicles from the three LEV classes.(a) Median POA, primary PM (primary PM was not measured for LEV2-3.1), and(b) NMOG emissions measured in the CVS (filled circlesrepresent individual measurements). Median SOA production(a) during 21 cold-start UC chamber experiments after 3 h of photooxidation(“SOA (3 h)”) and after 5× 10⁶ molecules cm−3 h of OH exposure (LEV1-2.1 and high-emitter (LEV1-6) outliers were removed).(c)MedianOH exposures after 3 h of photooxidation.(d) Median ratios of SOA to primary PM and SOA to POA after 5× 10⁶ molecules cm−3 h ofOH exposure. The dashed horizontal line in(d) represents 1 : 1.(e) Median ratios of SOA (5× 10⁶ molecules cm−3 h of OH exposure) toCO. Error bars represent uncertainty/variability propagated through all measured variables. Only one experiment is shown (no error bar) forthe hot-start SOA-to-POA ratio. Error bars for other SOA-to-POA ratios are not included; they are large due to several experiments withextremely low POA emissions.
3.2 Effects of vehicle age and hot and cold start onSOA formation
Important objectives of the test plan were to investigate theinfluence of driving cycle (hot versus cold start) and vehi-cle age on SOA formation and to quantify the relative im-portance of SOA formation to primary PM emissions. In or-der to make consistent comparisons across the entire set ofexperiments, Fig. 6 presents the SOA data on a mass-of-fuel-burned basis and as ratios of SOA to primary PM mass,SOA to POA and SOA to CO for comparison with ambi-ent OA measurements. (One cannot simply compare the end-of-experiment SOA concentration data in Fig. 5 because of
experiment-to-experiment differences in dilution.) Figure 6presents data for the median cold-start experiment for eachvehicle class (pre-LEV, LEV1, LEV2) and for the medianhot-start experiment. The trends in the median data reflectthose of the entire test fleet. The SOA data were measured at(1) the end of the experiment (“SOA (3 h)”, after 3 h of pho-tooxidation) and (2) after 5× 10⁶ molecules cm−3 h of OHexposure ("SOA"). (Figure 6d, e use the SOA measurementstaken after 5× 10⁶ molecules cm−3 h of OH exposure.) Theprimary emissions (CVS POA and primary PM) data weremeasured in the CVS. The SOA data in Fig. 6 have beencorrected for the average end-of-experiment SOA formation
Atmos. Chem. Phys., 14, 4661–4678, 2014 www.atmos-chem-phys.net/14/4661/2014/

T. D. Gordon et al.: SOA formation exceeds primary PM emissions for gasoline vehicles 4671
measured in the two blank and nine DPF-equipped vehicleexperiments. (Figure 5a plots the measured SOA concentra-tions without any blank SOA correction.)
Figure 6a indicates that the median SOA mass (per massof fuel burned) formed during the median hot-start experi-ment was only 22, 37 and 70 % of that formed during me-dian cold-start pre-LEV, LEV1 and LEV2 experiments (after5× 106 molecules cm−3 h of OH exposure), respectively. Itis well known that significant emissions occur during coldstart before the catalyst has become active. For example, thehot-start NMOG emissions for vehicle LEV1-2 were a factorof 7 lower than the cold-start emissions for this vehicle. How-ever, this reduction in NMOG emissions was larger than thereduction in SOA formation (hot-start SOA was only a factorof 2 lower than cold-start SOA), underscoring the fact thatthere is not a one-to-one relationship between these param-eters. This is not surprising since SOA precursors compriseonly a subset of the NMOG emissions (Fig. 3). The data sug-gest that catalyst warm-up is an important factor in control-ling the emissions of SOA precursors. Nordin et al. (2013)and Platt et al. (2013) also report substantial SOA formationfrom dilute cold-start LDGV emissions.
Figure 6 also shows that the median SOA production (mgkg-fuel−1) measured during the cold-start LEV2 experimentswas only a factor of 3 less than that measured during the me-dian pre-LEV experiment. Some reduction in SOA formationwas expected given the large differences in NMOG emis-sions. However, the reduction in SOA formation was muchless than the factor of 11 to 15 (based on median of entire testfleet and median of smog chamber experiments, respectively)difference in the NMOG emissions between these two vehi-cle classes (Fig. 3 shows medians of the larger test fleet of 63LDGVs from May et al. 2014), highlighting once again thecomplex relationship between NMOG emissions and SOAformation. The fact that relatively little SOA was formed inthe chamber blank, DPF-equipped vehicle, and hot-start ex-periments (Fig. 5) indicates that the unexpected similarity inthe SOA formation measured across the set of cold-start ex-periments was not simply due to contamination.
SOA production also depends on oxidant exposure andgas-particle partitioning. We investigated whether thesemechanisms influenced the conclusions about the trends inSOA formation. Increased oxidant exposure will generallylead to more SOA production (Lambe et al., 2012). Vehicleemissions are mainly comprised of saturated species, so OHis the most important oxidant. Figure 6c plots the medianOH exposure for the sets of chamber experiments (pre-LEV,LEV1, LEV2, hot start). The OH exposures for the hot- andcold-start experiments were similar (Table S1 in the Supple-ment). However, OH exposures were about 60 % higher dur-ing experiments with new, lower-emitting (LEV1 and LEV2)vehicles than during pre-LEV experiments (Table S1 in theSupplement). This was due to differences in VOC levels inthe chamber – higher VOC emissions reduced OH levels inthe pre-LEV experiments. Therefore, while the greater OH
exposure in the LEV1 and LEV2 experiments leads to en-hanced SOA formation, it would need to be a factor of 5higher (not just 60 %) to explain the similarity in the SOAformation across the different classes of vehicles. This isquantitatively demonstrated by the effective yield analysispresented later in the manuscript. Therefore, the similarityin SOA production across the set of LDGV tests was not dueto differences in OH exposure.
SOA production is influenced by gas-particle partitioning(Odum et al., 1996). Higher aerosol concentrations cause alarger fraction of the semivolatile organics to partition intothe condensed phase. However, this phenomenon does notexplain the similarity in the measured SOA production forthe different vehicle classes. The organic aerosol concentra-tions inside the chamber were lower during the experimentswith the newer, lower-emitting vehicles (LEV1 and LEV2)than the older, higher-emitting vehicles (pre-LEV). Thisshould increase (not decrease) the differences between theLEV2 and pre-LEV results; therefore, gas-particle partition-ing does not explain the discrepancy between NMOG emis-sions and the SOA production. Furthermore, the POA reduc-tion between hot- and cold-start experiments with LEV1 andLEV2 vehicles was relatively small (∼25 % for LEV1 and∼20 % for LEV2); therefore, gas-particle partitioning alonecannot explain the large SOA reduction observed during thehot-start experiments either.
To quantify the importance of SOA formation relative tothe primary PM emissions, Fig. 6d presents the ratios of theend-of-experiment, wall-loss-corrected SOA measured in thesmog chamber to both POA and gravimetric PM mass mea-sured in the CVS. After 5× 10⁶ molecules cm−3 h of OH ex-posure the PM concentrations inside the chamber during thecold-start LEV1 experiments were dominated by SOA (me-dian SOA / POA ratio of 15; median SOA / primary PM ratioof 5), and the LEV2 SOA / POA ratio was about 8. For thepre-LEV vehicles, the cold-start end-of-experiment SOA lev-els were similar to the primary PM and POA emissions mea-sured in the CVS. Figure 6d indicates that SOA was approx-imately equal to primary PM for hot-start experiments. SOAwas about a factor of 3 greater than POA for the LEV1-2.3hot-start experiment. In essentially every experiment, SOAwas either comparable to or larger than primary PM (or POA)after equal OH exposure. After 3 h of photooxidation SOAwas the dominant component of the PM in the chamber. Therelative contribution of SOA would likely continue to in-crease with further oxidation (de Gouw et al., 2005).
The ratios plotted in Fig. 6d are relative to primary PMand POA measured in the CVS. This is a useful compari-son since CVS data are widely used in emissions inventoriesand models. However, gas-particle partitioning experimentsconducted as part of this project indicate that the primaryPM emissions measured in the CVS are biased high relativeto the more dilute atmosphere (May et al., 2013b). The par-ticle concentrations in the CVS were almost always muchhigher (a factor of 10 or more) than the ambient, biasing the
www.atmos-chem-phys.net/14/4661/2014/ Atmos. Chem. Phys., 14, 4661–4678, 2014

4672 T. D. Gordon et al.: SOA formation exceeds primary PM emissions for gasoline vehicles
0%
50%
100%
150%
200%
250%
0%
50%
100%
150%
200%
250%
effec
tive
SOA
yiel
d
vehicle.expt#
speciated SOA precursors
speciatd SOA precursors + unspeciated NMOG
medianspre-LEV hot startLEV-1 LEV-2
pre-LEV LEV-1 LEV-2
vaporizedgasolinepre-LEV
0%
5%
Fig. 7. Two different effective SOA yield estimates (after 3 h of photooxidation) for pre-LEV, LEV1 and LEV2 light-duty gasoline vehicles(n = 25). The grey bars represent yields assuming only traditional (speciated) SOA precursors; the red bars also include unspeciated NMOGin the effective yield calculations. The braces indicate nine sets of duplicate experiments. Hot-start and normal UC driving cycle experimentswere performed with two vehicles (LEV1-2 and LEV2-3), denoted by the horizontal and diagonal black lines inside of the bars, respectively.Median (± 1σ ) effective SOA yields for the three LEV classes are shown on the right side. The inset compares the SOA yield for vaporizedgasoline (error bar represents the range of values measured for 1 µg m−3 < Coa< 10 µg m−3) from Jathar et al. (2013) with the yield fromthe pre-LEV emissions. Multiple experiments with the same vehicle were averaged before medians were calculated.
gas-particle partitioning of semivolatile organics towards theparticle phase. The amount of partitioning bias varies fromvehicle to vehicle depending on emission rate and CVS flow,but accounting for it would, on average, increase the ratiosplotted in Fig. 6d by a factor of 2 or more.
The median ratios of SOA to CO are plotted in Fig. 6d.This metric is commonly used to evaluate atmospheric SOAproduction (de Gouw et al., 2005). For the vehicles testedhere, the SOA to CO ratios are less than that measured in theatmosphere at a comparable OH exposure.
3.3 Effective SOA yields and SOA mass closure
Since the exhaust gas concentrations in the chamber werehigher than typical atmospheric levels, the absolute massconcentration of SOA formed in the chamber plotted in Fig. 5cannot be directly translated to the atmosphere. Therefore,we calculated an effective SOA yield, which quantifies thepercentage of the organic emissions that must be convertedto SOA in order to explain the chamber data.
Y =MSOA∑
MVOCreacted
=MSOA∑(
MVOCi
)·(1− exp(−ki [OH] t))
,
whereY is the effective SOA yield,MSOA is the mass ofSOA produced,t is photooxidation time,MVOCi andki arethe mass at timet and OH reaction rate of theith VOC, and[OH] is the OH radical concentration. A SOA yield is theratio of the measured SOA mass to the mass of reacted or-ganic precursors; it is a standard measure of SOA productionin smog chambers (Odum et al., 1996; Donahue et al., 2006).We use the term “effective” yield because LDGV exhaust is
comprised of a complex mix of species; only a subset of thesespecies was quantifiable by GC analysis. Therefore, we canonly estimate the mass of reacted organic precursors. Effec-tive SOA yields were based on SOA measured after 3 h ofphotooxidation; since OH exposure is intrinsic to the yieldcalculation, variation in SOA production due to differing OHexposure between experiments is accounted for.
Figure 7 plots two different effective yield estimates, eachbased on different components of the NMOG emissions.First we calculated an effective SOA yield accounting for thespeciated compounds that are known SOA precursors (“spe-ciated SOA precursors”). This analysis considered 75 com-pounds (see Table S5 in the Supplement), including single-ring aromatics (C6 to C12) and mid-weight VOCs (C9 toC12). In sum these compounds contribute about 20 % of thetotal NMOG emissions for the newer vehicles (LEV1 andLEV2) (Fig. 3). These compounds are commonly included inSOA models (Heald et al., 2005; Hennigan et al., 2011; Mira-colo et al., 2010, 2011; Vutukuru et al., 2006). The reactedmass of each precursor was calculated from its initial concen-tration (inferred from the CVS measurements), the OH expo-sure in the chamber and published reaction rate constants foreach species with OH (see Table S5 in the Supplement).
Figure 7 indicates that for the pre-LEV vehicles the ef-fective yield for speciated precursors was 2–12 % (depend-ing on experiment). In other words, 2–12 % of the mass ofreacted speciated SOA precursors listed in Table S5 in theSupplement must form SOA to explain pre-LEV smog cham-ber data. This is comparable to published yields for single-ring aromatics,n-alkanes, and other SOA precursors found
Atmos. Chem. Phys., 14, 4661–4678, 2014 www.atmos-chem-phys.net/14/4661/2014/

T. D. Gordon et al.: SOA formation exceeds primary PM emissions for gasoline vehicles 4673
in vehicle exhaust (Hildebrandt et al., 2009; Ng et al., 2007;Presto et al., 2010; Tkacik et al., 2012). Therefore oxidationof the speciated precursors can explain the pre-LEV SOAdata.
However, Fig. 7 indicates the effective yield for speciatedprecursors would need to be 32 and 128 % to explain themedian LEV1 and LEV2 experiments, respectively. This ismuch higher than the published yields for most speciated pre-cursors at the relatively low organic aerosol concentrations(< 10 µg m−3) inside the chamber (Table S1 in the Supple-ment). Therefore, it seems unlikely that the speciated precur-sors alone can explain the LEV1 and LEV2 chamber data.The only exceptions are one LEV1 and one LEV2 vehiclethat had realistic (and repeatable) low yields.
Other studies report that speciated SOA precursors can-not explain the SOA formation from emissions from wood,diesel and jet fuel combustion (Weitkamp et al., 2007;Grieshop et al., 2009; Miracolo et al., 2011). SOA modelsbased only on speciated precursors also systematically un-derpredict ambient SOA levels (de Gouw et al., 2005; Healdet al., 2005; Volkamer et al., 2006), especially in photochem-ical episodes (Vutukuru et al., 2006). Robinson et al. (2007)hypothesized that unspeciated, lower-volatility compoundsare important SOA precursors. For example, Fig. 3 indicatesthat about 30 % of the LEV1 and LEV2 NMOG emissionswere not speciated (versus only 12 % for the median pre-LEV vehicle). These unspeciated emissions are likely a com-bination of higher molecular weight or more polar speciesthat were not quantified by the GC used in this study. Thislevel of speciation is similar to previous studies (Schauer etal., 2002). Unspeciated NMOG emissions are not typicallyincluded in models and inventories.
To evaluate the potential contribution of the unspeciatedNMOG to SOA formation, we calculated effective yield es-timates accounting for both the speciated SOA precursorsand unspeciated emissions. The reacted mass of the speci-ated precursors was calculated as described previously. Tocalculate the reacted mass of the unspeciated NMOG, we as-sumed that the unspeciated organics react with OH at 2× 10–11 cm3 molecule−1 s−1, which is representative of publishedkinetic data for large saturated alkanes (Atkinson and Arey,2003). Figure 7 indicates that including unspeciated NMOGin the analysis reduces the effective yields to 1–2 % for pre-LEV, 3–30 % for LEV1 and 3–46 % for LEV2. The LEV1and LEV2 yields are reasonably consistent with data fromsingle-compound smog chamber experiments (Hildebrandtet al., 2009; Ng et al., 2007; Presto et al., 2010; Tkacik etal., 2012), but the pre-LEV yields are on the low end of thesingle-compound data.
The effective yield analysis presented in Fig. 7 indicatesthat unspeciated NMOG emissions are an important classof precursors in LDGV emissions, especially for LEV1 andLEV2 vehicles. In fact, the oxidation of unspeciated NMOGemissions appears to contribute the majority of the SOA for-mation in the cold-start LEV1 and LEV2 experiments. Fur-
thermore, the trends in effective yields plotted in Fig. 7 sug-gest that the mix of organic vapors emitted by newer vehicleswas more efficient (higher yielding) in producing SOA thanthe emissions from older vehicles.
The effective yield estimates are sensitive to OH exposureand assumed reactivity for the unspeciated NMOG. Sensi-tivity analysis indicates that the combination of the uncer-tainty in OH exposure and reactivity could change the effec-tive yields by a factor of 2 to 3. However it is unlikely thatthis uncertainty would influence the relative trends in effec-tive yields between different classes of vehicles.
4 Discussion and conclusions
To develop effective control strategies we must understandthe overall contribution of emissions from motor vehiclesto ambient PM – both primary particle emissions and sec-ondary PM formed in the atmosphere. The primary PM andSOA data from these LDGV experiments are summarized inFig. 8, which plots the median EC and POA emissions mea-sured in the CVS and the median SOA formed in the smogchamber. The primary PM data shown in Fig. 6 constitute asubset (only the chamber vehicles) of the primary PM datain Fig. 8; therefore, medians in the two figures are not thesame. The total height of the bars provides an estimate of thecontribution of the emissions to different types of PM after3 h of photooxidation. The median EC and POA values werecalculated using the entire vehicle fleet (63 LDGVs; May etal., 2014), while SOA medians are calculated from the sub-set of these vehicles used in chamber experiments. Data fromthe larger fleet shown in Fig. 2 indicate that LEV1 and LEV2vehicles have similar primary PM emissions.
Figure 8 indicates that 3 h of photooxidation of LDGV di-lute emissions in a smog chamber produced large amountsof SOA on both an absolute mass basis and in comparisonto primary PM emissions. (This result and the qualitativepatterns do not differ when SOA measured after equal OHexposure is used in Fig. 8 instead.) In fact, SOA formationfrom LDGV exhaust will likely exceed its direct contribu-tion to ambient PM, especially for newer vehicles. During ex-periments with LEV1 and LEV2 LDGVs, the mass of SOAformed in the smog chamber was 3 to 4 times greater thanthe mass of primary PM emissions measured in the CVS.For the pre-LEV vehicles, the mass of SOA formed in thesmog chamber was∼75 % greater than primary PM emis-sions. However, there was no evidence that SOA productionwas completed after 3 h of photooxidation (i.e., SOA wasstill being produced at the end of the experiments). Otherstudies have shown that SOA production downwind of ur-ban areas may persist for 48 h (de Gouw et al., 2005, 2008).Therefore, the smog chamber data may underestimate the ul-timate production of SOA from LDGV exhaust. This con-clusion is qualitatively consistent with many ambient studies
www.atmos-chem-phys.net/14/4661/2014/ Atmos. Chem. Phys., 14, 4661–4678, 2014

4674 T. D. Gordon et al.: SOA formation exceeds primary PM emissions for gasoline vehicles
0
10
20
30
pre-LEV LEV I LEV II HDDV(DPF)
HDDV(no DPF)
emission source
50
250
450
650
850SOA
POA
EC
mg
kg-fu
el-1
gasoline: n=82 (63 vehicles)diesel: n=19 (5 vehicles)
gasoline: n=82 (63 vehicles)diesel: n=19 (5 vehicles)
gasoline: n=18 (14 vehicles)diesel: n=19 (5 vehicles)
Fig. 8. Median EC, POA (in CVS) and SOA from light-duty gaso-line vehicles (LDGVs) and heavy-duty diesel vehicles (HDDVs).LDGV data were obtained during cold-start UC driving cycle ex-periments with a single CA summertime gasoline. HDDV data wereobtained during UDDS driving cycle experiments with 3 differenttypes of ULSD fuel (Gordon et al., 2013a). Median SOA values arecalculated from the averages obtained by applying theω = 0 andω = 1 wall-loss correction approaches. Error bars represent± 1σ .
that report significant concentrations of SOA, even in urbanareas (Jimenez et al., 2009).
Although tightening regulations have significantly reducedemissions of regulated primary pollutants (for example,Fig. 2 highlights the dramatic reductions in NMOG emis-sions from pre-LEV to LEV1 to LEV2 vehicles), the samemay not be true for PM. In fact, Fig. 8 suggests that forLDGVs manufactured over the last 20 years (LEV1 andLEV2 vehicles) there may not have been much reduction intheir contribution to ambient PM. This is not surprising; sinceLEV1 vehicles already met the LEV2 PM emissions stan-dard, changes to engine control/aftertreatment from LEV1 toLEV2 were not aimed at reducing PM (or the nonvolatile par-ticles – EC). Some fraction of semivolatile particles may beremoved by the catalyst (note the downward trend in POAemissions in Fig. 2b), but the removal efficiency is not wellunderstood.
Newer (LEV1 and LEV2) vehicles produced less SOAthan older (pre-LEV) vehicles (per mass of fuel burned), butthe differences were much smaller than the order of mag-nitude reduction in NMOG emissions. Therefore trends inSOA production appear to be more similar to the primaryPM emissions than the NMOG emissions. This highlightsthe complex, nonlinear relationship between NMOG emis-
sions and SOA formation, which is not surprising given thatonly a subset of the NMOG emissions are SOA precursors.
While further study will be required to fully elucidate thecauses of the unexpected difference between the reductionsof NMOG and SOA for the different LEV classes, we stressthat this result is not due primarily to exogenous NMOGsources (e.g., from the transfer line or the propene used toadjust VOC / NOx ratios) in our experiments. Control exper-iments in which the chamber was injected with (1) clean airinstead of vehicle exhaust (i.e., dynamic blank experiments)and (2) exhaust from diesel vehicles emitting subambient(below the minimum detection limit of our instruments) par-ticle and NMOG concentrations produced very little SOA,demonstrating that the SOA production observed during thechamber experiments was due to vehicle exhaust.
Several factors could explain the unexpected differencebetween the reductions of NMOG and SOA for the differentLEV classes. In general, components of the vehicle systemupstream (engine controls) and downstream (catalyst tech-nologies) of the actual fuel combustion site play crucial rolesin determining what is emitted from the tailpipe; thus, evenwhen identical fuels are burned in different vehicles (as in thepresent study), there is no reason to expect that the emissionsprofiles should be identical.
Two changes to emission controls during the 1990s (i.e.,between pre-LEV and LEV1) could have some impact on thespecific NMOGs emitted by different vehicles: spark retardand catalyst formulation. Spark retard, first used extensivelywith LEV1 vehicles, was introduced to increase the cata-lyst warm-up rate, but this technique can change the mix ofNMOGs emitted during the warm-up period (Lupescu, 2009;Russ, 1999). The higher temperature can lower the amount ofunburned fuel released, but especially at extensive spark re-tard it can also increase the amount of partially burned fuel(potentially increasing the unspeciated fraction). In addition,during this same time period (pre-LEV to LEV1 transition)Pd began to replace Pt as the main active metal in automo-tive catalysts. This shift in control technology could also alterthe mix of NMOGs emitted from newer vehicles (Kummer,1975; McCabe, 1992). In particular, the catalytic capabilityof Pt and Pd may differ depending on whether or not theNMOGs have double bonds.
Furthermore, catalysts are optimized to reduce emissionsof regulated pollutants (NOx, NMOG, and CO), not SOAprecursors. Catalysts are typically developed using surrogateemissions comprised of small hydrocarbons, such as propene– many of which do not produce SOA in the atmosphere.
In addition to these two intrinsic differences (spark re-tard and catalyst formulation) among the vehicles stud-ied, it is also possible that an artifact of our analy-sis could explain the difference between the reductionsof NMOG and SOA for the different LEV classes. OurNMOG classification scheme (SOA precursor, nonprecur-sor, unspeciated) is coarse, and compounds within theSOA precursor class have a wide range of reaction rates
Atmos. Chem. Phys., 14, 4661–4678, 2014 www.atmos-chem-phys.net/14/4661/2014/
T. D. Gordon et al.: SOA formation exceeds primary PM emissions for gasoline vehicles 4675
with OH (minimumkOH = 1.14× 10⁻¹³, maximumkOH =
5.8× 10⁻¹¹ cm3 molecule−1 s−1). Thus if among two vehi-cles with identical masses of SOA precursor emissions onevehicle’s SOA precursor emissions include a larger share ofcompounds with fast reaction rates, that vehicle should havea greater yield than the other. To investigate this possibil-ity, the emissions of individual NMOG species were plot-ted (pre-LEV vs. LEV1, LEV1 vs. LEV2 and pre-LEV vs.LEV2) on log–log axes in Fig. S6 in the Supplement. Pointsabove (below) the trendlines in Fig. S6 in the Supplementindicate species that were reduced less (more) than the ma-jority of the other species. Although a few species are biasedabove and below the trendlines, these are generally not rel-evant to first generation SOA production. For example, theclear outlier at (x = 5.27, y = 1.39) in Fig. S6c in the Sup-plement represents propane. Important SOA precursors suchas benzene and xylene are clustered around the trendline, in-dicating no bias. The absence of any clear bias from knownSOA precursors supports the conclusion that the unexpect-edly small reduction in SOA production for newer vehiclesis due to photooxidation of unspeciated (presumably high-molecular-weight) compounds rather than those detected bythe GC.
Much less SOA formation was measured in hot-start com-pared to cold-start tests. Therefore, catalyst warm-up appearsto be an important factor in controlling the emissions of SOAprecursors from LDGVs. But, again, the reductions in SOAformation during the hot-start tests were less than the reduc-tion in NMOG emissions.
Figure 8 also compares the LDGV to hot-start experimentsconducted as part of this project with three HDDVs (Gordonet al., 2013a). The lowest primary PM emissions and SOAformation were measured for the DPF-equipped HDDVs.Therefore, catalyzed DPFs appear to be a very effective con-trol technology. The highest primary PM emissions and sub-stantial SOA formation (comparable to the LDGVs on a fuelbasis) were measured for non-DPF-equipped HDDVs. Theprimary PM emissions from the non-DPF-equipped dieselswere mainly EC. Figure 8 presents the data from the per-spective of an individual vehicle; in the United States thereare substantially more LDGVs than HDDVs.
The conclusions in this work are based on smog cham-ber experiments. It is impossible to exactly reproduce atmo-spheric conditions inside a smog chamber; therefore, caremust be exercised in extrapolating results from smog cham-ber experiments to the atmosphere. For example, it is not ap-propriate to simply translate the wall-loss-corrected concen-trations plotted in Fig. 5 to the atmosphere. The major goalsof these experiments were to quantify the fraction of LDGVemissions (yield) that form SOA and to assess the relativeimportance of primary PM emissions versus SOA formation.
The experiments were designed to investigate relativelyfresh SOA, similar to what might be formed in urban en-vironments (modest OH exposures, relatively high NOx, andmoderate organic aerosol concentrations). This was done by
matching key parameters known to strongly influence SOAproduction, such as PM concentrations and VOC / NOx ra-tios, to urban-like values. For example, PM levels inside thechamber were maintained between 2 and 20 µg m−3; there-fore, gas-particle partitioning of semivolatile organics shouldbe similar to that found in urban settings. We also addedpropene (which is not a SOA precursor; Kroll and Seinfeld,2008) to the chamber to adjust the VOC / NOx ratio to matcha typical urban level∼3 : 1 ppbC ppbNO−1
x . This helps en-sure that the important radical branching channels such as thefate of organoperoxy radicals (RO2) are similar to those inthe atmosphere (Presto et al., 2005; Lim and Ziemann, 2009;Ng et al., 2007). However, other parameters were outside typ-ical atmospheric ranges. Mixing ratios of individual organicgases and NOx were generally higher than typical urban lev-els, and the mix of organics inside the chamber (gasoline ex-haust+ propene) was different than that in the atmosphere.Fortunately, SOA yields are thought to be less sensitive to ab-solute concentrations, especially if the organic aerosol levelsin the chamber are atmospherically relevant. To the extentthat the product distribution of the organic oxidation reac-tions differs from the atmosphere, these differences will in-fluence SOA formation.
Except for the oldest (pre-LEV) vehicles, SOA produc-tion could not be fully explained by speciated (traditional)SOA precursors. However, about 30 % of the NMOG emis-sions from LEV1 and LEV2 vehicles could not be speciated.These unspeciated emissions appear to be important SOAprecursors, likely forming the majority of the SOA in exper-iments performed with LEV1 and LEV2 vehicles. Given theunexpected finding that the gas-phase emissions from newer,LEV2 vehicles are more efficient at producing SOA thanemissions from older, pre-LEV vehicles, future studies elu-cidating the nature of these precursors are needed to advancethe development of next-generation SOA models and emis-sions control strategies.
Supplementary material related to this article isavailable online athttp://www.atmos-chem-phys.net/14/4661/2014/acp-14-4661-2014-supplement.pdf.
Acknowledgements.This research would not have been possiblewithout the hard work of the excellent and dedicated staff at the Cal-ifornia Air Resources Board’s Haagen-Smit Laboratory. Fundingwas provided by the US Environmental Protection Agency NationalCenter for Environmental Research (NCER) through the STAR pro-gram (R833748), the National Science Foundation’s Graduate Re-search Fellowship Program and the Coordinating Research Councilthrough project no. A-74/E-96. The California Air Resources Boardprovided significant in-kind support, including vehicle recruitment,vehicle testing, and sample analysis. The views, opinions, and/orfindings contained in this paper are those of the authors and shouldnot be construed as an official position of the funding agencies.
www.atmos-chem-phys.net/14/4661/2014/ Atmos. Chem. Phys., 14, 4661–4678, 2014

4676 T. D. Gordon et al.: SOA formation exceeds primary PM emissions for gasoline vehicles
Edited by: L. M. Russell
References
Allan, J. D., Delia, A. E., Coe, H., Bower, K. N., Alfarra, M. R.,Jimenez, J. L., Middlebrook, A. M., Drewnick, F., Onasch, T. B.,and Canagaratna, M. R.: A generalised method for the extractionof chemically resolved mass spectra from Aerodyne aerosol massspectrometer data, J. Aerosol Sci., 35, 909–922, 2004.
Atkinson, R. and Arey, J.: Atmospheric degradation of volatile or-ganic compounds, Chem. Rev., 103, 4605–4638, 2003.
California Air Resources Board: S.O.P. MLD 119: Procedure for theDirect Determination of Total Non-Methane Hydrocarbons andMethane in Motor Vehicle Exhaust Using Cryogenic Preconcen-tration and Flame Ionization Detection,http://www.arb.ca.gov/testmeth/slb/sop119.pdf(last access: 14 April 2014), 2001.
California Air Resources Board: S.O.P. MLD 102/103: ProcedureFor The Determination Of C2 To C12 Hydrocarbons In Automo-tive Exhaust Samples By Gas Chromatography,http://www.arb.ca.gov/testmeth/slb/sop102-103v2-2.pdf(last access: 14 April2014), 2004.
California Air Resources Board: S.O.P. MLD 104: Determinationof Aldehyde and KetoneCompounds in Automotive Source Sam-ples by High Performance Liquid Chromatography,www.arb.ca.gov/testmeth/slb/sop104v3.pdf(last access: 14 April 2014),2006.
Chirico, R., DeCarlo, P. F., Heringa, M. F., Tritscher, T., Richter,R., Prévôt, A. S. H., Dommen, J., Weingartner, E., Wehrle, G.,Gysel, M., Laborde, M., and Baltensperger, U.: Impact of af-tertreatment devices on primary emissions and secondary or-ganic aerosol formation potential from in-use diesel vehicles: re-sults from smog chamber experiments, Atmos. Chem. Phys., 10,11545–11563, doi:10.5194/acp-10-11545-2010, 2010.
Chow, J., Watson, J., Pritchett, L., Pierson, W., Frazier, C., andPurcell, R.: The DRI thermal optical reflectance carbon analy-sis system – description, evaluation and applications in United-States air quality studies, Atmos. Environ. A-Gen., 27, 1185–1201, 1993.
de Gouw, J., Brock, C., Atlas, E., Bates, T., Fehsenfeld, F., Goldan,P., Holloway, J., Kuster, W., Lerner, B., and Matthew, B.:Sources of particulate matter in the northeastern United Statesin summer: 1. Direct emissions and secondary formation of or-ganic matter in urban plumes, J. Geophys. Res., 113, D08301,doi:10.1029/2007JD009243, 2008.
de Gouw, J. A., Middlebrook, A. M., Warneke, C., Goldan, P.D., Kuster, W. C., Roberts, J. M., Fehsenfeld, F. C., Worsnop,D. R., Canagaratna, M. R., Pszenny, A. A. P., Keene, W. C.,Marchewka, M., Bertman, S. B., and Bates, T. S.: Budget of or-ganic carbon in a polluted atmosphere: Results from the NewEngland Air Quality Study in 2002, J. Geophys. Res., 110,D16305, doi:10.1029/2004JD005623, 2005.
Donahue, N., Robinson, A., Stanier, C., and Pandis, S.: Coupledpartitioning, dilution, and chemical aging of semivolatile organ-ics, Environ. Sci. Technol., 40, 2635–2643, 2006.
Dua, S., Hopke, P., and Raunemaa, T.: Hygroscopicity of dieselaerosols, Water Air Soil Pollut., 112, 247–257, 1999.
Farmer, D., Matsunaga, A., Docherty, K., Surratt, J., Seinfeld, J.,Ziemann, P., and Jimenez, J.: Response of an aerosol mass spec-trometer to organonitrates and organosulfates and implications
for atmospheric chemistry, P. Natl. Acad. Sci., 107, 6670–6675,doi:10.1073/pnas.0912340107, 2010.
Gordon, T. D., Presto, A. A., Nguyen, N. T., Robertson, W. H.,Na, K., Sahay, M., Zhang, M., Maddox, C., Rieger, P., Chat-topadhyay, S., Maldonado, H., Maricq, M., and Robinson, A.L.: Secondary Organic Aerosol Production from Diesel VehicleExhaust: Impact of Aftertreatment, Fuel Chemistry and Driv-ing Cycle, Atmos. Chem. Phys. Discuss., 13, 24223–24262,doi:10.5194/acpd-13-24223-2013, 2013a.
Gordon, T. D., Tkacik, D. S., Presto, A. A., Zhang, M., Jathar, S.H., Nguyen, N. T., Massetti, J., Truong, T., Cicero-Fernandez,P., Maddox, C., Rieger, P., Chattopadhyay, S., Maldonado, H.,Maricq, M. M., and Robinson, A. L.: Primary Gas- and Particle-Phase Emissions and Secondary Organic Aerosol Productionfrom Gasoline and Diesel Off-Road Engines, Environ. Sci. Tech-nol., 47 14137–14146, 2013b.
Grieshop, A. P., Logue, J. M., Donahue, N. M., and Robinson, A.L.: Laboratory investigation of photochemical oxidation of or-ganic aerosol from wood fires 1: measurement and simulation oforganic aerosol evolution, Atmos. Chem. Phys., 9, 1263–1277,doi:10.5194/acp-9-1263-2009, 2009.
Heald, C. L., Jacob, D. J., Park, R. J., Russell, L. M., Huebert, B.J., Seinfeld, J. H., Liao, H., and Weber, R. J.: A large organicaerosol source in the free troposphere missing from current mod-els, Geophys. Res. Lett., 32, 1–4, 2005.
Hennigan, C. J., Miracolo, M. A., Engelhart, G. J., May, A. A.,Presto, A. A., Lee, T., Sullivan, A. P., McMeeking, G. R., Coe,H., Wold, C. E., Hao, W.-M., Gilman, J. B., Kuster, W. C., deGouw, J., Schichtel, B. A., Collett Jr., J. L., Kreidenweis, S.M., and Robinson, A. L.: Chemical and physical transformationsof organic aerosol from the photo-oxidation of open biomassburning emissions in an environmental chamber, Atmos. Chem.Phys., 11, 7669–7686, doi:10.5194/acp-11-7669-2011, 2011.
Hildebrandt, L., Donahue, N. M., and Pandis, S. N.: High forma-tion of secondary organic aerosol from the photo-oxidation oftoluene, Atmos. Chem. Phys., 9, 2973–2986, doi:10.5194/acp-9-2973-2009, 2009.
Jathar, S. H., Miracolo, M. A., Tkacik, D. S., Adams, P. J.,and Robinson, A. L.: Secondary organic aerosol from photo-oxidation of evaporated fuel: Experimental results and implica-tions for aerosol formation from combustion emissions, Environ.Sci. Technol., 47, 12886–12893, 2013.
Jimenez, J. L., Canagaratna, M. R., Donahue, N. M., Prevot, A. S.H., Zhang, Q., Kroll, J. H., DeCarlo, P. F., Allan, J. D., Coe,H., Ng, N. L., Aiken, A. C., Docherty, K. S., Ulbrich, I. M.,Grieshop, A. P., Robinson, A. L., Duplissy, J., Smith, J. D., Wil-son, K. R., Lanz, V. A., Hueglin, C., Sun, Y. L., Tian, J., Laak-sonen, A., Raatikainen, T., Rautiainen, J., Vaattovaara, P., Ehn,M., Kulmala, M., Tomlinson, J. M., Collins, D. R., Cubison, M.J., E., Dunlea, J., Huffman, J. A., Onasch, T. B., Alfarra, M. R.,Williams, P. I., Bower, K., Kondo, Y., Schneider, J., Drewnick,F., Borrmann, S., Weimer, S., Demerjian, K., Salcedo, D., Cot-trell, L., Griffin, R., Takami, A., Miyoshi, T., Hatakeyama, S.,Shimono, A., Sun, J. Y., Zhang, Y. M., Dzepina, K., Kimmel,J. R., Sueper, D., Jayne, J. T., Herndon, S. C., Trimborn, A.M., Williams, L. R., Wood, E. C., Middlebrook, A. M., Kolb,C. E., Baltensperger, U., and Worsnop, D. R.: Evolution of Or-ganic Aerosols in the Atmosphere, Science, 326, 1525–1529,doi:10.1126/science.1180353, 2009.
Atmos. Chem. Phys., 14, 4661–4678, 2014 www.atmos-chem-phys.net/14/4661/2014/

T. D. Gordon et al.: SOA formation exceeds primary PM emissions for gasoline vehicles 4677
Kanakidou, M., Seinfeld, J. H., Pandis, S. N., Barnes, I., Dentener,F. J., Facchini, M. C., Van Dingenen, R., Ervens, B., Nenes, A.,Nielsen, C. J., Swietlicki, E., Putaud, J. P., Balkanski, Y., Fuzzi,S., Horth, J., Moortgat, G. K., Winterhalter, R., Myhre, C. E.L., Tsigaridis, K., Vignati, E., Stephanou, E. G., and Wilson,J.: Organic aerosol and global climate modelling: a review, At-mos. Chem. Phys., 5, 1053–1123, doi:10.5194/acp-5-1053-2005,2005.
Kirchstetter, T. W. and Novakov, T.: Controlled generation of blackcarbon particles from a diffusion flame and applications in eval-uating black carbon measurement methods, Atmos. Environ., 41,1874–1888, 2007.
Kroll, J. H. and Seinfeld, J. H.: Chemistry of secondary or-ganic aerosol: Formation and evolution of low-volatility or-ganics in the atmosphere, Atmos. Environ., 42, 3593–3624,doi:10.1016/j.atmosenv.2008.01.003, 2008.
Kummer, J.: Oxidation of CO and C 2 H 4 by base metal catalystsprepared on honeycomb supports. Adv. Chem. Ser., 143, p. 178,1975.
Lambe, A. T., Onasch, T. B., Croasdale, D. R., Wright, J. P., Martin,A. T., Franklin, J. P., Massoli, P., Kroll, 5 J. H., Canagaratna,M. R., and Brune, W. H.: Transitions from functionalization tofragmentation reactions of laboratory secondary organic aerosol(SOA) generated from the OH oxidation of alkane precursors,Environ. Sci. Technol., 46, 5430–5437, 2012.
Lim, Y. B. and Ziemann, P. J.: Chemistry of Secondary Or-ganic Aerosol Formation from OH Radical-Initiated Re-actions of Linear, Branched, and Cyclic Alkanes in thePresence of NOx, Aerosol Sci. Technol., 43, 604–619,doi:10.1080/02786820902802567, 2009.
Lipsky, E. M. and Robinson, A. L.: Effects of Dilution on Fine Par-ticle Mass and Partitioning of Semivolatile Organics in DieselExhaust and Wood Smoke, Environ. Sci. Technol., 40, 155–162,doi:10.1021/es050319p, 2006.
Lupescu J. A., Chanko T. B., Richert J. F., and Mauti, A. A.: TheEffect of Spark Timing on Engine–Out Hydrocarbon Speciationand Hydrocarbon Trap Performance. SAE Int., 01-1068, 2009.
Maricq, M. M., Chase, R. E., Podsiadlik, D. H., and Vogt, R.: Ve-hicle exhaust particle size distributions: a comparison of tailpipeand dilution tunnel measurements, SAE Transactions, 108, 721–732, 1999.
Matsunaga, A. and Ziemann, P. J.: Gas-Wall Partitioning of OrganicCompounds in a Teflon Film Chamber and Potential Effects onReaction Product and Aerosol Yield Measurements, Aerosol Sci.Technol., 44, 881–892, doi:10.1080/02786826.2010.501044,2010.
May, A. A., Presto, A. A., Hennigan, C. J., Nguyen, N. T., Gordon,T. D., and Robinson, A. L.: Gas-Particle Partitioning of PrimaryOrganic Aerosol Emissions: (2) Diesel Vehicles, Environ. Sci.Technol., 47, 8288–8296, doi:10.1021/es400782j, 2013a.
May, A. A., Presto, A. A., Hennigan, C. J., Nguyen, N. T., Gordon,T. D., and Robinson, A. L.: Gas-particle partitioning of primaryorganic aerosol emissions: (1) Gasoline vehicle exhaust, Atmos.Environ., 77, 128–139, doi:10.1016/j.atmosenv.2013.04.060,2013b.
May, A. A., Nguyen, N. T., Presto, A. A., Gordon, T. D., Lipsky,E. M., Karve, M., Gutierrez, A., Zhang, M., Pang, Y., Huang, S.,Fuentes, M., Vo, T., McCauley, E., Sax, T., Cicero-Fernandez,P., Massetti, J., Chen, S., Truong, T., Na, K., Long, J., Chang,
O., Robertson, W. H., Rieger, P., Ling, R., Maddox, C., Chat-topadhyay, S., Maldonado, H., Maricq, M. M., and Robinson, A.L.: Gas- and particle-phase primary emissions from in-use, on-road gasoline and diesel vehicles, Atmos. Environ., 88, 247–260,doi:10.1016/j.atmosenv.2014.01.046, 2014.
McCabe, R. W., Siegl, W. O., Chun, W., and Perry, J.: SpeciatedHydrocarbon Emissions from the Combustion of Single Compo-nent Fuels. II. Catalyst Effects. J. Air Waste Manage. Assoc., 42,1071–1077, 1992.
McMurry, P. H. and Grosjean, D.: Gas and aerosol wall losses inTeflon film smog chambers, Environ. Sci. Technol., 19, 1176–1182, doi:10.1021/es00142a006, 1985.
Miracolo, M. A., Presto, A. A., Lambe, A. T., Hennigan, C. J., Don-ahue, N. M., Kroll, J. H., Worsnop, D. R., and Robinson, A.L.: Photo-Oxidation of Low-Volatility Organics Found in Mo-tor Vehicle Emissions: Production and Chemical Evolution ofOrganic Aerosol Mass, Environ. Sci. Technol., 44, 1638–1643,doi:10.1021/es902635c, 2010.
Miracolo, M. A., Hennigan, C. J., 5 Ranjan, M., Nguyen, N. T.,Gordon, T. D., Lipsky, E. M., Presto, A. A., Donahue, N. M., andRobinson, A. L.: Secondary aerosol formation from photochem-ical aging of aircraft exhaust in a smog chamber, Atmos. Chem.Phys., 11, 4135–4147, doi:10.5194/acp-11-4135-2011, 2011.
Ng, N. L., Kroll, J. H., Chan, A. W. H., Chhabra, P. S., Flagan,R. C., and Seinfeld, J. H.: Secondary organic aerosol formationfrom m-xylene, toluene, and benzene, Atmos. Chem. Phys., 7,3909–3922, doi:10.5194/acp-7-3909-2007, 2007.
Nordin, E. Z., Eriksson, A. C., Roldin, P., Nilsson, P. T., Carlsson,J. E., Kajos, M. K., Hellén, H., Wittbom, C., Rissler, J., Löndahl,J., Swietlicki, E., Svenningsson, B., Bohgard, M., Kulmala, M.,Hallquist, M., and Pagels, J. H.: Secondary organic aerosol for-mation from idling gasoline passenger vehicle emissions investi-gated in a smog chamber, Atmos. Chem. Phys., 13, 6101–6116,doi:10.5194/acp-13-6101-2013, 2013.
Odum, J. R., Hoffmann, T., Bowman, F., Collins, D., Flagan, R.C., and Seinfeld, J. H.: Gas/Particle Partitioning and SecondaryOrganic Aerosol Yields, Environ. Sci. Technol., 30, 2580–2585,doi:10.1021/es950943, 1996.
Pisano, J., Durbin, T., Karavalakis, G., Collins, T., Huai, T., Ay-ala, A., Cicero-Fernandez, P., Zhang, M., Gutierrez, A., Huo, D.,and Vo, T.: Characterization of PM and PM Instruments for HighEmitting Light-Duty Gasoline Vehicles, SAE paper, 01, 2011.
Platt, S. M., El Haddad, I., Zardini, A. A., Clairotte, M., Astorga,C., Wolf, R., Slowik, J. G., Temime-Roussel, B., Marchand,N., Ježek, I., Drinovec, L., Mocnik, G., Möhler, O., Richter,R., Barmet, P., Bianchi, F., Baltensperger, U., and Prévôt, A.S. H.: Secondary organic aerosol formation from gasoline vehi-cle emissions in a new mobile environmental reaction chamber,Atmos. Chem. Phys., 13, 9141-9158, doi:10.5194/acp-13-9141-2013, 2013.
Presto, A. A., Huff Hartz, K. E., and Donahue, N. M.: SecondaryOrganic Aerosol Production from Terpene Ozonolysis. 2. Effectof NOx Concentration, Environ. Sci. Technol., 39, 7046–7054,doi:10.1021/es050400s, 2005.
Presto, A. A., Miracolo, M. A., Donahue, N. M., and Robinson,A. L.: Secondary Organic Aerosol Formation from High-NOxPhoto-Oxidation of Low Volatility Precursors: n-Alkanes, Envi-ron. Sci. Technol., 44, 2029–2034, doi:10.1021/es903712r, 2010.
www.atmos-chem-phys.net/14/4661/2014/ Atmos. Chem. Phys., 14, 4661–4678, 2014

4678 T. D. Gordon et al.: SOA formation exceeds primary PM emissions for gasoline vehicles
Robert, M. A., VanBergen, S., Kleeman, M. J., and Jakober, C. A.:Size and composition distributions of particulate matter emis-sions: part 1 – light-duty gasoline vehicles, J. Air Waste Manage.,57, 1414–1428, 2007.
Robinson, A. L., Donahue, N. M., Shrivastava, M. K., Weitkamp,E. A., Sage, A. M., Grieshop, A. P., Lane, T. E., Pierce, J. R.,and Pandis, S. N.: Rethinking organic aerosols: Semivolatileemissions and photochemical aging, Science, 315, 1259–1262,doi:10.1126/science.1133061, 2007.
Russ, S., Thiel, M., and Lavoie, G.:SI engine operation with re-tarded ignition: Part 2-HC emissions and oxidation, SAE Trans.,108, 1532–1538, 1999.
Samy, S. and Zielinska, B.: Secondary organic aerosol productionfrom modern diesel engine emissions, Atmos. Chem. Phys., 10,609–625, doi:10.5194/acp-10-609-2010, 2010.
Schauer, J. J., Kleeman, M. J., Cass, G. R., and Simoneit,B. R. T.: Measurement of Emissions from Air PollutionSources. 2. C1 through C30 Organic Compounds from MediumDuty Diesel Trucks, Environ. Sci. Technol., 33, 1578–1587,doi:10.1021/es980081n, 1999.
Schauer, J. J., Kleeman, M. J., Cass, G. R., and Simoneit,B. R. T.: Measurement of Emissions from Air PollutionSources. 5. C1–C32 Organic Compounds from Gasoline-Powered Motor Vehicles, Environ. Sci. Technol., 36, 1169–1180,doi:10.1021/es0108077, 2002.
Seinfeld, J. and Pandis, S. N.: From air pollution to climate change,Atmospheric Chemistry and Physics, 2nd Edn., p. 208, 1998.
Stone, E. A., Zhou, J., Snyder, D. C., Rutter, A. P., Mieritz, M., andSchauer, J. J.: A Comparison of Summertime Secondary OrganicAerosol Source Contributions at Contrasting Urban Locations,Environ. Sci. Technol., 43, 3448–3454, doi:10.1021/es8025209,2009.
Subramanian, R., Donahue, N. M., Bernardo-Bricker, A., Rogge,W. F., and Robinson, A. L.: Insights into the primary-secondaryand regional-local contributions to organic aerosol and PM2.5mass in Pittsburgh, Pennsylvania, Atmos. Environ., 41, 7414–7433, doi:10.1016/j.atmosenv.2007.05.058, 2007.
Tkacik, D. S., Presto, A. A., Donahue, N. M., and Robinson,A. L.: Secondary organic aerosol formation from intermediate-volatility organic compounds: cyclic, linear, and branched alka-nes, Environ. Sci. Technol., 46, 8773–8781, 2012.
Turpin, B. J., Saxena, P., and Andrews, E.: Measuring and sim-ulating particulate organics in the atmosphere: problems andprospects, Atmos. Environ., 34, 2983–3013, doi:10.1016/s1352-2310(99)00501-4, 2000.
Volkamer, R., Jimenez, J. L., San Martini, F., Dzepina, K., Zhang,Q., Salcedo, D., Molina, L. T., Worsnop, D. R., and Molina, M.J.: Secondary organic aerosol formation from anthro- pogenic airpollution: Rapid and higher than expected, Geophys. Res. Lett.,33, L17811, doi:10.1029/2006GL026899, 2006.
Vutukuru, S., Griffin, R. J., and Dabdub, D.: Simulation andanalysis of secondary organic aerosol dynamics in the SouthCoast Air Basin of California, J. Geophys. Res., 111, D10S12,doi:10.1029/2005JD006139, 2006.
Weingartner, E., Burtscher, H., and Baltensperger, U.: Hygroscopicproperties of carbon and diesel soot particles, Atmos. Environ.,31, 2311–2327, 1997.
Weitkamp, E., Sage, A., Pierce, J., Donahue, N., and Robinson,A.: Organic Aerosol Formation from Photochemical Oxidationof Diesel Exhaust in a Smog Chamber, Environ. Sci. Technol.,41, 6969–6975, 2007.
Atmos. Chem. Phys., 14, 4661–4678, 2014 www.atmos-chem-phys.net/14/4661/2014/