Embed Size (px)
Citation preview

Secondary Production of Secondary Production of Infaunal Benthic Communities in Infaunal Benthic Communities in Chesapeake Bay in Comparison Chesapeake Bay in Comparison
to Restored Oyster Reefsto Restored Oyster Reefs
Amanda Lawless and Dr. Rochelle SeitzAmanda Lawless and Dr. Rochelle Seitz
Virginia Institute of Marine Science, Virginia Institute of Marine Science, The College of William & MaryThe College of William & Mary
Gloucester Point, VAGloucester Point, VA
IntroductionIntroduction
Eastern Oyster, Eastern Oyster, Crassostrea virginicaCrassostrea virginica Ecologically and commercially important Ecologically and commercially important
in Chesapeake Bayin Chesapeake Bay
Over-harvesting, disease, Over-harvesting, disease, pollution, and loss of pollution, and loss of habitat have drastically habitat have drastically reduced the populationreduced the population
Reef restorationReef restoration
Chesapeake Bay Oyster Harvest (’53-’98)

Chesapeake BayChesapeake Bay
Lynnhaven Bay

Lynnhaven BayLynnhaven BayChesapeake Bay
Atla
ntic
Oce
an
Western Branch Eastern BranchLynnhaven River
Broad Bay
Linkhorn Bay
Characteristics:
Shallow
Tidal Influence
Temperature: 26-32°C
Salinity: 19-24 ppt

ObjectiveObjective
To compare the productivity of a lost To compare the productivity of a lost benthic community to the productivity of benthic community to the productivity of oysters on four types of oyster reefsoysters on four types of oyster reefs

Oyster ReefsOyster Reefs
Oyster Shell Reef
Module Reef
Rip Rap Reef
Reef Ball
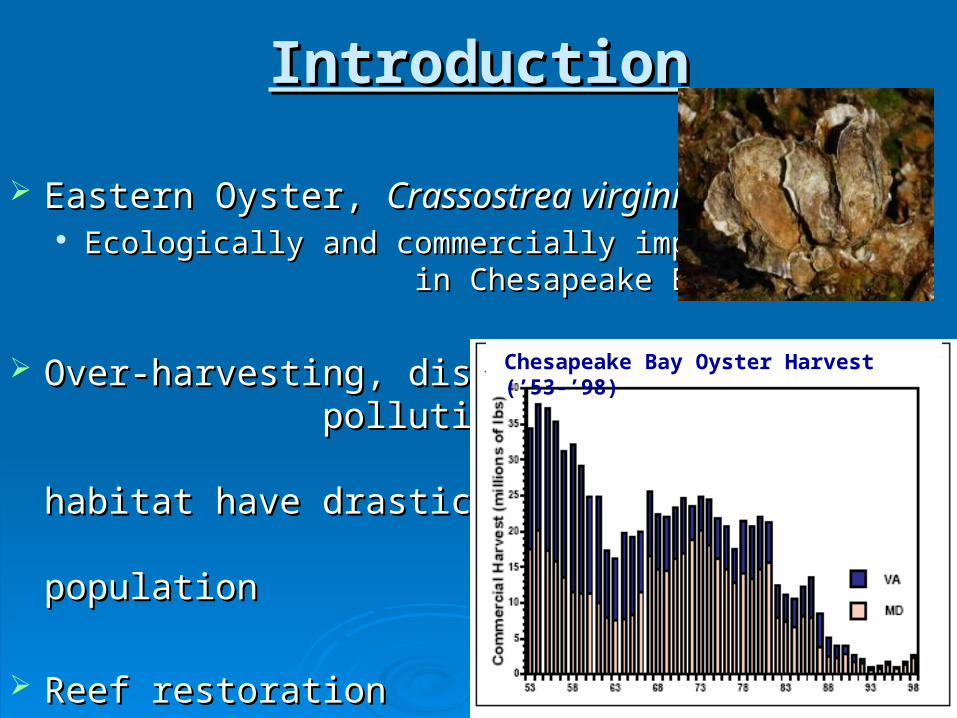
MethodsMethods Benthic SamplingBenthic Sampling
Macrofaunal suction (0.11 mMacrofaunal suction (0.11 m22 area to 40 cm depth)area to 40 cm depth)
Four random samples, prior to reef Four random samples, prior to reef deploymentdeployment
BivalvesBivalves Macoma balthicaMacoma balthica Tagelus plebeiusTagelus plebeius
Remaining InfaunaRemaining Infauna Estimated from previous samples Estimated from previous samples
in the Bay in the Bay • (Dauer 2000, 2002 sampling of Elizabeth River)(Dauer 2000, 2002 sampling of Elizabeth River)

Calculations - BenthosCalculations - Benthos Total Infaunal Biomass (g AFDW mTotal Infaunal Biomass (g AFDW m-2-2))
Bivalves – est. from length/weight regressionBivalves – est. from length/weight regression Remaining Infauna Remaining Infauna
• (Dauer 2000, 2002 sampling of Elizabeth River)(Dauer 2000, 2002 sampling of Elizabeth River)
Multiply by a range of published P:BMultiply by a range of published P:B• (Diaz and Schaffner 1990; Baird and Ulanowicz 1989)(Diaz and Schaffner 1990; Baird and Ulanowicz 1989)
Production of benthos (g AFDW mProduction of benthos (g AFDW m-2-2/yr)/yr)
Multiply by area of benthos lost per reef Multiply by area of benthos lost per reef type (g AFDW/yr)type (g AFDW/yr)

Calculations - OystersCalculations - Oysters Biomass of oysters (g AFDW mBiomass of oysters (g AFDW m-2-2))
Oyster shell – Fishermen’s Island, lower BayOyster shell – Fishermen’s Island, lower Bay• O’Beirn et al. 1999O’Beirn et al. 1999
Modules – Rappahannock RiverModules – Rappahannock River• Lipcius and Burke 2006Lipcius and Burke 2006
Rip rap – Lynnhaven systemRip rap – Lynnhaven system• Burke (in progress)Burke (in progress)
Reef balls – 90% module and 10% shellReef balls – 90% module and 10% shell
Multiply by a published P:BMultiply by a published P:B• Dame 1976; Bahr and Lanier 1981Dame 1976; Bahr and Lanier 1981
Production of oysters (g AFDW mProduction of oysters (g AFDW m-2-2/yr)/yr)
Multiply by area available for settlement per reef Multiply by area available for settlement per reef type (g AFDW/yr)type (g AFDW/yr)

Results - BenthosResults - BenthosSite Bivalve Biomass
(g AFDW m-2)Remaining Infauna
Biomass(g AFDW m-2)
P:B Production (g AFDW m-2/yr)
Eastern Branch
19.66 0.931 2.9 - 7.7
59.7 – 158.6
Linkhorn 9.73 0.931 2.9 - 7.7
30.9 – 36.9
Eastern Branch Linkhorn
Production (g AFDW m
-2/yr)
0
50
100
150
200
250
LowHigh

Results – OystersResults – OystersReefType
Biomass(g AFDW m-2)
P:B Production (g AFDW m-2/yr)
Area(m2)
Total Production(g AFDW/yr)
OysterShell
600 2.4 1440 0.656 945 * 3 = 2,835
Rip Rap 45.4 2.4 109 0.656 71.5 * 3 = 214.5
Module 13.7 2.4 32.9 4.3 141.5 * 3 = 424.5
Reef Ball 72.3 2.4 173.5 2.4 416.4 * 3 = 1,249
Shell Rip Rap Module Reef Ball
Production (g AFDW m
-2/yr)
0
100
200
300
1200
1300
1400
1500
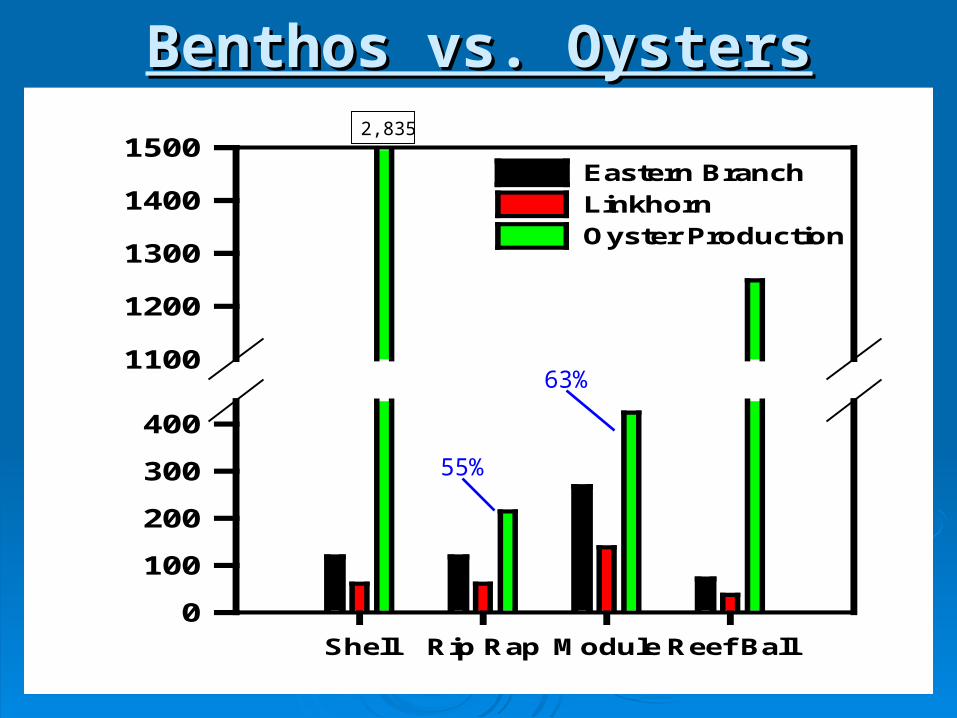
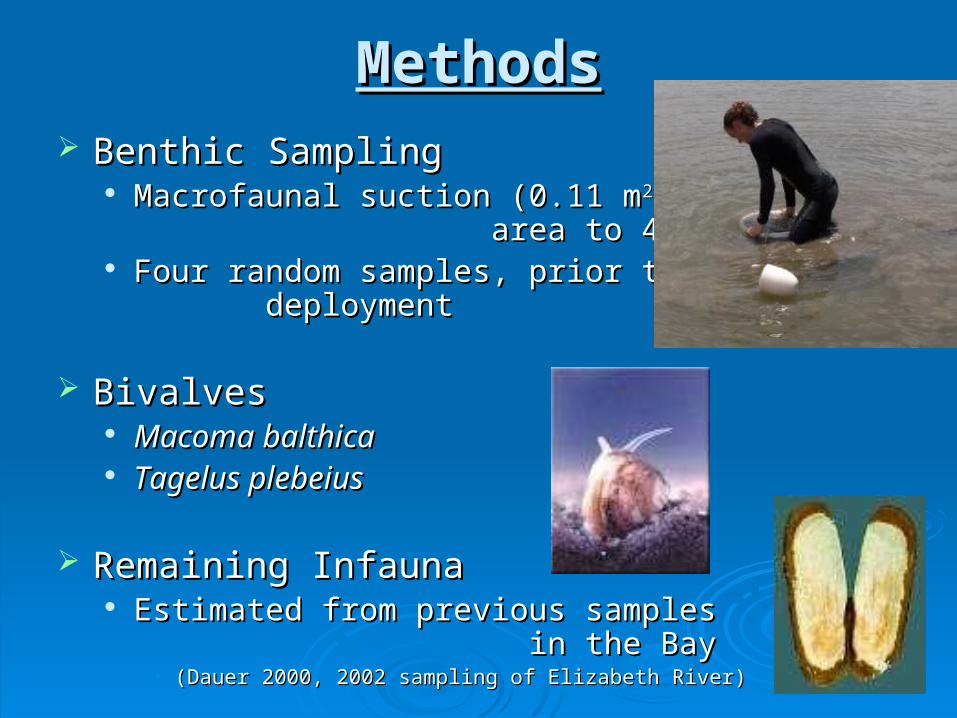
Benthos vs. OystersBenthos vs. Oysters
Shell Rip Rap Module Reef Ball
Production (g AFDW/yr)0
100
200
300
400
1100
1200
1300
1400
1500Eastern Branch Linkhorn Oyster Production
2,835
55%
63%
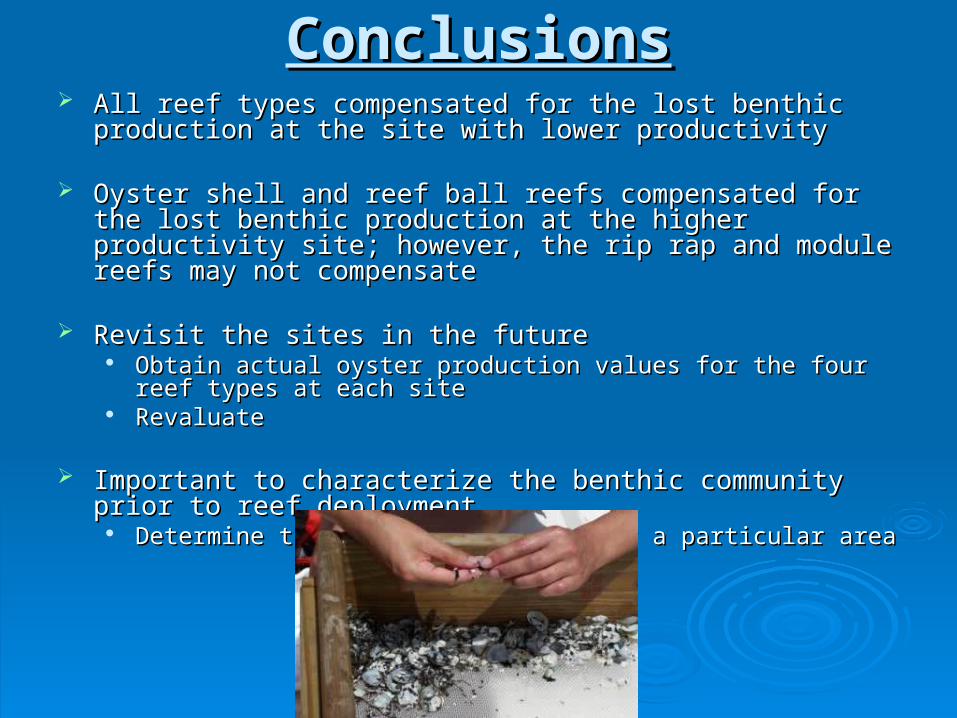
ConclusionsConclusions All reef types compensated for the lost benthic production at the site All reef types compensated for the lost benthic production at the site
with lower productivitywith lower productivity
Oyster shell and reef ball reefs compensated for the lost benthic Oyster shell and reef ball reefs compensated for the lost benthic production at the higher productivity site; however, the rip rap and production at the higher productivity site; however, the rip rap and module reefs may not compensate module reefs may not compensate
Revisit the sites in the futureRevisit the sites in the future Obtain actual oyster production values for the four reef types at each site Obtain actual oyster production values for the four reef types at each site RevaluateRevaluate
Important to characterize the benthic community prior to reef Important to characterize the benthic community prior to reef deployment deployment
Determine the best type of reef for a particular areaDetermine the best type of reef for a particular area

AcknowledgementsAcknowledgements
Dr. Rochelle Seitz, VIMSDr. Rochelle Seitz, VIMS Dr. Rom Lipcius, VIMSDr. Rom Lipcius, VIMS Community Ecology Group, VIMSCommunity Ecology Group, VIMS Marine Conservation Biology Group, VIMSMarine Conservation Biology Group, VIMS Chesapeake Bay FoundationChesapeake Bay Foundation US Army Corps of Engineers, Norfolk, VA OfficeUS Army Corps of Engineers, Norfolk, VA Office NOAA Chesapeake Bay OfficeNOAA Chesapeake Bay Office