Embed Size (px)
Citation preview

Senate Education, Health, Environmental Affairs Committee
PMT & Manure Transport Update Secretary Joe Bartenfelder
Assistant Secretary Hans Schmidt January 18, 2017

Phosphorus Management Tool (PMT)

Phosphorus Management Tool (PMT)
Four Significant Enhancements
1. Enact an immediate ban of additional phosphorus on soils highest in phosphorus based on a soil test.
2. Provide comprehensive information on soil phosphorus conditions statewide.
3. Ensure adequate time for farmers to fully understand and plan for new requirements.
4. Assure agricultural producers that critical elements are available for implementation.

Phosphorus Management Tool (PMT)
MD State Total Soil Phosphorus Data
1/11/2017
Total Regulated Acres 1,277,931
Total Acres Submitted 1,083,552
Percentage Reported 84.8%
Number of Fields Submitted 73,647
P FIV < 150 79.3%
P FIV 150-499 19.1%
P FIV > 500 1.6%

Phosphorus Management Tool (PMT)
1/17/2017 Soil Test P FIV <150 Soil Test P FIV 150 - 499 Soil Test P FIV > 500
County Total AIR Acres Reported 2014 Total Acres submitted % of County Reported Acres % of Acres Acres % of Acres Acres % of Acres
Western Maryland
Allegany 12,321.60 10,091.90 81.90% 9,532.40 94.46% 533.50 5.29% 26.00 0.26%
Carroll 94,462.98 75,820.42 80.26% 71,170.03 93.87% 4,518.49 5.96% 131.90 0.17%
Frederick 127,363.87 98,676.43 77.48% 87,356.65 88.53% 11,255.82 11.41% 63.96 0.06%
Garrett 39,478.24 28,256.97 71.58% 27,366.74 96.85% 865.23 3.06% 25.00 0.09%
Washington 80,805.27 60,444.35 74.80% 56,195.65 92.97% 4,231.05 7.00% 17.65 0.03%
Regional Total 354,431.96 273,290.07 77.11% 251,621.47 92.07% 21,404.09 7.83% 264.51 0.10%
Central Maryland
Baltimore 38,004.15 36,260.06 95.41% 34,301.08 94.60% 1,898.36 5.24% 60.62 0.17%
Harford 49,862.63 40,266.01 80.75% 36,673.58 91.08% 3,460.06 8.59% 132.37 0.33%
Howard 14,635.39 14,945.05 102.12% 13,677.85 91.52% 1,251.90 8.38% 15.30 0.10%
Montgomery 49,377.83 28,200.84 57.11% 27,245.45 96.61% 846.09 3.00% 109.30 0.39%
Regional Total 151,880.00 119,671.96 78.79% 111,897.96 93.50% 7,456.41 6.23% 317.59 0.27%
Southern Maryland
Anne Arundel 15,557.15 12,350.46 79.39% 8,985.77 72.76% 3,298.19 26.70% 66.50 0.54%
Prince Georges 12,069.75 10,366.24 85.89% 8,324.05 80.30% 2,008.19 19.37% 34.00 0.33%
Calvert 11,685.82 8,538.90 73.07% 5,689.50 66.63% 2,838.10 33.24% 11.30 0.13%
Charles 22,075.21 20,060.81 90.87% 15,912.21 79.32% 4,115.80 20.52% 32.80 0.16%
Saint Mary's 35,326.72 28,072.46 79.47% 21,093.96 75.14% 6,872.72 24.48% 105.78 0.38%
Regional Total 96,714.65 79,388.87 82.09% 60,005.49 75.58% 19,133.00 24.10% 250.38 0.32%
Upper Eastern Shore
Cecil 51,726.39 57,939.99 112.01% 54,216.06 93.57% 3,590.17 6.20% 133.76 0.23%
Kent 95,083.11 92,746.15 97.54% 85,129.51 91.79% 7,274.52 7.84% 342.12 0.37%
Queen Annes 125,814.99 112,972.15 89.79% 98,495.01 87.19% 14,357.72 12.71% 119.42 0.11%
Regional Total 272,624.49 263,658.29 96.71% 237,840.58 90.21% 25,222.41 9.57% 595.30 0.23%
Mid Eastern Shore
Talbot 69,783.22 65,560.26 93.95% 58,569.18 89.34% 6,932.68 10.57% 58.40 0.09%
Caroline 92,039.41 89,914.24 97.69% 58,434.75 64.99% 31,218.39 34.72% 261.10 0.29%
Dorchester 84,686.73 51,364.50 60.65% 38,036.64 74.05% 13,079.54 25.46% 248.32 0.48%
Regional Total 246,509.36 206,839.00 83.91% 155,040.57 74.96% 51,230.61 24.77% 567.82 0.27%
Lower Eastern Shore
Somerset 32,598.90 27,011.51 82.86% 5,875.77 21.75% 17,417.44 64.48% 3,718.30 13.77%
Wicomico 53,223.80 46,209.11 86.82% 15,473.65 33.49% 24,794.72 53.66% 5,940.00 12.85%
Worcester 69,947.75 67,482.73 96.48% 20,867.79 30.92% 40,595.72 60.16% 6,019.22 8.92%
Regional Total 155,770.45 140,703.35 90.33% 42,217.21 30.00% 82,807.88 58.85% 15,677.52 11.14%
MD State Total 1,277,930.91 1,083,551.54 84.79% 858,623 79.24% 207,254 19.13% 17,673.12 1.63%

Phosphorus Management Tool (PMT)
How It Works: Risk
** Could add time if services are not adequate.

Phosphorus Management Tool (PMT)
How It Works: Management
PMT Risk
Category
Transition Management
Phase I
Transition Management
Phase II PMT
LOW N-Based (not to exceed
3 Year Crop Removal3 Year Crop Removal 3 Year Crop Removal
MEDIUM3 Year Crop Removal 2 Year Crop Removal 1 Year Crop Removal
HIGH 1 Year Crop Removal
50% of 1 Year Crop
Removal
No Additional
Phosphorus

Phosphorus Management Tool (PMT)
•1,661 Operations have been reported •Represents one or more fields being 150 or greater
•Represents 11,769 fields
•Only these fields transition to PMT
•Represents 187,870 acres
• PMT Tier Groups •Tier A = 150 – 300 Avg FIV (Transitions 2020)
• 1,313 operations 8,220 fields 122,705 acres
•Tier B = 300 – 450 Avg FIV (Transitions 2019)
• 252 operations 2,815 fields 54,271 acres
•Tier C = >450 Avg FIV (Transitions 2018)
• 96 operations 734 fields 10,894 acres
PMT Statewide Tier Group Data

Phosphorus Management Tool (PMT)
Economic Analysis Sample
• 8 farms in study
– 4 Poultry Operations
– 4 Dairy Operations
• Participating farms range from 59 to 104 acres
• Each participant compensated with incentives to reimburse commercial fertilizer costs

Phosphorus Management Tool (PMT)
P Loss Risk Ratings PSIPMT Of the field samples included in our study:
Under PSI:
Under PMT:
Low Medium High (+)
75% 25% 0%
Low Medium High
30.8% 30.8% 38.5%

Phosphorus Management Tool (PMT)
Case Study: Farm 2015-P-02 Poultry Operation
Acreage in Study: 103
Composed of two fields, A (32 acres) and B (71 acres)
Crop: Corn
P Loss Rating Changes
Rating Under PSI Rating Under PMT
Field A Medium High
Field B Low High

Phosphorus Management Tool (PMT)
Case Study: Farm 2015-P-02
Costs of Fertilizer under PSI regulation:
Total Cost Per Acre: $91.40
Input Price ($)
Manure 68-104-136 15.00/ton @ 2 tons/acre
Spreading Manure 10.00/acre
N-SUL-32 41.40/acre
Knife in N 10.00/acre

Phosphorus Management Tool (PMT)
Case Study: Farm 2015-P-02 PMT Nutrient Recommendation:
Costs of Fertilizer under PMT regulation:
Total Cost Per Acre: $122.70
Input Price ($)
10-0-30 43.70/acre
Spreading 7.00/acre
N-SUL-32 62.00/acre
Knife in N 10.00/acre
Phosphorus Management Tool (PMT)
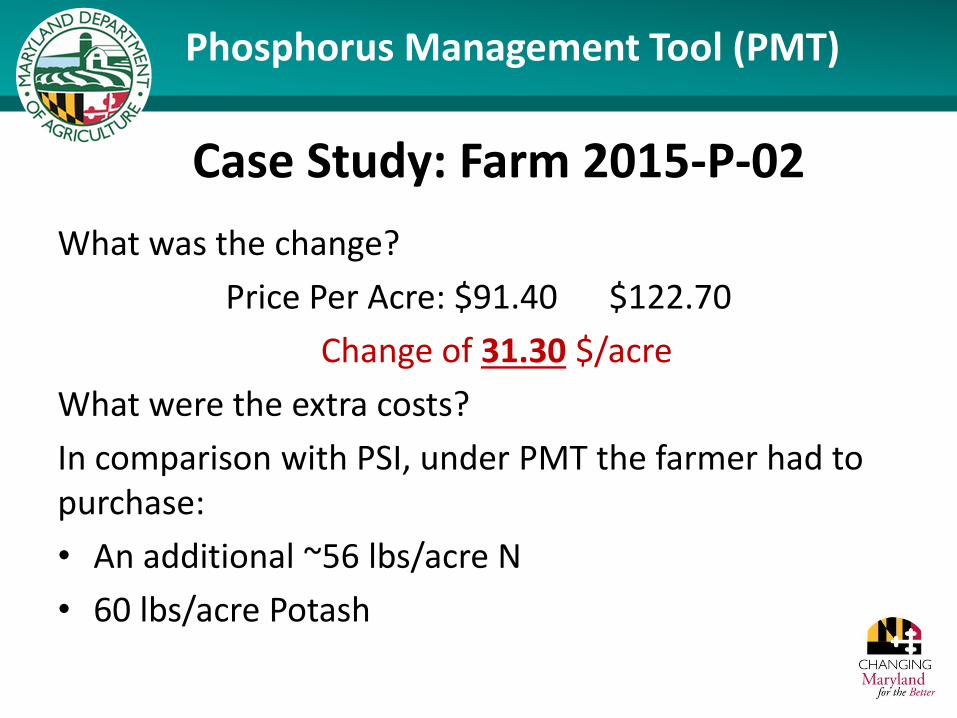
Case Study: Farm 2015-P-02
What was the change?
Price Per Acre: $91.40 $122.70
Change of 31.30 $/acre
What were the extra costs?
In comparison with PSI, under PMT the farmer had to purchase:
• An additional ~56 lbs/acre N
• 60 lbs/acre Potash

Manure Transport Program

Manure Transport Program
• 213,000 tons transported (all manure)
• $1.4 million in payments
• Poultry litter tons: 57,700
• Other manure tons: 155,400
• Land applied poultry litter – 6,000 tons (17 contracts)
FY2016 Accomplishments

Manure Transport Program
Effect on WIP Goals
• Maryland continues to exceed WIP goals for Manure Transport
• Cost-Share program allows MDA to track manure transport

Manure Transport Program
Program History

Manure Transport Program
Land Application vs. Alternative Use

Manure Transport Program
Poultry Litter Land Application
• 383,949 Tons Poultry Litter Collected 2015
• 383,949 Tons / 2 Tons Application Rate = 191,975 acres needed for application of litter
– Upper Shore = 245,362 ac. (90% of reported acres is below 150 FIV)
– Mid Shore = 184,882 ac. (75% of reported acres is below 150 FIV)
– Lower Shore = 38,943 ac. (25% of reported acres is below 150 FIV)
– Total Acres Available for Spreading = 469,187 January 2017

Animal Waste Technology Projects
PROJECTS ANIMAL
TYPE/LOCATION
STATE
FUNDING
TECHNOLOGY STATUS
Biomass Heating
Solutions Inc. (BHSL)
Annapolis, MD
Poultry
Murphy
Farms/Dorchester
County
$970,000 Fluidized bed (Thermo-
chemical)
Commissioned Dec
2016, operational
January 2017
Green Mountain
Technologies, Inc.
(GMT)
Bainbridge Island, WA
Horse
Days End Farm /
Howard County
$150,790 In vessel
composter/turnkey
Operational
October,2015- present
successful
Green Mountain
Technologies, Inc.
(GMT)
Bainbridge Island, WA
Dairy Cattle
Iager Farm /Frederick
County
$237,520
In vessel
composter/turnkey
Operational December
2015 to present, 3 mos.
add’t monitoring
planned
Planet Found Energy
Development (PFED)
Berlin, MD
Poultry
Millenium
Farms/Worcester
County
$676,144
Anaerobic digestion
with nutrient separating
system
Commissioning Dec
2016-January 2017;
operational Feb 2017

Animal Waste Technology Projects
2016 projects ANIMAL
TYPE/LOCATION STATE FUNDING TECHNOLOGY
Veteran Compost Livestock/Anne Arundel County
$350,302 Aerated Static Pile
Composting
ChesapeakeBay Renewables
Poultry Litter/Somerset
County $1,400,000
Thermophilic AD w/Nutrient Recovery
Projects Approved October 2016

Summary

Thank You

![UAB Faculty Senate Secretary Job Description · Associate Chair of the UAB Faculty Senate [Associate Chair of the Faculty; Associate Chair of the Senate] Job Description . 1. Serves](https://img.pdfslide.net/doc/110x75/5ce7d2ae88c993082d8d74aa/uab-faculty-senate-secretary-job-description-associate-chair-of-the-uab-faculty.jpg)