Embed Size (px)
Citation preview

Rural Development Statistics
Population
SECTION -1: POPULATION This section contains 27 tables providing information on some selected demographic characteristics of rural population including Population Totals, Sex Ratio, Vital Rates and Expectancy of Life.
1.1: The population figures for the years 1981, 1991, 2001 and 2011 both for males and females and also for rural and urban areas, are reported.
1.2 : Data on number of states, districts, towns and villages in India in 2001 & 2011 are presented.
1.3: State-wise population in 2011 and Decadal Growth during 2001-2011 are shown.
1.4: State-wise rural population data for the years 2001 & 2011 are given.
1.5: State-wise decadal growth rate for rural population 1991-2001 and 2001-2011 are presented.
1.6: Table presents the data on rural child population in the age group of 0-6 years for the year 2011.
1.7: Percentage share of total population by residence in 2001 & 2011 are presented.
1.8: Table presents percentage share of rural child population (0-6 years) state-wise for 2001 & 2011.
1.9: Data on child sex-ratio are presented state-wise in rural areas for 2001 & 2011.
1.10: Data on population aged 7 years and above are presented in this table state-wise for 2011.
1.11: State-wise population density information for 2001 & 2011 is shown.
1.12: State-wise data on sex ratio for 2001 & 2011 in rural and urban areas are indicated.
1.13 & 1.14 :
Distribution of villages & districts by population size groups as per 1991 and 2001 censuses are shown. The shares of each category in population are indicated.
1.15: Data on the vital rates such as Crude Birth Rate, Crude Death Rate and Infant Mortality Rate are included for the years 2007 to 2010 separately for rural and urban areas.
1.16: Provides data on a few vital rates in rural areas for the years 2008 to 2010 in different States and UTs.
1.17 : Based on the Sample Registration System, estimates of the Neonatal Mortality Rates, Post-Neonatal Mortality Rates and Peri-Natal Mortality Rates are included for the years 1980 to 2009.
1. 18 : Contains data on Infant Mortality Rate sex-wise in rural areas for the years 2008, 2009 & 2010 in different States and UTs.
1.19 & 1.20 :
Time series data on fertility indicators from 1998 to 2009 are presented at all-India level for rural and urban areas. State-wise Maternal Mortality Rates for the years 1997-98, 1999-2001,2001-03, 2004-06 and 2007-09 are presented.
1.21 : Age-specific Fertility Rates are presented for the years 2004 to 2009.
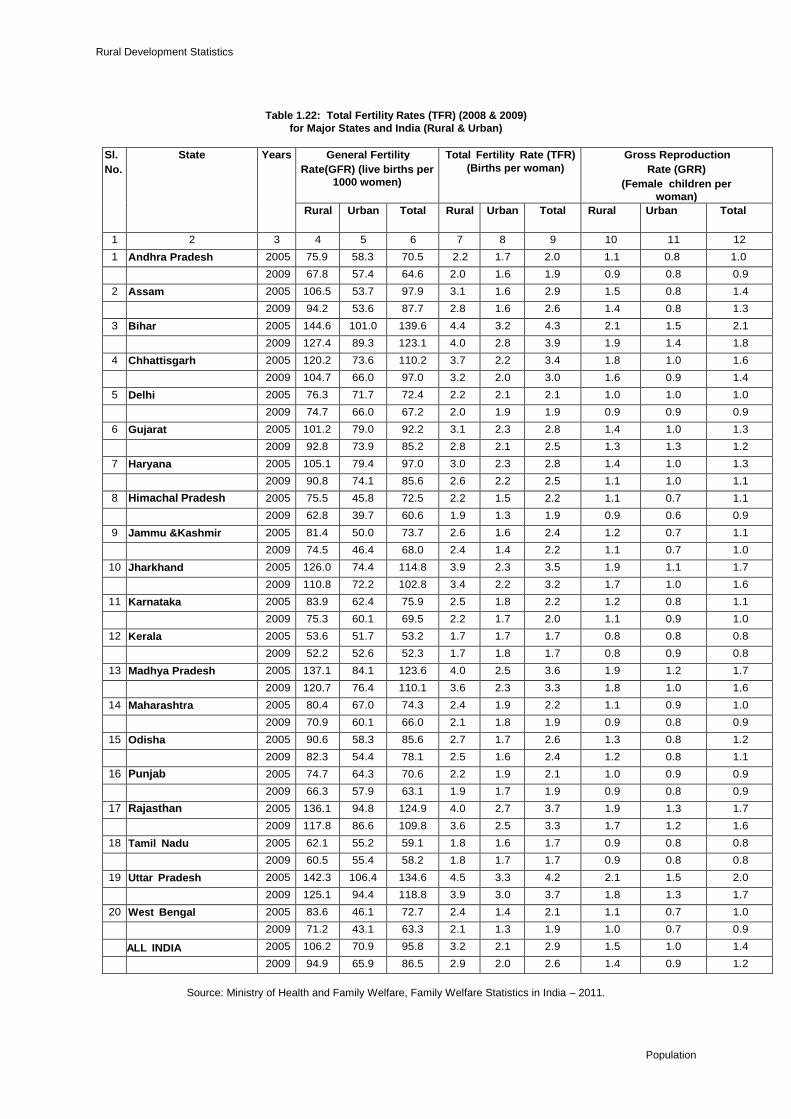
1.22 : Total Fertility Rates (TFR) in 2008 & 2009 for major states are given.

Rural Development Statistics
Population
1.23 : General Fertility Rates and Total Marital Fertility Rates are presented for the years 2005 and 2009.
1.24: Data on Expectation of Life at Birth for males and females are shown for different time periods.
1.25: Data on Expectation of Life at Birth for States and UTs are presented for the period 2002-06.
PROJECTIONS
1.26 : Highlights the estimates for a few major demographic indicators for selected time periods.
1.27 : Projected levels of the expectation of life at birth for the periods 2011-15, 2016-20 & 2021-25 are given for major states.

Rural Development Statistics
Population
Highlights
Pace of urbanisation has been steadily growing in India and 31 per cent of India’s
population are inhabited in urban areas in 2011. The phenomenal increase in
census towns during 2011 census was also responsible for the increase in
urbanisation. There has been a growing tendency to create new districts in several
states. Among the major states, Tamil Nadu, Maharashtra, Gujarat and Karnataka
are more urbanised. The rapid rural-urban migration is also responsible for
significant differences in population densities between rural and urban areas.
The decline in population growth rate was moderate in poverty stricken states of
Bihar and Uttar Pradesh. Several states have experienced deceleration in population
growth during last decade compared to 90s. Kerala has registered an impressive
annual growth of 0.48 per cent. It is disturbing to note that there was acceleration of
population growth in the states of Tamil Nadu and Chhattisgarh.
Share of small villages in rural population has been shrinking while that of villages
with population above 5000 has been increasing.
Nearly 56 per cent of districts have population ranging from one to two millions.
Rural-urban disparities on vital rates though narrowing down over the years, similar
inter-state differences continue to exist.
Expectancy of life has been rising, on an average, at the rate of half year per annum
since Independence. Among the major states, Assam, Madhya Pradesh and Odisha
have been lagging behind other states in this regard. The females are better placed
on this indicator.
The declining trend in sex ratio has been arrested and the recent improvements on
this indicator reveal that Indian society is sensitive to the gender disparities. The sex-
ratio has increased considerably by 26 points during the last decade in urban India.
The absolute rise in population size and declining ‘average household size’ suggests
the disintegration of joint family system in favour of nuclear family.
The current Crude Birth Rates, Infant Mortality Rates and Child Malnutrition points
out that India has to invest in human development heavily to realise the Millennium
Development Goals (MDGs).

Rural Development Statistics
Population
1. POPULATION
Table 1.1: Data on Selected Parameters of India’s Population
(Number in Millions)
Rural Urban Total
Male Female Total Male Female Total Male Female Total
1981
Number 269 256 525 85 75 160 354 331 685
Percentage 76.0 77.3 76.6 24.0 22.7 23.4 100.0 100.0 100.0
Sex Ratio --- --- 951 --- --- 878 --- --- 934
1991
Number 324 304 628 115 102 217 439 407 846
Percentage 73.7 74.9 74.3 26.3 25.1 25.7 100.0 100.0 100.0
Sex Ratio --- --- 938 --- --- 894 --- --- 927
2001
Number 381 360 741 150 135 285 531 496 1027
Percentage 71.8 72.8 72.2 28.2 27.2 27.8 100.0 100.0 100.0
Sex Ratio -- -- 946 -- -- 901 --- --- 933
2011
Number 427.92 405.17 833.08 195.81 181.30 377.11 623.72 586.47 1210.19
Percentage 68.61 69.09 68.84 31.39 30.91 31.16 100.0 100.0 100.0
Sex Ratio -- -- 947 -- -- 926 -- -- 940
Sources: (i) G O I, Final Population Totals, Paper-2 of 1992, Vol. I Census of India, 1991.
(ii) G O I, Census of India 2001, Provisional Population Totals, Paper-1 of 2001, Registrar General, India. (iii) G O I, Census of India 2011, Provisional Population Totals, Paper-1 of 2011, Registrar General, India.
Table 1.2: Number of States, Districts, Towns and Villages in India- 2001 & 2011 (Number)
2001 2011 Increase
States / UTs 35 35 --
Districts 593 640 47
Sub-Districts 5463 5924 461
Towns 5161 7935 2774
Statutory Towns 3799 4041 242
Census Towns 1362 3894 2532
Villages 638588 640867 2279
Source: G O I, Census of India 2011, Provisional Population Totals, Paper-1 of 2011, Registrar General, India.

Rural Development Statistics
Population
Table 1.3: Population and Decadal Growth: State-wise 2011
S.No. State/UT Total Population (2011) (Number in Millions)
Decadal growth of population (%)
Average annual exponential growth rate of population (%)
Persons Male Females 1991-2001 2001-2011 1991-2001 2001-2011
1. Andhra Pradesh 84.67 42.51 42.16 14.59 11.10 1.37 1.06
2. Arunachal Pradesh 1.38 0.72 0.66 27.00 25.92 2.42 2.33
3. Assam 31.17 15.95 15.21 18.92 16.93 1.75 1.58
4. Bihar 103.80 54.18 49.62 28.62 25.07 2.55 2.26
5. Chhattisgarh 25.54 12.83 12.71 18.27 22.59 1.69 2.06
6. Goa 1.46 0.74 0.72 15.21 8.17 1.43 0.79
7. Gujarat 60.38 31.48 28.90 22.66 19.17 2.06 1.77
8. Haryana 25.35 13.51 11.85 28.43 19.90 2.53 1.83
9. Himachal Pradesh 6.86 3.47 3.38 17.54 12.81 1.63 1.21
10. Jammu & Kashmir 12.55 6.67 5.88 29.43 23.71 2.61 2.15
11. Jharkhand 32.97 16.93 16.03 23.36 22.34 2.12 2.04
12 Karnataka 61.13 31.06 30.07 17.51 15.67 1.63 1.47
13 Kerala 33.39 16.02 17.37 9.43 4.86 0.90 0.48
14. Madhya Pradesh 72.60 37.61 34.98 24.26 20.30 2.20 1.87
15. Maharashtra 112.37 58.36 54.01 22.73 15.99 2.07 1.49
16. Manipur 2.72 1.37 1.35 24.86 18.65 2.25 1.72
17. Meghalaya 2.96 1.49 1.47 30.65 27.82 2.71 2.49
18. Mizoram 1.09 0.55 0.54 28.82 22.78 2.57 2.07
19. Nagaland 1.98 1.03 0.95 64.53 -0.47 5.11 -0.05
20. Odisha 41.95 21.20 20.75 16.25 13.97 1.52 1.32
21. Punjab 27.70 14.63 13.07 20.10 13.73 1.85 1.30
22. Rajasthan 68.62 35.62 33.00 28.41 21.44 2.53 1.96
23. Sikkim 0.61 0.32 0.29 33.06 12.36 2.90 1.17
24. Tamil Nadu 72.14 36.16 35.98 11.72 15.60 1.11 1.46
25. Tripura 0.04 1.87 1.80 16.03 14.75 1.50 1.39
26. Uttarakhand 10.12 5.15 4.96 20.41 19.17 1.87 1.77
27. Uttar Pradesh 199.58 104.59 94.99 25.85 20.09 2.33 1.85
28. West Bengal 91.35 46.93 44.42 17.77 13.93 1.65 1.31
Union Territories
29. A & N Islands 0.38 0.20 0.18 26.90 6.68 2.41 0.65
30. Chandigarh 1.05 0.58 0.47 40.28 17.10 3.44 1.59
31. D & N Haveli 0.34 0.19 0.15 59.22 55.50 4.76 4.51
32. Daman & Diu 0.24 0.15 0.09 55.73 53.54 4.53 4.38
33. Delhi 16.75 8.98 7.78 47.02 20.96 3.93 1.92
34. Lakshadweep 0.06 0.03 0.03 17.30 6.23 1.61 0.61
35. Puducherry 1.24 0.61 0.63 20.62 27.72 1.89 2.48
All-India 1210.19 623.72 586.47 21.54 17.64 1.94 1.64
Source: G O I, Census of India 2011, Provisional Population Totals, Paper-1 of 2011, Registrar General, India.

Rural Development Statistics
Population
Table 1.4: Rural Population: Sex-wise and State-wise (2001 & 2011)
(Number in Millions)
S.No. State/UT 2001 2011
Male Female Persons Male Females Persons
1. Andhra Pradesh 27.85 27.37 55.22 28.22 28.09 56.31
2. Arunachal Pradesh 0.45 0.42 0.87 0.55 0.51 1.06
3. Assam 11.98 11.26 23.24 13.69 13.09 26.78
4. Bihar 38.51 35.69 74.20 47.98 44.09 92.07
5. Chhattisgarh 8.29 8.33 16.62 9.79 9.81 19.6
6. Goa 0.34 0.34 0.68 0.28 0.28 0.56
7. Gujarat 16.29 15.41 31.70 17.80 16.87 34.67
8. Haryana 8.02 6.95 14.97 8.79 7.74 16.53
9. Himachal Pradesh 2.75 2.73 5.48 3.10 3.07 6.17
10. Jammu & Kashmir 3.92 3.64 7.56 4.81 4.33 9.14
11. Jharkhand 10.66 10.26 20.92 12.78 12.26 25.04
12 Karnataka 17.62 17.19 34.81 19.01 18.54 37.55
13 Kerala 11.45 12.12 23.57 8.40 18.53 26.93
14. Madhya Pradesh 22.97 21.31 44.28 27.14 25.40 52.54
15. Maharashtra 28.44 27.29 55.73 31.59 29.95 61.54
16. Manipur 0.92 0.89 1.81 0.97 0.93 1.9
17. Meghalaya 0.94 0.91 1.85 1.19 1.17 2.36
18. Mizoram 0.23 0.22 0.45 0.27 0.26 0.53
19. Nagaland 0.85 0.79 1.64 0.72 0.68 1.4
20. Odisha 15.71 15.50 31.21 17.58 17.37 34.95
21. Punjab 8.50 7.54 16.04 9.09 8.23 17.32
22. Rajasthan 22.39 20.87 43.27 26.68 24.86 51.54
23. Sikkim 0.26 0.22 0.48 0.24 0.21 0.45
24. Tamil Nadu 17.51 17.36 34.87 18.66 18.53 37.19
25. Tripura 1.36 1.29 2.65 1.39 1.32 2.71
26. Uttaranchal 3.14 3.17 6.31 3.51 3.51 7.02
27. Uttar Pradesh 69.10 62.44 131.54 81.04 74.07 155.11
28. West Bengal 29.61 28.13 57.73 31.90 30.31 62.21
Union Territories
29. A & N Islands 0.13 0.11 0.24 0.13 0.11 0.24
30. Chandigarh 0.06 0.03 0.09 0.02 0.01 0.03
31. D & N Haveli 0.09 0.08 0.17 0.10 0.08 0.18
32. Daman & Diu 0.06 0.04 1.00 0.03 0.03 0.06
33. Delhi 0.53 0.43 0.96 0.23 0.19 0.42
34. Lakshadweep 0.02 0.01 0.03 0.01 0.01 0.02
35. Puducherry 0.16 0.16 0.32 0.19 0.20 0.39
All-India 381 360 741 427.92 405.17 833.09
Source: G O I, Census of India 2011, Provisional Population
Totals, Paper-2 of 2011, Registrar General, India.

Rural Development Statistics
Population
Table 1.5: Decadal Growth Rate Rural Population: State-wise (1991–2001 & 2001-2011) (Percentage)
S.No. State/UT Decadal Growth (1991-2001) Decadal Growth (2001-2011)
Male Female Persons Male Female Persons
1 Andhra Pradesh 13.67 14.04 13.62 1.33 2.63 1.97
2 Arunachal Pradesh 12.50 5.00 8.75 22.22 21.43 21.84
3 Assam 17.45 17.29 17.37 14.27 16.25 15.23
4 Bihar -1.26 -0.86 -1.07 24.59 23.54 24.08
5 Chhattisgarh -- -- -- 18.09 17.77 17.93
6 Goa -15.00 13.33 -2.86 -17.65 -17.65 -17.65
7 Gujarat 16.36 18.54 17.41 9.27 9.47 9.37
8 Haryana 19.70 21.93 20.73 9.60 11.37 10.42
9 Himachal Pradesh 14.58 18.70 16.60 12.73 12.45 12.59
10 Jammu & Kashmir 30.67 30.00 30.34 22.70 18.96 20.90
11 Jharkhand
19.89 19.49 19.69
12 Karnataka 12.23 12.35 12.29 7.89 7.85 7.87
13 Kerala 9.05 11.19 10.14 -26.64 52.89 14.26
14 Madhya Pradesh -11.99 -13.72 -12.83 18.15 19.19 18.65
15 Maharashtra 16.08 14.66 15.38 11.08 9.75 10.43
16 Manipur 31.43 48.33 39.23 5.43 4.49 4.97
17 Meghalaya 34.29 30.00 32.14 26.60 28.57 27.57
18 Mizoram 15.00 10.00 12.50 17.39 18.18 17.78
19 Nagaland 70.00 58.00 64.00 -15.29 -13.92 -14.63
20 Odisha 13.84 13.97 13.91 11.90 12.06 11.98
21 Punjab 13.33 12.54 12.96 6.94 9.15 7.98
22 Rajasthan 27.22 28.83 27.64 19.16 19.12 19.11
23 Sikkim 30.00 10.00 20.00 -7.69 -4.55 -6.25
24 Tamil Nadu -5.35 -4.62 -4.99 6.57 6.74 6.65
25 Tripura 13.33 17.27 15.22 2.21 2.33 2.26
26 Uttaranchal -- -- -- 11.78 10.73 11.25
27 Uttar Pradesh 16.72 19.39 17.97 17.28 18.63 17.92
28 West Bengal 16.57 17.70 17.10 7.73 7.75 7.76
Union Territories
29 A & N Islands 30.00 10.00 20.00 -- -- --
30 Chandigarh 50.00 50.00 50.00 -66.67 -66.67 -66.67
31 D & N Haveli 50.00 33.33 41.67 11.11 0.00 5.88
32 Daman & Diu 100.00 100.00 -- -50.00 -25.00 -94.00
33 Delhi 6.00 7.50 6.67 -56.60 -55.81 -56.25
34 Lakshadweep 100.00 0.00 50.00 -50.00 -- -33.33
35 Puducherry -46.67 -20.00 -36.00 18.75 25.00 21.88
All-India 17.48 18.28 17.86 12.31 12.55 12.43
Source: G O I, Census of India 2011, Provisional Population Totals, Paper-2 of 2011,
Registrar General, India.

Rural Development Statistics
Population
Table 1.6: Rural Child Population (0-6 years) and Decadal Growth Rate: State-wise 2011
(Number in Millions)
S.No. State/UT Rural Child Population (2011)
Decadal Growth (2001-2011) (%)
Persons Male Females Persons Male Female
1. Andhra Pradesh 5.85 3.01 2.84 -23.22 -22.38 -24.09
2. Arunachal Pradesh 0.16 0.08 0.08 -2.61 -2.81 -2.40
3. Assam 4.08 2.09 2.00 -0.56 -0.06 -1.07
4. Bihar 16.90 8.73 8.17 9.75 10.24 9.23
5. Chhattisgarh 2.87 1.45 1.41 -3.29 -2.80 -3.79
6. Goa 0.05 0.03 0.03 -26.66 -25.60 -27.77
7. Gujarat 4.68 2.45 2.22 -8.06 -8.08 -8.02
8. Haryana 2.24 1.23 1.02 -9.64 -10.02 -9.17
9. Himachal Pradesh 0.70 0.37 0.33 -4.18 -4.63 -3.68
10. Jammu & Kashmir 1.60 0.86 0.74 31.37 38.23 24.20
11. Jharkhand 4.25 2.18 2.07 3.33 4.43 2.19
12 Karnataka 4.35 2.24 2.11 -11.82 -11.64 -12.02
13 Kerala 1.75 0.89 0.86 -38.85 -38.81 -38.89
14. Madhya Pradesh 8.13 4.24 3.89 -3.68 -2.55 -4.89
15. Maharashtra 7.45 3.96 3.48 -11.66 -9.95 -13.53
16. Manipur 0.25 0.13 0.12 1.36 2.77 -0.12
17. Meghalaya 0.48 0.24 0.24 19.22 19.32 19.12
18. Mizoram 0.09 0.05 0.00 14.03 13.95 14.11
19. Nagaland 0.31 0.11 0.10 -11.22 -9.56 -12.94
20. Odisha 4.34 2.24 2.10 -7.69 -6.90 -8.53
21. Punjab 1.86 1.01 0.85 -14.34 -16.40 -11.77
22. Rajasthan 8.32 4.41 3.91 -3.11 -1.67 -4.70
23. Sikkim 0.05 0.02 0.02 -34.68 -34.22 -35.17
24. Tamil Nadu 3.65 1.89 1.77 -13.73 -13.93 -13.52
25. Tripura 0.35 0.18 0.17 -7.49 -6.87 -8.14
26. Uttarakhand 0.97 0.51 0.46 -9.69 -8.54 -10.93
27. Uttar Pradesh 24.25 12.74 11.51 -7.66 -6.83 -8.55
28. West Bengal 7.54 3.86 3.67 -17.37 -16.89 -17.86
Union Territories
29. A & N Islands 0.03 0.01 0.01 -15.57 -15.95 -15.17
30. Chandigarh 0.00 0.00 0.00 -70.48 -70.72 -70.20
31. D & N Haveli 0.03 0.01 0.01 -14.64 -12.82 -16.45
32. Daman & Diu 0.01 0.00 0.00 -45.37 -5.62 -45.09
33. Delhi 0.06 0.03 0.02 -64.74 -63.93 -65.69
34. Lakshadweep 0.00 0.00 0.00 -67.95 -66.06 -69.83
35. Puducherry 0.04 0.02 1.77 2.03 2.55 -13.52
All-India 117.59 61.29 56.30 -7.04 -6.32 -7.51
Source: G O I, Census of India 2011, Provisional Population Totals, Paper-1 of 2011, Registrar General, India.

Rural Development Statistics
Population
Table 1.7: Share of India’s Population by Residence – 2001 & 2011
(%)
S.No. State/UT Share in total population 2001
Share in total population 2011
Rural Urban Rural Urban
1. Andhra Pradesh 72.70 27.30 66.51 33.49
2. Arunachal Pradesh 79.25 20.75 77.33 22.67
3. Assam 87.10 12.90 85.92 14.08
4. Bihar 89.54 10.46 88.70 11.30
5. Chhattisgarh 79.91 20.09 76.76 23.24
6. Goa 50.24 49.76 37.83 62.17
7. Gujarat 62.64 37.36 57.42 42.58
8. Haryana 71.08 28.92 65.21 34.79
9. Himachal Pradesh 90.20 9.80 89.96 10.04
10. Jammu & Kashmir 75.19 24.81 72.79 27.21
11. Jharkhand 77.76 22.24 75.95 24.05
12 Karnataka 66.01 33.99 61.43 38.57
13 Kerala 74.04 25.96 52.28 47.72
14. Madhya Pradesh 73.54 26.46 72.37 27.63
15. Maharashtra 57.57 42.43 54.77 45.23
16. Manipur 74.89 25.11 67.79 30.21
17. Meghalaya 80.42 19.58 79.92 20.08
18. Mizoram 50.37 49.63 48.49 51.51
19. Nagaland 82.77 17.23 71.03 28.97
20. Odisha 85.01 14.99 83.32 16.68
21. Punjab 66.08 33.92 62.51 37.49
22. Rajasthan 76.61 23.39 75.11 24.89
23. Sikkim 88.93 11.07 75.03 24.97
24. Tamil Nadu 55.96 44.04 51.55 48.45
25. Tripura 82.94 17.06 73.82 26.18
26. Uttarakhand 74.33 25.67 69.45 30.55
27. Uttar Pradesh 79.22 20.78 77.72 22.28
28. West Bengal 72.03 27.97 68.11 31.89
Union Territories
29. A & N Islands 67.37 32.63 64.33 35.67
30. Chandigarh 10.23 89.77 2.72 97.25
31. D & N Haveli 77.11 22.89 53.38 46.62
32. Daman & Diu 63.75 36.25 24.84 75.16
33. Delhi 6.82 93.18 2.50 97.50
34. Lakshadweep 55.54 44.46 21.92 78.08
35. Puducherry 33.43 66.57 31.69 68.31
All-India 72.19 27.81 68.84 31.16
Source: G O I, Census of India 2011, Provisional Population Totals, Paper-1 of 2011, Registrar General, India.

Rural Development Statistics
Population
Table 1.8: Percentage of Child Population (0-6 Years) in Total State-wise 2001 & 2011-Rural
(%)
S.No. State/UT Males Females Persons
2001 2011 2001 2011 2001 2011
1. Andhra Pradesh 13.90 10.68 13.61 10.10 13.76 10.39
2. Arunachal Pradesh 18.96 15.12 19.93 15.70 19.43 15.40
3. Assam 17.47 15.23 17.90 15.25 17.68 15.24
4. Bihar 20.52 18.20 20.93 18.52 20.72 18.35
5. Chhattisgarh 18.00 14.84 17.61 14.40 17.80 14.62
6. Goa 10.73 9.85 10.34 9.13 10.54 9.49
7. Gujarat 16.35 13.78 15.67 13.18 16.02 13.49
8. Haryana 16.91 13.94 16.06 13.15 16.52 13.57
9. Himachal Pradesh 13.95 11.82 12.69 10.87 13.33 11.35
10. Jammu & Kashmir 15.61 17.84 16.28 17.06 15.93 17.47
11. Jharkhand 19.51 17.03 19.73 16.89 19.62 16.96
12 Karnataka 14.35 11.77 13.94 11.40 14.15 11.59
13 Kerala 12.73 10.61 11.55 9.45 12.12 10.01
14. Madhya Pradesh 18.90 15.63 19.16 15.32 19.03 15.48
15. Maharashtra 15.46 12.54 14.75 11.63 15.11 12.10
16. Manipur 14.69 13.67 14.59 13.15 14.64 13.42
17. Meghalaya 21.43 20.27 21.53 20.04 21.48 20.16
18. Mizoram 17.59 17.20 18.39 17.50 17.98 17.34
19. Nagaland 14.25 15.29 15.07 15.14 14.64 15.22
20. Odisha 15.25 12.72 14.77 12.09 15.01 12.40
21. Punjab 14.21 11.13 12.76 10.37 13.52 10.77
22. Rajasthan 20.00 16.53 19.65 15.72 19.84 16.14
23. Sikkim 14.32 9.95 15.71 10.73 14.97 10.32
24. Tamil Nadu 12.49 10.10 11.75 9.54 12.12 9.82
25. Tripura 14.28 13.08 14.62 13.07 14.44 13.08
26. Uttarakhand 17.78 15.56 16.21 13.01 16.99 13.78
27. Uttar Pradesh 19.77 15.71 20.14 15.54 19.94 15.63
28. West Bengal 15.69 12.10 15.90 12.12 15.79 12.11
Union Territories
29. A & N Islands 12.40 10.29 13.92 11.52 13.10 10.86
30. Chandigarh 13.74 13.32 18.73 16.63 15.65 14.67
31. D & N Haveli 17.63 14.36 20.76 16.00 19.07 15.12
32. Daman & Diu 10.86 11.62 16.99 12.40 13.12 11.99
33. Delhi 16.37 13.58 17.20 12.97 16.74 13.30
34. Lakshadweep 16.08 12.98 16.74 12.08 16.40 12.54
35. Puducherry 12.99 11.22 12.69 10.44 12.84 10.82
All-India 17.14 14.32 16.92 13.90 17.03 14.11
Source: G O I, Census of India 2011, Provisional Population Totals, Paper-1 of 2011, Registrar General, India.

Rural Development Statistics
Population
Table 1.9: Child Sex Ratio (0-6 Years) Rural State-wise 2011
(Females per 1000 males)
S.No. State/UT Rural Sex Ratio
2001 2011
1. Andhra Pradesh 963 942
2. Arunachal Pradesh 960 964
3. Assam 967 957
4. Bihar 944 935
5. Chhattisgarh 982 972
6. Goa 952 924
7. Gujarat 906 906
8. Haryana 823 831
9. Himachal Pradesh 900 909
10. Jammu & Kashmir 957 860
11. Jharkhand 973 952
12 Karnataka 949 945
13 Kerala 961 960
14. Madhya Pradesh 939 917
15. Maharashtra 916 880
16. Manipur 956 929
17. Meghalaya 973 972
18. Mizoram 965 966
19. Nagaland 969 932
20. Odisha 955 939
21. Punjab 799 843
22. Rajasthan 914 886
23. Sikkim 966 952
24. Tamil Nadu 933 937
25. Tripura 968 955
26. Uttarakhand 918 894
27. Uttar Pradesh 921 904
28. West Bengal 963 952
Union Territories
29. A & N Islands
30. Chandigarh 847 862
31. D & N Haveli 1003 961
32. Daman & Diu 916 925
33. Delhi 850 809
34. Lakshadweep 999 888
35. Puducherry 967 957
All-India 934 919
Source: G O I, Census of India 2011, Provisional Population Totals, Paper-1 of 2011, Registrar General, India.

Rural Development Statistics
Population
Table 1.10: Population Aged 7 Years and Above by Sex : 2011
(Number in Millions) S.No. State / UT Persons Males Females Sex Ratio
1 Andhra Pradesh 76.02 38.06 37.96 997 2 Arunachal Pradesh 1.18 0.62 0.56 903 3 Assam 26.66 13.65 13.01 953 4 Bihar 85.22 44.57 40.65 912 5 Chhattisgarh 21.96 11.00 10.95 995 6 Goa 1.32 0.67 0.65 970 7 Gujarat 52.89 27.51 25.38 923 8 Haryana 22.06 11.70 10.35 885 9 Himachal Pradesh 6.09 3.07 3.02 984
10 Jammu & Kashmir 10.54 5.58 4.96 889 11 Jharkhand 27.73 14.24 13.49 947 12 Karnataka 54.27 27.53 26.75 972 13 Kerala 30.07 14.33 15.74 1098 14 Lakshadweep 0.06 0.03 0.03 1000 15 Madhya Pradesh 62.05 32.10 29.95 933 16 Maharashtra 99.52 51.54 47.99 931 17 Manipur 2.37 1.19 1.18 992 18 Meghalaya 2.41 1.21 1.20 992 19 Mizoram 0.93 0.47 0.46 979 20 Nagaland 1.69 0.88 0.82 932 21 Odisha 36.91 18.60 18.31 984 22 Punjab 24.76 13.04 11.72 899 23 Rajasthan 58.12 30.04 28.08 935 24 Sikkim 0.55 0.29 0.26 897 25 Tamil Nadu 65.24 32.62 32.63 1000 26 Tripura 3.23 1.64 1.58 963 27 Uttar Pradesh 169.85 88.94 80.91 910 28 Uttarakhand 8.79 4.45 4.34 975 29 West Bengal 81.24 41.74 39.50 946 UTs
30 Andaman & Nicobar Islands 0.34 0.18 0.16 889 31 Chandigarh 0.94 0.52 0.42 808 32 NCT of Delhi 14.78 7.92 6.86 866 33 Dadra & Nagar Haveli 0.29 0.17 0.13 765 34 Daman & Diu 0.22 0.14 0.08 571 35 Puducherry 1.12 0.55 0.57 1036 INDIA 1051.40 540.77 510.63 944
Source: G O I, Census of India 2011, Provisional Population Totals, Paper-1 of 2011, Registrar General, India.

Rural Development Statistics
Population
Table 1.11: State-Wise Population Density 2001 & 2011
(Persons per Sq. Km)
S.No. State/UT 2001 2011
1. Andhra Pradesh 277 308
2. Arunachal Pradesh 13 17
3. Assam 339 397
4. Bihar 881 1102
5. Chhattisgarh 154 189
6. Goa 364 394
7. Gujarat 258 308
8. Haryana 478 573
9. Himachal Pradesh 109 123
10. Jammu & Kashmir 45 124
11. Jharkhand 338 414
12 Karnataka 275 319
13 Kerala 819 859
14. Madhya Pradesh 195 236
15. Maharashtra 314 365
16. Manipur 97 122
17. Meghalaya 103 132
18. Mizoram 42 52
19. Nagaland 120 119
20. Odisha 236 269
21. Punjab 483 550
22. Rajasthan 165 201
23. Sikkim 76 86
24. Tamil Nadu 479 555
25. Tripura 305 350
26. Uttarakhand 158 189
27. Uttar Pradesh 689 828
28. West Bengal 903 1029
Union Territories
29. A & N Islands 43 46
30. Chandigarh 7900 9252
31. D & N Haveli 449 698
32. Daman & Diu 1412 2169
33. Delhi 9339 11297
34. Lakshadweep 1895 2013
35. Puducherry 2034 2598
All-India 312 382 Source: G O I, Census of India 2011, Provisional Population Totals, Paper-1 of 2011,
Registrar General, India.

Rural Development Statistics
Population
Table 1.12: Sex ratio- State-wise – 2001 & 2011
(Females per 1000 males)
S.No. State/UT Rural Urban Total
2001 2011 2001 2011 2001 2011
1. Andhra Pradesh 983 995 965 984 978 992
2. Arunachal Pradesh 914 929 819 889 893 920
3. Assam 944 956 872 937 935 954
4. Bihar 926 919 868 891 919 916
5. Chhattisgarh 1004 1002 932 956 989 991
6. Goa 988 997 934 951 961 968
7. Gujarat 945 947 880 880 920 918
8. Haryana 866 880 847 871 861 877
9. Himachal Pradesh 989 988 795 853 968 974
10. Jammu & Kashmir 917 899 819 840 892 883
11. Jharkhand 962 960 870 908 941 947
12 Karnataka 977 975 942 957 965 968
13 Kerala 1059 1077 1058 1091 1058 1084
14. Madhya Pradesh 927 936 898 916 919 930
15. Maharashtra 960 948 873 899 922 925
16. Manipur 963 966 1009 1038 974 987
17. Meghalaya 969 983 982 997 972 986
18. Mizoram 923 950 948 1000 935 975
19. Nagaland 916 942 829 905 900 931
20. Odisha 987 988 895 934 972 978
21. Punjab 890 906 849 872 876 893
22. Rajasthan 930 932 890 911 923 926
23. Sikkim 880 883 830 908 875 889
24. Tamil Nadu 992 993 982 998 987 995
25. Tripura 946 956 959 976 948 961
26. Uttarakhand 1007 1000 845 883 962 963
27. Uttar Pradesh 904 914 876 888 898 908
28. West Bengal 950 950 893 939 934 947
Union Territories
29. A & N Islands 861 871 815 891 846 878
30. Chandigarh 621 691 796 821 777 818
31. D & N Haveli 852 863 691 684 812 775
32. Daman & Diu 586 867 984 550 710 618
33. Delhi 810 847 822 867 821 866
34. Lakshadweep 959 954 935 944 948 946
35. Puducherry 990 1029 1007 1043 1001 1038
All-India 946 947 900 926 933 940
Source: G O I, Census of India 2011, Provisional Population Totals, Paper-1 of 2011,
Registrar General, India.

Rural Development Statistics
Population
Table 1.13: Distribution of Rural Population by
Size of Village in India : (1961 to 2001)
(%)
S.No. Size of Village in terms of Population
1961 1971 1981 1991 2001
1. Less than 200 3.83 2.68 1.78 1.69 1.24
2. 200 – 499 12.55 9.91 7.49 7.78 5.92
3. 500 – 999 18.33 16.45 14.21 16.76 14.18
4. 1000 – 1999 19.80 19.90 19.25 25.74 24.69
5. 2000 – 4999 17.22 18.68 20.09 29.80 32.22
6. 5000 – 9999 5.05 5.94 6.90 11.21 13.22
7. 10000 & Above 2.80 4.07 4.56 7.03 8.54
8. Rural population as percentage of total population
82.03 80.09 76.66 74.27 72.18
Source: CSO, Selected Socio-Economic Statistics India, 2006.
Distribution of Rural Population by size of villages - 1961
3.83
12.55
18.33
19.8
17.22
5.052.8
Less than 200 200 – 499500 – 999 1000 – 19992000 – 4999 5000 – 999910000 & Above
Distribution of Rural Population by size of Villages 2001
1.24 5.92
14.18
24.69
32.22
13.22
8.54
Less than 200 200 – 499
500 – 999 1000 – 1999
2000 – 4999 5000 – 9999
10000 & Above

Rural Development Statistics
Population
Table 1.14: Distribution of Districts by Population Size – India (1991 and 2001)
S.No. Ranges of Population 1991
2001
Number of
Districts
Percent-age of districts
Population (Number in Millions)
Number of
Districts
Percent-age of
districts
Population (Number in Millions)
Absolute Per cent Absolute Per cent
Total 466 100.00 846.39 100.00 593 100.00 1027.02 100.00
1. Less than 1,00,000 27 5.79 1.79 0.21 22 3.71 1.28 0.12
2. 100,000-499,999 45 9.66 13.07 1.54 65 10.96 18.08 1.76
3. 500,000-999,999 68 14.59 53.22 6.29 96 16.19 71.49 6.96
4. 1,000,000-1,999,999 140 30.04 206.60 24.41 212 35.75 307.75 29.97
5. 2,000,000-2,999,999 118 25.32 290.65 34.34 113 19.06 277.38 27.01
6. 3,000,000-3,999,999 43 9.23 144.98 17.13 57 9.61 194.70 18.96
7. 4,000,000-4,999,999 16 3.43 73.05 8.63 16 2.70 71.52 6.96
8. 5,000,000 + 9 1.93 63.03 7.45 12 2.02 84.83 8.26
Notes: 1. The population figures for the districts of Jammu and Kashmir for 1991 Census has been interpolated, as the 1991
Census could not be held in the state due to disturbed conditions. 2. The population figures for entire Kachchh district, Morvi, Malia-Miyana and Wankaner talukas of Rajkot district and Jodiya
taluka of Jamnagar district in Gujarat for 2001 Census have been estimated as population enumeration at the Census of India, 2001, could not be conducted here due to natural calamity.
3. The population figure for entire Kinnaur district in Himachal Pradesh for the year 2001 has been estimated as population enumeration at the Census of India, 2001, could not be conducted here due to natural calamity.
Source: G O I, Census of India 2001, Provisional Population Totals, Paper-1 of 2001, Registrar General, India.
Percentage of Districts with ranges of Population - 2001
3.7%
11.0%
16.2%
35.8%
19.1%
9.6%
2.7%
2.0%
Less than 1,00,000
100,000-499,999
500,000-999,999
1,000,000-1,999,999
2,000,000-2,999,999
3,000,000-3,999,999
4,000,000-4,999,999
5,000,000 +

Rural Development Statistics
Population
Table 1.15: Vital Rates - All India
(2007 to 2010)
S. No.
2007
2008
2009 2010
Rural Urban Overall Rural Urban Overall Rural Urban Overall Rural Urban Overall
1. Crude Birth Rate (Per 1000 Population per year)
24.7 18.6 23.1 24.4 18.5 22.8 24.1 18.3 22.5 23.7 18.0 22.1
2. Crude Death Rate (Per 1000 Population per year)
8.0 6.0 7.4 8.0 5.9 7.4 7.8 5.8 7.3 7.7 5.8 7.2
3. Natural Growth Rate (Per 1000 Population per year)
16.8 12.7 15.7 16.5 12.6 15.4 16.3 12.5 15.2 15.9 12.2 14.9
4. Infant Mortality Rate (Per 1000 Live Births)
61 37
55 58 36 53 55 34 50 51 31 47
Source: G O I, Sample Registration System Bulletin 2009, Registrar General, India.

Rural Development Statistics
Population
1.16: Vital Rates in Rural Areas - State-wise
(2008 to 2010)
S.No. State/UT Birth Rate (per 1000 population per year)
Death Rate (per 1000 population per year)
Natural Growth Rate (per 1000 population per year)
Infant Mortality Rate (per 1000 Live Births)
2008 2009 2010 2008 2009 2010 2008 2009 2010 2008 2009 2010
Bigger States
1. Andhra Pradesh 19.1 18.8 18.3 8.3 8.5 8.6 10.8 10.3 9.7 58 54 51
2. Assam 25.3 24.9 24.4 9.0 8.8 8.6 16.2 16.1 15.8 66 64 60
3. Bihar 29.7 29.3 28.8 7.4 7.2 7.0 22.3 22.1 21.8 57 53 49
4. Chhattisgarh 27.6 27.2 26.8 8.5 8.5 8.4 19.2 18.8 18.4 59 55 52
5. Delhi 20.2 19.9 19.7 5.1 4.8 4.6 15.1 15.0 15.0 40 40 37
6. Gujarat 24.1 23.8 23.3 8.0 7.7 7.5 16.1 16.1 15.8 58 55 51
7. Haryana 24.2 23.8 23.3 7.3 7.1 7.0 16.8 16.7 16.3 58 54 51
8. Jammu & Kashmir 20.2 19.9 19.5 6.0 6.0 5.9 14.2 13.9 13.6 51 48 45
9. Jharkhand 27.5 27.1 26.7 7.5 7.4 7.4 19.9 19.7 19.3 49 46 44
10. Karnataka 20.9 20.6 20.2 8.5 8.3 8.1 12.4 12.3 12.1 50 47 43
11. Kerala 14.6 14.6 14.8 6.7 6.8 7.1 7.9 7.8 7.7 12 12 14
12. Madhya Pradesh 30.0 29.7 29.2 9.4 9.2 9.0 20.7 20.5 20.2 75 72 67
13. Maharashtra 18.4 18.1 17.6 7.4 7.6 7.5 11.0 10.6 10.2 40 37 34
14. Odisha 22.2 21.9 21.4 9.4 9.2 9.0 12.9 12.7 12.4 71 68 63
15. Punjab 18.0 17.7 17.2 8.0 7.8 7.7 10.1 9.9 9.5 45 42 37
16. Rajasthan 28.8 28.4 27.9 7.0 6.7 6.9 21.8 21.7 20.9 69 65 61
17. Tamil Nadu 16.2 16.5 16.0 8.2 8.5 8.2 8.0 8.0 7.8 34 30 25
18. Uttar Pradesh 30.0 29.7 29.2 8.8 8.6 8.5 21.2 21.1 20.7 70 66 64
19. West Bengal 19.4 19.1 18.6 6.1 6.1 6.0 13.3 13.0 12.6 37 34 32
Smaller States
20. Arunachal Pradesh 23.1 22.6 22.1 5.6 7.0 6.9 17.5 15.6 15.2 34 35 34
21. Goa 13.4 13.0 12.6 8.1 8.2 8.1 5.3 4.8 4.5 10 11 10
22. Himachal Pradesh 18.2 17.8 17.5 7.7 7.4 7.2 10.6 10.4 10.3 45 46 41
23. Manipur 15.9 15.4 14.8 4.8 4.6 4.3 11.1 10.8 10.5 16 18 15
24. Meghalaya 27.3 26.4 26.6 8.4 8.6 8.4 18.9 17.9 18.2 60 61 58
25. Mizoram 22.0 21.7 21.1 5.9 5.0 5.4 16.1 16.7 15.7 45 45 47
26. Nagaland 17.8 17.4 17.0 5.0 3.7 3.7 12.9 13.7 13.3 25 27 24
27. Sikkim 18.7 18.4 18.1 5.4 6.0 5.9 13.3 12.4 12.3 35 36 31
28. Tripura 16.1 15.5 15.6 6.0 5.0 4.8 10.1 10.5 10.8 36 33 29
29. Uttarakhand 21.0 20.6 20.2 6.7 6.9 6.7 14.4 13.7 13.5 48 44 41
Union Territories
30. A & N Islands 16.9 16.5 15.5 5.5 4.4 4.8 11.4 12.0 10.7 35 31 29
31. Chandigarh 22.6 22.1 21.6 3.1 3.9 3.7 19.6 18.2 17.9 22 25 20
32. D & N Haveli 26.4 26.5 26.0 6.1 5.2 5.1 20.4 21.3 20.9 38 41 43
33. Daman & Diu 17.3 19.6 19.1 5.4 5.5 4.9 12.0 14.1 14.2 29 21 19
34. Lakshadweep 15.7 15.5 15.5 6.4 5.4 6.1 9.3 10.1 9.5 28 22 23
35. Puducherry 16.4 17.1 16.7 8.8 7.4 8.2 7.6 9.7 8.5 31 28 25
Rural India 24.4 24.1 23.7 8.0 7.8 7.7 16.5 16.3 15.9 58 55 51
Source: G O I, Sample Registration System (SRS) Bulletin 2008 , 2009 & 2011, Registrar General, India.

Rural Development Statistics
Population
Table 1.17: Infant and Child Mortality Rates - India 1980 to 2009
(Per 1000 live births)
Year
Infant Mortality Rate Neo-natal Mortality Rate Post neo-natal Mortality Rate
Rural Urban Total Rural Urban Total Rural Urban Total 1 2 3 4 5 6 7 8 9 10
1980 124 65 114 76 39 69 48 26 45 1985 107 59 97 67 38 60 40 26 37 1990 86 50 80 57 31 53 29 20 27 1991 87 53 80 55 32 51 31 21 29 1992 85 53 79 54 33 50 31 20 29 1993 82 45 74 52 28 47 28 16 26 1994 80 52 74 52 33 48 28 20 26 1995 80 48 74 52 29 48 28 19 26 1996 77 46 72 50 28 47 27 17 25 1997 77 45 71 51 26 46 26 19 25 1998 77 45 72 49 27 45 NA NA NA 1999 75 44 70 49 28 45 NA NA NA 2000 74 44 68 49 27 44 NA NA NA 2001 72 42 66 44 25 40 NA NA NA 2002 69 40 63 44 24 40 26 16 24 2003 66 38 60 41 22 37 25 16 23 2004 64 40 58 41 24 37 22 16 21 2005 64 40 58 41 23 37 23 17 22 2006 62 39 57 41 23 37 22 16 20 2007 61 37 55 40 22 36 20 16 19 2008 58 36 53 39 21 35 19 15 18 2009 55 34 50 38 21 34 17 13 16
Year
Peri-natal Mortality Rate Still Birth Rate
Rural Urban Total Rural Urban Total
1 11 12 13 14 15 16 1980 60 35 56 12 8 11 1985 52 30 48 11 9 10 1990 52 34 48 12 11 12 1991 49 33 46 11 10 11 1992 50 34 48 12 10 12 1993 48 31 44 11 9 11 1994 43 39 43 7 15 9 1995 48 31 45 9 9 9 1996 46 32 44 9 9 9 1997 46 29 43 9 9 9 1998 45 29 42 9 8 9 1999 47 30 44 11 8 10 2000 44 26 40 9 7 8 2001 39 25 36 10 8 9 2002 38 23 35 9 7 9 2003 36 20 33 9 8 9 2004 39 23 35 10 8 10 2005 40 24 37 9 8 9 2006 41 24 37 9 8 9 2007 41 24 37 9 8 9 2008 39 22 35 9 7 8 2009 39 23 35 8 7 8
Infant Mortality Rate: Number of infants dying under one year of age in a year per 1000 live births of the same year. Neo-natal Mortality Rate: Number of infants dying within the first month of life (under 28 days) in a year per 1000 live births of the same year. Post neo-natal Mortality Rate: Number of infant deaths at 28 days to one year of age per 1000 live births in a given year. Peri-natal Mortality Rate: Number of still births plus deaths within 1st week of delivery per 1000 births in a year.
Source: G O I, Ministry of Health and Family Welfare, Family Welfare Statistics in India, 2011.

Rural Development Statistics
Population
Table 1.18: Infant Mortality Rate- Sex wise& State-wise (2008, 2009 & 2010)
Rural Areas (Per 1000 Live Births)
S.No. State 2008 2009
2010
Male Female Total Male Female Total Male Female Total
1. Andhra Pradesh 58 56 60 53 53 54 50 51 51
2. Assam 66 65 68 61 61 64 59 62 60
3. Bihar 57 54 59 53 53 53 47 51 49
4. Chhattisgarh 59 58 59 51 51 55 49 55 52
5. Delhi 40 39 40 40 40 40 32 42 37
6. Gujarat 58 58 60 55 55 55 48 54 51
7. Haryana 58 56 60 52 52 54 51 52 51
8. Jammu & Kashmir 51 50 54 43 43 48 43 47 45
9. Jharkhand 49 47 50 44 44 46 43 46 44
10. Karnataka 50 49 52 46 46 47 42 44 43
11. Kerala 12 11 13 10 10 12 14 15 14
12 Madhya Pradesh 75 73 77 71 71 72 66 67 67
13 Maharashtra 40 40 40 35 35 37 33 35 34
14. Odisha 71 70 73 67 67 68 62 63 63
15. Punjab 45 44 48 41 41 42 36 39 37
16. Rajasthan 69 67 71 64 64 65 58 64 61
17. Tamil Nadu 34 33 35 29 29 30 25 26 25
18. Uttar Pradesh 70 67 74 65 65 66 61 67 64
19. West Bengal 37 36 38 34 34 34 31 33 32
All-India 58 57 60 54 56 55 50 53 51
Source: G O I, Sample Registration System (SRS) Bulletin 2008, 2009 & 2010, Registrar General, India.

Rural Development Statistics
Population
Table 1.19: Fertility Indicators (1998 to 2009) All – India
Indicators
Area
1998
1999
2000
2001
2002
2003
2004
2005
2006
2007
2008
2009
General Fertility Rate
(GFR)
(Number of live births per 1000 women)
Rural
115.2
112.8
112.7
108.6
106.0
103.5
109.7
106.2
103.4
98.6
96.9
94.9
Urban
79.7
77.6
76.5
74.4
72.5
71.9
72.0
70.9
69.1
67.3
66.5
65.9
Total
106.5
103.2
102.8
99.5
97.1
95.3
98.6
95.8
93.3
89.5
88.0
86.5
General Marital Fertility
Rate (GMFR)
(Number of live births per 1000 married women)
Rural
149.1
147.8
148.8
145.4
142.1
141.0
143.3
140.7
137.8
133.9
130.8
129.8
Urban
113.8
112.3
111.1
110.0
106.4
106.4
102.3
101.5
99.5
97.7
95.9
95.5
Total
141.3
138.9
139.2
136.7
133.3
132.6
131.9
129.7
127.2
123.9
121.1
120.3
Total Fertility Rate (TFR)
(Children per woman)
Rural
3.5
3.5
3.5
3.4
3.3
3.2
3.3
3.2
3.1
3.0
2.9
2.9
Urban
2.4
2.3
2.3
2.3
2.2
2.2
2.1
2.1
2.0
2.0
2.0
2.0
Total
3.2
3.2
3.2
3.1
3.0
3.0
2.9
2.9
2.8
2.7
2.6
2.6
Total Marital Fertility
Rate (TMFR)
(Children per married woman)
Rural
4.8
4.9
5.0
4.9
4.8
4.9
4.6
4.5
4.6
4.5
4.5
4.5
Urban
4.2
4.2
4.2
4.2
4.2
4.2
3.9
3.8
3.9
3.9
3.9
3.8
Total
4.6
4.7
4.8
4.7
4.6
4.7
4.4
4.3
4.4
4.4
4.3
4.4
Gross Reproduction
Rate (GRR)
(Female children per woman)
Rural
1.7
1.7
1.7
1.6
1.6
1.5
1.5
1.5
1.5
1.4
1.4
1.4
Urban
1.1
1.1
1.1
1.0
1.0
1.0
1.0
1.0
1.0
0.9
0.9
0.9
Total
1.5
1.5
1.5
1.5
1.4
1.4
1.4
1.4
1.3
1.3
1.2
1.2
Source: GOI, Ministry of Health and Family Welfare, Family Welfare Statistics in India, 2011.

Rural Development Statistics
Population
Table 1.20: Maternal Mortality Rate (MMR)
(1997-98, 1999-2001, 2001-03, 2004-06 & 2007-09) (Per 1,00,000 live births)
States
1997-98
1999-01
2001-03
2004-06
2007-09
India
398
327
301
254 212
Andhra Pradesh
197
220
195
154 134
Assam
568
398
490
480 390
Bihar/Jharkhand
531
400
371
312 261
Gujarat
46
202
172
160 148
Haryana
136
176
162
186 153
Karnataka
245
266
228
213 178
Kerala
150
149
110
95 81
Madhya Pr/Chhattisgarh
441
407
379
335 269
Maharashtra
166
169
149
130 104
Odisha
346
424
358
303 258
Punjab
280
177
178
192 172
Rajasthan
508
501
445
388 318
Tamil Nadu
131
167
134
111 97
Uttar Pradesh/Uttarakhand
606
539
517
440 359
West Bengal
303
218
194
141 145
Source: GOI, Ministry of Health and Family Welfare, Family Welfare Statistics in India, 2011.

Rural Development Statistics
Population
Table 1.21: Age-specific Fertility Rates (ASFR*) and
Age-specific Marital Fertility Rates (ASMFR**) Rural India (2004 to 2009)
Age
Groups Rural
2004 2005 2006 2007 2008 2009
ASFR ASMFR ASFR ASMFR ASFR ASMFR ASFR ASMFR ASFR ASMFR ASFR ASMFR
15-19 58.6 234.0 52.4 218.7 52.6 251.2 47.3 247.6 47.6 252.5 44.3 248.5
20-24 240.6 306.0 246.2 318.9 227.7 304.8 235.5 323.5 218.6 303.0 227.8 326.0
25-29 184.0 198.6 171.2 185.3 180.9 197.2 169.4 185.0 169.7 185.7 166.0 183.2
30-34 96.5 102.3 99.1 105.3 87.5 92.7 83.0 88.1 80.7 85.7 82.7 88.0
35-39 45.6 49.1 41.4 44.6 42.5 45.9 37.5 40.4 39.2 42.3 34.8 37.4
40-44 21.0 23.3 21.5 23.9 18.8 20.8 15.3 17.0 15.3 17.0 14.5 16.0
45-49 10.7 12.6 8.1 9.6 8.0 9.4 5.5 6.4 6.3 7.4 6.3 7.3
*: Number of live births in a year to 1000 women. **: Number of live births in a year to 1000 married women.
Source: G O I, Ministry of Health and Family Welfare, Family Welfare Statistics in India, 2011.
Rural Development Statistics
Population
Table 1.22: Total Fertility Rates (TFR) (2008 & 2009)
for Major States and India (Rural & Urban)
Sl.
No. State Years General Fertility
Rate(GFR) (live births per
1000 women)
Total Fertility Rate (TFR)
(Births per woman) (
Births per woman)
Gross Reproduction
Rate (GRR)
(Female children per
woman) Rural Urban Total Rural Urban Total Rural Urban Total
1 2 3 4 5 6 7 8 9 10 11 12 1 Andhra Pradesh 2005 75.9 58.3 70.5 2.2 1.7 2.0 1.1 0.8 1.0
2009 67.8 57.4 64.6 2.0 1.6 1.9 0.9 0.8 0.9
2 Assam 2005 106.5 53.7 97.9 3.1 1.6 2.9 1.5 0.8 1.4
2009 94.2 53.6 87.7 2.8 1.6 2.6 1.4 0.8 1.3
3 Bihar 2005 144.6 101.0 139.6 4.4 3.2 4.3 2.1 1.5 2.1
2009 127.4 89.3 123.1 4.0 2.8 3.9 1.9 1.4 1.8
4 Chhattisgarh 2005 120.2 73.6 110.2 3.7 2.2 3.4 1.8 1.0 1.6
2009 104.7 66.0 97.0 3.2 2.0 3.0 1.6 0.9 1.4
5 Delhi 2005 76.3 71.7 72.4 2.2 2.1 2.1 1.0 1.0 1.0
2009 74.7 66.0 67.2 2.0 1.9 1.9 0.9 0.9 0.9
6 Gujarat 2005 101.2 79.0 92.2 3.1 2.3 2.8 1.4 1.0 1.3
2009 92.8 73.9 85.2 2.8 2.1 2.5 1.3 1.3 1.2
7 Haryana 2005 105.1 79.4 97.0 3.0 2.3 2.8 1.4 1.0 1.3
2009 90.8 74.1 85.6 2.6 2.2 2.5 1.1 1.0 1.1
8 Himachal Pradesh 2005 75.5 45.8 72.5 2.2 1.5 2.2 1.1 0.7 1.1
2009 62.8 39.7 60.6 1.9 1.3 1.9 0.9 0.6 0.9
9 Jammu &Kashmir 2005 81.4 50.0 73.7 2.6 1.6 2.4 1.2 0.7 1.1
2009 74.5 46.4 68.0 2.4 1.4 2.2 1.1 0.7 1.0
10 Jharkhand 2005 126.0 74.4 114.8 3.9 2.3 3.5 1.9 1.1 1.7
2009 110.8 72.2 102.8 3.4 2.2 3.2 1.7 1.0 1.6
11 Karnataka 2005 83.9 62.4 75.9 2.5 1.8 2.2 1.2 0.8 1.1
2009 75.3 60.1 69.5 2.2 1.7 2.0 1.1 0.9 1.0
12 Kerala 2005 53.6 51.7 53.2 1.7 1.7 1.7 0.8 0.8 0.8
2009 52.2 52.6 52.3 1.7 1.8 1.7 0.8 0.9 0.8
13 Madhya Pradesh 2005 137.1 84.1 123.6 4.0 2.5 3.6 1.9 1.2 1.7
2009 120.7 76.4 110.1 3.6 2.3 3.3 1.8 1.0 1.6
14 Maharashtra 2005 80.4 67.0 74.3 2.4 1.9 2.2 1.1 0.9 1.0
2009 70.9 60.1 66.0 2.1 1.8 1.9 0.9 0.8 0.9
15 Odisha 2005 90.6 58.3 85.6 2.7 1.7 2.6 1.3 0.8 1.2
2009 82.3 54.4 78.1 2.5 1.6 2.4 1.2 0.8 1.1
16 Punjab 2005 74.7 64.3 70.6 2.2 1.9 2.1 1.0 0.9 0.9
2009 66.3 57.9 63.1 1.9 1.7 1.9 0.9 0.8 0.9
17 Rajasthan 2005 136.1 94.8 124.9 4.0 2.7 3.7 1.9 1.3 1.7
2009 117.8 86.6 109.8 3.6 2.5 3.3 1.7 1.2 1.6
18 Tamil Nadu 2005 62.1 55.2 59.1 1.8 1.6 1.7 0.9 0.8 0.8
2009 60.5 55.4 58.2 1.8 1.7 1.7 0.9 0.8 0.8
19 Uttar Pradesh 2005 142.3 106.4 134.6 4.5 3.3 4.2 2.1 1.5 2.0
2009 125.1 94.4 118.8 3.9 3.0 3.7 1.8 1.3 1.7
20 West Bengal 2005 83.6 46.1 72.7 2.4 1.4 2.1 1.1 0.7 1.0
2009 71.2 43.1 63.3 2.1 1.3 1.9 1.0 0.7 0.9
ALL INDIA 2005 106.2 70.9 95.8 3.2 2.1 2.9 1.5 1.0 1.4
2009 94.9 65.9 86.5 2.9 2.0 2.6 1.4 0.9 1.2
Source: Ministry of Health and Family Welfare, Family Welfare Statistics in India – 2011.

Rural Development Statistics
Population
Table 1.23: General Marital Fertility Rate and Total Marital Fertility Rates
In Rural Areas of Major States
(2005 & 2009)
General Marital Fertility Rate (GMFR)
(No. of live births per 1000 married women)
Total Marital Fertility Rate (TMFR)
(Children born per woman)
2005 2009 2005 2009
Andhra Pradesh 98.0 89.3 3.4 3.4
Assam 160.5 145.8 5.4 5.2
Bihar 173.7 165.9 5.2 5.3
Chhattisgarh 161.5 141.4 5.3 4.7
Delhi 104.9 103.0 3.9 3.8
Gujarat 133.8 124.1 4.3 4.3
Haryana 139.0 124.5 4.5 4.5
Himachal Pradesh 106.8 89.6 4.7 4.7
Jammu and Kashmir 133.8 129.5 4.8 5.4
Jharkhand 159.4 150.9 4.9 5.2
Karnataka 117.7 107.3 4.1 3.9
Kerala 77.9 73.1 4.1 3.7
Madhya Pradesh 170.3 157.0 5.1 5.1
Maharashtra 104.7 92.4 3.5 3.2
Odisha 127.3 116.9 4.2 4.4
Punjab 107.5 98.2 4.5 4.1
Rajasthan 165.2 150.6 4.8 4.6
Tamil Nadu 90.6 86.9 4.0 3.9
Uttar Pradesh 186.3 175.2 5.6 5.7
West Bengal 108.3 92.8 3.7 3.5
India 140.7 129.8 4.5 4.5
General Marital Fertility Rate (GMFR): Number of live births per 1000 married women in the reproductive age-group (15-49
years) in a given year.
Total Marital Fertility Rate (TMFR) : Average number of children that would be born to a married woman if she experiences the current fertility pattern throughout her reproductive span (15-49 years)
Source: GOI, Ministry of Health and Family Welfare, Family Welfare Statistics in India , 2011.

Rural Development Statistics
Population
Table 1.24: Expectation of Life at Birth in India
(1901-11 to 2021-2025)
S.No. Period Expectation of life at birth (in years)
Male Female Person
1. 1901-1911 22.6 23.3 22.9
2. 1911-1921 19.4 20.9 20.1
3. 1921-1931 26.9 26.6 26.8
4. 1931-1941 32.1 31.4 31.8
5. 1941-1951 32.4 31.7 32.1
6. 1951-1961 41.9 40.6 41.3
7. 1961-1971 46.4 44.7 45.6
8. 1970-1975 50.5 49.0 49.7
9. 1976-1980 52.5 52.1 52.3
10. 1981-1985 55.4 55.7 55.5
11. 1986-1990 57.7 58.1 57.7
12. 1987-91 * 58.1 58.6 58.3
13. 1988-92 * 58.6 59.0 58.7
14. 1989-93 * 59.0 59.7 59.4
15. 1990-94 * 59.4 60.4 60.0
16. 1991-95 * 59.7 60.9 60.3
17. 1992-96 * 60.1 61.4 60.7
18. 1993-97 * 60.4 61.8 61.1
19. 1994-98 60.6 62.2 61.4
20. 1995-99 60.8 62.5 61.7
21. 1991-1996 (P) 60.6 61.7 61.2
22. 1996-2001 (P) 62.8 63.4 NA
23. 2001-2005 (P) 63.8 66.1 NA
24. 2006-2010 (P) 65.8 68.1 NA
25. 2011-2015 (P) 67.3 69.6 NA
26. 2016-2020 (P) 68.8 71.1 NA
27. 2021-2025 (P) 69.8 72.3 NA
P: Projected NA : Not Available * Excludes Jammu and Kashmir
Source: G O I, Ministry o f Health and Family Welfare, Family Welfare Statistics in India, 2011.
Expectation of Life at birth in India (1991-95 to 2021-2025)
54
56
58
60
62
64
66
68
70
72
74
1991-
95
1992-
96
1993-
97
1994-
98
1995-
99
1991-
1996
1996-
2001
2001-
2005
2006-
2010
2011-
2015
2016-
2020
2021-
2025
Period
Ye
ars
Male Female

Rural Development Statistics
Population
Table 1.25: Expectation of Life at Birth by Sex –State-wise
(2002-2006)
(in Years)
States
Total Rural Urban
Total Males Females Total Males Females Total Males Females
India 63.5 62.6 64.2 62.1 61.2 62.7 68.8 67.1 70.0
Andhra Pradesh 64.4 62.9 65.5 63.1 61.7 64.3 67.8 66.1 69.4
Assam 58.9 58.6 59.3 57.9 57.7 58.3 67.6 67.1 68.3
Bihar 61.6 62.2 60.4 60.7 61.7 59.7 67.5 66.7 68.3
Gujarat 64.1 62.9 65.2 62.7 61.7 63.7 66.6 65.3 68.4
Haryana 66.2 65.9 66.3 65.4 65.4 65.2 69.2 67.4 70.7
Himachal Pradesh 67.0 66.5 67.3 66.9 66.4 67.0 69.1 67.5 70.8
Karnataka 65.3 63.6 67.1 63.7 61.8 65.6 69.5 68.1 70.5
Kerala 74.0 71.4 76.3 73.8 71.4 76.1 74.6 70.8 76.7
Madhya Pradesh 58.0 58.1 57.9 56.6 56.7 56.3 65.1 64.2 66.0
Maharashtra 67.2 66.0 68.4 65.2 64.0 66.3 71.2 69.6 72.8
Odisha 59.6 59.5 59.6 58.8 58.8 58.8 66.4 64.3 67.7
Punjab 69.4 68.4 70.4 68.5 67.7 69.2 71.2 69.7 72.7
Rajasthan 62.0 61.5 62.3 60.6 60.4 60.7 67.0 66.7 67.2
Tamil Nadu 66.2 65.0 67.4 64.5 63.5 65.5 69.6 67.6 71.8
Uttar Pradesh 60.0 60.3 59.5 59.2 59.7 58.5 64.0 63.2 64.6
West Bengal 64.9 64.1 65.8 63.5 62.6 64.3 69.9 68.9 71.3
Source: G O I, Ministry o f Health and Family Welfare, Family Welfare Statistics in India, 2011.

Rural Development Statistics
Population
PROJECTIONS
Table 1.26: Major Demographic Indicators (2011-15 to 2021-25)
S.No. Indices 2011-15 2016-20 2021-25
1 Projected values of Expectation of life at birth
Males 67.3 68.8 69.8
Females 69.6 71.1 72.3
2 Total Fertility Rate (TFR) 2.3 2.2 2.0
3 Projected Population (in Millions)
1269.0 1339.70 1399.80
Source: G O I, Census of India 2011, Provisional Population Totals, Paper-1 of 2011, Registrar General, India.

Rural Development Statistics
Population
Table 1.27: Projected Levels of the Expectation of Life at Birth
State-wise (2011-15, 2016-20 and 2021-25) (in Years)
S. No.
State/UT
Male Female
2011-15 2016-20 2021-25 2011-15 2016-20 2021-25
INDIA 67.3 68.8 69.8 69.6 71.1 72.3 1 Andhra Pradesh 66.9 68.4 69.4 70.9 72.1 73.3
2 Assam 63.6 65.6 67.1 64.8 66.8 68.8
3 Bihar 68.6 69.6 70.6 68.7 70.2 71.4
4 Chhattisgarh 63.0 65.0 66.5 66.0 68.0 69.5
5 Delhi 72.2 73.0 73.5 75.8 76.6 77.4
6 Gujarat 69.2 70.7 71.9 72.5 73.7 74.9
7 Haryana 68.9 69.9 70.9 71.3 72.5 73.7
8 Himachal Pradesh 70.8 71.6 72.4 74.3 75.3 76.1
9 Jammu & Kashmir 66.5 68.0 69.2 69.3 71.3 72.8
10 Jharkhand 67.5 68.5 69.5 66.0 68.0 69.5
11 Karnataka 68.0 69.0 70.0 72.3 73.5 74.5
12 Kerala 73.2 74.2 75.2 77.6 78.1 78.6
13 Madhya Pradesh 64.5 66.5 68.0 65.3 67.3 69.3
14 Maharashtra 68.9 69.9 70.9 72.5 73.7 74.7
15 Odisha 64.3 66.3 67.8 67.3 69.6 71.6
16 Punjab 69.7 70.7 71.5 72.8 73.8 74.8
17 Rajasthan 67.6 68.6 69.6 70.7 71.9 73.1
18 Tamil Nadu 68.6 69.6 70.6 71.8 73.0 74.0
19 Uttar Pradesh 66.0 67.5 68.7 66.9 69.2 71.2
20 Uttarakhand 66.0 67.5 68.5 69.5 71.0 72.2
21 West Bengal 69.2 70.2 71.0 72.1 73.3 74.3
Source: G O I, Ministry o f Health and Family Welfare, Family Welfare Statistics in India, 2011.