Embed Size (px)
Citation preview
171S1.2q Functions and Graphs
1
January 10, 2013
Jan 51:47 PM
Copyright © 2009 Pearson Education, Inc.
CHAPTER 1: Graphs, Functions, and Models
1.1 Introduction to Graphing1.2 Functions and Graphs1.3 Linear Functions, Slope, and Applications1.4 Equations of Lines and Modeling1.5 Linear Equations, Functions, Zeros and Applications1.6 Solving Linear Inequalities
MAT 171Dr. Claude Moore, CFCC
Jan 103:33 PM
Jan 108:04 AM Aug 229:34 PM
Section 1.2 Finding Function Values
Mathematica Interactive Figures are available through Tools for Success, Activities and Projects in CourseCompass. You may access these through CourseCompass or from the Important Links webpage. You must Login to MML to use this link.
Section 1.2 Domain and Range of a Function
Interactive Figures Demonstration Video
Jan 108:14 AM Jan 51:47 PM
Copyright © 2009 Pearson Education, Inc.
1.2 Functions and Graphs
• Determine whether a correspondence or a relation is a function.
• Find function values, or outputs, using a formula or a graph.
• Graph functions.• Determine whether a graph is that of a function.
• Find the domain and the range of a function.
• Solve applied problems using functions.
171S1.2q Functions and Graphs
2
January 10, 2013
Jan 51:47 PM
Copyright © 2009 Pearson Education, Inc.
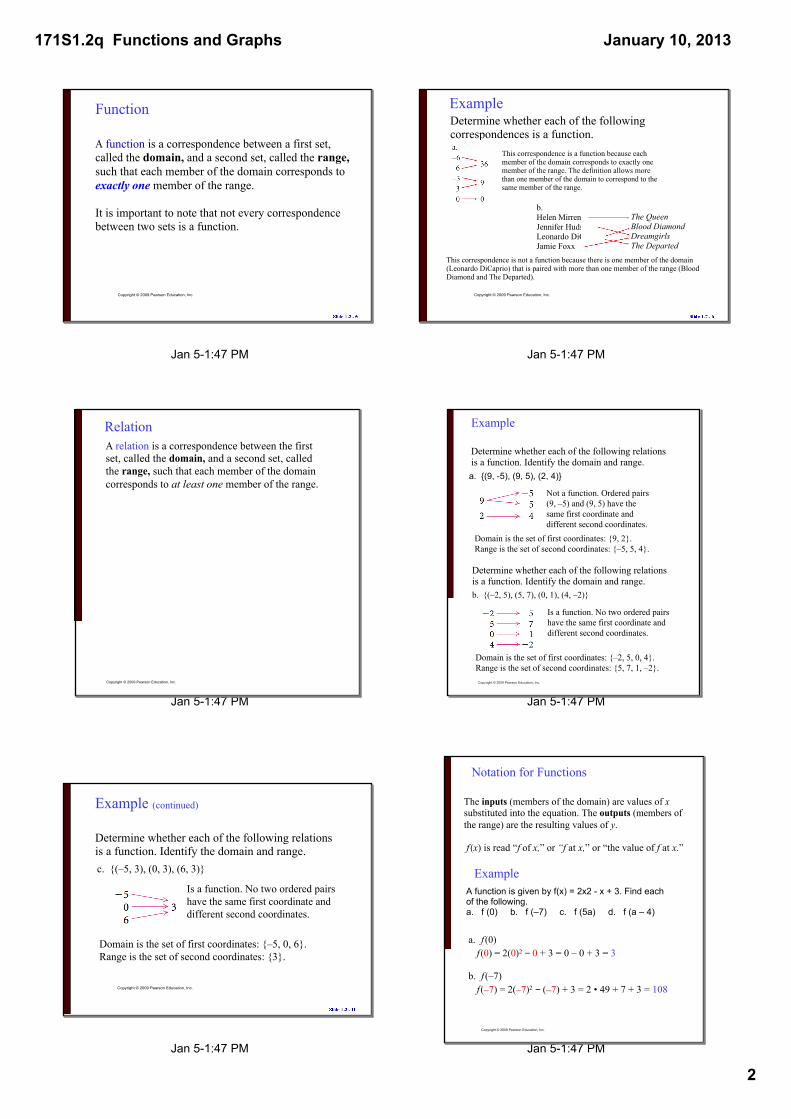
Function
A function is a correspondence between a first set, called the domain, and a second set, called the range, such that each member of the domain corresponds to exactly one member of the range.
It is important to note that not every correspondence between two sets is a function.
Jan 51:47 PM
Copyright © 2009 Pearson Education, Inc.
ExampleDetermine whether each of the following correspondences is a function.
This correspondence is a function because each member of the domain corresponds to exactly one member of the range. The definition allows more than one member of the domain to correspond to the same member of the range.
b.Helen MirrenJennifer HudsonLeonardo DiCaprioJamie Foxx
The QueenBlood DiamondDreamgirlsThe Departed
This correspondence is not a function because there is one member of the domain (Leonardo DiCaprio) that is paired with more than one member of the range (Blood Diamond and The Departed).
Jan 51:47 PM
Copyright © 2009 Pearson Education, Inc.
RelationA relation is a correspondence between the first set, called the domain, and a second set, called the range, such that each member of the domain corresponds to at least one member of the range.
Jan 51:47 PM
Copyright © 2009 Pearson Education, Inc.
Determine whether each of the following relations is a function. Identify the domain and range.b. (–2, 5), (5, 7), (0, 1), (4, –2)
Is a function. No two ordered pairs have the same first coordinate and different second coordinates.
Domain is the set of first coordinates: –2, 5, 0, 4. Range is the set of second coordinates: 5, 7, 1, –2.
Example
Determine whether each of the following relations is a function. Identify the domain and range.a. (9, 5), (9, 5), (2, 4)
Not a function. Ordered pairs (9, –5) and (9, 5) have the same first coordinate and different second coordinates.
Domain is the set of first coordinates: 9, 2. Range is the set of second coordinates: –5, 5, 4.
Jan 51:47 PM
Copyright © 2009 Pearson Education, Inc.
Example (continued)
Determine whether each of the following relations is a function. Identify the domain and range.c. (–5, 3), (0, 3), (6, 3)
Is a function. No two ordered pairs have the same first coordinate and different second coordinates.
Domain is the set of first coordinates: –5, 0, 6. Range is the set of second coordinates: 3.
Jan 51:47 PM
Copyright © 2009 Pearson Education, Inc.
Notation for Functions
The inputs (members of the domain) are values of x substituted into the equation. The outputs (members of the range) are the resulting values of y.
f (x) is read “f of x,” or “f at x,” or “the value of f at x.”
Example
a. f (0)f (0) = 2(0)2 − 0 + 3 = 0 – 0 + 3 = 3
b. f (–7)f (–7) = 2(–7)2 − (–7) + 3 = 2 • 49 + 7 + 3 = 108
A function is given by f(x) = 2x2 x + 3. Find each of the following.a. f (0) b. f (–7) c. f (5a) d. f (a – 4)
171S1.2q Functions and Graphs
3
January 10, 2013
Jan 51:47 PM
Copyright © 2009 Pearson Education, Inc.
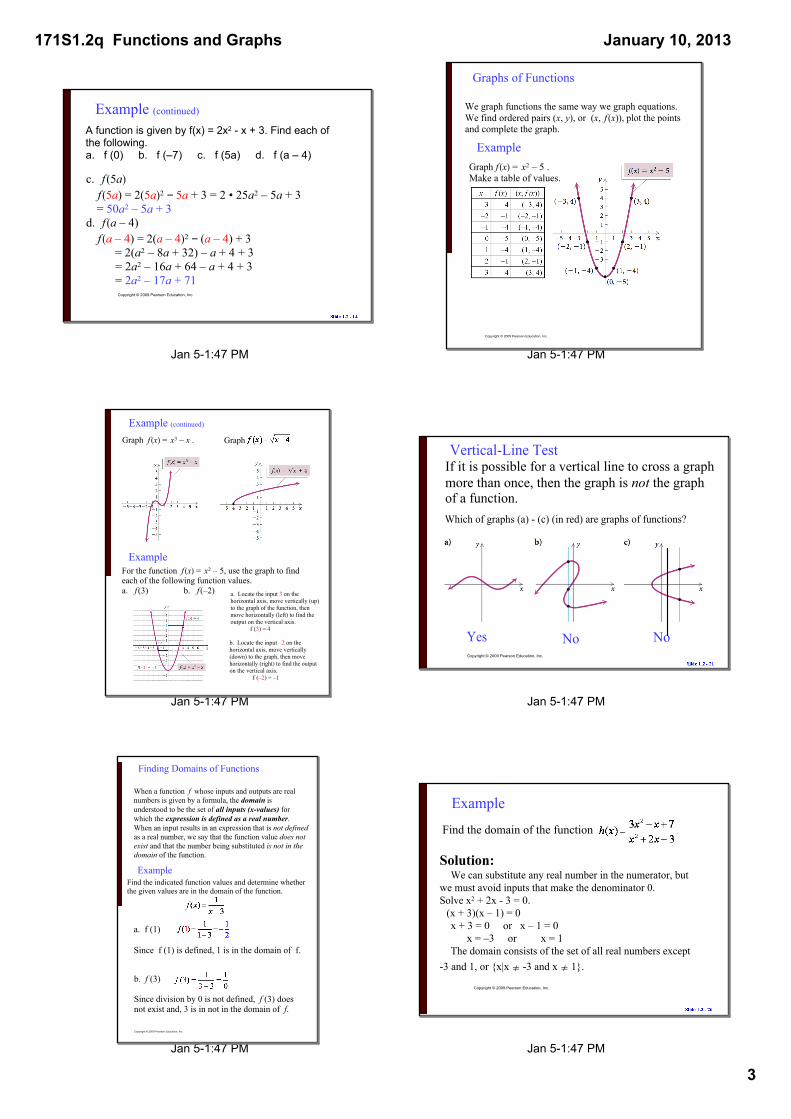
Example (continued)
c. f (5a)f (5a) = 2(5a)2 − 5a + 3 = 2 • 25a2 – 5a + 3
= 50a2 – 5a + 3d. f (a – 4)f (a – 4) = 2(a – 4)2 − (a – 4) + 3
= 2(a2 – 8a + 32) – a + 4 + 3 = 2a2 – 16a + 64 – a + 4 + 3 = 2a2 – 17a + 71
A function is given by f(x) = 2x2 x + 3. Find each of the following.a. f (0) b. f (–7) c. f (5a) d. f (a – 4)
Jan 51:47 PM
Copyright © 2009 Pearson Education, Inc.
Graphs of Functions
We graph functions the same way we graph equations. We find ordered pairs (x, y), or (x, f (x)), plot the points and complete the graph.
ExampleGraph f (x) = x2 – 5 .Make a table of values.
Jan 51:47 PM
Copyright © 2009 Pearson Education, Inc.
Example (continued)Graph f (x) = x3 – x . Graph
ExampleFor the function f (x) = x2 – 5, use the graph to find each of the following function values.a. f (3) b. f (–2) a. Locate the input 3 on the
horizontal axis, move vertically (up) to the graph of the function, then move horizontally (left) to find the output on the vertical axis. f (3) = 4
b. Locate the input –2 on the horizontal axis, move vertically (down) to the graph, then move horizontally (right) to find the output on the vertical axis. f (–2) = –1
Jan 51:47 PM
Copyright © 2009 Pearson Education, Inc.
VerticalLine TestIf it is possible for a vertical line to cross a graph more than once, then the graph is not the graph of a function.Which of graphs (a) (c) (in red) are graphs of functions?
Yes No No
Jan 51:47 PM
Copyright © 2009 Pearson Education, Inc.
Finding Domains of Functions
When a function f whose inputs and outputs are real numbers is given by a formula, the domain is understood to be the set of all inputs (xvalues) for which the expression is defined as a real number. When an input results in an expression that is not defined as a real number, we say that the function value does not exist and that the number being substituted is not in the domain of the function.
ExampleFind the indicated function values and determine whether the given values are in the domain of the function.
a. f (1)
Since f (1) is defined, 1 is in the domain of f.
b. f (3)
Since division by 0 is not defined, f (3) does not exist and, 3 is in not in the domain of f.
Jan 51:47 PM
Copyright © 2009 Pearson Education, Inc.
Example
Find the domain of the function
Solution: We can substitute any real number in the numerator, but
we must avoid inputs that make the denominator 0. Solve x2 + 2x 3 = 0. (x + 3)(x – 1) = 0x + 3 = 0 or x – 1 = 0 x = –3 or x = 1The domain consists of the set of all real numbers except
3 and 1, or x|x ≠ 3 and x ≠ 1.
171S1.2q Functions and Graphs
4
January 10, 2013
Jan 51:47 PM
Copyright © 2009 Pearson Education, Inc.
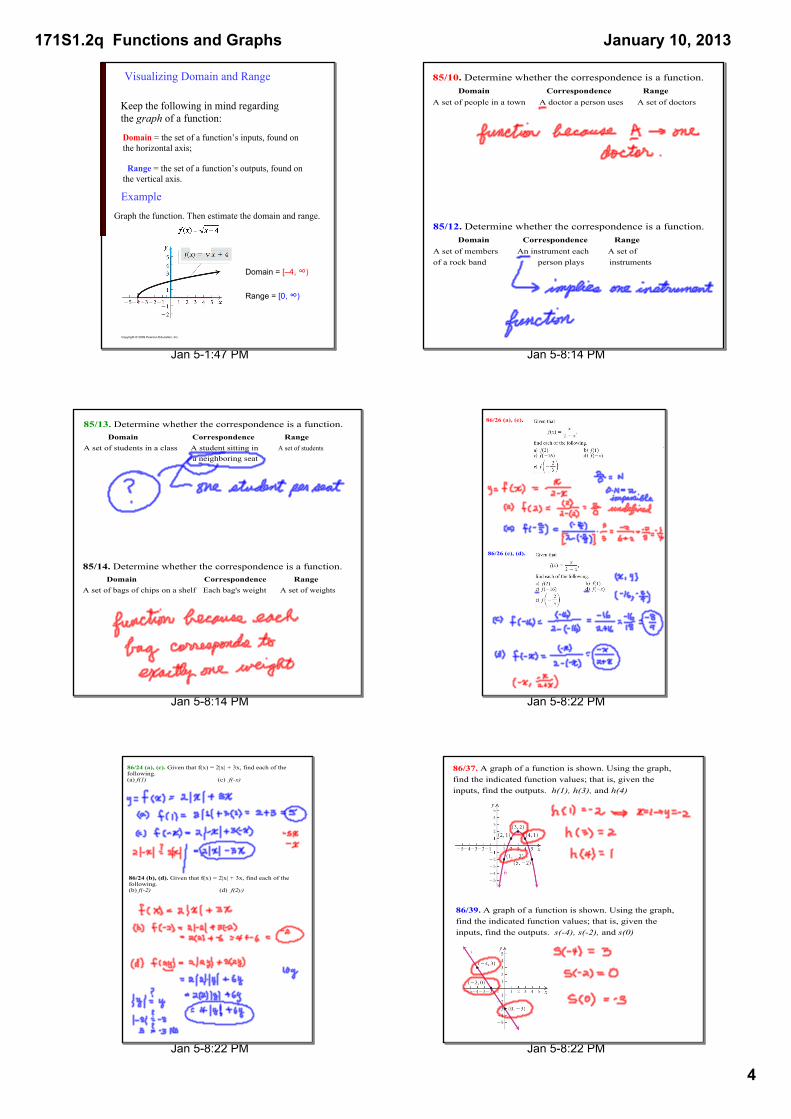
Visualizing Domain and Range
Domain = the set of a function’s inputs, found on the horizontal axis;
Range = the set of a function’s outputs, found on the vertical axis.
Keep the following in mind regarding the graph of a function:
ExampleGraph the function. Then estimate the domain and range.
Domain = [–4, ∞)
Range = [0, ∞)
Jan 58:14 PM
85/10. Determine whether the correspondence is a function. Domain Correspondence RangeA set of people in a town A doctor a person uses A set of doctors
85/12. Determine whether the correspondence is a function. Domain Correspondence RangeA set of members An instrument each A set of of a rock band person plays instruments
Jan 58:14 PM
85/13. Determine whether the correspondence is a function. Domain Correspondence RangeA set of students in a class A student sitting in A set of students a neighboring seat
85/14. Determine whether the correspondence is a function. Domain Correspondence RangeA set of bags of chips on a shelf Each bag's weight A set of weights
Jan 58:22 PM
86/26 (a), (e).
86/26 (c), (d).
Jan 58:22 PM
86/24 (a), (c). Given that f(x) = 2|x| + 3x, find each of the following.(a) f(1) (c) f(x)
86/24 (b), (d). Given that f(x) = 2|x| + 3x, find each of the following.(b) f(2) (d) f(2y)
Jan 58:22 PM
86/37. A graph of a function is shown. Using the graph, find the indicated function values; that is, given the inputs, find the outputs. h(1), h(3), and h(4)
86/39. A graph of a function is shown. Using the graph, find the indicated function values; that is, given the inputs, find the outputs. s(4), s(2), and s(0)
171S1.2q Functions and Graphs
5
January 10, 2013
Jan 58:22 PM
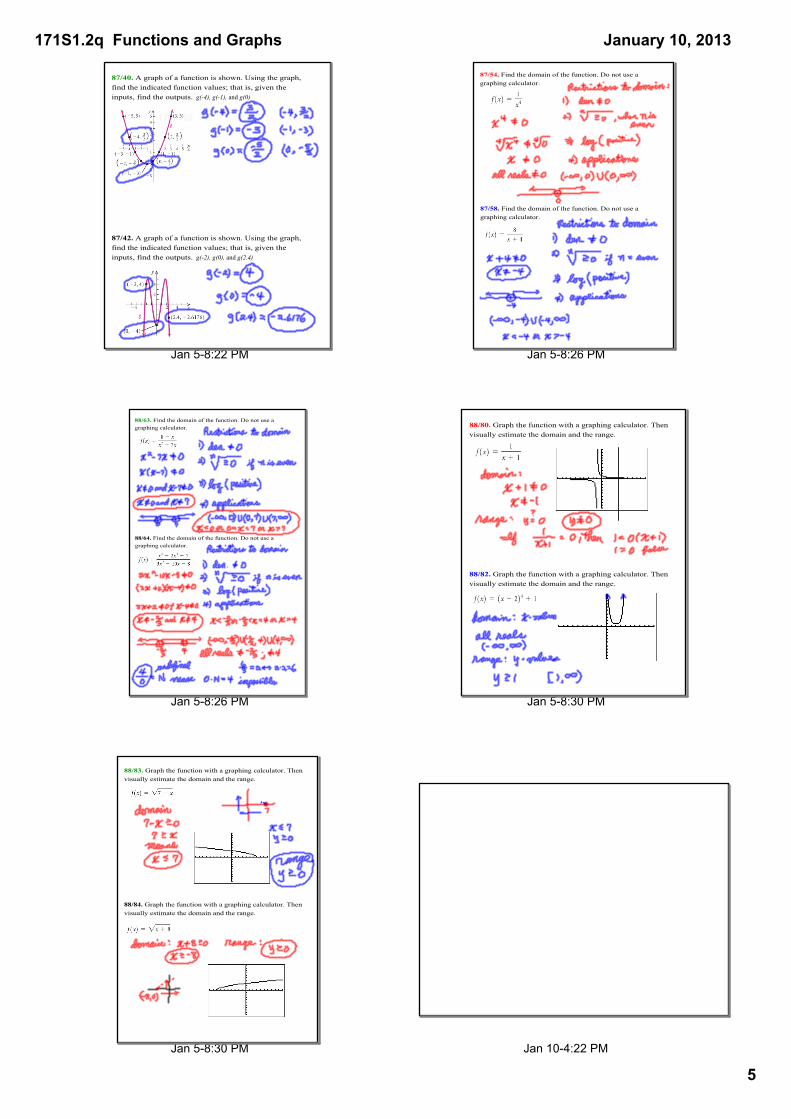
87/40. A graph of a function is shown. Using the graph, find the indicated function values; that is, given the inputs, find the outputs. g(4), g(1), and g(0)
87/42. A graph of a function is shown. Using the graph, find the indicated function values; that is, given the inputs, find the outputs. g(2), g(0), and g(2.4)
Jan 58:26 PM
87/54. Find the domain of the function. Do not use a graphing calculator.
87/58. Find the domain of the function. Do not use a graphing calculator.
Jan 58:26 PM
88/63. Find the domain of the function. Do not use a graphing calculator.
88/64. Find the domain of the function. Do not use a graphing calculator.
Jan 58:30 PM
88/80. Graph the function with a graphing calculator. Then visually estimate the domain and the range.
88/82. Graph the function with a graphing calculator. Then visually estimate the domain and the range.
Jan 58:30 PM
88/83. Graph the function with a graphing calculator. Then visually estimate the domain and the range.
88/84. Graph the function with a graphing calculator. Then visually estimate the domain and the range.
Jan 104:22 PM


![MAT 155 Lab 10 Sections 8.1-5 Hypothesis Testing - Part 3 ...cfcc.edu/faculty/cmoore/MAT155-lab10ans.pdf · MAT] 55 Lab 10 Sections 8.] -5 Hypothesis Testing - Part 3 Lab] OHypothesis-3.doc](https://img.pdfslide.net/doc/110x75/5c23a59609d3f2d84c8be353/mat-155-lab-10-sections-81-5-hypothesis-testing-part-3-cfccedufacultycmooremat155-.jpg)