Embed Size (px)
Citation preview
Suwannee River Basin Plan 2–1
In This Section River Basin Description
Population and Land Use
Local Governments and Planning Authorities
Water Use Classifications
Section 2
River Basin Characteristics This section describes the following major characteristics of the Suwannee River
basin:
• River basin description (Section 2.1): the physical features and natural processes of the basin.
• Population and land use (Section 2.2): the sociological features of the basin, including the types of human activities that might affect water quality and water resource use.
• Local governments and planning authorities (Section 2.3): identification and roles of the local authorities within the basin.
• Water use classifications (Section 2.4): description of water use classifications and baseline goals for management of waters within the basin as defined in the state regulatory framework.
2.1 River Basin Description
This section describes the important geographical, geological, hydrological, and biological characteristics of the Suwannee River basin.
The physical characteristics of the Suwannee River basin include its location, physiography, soils, climate, surface water and ground water resources, and natural water quality. These physical characteristics influence the basin’s biological habitats and the ways people use the basin’s land and water resources.
2.1.1 River Basin Boundaries
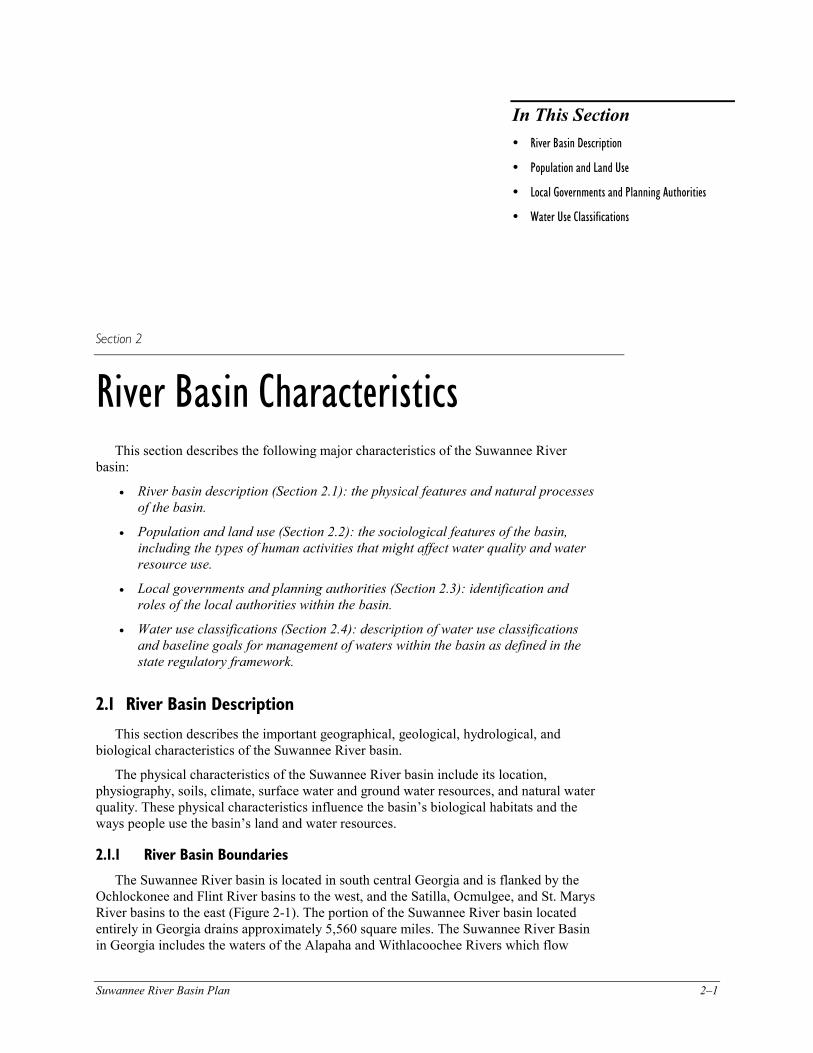
The Suwannee River basin is located in south central Georgia and is flanked by the Ochlockonee and Flint River basins to the west, and the Satilla, Ocmulgee, and St. Marys River basins to the east (Figure 2-1). The portion of the Suwannee River basin located entirely in Georgia drains approximately 5,560 square miles. The Suwannee River Basin in Georgia includes the waters of the Alapaha and Withlacoochee Rivers which flow
Section 2. River Basin Characteristics
2–2 Suwannee River Basin Plan
Figure 2-1. Location of the Suwannee River Basin
N
50 0 50
SCALEMiles
Hydrologic Unit Boundaries
State Boundaries
Portion of Suwannee within Georgia
Major Rivers
FLORIDA
SUWANNEE
GEORGIA
SATILLA
SAINT MARYSOCHLOCKONEE
Section 2. River Basin Characteristics
Suwannee River Basin Plan 2–3
south into Florida and join the Suwannee River which empties into the Gulf of Mexico. The Suwannee River basin drains approximately 10,000 square miles, with approximately 5,560 square miles of the basin in Georgia.
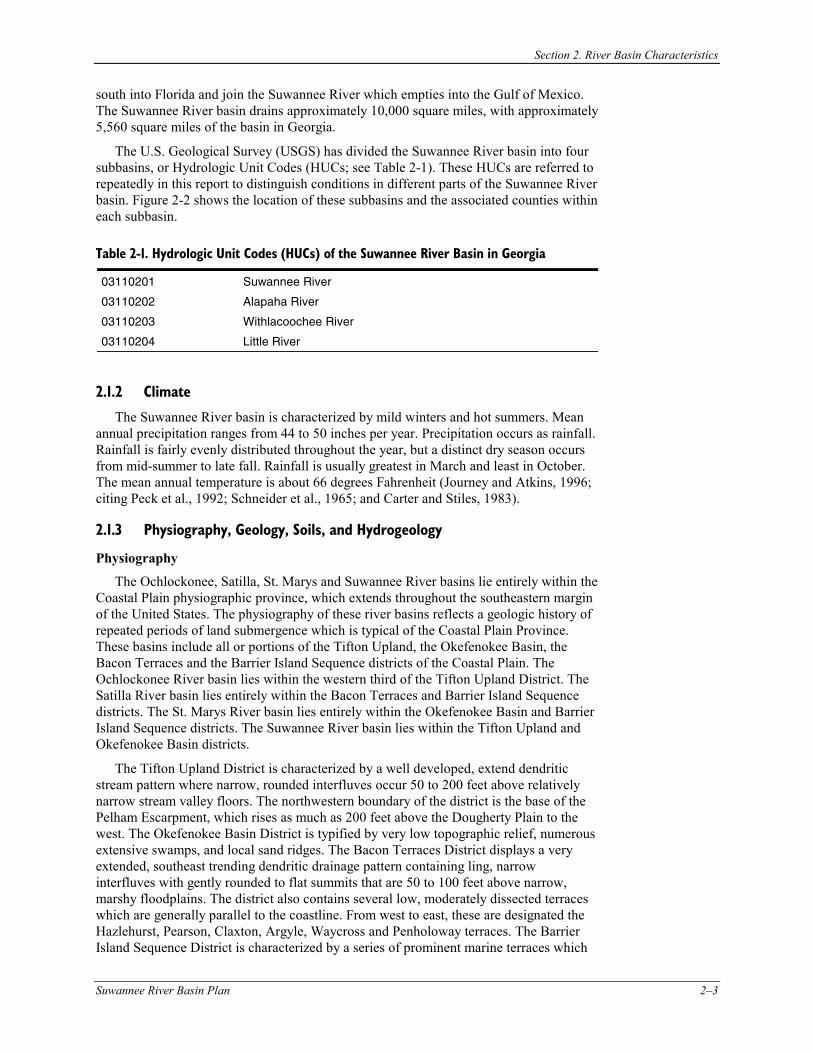
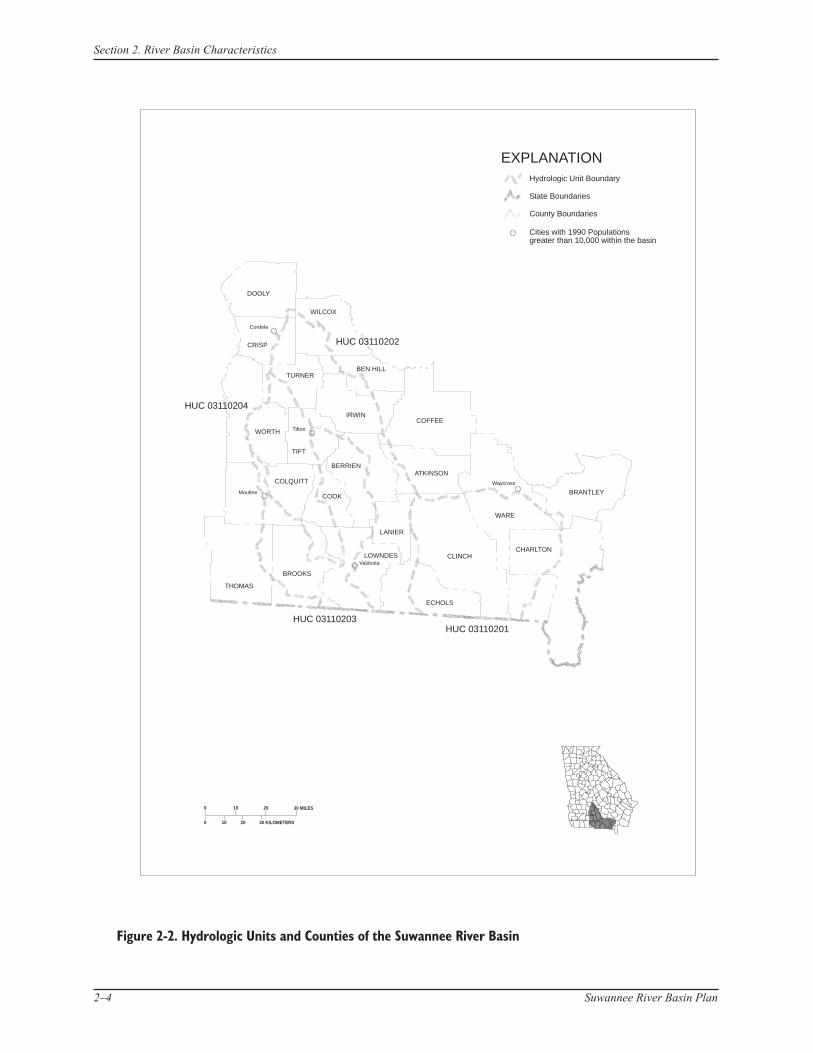
The U.S. Geological Survey (USGS) has divided the Suwannee River basin into four subbasins, or Hydrologic Unit Codes (HUCs; see Table 2-1). These HUCs are referred to repeatedly in this report to distinguish conditions in different parts of the Suwannee River basin. Figure 2-2 shows the location of these subbasins and the associated counties within each subbasin.
Table 2-1. Hydrologic Unit Codes (HUCs) of the Suwannee River Basin in Georgia
03110201 Suwannee River
03110202 Alapaha River
03110203 Withlacoochee River
03110204 Little River
2.1.2 Climate
The Suwannee River basin is characterized by mild winters and hot summers. Mean annual precipitation ranges from 44 to 50 inches per year. Precipitation occurs as rainfall. Rainfall is fairly evenly distributed throughout the year, but a distinct dry season occurs from mid-summer to late fall. Rainfall is usually greatest in March and least in October. The mean annual temperature is about 66 degrees Fahrenheit (Journey and Atkins, 1996; citing Peck et al., 1992; Schneider et al., 1965; and Carter and Stiles, 1983).
2.1.3 Physiography, Geology, Soils, and Hydrogeology
Physiography
The Ochlockonee, Satilla, St. Marys and Suwannee River basins lie entirely within the Coastal Plain physiographic province, which extends throughout the southeastern margin of the United States. The physiography of these river basins reflects a geologic history of repeated periods of land submergence which is typical of the Coastal Plain Province. These basins include all or portions of the Tifton Upland, the Okefenokee Basin, the Bacon Terraces and the Barrier Island Sequence districts of the Coastal Plain. The Ochlockonee River basin lies within the western third of the Tifton Upland District. The Satilla River basin lies entirely within the Bacon Terraces and Barrier Island Sequence districts. The St. Marys River basin lies entirely within the Okefenokee Basin and Barrier Island Sequence districts. The Suwannee River basin lies within the Tifton Upland and Okefenokee Basin districts.
The Tifton Upland District is characterized by a well developed, extend dendritic stream pattern where narrow, rounded interfluves occur 50 to 200 feet above relatively narrow stream valley floors. The northwestern boundary of the district is the base of the Pelham Escarpment, which rises as much as 200 feet above the Dougherty Plain to the west. The Okefenokee Basin District is typified by very low topographic relief, numerous extensive swamps, and local sand ridges. The Bacon Terraces District displays a very extended, southeast trending dendritic drainage pattern containing ling, narrow interfluves with gently rounded to flat summits that are 50 to 100 feet above narrow, marshy floodplains. The district also contains several low, moderately dissected terraces which are generally parallel to the coastline. From west to east, these are designated the Hazlehurst, Pearson, Claxton, Argyle, Waycross and Penholoway terraces. The Barrier Island Sequence District is characterized by a series of prominent marine terraces which
Section 2. River Basin Characteristics
2–4 Suwannee River Basin Plan
0
0
10
10
20
20
30 KILOMETERS
30 MILES
Figure 2-2. Hydrologic Units and Counties of the Suwannee River Basin
EXPLANATIONHydrologic Unit Boundary
State Boundaries
County Boundaries
Cities with 1990 Populationsgreater than 10,000 within the basin
DOOLY
HUC 03110202
WILCOX
CRISP
Cordele
TURNERBEN HILL
IRWIN
WORTH
TIFT
COFFEE
BERRIEN
COLQUITTATKINSON
COOK
LANIER
LOWNDES
BROOKS
ECHOLS
THOMAS
CLINCHCHARLTON
WARE
BRANTLEY
Tifton
Moultrie
Valdosta
Waycross
HUC 03110204
HUC 03110203HUC 03110201
Section 2. River Basin Characteristics
Suwannee River Basin Plan 2–5
form a step-like progression of decreasing altitudes toward the sea. The former, higher sea levels created barrier island-salt marsh environments parallel to and similar to those found on the present coast. The terraces are composed of sand ridges marking the former barrier islands, and are flanked by fresh water marshes at the former salt marsh locations. They have undergone slight to moderate dissection which is generally more advanced at the western edge of the district. Trail Ridge is the most prominent of these terraces with a maximum elevation of approximately 160 feet. It marks the western boundary of the Barrier Island Sequence District where it joins the Bacon Terraces and Okefenokee Basin districts. Other, less prominent terraces in the district, from west to east, are the Wicomico, Penholoway, Talbot, Pamlico, Princess Anne, and Silver Bluff-Holocene terraces.
The streams in these basins are typical of the Coastal Plain. They generally lack the riffles and shoals that are common to streams in the Piedmont Province to the north, and exhibit more extensive floodplain development and greater sinuosity.
Carolina Bays are elliptical or “spoon-shaped” wetland depressions aligned roughly north-northwest and are logically well developed throughout the area east of the Suwannee River basin. Lime sinks and lake-filled sinks are well developed in areas underlain by limestone in the shallow subsurface, notably in the Lake Park area south and west of Valdosta, Lowndes County.
Geology
Weathered, poorly consolidated sediments underlie all of these river basins, and are dominantly composed of sands, clays, and gravels which range from Miocene to Holocene in age. These sediments include the Miccosukee Formation (Pliocene age), Altamaha Formation and various formations of the Hawthorne Group (all Miocene age), as well as barrier island and marsh/lagoon facies of the numerous shoreline complexes (Pleistocene to Holocene age). Local occurrences of calcareous sediments include the Suwannee Limestone (Oligocene age) and Duplin Marl (Pliocene age). Other rock types in the area include dolomite, chert, peat, phosphate and fuller’s earth, as well as Quaternary alluvium in the flood plains along the major stream valleys. Most of these sediments were deposited in either terrestrial or shallow marine environments.
Sediments in the area are locally mined for construction sand and fill material. In addition, the Meigs Member of the Coosawhatchie Formation (Hawthorne Group) is the source of the economically important fuller’s earth clay deposits being mined in the Ochlockonee River Basin. In the past, crushed stone was produced from some of the limestone deposits, and a few of the larger Carolina Bays were mined for peat.
Soils
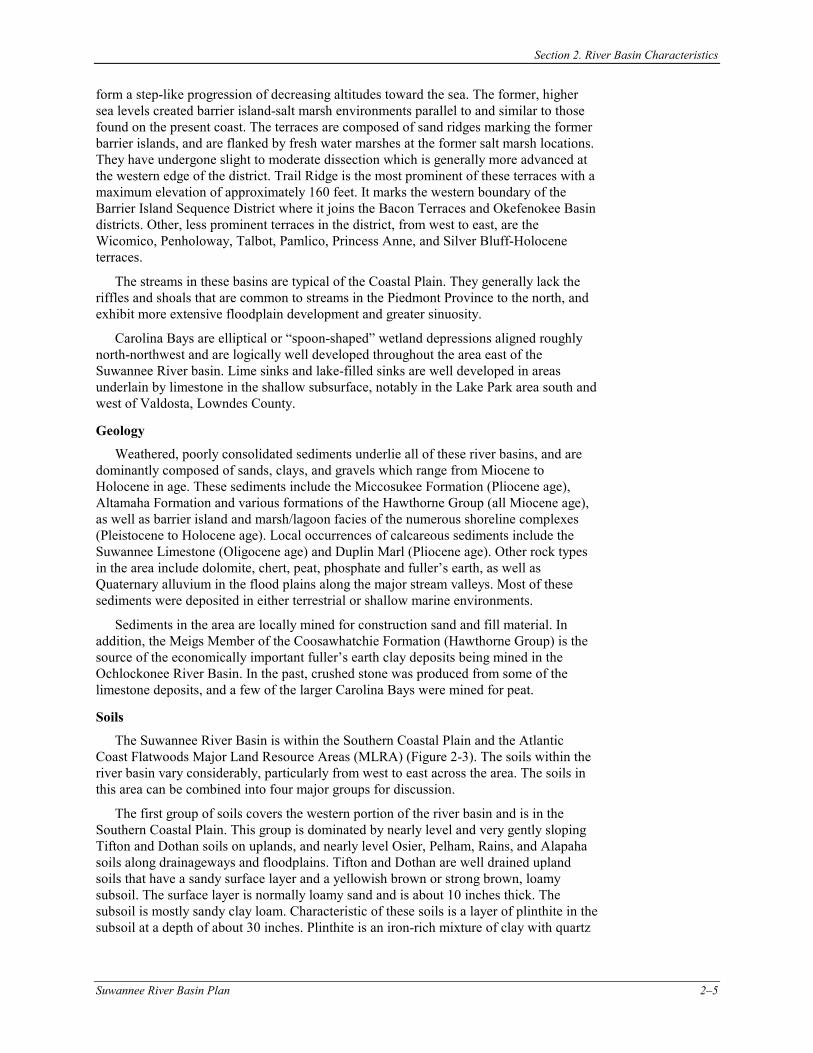
The Suwannee River Basin is within the Southern Coastal Plain and the Atlantic Coast Flatwoods Major Land Resource Areas (MLRA) (Figure 2-3). The soils within the river basin vary considerably, particularly from west to east across the area. The soils in this area can be combined into four major groups for discussion.
The first group of soils covers the western portion of the river basin and is in the Southern Coastal Plain. This group is dominated by nearly level and very gently sloping Tifton and Dothan soils on uplands, and nearly level Osier, Pelham, Rains, and Alapaha soils along drainageways and floodplains. Tifton and Dothan are well drained upland soils that have a sandy surface layer and a yellowish brown or strong brown, loamy subsoil. The surface layer is normally loamy sand and is about 10 inches thick. The subsoil is mostly sandy clay loam. Characteristic of these soils is a layer of plinthite in the subsoil at a depth of about 30 inches. Plinthite is an iron-rich mixture of clay with quartz
Section 2. River Basin Characteristics
2–6 Suwannee River Basin Plan
0
0
10
10
20
20
30 KILOMETERS
30 MILES
Figure 2-3. Suwannee River BasinMajor Land Resource Areas in the
EXPLANATION
Hydrologic Unit Boundary
State Boundaries
County Boundaries
Southern Coastal Plain
Atlantic Coast Flatwoods
Water
Carolina and Georgia Sand Hills
DOOLY
WILCOX
CRISP
TURNER BEN HILL
IRWIN
WORTH
TIFT
COFFEE
BERRIEN
COLQUITTATKINSON
COOK
LANIER
LOWNDES
BROOKS
ECHOLS
THOMAS
CLINCHCHARLTON
WARE
BRANTLEY
Section 2. River Basin Characteristics
Suwannee River Basin Plan 2–7
and other constituents that can perch water during wet seasons. The soils along drainageways and floodplains are poorly drained. Most of these soils are sandy throughout, but some of them have a loamy subsoil at various depths. Water tables are commonly at or near the surface during wet seasons, and the soils are subject to flooding.
The second group of soils are found at the transition between the Southern Coastal Plain and the Atlantic Coast Flatwoods MLRA's. This area contains soils some soils that are typical from both MLRA's, but it is dominated by nearly level, somewhat poorly drained and poorly drained soils, such as Leefield and Pelham. These soils have a sandy surface layer that is 20 to 40 inches thick over a loamy subsoil. Water tables range from near the surface to about 2.5 feet during wet seasons.
The third major group of soils is in the Atlantic Coast Flatwoods MLRA. This area is dominated by nearly level, poorly drained soils on broad flats, and by very poorly drained soils in depressions and along drainageways. This area is characterized by an abundance of Spodosols, which are sandy soils that have a layer where a complex of organic matter and aluminum has accumulated. Most of the soils in this area are sandy, although a loamy subsoil is sometimes found at depth of around 3 feet. Water tables are commonly at or near the surface during wet seasons, and soils in depressions are often ponded.
The fourth group of soils are also in the Atlantic Coast Flatwoods MLRA. These soils occur within the Okefenokee Swamp. This area is dominated by organic soils that are saturated and covered with water most of the time. These soils are extremely acid. They are normally underlain by sandy or loamy material at various depths. Scattered within the area of organic soils are islands of sandy mineral soils. These sandy soils are mostly poorly drained, with a water table at or near the surface during wet seasons, but they are higher in elevation and drier than the surrounding organic soils.
Hydrogeology
Coastal Plain sediments underlie the entire region and groundwater is produced from several aquifers. Sources of ground water include, in order of importance, the unconfined Surficial aquifer, the Upper and Lower Brunswick aquifers and the Upper and Lower Floridan aquifers. The Surficial aquifer is up to 230 feet thick and consists of interlayered, Miocene and younger, sand, clay and limestone. It is underlain by the Upper and Lower Brunswick aquifers both of which are composed of 150 and 70 feet, respectively, of poorly sorted sand. The Upper and Lower Floridan aquifers consist of Eocene to Oligocene carbonate rocks (largely limestone and dolostone) 700 to 2,500 feet in thickness. In each of the aquifers, except for the Surficial aquifer, the groundwater is under confined (aquifer) conditions. Most of these aquifers consistently have excellent water quality; however, the Lower Floridan aquifer is saline and generally does not meet drinking water standards.
2.1.4 Surface Water Resources
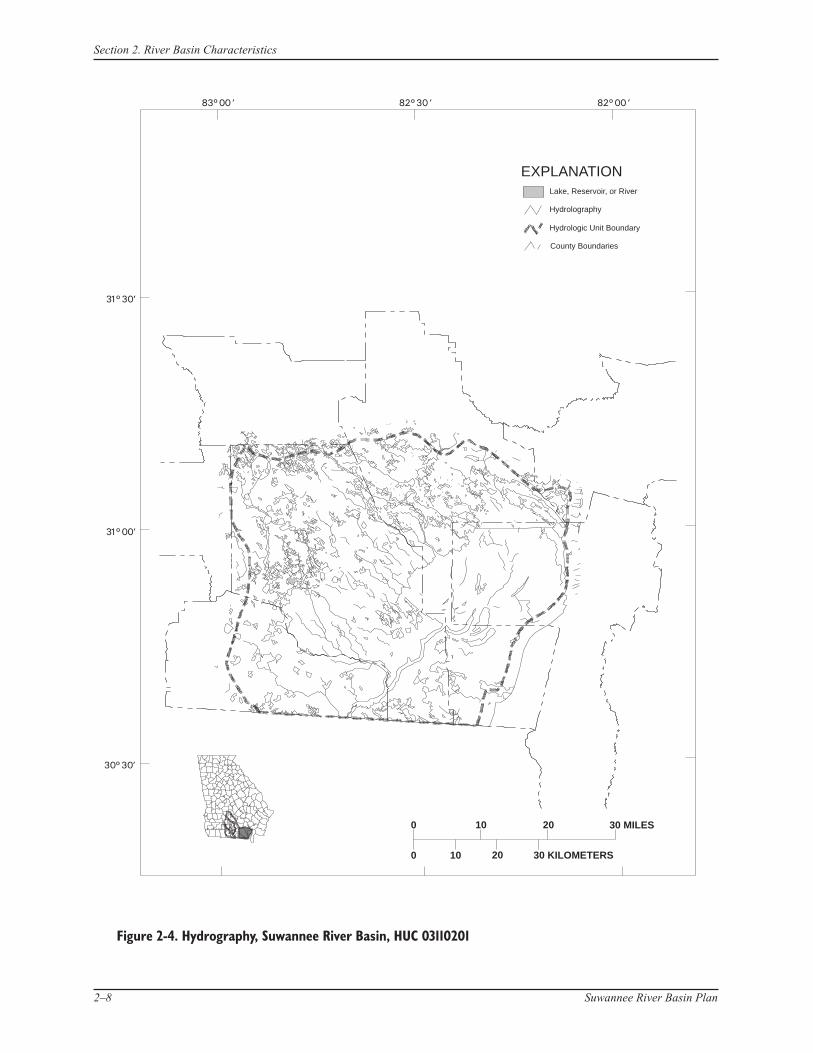
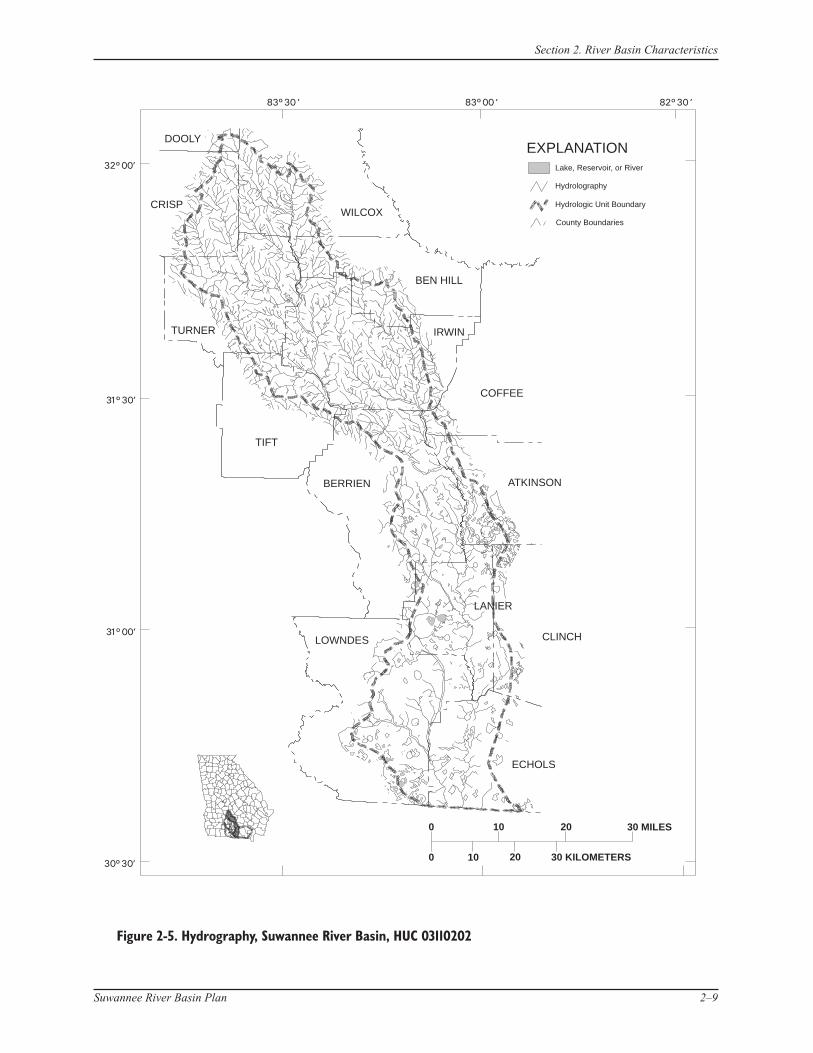
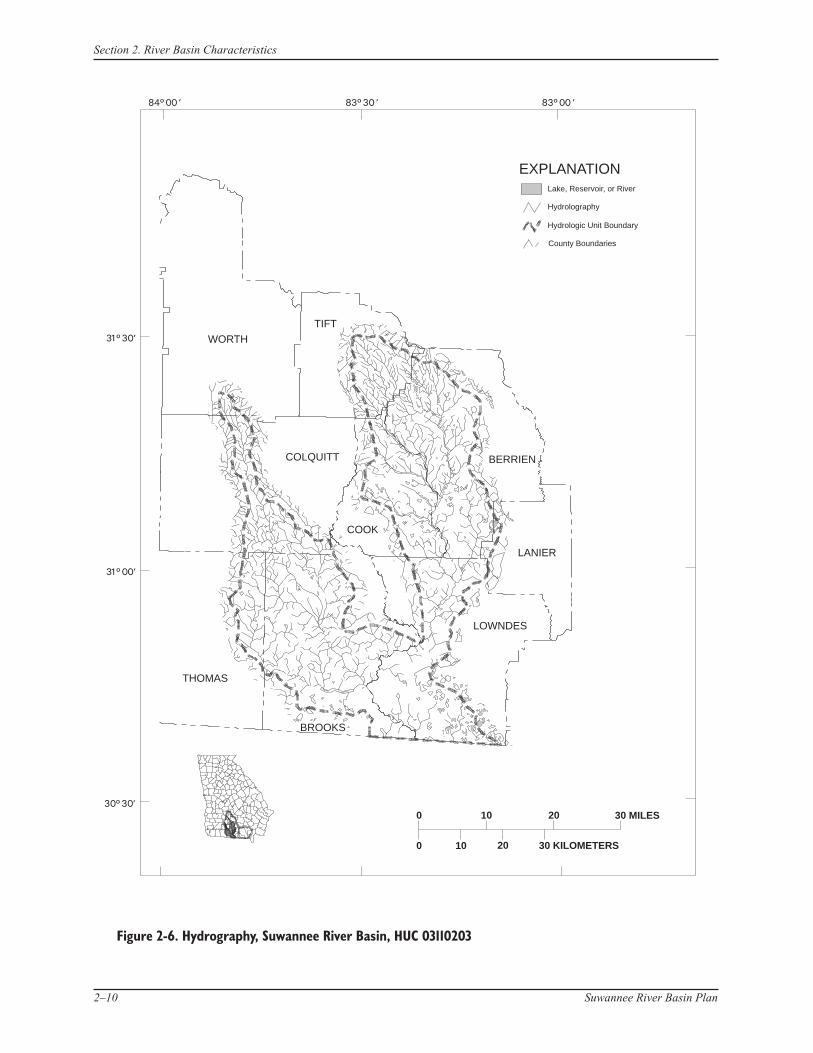
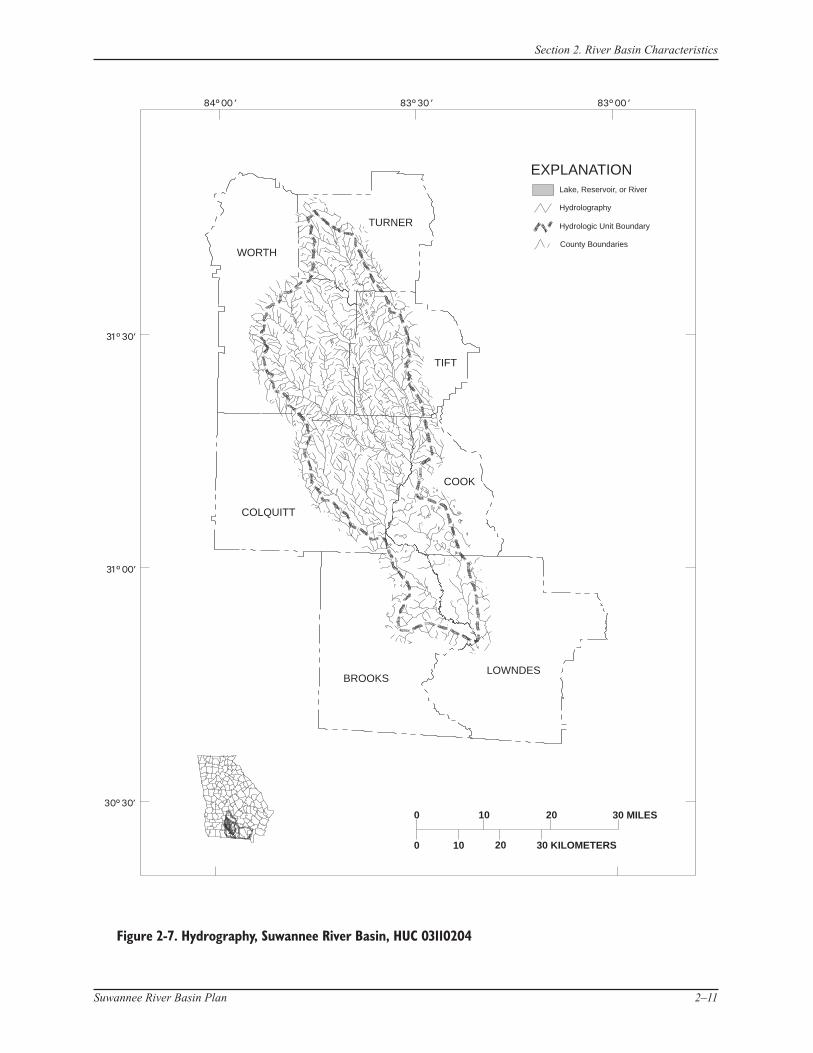
The major surface water resources of the Suwannee River basin are three major rivers, which drain portions of the basin. The eastern portion of the basin contains the headwaters for the Suwannee River. The central portion is drained by the Alapaha River, which joins the Suwannee River about 15 miles south of the stateline. The western portion of the basin comprises the Withlacoochee River watershed, which joins the Suwannee River about eight miles downstream from the confluence of the Suwannee and Alapaha rivers. The three major rivers thus cross the stateline separately, but they join long before the Suwannee reaches the Gulf of Mexico.
Some of the major streams in the basin include the Little River, Alapacha River, Okapilco Creek, Suwanoochee River, Willacoochee River and Little River. Stream networks within each HUC are shown in Figures 2-4 through 2-7.
Section 2. River Basin Characteristics
2–8 Suwannee River Basin Plan
Figure Suwannee River Basin, HUC 031102012-4. Hydrography,
EXPLANATION
Hydrologic Unit Boundary
County Boundaries
Hydrolography
Lake, Reservoir, or River
0 10 20
0 10 20 30 KILOMETERS
30 MILES
Section 2. River Basin Characteristics
Suwannee River Basin Plan 2–9
Figure Suwannee River Basin, HUC 031102022-5. Hydrography,
EXPLANATION
Hydrologic Unit Boundary
County Boundaries
Hydrolography
Lake, Reservoir, or River
0 10 20
0 10 20 30 KILOMETERS
30 MILES
DOOLY
WILCOXCRISP
TURNER
BEN HILL
IRWIN
TIFT
COFFEE
BERRIEN ATKINSON
LANIER
LOWNDES
ECHOLS
CLINCH
Section 2. River Basin Characteristics
2–10 Suwannee River Basin Plan
Figure Suwannee River Basin, HUC 031102032-6. Hydrography,
EXPLANATION
Hydrologic Unit Boundary
County Boundaries
Hydrolography
Lake, Reservoir, or River
0 10 20
0 10 20 30 KILOMETERS
30 MILES
WORTH
TIFT
BERRIENCOLQUITT
COOK
LANIER
LOWNDES
BROOKS
THOMAS
Section 2. River Basin Characteristics
Suwannee River Basin Plan 2–11
Figure Suwannee River Basin, HUC 031102042-7. Hydrography,
EXPLANATION
Hydrologic Unit Boundary
County Boundaries
Hydrolography
Lake, Reservoir, or River
0 10 20
0 10 20 30 KILOMETERS
30 MILES
TURNER
WORTH
TIFT
COLQUITT
COOK
LOWNDESBROOKS
Section 2. River Basin Characteristics
2–12 Suwannee River Basin Plan
2.1.5 Ground Water Resources
Groundwater resources in the Suwannee River basin are supplied by the Floridan aquifer system, one of the most productive ground water reservoirs in the United States. The system supplies about 50 percent of the ground water used in the state. It is used as a major water source throughout most of South Georgia. A more detailed description of the Floridan aquifer system is provided below.
Floridan Aquifer
The Floridan aquifer underlies the rest of the southern portion of the basin. The aquifer is overlain by approximately 25-125 feet of sandy clay residuum derived from chemical weathering of the underlying rock. The total thickness of the Floridan aquifer in the basin ranges from a few tens of feet in the north to more than 400 feet in the extreme southern portion of the basin. Clastic grains of sand and shale are major components of the Floridan aquifer near its northernmost extent, where it is dominantly limestone in the Ochlockonee basin. Throughout most of the basin, the aquifer can be divided into three thick limestone formations: the Tampa Limestone, the Suwannee Limestone and the Ocala Limestone. The Tampa Limestone consists of whitish gray limestone that has a shale bed at its base. This shale acts as a confining layer to the underlying Suwannee and Ocala limestones (Miller, 1986). Below the Tampa, the Suwannee limestone is a massive chalky unit that is easily dissolved and weathered. For this reason, the many solution cavities in the Tampa provide abundant water to the underlying Ocala Limestone. The Ocala Limestone is the principal unit of the Floridan aquifer, and contains an upper friable, porous unit and a lower fine-grained unit (Miller, 1986). This lower unit contains most of the groundwater in the Floridan aquifer (Torak and others, 1993). The Ocala is underlain by the clay-rich Lisbon Formation, which acts as a slower confining bed to the water-bearing limestones above. Well yields in the Floridan aquifer can range from about 40 GPM in the north to more than 10,000 GPM in the thickest, southern most portion of the Floridan aquifer. The Floridan serves as the main aquifer from Decatur and Seminole counties to the coast.
Recharge occurs through the sandy soil in the outcrop area. In the northern portion of the basin this unit is seen as one single aquifer and can be called either the Cretaceous Aquifer or the Dublin-Midville Aquifer. As you move to the south, an intervening clay layer becomes apparent, and divides the aquifer into two distinct units. Below is the Midville Aquifer of definite Cretaceous age. Overlying the confining shale unit is the Dublin Aquifer, which is of Cretaceous-Early Tertiary age.
2.1.6 Biological Resources
The Suwannee River basin supports a diverse and rich mix of terrestrial and aquatic habitats and is home to several federally and state-protected species. The basin encompasses parts of five major land resource areas. Some of the biological resources of the basin are summarized below.
Fish Fauna
The fish fauna of the Georgia portion of the Suwannee River basin includes 36 species representing 13 families. The largest group of fish species found in the Suwannee basin are in the sunfish family Centrarchidae. Sunfish present in the Suwannee basin range from highly sought after game fish such as the largemouth bass, to rare species including the blackbanded sunfish. Other families with large numbers of species are the catfishes and the topminnows. Fish populations in the Georgia portion of the Suwannee basin are limited in productivity by acidic waters, low alkalinity, and extreme variation in flow.
Section 2. River Basin Characteristics
Suwannee River Basin Plan 2–13
Fisheries
The headwaters of the Suwannee River drain approximately 574 square miles of the Okefenokee Swamp. The Suwannee River flows southwest through Georgia for 33 miles before entering Florida. Once in Florida, the Suwannee converges with two of its tributaries, the Alapaha and Withlacoochee rivers, which both originate in Georgia. The Suwannee River is a blackwater stream with extremely acidic waters. A pH reading of 3.6 was recorded July 22, 1997 (U.S. Geological Survey, 1997).
The Suwannee River basin possesses a diversity of aquatic habitats providing some unique fishing opportunities. The Okefenokee National Wildlife Refuge encompasses approximately 400,000 acres and contains several open water lakes within the Okefenokee Swamp. These lakes offer excellent fishing opportunities for chain pickerel, flier, warmouth, and bullhead catfish. Like the Okefenokee Swamp the Suwannee River has good fisheries for flier, warmouth, chain pickerel, and bullhead catfishes.
Banks Lake National Wildlife Refuge is located in Lanier County and contains 1,500 acres of marsh, 1,549 acres of cypress swamp, and 1,000 acres of open water. Banks Lake is a natural pocosin or sink of ancient geological origin. This lake offers fishing opportunities for chain pickerel, warmouth, largemouth bass, bluegill, and crappie.
The Alapaha River is a small blackwater river which originates in Crisp and Wilcox counties. With the exception of high flow periods, travel by boat on the Alapaha is limited to the section of the river below the northern boundary of Berrien County. This river has good fisheries for largemouth bass, redbreast sunfish, bluegill, warmouth, crappie, and catfishes. The rare Suwannee bass is also found in the Alapaha River.
The Withlacoochee River is the only river in the Georgia portion of the Suwannee drainage that is not a typical blackwater stream. This river is largely characterized by steep limestone banks and rocky shoals. During moderate to low flows the Withlacoochee is predominately a spring-fed river. However, during high flow periods this river is influenced by swamp drainage and assumes a blackwater appearance. This river provides good fishing opportunities for largemouth bass, redbreast sunfish, warmouth, bluegill, crappie, catfishes, and the Suwannee bass.
The banded topminnow, blackbanded sunfish, and Suwannee bass are three fish species found in the Suwannee basin that are currently listed by the state as rare species. The banded topminnow and blackbanded sunfish are found in the Suwannee River. The Suwannee bass is found in both the Alapaha and Withlacoochee rivers.
2.2 Population and Land Use
2.2.1 Population
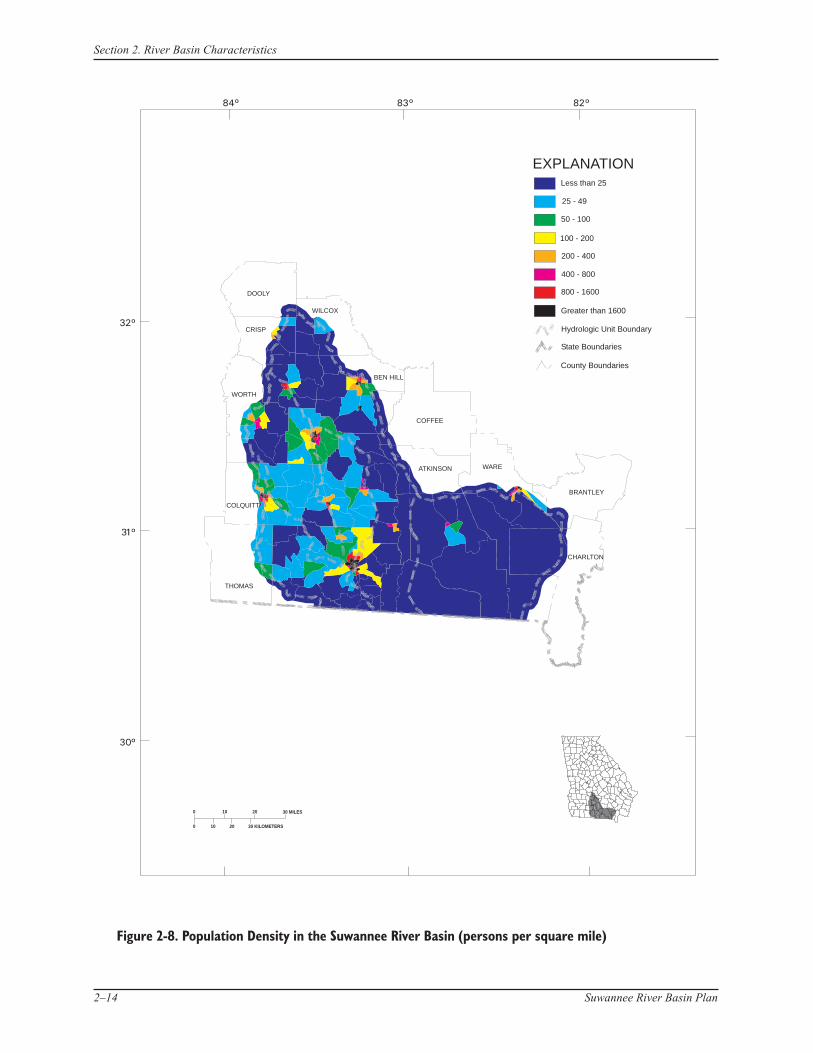
As of 1995, about 231,000 people lived in the Suwannee watershed (DRI/McGraw-Hill, 1996). Population distribution in the basin at the time of the 1990 census by census blocks is shown in Figure 2-8. Population centers in the Suwannee watershed include the development surrounding Valdosta, Tifton, Moultrie and Fitzgerald.
Between 1975 and 1995, the population in the Suwannee River basin increased by 1.3 percent per year (DRI/McGraw-Hill, 1996). Basin population is projected to increase at an average growth rate through 2050.
One area in which this river basin will differ slightly from state trends, is an age group of 16-24 year olds which will experience above average growth through 2050. The river basin will mirror state trends in terms of its elderly population with the 65 and older age
Section 2. River Basin Characteristics
2–14 Suwannee River Basin Plan
0
0
10
10
20
20
30 KILOMETERS
30 MILES
Figure 2-8. Population Density Suwannee River Basin (persons per square mile)in the
EXPLANATION
Hydrologic Unit Boundary
State Boundaries
County Boundaries
Less than 25
25 - 49
50 - 100
200 - 400
100 - 200
400 - 800
800 - 1600
Greater than 1600
DOOLY
WILCOX
CRISP
BEN HILL
WORTH
COFFEE
COLQUITT
ATKINSON
THOMAS
CHARLTON
BRANTLEY
WARE
Section 2. River Basin Characteristics
Suwannee River Basin Plan 2–15
group showing a larger than average gain through 2050. Large youth and elderly populations will mean a decline in the working age population.
2.2.2 Employment
The Suwannee River basin supported 87,100 jobs in 1995. It is moving from a manufacturing- to a service-based economy. In the coming years, a decrease in jobs is expected in manufacturing and durable goods, offset by an increase in jobs in the service and trade sectors.
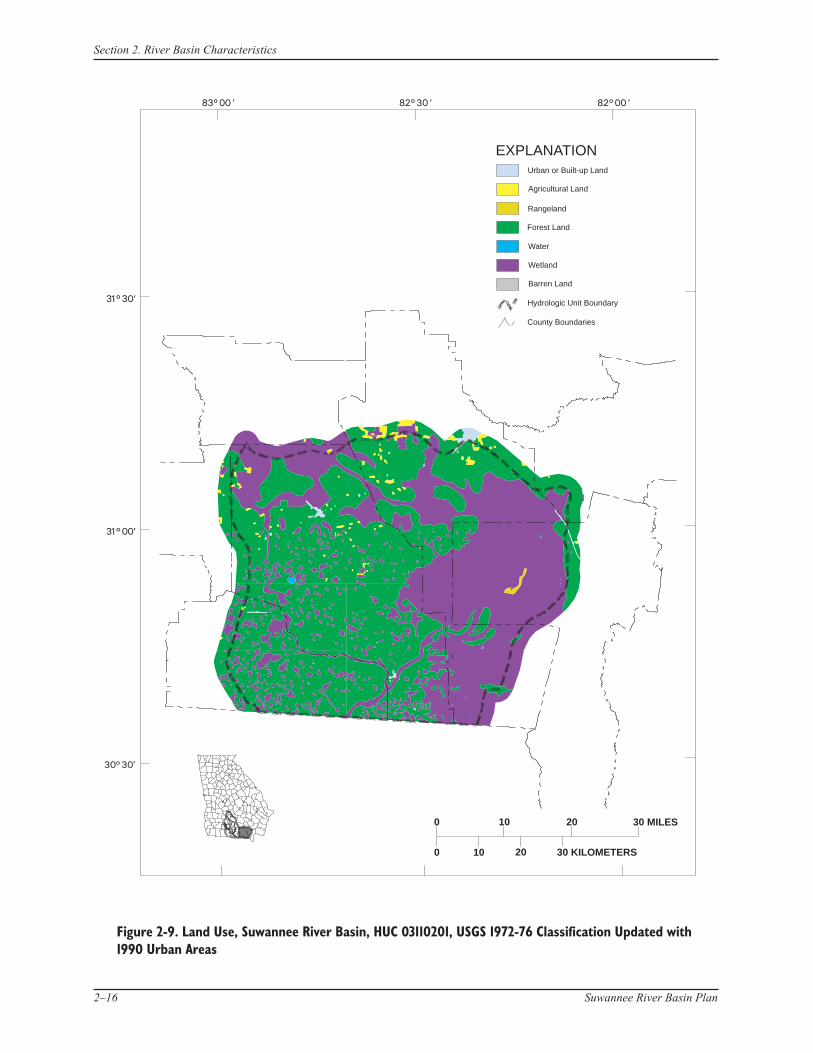
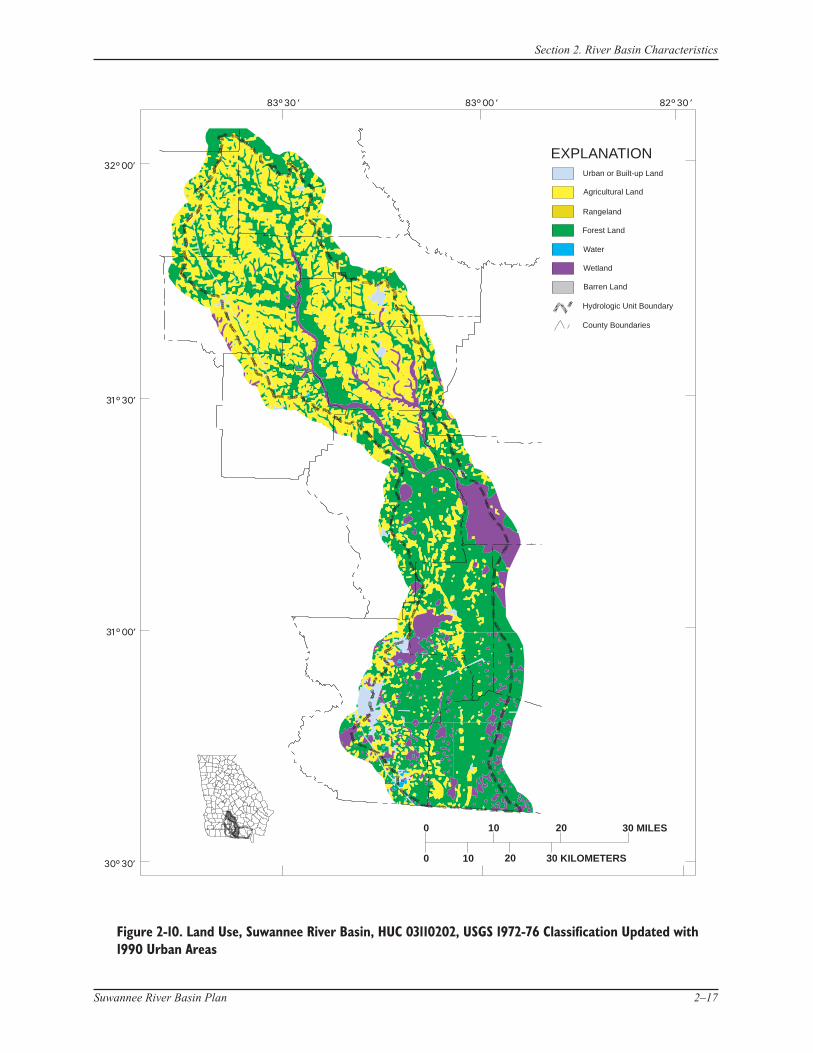
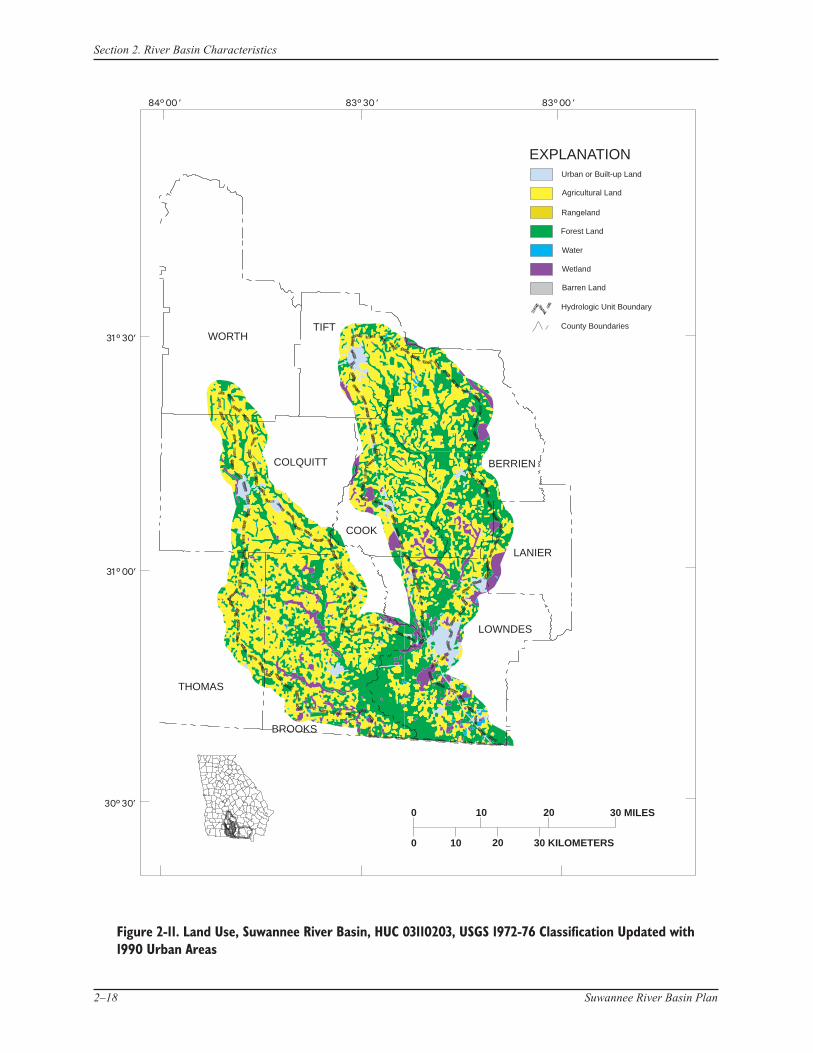
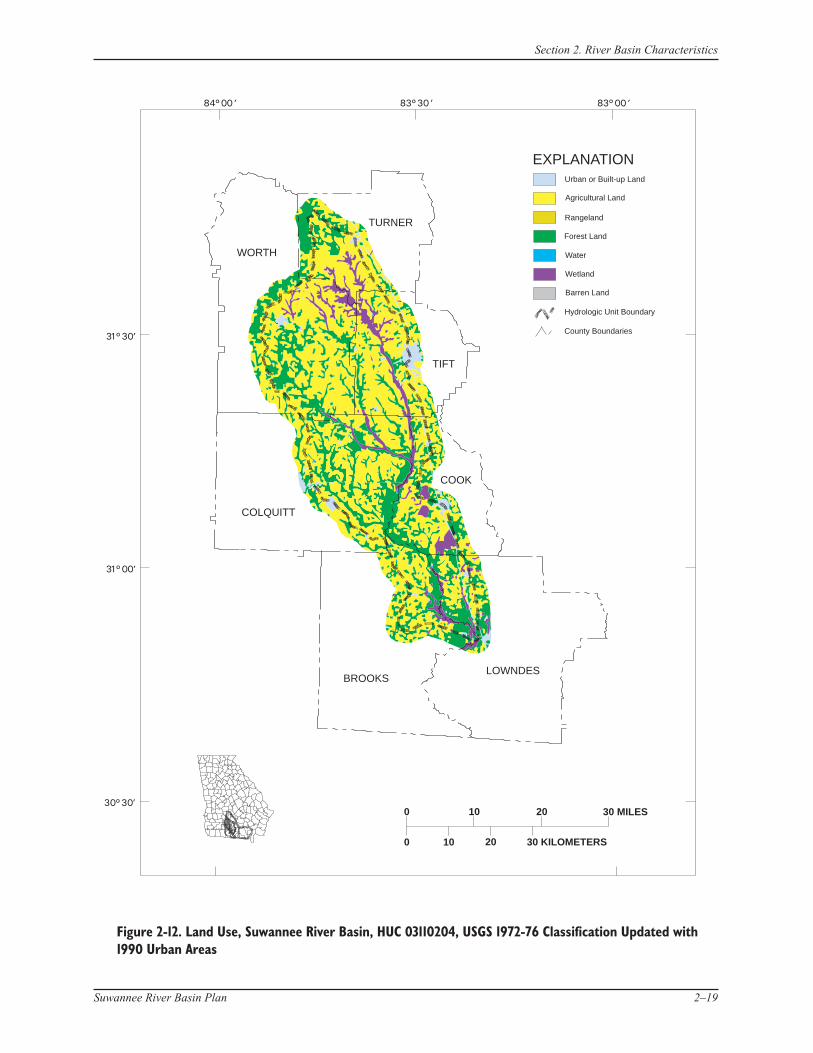
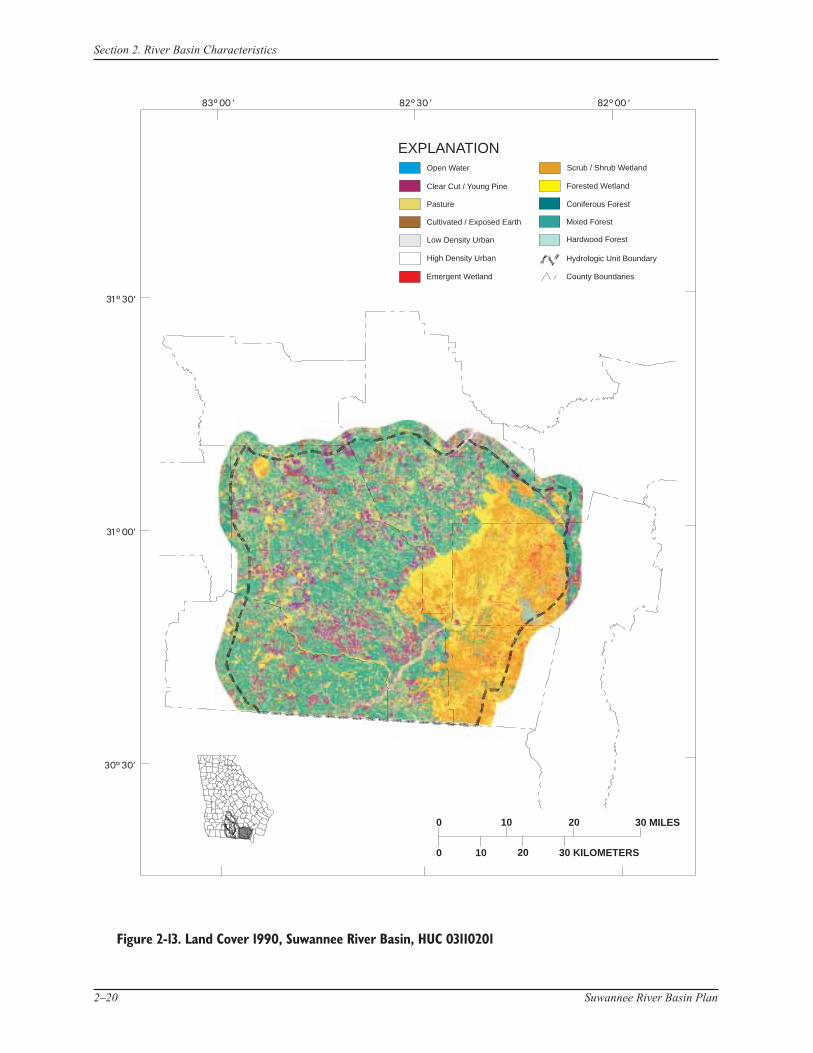
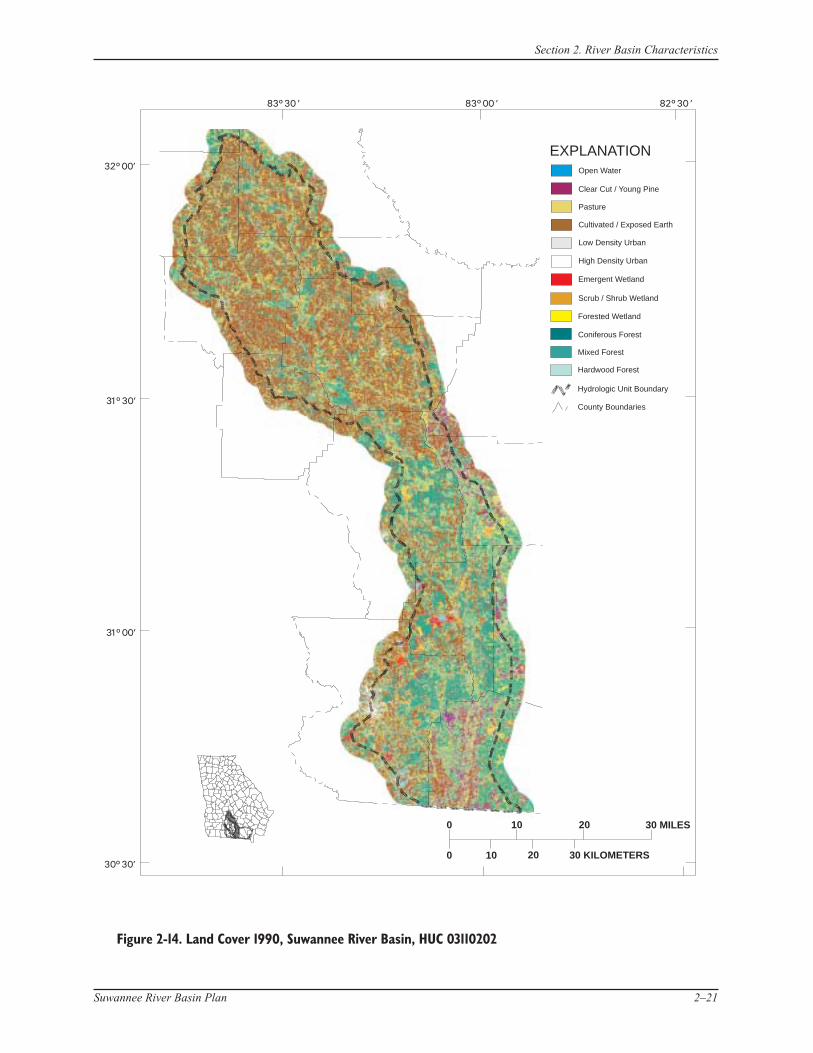
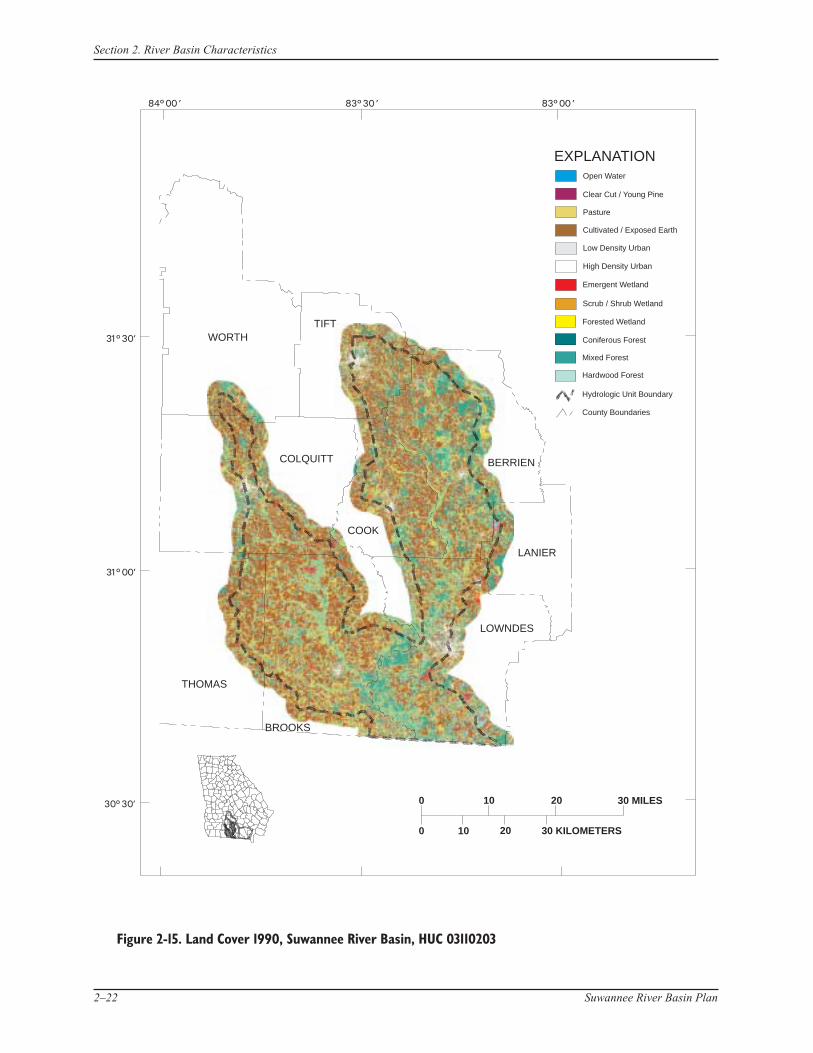
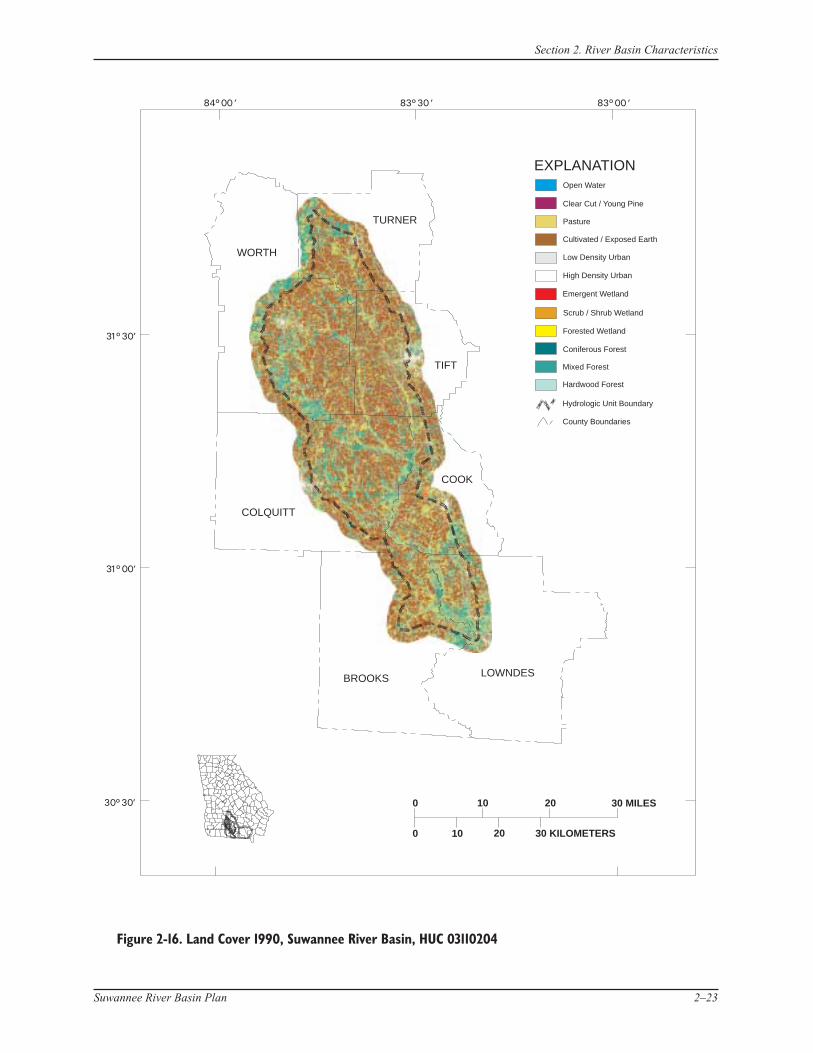
2.2.3 Land Cover and Use
Land use/land cover classification (Figures 2-9 through 2-16) was determined for the Suwannee River Basin based on high-altitude aerial photography for 1972-76 (U.S. Geological Survey, 1972-78). Subsequently in 1991 land cover data were developed based on interpretation of Landsat TM satellite image data obtained during 1988-90, leaf-off conditions. These two coverages differ significantly. Aerial photography allows identification of both land cover and land uses. Satellite imagery, however, detects primarily land cover, and not land use, such that a forest and a wooded subdivision may, for instance, appear similar. Satellite interpretation also tends to be less accurate than aerial photography.
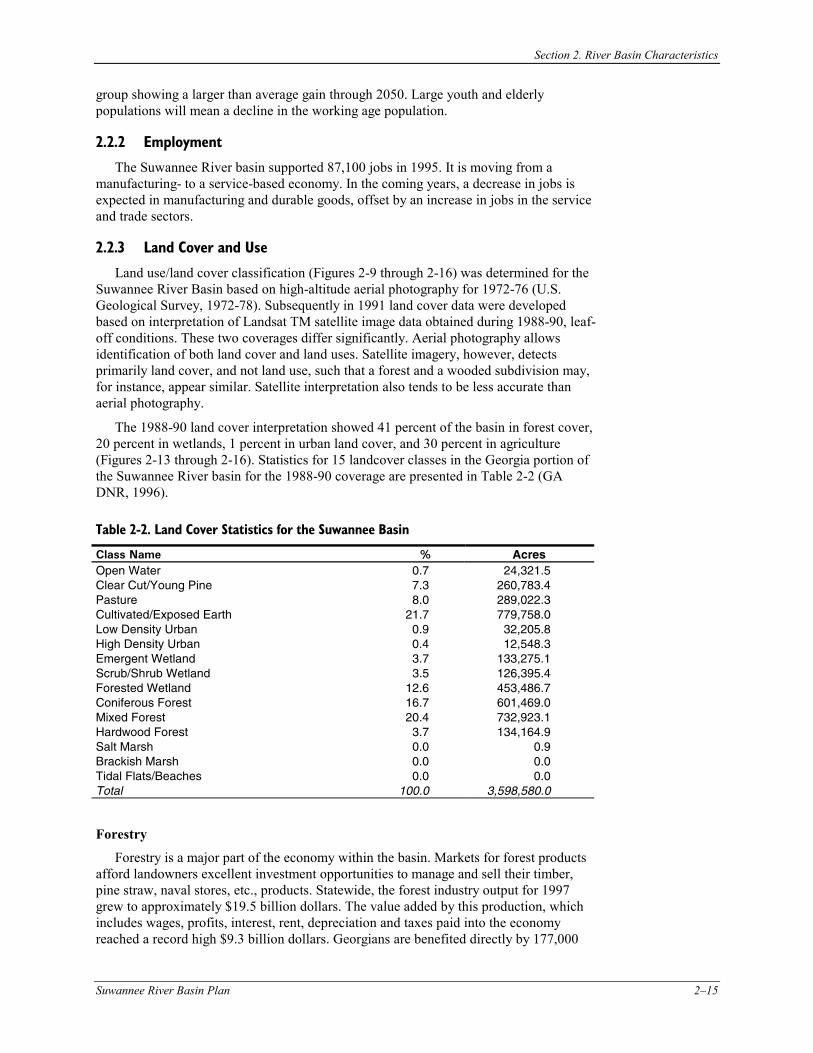
The 1988-90 land cover interpretation showed 41 percent of the basin in forest cover, 20 percent in wetlands, 1 percent in urban land cover, and 30 percent in agriculture (Figures 2-13 through 2-16). Statistics for 15 landcover classes in the Georgia portion of the Suwannee River basin for the 1988-90 coverage are presented in Table 2-2 (GA DNR, 1996).
Table 2-2. Land Cover Statistics for the Suwannee Basin
Class Name % Acres Open Water 0.7 24,321.5 Clear Cut/Young Pine 7.3 260,783.4 Pasture 8.0 289,022.3 Cultivated/Exposed Earth 21.7 779,758.0 Low Density Urban 0.9 32,205.8 High Density Urban 0.4 12,548.3 Emergent Wetland 3.7 133,275.1 Scrub/Shrub Wetland 3.5 126,395.4 Forested Wetland 12.6 453,486.7 Coniferous Forest 16.7 601,469.0 Mixed Forest 20.4 732,923.1 Hardwood Forest 3.7 134,164.9 Salt Marsh 0.0 0.9 Brackish Marsh 0.0 0.0 Tidal Flats/Beaches 0.0 0.0 Total 100.0 3,598,580.0
Forestry
Forestry is a major part of the economy within the basin. Markets for forest products afford landowners excellent investment opportunities to manage and sell their timber, pine straw, naval stores, etc., products. Statewide, the forest industry output for 1997 grew to approximately $19.5 billion dollars. The value added by this production, which includes wages, profits, interest, rent, depreciation and taxes paid into the economy reached a record high $9.3 billion dollars. Georgians are benefited directly by 177,000
Section 2. River Basin Characteristics
2–16 Suwannee River Basin Plan
Figure 2-9. Land Use, Suwannee River Basin, HUC 03110201, USGS 1972-76 Classification Updated with1990 Urban Areas
0 10 20
0 10 20 30 KILOMETERS
30 MILES
EXPLANATION
Hydrologic Unit Boundary
County Boundaries
Barren Land
Urban or Built-up Land
Agricultural Land
Forest Land
Water
Wetland
Rangeland
Section 2. River Basin Characteristics
Suwannee River Basin Plan 2–17
Figure 2-10. Land Use, Suwannee River Basin, HUC 03110202, USGS 1972-76 Classification Updated with1990 Urban Areas
EXPLANATION
Hydrologic Unit Boundary
County Boundaries
Barren Land
Urban or Built-up Land
Agricultural Land
Forest Land
Water
Wetland
Rangeland
0 10 20
0 10 20 30 KILOMETERS
30 MILES
Section 2. River Basin Characteristics
2–18 Suwannee River Basin Plan
Figure 2-11. Land Use, Suwannee River Basin, HUC 03110203, USGS 1972-76 Classification Updated with1990 Urban Areas
EXPLANATION
Hydrologic Unit Boundary
County Boundaries
Barren Land
Urban or Built-up Land
Agricultural Land
Forest Land
Water
Wetland
Rangeland
0 10 20
0 10 20 30 KILOMETERS
30 MILES
WORTHTIFT
BERRIENCOLQUITT
COOK
LANIER
LOWNDES
BROOKS
THOMAS
Section 2. River Basin Characteristics
Suwannee River Basin Plan 2–19
Figure 2-12. Land Use, Suwannee River Basin, HUC 03110204, USGS 1972-76 Classification Updated with1990 Urban Areas
EXPLANATION
Hydrologic Unit Boundary
County Boundaries
Barren Land
Urban or Built-up Land
Agricultural Land
Forest Land
Water
Wetland
Rangeland
0 10 20
0 10 20 30 KILOMETERS
30 MILES
TURNER
WORTH
TIFT
COLQUITT
COOK
LOWNDESBROOKS
Section 2. River Basin Characteristics
2–20 Suwannee River Basin Plan
Figure 2-13. Land Cover 1990, Suwannee River Basin, HUC 03110201
0 10 20
0 10 20 30 KILOMETERS
30 MILES
EXPLANATION
Hydrologic Unit Boundary
County Boundaries
Open Water
Clear Cut / Young Pine
Cultivated / Exposed Earth
Low Density Urban
Emergent Wetland
Pasture
High Density Urban
Scrub / Shrub Wetland
Forested Wetland
Coniferous Forest
Hardwood Forest
Mixed Forest
Section 2. River Basin Characteristics
Suwannee River Basin Plan 2–21
Figure 2-14. Land Cover 1990, Suwannee River Basin, HUC 03110202
EXPLANATIONOpen Water
Clear Cut / Young Pine
Cultivated / Exposed Earth
Low Density Urban
Emergent Wetland
Pasture
High Density Urban
Hydrologic Unit Boundary
County Boundaries
Scrub / Shrub Wetland
Forested Wetland
Coniferous Forest
Hardwood Forest
Mixed Forest
0 10 20
0 10 20 30 KILOMETERS
30 MILES
Section 2. River Basin Characteristics
2–22 Suwannee River Basin Plan
Figure 2-15. Land Cover 1990, Suwannee River Basin, HUC 03110203
EXPLANATIONOpen Water
Clear Cut / Young Pine
Cultivated / Exposed Earth
Low Density Urban
Emergent Wetland
Pasture
High Density Urban
Hydrologic Unit Boundary
County Boundaries
Scrub / Shrub Wetland
Forested Wetland
Coniferous Forest
Hardwood Forest
Mixed Forest
0 10 20
0 10 20 30 KILOMETERS
30 MILES
WORTHTIFT
BERRIENCOLQUITT
COOK
LANIER
LOWNDES
BROOKS
THOMAS
Section 2. River Basin Characteristics
Suwannee River Basin Plan 2–23
Figure 2-16. Land Cover 1990, Suwannee River Basin, HUC 03110204
EXPLANATIONOpen Water
Clear Cut / Young Pine
Cultivated / Exposed Earth
Low Density Urban
Emergent Wetland
Pasture
High Density Urban
Hydrologic Unit Boundary
County Boundaries
Scrub / Shrub Wetland
Forested Wetland
Coniferous Forest
Hardwood Forest
Mixed Forest
0 10 20
0 10 20 30 KILOMETERS
30 MILES
TURNER
WORTH
TIFT
COLQUITT
COOK
LOWNDESBROOKS
Section 2. River Basin Characteristics
2–24 Suwannee River Basin Plan
job opportunities created by the manufacture of paper, lumber, furniture and various other wood products as well as benefiting the consumers of these products. Other benefits of the forest include hunting, fishing, aesthetics, wildlife watching, hiking, camping and other recreational opportunities as well as providing important environmental benefits such as clean air and water and wildlife habitat.
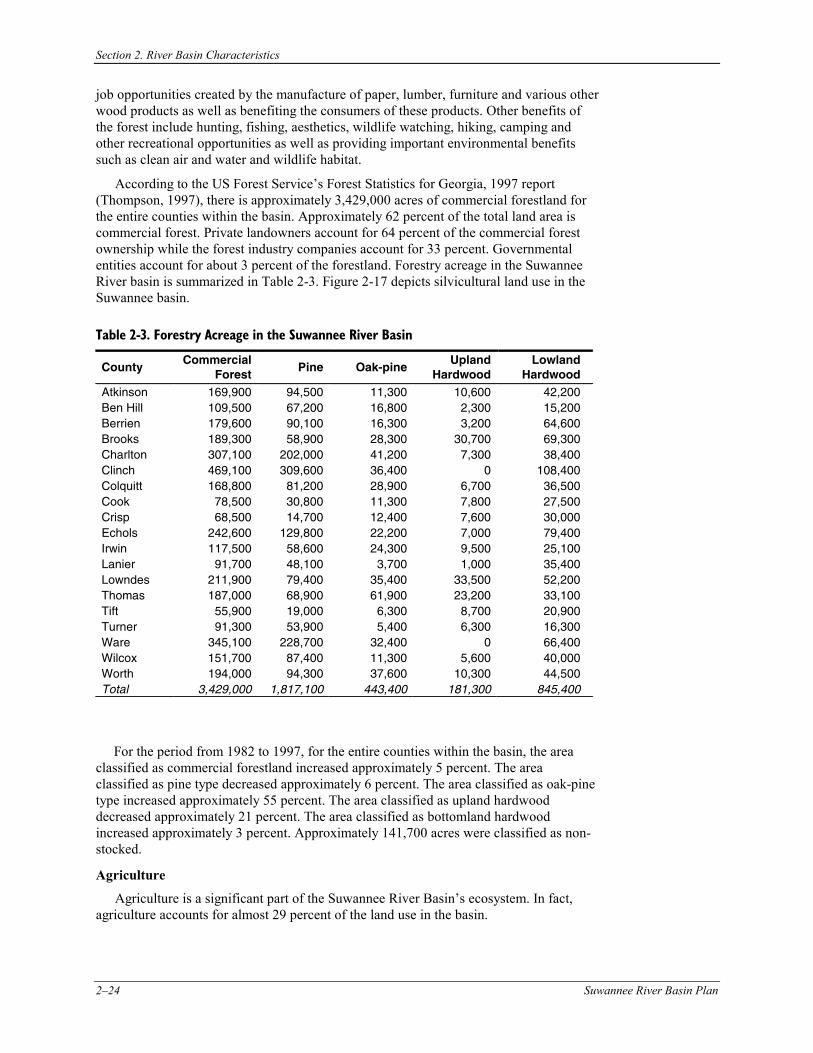
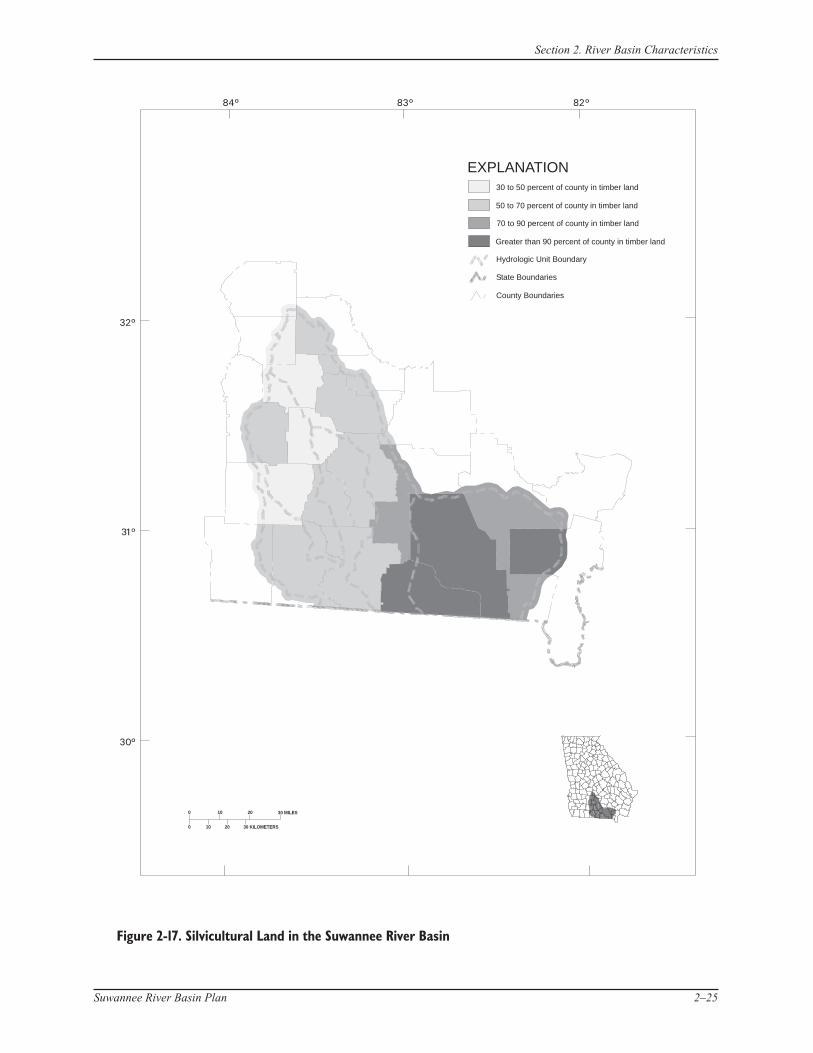
According to the US Forest Service’s Forest Statistics for Georgia, 1997 report (Thompson, 1997), there is approximately 3,429,000 acres of commercial forestland for the entire counties within the basin. Approximately 62 percent of the total land area is commercial forest. Private landowners account for 64 percent of the commercial forest ownership while the forest industry companies account for 33 percent. Governmental entities account for about 3 percent of the forestland. Forestry acreage in the Suwannee River basin is summarized in Table 2-3. Figure 2-17 depicts silvicultural land use in the Suwannee basin.
Table 2-3. Forestry Acreage in the Suwannee River Basin
County Commercial
Forest Pine Oak-pine
Upland Hardwood
Lowland Hardwood
Atkinson 169,900 94,500 11,300 10,600 42,200 Ben Hill 109,500 67,200 16,800 2,300 15,200 Berrien 179,600 90,100 16,300 3,200 64,600 Brooks 189,300 58,900 28,300 30,700 69,300 Charlton 307,100 202,000 41,200 7,300 38,400 Clinch 469,100 309,600 36,400 0 108,400 Colquitt 168,800 81,200 28,900 6,700 36,500 Cook 78,500 30,800 11,300 7,800 27,500 Crisp 68,500 14,700 12,400 7,600 30,000 Echols 242,600 129,800 22,200 7,000 79,400 Irwin 117,500 58,600 24,300 9,500 25,100 Lanier 91,700 48,100 3,700 1,000 35,400 Lowndes 211,900 79,400 35,400 33,500 52,200 Thomas 187,000 68,900 61,900 23,200 33,100 Tift 55,900 19,000 6,300 8,700 20,900 Turner 91,300 53,900 5,400 6,300 16,300 Ware 345,100 228,700 32,400 0 66,400 Wilcox 151,700 87,400 11,300 5,600 40,000 Worth 194,000 94,300 37,600 10,300 44,500 Total 3,429,000 1,817,100 443,400 181,300 845,400
For the period from 1982 to 1997, for the entire counties within the basin, the area classified as commercial forestland increased approximately 5 percent. The area classified as pine type decreased approximately 6 percent. The area classified as oak-pine type increased approximately 55 percent. The area classified as upland hardwood decreased approximately 21 percent. The area classified as bottomland hardwood increased approximately 3 percent. Approximately 141,700 acres were classified as non-stocked.
Agriculture
Agriculture is a significant part of the Suwannee River Basin’s ecosystem. In fact, agriculture accounts for almost 29 percent of the land use in the basin.
Section 2. River Basin Characteristics
Suwannee River Basin Plan 2–25
0
0
10
10
20
20
30 KILOMETERS
30 MILES
Figure 2-17. Silvicultural Land Suwannee River Basinin the
EXPLANATION
Hydrologic Unit Boundary
State Boundaries
County Boundaries
70 to 90 percent of county in timber land
30 to 50 percent of county in timber land
50 to 70 percent of county in timber land
Greater than 90 percent of county in timber land
Section 2. River Basin Characteristics
2–26 Suwannee River Basin Plan
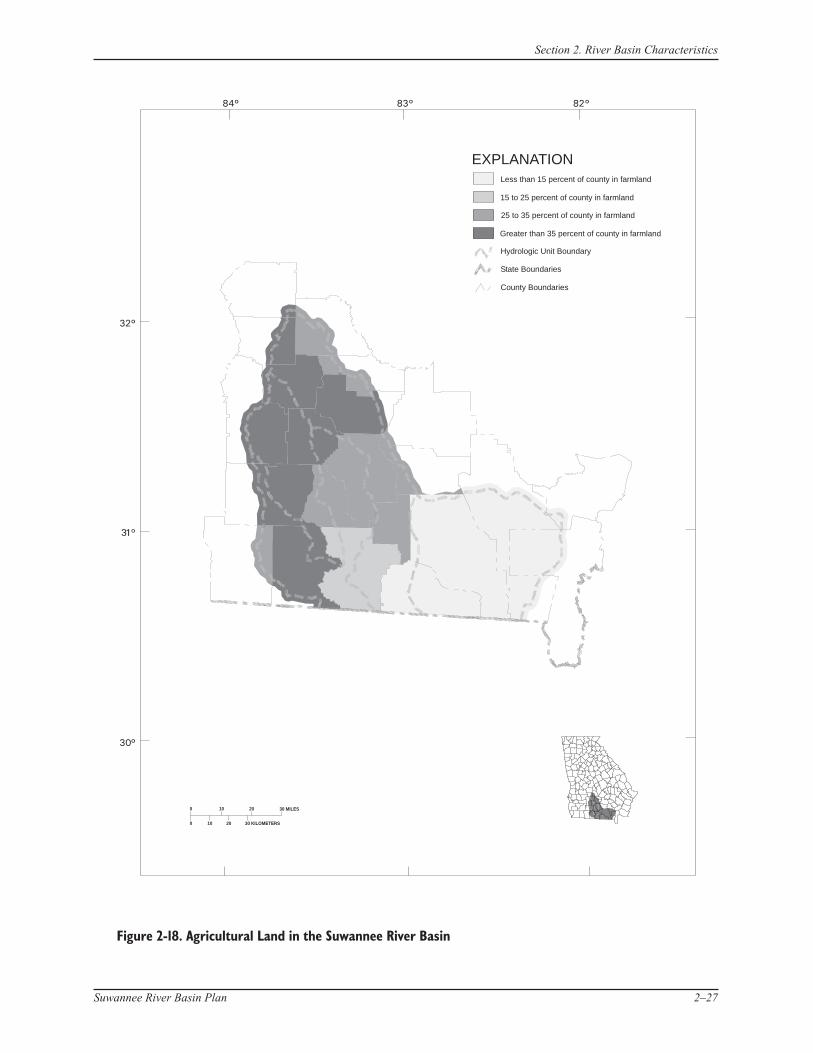
In 1997, there were some 1,040,286 acres devoted to agricultural production (Figure 2-18). All major commodities that are grown in Georgia (peanuts, corn, cotton, oats, rye, sorghum, soybeans, and tobacco) are produced in the Basin. Worth County is the basins top peanut producing county and ranks 3rd among all counties in the State. Irwin County leads the Basin in corn production (6th in Georgia). With respect to cotton and tobacco production the Suwannee River Basin is home to seven of the State’s top cotton producing counties and six of the top tobacco producing counties.
Orchard production is also significant in the area. In fact, Brooks County is Georgia’s second most productive county for peaches; while Colquitt County also ranks in the top ten counties. Berrien and Thomas Counties contain significant pecan production areas. Additionally, the Basin has a strong vegetable production market with Crisp County considered Watermelon Capitol of the World.
Georgia’s irrigation permit database shows 4,924 irrigation permits have been issued for the purpose of agricultural irrigation in the Suwannee River Basin. Commodity producers, in the counties that comprise the Basin, applied some 195.03 million gallons of water per day for supplemental irrigation. As a result, producers applied an average of 8.9 inches per acre during 1995. A majority of agricultural water use for irrigation came from groundwater sources, some 63 percent, in 1995. Berrien, Tift, and Turner Counties contain the largest number of irrigated acreage in the Basin.
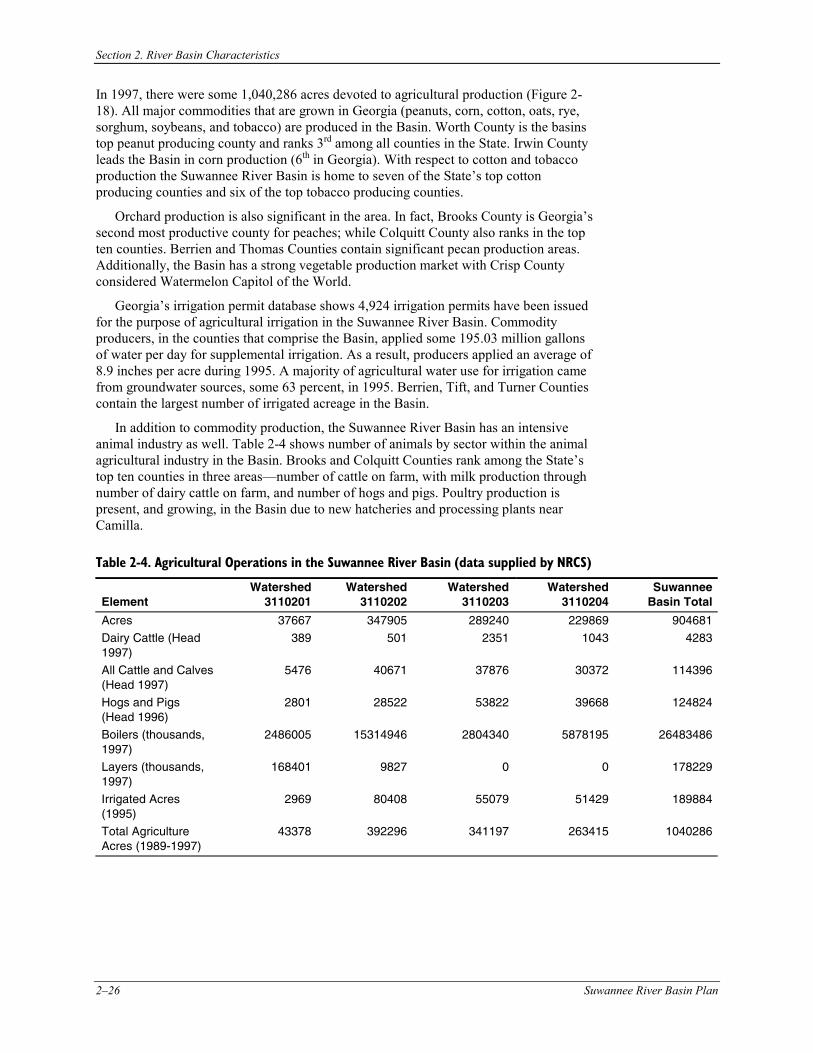
In addition to commodity production, the Suwannee River Basin has an intensive animal industry as well. Table 2-4 shows number of animals by sector within the animal agricultural industry in the Basin. Brooks and Colquitt Counties rank among the State’s top ten counties in three areas—number of cattle on farm, with milk production through number of dairy cattle on farm, and number of hogs and pigs. Poultry production is present, and growing, in the Basin due to new hatcheries and processing plants near Camilla.
Table 2-4. Agricultural Operations in the Suwannee River Basin (data supplied by NRCS)
Element Watershed
3110201 Watershed
3110202 Watershed
3110203 Watershed
3110204 Suwannee
Basin Total
Acres 37667 347905 289240 229869 904681
Dairy Cattle (Head 1997)
389 501 2351 1043 4283
All Cattle and Calves (Head 1997)
5476 40671 37876 30372 114396
Hogs and Pigs (Head 1996)
2801 28522 53822 39668 124824
Boilers (thousands, 1997)
2486005 15314946 2804340 5878195 26483486
Layers (thousands, 1997)
168401 9827 0 0 178229
Irrigated Acres (1995)
2969 80408 55079 51429 189884
Total Agriculture Acres (1989-1997)
43378 392296 341197 263415 1040286
Section 2. River Basin Characteristics
Suwannee River Basin Plan 2–27
0
0
10
10
20
20
30 KILOMETERS
30 MILES
Figure 2-18. Agricultural Land Suwannee River Basinin the
EXPLANATION
Hydrologic Unit Boundary
State Boundaries
County Boundaries
25 to 35 percent of county in farmland
Less than 15 percent of county in farmland
15 to 25 percent of county in farmland
Greater than 35 percent of county in farmland
Section 2. River Basin Characteristics
2–28 Suwannee River Basin Plan
Collectively, across all animal operations, there are an estimated 203,221 Animal Units (AUs) in the Basin. AUs are defined here as 1000 lb. Animal Equivalents. Animal operations, in the counties that comprise the Basin, used some 3.75 million gallons of water per day in 1995. Additionally, some 2.5 million tons per year of animal waste was generated on these operations. Producers handle animal waste through various management activities that utilize nutrients, and other soil amendment benefits, for commodity production.
Agriculture is a key component of the Ochlocknee River Basin’s economy. In 1997, agriculture contributed over $4 billion to the local economy. Along with significant agricultural production, however, comes an increased potential for agricultural non-point source pollution. As a part of the river basin planning process, the Georgia Soil and Water Conservation Commission (GSWCC)—with technical assistance from the Natural Resources Conservation Service (NRCS)—assess agricultural impacts on water quantity and water quality. Historical, present, and future agricultural water demand is assessed in Section 3; while agricultural non-point source pollution is assessed in Section 4.
2.3 Local Governments and Planning Authorities
Many aspects of basin management and water quality protection depend on decisions regarding zoning, land use, and land management practices. These are particularly important for the control of nonpoint pollutionCpollution that arises in storm water runoff from agriculture, urban or residential development, and other land uses. The authority and responsibility for planning and control of these factors lies with local governments, making local governments and jurisdictions important partners in basin management.
The Department of Community Affairs (DCA) is the state’s principal department with responsibilities for implementing the coordinated planning process established by the Georgia Planning Act. Its responsibilities include promulgation of minimum standards for preparation and implementation of plans by local governments, review of local and regional plans, certification of qualified local governments, development of a state plan, and provision of technical assistance to local governments. Activities under the Planning Act are coordinated with the Environmental Protection Division (EPD), Regional Development Centers (RDCs), and local governments.
2.3.1 Counties and Municipalities
Local governments in Georgia consist of counties and incorporated municipalities. As entities with constitutional responsibility for land management, local governments have a significant role in the management and protection of water quality. The role of local governments includes enacting and enforcing zoning, storm water and development ordinances; undertaking water supply and wastewater treatment planning; and participating in programs to protect wellheads and significant ground water recharge areas. Many local governments are also responsible for operation of water supply and wastewater treatment facilities.
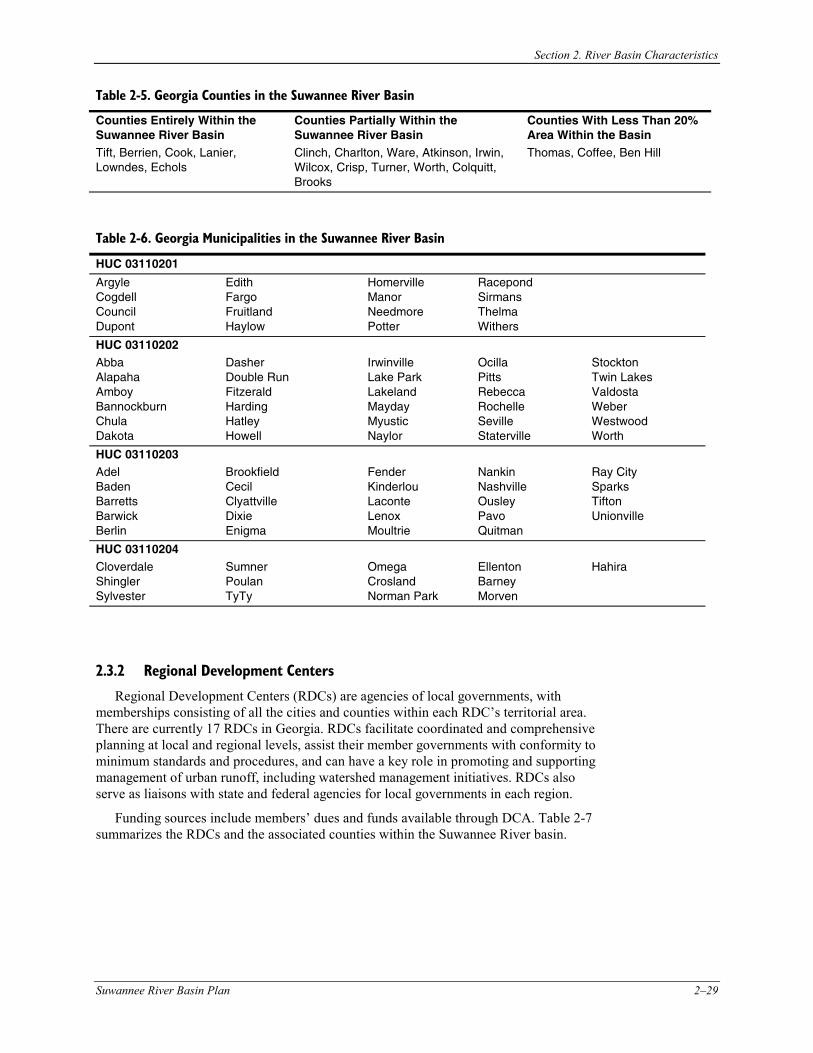
The Suwannee River basin includes part or all of 20 Georgia counties (Table 2-5 and Figure 2-2); however, only six are entirely within the basin, and three counties have a small fraction (<20 percent) of their land area within the basin. Thus there are a total of 11 counties with significant jurisdictional area in the basin. Municipalities or cities are communities officially incorporated by the General Assembly. Georgia has more than 530 municipalities. Table 2-6 lists the municipalities in the Suwannee River basin.
Section 2. River Basin Characteristics
Suwannee River Basin Plan 2–29
Table 2-5. Georgia Counties in the Suwannee River Basin
Counties Entirely Within the Suwannee River Basin
Counties Partially Within the Suwannee River Basin
Counties With Less Than 20% Area Within the Basin
Tift, Berrien, Cook, Lanier, Lowndes, Echols
Clinch, Charlton, Ware, Atkinson, Irwin, Wilcox, Crisp, Turner, Worth, Colquitt, Brooks
Thomas, Coffee, Ben Hill
Table 2-6. Georgia Municipalities in the Suwannee River Basin
HUC 03110201
Argyle Cogdell Council Dupont
Edith Fargo Fruitland Haylow
Homerville Manor Needmore Potter
Racepond Sirmans Thelma Withers
HUC 03110202 Abba Alapaha Amboy Bannockburn Chula Dakota
Dasher Double Run Fitzerald Harding Hatley Howell
Irwinville Lake Park Lakeland Mayday Myustic Naylor
Ocilla Pitts Rebecca Rochelle Seville Staterville
Stockton Twin Lakes Valdosta Weber Westwood Worth
HUC 03110203 Adel Baden Barretts Barwick Berlin
Brookfield Cecil Clyattville Dixie Enigma
Fender Kinderlou Laconte Lenox Moultrie
Nankin Nashville Ousley Pavo Quitman
Ray City Sparks Tifton Unionville
HUC 03110204 Cloverdale Shingler Sylvester
Sumner Poulan TyTy
Omega Crosland Norman Park
Ellenton Barney Morven
Hahira
2.3.2 Regional Development Centers
Regional Development Centers (RDCs) are agencies of local governments, with memberships consisting of all the cities and counties within each RDC’s territorial area. There are currently 17 RDCs in Georgia. RDCs facilitate coordinated and comprehensive planning at local and regional levels, assist their member governments with conformity to minimum standards and procedures, and can have a key role in promoting and supporting management of urban runoff, including watershed management initiatives. RDCs also serve as liaisons with state and federal agencies for local governments in each region.
Funding sources include members’ dues and funds available through DCA. Table 2-7 summarizes the RDCs and the associated counties within the Suwannee River basin.
Section 2. River Basin Characteristics
2–30 Suwannee River Basin Plan
Table 2-7. Regional Development Centers in the Suwannee River Basin
2.4 Water Use Classifications
2.4.1 Georgia’s Water Use Classification System
The Board of Natural Resources was authorized through the Rules and Regulations for Water Quality Control promulgated under the Georgia Water Quality Control Act of 1964, as amended, to establish water use classifications and water quality standards for the surface waters of the State.
The water use classifications and standards were first established by the Georgia Water Quality Control Board in 1966. Georgia was the second state in the nation to have its water use classifications and standards for intrastate waters approved by the federal government in 1967. For each water use classification, water quality standards or criteria were developed which established a framework to be used by the Water Quality Control Board and later the Environmental Protection Division in making water use regulatory decisions.
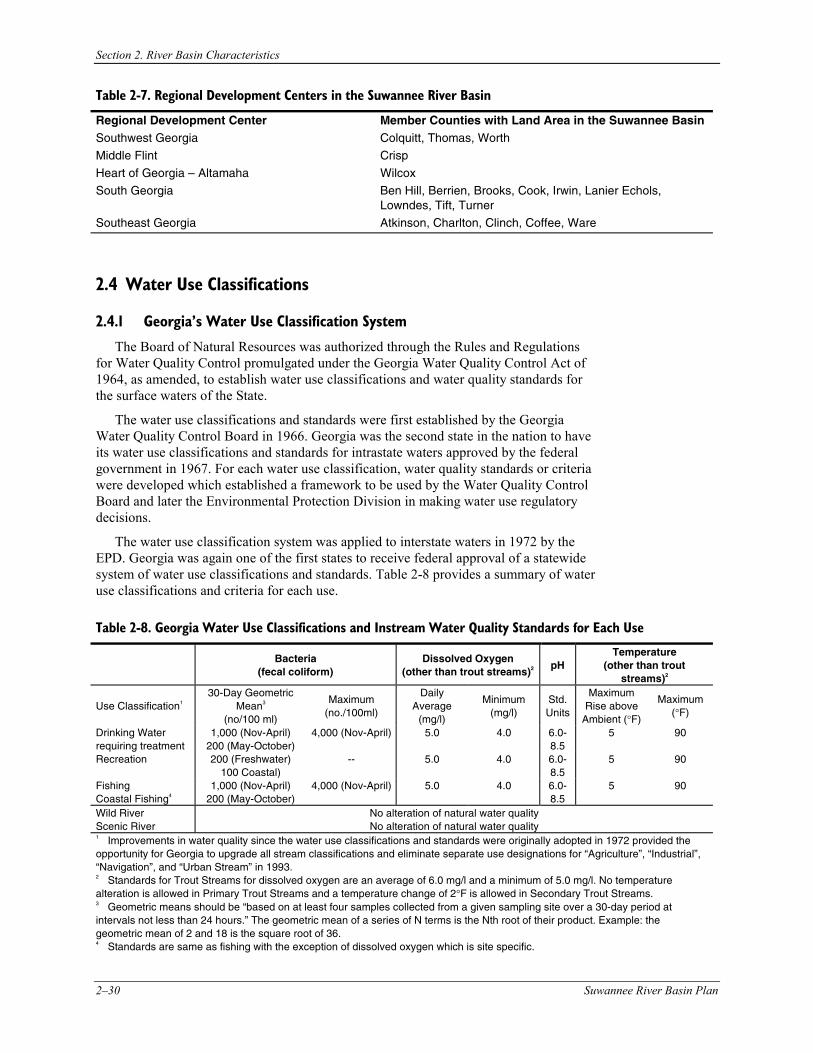
The water use classification system was applied to interstate waters in 1972 by the EPD. Georgia was again one of the first states to receive federal approval of a statewide system of water use classifications and standards. Table 2-8 provides a summary of water use classifications and criteria for each use.
Table 2-8. Georgia Water Use Classifications and Instream Water Quality Standards for Each Use
Bacteria
(fecal coliform) Dissolved Oxygen
(other than trout streams)2 pH
Temperature (other than trout
streams)2
Use Classification1 30-Day Geometric
Mean3 (no/100 ml)
Maximum (no./100ml)
Daily Average
(mg/l)
Minimum (mg/l)
Std. Units
Maximum Rise above
Ambient (°F)
Maximum (°F)
Drinking Water requiring treatment
1,000 (Nov-April) 200 (May-October)
4,000 (Nov-April) 5.0 4.0 6.0-8.5
5 90
Recreation 200 (Freshwater) 100 Coastal)
-- 5.0 4.0 6.0-8.5
5 90
Fishing Coastal Fishing4
1,000 (Nov-April) 200 (May-October)
4,000 (Nov-April) 5.0 4.0 6.0-8.5
5 90
Wild River No alteration of natural water quality Scenic River No alteration of natural water quality 1 Improvements in water quality since the water use classifications and standards were originally adopted in 1972 provided the opportunity for Georgia to upgrade all stream classifications and eliminate separate use designations for “Agriculture”, “Industrial”, “Navigation”, and “Urban Stream” in 1993.
2 Standards for Trout Streams for dissolved oxygen are an average of 6.0 mg/l and a minimum of 5.0 mg/l. No temperature alteration is allowed in Primary Trout Streams and a temperature change of 2°F is allowed in Secondary Trout Streams. 3 Geometric means should be “based on at least four samples collected from a given sampling site over a 30-day period at intervals not less than 24 hours.” The geometric mean of a series of N terms is the Nth root of their product. Example: the geometric mean of 2 and 18 is the square root of 36. 4 Standards are same as fishing with the exception of dissolved oxygen which is site specific.
Regional Development Center Member Counties with Land Area in the Suwannee Basin Southwest Georgia Colquitt, Thomas, Worth
Middle Flint Crisp
Heart of Georgia – Altamaha Wilcox
South Georgia Ben Hill, Berrien, Brooks, Cook, Irwin, Lanier Echols, Lowndes, Tift, Turner
Southeast Georgia Atkinson, Charlton, Clinch, Coffee, Ware
Section 2. River Basin Characteristics
Suwannee River Basin Plan 2–31
Congress made changes in the CWA in 1987 that required each state to adopt numeric limits for toxic substances for the protection of aquatic life and human health. To comply with these requirements, the Board of Natural Resources adopted 31 numeric standards for protection of aquatic life and 90 numeric standards for the protection of human health. Appendix B provides a summary of toxic substance standards that apply to all waters in Georgia. Water quality standards are discussed in more detail in Section 5.2.1.
In the latter 1960s through the mid-1970s there were many water quality problems in Georgia. Many stream segments were classified for the uses of navigation, industrial, or urban stream. Major improvements in wastewater treatment over the years have allowed the stream segments to be raised to the uses of fishing or coastal fishing which include more stringent water quality standards. The final two segments in Georgia were upgraded as a part of the triennial review of standards completed in 1989. All of Georgia’s waters are currently classified as either fishing, recreation, drinking water, wild river, scenic river, or coastal fishing.
2.4.2 Water Use Classifications for the Suwannee River Basin
Waters in the Suwannee River basin are classified as fishing.
References
Burch, J.B. 1973. Freshwater Unionacean Clams (Mollusca:Pelycypoda) of North America. Identification Manual Number 11. U.S. Environmental Protection Agency, Washington, DC.
Carter, R.F., and H.R. Stiles. 1983. Average Annual Rainfall and Runoff in Georgia, 1941-1970. Hydrologic Atlas 9, U.S. Geological Survey.
Cowardin, L.M., V. Carter, F.C. Golet, and E.T. LaRoe. 1979. Classification of wetlands and deepwater habitats of the United States: U.S. Fish and Wildlife Service, FWS/OBS-79/31.
DRI/McGraw-Hill. 1996. The Regional Economic Forecast of Population and Employment Comprehensive Study Volume 1. Prepared for: The Georgia Department of natural Resources Environmental Protection Division. DRI/McGraw-Hill, Lexington, MA.
GA DNR. 2000. Water Quality in Georgia, 1998-1999. Georgia Department of Natural Resources, Environmental Protection Division, Atlanta, Georgia.
Georgia Game and Fish. 1966. Suwannee River Fish Population Studies, June and October 1966 (unpublished).
Georgia Environmental Protection Division. 1987. Water Availability And Use Report, Coastal Plain River Basins.
Heath, R.C. 1989. The Piedmont ground-water system. pp. 1-13 in Daniel, C.C. III, R.K. White, and P.A. Stone, Ground Water in the Piedmont, Proceedings of a Conference on Ground Water in the Piedmont of the Eastern United States. Clemson University, Clemson, South Carolina.
Hobbs, H.H. 1981. The Crayfishes of Georgia. Smithsonian Contributions to Zoology, Number 318.
Miller, J.A. 1990. Ground Water Atlas of the United StatesCSegment 6CAlabama, Florida, Georgia, and South Carolina. Hydrologic Investigations Atlas 730-G. U.S. Geological Survey. 730-G. U.S. Ge.
Section 2. River Basin Characteristics
2–32 Suwannee River Basin Plan
Neves, R.J., A.E. Bogan, J.D. Williams, S.A. Ahlstedt, and P.W. Hartfield. 1997. Status of aquatic molluscs in the southeastern United States: A downward spiral of diversity. Pages 43-85 in G.W. Benz and D.E. Collins, editors, Southeastern Aquatic Fauna in Peril: The Southeastern Perspective. Special Publication 1, Southeast Aquatic Research Institute. Lenz Design and Communication, Decatur, Georgia.
Peck, M.F., C.N. Joiner, and A.M. Cressler. 1992. Ground-Water Conditions in Georgia, 1991. Open-File Report 92-470. U.S. Geological Survey.
Watters, G.T. 1994. An annotated bibliography of the reproduction and propagation of the Unionoidea. Ohio Biological Survey, Miscellaneous Contributions, 1: 1-158.
Williams, J.D., M.L. Warren, K.S. Cummings, J.L. Harris, and R.J. Neves. 1992. Conservation status of freshwater mussels of the United States and Canada. Fisheries, 18(9): 6-22.
Williamson, G.K., and R.A. Moulis. 1994. Distribution of Amphibians and Reptiles in Georgia. Savannah Science Museum, Inc. Savannah, Georgia.