Embed Size (px)
Citation preview

CAPABILITY AS S E S S M E N T
What Is A Capability Assessment? The purpose of conducting a capability assessment is to determine the ability of a given jurisdiction to implement a mitigation strategy.1 As in any planning process, it is important to try to figure out what actions are feasible, based on an understanding of those departments tasked with their implementation. More specifically, the capability assessment helps to determine what mitigation actions are likely to be implemented over time given the fiscal, technical, administrative and political framework of the community.2 It also provides an opportunity to assess existing plans, policies and processes in place. A careful analysis was conducted to detect any existing gaps, shortfalls or weaknesses within existing government activities that could exacerbate community vulnerability. The assessment also highlights the positive measures already in place that should continue to be supported.
Conducting the Capability Assessment As part of the initial kickoff meetings with counties and municipal governments, H-GAC staff distributed a detailed Local Capability Assessment Survey. The survey, which was filled out by local officials, posed several questions regarding existing local plans, policies, programs or ordinances that contribute to and/ or hinder that county or municipality’s ability to implement hazard mitigation actions. In addition, respondents were asked to self-assess their capabilities.3 The information was incorporated into a database for further analysis. A general scoring methodology was applied to quantify and rank each jurisdiction’s overall capability relative to one another. According to the scoring system, each plan, policy, ordinance or program was assigned a rating based on its relevance to hazard mitigation. Additional points were added based on each county and municipal government’s self-assessment. A total score and general rating (Limited, Moderate or High) was then determined according to the total number of points received. The general survey results are summarized in Table 5.1. In addition, the results of the survey serve as a good source of introspection for those jurisdictions that wish to improve their capability. Identified gaps may be re-cast as specific mitigation actions, designed to address identified weaknesses.
1 While the Interim Final Rule for implementing the Disaster Mitigation Act of 2000 does not require a local capability assessment to be completed for local hazard mitigation plans, it is a critical step in the development of a mitigation strategy that meets the needs of each jurisdiction while taking into account their own unique abilities. However, the Rule does state that a community’s mitigation strategy should be “based on existing authorities, policies, programs and resources, and its ability to expand on and improve these existing tools” (44 CFR, Part 201.6(c) (3)). 2 Photo courtesy of the City of Galveston. 3 A copy of the survey and the scoring system used to assess county and municipal capabilities has been included in Appendix D of this Plan. Due to the length of the survey and the number of participating jurisdictions in the H-GAC Plan, the completed surveys were not included in this document. Hard copies of the surveys can be obtained by contacting the H-GAC offices.

C A P A B I L I T Y A S S E S S M E N T H O U S T O N - G A L V E S T O N A R E A C O U N C I L R E G I O N A L H A Z A R D M I T I G A T I O N P L A N
Section 5: Page 2
An inventory and analysis of previously implemented mitigation projects was also included as part of the capability assessment. This information provided a region-wide perspective of the efforts taken to reduce the effect of natural hazards and provided insight on the effectiveness of those efforts. Documenting past mitigation measures can also serve to help assess the degree to which local governments are willing to adopt future mitigation actions.
Capability Assessment Findings The findings of the capability assessment are described below. Table 5.1 provides a jurisdictional overview of the plans and programs in place, followed by summary statistics of the Local Capability Assessment Surveys . Each county and municipality was asked to self-assess their technical, fiscal, administrative and political capabilities, which were subsequently defined. As required by Annex P of the Texas Division of Emergency Management, completed Hazard Mitigation Grant Program (HMGP) projects were identified and described. Finally, conclusions were presented, including a discussion of the approach used to develop meaningful mitigation strategies based on the capability and risk assessment findings.
Table 5.1 Relevant Plans and Programs in Place
Table Key
HMP: Hazard Mitigation Plan DRP: Disaster Recovery Plan CLUP: Comprehensive Land Use Plan FMP: Floodplain Management Plan SMP: Stormwater Management Plan EOP: Emergency Operations Plan COOP: Continuity of Operations Plan REP: Radiological Emergency Plan SARA: SARA Title III Emergency Response Plan TRANS: Transportation Plan
CIP: Capital Improvements Plan (that regulates infrastructure in hazard areas) REG-PL: Regional Planning HPP: Historic Preservation Plan ZO: Zoning Ordinance SO: Subdivision Ordinance FDPO: Flood Damage Prevention Ordinance NFIP: National Flood Insurance Program CRS: Community Rating System BC: Building Codes
Jurisdiction
HM
P
DR
P
CL
UP
FMP
SM
P
EO
P
CO
OP
RE
P
SA
RA
TR
AN
S
CIP
RE
G-P
L
HP
P
ZO
SO
FDP
O
NFI
P
CR
S
BC
Austin County ? ? ? ? ? ? ? ? ? ? ? ?
Bellville ? ? ? ? ? ? ? ? ? ? ? ? ?
Brazos Country ? ? ? ? ? ? ? ? ? ? ?
Industry
San Felipe ? ? ? ? ? ? ? ? ? ? ? Sealy ? ? ? ? ? ? ? ? ? ? ? ? ? ? ? ? Wallis ? ? ? ? ? ? ? ? ? ? ? ? ? Brazoria County ? ? ? ? ? ? ? ? ? ?
Alvin ? ? ? ? ? ? ? ? ? ? ? ? ? Angleton* ?
Bailey’s Prairie* ?
Bonney* ?
Brazoria ? ? ? ? ? ? ?

C A P A B I L I T Y A S S E S S M E N T H O U S T O N - G A L V E S T O N A R E A C O U N C I L R E G I O N A L H A Z A R D M I T I G A T I O N P L A N
Section 5: Page 3
Table Key
HMP: Hazard Mitigation Plan DRP: Disaster Recovery Plan CLUP: Comprehensive Land Use Plan FMP: Floodplain Management Plan SMP: Stormwater Management Plan EOP: Emergency Operations Plan COOP: Continuity of Operations Plan REP: Radiological Emergency Plan SARA: SARA Title III Emergency Response Plan TRANS: Transportation Plan
CIP: Capital Improvements Plan (that regulates infrastructure in hazard areas) REG-PL: Regional Planning HPP: Historic Preservation Plan ZO: Zoning Ordinance SO: Subdivision Ordinance FDPO: Flood Damage Prevention Ordinance NFIP: National Flood Insurance Program CRS: Community Rating System BC: Building Codes
Jurisdiction
HM
P
DR
P
CL
UP
FMP
SM
P
EO
P
CO
OP
RE
P
SA
RA
TR
AN
S
CIP
RE
G-P
L
HP
P
ZO
SO
FDP
O
NFI
P
CR
S
BC
Brookside Village ? ? ? ? ? ? ? ? ? ? ? ? Clute* ?
Danbury* ?
Freeport ? ? ? ? ? ? ? ? ? ? ? ?
Hillcrest Village* ?
Holiday Lakes ? ? ?
Iowa Colony ? ? ? ? ? ? ? ? ?
Jones Creek* ?
Lake Jackson ? ? ? ? ? ? ? ? ? ? ? ? ? ? ?
Liverpool* ?
Manvel ? ? ? ? ? ? ? ? ? ? Oyster Creek ? ? ? ? ? ? ? ? ? ? Quintana ? ? ? ? ? ? ? ? ? Richwood ? ? ? ? ? ? ? ? ? ? ? Surfside Beach ? ? ? ? ? ? ? ? ? ? ? ? Sweeny ? ? ? ? ? ? ? ? ? Chambers County ? ? ? ? ? ? ? ? ?
Anahuac ? ? ? ? ? ? ? ? ?
Beach City ? ? ? ? ? ? ? ? ?
Cove ? ? ? ? ? ? ? ?
Old River-Winfree ? ? ? ? ? ? ? ? ?
Mont Belvieu ? ? ? ? ? ? ? ? ?
Galveston County ? ? ? ? ? ? ? ? ? ? ? ?
Bayou Vista ? ? ?
Clear Lake Shores ? ? ? ? ? ? ? ? ? ? Dickinson ? ? ? ? ? ? ? ? ? ? ? ? Galveston ? ? ? ? ? ? ? ? ? ? ? ? ? ?

C A P A B I L I T Y A S S E S S M E N T H O U S T O N - G A L V E S T O N A R E A C O U N C I L R E G I O N A L H A Z A R D M I T I G A T I O N P L A N
Section 5: Page 4
Table Key
HMP: Hazard Mitigation Plan DRP: Disaster Recovery Plan CLUP: Comprehensive Land Use Plan FMP: Floodplain Management Plan SMP: Stormwater Management Plan EOP: Emergency Operations Plan COOP: Continuity of Operations Plan REP: Radiological Emergency Plan SARA: SARA Title III Emergency Response Plan TRANS: Transportation Plan
CIP: Capital Improvements Plan (that regulates infrastructure in hazard areas) REG-PL: Regional Planning HPP: Historic Preservation Plan ZO: Zoning Ordinance SO: Subdivision Ordinance FDPO: Flood Damage Prevention Ordinance NFIP: National Flood Insurance Program CRS: Community Rating System BC: Building Codes
Jurisdiction
HM
P
DR
P
CL
UP
FMP
SM
P
EO
P
CO
OP
RE
P
SA
RA
TR
AN
S
CIP
RE
G-P
L
HP
P
ZO
SO
FDP
O
NFI
P
CR
S
BC
Hitchcock ? ? ? ? ? ? ? ? Jamaica Beach ? ? ? ? ? ? ? ? Kemah ? ? ? ? ? ? ? ? ? ? ? ? ? La Marque ? ? ? ? ? ? ? ? ? ? ? ? ? ? ? ? Tiki Island ? ? ? ? ? ? ? ? ? ? ? ? Liberty County ? ? ? ? ? ? ? ? ? ? ?
Ames ? ? ? ? Cleveland ? ? ? ? ? ? ? ? ? ? Daisetta ? ? ? ? ? ?
Dayton ? ? ? ? ? ? ? ? ? ? ?
Dayton Lakes* ?
Devers
Hardin ?
Kenefick* Liberty ? ? ? ? ? ? ? ? ? North Cleveland* Plum Grove* ?
Montgomery County
? ? ? ? ? ? ? ? ? ? ? ?
Conroe ? ? ? ? ? ? ? ? ? ? ? ? ? Cut and Shoot ? ? ? ?
Magnolia* ?
Montgomery ? ? ? ? ? ? ? ? ? ? ? ? Oak Ridge North ? ? ? ? ? ? ? ? ? ? ? ? Panorama Village ? ? ? ? ? ? ? ? ? Patton Village* ?
Roman Forest ? ? ? ? ? Shenandoah ? ? ? ? ? ? ? ? ? ? ?

C A P A B I L I T Y A S S E S S M E N T H O U S T O N - G A L V E S T O N A R E A C O U N C I L R E G I O N A L H A Z A R D M I T I G A T I O N P L A N
Section 5: Page 5
Table Key
HMP: Hazard Mitigation Plan DRP: Disaster Recovery Plan CLUP: Comprehensive Land Use Plan FMP: Floodplain Management Plan SMP: Stormwater Management Plan EOP: Emergency Operations Plan COOP: Continuity of Operations Plan REP: Radiological Emergency Plan SARA: SARA Title III Emergency Response Plan TRANS: Transportation Plan
CIP: Capital Improvements Plan (that regulates infrastructure in hazard areas) REG-PL: Regional Planning HPP: Historic Preservation Plan ZO: Zoning Ordinance SO: Subdivision Ordinance FDPO: Flood Damage Prevention Ordinance NFIP: National Flood Insurance Program CRS: Community Rating System BC: Building Codes
Jurisdiction
HM
P
DR
P
CL
UP
FMP
SM
P
EO
P
CO
OP
RE
P
SA
RA
TR
AN
S
CIP
RE
G-P
L
HP
P
ZO
SO
FDP
O
NFI
P
CR
S
BC
Splendora ? ? ? ? ? ? ?
Stagecoach* ?
Woodbranch* ?
Woodlands*
Woodloch* ?
Willis ? ? ? ? ? ? ? ? ?
Walker County* ?
Huntsville ? ? ? ? ? ? ? ? ? ?
New Waverly* ?
Riverside* ?
Waller County ? ? ? ?
Brookshire ? ? ? Hempstead ? ? ? ? ? ? ? ? Pattison ? ? Pine Island Prairie View ? ? ? ? ? ? ? ? Waller ? ? ? ? ? ? ? ?
Note: Those communities listed above with an asterisk (*) beside their name did not submit a Capabil ity Assessment Survey. As part of the Capability Assessment Survey, each county and municipality was asked to assess their own technical, fiscal, administrative and political capabilities. Table 5.2 provides the results of this self-appraisal process. An “L” indicates low capability; an “M” indicated moderate capability; and an “H” indicates high capability.

C A P A B I L I T Y A S S E S S M E N T H O U S T O N - G A L V E S T O N A R E A C O U N C I L R E G I O N A L H A Z A R D M I T I G A T I O N P L A N
Section 5: Page 6
Table 5.2 Self-Assessment of Local Capability
Jurisdiction Technical Capability
Fiscal Capability
Administrative Capability
Political Capability
Austin County L L L H Bellville M H H M Brazos Country L L L M Industry L L L L San Felipe L L L M Sealy L L L L Wallis L L L L Brazoria County M M M L Alvin M M H L Angleton* Bailey’s Prairie* Bonney* Brazoria L L M M Brookside Village L M M M Clute* Danbury* Freeport M H H M Hillcrest Village* Holiday Lakes L L L L Iowa Colony L L L L Jones Creek* Lake Jackson H M M M Liverpool* Manvel L L H H Oyster Creek L L L L Quintana H L L M Richwood H H H L Surfside Beach L L L L Sweeny L M H H Chambers County L L L L Anahuac L L L L Beach City L L L L Cove L L L L Old River-Winfree L L L L Mont Belvieu L L L L Galveston County L H H H Bayou Vista L L L L Clear Lake Shores M L M M Dickinson L L L M

C A P A B I L I T Y A S S E S S M E N T H O U S T O N - G A L V E S T O N A R E A C O U N C I L R E G I O N A L H A Z A R D M I T I G A T I O N P L A N
Section 5: Page 7
Jurisdiction Technical Capability
Fiscal Capability
Administrative Capability
Political Capability
Galveston L L M M Hitchcock L L L L Jamaica Beach M M M L Kemah L L L L La Marque M L M M Tiki Island M M M M Liberty County M M M L Ames L L L L Cleveland L L M L Daisetta L L L L Dayton L M M M Dayton Lakes* Devers L L L L Hardin L L L L Keneflick* Liberty L L L L North Cleveland* Plum Grove* Montgomery County M L M L Conroe M M M M Cut and Shoot L L L L Magnolia* Montgomery L L L H Oak Ridge North M L L L Panorama Village L L H M Patton Village* Roman Forest L L L M Shenandoah L M M L Splendora L L L L Stagecoach* Woodlands* Woodloch* Woodbranch* Willis L L H L Walker County* Huntsville L L H L New Waverly* Riverside* Waller County L L L L Brookshire L L L L Hempstead L L L M Pattison L L L L

C A P A B I L I T Y A S S E S S M E N T H O U S T O N - G A L V E S T O N A R E A C O U N C I L R E G I O N A L H A Z A R D M I T I G A T I O N P L A N
Section 5: Page 8
Jurisdiction Technical Capability
Fiscal Capability
Administrative Capability
Political Capability
Pine Island L L L L Prairie View L L M M Waller L L L L
Note: Those communities listed above with an asterisk (*) beside their name did not submit a Capability Assessment Survey.
Emergency Management Capabilities
Hazard mitigation is widely recognized as one of the four primary “phases” of emergency management. Other phases include preparedness, response and recovery. In reality, each phase is interconnected with hazard mitigation as Figure 5.1 suggests. Planning for each phase is a critical part of a comprehensive emergency management program and a key to the successful implementation of hazard mitigation actions. As a result, the Capability Assessment Survey asks several questions across a range of emergency management plans in order to assess the jurisdiction’s willingness to plan and their level of technical planning proficiency.
Figure 5.1 Hazard Mitigation and the Phases of Emergency Management
Hazard Mitigation Plan: A hazard mitigation plan represents a community’s blueprint for how they intend to reduce the impact of natural and human-caused hazards on people and the built environment. Elements of a hazard mitigation plan include a risk assessment, capability assessment and mitigation strategy.
? Survey results indicate that three (3) of the eight counties participating in the H-GAC Plan have developed hazard mitigation plans.

C A P A B I L I T Y A S S E S S M E N T H O U S T O N - G A L V E S T O N A R E A C O U N C I L R E G I O N A L H A Z A R D M I T I G A T I O N P L A N
Section 5: Page 9
? At the municipal level, 20 percent reported that they had a hazard mitigation plan in place at the time of the survey. Sixteen (16) percent of participating communities indicated that they were part of a county mitigation plan. Sixty-six (66) percent of municipalities did not have a plan in place at the time of the survey.4
Disaster Recovery Plan: A disaster recovery plan serves to guide the physical, social, environmental and economic recovery and reconstruction process following a disaster.
? Survey results indicated that four (4) of the seven counties responding to the survey have developed a disaster recovery plans.
? Twenty-four (24) percent of the municipalities surveyed indicated that they had a disaster recovery plan in place, while 14 percent of municipalities reported that they were part of a county recovery plan. Sixty-two (62) percent of municipalities did not have a plan in place at the time of the survey.
Emergency Operations Plan: An emergency operations plan outlines responsibilities and the means by which resources are deployed following an emergency or disaster.
? Survey results indicated that six (6) of the seven counties responding to the survey have an emergency operation plan.
? Fifty (50) percent of the municipalities that responded to the survey reported having an emergency operations plan in place. Twenty-eight (28) percent of municipalities reported that they participated in the county emergency operations plan. Twenty-two (22) percent of reporting municipalities did not have a plan in place at the time of the survey.
Continuity of Operation Plan: A continuity of operations plan establishes a chain of command, line of succession and plans for backup or alternate emergency facilities in case of an extreme emergency.
? Survey results indicate that six (6) counties have a continuity of operation plan.
? Survey results indicate that 24 percent of municipalities maintain a stand alone continuity of operation plan, while 14 percent of municipalities reported that they participated in a county-level plan. Sixty-two (62) percent of municipalities do not maintain a continuity of operation plan.
Radiological Emergency Plan: A radiological emergency plan delineates roles and responsibilities for assigned personnel and the means to deploy resources in the event of a radiological accident.
? Survey results indicate that five (5) of the counties have a radiological emergency plan.
? Twenty-eight (28) percent of the municipalities have radiological emergency plans, while 18 percent participate in their county’s plan. Fifty-eight (58) percent of municipalities do not have a radiological emergency plan.
General Planning Capabilities
4 Each participating county and municipality will have a hazard mitigation plan in place once this planning process is complete.

C A P A B I L I T Y A S S E S S M E N T H O U S T O N - G A L V E S T O N A R E A C O U N C I L R E G I O N A L H A Z A R D M I T I G A T I O N P L A N
Section 5: Page 10
The implementation of hazard mitigation activities often involves individuals beyond the emergency management profession. Stakeholders may include local planners, public works officials, economic development specialists and others. Similarly, hazard mitigation planning crosses multiple disciplines. As a result, the questions asked in the Capability Assessment Survey regarding general planning capabilities were designed to measure the degree to which mitigation was integrated into other planning efforts. Regional Planning: Regional planning refers to any type of planning effort that involves a community working in conjunction with neighboring jurisdictions. For example, the development of this Hazard Mitigation Plan is a regional planning effort.
? Survey results indicate that six (6) counties have participated in regional planning efforts.
? Fifty-six (56) percent of municipalities reported participating in regional plans.5 Comprehensive Plan: A comprehensive plan establishes an overall community vision and a guide to municipal decision-making. Typically a comprehensive plan is comprised of demographic conditions, land use, transportation elements and community facilities.6 Given the broad nature of the plan and its regulatory standing, the integration of hazard mitigation measures into the comprehensive plan can enhance the likelihood of achieving risk reduction goals and actions.
? Survey results indicate that no counties maintain comprehensive plans.7 ? Ten (10) percent of municipalities reported the existence of a comprehensive plan, while
14 percent reported that they are in the process of developing a plan. Seventy-six (76) percent of municipalities did not have a comprehensive plan in place at the time of this survey.
Transportation Plan: A transportation plan identifies the means to gauge transportation demands and the options to meet those needs, while considering the social, economic and environmental characteristics of the area. The development of transportation networks can significantly impact the amount, type and location of future growth. As a result, transportation planning can have a dramatic impact on future hazard vulnerability.
? Survey results indicated that five (5) counties maintain transportation plans.8
? Twenty-four (24) percent of municipalities had a transportation plan in place at the time of this survey.
Capital Improvements Plan: A capital improvement plan guides the scheduling of public improvements spending. A capital improvements plan can serve as an important mechanism to guide future development away from identified hazard areas. Limiting public spending in hazardous areas is one of the most effective long-term mitigation actions available to local governments.
5 These figures underestimate county and municipal involvement in regional planning, as the H-GAC Regional Mitigation Plan is a multi-jurisdictional effort. 6 Adapted from The Practice of Local Government Planning. 1988. Frank So and Judith Getzels, Eds. International City Management Association: Washington, D.C. pp. 71-81. 7 County governments do not have the statutory authority to implement land use controls. 8 Several respondents considered the transportation plan to be part of the emergency plan (Annex S) and not a separate planning document.

C A P A B I L I T Y A S S E S S M E N T H O U S T O N - G A L V E S T O N A R E A C O U N C I L R E G I O N A L H A Z A R D M I T I G A T I O N P L A N
Section 5: Page 11
? Survey results indicated that two (2) counties have a capital improvement plan.
? Eighteen (18) percent of the municipalities surveyed indicated that they do not have a capital improvement plan.
Historic Preservation Plan: A historic preservation plan is designed to establish a strategy for protecting historic structures or districts within a community. An often overlooked aspect of the historic preservation plan is the assessment of buildings and sites located in areas subject to natural hazards, including the identification of the means to reduce future damages.9 Examples involve retrofitting or relocation techniques that account for the need to protect buildings that may not meet current building standards or are located within a historic district that cannot easily be moved out of harms way.
? None of the counties had a historic preservation plan in place at the time of this survey.
? One municipality indicated that they maintained a historic preservation plan. Zoning Ordinances: Zoning represents the primary means by which land use is controlled by local governments. As part of a community’s police power, zoning is used to protect the public health, safety and welfare of those in a given jurisdiction. A zoning ordinance is the mechanism through which zoning is typically implemented. Since zoning regulations enable municipal governments to limit the type and density of development, it can serve as a powerful tool when applied in identified hazard areas.
? No counties reported that they had a zoning ordinance in place. 10
? Forty (40) percent of participating municipalities reported that they maintained a zoning ordinance.
Subdivision Ordinances: A subdivision ordinance is intended to regulate the development of housing, commercial, industrial or other uses, including associated public infrastructure, as land is subdivided into buildable lots for sale or future development. Subdivision design that accounts for natural hazards can dramatically reduce the exposure of future development.11
? Survey results indicated that six (6) counties maintain subdivision ordinances.
? Seventy-eight (78) percent of participating municipalities have subdivision ordinances. Building Codes, Permitting and Inspections : Building Codes regulate construction standards. Decisions regarding the adoption of building codes (that account for hazard risk), the type of permitting process required both before and after a disaster, and the enforcement of inspection protocols all affect the level of hazard risk faced by a community.
9 See Protecting the Past from Natural Disasters. 1989. Nelson, Carl. National Trust for Historic Preservation: Washington, D.C. 10 Counties do not have the statutory authority to implement land use controls such as zoning (see Chapter 232, Texas Local Government Code). 11 For additional information regarding the use of subdivision regulations in reducing flood hazard risk, see Subdivision Design in Flood Hazard Areas. 1997. Morris , Marya. Planning Advisory Service Report Number 473. American Planning Association: Washington, D.C.

C A P A B I L I T Y A S S E S S M E N T H O U S T O N - G A L V E S T O N A R E A C O U N C I L R E G I O N A L H A Z A R D M I T I G A T I O N P L A N
Section 5: Page 12
? No counties enforce building codes.12
? Seventy-six (76) percent of participating municipalities enforce building codes.
12 Counties are not allowed to adopt building codes. However, some counties have adopted the Uniform Fire and Building Codes for commercial buildings and certain public facilities in order to address fire safety.
C A P A B I L I T Y A S S E S S M E N T H O U S T O N - G A L V E S T O N A R E A C O U N C I L R E G I O N A L H A Z A R D M I T I G A T I O N P L A N
Section 5: Page 13
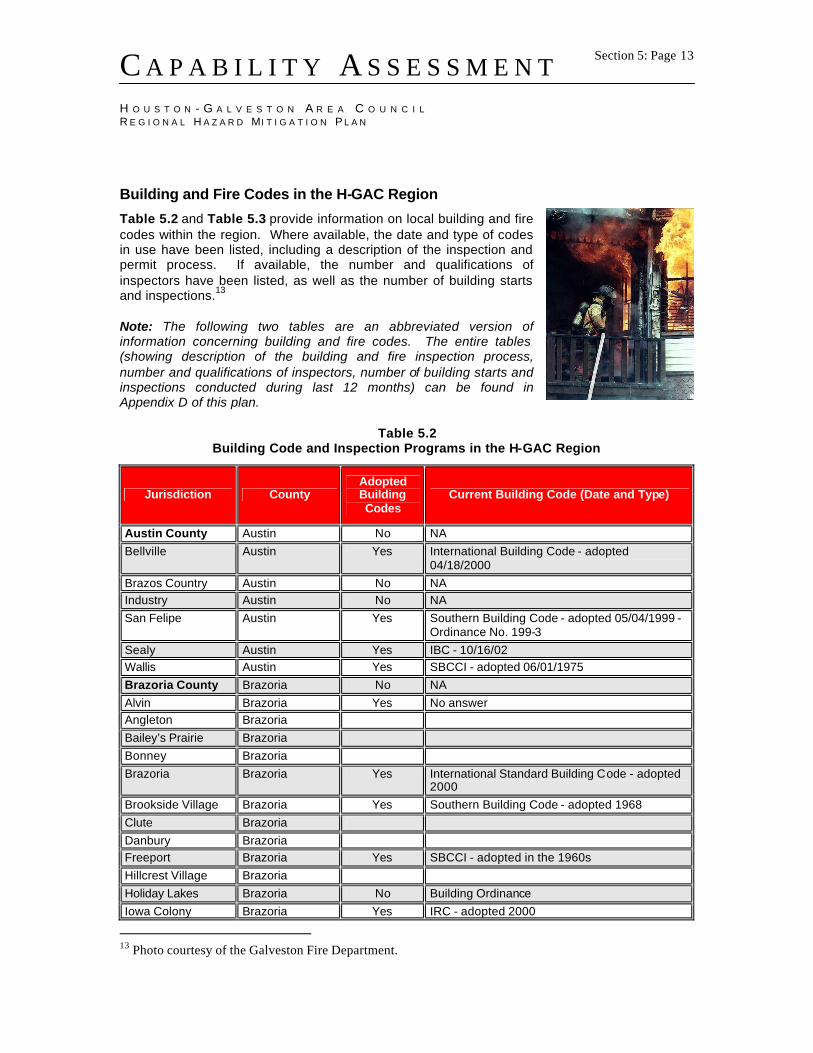
Building and Fire Codes in the H-GAC Region
Table 5.2 and Table 5.3 provide information on local building and fire codes within the region. Where available, the date and type of codes in use have been listed, including a description of the inspection and permit process. If available, the number and qualifications of inspectors have been listed, as well as the number of building starts and inspections.13 Note: The following two tables are an abbreviated version of information concerning building and fire codes. The entire tables (showing description of the building and fire inspection process, number and qualifications of inspectors, number of building starts and inspections conducted during last 12 months) can be found in Appendix D of this plan.
Table 5.2 Building Code and Inspection Programs in the H-GAC Region
Jurisdiction County Adopted Building Codes
Current Building Code (Date and Type)
Austin County Austin No NA Bellville Austin Yes International Building Code - adopted
04/18/2000 Brazos Country Austin No NA Industry Austin No NA San Felipe Austin Yes Southern Building Code - adopted 05/04/1999 -
Ordinance No. 199-3 Sealy Austin Yes IBC - 10/16/02 Wallis Austin Yes SBCCI - adopted 06/01/1975 Brazoria County Brazoria No NA Alvin Brazoria Yes No answer Angleton Brazoria Bailey’s Prairie Brazoria Bonney Brazoria Brazoria Brazoria Yes International Standard Building Code - adopted
2000 Brookside Village Brazoria Yes Southern Building Code - adopted 1968 Clute Brazoria Danbury Brazoria Freeport Brazoria Yes SBCCI - adopted in the 1960s Hillcrest Village Brazoria Holiday Lakes Brazoria No Building Ordinance Iowa Colony Brazoria Yes IRC - adopted 2000
13 Photo courtesy of the Galveston Fire Department.

C A P A B I L I T Y A S S E S S M E N T H O U S T O N - G A L V E S T O N A R E A C O U N C I L R E G I O N A L H A Z A R D M I T I G A T I O N P L A N
Section 5: Page 14
Jurisdiction County Adopted Building Codes
Current Building Code (Date and Type)
Jones Creek Brazoria Lake Jackson Brazoria Yes International Building Code - adopted 2000 Liverpool Brazoria Manvel Brazoria Yes SBCCI and ICBO Oyster Creek Brazoria Yes Standard Building Code - originally adopted
codes in 1987 Quintana Brazoria Yes SBCCI - originally adopted codes in 1976 Richwood Brazoria Yes International Building Code Surfside Beach Brazoria Yes SBCCI - originally adopted codes in 1994 Sweeny Brazoria Yes International Building Code - 2000 Chambers County Chambers No NA Cove Chambers Anahuac Chambers Beach City Chambers Old River-Winfree Chambers/Liberty Mont Belvieu Chambers/Liberty Galveston County Galveston No NA Bayou Vista Galveston No answer No answer Clear Lake Shores Galveston Yes International Building Code (2000) Dickinson Galveston Yes SBCCI and IBC Galveston Galveston Hitchcock Galveston Yes Southern Building Code promulgated by the
Southern Building Code Congress and International - first adopted in 1968
Jamaica Beach Galveston Yes International Building Code - adopted 12/03/2001
Kemah Galveston Yes ICBO - adopted July 91 - amended 03/02/2000 La Marque Galveston Yes Standard Code - adopted in the 1970s Tiki Island Galveston Yes ICC 2000 - codes first adopted in 1983 Liberty County Liberty No NA Ames Liberty Yes SBCCI Cleveland Liberty Yes IBC (2000) - originally adopted codes in 1976 Daisetta Liberty No NA Dayton Liberty Yes IBC (2000) - originally adopted codes in 1991 Dayton Lakes Liberty Devers Liberty No NA Hardin Liberty No NA Kenefick Liberty Liberty Liberty Yes ICC - 2002 North Cleveland Liberty Plum Grove Liberty Montgomery Montgomery No NFIP and septic only

C A P A B I L I T Y A S S E S S M E N T H O U S T O N - G A L V E S T O N A R E A C O U N C I L R E G I O N A L H A Z A R D M I T I G A T I O N P L A N
Section 5: Page 15
Jurisdiction County Adopted Building Codes
Current Building Code (Date and Type)
County Conroe Montgomery Yes ICC - adopted 2002 Cut and Shoot Montgomery Yes International Residential Code and National
Electrical Code - adopted Dec 01 to comply with Chapter 214 LGC Subchapter G
Magnolia Montgomery Montgomery Montgomery Yes International Residential Code - 2001 Oak Ridge North Montgomery Yes International Building Code Panorama Village Montgomery Yes SBCCI - adopted in 1972 Patton Village Montgomery Roman Forest Montgomery Yes Standard Building Code - adopted 1975 Shenandoah Montgomery Yes ICC Splendora Montgomery Yes SBCCI - unsure of adoption date The Woodlands Montgomery Willis Montgomery Yes SBCCI (1997) - adopted 04/21/98 Walker County Walker No Huntsville Walker Yes International Building Code (2000) - adopted
February 2002 Riverside Walker New Waverly Walker Waller County Waller No NA Brookshire Waller Yes ICC Hempstead Waller Yes Southern Building Code 09/22/1998 Pattison Waller Yes Southern Building Code (99) 10/10/2002 Pine Island Waller No NA Prairie View Waller Yes SBCCI - adopted 2000 Waller Waller/Harris Yes Ordinance 280 - 11/11/2002 and ordinance 281
– 11/11/2002 - ICC
Table 5.3 Fire Codes in the H-GAC Region
Jurisdiction County Adopted
Fire Codes
Current Fire Code (Date and Type)
Austin County Austin No NA Bellville Austin Yes International Fire Code - 1991 Brazos Country Austin No NA Industry Austin No NA San Felipe Austin No NA Sealy Austin Yes International Fire Code - 2000 edition Wallis Austin No Brazoria County Brazoria Yes International Fire Code

C A P A B I L I T Y A S S E S S M E N T H O U S T O N - G A L V E S T O N A R E A C O U N C I L R E G I O N A L H A Z A R D M I T I G A T I O N P L A N
Section 5: Page 16
Jurisdiction County Adopted
Fire Codes
Current Fire Code (Date and Type)
Alvin Brazoria Yes SBCCI Inspected annually on request Angleton Brazoria Bailey’s Prairie Brazoria Bonney Brazoria Brazoria Brazoria No Brookside Village Brazoria Yes SBCC - Adopted 11/14/2000 Clute Brazoria Danbury Brazoria Freeport Brazoria Yes Southern Building Code (1997 Edition) - adopted
in 2000 Hillcrest Village Brazoria Holiday Lakes Brazoria No NA Iowa Colony Brazoria No NA Jones Creek Brazoria Lake Jackson Brazoria Yes Adopted in 1958 - upgraded to International Fire
Code in 2000 Liverpool Brazoria Manvel Brazoria Yes 2000 International Fire Code 08/11/00 Oyster Creek Brazoria No NA Quintana Brazoria Yes Fire Prevention Code - adopted 1980 Richwood Brazoria Yes International Fire Code Surfside Beach Brazoria No NA Sweeny Brazoria No NFPA Chambers County Chambers No NA Cove Chambers Anahuac Chambers Beach City Chambers Old River-Winfree Chambers/Liberty Mont Belvieu Chambers/Liberty Galveston County Galveston No NA Bayou Vista Galveston No
answer No answer
Clear Lake Shores Galveston Yes International Uniform Fire Code Dickinson Galveston Yes STPC 1994 Galveston Galveston Hitchcock Galveston Yes Standard Fire Code Jamaica Beach Galveston Yes International Fire Code - adopted 12/03/2001 Kemah Galveston Yes NFPA - adopted 05/12/1994 - amended IFC in
March 2002 La Marque Galveston Yes Standard Fire Code - adopted in 1997 Tiki Island Galveston Yes NFPA Liberty County Liberty Yes Life Safety Code

C A P A B I L I T Y A S S E S S M E N T H O U S T O N - G A L V E S T O N A R E A C O U N C I L R E G I O N A L H A Z A R D M I T I G A T I O N P L A N
Section 5: Page 17
Jurisdiction County Adopted
Fire Codes
Current Fire Code (Date and Type)
Ames Liberty No NA Cleveland Liberty Yes 2000 International Fire Code - originally adopted
fire codes in 1976 Daisetta Liberty No NA Dayton Liberty Yes International Fire Code (2000) - originally adopted
codes in 1991 Dayton Lakes Liberty Devers Liberty No NA Hardin Liberty No NA Kenefick Liberty Liberty Liberty Yes IFC North Cleveland Liberty Plum Grove Liberty Montgomery County
Montgomery No NA
Conroe Montgomery Yes International Fire Code - 2000 edition Cut and Shoot Montgomery No Fire related matters are handled by ESD 12 Magnolia Montgomery Montgomery Montgomery Yes Standard Fire Prevention Code - adopted 1998 Oak Ridge North Montgomery Yes International Code Council - adopted 1982 Panorama Village Montgomery Yes 1998 Patton Village Montgomery Roman Forest Montgomery No NA Shenandoah Montgomery Yes International Fire Code Splendora Montgomery No NA The Woodlands Montgomery Willis Montgomery Yes Standard Fire Code (1997) - adopted 04/21/1998 Walker County Walker Huntsville Walker Yes Adopted International Fire Code 2000 Riverside Walker New Waverly Walker Waller County Waller No NA Brookshire Waller Yes SBCC Hempstead Waller Yes International Fire Code Pattison Waller No NA Pine Island Waller No NA Prairie View Waller Yes NFPA Waller Waller/Harris Yes 2003 ICC Fire Code
In addition to using survey results, the adoption and enforcement of building codes by local jurisdictions were assessed using the Building Code Effectiveness Grading Schedule (BCEGS)

C A P A B I L I T Y A S S E S S M E N T H O U S T O N - G A L V E S T O N A R E A C O U N C I L R E G I O N A L H A Z A R D M I T I G A T I O N P L A N
Section 5: Page 18
program developed by the Insurance Services Office, Inc. (ISO). 14 Under the BCEGS program, ISO assesses the building codes in effect in a particular community and how the community enforces its building codes, with special emphasis on mitigation of losses from natural hazards. The results of BCEGS assessments are routinely provided to private insurance companies, which in turn may offer ratings credits for new buildings constructed in communities with strong BCEGS classifications. ISO assumes that communities with well-enforced, up-to-date codes should suffer fewer losses, thereby enabling insurers to offer lower rates. In conducting the assessment, ISO collects information related to the qualifications of personnel as well as number of inspections performed per day. This type of information, combined with local building codes, is used to determine a grade for that jurisdiction. Grades range from 1 to 10, with lower grades representing a higher standard. A BCEGS grade of 1 represents an exemplary commitment to building code enforcement, whereas a grade of 10 indicates that a jurisdiction does not meet a minimum recognized protection level. The results of those jurisdictions in the H-GAC planning area that agreed to submit to the evaluation are listed in Table 5.4.
Table 5.4
H-GAC Building Code Effectiveness Grading Schedule
Jurisdiction County Personal Rating
Commercial Rating
Most Recent Date of Evaluation
Angleton Brazoria 5 5 1996 Bellville Austin 8 8 1997 Brazoria Brazoria 6 6 1999 Brookshire Waller 5 5 1997 Clear Lake Shores Galveston 6 6 1996 Cleveland Liberty 6 6 1997 Clute Brazoria 5 5 1999 Conroe Montgomery 6 6 2000 Dayton Liberty 5 5 1997 Dickinson Galveston 8 8 1996 Freeport Brazoria 6 6 1999 Galveston Galveston 7 7 1996 Hitchcock Galveston 7 7 1997 Huntsville Walker 8 8 1997 Kemah Galveston 5 5 1999 La Marque Galveston 6 6 1996 Lake Jackson Brazoria 6 6 1996 Liberty Liberty 7 7 1996 Mont Belvieu Chambers/ Liberty 7 7 1997 Sealy Austin 5 5 1996
14 Participation in BCEGS is voluntary. Local governments must request that ISO officials conduct an evaluation.

C A P A B I L I T Y A S S E S S M E N T H O U S T O N - G A L V E S T O N A R E A C O U N C I L R E G I O N A L H A Z A R D M I T I G A T I O N P L A N
Section 5: Page 19
Floodplain Management Capability
Flooding represents the greatest natural hazard facing the Nation and the H-GAC planning area. At the same time, the tools available to reduce the impacts associated with flooding are among the most advanced when compared to other hazard-specific mitigation techniques. In addition to approaches that cut across hazards, such as education, outreach and the training of local officials, the National Flood Insurance Program (NFIP) offers specific regulatory measures that enable government officials to determine where and how growth occurs relative to flood hazards. In order for a county or municipality to join the NFIP, they must adopt a Local Flood Damage Prevention Ordinance that requires jurisdictions to follow established minimum building standards in the floodplain. Another key service provided by the NFIP is the mapping of identified flood hazard areas. Flood Insurance Rate Maps (FIRMs) are used to assess flood hazard risk and set flood insurance rates. The maps also provide an important tool to educate residents, government officials and the business community about the likelihood of flooding in their community. All counties and 86 percent of municipalities in the H-GAC planning area participate in the NFIP.15 Table 5.5 provides a snapshot of the NFIP flood insurance policies in place within the H-GAC region. This is a summary table organized by county.
Table 5.5 National Flood Insurance Program Policy Summary
Jurisdiction Total Number of Policies Total Coverage Total Number of
Losses Total Dollars
Paid
Austin 283 $46,688 57 $1,471,819 Brazoria 28,965 $4,766,533 12,774 $144,122,574 Chambers 5,344 $873,560 2,305 $29,040,113 Galveston 52,779 $8,425,159 29,549 $285,798,107 Liberty 1,477 $191,723 1,792 $22,868,393 Montgomery 11,294 $2,276,196 5,683 $134,486,953 Walker 185 $26,079 189 $2,390,511 Waller 486 $79,950 173 $3,867,245 TOTAL 100,813 $16,685,888 52,522 $624,045,715
An additional indicator of floodplain management capability is the number of participants in the Community Rating System (CRS). The CRS is an incentive -based program that encourages counties and municipalities to undertake flood mitigation activities that go beyond the minimum requirements of the NFIP. All of the 18 creditable CRS mitigation activities are assigned point values. As points are accumulated and reach identified thresholds, communities can apply for an improved CRS class rating. Class ratings, which range from 10 to 1, are tied to flood insurance premium reductions. As class ratings decrease, the percent reduction in flood insurance
15 Some jurisdictions surveyed do not participate in the NFIP due to the lack of mapped Special Flood Hazard Areas or the belief that they do not face a significant flood risk. However, localized flooding may occur regardless of existing streams, rivers or low-lying areas. Furthermore, homeowners are not eligible to maintain flood insurance unless the jurisdiction in which they own property participates in the NFIP.

C A P A B I L I T Y A S S E S S M E N T H O U S T O N - G A L V E S T O N A R E A C O U N C I L R E G I O N A L H A Z A R D M I T I G A T I O N P L A N
Section 5: Page 20
premiums for NFIP policyholders in that community increases. Of the 57 jurisdictions that responded to the survey, three municipalities and no counties participate in this program.
Table 5.6 CRS Premium Discounts
1 45% 2 40% 3 35% 4 30% 5 25% 6 20% 7 15% 8 10% 9 5% 10 ---
Table 5.7
CRS Communities and Rankings in the H-GAC Region
Jurisdiction
CRS Rating
Conroe 7 Tiki Island 9
Kemah 5
Table 5.8 Information on Floodplain Management Programs in the H-GAC Region
Note: The following information was taken from the Local Community Capability Assessment Surveys . The full version of this table (including information regarding the number of inspections conducted and number of permits issued in the last 12 and the number and explanation of variances issued in the last 12 months) can be found in Appendix D.
Jurisdiction County NFIP Participant
Current Floodplain Management Ordinance/
Court Orders Date Adopted
Austin County Austin Y Flood Damage Prevention Ordinance
11/13/1989 amended 05/24/1999
Bellville Austin Y See Austin County 04/1998 Brazos Country Austin Y Ordinance 2001-09 08/15/2001 Industry Austin N NA NA San Felipe Austin Y See Austin County No answer Sealy Austin Y Flood Damage Prevention
Ordinance 06/09/1999
Wallis Austin Y See Austin County No answer Brazoria County Brazoria Y Flood Damage Prevention
Ordinance Adopted 12/1971
Alvin Brazoria Y No answer No answer Angleton Brazoria Y

C A P A B I L I T Y A S S E S S M E N T H O U S T O N - G A L V E S T O N A R E A C O U N C I L R E G I O N A L H A Z A R D M I T I G A T I O N P L A N
Section 5: Page 21
Jurisdiction County NFIP Participant
Current Floodplain Management Ordinance/
Court Orders Date Adopted
Bailey’s Prairie Brazoria Y Bonney Brazoria Y Brazoria Brazoria Y Flood Damage Prevention
Ordinance No answer
Brookside Village Brazoria Y Flood Damage Prevention Ordinance
No answer
Clute Brazoria Y Danbury Brazoria Y Freeport Brazoria Y Flood Damage Prevention
Ordinance 04/1989
Hillcrest Village Brazoria Y No NA Holiday Lakes Brazoria Y Iowa Colony Brazoria Y No NA Jones Creek Brazoria Y Lake Jackson Brazoria Y No - part of Floodplain
Management NA
Liverpool Brazoria Y Manvel Brazoria Y Ordinance #2-90-05 08/10/00 Oyster Creek Brazoria Y Ordinance Number 311 03/19/1987 Quintana Brazoria Y Flood Damage Prevention
Ordinance 1984
Richwood Brazoria Y Flood Damage Prevention Ordinance
1987
Surfside Beach Brazoria Y No NA Sweeny Brazoria Y Ordinance Number 102-87 1987 Chambers County Chambers Y Cove Chambers N Anahuac Chambers Y Beach City Chambers Y Old River-Winfree Chambers/
Liberty Y
Mont Belvieu Chambers/ Liberty
Y
Galveston County Galveston Y Flood Damage Prevention Ordinance
1971 - latest update 2002
Bayou Vista Galveston Y No answer to survey questions
No answer
Clear Lake Shores Galveston Y Flood Damage Prevention Ordinance
1987
Dickinson Galveston Y Floodplain Management Ordinance
No answer
Galveston Galveston Y Hitchcock Galveston Y No ordinance NA

C A P A B I L I T Y A S S E S S M E N T H O U S T O N - G A L V E S T O N A R E A C O U N C I L R E G I O N A L H A Z A R D M I T I G A T I O N P L A N
Section 5: Page 22
Jurisdiction County NFIP Participant
Current Floodplain Management Ordinance/
Court Orders Date Adopted
Jamaica Beach Galveston Y Flood Damage Prevention Ordinance
10/2002
Kemah Galveston Y Flood Damage Prevention Ordinance
Adopted 02/27/1992 - amended 09/26/2002
La Marque Galveston Y Flood Damage Prevention Ordinance
2002
Tiki Island Galveston Y Flood Damage Prevention Ordinance
1983
Liberty County Liberty Y Flood Damage Prevention Order
07/25/1988 - entered into record 03/02/1992 (Vol. 7 Page 635)
Ames Liberty N NA NA Cleveland Liberty Y Daisetta Liberty Y No ordinance NA Dayton Liberty Y Flood Damage Prevention
Ordinance 1988
Dayton Lakes Liberty Y Devers Liberty N NA NA Hardin Liberty Y Answered no to all Kenefick Liberty N Liberty Liberty Y No ordinance No answer North Cleveland Liberty N Plum Grove Liberty Y Montgomery County Montgomery Y No ordinance Joined the program in
1978-79 Conroe Montgomery Y Flood Damage Prevention
Ordinance 1995 - currently being amended
Cut and Shoot Montgomery Y No ordinance Adopted 06/1987, amended 11/1996
Magnolia Montgomery Y Montgomery Montgomery Y Flood Damage Prevention
Ordinance 1996
Oak Ridge North Montgomery Y Flood Damage Prevention Ordinance
1982 - amended 1997
Panorama Village Montgomery Y Flood Damage Prevention Ordinance
No answer
Patton Village Montgomery N Roman Forest Montgomery Y No ordinance NA Shenandoah Montgomery Y Floodplain Management
Ordinance (ORD. No. 0-9604)
12/11/1996 - amended 04/24/2002 to include criminal and civil penalties
Splendora Montgomery Y Flood Damage Prevention Ordinance
12/04/1986

C A P A B I L I T Y A S S E S S M E N T H O U S T O N - G A L V E S T O N A R E A C O U N C I L R E G I O N A L H A Z A R D M I T I G A T I O N P L A N
Section 5: Page 23
Jurisdiction County NFIP Participant
Current Floodplain Management Ordinance/
Court Orders Date Adopted
The Woodlands Montgomery Y Willis Montgomery Y Flood Damage Prevention
Ordinance 12/17/1996
Walker County Walker Y Huntsville Walker Y Flood Damage Prevention
Ordinance 07/05/1977
Riverside Walker Y New Waverly Walker Y Waller County Waller Y Flood Damage Prevention
Ordinance Joined the program in the 1980s
Brookshire Waller Y Answered no to all Hempstead Waller Y Flood Damage Prevention
Ordinance 01/08/1988
Pattison Waller Y Answered no to all Pine Island Waller N NA NA Prairie View Waller Y No ordinance Joined the program in
1987 Waller Waller/
Harris Y Floodplain Ordinance No answer
Community Assistance Visits (CAVs): State and federal floodplain management officials occasionally perform Community Assistance Visits (CAVs). A CAV is performed to review the local floodplain management program and note any deficiencies. H-GAC officials sent a letter to FEMA requesting information on CAVs conducted over the past 15 years for the participating jurisdictions. FEMA responded that they could not provide this information because of limited manpower and because community files are purged on a regular basis. Floodplain Management Plan: A floodplain management plan (or Flood Mitigation Plan) provides a framework for action regarding the corrective and preventative measures in place to reduce flood-related impacts.
? Survey results indicated that six (6) counties had a floodplain management plan in place at the time of this survey.
? Fifty-six (56) percent of participating municipalities reported that they had a floodplain management plan and eight (8) percent reported that they were part of a county-level plan.
Stormwater Management Plan: A stormwater management plan is designed to address flooding associated with stormwater runoff. The stormwater management plan is typically focused on design and construction measures that are intended to reduce the impact of more frequently occurring minor urban flooding.
? Survey results indicated that two (2) counties maintain a stormwater management plan.

C A P A B I L I T Y A S S E S S M E N T H O U S T O N - G A L V E S T O N A R E A C O U N C I L R E G I O N A L H A Z A R D M I T I G A T I O N P L A N
Section 5: Page 24
? According to survey results, 24 percent of municipalities had a stormwater management plan in place at the time of this survey, and one municipality noted that they participated in their county-level stormwater management plan.
County and Municipal Self-Assessment
The Capability Assessment Survey was comprised of two parts: 1) an evaluation of existing plans, policies and ordinances and 2) a self-assessment of county and municipal capabilities. This section discusses the findings of the self-assessment. County and municipal officials were asked to self-assess their capabilities (as high, moderate or limited) across the following characteristics: technical, administrative/ institutional, fiscal and political capability.16 First, a description of each characteristic is provided, followed by the regional findings. It is important to note that due to the high degree of variability across county and municipal capabilities, the mitigation actions chosen by each jurisdiction in their Mitigation Action Plans will reflect these local abilities.
Technical Capability
Technical capability can be defined as possessing the skills and tools needed to improve decision making, including the development of sound mitigation actions. Technical capability can be measured across three primary elements: 1) geographic information systems (GIS) and database management; 2) grants management; and 3) hazard mitigation planning. Measuring the degree to which each element is found in the H-GAC region was conducted using the Capability Assessment Survey and through discussions with county and municipal staff. Self-assessment survey questions addressing technical capability focused on the use of GIS, while questions addressing grants management and mitigation planning capability can be found in Part VI, Participation in Grant Programs and Projects and Part II, Hazard Mitigation Plans, Policies and Ordinances. The analysis of the responses to the Capability Assessment Survey indicated that there is generally a low technical capability at the county and municipal level. Seventy-seven (77) percent rated their technical capability as low. Of the 57 responding counties and municipalities, three jurisdictions (municipalities) assessed themselves as having a high level of technical capability, while 10 (three counties and seven municipalities) responded that they had a moderate technical capability. The following are a summary of key resource needs affecting technical capability:
? Information on previous disasters and mitigation projects;
? Additional training to undertake GIS -driven risk assessments, identify potential mitigation projects, and develop hazard mitigation plans; and
? Enhancing the ability to use information technologies to facilitate the formulation, development, implementation and monitoring of mitigation plans.
Recommendations : The result of the technical capability assessment highlights a belief among those who filled out the survey that the existing capability of most counties and communities could be improved. As a result, local Mitigation Action Plans should be developed that strengthen technical capabilities. While there is a wide range of technical resources across county and municipal governments, the development of a systematic protocol for sharing resources could 16 Seven of the eight participating counties and 59 percent of the municipalities answered the self-assessment survey questions.

C A P A B I L I T Y A S S E S S M E N T H O U S T O N - G A L V E S T O N A R E A C O U N C I L R E G I O N A L H A Z A R D M I T I G A T I O N P L A N
Section 5: Page 25
significantly increase the level of technical capability to analyze natural hazards and develop meaningful actions to reduce their impact. The development of regional mitigation actions could also be used to assist in this effort.
Administrative/ Institutional Capability
Administrative and institutional capability was evaluated by reviewing county and municipal staffing and the existing organizational structure found across local government to implement mitigation strategies. The analysis of the responses to the Capability Assessment Survey indicated that there is a moderate to low administrative capability at the county and municipal levels respectively. However, this capability varies widely across municipalities. Of the six counties responding, one reported a high administrative capability, while three counties self-assessed their administrative capability as moderate and two reported a low capability. Sixty-four (64) percent of municipalities reported their administrative capability as low, while 24 percent rated their administrative capability as moderate and 12 percent rated their administrative capability as high. The following are a summary of key issues affecting administrative capability:
? Limited integration of mitigation into county/ local government functions; and
? Limited interdepartmental coordination. ? Limited powers granted to County governments17.
Recommendations : The results of the administrative capability assessment demonstrate that counties, generally speaking, and larger municipalities, tend to possess a stronger administrative capability than smaller, rural communities. The enhancement of administrative capability may be achieved through county/ municipal training, outreach and mentoring of smaller rural jurisdictions as well as the sharing of resources, when appropriate.
Fiscal Capability
The ability to take action is often closely associated with the amount of money available to implement policies and projects.18 This may take the form of grants received or state and locally-based revenue. The costs associated with policy and project implementation vary widely. In some cases, policies are tied primarily to staff costs associated with the creation and monitoring of a given program. In other cases, money is linked to a project, such as the acquisition of flood-prone homes, which can require a substantial commitment from local, state and federal funding sources.
17 Counties in the state of Texas have limited powers when it comes to enacting codes. Similarly, County governments may not adopt ordinances; they may only implement court orders. 18 Gaining access to federal, state or other sources of funding is often an overriding factor driving the development of hazard mitigation plans. However, an important objective of local governments seeking a more sustainable future is the concept of self-reliance. Over time, counties and municipalities should seek the means to become less dependent on federal assistance, developing a more diversified approach that assesses the availability of federal, state and locally-generated funding to implement mitigation actions. Additional assistance may be available from the business and corporate sector as well as certain non-profit groups. This should be coupled with an attempt to identify mitigation measures that cost little or no money, yet may compliment the larger array of actions identified in the plan.

C A P A B I L I T Y A S S E S S M E N T H O U S T O N - G A L V E S T O N A R E A C O U N C I L R E G I O N A L H A Z A R D M I T I G A T I O N P L A N
Section 5: Page 26
The analysis of the responses to the Capability Assessment Survey indicated that there is a moderate to low fiscal capability at the county and municipal levels respectively. Of the six counties responding, one reported a high fiscal capability, while two counties self-assessed their fiscal capability as moderate and three reported a low capability. Seventy-eight (78) percent of municipalities reported their fiscal capability as low, while 16 percent rated their fiscal capability as moderate and 6 percent rated their fiscal capability as high. Recommendations : The factors used in the self-assessment of local capability should be used as a general guide to help craft mitigation actions that are achievable. When considering the effect of fiscal capability on the implementation of policies and projects, jurisdictions should ask several basic questions:
? Does the action require a monetary commitment or staff resources?
? Can jurisdictions combine resources with other counties or municipalities to address identified problems?
? Is the jurisdiction willing to commit local revenue on a sustained or one time basis? In order to implement mitigation projects and policies, some monetary commitment or staff resources will be required. This may take the form of a non-federal match requirement or the costs associated with staff time devoted to policy development and implementation. The identification of eligible Pre-Disaster Mitigation (PDM) projects, as well as other federal funding sources identified in the H-GAC Mitigation Plan, enables communities in the region to compete nationally for available funding. County and municipal governments should consider, whenever possible, combining financial and staff resources to address hazards, most of which tend to impact regions rather than individual jurisdictions. Finally, if local governments have access to an ongoing source of revenue, a more comprehensive and sustained effort can be achieved. Examples include the development of a stormwater management fee or the development of a budgetary line item that specifically addresses hazard mitigation.
Political Capability
One of the most difficult and sensitive capabilities to evaluate involves the political will of a jurisdiction to enact meaningful policies and projects. According to the results of the survey, the H-GAC region has a low to moderate political capability to enact meaningful and proactive mitigation policies. Sixty (60) percent of municipalities reported a low political capability. Of the 50 municipalities reporting, 34 percent expressed that they had a moderate political capability and 4 percent stated that their jurisdiction had a high political capability. Two of the seven counties reported a high political capability, and five reported that they had a low political capability. Recommendations : County and municipal government officials reported that while there is an interest in disaster mitigation activities, there appears to be a lack of local commitment to take the steps necessary to implement mitigation activities. Political support from elected officials can prove critically important. Past events, including Tropical Storm Allison in 2001, which devastated parts of the H-GAC planning area, should be used to better educate elected officials regarding the merits of mitigation planning. When possible, local governments who have implemented hazard mitigation projects should attempt to assess their effectiveness following future events. The ability to document mitigation projects and policies that work is a high priority among FEMA officials. Therefore, local government staff should work with Texas Division of Emergency Management and FEMA officials following disasters to evaluate past mitigation projects. The

C A P A B I L I T Y A S S E S S M E N T H O U S T O N - G A L V E S T O N A R E A C O U N C I L R E G I O N A L H A Z A R D M I T I G A T I O N P L A N
Section 5: Page 27
results should be presented to locally elected officials in order to provide real world examples of how mitigation can protect lives and property.
Previously Implemented Mitigation Measures
The success of future mitigation efforts can be gauged, in part, by past efforts. Previously implemented mitigation measures indicate that there has been a desire to reduce the effects of natural hazards. Past success of these projects can also be influential in building support for new mitigation efforts.
Hazard Mitigation Grant Program (HMGP) Projects
The Federal Emergency Management Agency’s Hazard Mitigation Grant Program (HMGP) provides competitive funding to states and local governments for the implementation of long-term hazard mitigation measures following a presidential disaster declaration. According to the Texas Division of Emergency Management, since 1991 there have been 24 HMGP and HPP-M projects completed in the region totaling $14,647,005. This number will increase substantially as HMGP projects associated with Tropical Storm Allison are completed. Completed projects, including a project description, award and completion date, subgrantee and budget are listed in Table 5.9. There have been no completed HMGP projects in Galveston County. Hurricane Local Grant Program and Hurricane Property Protection Mitigation Program Each year, the Texas Division of Emergency Management (DEM) awards grants to local jurisdictions in the coastal areas of Texas for projects relating to hurricane awareness and property protection mitigation against damage from hurricanes. Through the Hurricane Local Grant Program, approximately $10,000 in grants of $1,000 or less per jurisdiction are awarded for projects that enhance hurricane-related public awareness and education. Through the Hurricane Property Protection Mitigation Grant Program (HPP-M), Texas DEM distributes approximately $100,000 in grants of $20,000 or less per jurisdiction for projects designed to enhance hurricane-related property protection mitigation. The Local Grants have no match requirement, but the HPP-M requires a 50 percent cash match by the jurisdiction.
Table 5.9 Closed (Completed) HMGP and HPP-M Projects in the H-GAC Region
Note: The information listed below was provided by Texas Division of Emergency Management. No information on HMGP projects for Galveston County was provided.
Jurisdiction (County) Grant Number Project Description Amount Date
Awarded Date
Completed
Richwood (Brazoria)
DR-900-008 Drainage improvements $45,876 04/12/1991 09/30/1994
Angleton (Brazoria)
DR-900-001 Storm sewer system $153,162 04/12/1991 01/25/1994
Sweeny (Brazoria)
HPP-M-FY-2000-004 Replace overhead door of Fire Department to protect emergency response vehicles from hurricane force winds
$10,480 05/24/2000 07/07/2000

C A P A B I L I T Y A S S E S S M E N T H O U S T O N - G A L V E S T O N A R E A C O U N C I L R E G I O N A L H A Z A R D M I T I G A T I O N P L A N
Section 5: Page 28
Jurisdiction (County) Grant Number Project Description Amount Date
Awarded Date
Completed
Clute (Brazoria)
HPP-M-FY-2000-011 Construction of power switching unit on City Hall/Police Station
$14,650 06/17/1998 08/24/1998
Danbury (Brazoria)
HPP-M-FY-1997-017 Built structure to house generator and generator supplies
$8,890 12/18/1997 05/21/1998
Liberty (Liberty)
DR-930-011 Levee $464,042 12/26/1991 08/3/1995
Liberty County DR-1041-041 Acquisition/demolition of 54 properties
$1,301,429 10/18/1994 03/23/1998
Liberty Liberty)
HPP-M-FY-1999-013 Installation of storm doors for fire station
$20,000 02/05/1999 09/14/1999
Montgomery County
DR-1041-031 Acquisition/demolition of 272 properties
$13,996,449 10/18/1994 05/16/2001
Jamaica Beach (Galveston)
HPP-M-FY-2002-002 Installation of hurricane shutters on City Hall located at San Luis Pass Road
$859 05/03/2002 10/16/2001
Galveston County HPP-M-FY-2002-001 Installation of 18 hurricane shutters on the Crystal Beach Annex Sheriff’s Department
$25,243 05/03/2002 08/31/2002
Galveston County HPP-M-FY-2001-007 Installation of hurricane shutters on the County Courthouse – Final phase
$26,978 07/11/2001 08/31/2001
Galveston County HPP-M-FY-2001-003 Installation of hurricane shutters on the County Courthouse – phased project
$36,898 02/12/2001 05/16/2001
Clear Lake Shores (Galveston)
HPP-M-FY-2000-002 Retrofit shutters and reinforcement walls on City Hall, Police Station, Municipal Court and EOC
$28,620 05/24/2000 08/30/2000
Galveston County HPP-M-FY-2000-005 Installation of hurricane shutter on the County Courthouse – phased project
$36,324 05/24/2000 09/05/2000
La Marque (Galveston)
HPP-M-FY-1999-022 Installation of hurricane shutters and purchase of a fire-insulated file cabinet
$22,482 02/05/1999 08/10/1999
Galveston County HPP-M-FY-1998-005 Installation of hurricane shutters on the County Courthouse – phased project
$38,947 06/17/1998 09/30/1998
Hitchcock (Galveston)
HPP-M-FY-1998-004 Construction of new roof and installation of roll-up shutters on Police Station
$8,672 06/17/1998 08/15/1998
Galveston County HPP-M-FY-1997-014 Installation of hurricane shutters on the County Courthouse – phased project
$10,000 12/18/1997 04/22/1998
C A P A B I L I T Y A S S E S S M E N T H O U S T O N - G A L V E S T O N A R E A C O U N C I L R E G I O N A L H A Z A R D M I T I G A T I O N P L A N
Section 5: Page 29
Public Assistance (PA) Program Projects
FEMA's Public Assistance (PA) grant program is available to states, local governments and eligible non-profit organizations following a presidentially-declared disaster. Grants focus on emergency measures such as debris removal, costs associated with operational response, and the repair and reconstruction of damaged infrastructure. Over 570 PA projects have been implemented in the H-GAC planning area. This listing is too extensive to include in this plan. To obtain the complete listing of PA projects as supplied by the Texas Division of Emergency Management, contact the H-GAC offices.
Corps of Engineers Studies, Plans and Projects
The United States Army Corps of Engineers (USACE) provide a variety of hazard mitigation services. Examples include developing plans, studies and projects related to the reduction or elimination of long-term risk to human life and property. While a number of USACE projects have been completed in the H-GAC planning area, only a few are directly related to mitigation. Those projects not related to mitigation have not been included in this list.
Table 5.10 Mitigation-related USACE Studies, Plans and Projects in the H-GAC Region
Project Name Project Sponsors Description
Clear Creek Texas Flood Control Project
Brazoria, Galveston, Harris, Harris County Flood Control
Flood control project under development to provide flood damage reduction along Clear Creek
Freeport Hurricane Protection Levee, Texas
The project consists of a system of levees and pumping stations that protect approximately 42 square miles from storm surge inundation due to hurricanes and tropical storms – under development
Wallisville Lake Chambers-Liberty Counties Navigation District, City of Houston, Trinity River Authority
3,800 acre reservoir created to ease flooding problems and enhance recreational opportunities
Sabine Pass and Galveston Bay
Galveston and Jefferson Counties
Beach erosion project
Texas Water Development Board Studies, Plans and Projects – Flood Mitigation Assistance Program
In the State of Texas, the Texas Water Development Board (TWDB) administers the FEMA Flood Mitigation Assistance (FMA) program. The FMA program provi des funding for projects and plans that are aimed at reducing the number of insured properties that have incurred repetitive flood losses. The TWDB also provides state Flood Protection Planning Grants to communities to support regional flood protection planning efforts. Eligible activities under Flood Protection Planning include studies and analyses to identify problems resulting from or relating to flooding, and identify potential solutions.

C A P A B I L I T Y A S S E S S M E N T H O U S T O N - G A L V E S T O N A R E A C O U N C I L R E G I O N A L H A Z A R D M I T I G A T I O N P L A N
Section 5: Page 30
Table 5.11 FMA Grantees in the H-GAC Region
Jurisdiction Grant Type Year Amount
Liberty County FMA Planning Grant 1998 $46,875 Oak Ridge North FMA Planning Grant 1999 $35,000 Galveston County FMA Planning Grant 2000 $46,875 Huntsville FMA Planning Grant 2001 $50,000

C A P A B I L I T Y A S S E S S M E N T H O U S T O N - G A L V E S T O N A R E A C O U N C I L R E G I O N A L H A Z A R D M I T I G A T I O N P L A N
Section 5: Page 31
Table 5.12 TWDB Flood Protection Planning Grants in the H-GAC Region
Contract Number Contractor Name Description Amount Fiscal Year
Commitment
99483318 Brazoria County Flood Protection Study for Brazoria County
$300,000 1999
94483026 Galveston County Dickinson Bayou Watershed/Phase III $125,000 1994
93483350 Galveston County Dickinson Bayou Watershed/Phase II $150,000 1993 91483581 Galveston County Dickinson Bayou Watershed $100,000 1991
90483771 Galveston County Galveston County $100,000 1990 9483726 Galveston County
Drainage District Cloud Bayou in Southeast Galveston County
$15,000 1989
8483631 Montgomery County Southern Montgomery County $74,994 1988 8483519 Brazoria County
C&RD No. 3 Brazoria County Conservation and Reclamation District No. 3
$176,335 1987
5541017 Brazoria County Drainage District #4
Brazoria County Drainage District #4, Brazoria County
$60,000 1984
Pre-Disaster Mitigation Program; Property Protection – Mitigation Program
The Pre-Disaster Mitigation (PDM) program is designed to provide states and communities with funding to implement cost-effective hazard mitigation activities. Eligible activities may include the acquisition or elevation of flood-prone properties, retrofitting structures, education and outreach efforts, and mitigation planning.19
Master Drainage and Stormwater Management Plans in the H-GAC Region
The following communities indicated in their local Capability Assessment Surveys that they have a Master Drainage and/ or Stormwater Management Plan. More detailed information regarding the effectiveness of these plans can be found in the individual surveys.20
19 Pre -Disaster Mitigation funding was provided to H-GAC by FEMA and Texas DEM in order to develop this Plan. 20 A copy of individual local Capability Assessment Surveys can be obtained by contacting H-GAC staff.
C A P A B I L I T Y A S S E S S M E N T H O U S T O N - G A L V E S T O N A R E A C O U N C I L R E G I O N A L H A Z A R D M I T I G A T I O N P L A N
Section 5: Page 32
Table 5.13 Master Drainage and Stormwater Management Plans in the H-GAC Region
Name of Community
Bellville Montgomery Brookside Village Montgomery County Conroe Oak Ridge North Dayton Panorama Village Kemah Roman Forest La Marque Shenandoah Lake Jackson Tiki Island Liberty County Willis
Comprehensive Plans in the H-GAC Region
The following communities indicated in their Local Capability Assessment surveys that they maintain a Comprehensive Plan. More information regarding the effectiveness of these plans can be found in local surveys.
Table 5.14 Comprehensive Plans in the H-GAC Region
Name of Community
Alvin Iowa Colony Montgomery Shenandoah Brazoria (City) La Marque Oak Ridge North Surfside Beach Brookside Village Lake Jackson Richwood Willis Dayton Huntsville
H-GAC and Project Impact The H-GAC region was designated a Project Impact community by FEMA in 1998. Project Impact was created by FEMA in an attempt to reduce future disaster losses through the widespread use of hazard mitigation prior to the onset of a disaster. Key objectives of the initiative included: identifying hazards and assessing their potential impact on communities, and educating local government officials, citizens and members of the business community about the adoption of hazard mitigation measures. Most Project Impact communities received federal “seed” money to establish program objectives and implement hazard mitigation projects. Specific projects funded in the H-GAC region included:
? Harris County Buyout Program ? Bellaire Local Drainage Project ? City of Webster Flood Risk Analysis ? City of Webster Municipal Buildings: Hurricane Preparedness ? Equipping Schools with Scanners and NOAA Weather Radios ? Public Education: Hurricane Preparedness Booklet

C A P A B I L I T Y A S S E S S M E N T H O U S T O N - G A L V E S T O N A R E A C O U N C I L R E G I O N A L H A Z A R D M I T I G A T I O N P L A N
Section 5: Page 33
Conclusions on Local Capability The capability of local governments in the Houston-Galveston Bay Area varies greatly from jurisdiction to jurisdiction. Generally speaking, county-level governments scored higher than municipalities. Of the 57 respondents, five of the counties scored in the top 15 jurisdictions in the region. However, much of this variation can be accounted for when assessing the size of each jurisdiction. Larger cities tended to score higher, while smaller, more rural communities reported more limited capability. Additional factors to consider include the physical location and wealth of participating municipalities. Several smaller suburban jurisdictions scored high on the capability assessment. It is not clear whether this is due to the level of resources at their disposal or their proximity to larger urban areas, where public expectations regarding governmental services tend to be higher than in rural areas. Perhaps one of the most significant survey findings was the widespread existence of several planning programs and tools already in use across the H-GAC area. However, many of the processes and tools do not incorporate hazard mitigation practices. For example, planning is widely applied to response-related activities via the use of Emergency Operations Plans, Continuity of Operations Plans, Radiological Emergency Plans and SARA Title III planning. As a result, counties and local governments are familiar with the concept of planning and it has been institutionalized across the region. Therefore, an important regional consideration in this Plan should be to work with counties and municipalities to apply this planning experience to hazard mitigation and, likewise apply hazard mitigation to planning activities already taking place. The H-GAC Regional Hazard Mitigation Plan provides the vehicle to begin this process. However, in order to succeed, it will require clearly articulating the benefits of participating in and sustaining the mitigation planning process. One of the best ways to obtain local buy-in and long-term success is to identify and implement achievable mitigation actions.
Linking the Capability Assessment, the Risk Assessment, and the Mitigation Strategy
The conclusions of the Capability Assessment and Risk Assessment serve as the foundation for a meaningful hazard mitigation strategy. During the process of identifying the goals and mitigation actions, each jurisdiction must consider not only their level of hazard risk but also their existing capability to minimize or eliminate that risk.
In jurisdictions where the overall hazard risk is considered to be HIGH, and local capability is considered LIMITED, then specific mitigation actions that account for these conditions should be considered. This may include less costly actions such as minor ordinance revisions or public awareness activities. If necessary, specific capabilities may need to be improved in order to better address recurring threats. Similarly, in cases where the hazard vulnerability is LOW and overall capability is HIGH, more emphasis can be placed on actions that may impact future vulnerability such as guiding development away from known hazard areas.