Embed Size (px)
Citation preview
Section 5.2-1Copyright © 2014, 2012, 2010 Pearson Education, Inc.
Lecture Slides
Elementary Statistics Twelfth Edition
and the Triola Statistics Series
by Mario F. Triola

Section 5.2-2Copyright © 2014, 2012, 2010 Pearson Education, Inc.
Chapter 5Probability Distributions
5-1 Review and Preview
5-2 Probability Distributions
5-3 Binomial Probability Distributions
5-4 Parameters for Binomial Distributions
5-5 Poisson Probability Distributions
Section 5.2-3Copyright © 2014, 2012, 2010 Pearson Education, Inc.
Key Concept
This section introduces the important concept of a probability distribution, which gives the probability for each value of a variable that is determined by chance.
Give consideration to distinguishing between outcomes that are likely to occur by chance and outcomes that are “unusual” in the sense they are not likely to occur by chance.
Section 5.2-4Copyright © 2014, 2012, 2010 Pearson Education, Inc.
Random VariableProbability Distribution
Random Variablea variable (typically represented by x) that has a single numerical value, determined by chance, for each outcome of a procedure
Probability Distributiona description that gives the probability for each value of the random variable, often expressed in the format of a graph, table, or formula
Section 5.2-5Copyright © 2014, 2012, 2010 Pearson Education, Inc.
Discrete and Continuous Random Variables
Discrete Random Variableeither a finite number of values or countable number of values, where “countable” refers to the fact that there might be infinitely many values, but that they result from a counting process
Continuous Random Variablehas infinitely many values, and those values can be associated with measurements on a continuous scale without gaps or interruptions.
Section 5.2-6Copyright © 2014, 2012, 2010 Pearson Education, Inc.
Probability Distribution: Requirements
1. There is a numerical random variable x and its values are associated with corresponding probabilities.
2. The sum of all probabilities must be 1.
3. Each probability value must be between 0 and 1 inclusive.
1P x
0 1P x
Section 5.2-7Copyright © 2014, 2012, 2010 Pearson Education, Inc.
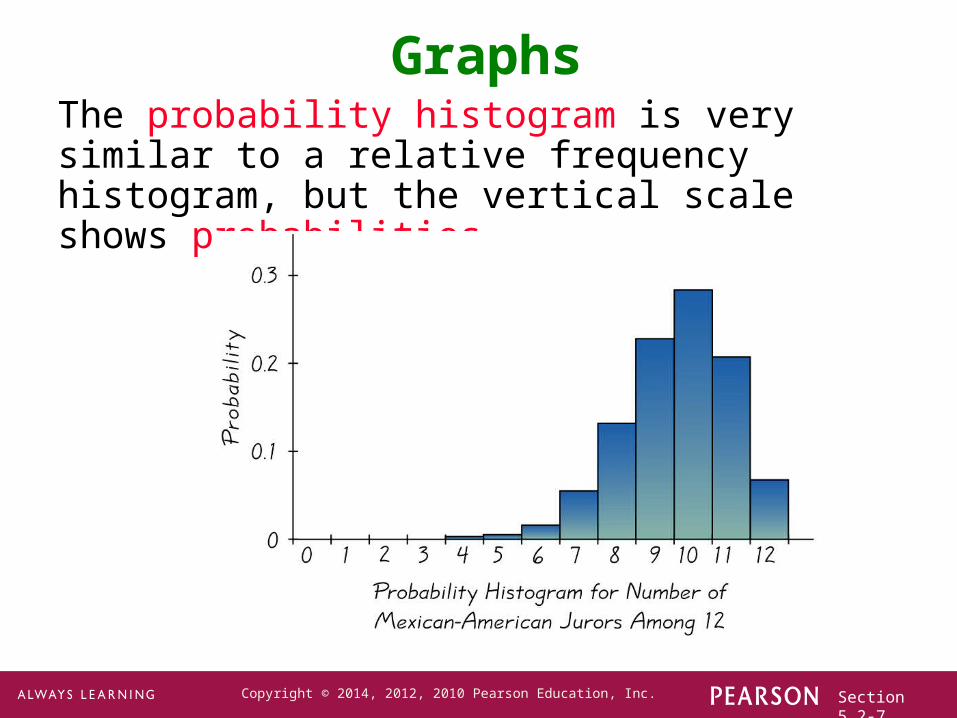
GraphsThe probability histogram is very similar to a relative frequency histogram, but the vertical scale shows probabilities.
Section 5.2-8Copyright © 2014, 2012, 2010 Pearson Education, Inc.
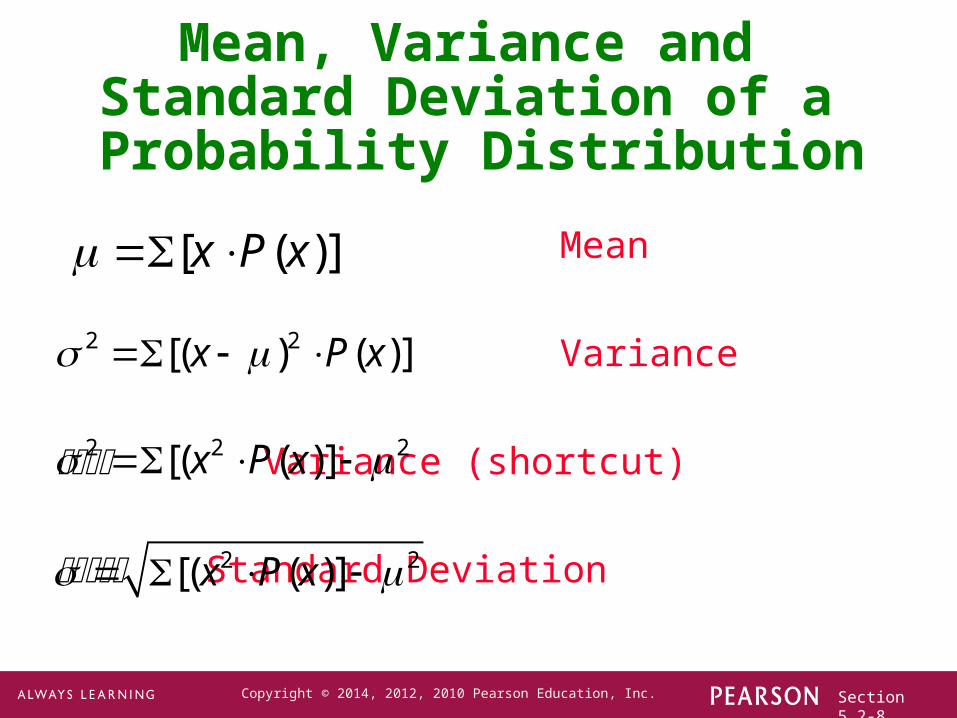
Mean
Variance
Variance (shortcut)
Standard Deviation
[ ( )]x P x
Mean, Variance and Standard Deviation of a Probability Distribution
2 2[( ) ( )]x P x
2 2 2[( ( )]x P x
2 2[( ( )]x P x
Section 5.2-9Copyright © 2014, 2012, 2010 Pearson Education, Inc.
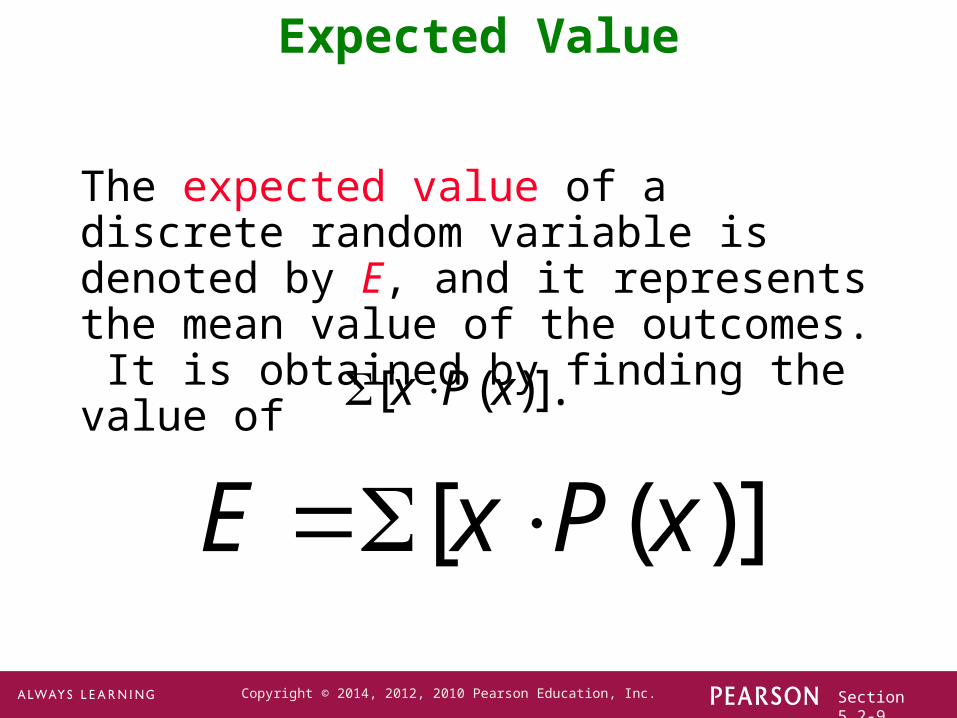
The expected value of a discrete random variable is denoted by E, and it represents the mean value of the outcomes. It is obtained by finding the value of
Expected Value
[ ( )].x P x
[ ( )]E x P x
Section 5.2-10Copyright © 2014, 2012, 2010 Pearson Education, Inc.
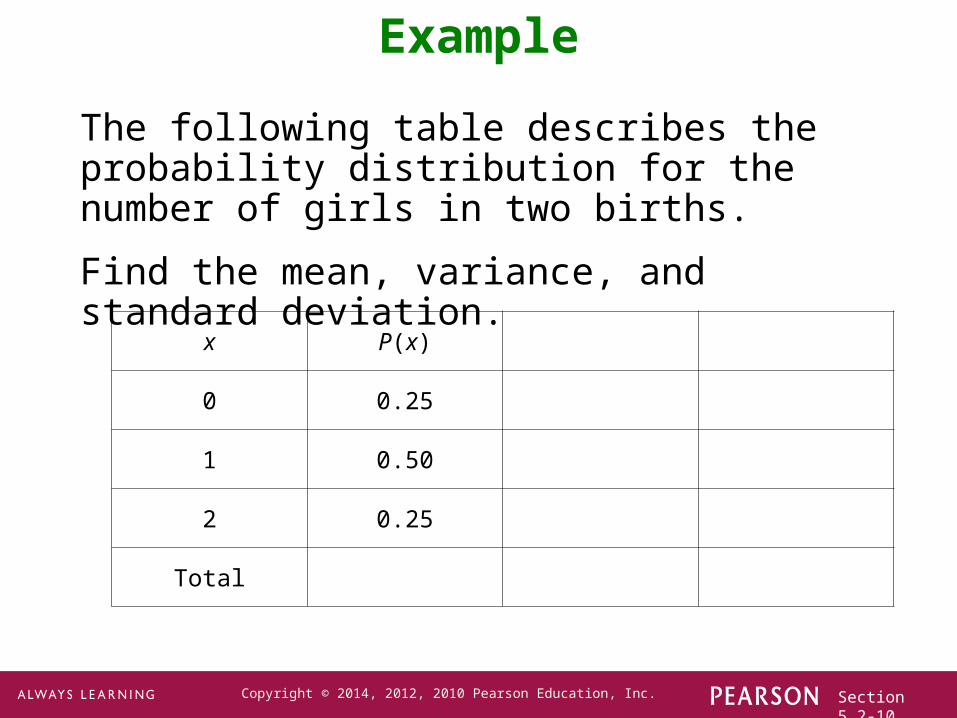
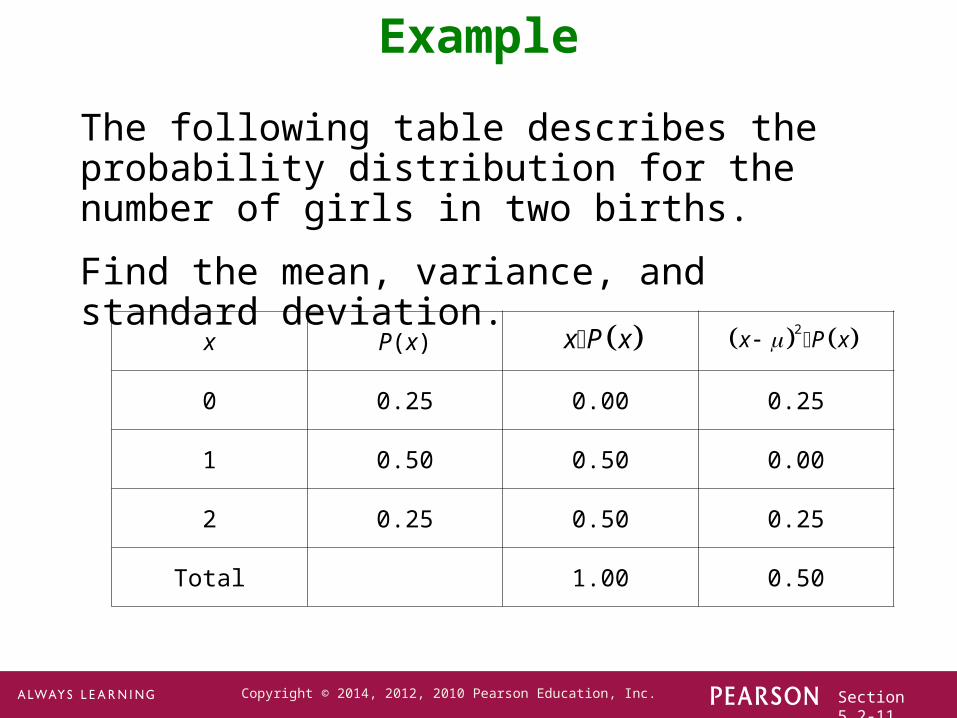
The following table describes the probability distribution for the number of girls in two births.
Find the mean, variance, and standard deviation.
Example
x P(x)
0 0.25
1 0.50
2 0.25
Total
Section 5.2-11Copyright © 2014, 2012, 2010 Pearson Education, Inc.
The following table describes the probability distribution for the number of girls in two births.
Find the mean, variance, and standard deviation.
Example
x P(x)
0 0.25 0.00 0.25
1 0.50 0.50 0.00
2 0.25 0.50 0.25
Total 1.00 0.50
x P x 2x P x
Section 5.2-12Copyright © 2014, 2012, 2010 Pearson Education, Inc.
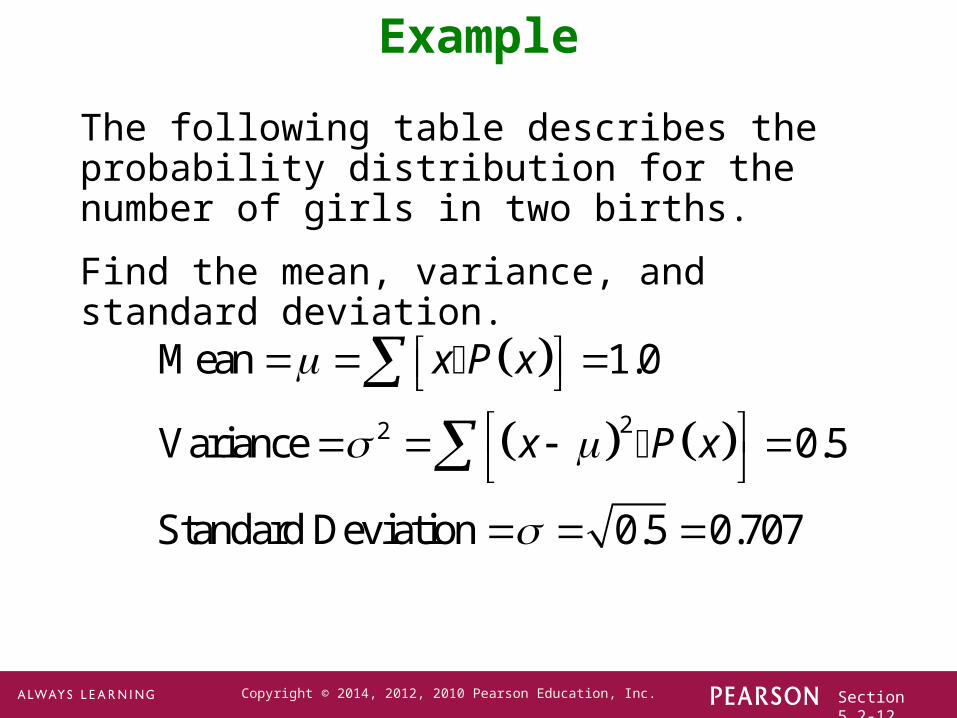
The following table describes the probability distribution for the number of girls in two births.
Find the mean, variance, and standard deviation.
Example
22
Mean 1.0
Variance 0.5
Standard Deviation 0.5 0.707
x P x
x P x
Section 5.2-13Copyright © 2014, 2012, 2010 Pearson Education, Inc.
Identifying Unusual ResultsRange Rule of Thumb
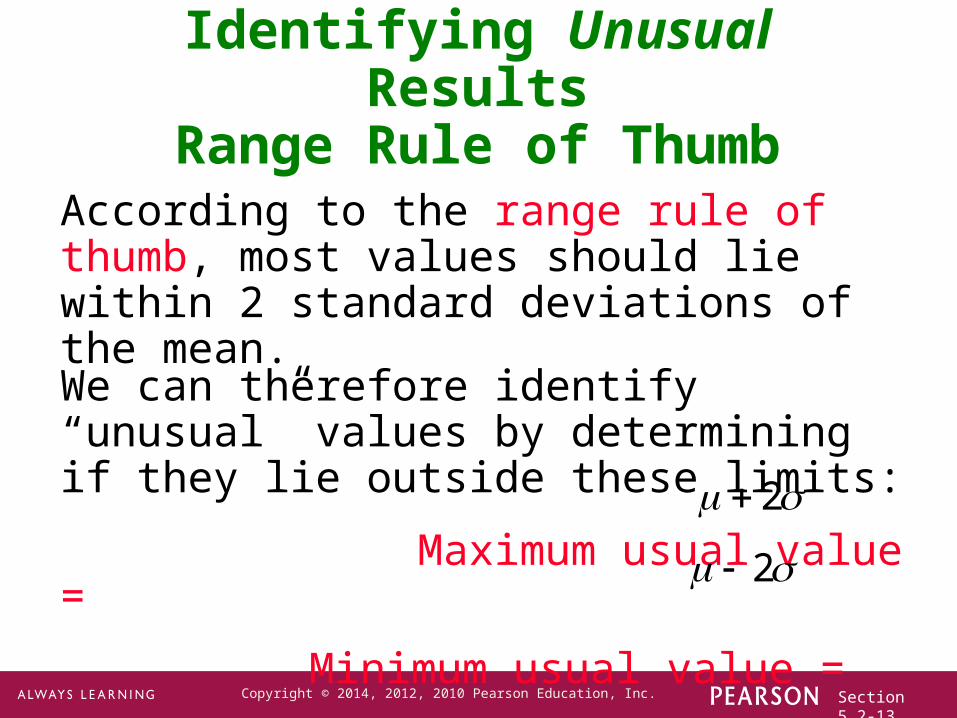
According to the range rule of thumb, most values should lie within 2 standard deviations of the mean.
We can therefore identify “unusual” values by determining if they lie outside these limits:
Maximum usual value =
Minimum usual value =
2
2
Section 5.2-14Copyright © 2014, 2012, 2010 Pearson Education, Inc.
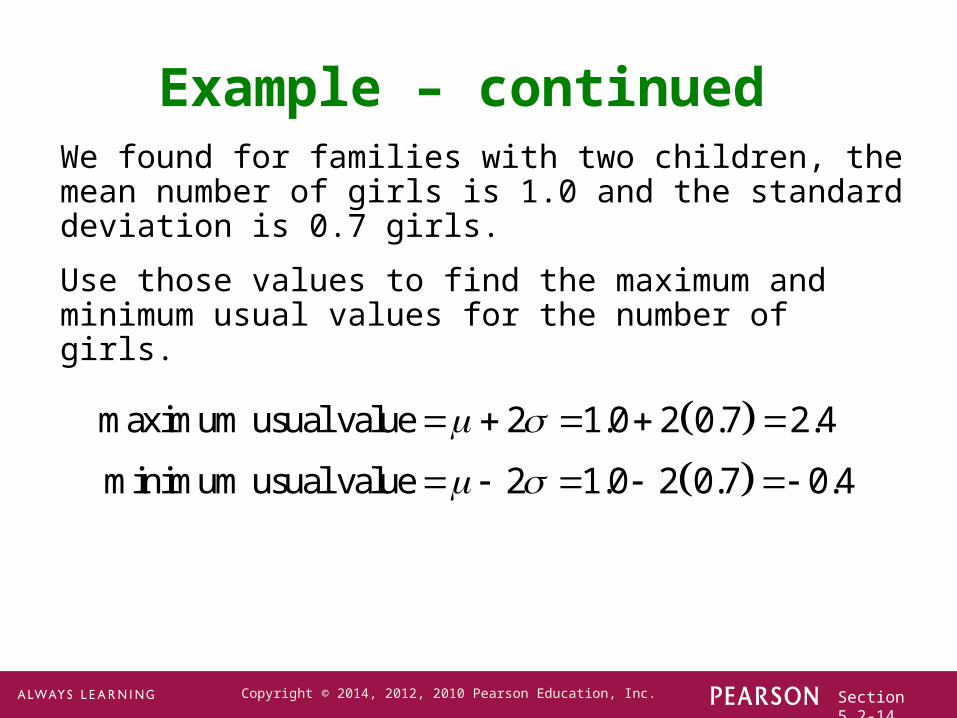
Example – continued We found for families with two children, the mean number of girls is 1.0 and the standard deviation is 0.7 girls.
Use those values to find the maximum and minimum usual values for the number of girls.
maximum usual value 2 1.0 2 0.7 2.4
minimum usual value 2 1.0 2 0.7 0.4
Section 5.2-15Copyright © 2014, 2012, 2010 Pearson Education, Inc.
Identifying Unusual ResultsProbabilities
Rare Event Rule for Inferential Statistics
If, under a given assumption (such as the assumption that a coin is fair), the probability of a particular observed event (such as 992 heads in 1000 tosses of a coin) is extremely small, we conclude that the assumption is probably not correct.
Section 5.2-16Copyright © 2014, 2012, 2010 Pearson Education, Inc.
Identifying Unusual ResultsProbabilities
Using Probabilities to Determine When Results Are Unusual
Unusually high: x successes among n trials is an unusually high number of successes if .
Unusually low: x successes among n trials is an unusually low number of successes if .
( or more) 0.05P x
( or fewer) 0.05P x