Embed Size (px)
Citation preview

Section 9302
Oil Response in Fast
Water Currents: A
Decision Tool

OIL RESPONSE IN FAST WATER CURRENTS: A DECISION TOOL
UU..SS.. CCOOAASSTT GGUUAARRDDRREESSEEAARRCCHH AANNDD DDEEVVEELLOOPPMMEENNTT CCEENNTTEERR
GGRROOTTOONN,, CCTT 0066334400--66004488
December 2002

N O T I C E
This document is disseminated under the sponsorship of the Department of Transportation in the interest of information exchange. The United States Government assumes no liability for its contents or use thereof.
The United States Government does not endorse products or manufacturers. Trade or manufacturers’ names appear herein solely because they are considered essential to the object of this report.
This report does not constitute a standard, specification, or regulation.
Marc B. Mandler, Ph.D. Technical Director
United States Coast Guard Research & Development Center 1082 Shennecossett Road Groton, CT 06340-6048

U.S. Coast Guard Research and Development Center 1082 Shennecossett Road, Groton, CT 06340-6048
Report No. CG-D-03-03
Oil Response in Fast Water Currents: A Decision Tool
December 2002
This document is available to the U.S. public through the National Technical Information Service, Springfield, VA 22161
Prepared for:
U.S. Department of Transportation United States Coast Guard
Marine Safety and Environmental Protection (G-M) Washington, DC 20593-0001

Technical Report Documentation Page 1. Report No.
CG-D-03-03 2. Government AccessionNumber
3. Recipient’s Catalog No.
5. Report DateDecember 2002
4. Title and Subtitle
OIL RESPONSE IN FAST WATER CURRENTS: A DECISION TOOL
6. Performing Organization Code
Project No. 4120.12
7. Author(s)
Kurt Hansen, Peter Tebeau 8. Performing Organization Report No.
R&DC 572
10. Work Unit No. (TRAIS)9. Performing OrganizationName and Address U.S. Coast Guard Research and Development Center 1082 Shennecossett Road Groton, CT 06340-6048
Potomac Management Group 510 King Street Alexandria, VA 22314
11. Contract or Grant No.
13. Type of Report & Period Covered
Final Report 12. Sponsoring Organization Name and Address
U.S. Department of Transportation United States Coast Guard Marine Safety and Environmental Protection (G-M)Washington, DC 20593-0001
14. Sponsoring Agency Code
Commandant (G-MOR) U.S. Coast Guard Headquarters Washington, DC 20593-0001
15. Supplementary Notes
The R&D Center’s technical point of contact is Kurt Hansen, 860-441-2865, email: [email protected].
16. Abstract (MAXIMUM 200 WORDS)
This decision tool is a companion manual for the report, “Oil Response in Fast Currents, A Field Guide” (Report CG-D-01-02). This booklet provides tables, pictures and figures, mostly from out of the guide, that can be used to make decisions in the field or command post. Users should refer to the guide for additional details concerning decision methods, techniques and equipment.
17. Key Words
fast water response, oil spill response, decision tool 18. Distribution StatementThis document is available to the U.S. public through the National Technical Information Service, Springfield, VA 22161
19. Security Class (This Report)
UNCLASSIFIED 20. Security (This page)
UNCLASSIFIED 21. No. of Pages
28 22. Price
Form DOT F 1700.7 (8/72) Reproduction of form and completed page is authorized
ADA415830
iv

OVERVIEW OF THE OIL SPILL RESPONSE: FAST WATER DECISION TOOL
Purpose This document provides oil spill response personnel with a job aid for organizing and implementing oil spill containment and cleanup measures in a fast water environment. Fast water refers to any situation where river, harbor or estuary surface current velocities are expected to exceed one knot. Experience and research have shown that special strategies and tactics are warranted in channeling, containing and recovering spilled oil, and safety should be a main concern.
This decision tool is a companion document to the more comprehensive report, “Oil Spill Response in Fast Currents, a Field Guide,” published by the Coast Guard R&D Center in 2002, which is available from the National Technical Information Service in Springfield, VA. This decision tool assumes that the user will have read and understood the material contained in the parent Field Guide. This tool has been limited to essential graphics and tables to refresh the responder’s memory, allow him/her to quickly assess the situation and formulate an action plan, and communicate this plan to other personnel.
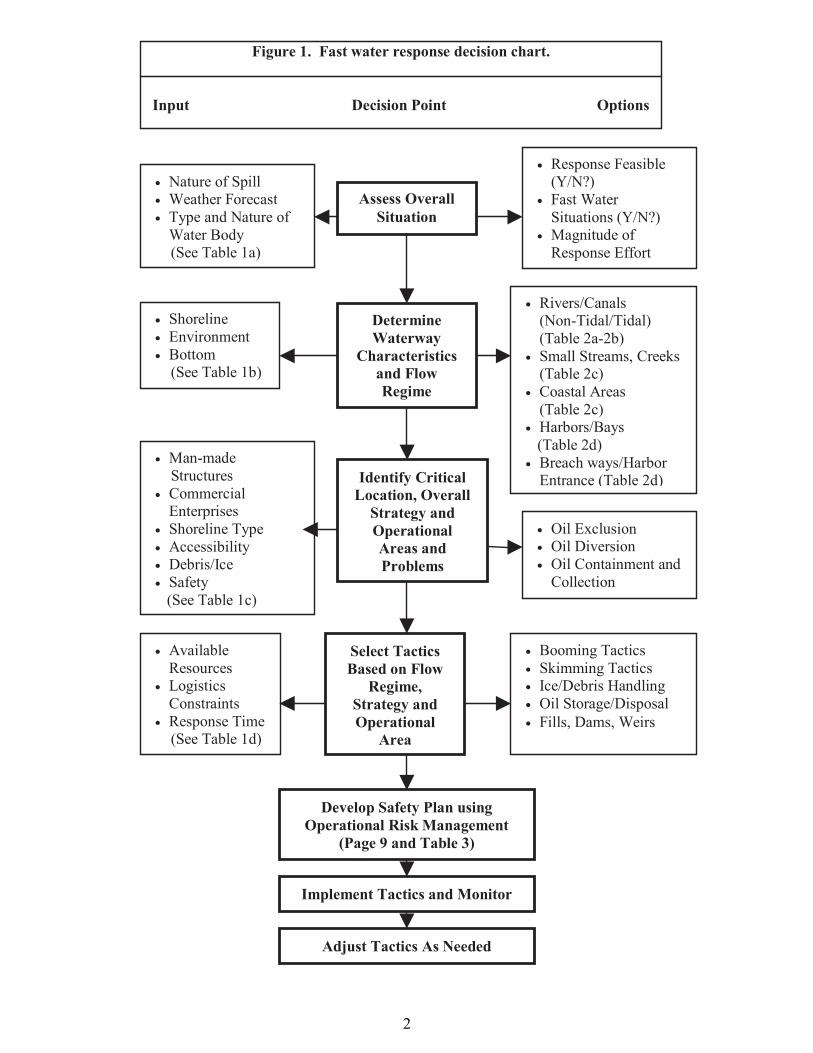
Organization The decision tool is organized to provide information for developing fast water response strategies. This process is depicted in the decision flow diagram in Figure 1. For each step in the process, the necessary input information and options are specified. Tables and figures provide the primary options open to the responder, and graphically depict various boom and skimmer tactics for oil exclusion, diversion and recovery. In addition, a set of easy to use graphics and tables is provided to allow the responder to compute key deployment parameters such as boom length, deflection angles, mooring line tension and the number of anchors required.
Relation to Other Spill Response Documents and ResourcesIn addition to familiarity with the Field Guide, responders should be familiar with the basic National Interagency Incident Management System/Incident Command System (NIIMS/ICS) spill response doctrine as outlined in the USCG Incident Management Handbook. The Area Contingency Plan should also be available and consulted for information on sensitive resource locations and environmental data such as anticipated current velocities, oil behavior and natural collection points. The responder should also consult with the NOAA Scientific Support Coordinator (SSC), local First Responders, as well as harbormasters and local mariners to gather information to verify the viability of the strategy and tactics arrived at using this decision tool.
1
Assess Overall Situation
Determine Waterway
Characteristics and Flow Regime
• Shoreline• Environment• Bottom
(See Table 1b)
Identify Critical Location, Overall
Strategy and Operational Areas and Problems
• Man-madeStructures
• CommercialEnterprises
• Shoreline Type• Accessibility• Debris/Ice• Safety
(See Table 1c)
Select Tactics Based on Flow
Regime, Strategy and Operational
Area
• Nature of Spill• Weather Forecast• Type and Nature of
Water Body(See Table 1a)
Implement Tactics and Monitor
Adjust Tactics As Needed
• AvailableResources
• LogisticsConstraints
• Response Time(See Table 1d)
• Response Feasible(Y/N?)
• Fast WaterSituations (Y/N?)
• Magnitude ofResponse Effort
• Rivers/Canals(Non-Tidal/Tidal)(Table 2a-2b)
• Small Streams, Creeks (Table 2c)
• Coastal Areas(Table 2c)
• Harbors/Bays(Table 2d)
• Breach ways/HarborEntrance (Table 2d)
• Oil Exclusion• Oil Diversion• Oil Containment and
Collection
• Booming Tactics• Skimming Tactics• Ice/Debris Handling• Oil Storage/Disposal• Fills, Dams, Weirs
Develop Safety Plan using Operational Risk Management
(Page 9 and Table 3)
Figure 1. Fast water response decision chart.
Input Decision Point Options
2
Table 1a. Assess overall situation.
Selection Factor
Related Sub-Factors Info Sources
Nature of the spill
• Amount and type of oil• Time and place of oil impact (ETA)• Weathering/emulsion issues• History of spills
• PolReps• Area
Contingency Plan• NOAA SSC
Weather forecast
• Wind affects oil drift and sea state• Rain affects currents in rivers and
coastal areas• Temperature, oil evaporation rate and
people endurance• Visibility
• On-Scene Observations
• Local forecasts• Marine forecasts• NOAA SSC
Type and Nature of Water body
• River, lake, swamp, inlet, bay, ocean,etc.
• Presence of debris or ice• Navigable or not, traffic type & density
• NOAA Charts• Local
Responders
Table 1b. Determine waterway characteristics and flow regime.
Selection Factor
Related Sub-Factors Info Sources
Shoreline • River (winding, width, etc.), estuary,strait, headland, harbor, inlet, island, etc.
• Natural collection points• Sensitive areas
• AreaContingencyPlan
• NOAA Charts/ESI Maps
Environment • Current speed and direction• Tidal action: height, cycle time,
reversing currents, slack water, etc.• Waves: height, wave direction, period,
breaking or non-breaking, etc.
• On-SceneObservations
• Real-timeMeasurements
• NOAA SSCBottom • Water depth and contours
• Bottom type (relating to habitat damageand anchoring potential)
• NOAA HydroCharts
• ESI Maps
3

Table 1c. Identify critical location, strategy, and operational areas and problems.
Selection Factor
Related Sub-Factors Info Sources
Man-made structures andcommercial enterprises
• Piers, breakwaters, bulkheads, bridges,etc.
• Water intakes (drinking water,desalination, etc.)
• Floating houses, casinos, commercialand recreational traffic
• Commercial logs, fish hatcheries, etc.• High volume water traffic
• NOAA HydroCharts
• Local harbormaster• Port authority• Area Contingency
Plan
Shoreline type
• Salt marshes and mangroves, shelteredtidal flats, sheltered rocky coasts,exposed tidal flats and vegetation, gravelbeaches, beaches
• Other threatened or historical areas
• Area ContingencyPlan
• NOAA SSC• ESI Maps
Accessibility • Land accesses (bridges, roads, shoreline grade, shoreline vegetation, etc.) • Water access (boat ramps, marinas, fuel,
boat draft, specialty vehicles such as jetboats, air cushion vehicles, airboats, etc.
• Air accesses (airports and areas forhelicopters)
• Approval may be needed
• NOAA HydroCharts
• Local harbormaster• Port authority• Area Contingency
Plan
Debris/Ice • Collection and disposal procedures• Natural Collection Points
• First Responders• Area Cont. Plan
Safety • Personnel Safety• Site specific issues such as accidental
ignition sources
• First Responders• Area Contingency
Plan
Table 1d. Select tactics based on flow regime, strategy and operational area.
Selection Factor
Related Sub-Factors Info Sources
Available resources/ Logistics (Response Time to Plan and Deploy)
• Response organizations: On SceneCoordinator (OSC), Responsible Party (RP),Oil Spill Response Organization (OSRO),etc.
• Estimated Time of Deployment (ETD)• Response equipment, locations and
availability (effectiveness in the fast-waterconditions)
• Boats (HP for speed & towing in currents)• Response personnel, their training, location
& availability (experience in swift currents)• Logistics support network & equipment• Repair and Maintenance facilities• Communications
• USCGIncidentManagementHandbook
• AreaContingencyPlan
• Vessel/FacilityResponsePlan
• Local OSRO
4

Table 2a. Fast current scenarios and tactics in rivers/canal (non-tidal).
Scenario Amplifying Information
Tactics
Rivers/Canal (Non-Tidal): Depth is greater than typical boom skirt depth. May have tidal influence, but current always goes in same direction
Current speed dependent Vessel traffic dependent
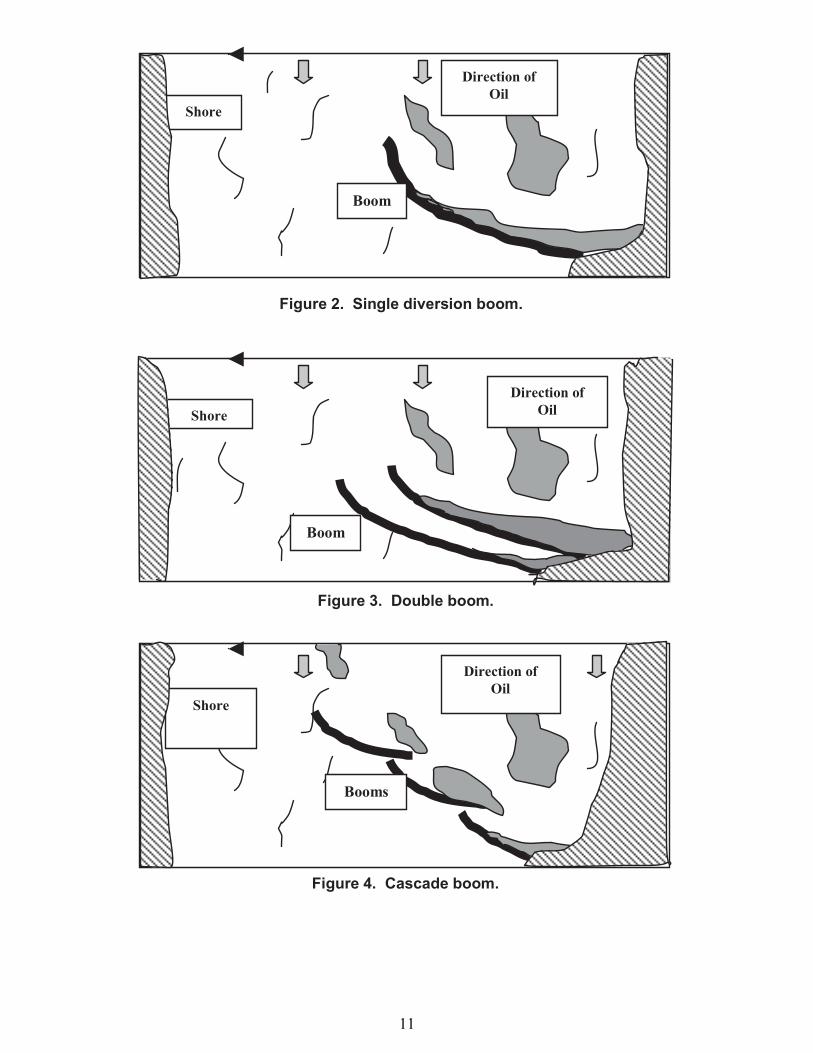
• Single Diversion Boom(Figure 2)
• Current < 2 knots useboom skirt of 12 inches
• Current > 2 knots useboom skirt 6 inches orless
Currents > 2 knots • Cascading Diversion Boom (Figure 4)
• Use short skirts, shortboom lengths andsufficient overlap
Collection areas available on both sides
• Chevron Booms(Figures 6-7)
• Open for vessel traffic• Closed if no traffic
Currents < 2 knots and river is wide
• Single Diversion Boom• Exclusion Boom for
Sensitive Areas(Figure 5)
• Encircle & Divert toCollection Area
Sufficient room to maneuver
Skimmers for Collection (Figures 10-11)
Vessels not available
Boom Vane or Flow Diverters (Figure 9)
Special Conditions Air and Water Jets Isolated Areas Sorbents and Pom-Poms
5

Table 2b. Fast current scenarios and tactics in rivers/canals-(tidal).
Scenario Amplifying Information
Tactics
Depth is greater than typical boom skirt depth Current reverses direction
Current speed dependent Vessel traffic dependent Special methods needed to compensate for tides
• Diversion Boom – needdouble set (Figure 2)
• Current < 2 knots useboom skirt of 12 inches
• Current > 2 knots useboom skirt 6 inches orless
Currents > 2 knots • Cascade Boom - may need double set
(Figure 4) • Use short skirts, short
boom lengths andsufficient overlap
Collection areas available on both sides
• Chevron - may needdouble set (Figures 6-7)
• Open for vessel traffic• Closed if no traffic
Currents < 2 knots and river is wide
Encircling
Isolated Areas Sorbents and Pom-Poms Sufficient room to maneuver
Skimmers (Figures 10-11)
Vessels not available
Boom Vane or Flow Diverters (Figure 9)
Special Conditions Air and Water Jets Isolated Areas Sorbents and Pom-Poms
6

Table 2c. Fast current scenarios and tactics in small streams and coastal areas.
Scenario Amplifying Information
Tactics
Small streams, creeks, culverts: Depth is less than boom skirt depth
Dependent upon flow rate
��Single Diversion for volume flow greater than about 10 cubic feet/second (Figure 2)
Block for low volume flow
• Sealing• Fill• Dams (Figures 12-13)• Weirs
Design for volume ��Overflow/Underflow damsLow Flow ��Sorbents and Pom-Poms
Coastal Areas: Near shore wave dependent Includes near shore and straits Various depths Usually tidal
��Single Diversion Boom Current < 2 knots use boom skirt of 12 inches if no waves
Currents > 2 knots • Cascade Boom (Figure 4) • Use short boom lengths and
sufficient overlapCurrents < 2 knots and river is wide
�� Encircling
Sufficient room to maneuver
�� Skimmers (Figures 10-11)
�� VOSS/SORS
Isolated Areas �� Sorbents and Pom Poms
7

Table 2d. Fast current scenarios and tactics in harbors/bays and harbor entrances.
Scenario Amplifying Information
Tactics
Harbors/Bays: Near shore wave dependent Depth is usually greater than typical boom skirt depth
Use river techniques in specific areas Current speed dependent Vessel traffic dependent
• Single Diversion Boom(Figure 2)
• Current < 2 knots use boomskirt of 12 inches if nowaves
• Current > 2 knots use boomskirt 6 inches or less if nowaves
Currents > 2 knots • Cascade Boom (Figure 4)• Use short skirts, short boom
lengths and sufficientoverlap
Currents < 2 knots and area is large
��Encircling
Sufficient room to maneuver
��Skimmers (Figures 10-11)
Special Conditions ��Air and Water Jets Isolated Areas ��Sorbents and Pom-Poms
Breach ways and Harbor Entrances: Various depths, Usually tidal
Current speed, vessel traffic and wave dependent
• Single Diversion Boom(Figure 2)
• Current < 2 knots use boomskirt of 12 inches if nowaves
• Current > 2 knots use boomskirt 6 inches or less if nowaves
Currents > 2 knots • Cascade Boom (Figure 4)• Use short skirts (if no
waves), shorts boom lengthsand sufficient overlap
Collection areas available on both sides
• Chevron Boom (Figures 6-7)• Open for vessel traffic• Closed if no traffic
Block for low volume flow
• Sealing• Fill• Dams• Weirs
Vessels notavailable
�� Boom Vane or FlowDiverters(Figure 9)
Design for volume �� Overflow/Underflow dams(Figures 12-13)
Isolated Areas �� Sorbents and Pom-Poms
8

SAFETY
Oil spill response is an inherently hazardous operation. It involves handling a hazardous material in a marine environment often under less than ideal sea and weather conditions. Deploying, operating and retrieving heavy and cumbersome oil spill response equipment routinely requires physical exertion and subjects responders to heat and cold stress. Responding to spills in fast water environments imposes additional hazards due to the extreme loads placed on equipment and the danger of personnel being swept away in the fast currents. Coast Guard personnel must perform Operational Risk Management (ORM) as outlined in COMDTINST M35003 before initiating response actions. (see process below).
Operational Risk Management Process
1. Identify Mission Tasks2. Identify Hazards3. Assess Risks4. Identify Options Tables5. Evaluate Risk vs. Gain6. Execute Decision7. Monitor Situation
Table 3 summarizes the major hazards, potential injuries and risk control measures associated with fast-water oil spill response. The water hazards are defined in some detail as these are the single most dangerous hazards associated with fast water response.
If an individual should accidentally fall in the water, there are a number of things that both the victim and rescuers should remember:
• Don’t swim against the current. Swim perpendicular.• Swim on back, feet downstream.• Use hands and feet to fend off obstructions.• Do not tie rope around swimmer or rescuer.• Angle rescue lines down current.• Stay on upstream side of the line.• Never clip into the line.
9

Table 3. Fast-water oil spill response hazard summary.
Hazard Injury Potential ControlSlips, Trips and Falls
Broken limbs, lacerations, head injuries
Awareness, protective clothing, safety lines
Ergonomic Back injury, joint injuries, hernias
Proper lifting methods, lifting devices
Heat and Cold Stress
Frost bite, hypothermia, heat stroke
Proper clothing, nutrition, rest, & medical monitoring
Flammability –Fire & Explosion
Death, severe burns, broken limbs, loss of eyes
Awareness, proper ventilation, monitoring
Oil Toxicity Eye/skin irritation, nausea, dizziness, long term effects
Air monitoring, respiratory protection, gloves, coveralls
Line Hazards Death, loss of limbs & eyes, broken limbs
Adequate line strength, safety observer, knife available
Heavy Equipment Hazards
Damage to eyes, hearing loss, exhaust inhalation, cuts and abrasions
Eye and ear protection, secure loose clothing, stay clear of danger points/ exhaust
Water (drowning)
Critical - death, hypothermia
Consider the following: • Don’t swim against
current, swimperpendicular
• Swim on back, feetdownstream
• Use hands and feet tofend off obstructions
• Do not tie rope aroundswimmer or rescuer
• Angle rescue linesdown current
• Stay on upstream sideof the line
• Never clip into the line
• Buddy System• Life jackets• Cold weather gear• Fall restraints• Life rings, boat
hooks• Rescue boats• Avoid waders• Bicycle helmets can
be substituted forhardhats only if nooverhead hazardsexits
• Avoid slip on firemanboots
• Avoid loose clothing
10
Shore
Direction of Oil
Boom
Shore Direction of
Oil
Shore
Direction of Oil
Figure 2. Single diversion boom.
Figure 3. Double boom.
Figure 4. Cascade boom.
Boom
Booms
11

Shore
Direction of Oil
Shore
Direction of Oil
Shore
Direction of Oil
Marina
Figure 5. Exclusion boom.
Figure 6. Open chevron boom.
Figure 7. Closed chevron boom.
Boom
Boom
12

Figure 8. Boom deflectors can be used without multiple anchors.
Figure 9. Boom vane deploys and retrieves deflection boom from shore to allow vessel passage.
13

Figure 10. The NOFI Vee SweepTM with tapered channel separator.
Figure 11. Wide-mouth V-shape boom with attached skimmer.
14

Figure 12. Earth underflow dam.
Figure 13. Overflow dam.
Intake
Outlet
15

HYDRODYNAMIC CONSIDERATIONS AND BOOMING RESOURCES
In assessing the overall feasibility of implementing a fast water booming tactic, it is necessary to determine key hydrodynamic parameters and assess the adequacy of on-scene resources based on these parameters. The definition’s process for accomplishing this is depicted in Figure 14, which outlines a procedure for determining the necessary parameters.
Definitions: • Current Speed (V in knots) and Water Depth (D in feet)• Profile Length-width that needs to be boomed: This is the value X in the
bottom of figure 15.• Maximum Deployment Angle of the boom (from Figure 15 or Table 4),• Minimum Length of Boom required (Lboom from Table 4),• Total Force exerted on the boom (Tboom from Table 4), and• Number of Anchor Points (AP#) required assuming a minimum of 50 feet of
spacing (AP# from Table 4).
Mooring Line: A conservative estimate of the total length of mooring line (Lline) required per anchor point is D X 7. The tension on each mooring line is estimated by Tline = Tboom / AP#.
The tension on each mooring line should then be checked against the lines Nominal Breaking Strength (from Table 5) and the Holding Power of each anchor (from Table 6). The value of the Tline should be less than both these values.
Boat Horsepower: The horsepower required (HPmin) for a deployment vessel to maintain the boom at this deployment angle in the current can be estimated as follows:
• For an outboard motor: HPmin = Tboom/15
• For an inboard motor: HPmin = Tboom/20
• For a jet drive motor: HPmin = Tboom/10
Anchoring: Examples of anchoring techniques are shown in Figures 16-18.
16

Figure 14. Hydrodynamic considerations and booming requirements.
Determine • Max Deflection Angle – �• Min Boom Length – Lboom
Determine: • Total Force on Boom – Tboom• Total Number of Anchor Points –
AP#• Length on Mooring Lines – D x 7=
Lline• Tension on Mooring Lines –
Tboom / AP# = Tline
• Assess Resources• Adjust as Necessary• Develop Deployment Plan
• Check Line Strength and AnchorHolding Power
• Tline < Nominal BreakingStrength (Table 5)
• Tline < Table 6 Value x AnchorWeight /100 lbs
Determine Current Speed (V in Knots) and Depth (D in Feet)
Figure 15
Table 4
Table 5 and Table 6
• Chip Log Technique(Table 4)
• Current Meter• Published Data• Chart• Depth Sounding
17

Figure 15. Maximum boom deployment angles required to prevent oil entrainment.
Based on critical escape velocity of 0.7 knots
0.0
1.0
2.0
3.0
4.0
5.0
6.0
0 10 20 30 40 50 60 70 80 90
Boom Angle to Current (degrees)
Cur
rent
Vel
ocity
(kno
ts)
Flow Angle
Shoreline
Distance Along Shore
Profile to
Current (100 ft)
X
Shore Anchor Point
Waterway Anchor Point
18
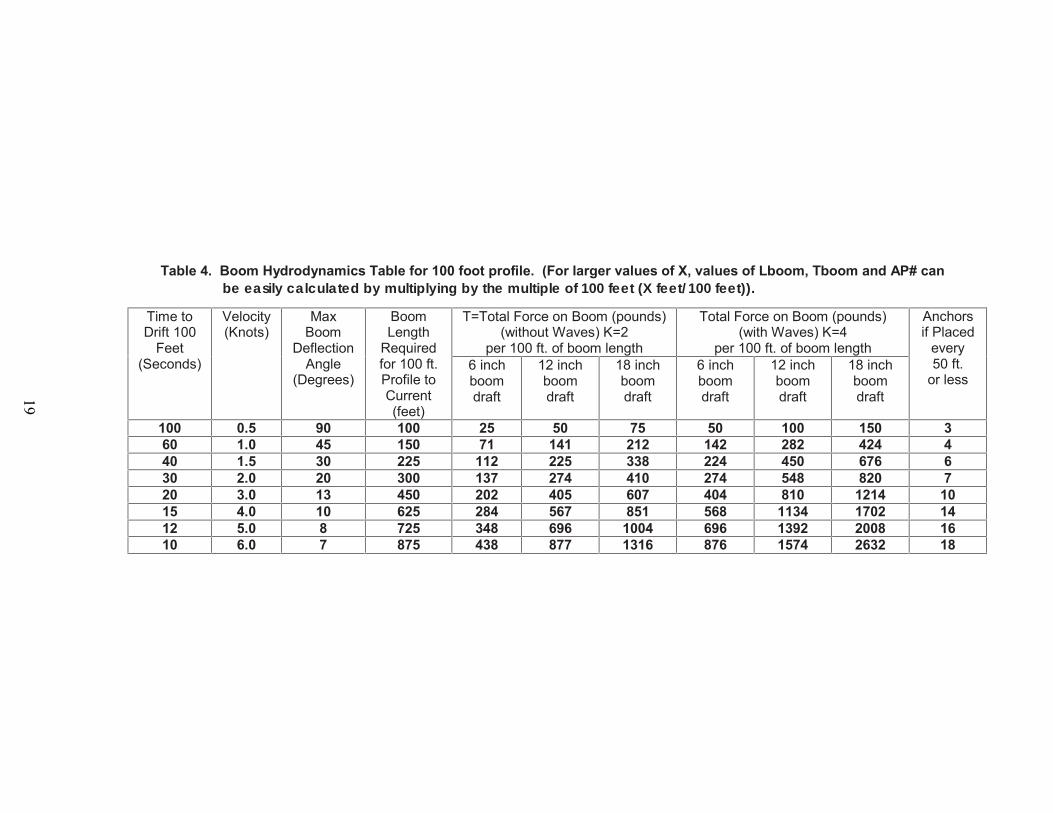
Table 4. Boom Hydrodynamics Table for 100 foot profile. (For larger values of X, values of Lboom, Tboom and AP# can be easily calculated by multiplying by the multiple of 100 feet (X feet/100 feet)).
T=Total Force on Boom (pounds) (without Waves) K=2
per 100 ft. of boom length
Total Force on Boom (pounds) (with Waves) K=4
per 100 ft. of boom length
Time to Drift 100
Feet (Seconds)
Velocity (Knots)
Max Boom
Deflection Angle
(Degrees)
Boom Length
Required for 100 ft. Profile to Current (feet)
6 inch boom draft
12 inch boom draft
18 inch boom draft
6 inch boom draft
12 inch boom draft
18 inch boom draft
Anchors if Placed
every50 ft.
or less
100 0.5 90 100 25 50 75 50 100 150 360 1.0 45 150 71 141 212 142 282 424 4 40 1.5 30 225 112 225 338 224 450 676 6 30 2.0 20 300 137 274 410 274 548 820 7 20 3.0 13 450 202 405 607 404 810 1214 10 15 4.0 10 625 284 567 851 568 1134 1702 14 12 5.0 8 725 348 696 1004 696 1392 2008 16 10 6.0 7 875 438 877 1316 876 1574 2632 18
19

Equations for Boom Force (Tboom) in Table 4
For a quick approximate load on a boom that is anchored at an angle of between 10 and 30 degrees to the current, use the following formula:
T = K * A * V2 where: T = tensile force, lbfK = constant, lbf /(ft2 x knots2)
A = projected area of the submerged portion of the boom, ft2
V = tow speed, knots
The projected area of the boom was calculated based on the boom draft, and the length of the boom normal to the water current (i.e., the direction of travel):
A = d * L * sin θ where: A = projected area of the submerged portion of the boom, ft2
d = boom draft, feet L = boom length, feet (100 ft)
θ �������������� �����°, 20°, 30°)
Table 5. Nominal line breaking strengths (pounds).
Table 6. Anchor holding power as a multiple of dry weight for 100 pounds.
Diameter (inches)
Manila Polypropylene (Three-Strand)
Nylon (Triple Strand)
Nylon (Double Braid)
Polyester (Double Braid)
5/16 900 1700 2300 3400 2400 1/2 2380 3800 5600 8500 5750 5/8 3960 5600 8910 15200 9000 1 9000 13000 23000 26500 26800 2 22500 32000 60000 74000 69900
Anchor Type Soft Soils Hard Soils Danforth/LWT 12.6 31.6
STATO/NAVMOOR 27.7 25-33Navy Stockless 3.5 11
20

Figure 16. Typical boom mooring configuration.
Figure 17. Mooring boom with multiple anchors.
Figure 18. Typical shoreline boom mooring system using posts.
Danforth Anchor
AnchorChain
AnchorLine
Tow Bridle
Boom
Skirt
Anchor Chain(6’ to 8’)
Anchor Line(5-7 X Depth)
Water Surface
Anchor
Buoy Buoy
Depth
Retrieval Line
BoomBridle
Shackles
Fence Post
Boom TrenchedInto the Shore
21

Table 7. Fast water worksheet.
FAST WATER WORK-SHEET
1.Incident Name: 2.Date/time prepared: 3.Operational Period 4.Attachments
5. Fast WaterType
Rivers/Canals (non-tidal) Rivers/Canals (tidal) Small Streams/Culverts/Creeks Coastal areas Harbors/Bays Breakwaters and Harbor entrances Other (specify):
Oil Type Oil Amount Temperature °F
Humidity %
Evaporation in 24 hours %
Wind (mph)
Visibility (Ft)
Rain, Sleet, Snow
Water (°F) Temperature
Other
6. BackgroundInfo
7. SafetyHazards
Confined Space Noise Heat Stress Cold Stress Electrical Animal/Plant/Insect Ergonomic Ionizing Rad Slips/Trips/Falls Struck by Water Violence Excavation Biomedical waste and/or needles Fatigue Other (specify)
8. PersonalProtection
Life Jackets Oil resistant gloves Shoulder length resistant gloves Level D Eye protection Cold WX Gear Level C Splash Suits Hearing protection Fall protection Water Sun screen Wet Suits Dry Suits Portable first aid kits Other (specify)
9. PotentialBoomingLocations
ETA Oil
Impact
Natural Collection
Point
Shoreline wave
energy
Current Speed & Direction Access
Water Depth
Tidal Influence
Bottom Amenable
to Anchors
Debris, Ice
Shore Sensitivity
Historical Economic Concern
Nav Traffic
Strategy Selec-
tion
Yes No
High Med Low
Land Water Air
High Med Low
Yes No
High Med Low
High Med Low
High Med Low
High Med Low
Yes No
High Med Low
Land Water Air
High Med Low
Yes No
High Med Low
High Med Low
High Med Low
High Med Low
10. SelectionStrategies
Current < 2 Knots Current > 2 Knots Room to Maneuver Collection Possible on
Opposite Sides Rivers/Canals (non-tidal)
Single Diversion Booming (Skirt < 12 inches) (SDB < 12)
Sorbents (isolated areas) (SRB) Exclusion Booming (EXB) Encircle Booming (ECB)
Single Diversion Booming (Skirt < 6 inches) (SDB < 6)
Cascade Booming (CSC) Skimmers (SK) Chevron Booming
(CHV)
Rivers/Canals (tidal)
Double SDB < 12, ECB, SRB Double SDB < 6, CSC SK CHV
Small Streams/ Creeks/Culverts
Fill, Dams, Weirs Underflow/Overflow Dams (UFD/OFD)
SRB
SK (small)
Coastal Areas ENC, SDB < 12 (no waves), SRB CSC SK Harbor/Bays SDB < 12, ECB, SRB SDB < 6, CSC SK CHV Breakwaters/ Harbor Entrances
SDB < 12, ECB, SRB, Fill, Dams, Weirs, UFD, OFD
SDB < 6, CSC SK CHV
Prepared by: Page _________ of ___________.
22

Table 8. Conversion tables.
CONVERSIONS AND EQUIVALENTS
AREA (s=statute, n=nautical) VOLUME Multiply by to derive multiply by to derive meters2 10.76 feet2 barrels 42 gallons
feet2 0.0929 meters2 barrels 5.615 feet3
kilometers2 0.386 s. miles2 barrels 158.9 liters s. miles2 2.59 kilometers2 barrels 0.1589 meters3
s. miles2 0.7548 n. miles2 feet3 7.481 gallonsn. miles2 1.325 s. miles2 gallons 3.785 liters
kilometers2 0.2916 n. miles2
n. miles2 3.430 kilometers2
WEIGHT multiply by to derive
TEMPERATURE kilograms 2.205 pounds
Calculate To derive metric tons 0.984 long tons 5/9(°F-32°) °C metric tons 1,000 kilograms9/5°C+32° °F metric tons 2,205 pounds
long tons 1,016 kilograms long tons 2240 pounds short tons 907.2 kilograms short tons 2,000 pounds
DENSITY ESTIMATIONS Barrels/Long Ton Notes: Range Average
Crude Oils 6.7 - 8.1 7.4 Aviation Gasolines 8.3 - 9.2 8.8 Motor Gasolines 8.2 - 9.1 8.7
Kerosenes 7.7 - 8.3 8.0Gas Oils 7.2 - 7.9 7.6
Diesel Oils 7.0 - 7.9 7.5 Lubricating Oils 6.8 - 7.6 7.2
Fuel Oils 6.6 - 7.0 6.8 Asphaltic Bitumens 5.9 - 6.5 6.2
• 1 Long Ton equals 2,200lbs.
• As a generalapproximation, use 7 bbl.(300 U.S. gallons) permetric ton of oil.
• 6.4 barrels/long ton isneutrally buoyant in freshwater. Open ocean neutralbuoyancy values aregenerally in the 6.21-6.25barrels/long ton range.
Specific Gravity of 1 or an API of 10 equals the density of fresh water.
23
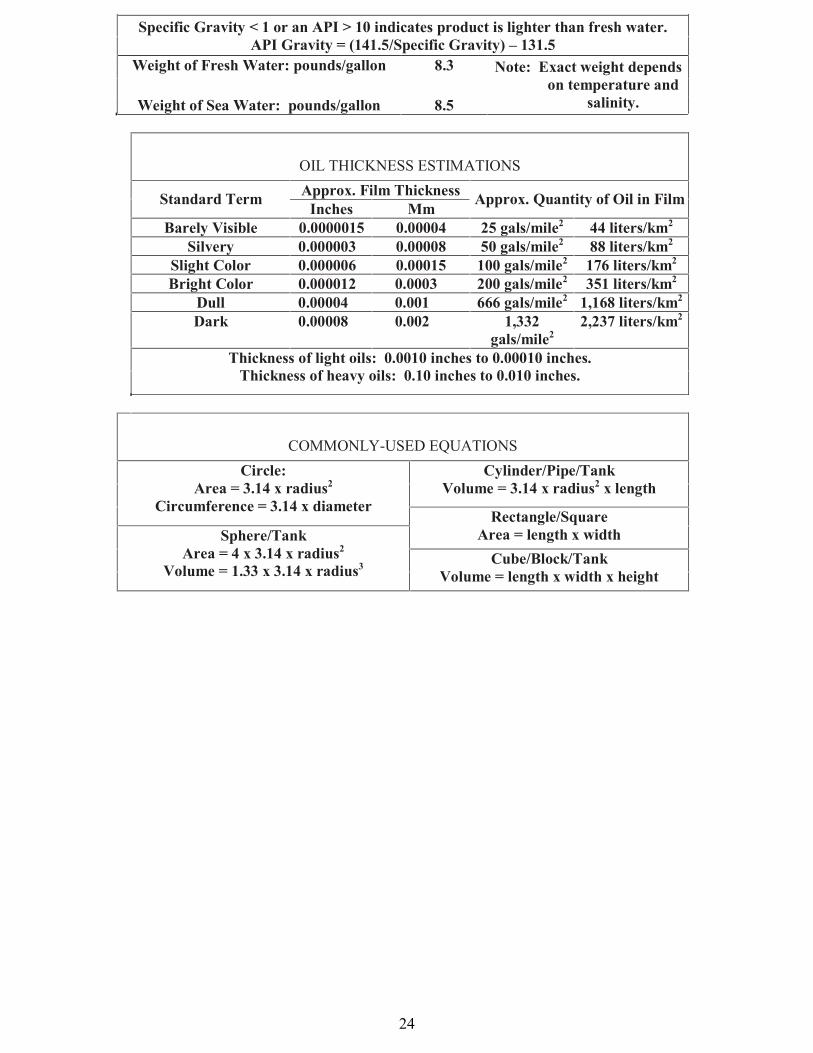
Specific Gravity < 1 or an API > 10 indicates product is lighter than fresh water. API Gravity = (141.5/Specific Gravity) – 131.5
Weight of Fresh Water: pounds/gallon 8.3
Weight of Sea Water: pounds/gallon 8.5
Note: Exact weight depends on temperature and
salinity.
OIL THICKNESS ESTIMATIONS Approx. Film Thickness Standard Term Inches Mm Approx. Quantity of Oil in Film
Barely Visible 0.0000015 0.00004 25 gals/mile2 44 liters/km2
Silvery 0.000003 0.00008 50 gals/mile2 88 liters/km2
Slight Color 0.000006 0.00015 100 gals/mile2 176 liters/km2
Bright Color 0.000012 0.0003 200 gals/mile2 351 liters/km2
Dull 0.00004 0.001 666 gals/mile2 1,168 liters/km2
Dark 0.00008 0.002 1,332 gals/mile2
2,237 liters/km2
Thickness of light oils: 0.0010 inches to 0.00010 inches. Thickness of heavy oils: 0.10 inches to 0.010 inches.
COMMONLY-USED EQUATIONS Cylinder/Pipe/Tank
Volume = 3.14 x radius2 x length Circle:
Area = 3.14 x radius2
Circumference = 3.14 x diameter Rectangle/Square
Area = length x width Sphere/Tank Area = 4 x 3.14 x radius2
Volume = 1.33 x 3.14 x radius3 Cube/Block/Tank Volume = length x width x height
24