Embed Size (px)
Citation preview
Section 9ASection 9AFunctions: The Building Functions: The Building Blocks of Mathematical Blocks of Mathematical
ModelsModels
Pages 532-539Pages 532-539
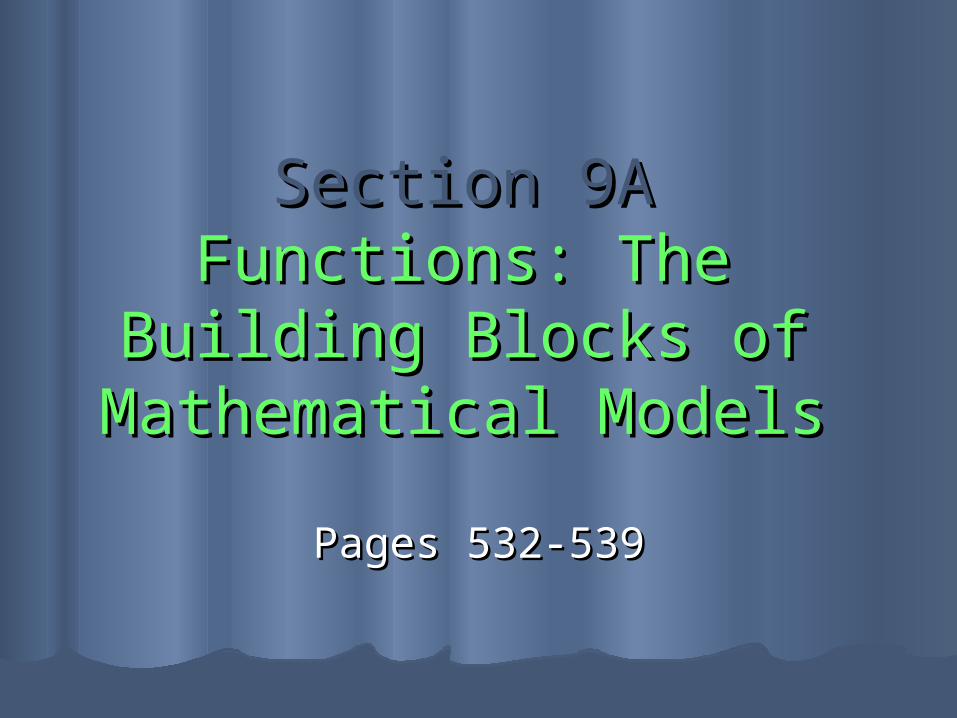
FunctionsFunctionsA function describes how a A function describes how a dependent dependent
variable (output) variable (output) changes changes with respect with respect toto one or more one or more independent variables independent variables (inputs)(inputs)..
When there are only When there are only twotwo variables, we often variables, we often summarize them as an summarize them as an ordered pairordered pair with the with the independent variable first: independent variable first:
((independent variableindependent variable, , dependent variabledependent variable) ) ((inputinput, , outputoutput))
((xx, , yy) )
9-A
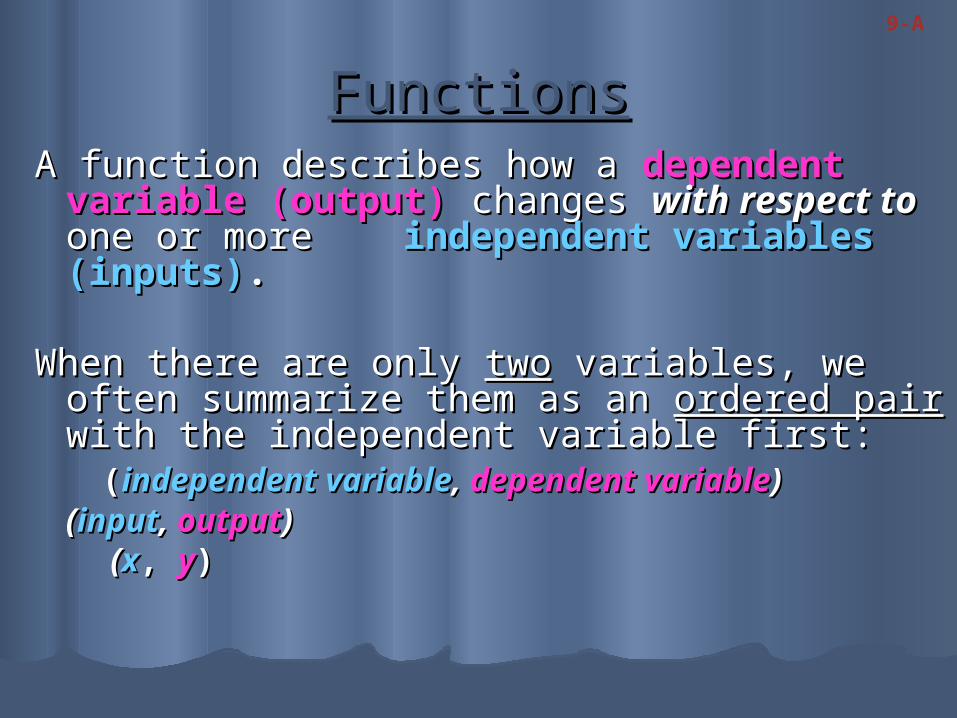
FunctionsFunctionsA function describes how a A function describes how a dependent dependent
variable (output) variable (output) changes with respect changes with respect toto one or more one or more independent variables (inputs)independent variables (inputs) ..
((timetime, , temperaturetemperature) ) ((altitudealtitude, , pressurepressure))((growth rategrowth rate, , populationpopulation))
((interest rateinterest rate, , monthly mortgage monthly mortgage paymentpayment) ) ((relative energyrelative energy, , magnitude (of magnitude (of earthquake)earthquake)))
9-A
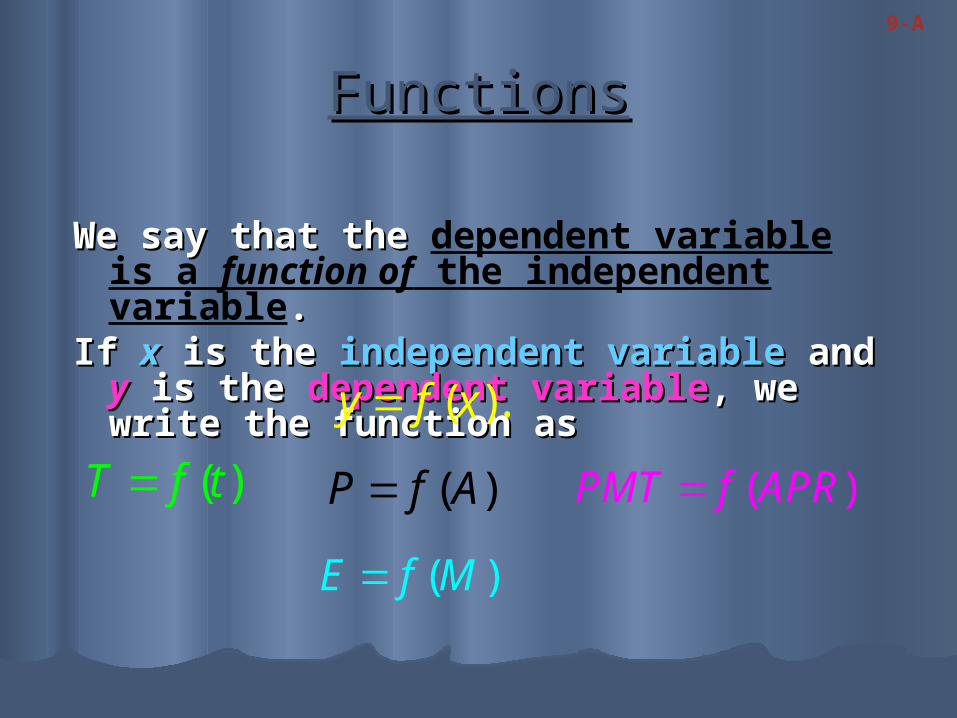
FunctionsFunctions
We say that the We say that the dependent variable is a function of the independent variable. .
If If xx is the is the independent variableindependent variable and and yy is the is the dependent variabledependent variable, we write , we write the function asthe function as
9-A
( ).y f x
( )T f t ( )P f A ( )PMT f APR
( )E f M

Representing FunctionsRepresenting Functions
There are There are three basic ways to three basic ways to represent functionsrepresent functions..
DataData TableTable or List or List
Draw a Draw a picturepicture or or graphgraph
Write an Write an equationequation
9-A
Coordinate PlaneCoordinate Plane9-A
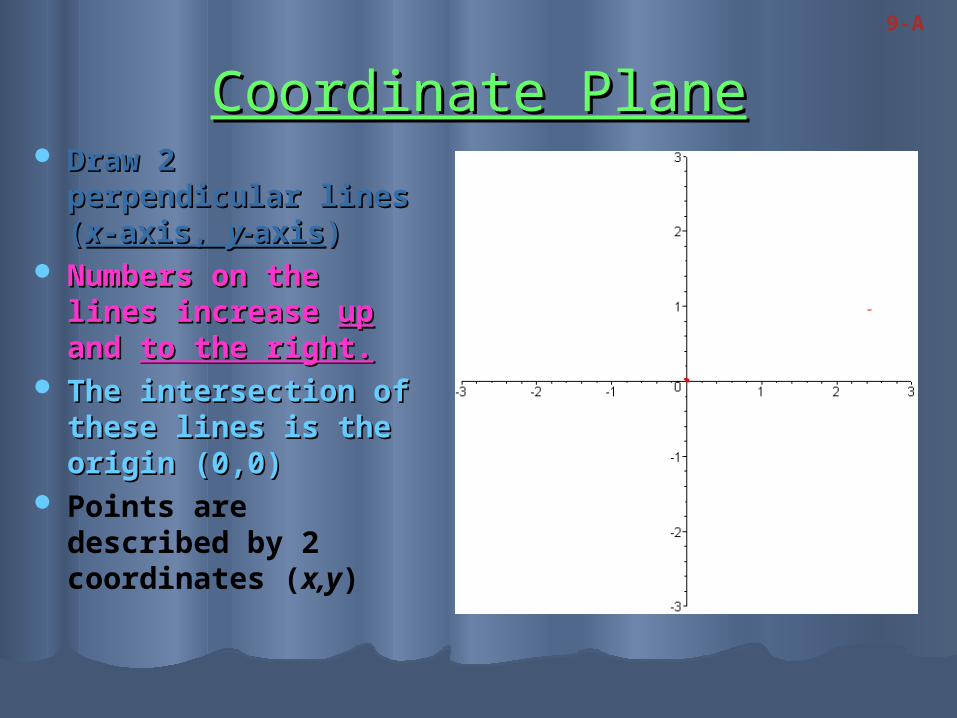
Coordinate PlaneCoordinate Plane Draw 2 Draw 2
perpendicular lines perpendicular lines ((xx-axis, -axis, y-y-axisaxis))
Numbers on the Numbers on the lines increase lines increase upup and and to the right.to the right.
The intersection of The intersection of these lines is the these lines is the origin (0,0)origin (0,0)
Points are described by 2 coordinates (x,y)
9-A
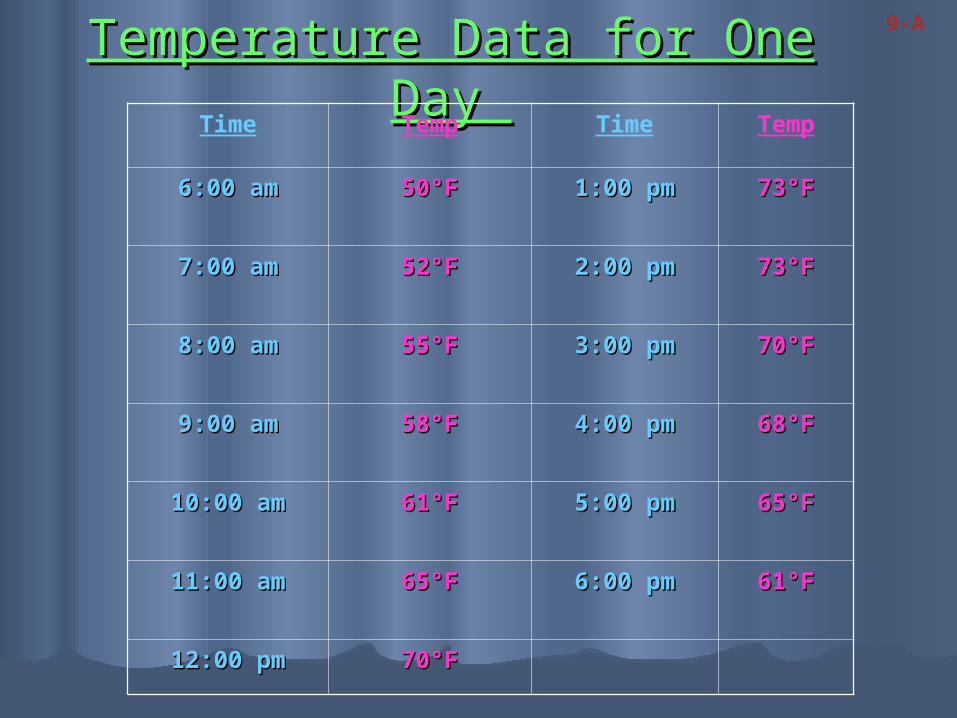
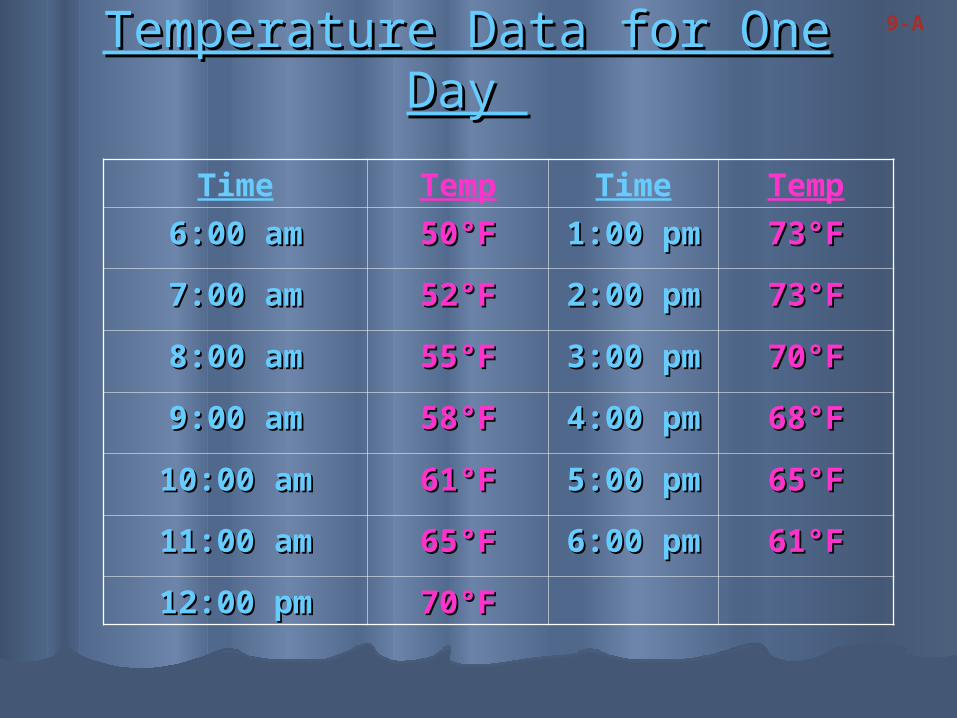
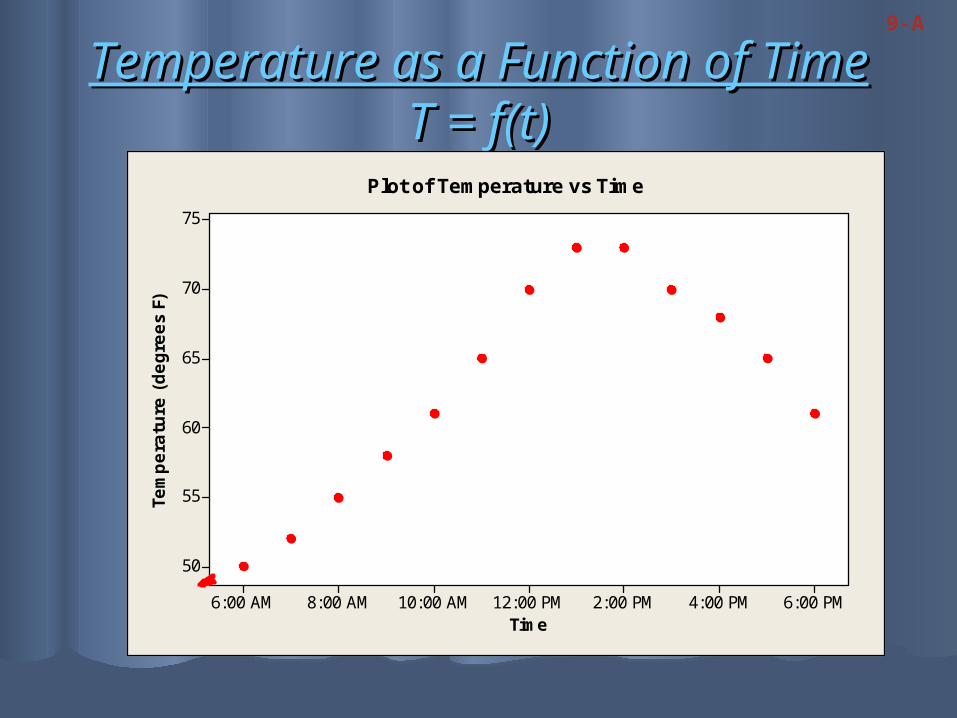
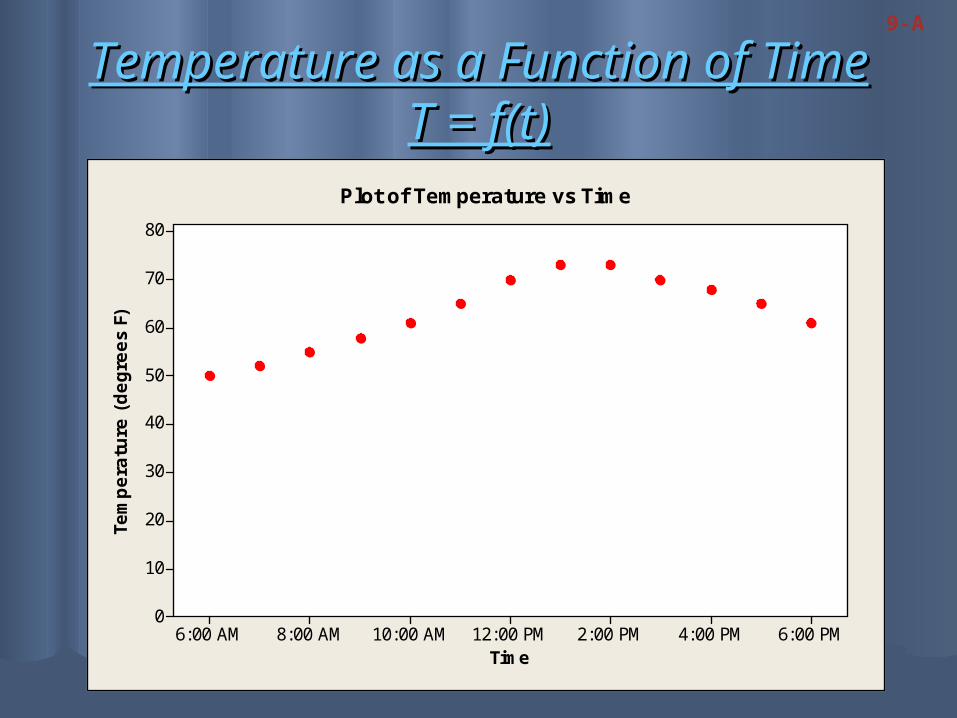
Temperature Data for One Temperature Data for One Day Day
Time Temp Time Temp
6:00 am6:00 am 50°F50°F 1:00 pm1:00 pm 73°F73°F
7:00 am7:00 am 52°F52°F 2:00 pm2:00 pm 73°F73°F
8:00 am8:00 am 55°F55°F 3:00 pm3:00 pm 70°F70°F
9:00 am9:00 am 58°F58°F 4:00 pm4:00 pm 68°F68°F
10:00 am10:00 am 61°F61°F 5:00 pm5:00 pm 65°F65°F
11:00 am11:00 am 65°F65°F 6:00 pm6:00 pm 61°F61°F
12:00 pm12:00 pm 70°F70°F
9-A
Domain and RangeDomain and RangeThe The domaindomain of a function is the set of of a function is the set of
values values
that both make sense and are of that both make sense and are of interest for the interest for the
input (independent)input (independent) variable. variable.The The rangerange of a function consists of the of a function consists of the
values values
of the of the output (dependent)output (dependent) variable that variable that correspond to the values in the domain.correspond to the values in the domain.
9-A
Temperature Data for One Temperature Data for One Day Day
Time Temp Time Temp
6:00 am6:00 am 50°F50°F 1:00 pm1:00 pm 73°F73°F
7:00 am7:00 am 52°F52°F 2:00 pm2:00 pm 73°F73°F
8:00 am8:00 am 55°F55°F 3:00 pm3:00 pm 70°F70°F
9:00 am9:00 am 58°F58°F 4:00 pm4:00 pm 68°F68°F
10:00 am10:00 am 61°F61°F 5:00 pm5:00 pm 65°F65°F
11:00 am11:00 am 65°F65°F 6:00 pm6:00 pm 61°F61°F
12:00 pm12:00 pm 70°F70°F
9-A
Domain and RangeDomain and Range
The The domaindomain is the hours from is the hours from 6 6 am to 6 pmam to 6 pm..
The The rangerange is temperatures from is temperatures from 50-73°F.50-73°F.
9-A
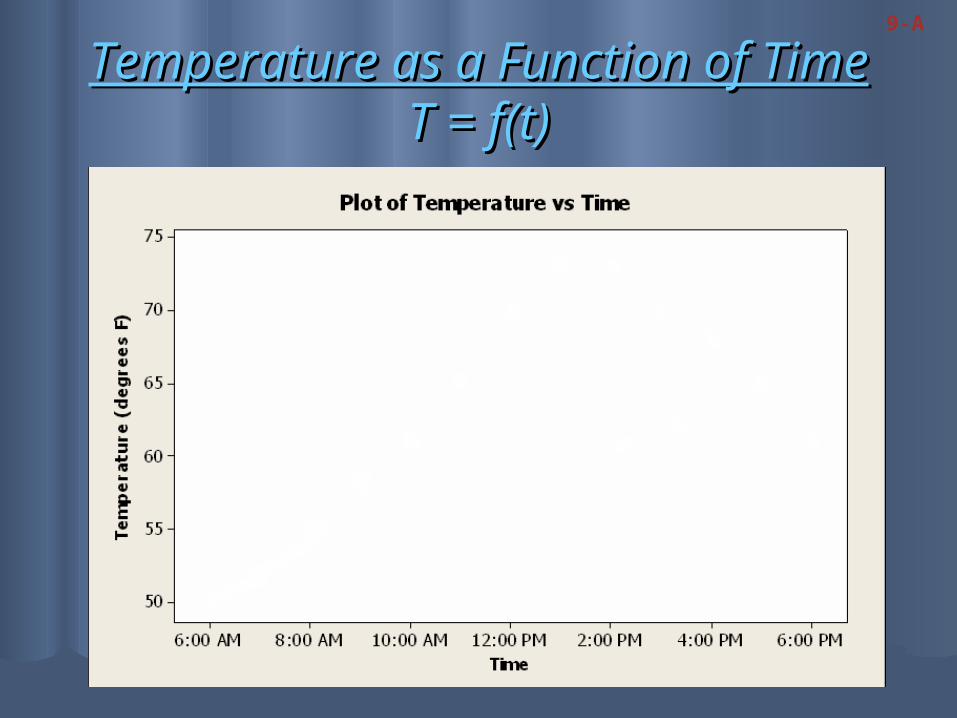
Temperature as a Function of TimeTemperature as a Function of TimeT = f(t)T = f(t)
9-A
Temperature as a Function of TimeTemperature as a Function of TimeT = f(t)T = f(t)
9-A
Time
Tem
pera
ture
(degre
es
F)
6:00 PM4:00 PM2:00 PM12:00 PM10:00 AM8:00 AM6:00 AM
75
70
65
60
55
50
Plot of Temperature vs Time
Temperature as a Function of TimeTemperature as a Function of TimeT = f(t)T = f(t)
9-A
Time
Tem
pera
ture
(degre
es
F)
6:00 PM4:00 PM2:00 PM12:00 PM10:00 AM8:00 AM6:00 AM
80
70
60
50
40
30
20
10
0
Plot of Temperature vs Time
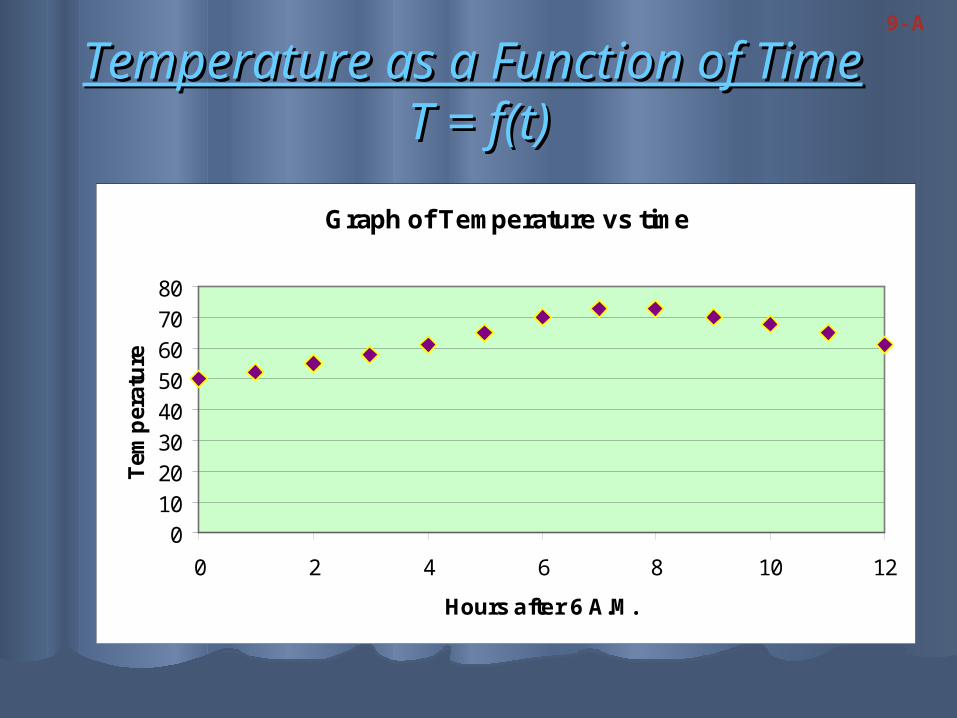
Temperature as a Function of TimeTemperature as a Function of Time T = f(t)T = f(t)
9-A
Graph of Temperature vs time
01020304050607080
0 2 4 6 8 10 12
Hours after 6 A.M.
Tem
per
atu
re
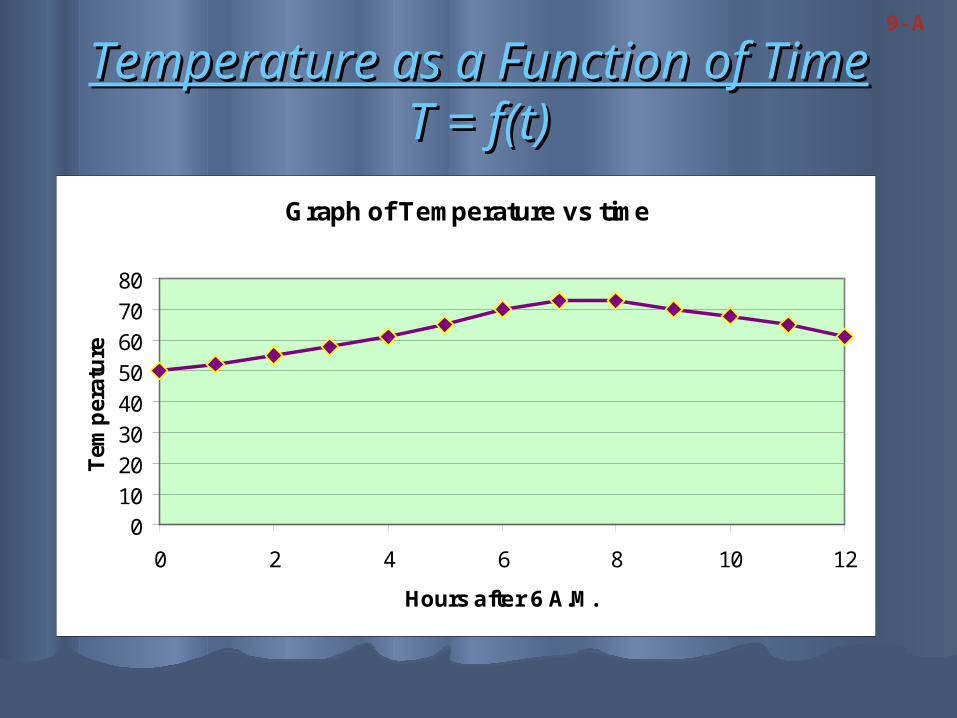
Temperature as a Function of TimeTemperature as a Function of TimeT = f(t)T = f(t)
9-A
Graph of Temperature vs time
01020304050607080
0 2 4 6 8 10 12
Hours after 6 A.M.
Tem
per
atu
re
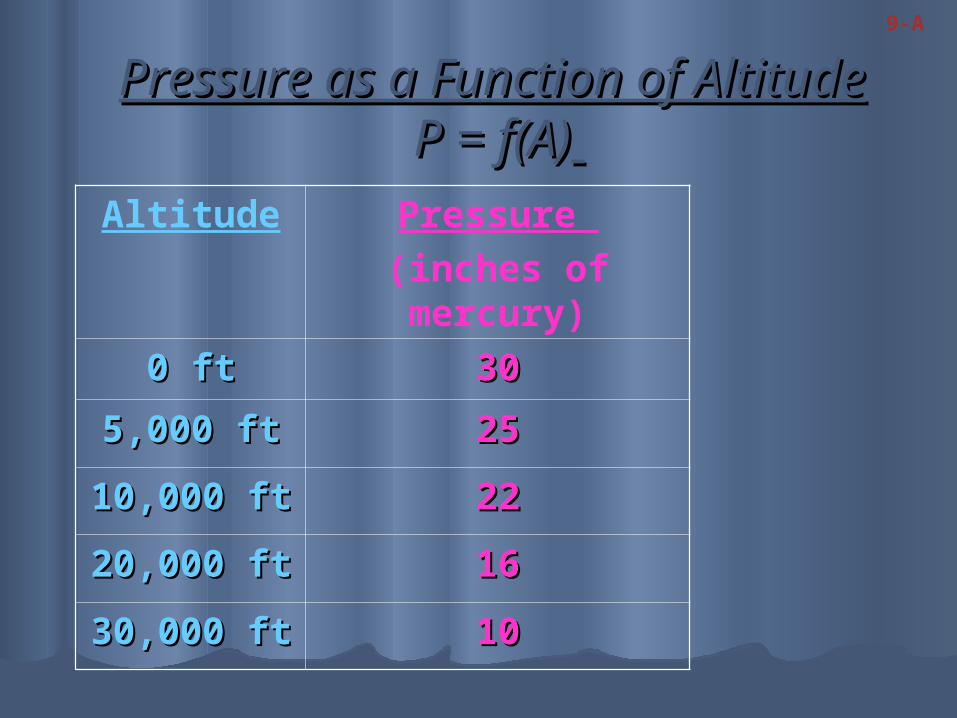
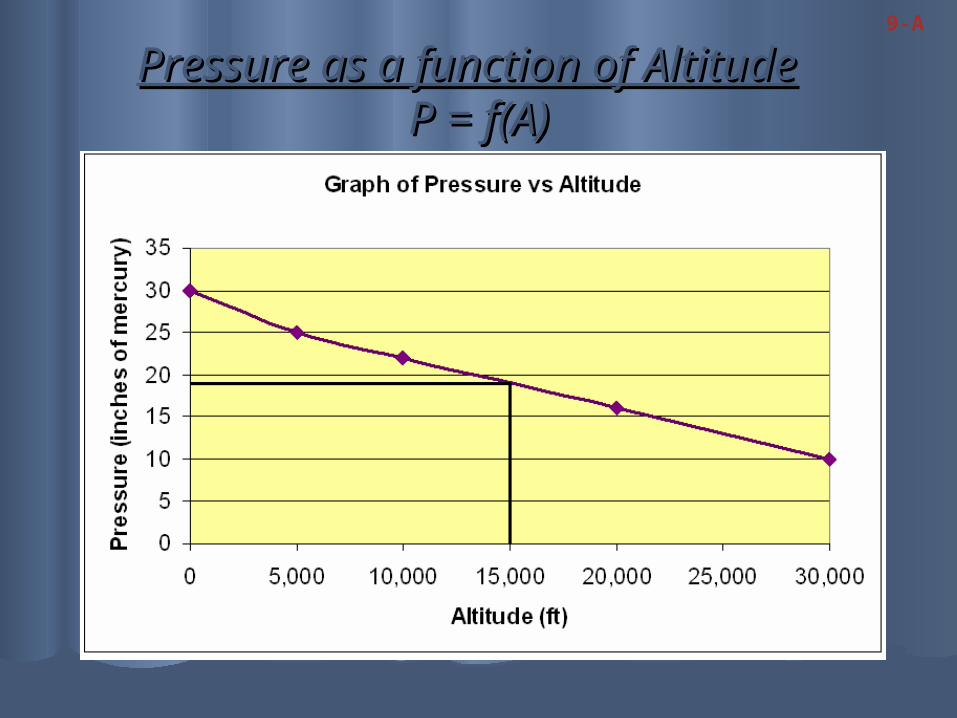
Pressure as a Function of AltitudePressure as a Function of Altitude P = f(A)P = f(A)
Altitude Pressure (inches of mercury)
0 ft0 ft 3030
5,000 ft5,000 ft 2525
10,000 ft10,000 ft 2222
20,000 ft20,000 ft 1616
30,000 ft30,000 ft 1010
9-A
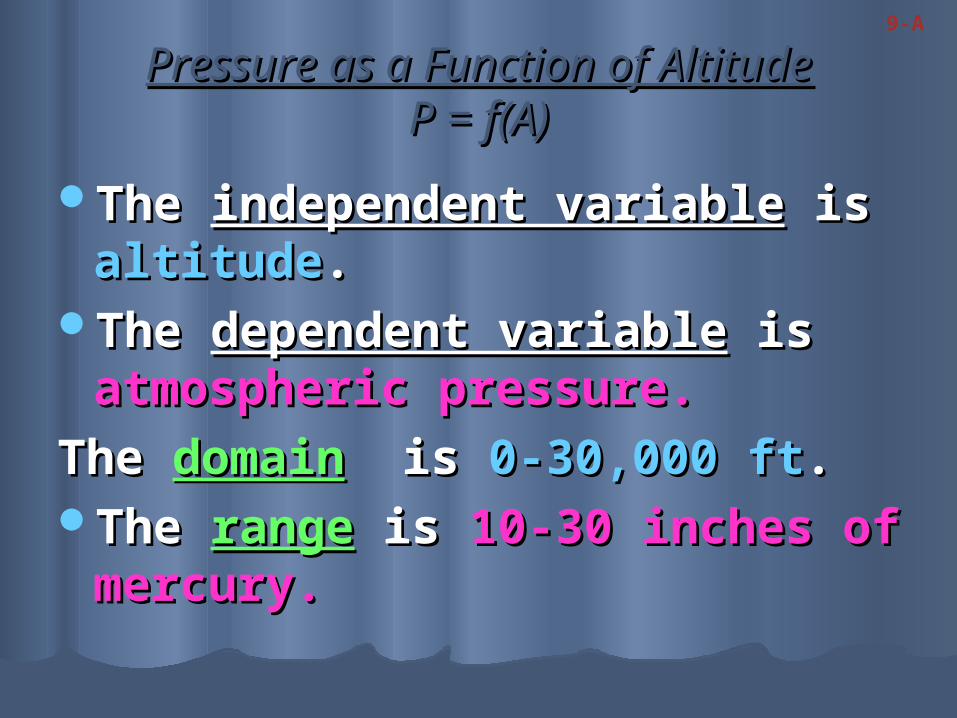
Pressure as a Function of AltitudePressure as a Function of AltitudeP = f(A)P = f(A)
The The independent variableindependent variable is is altitudealtitude..
The The dependent variabledependent variable is is atmospheric pressure.atmospheric pressure.
The The domaindomain is is 0-30,000 ft0-30,000 ft..The The rangerange is is 10-30 inches of 10-30 inches of
mercury.mercury.
9-A
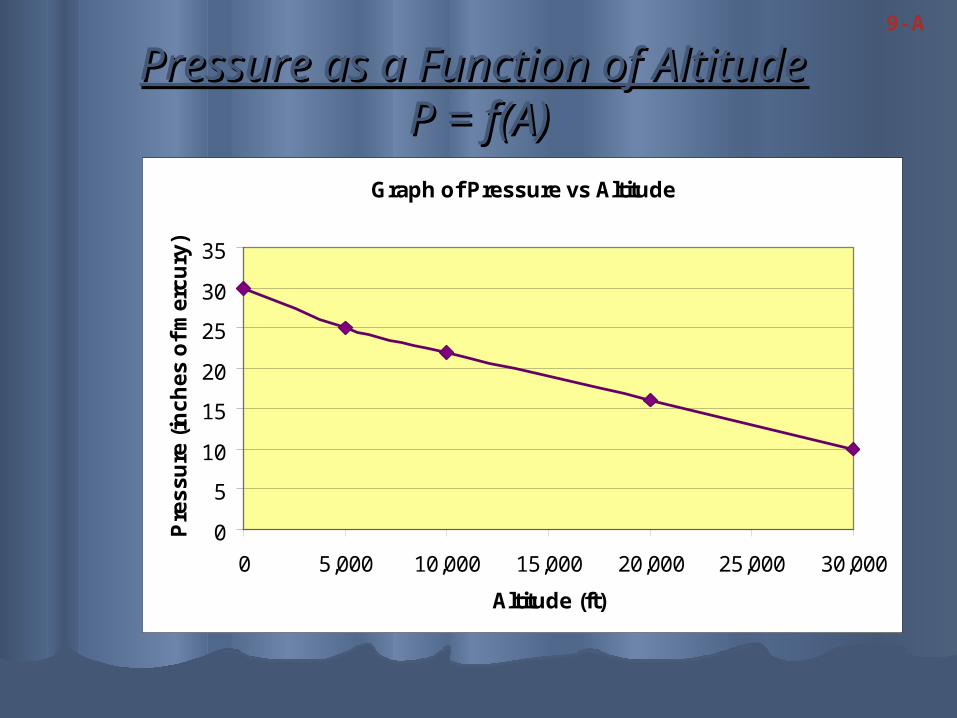
Pressure as a Function of AltitudePressure as a Function of Altitude P = f(A)P = f(A)
9-A
Graph of Pressure vs Altitude
0
5
10
15
20
25
30
35
0 5,000 10,000 15,000 20,000 25,000 30,000
Altitude (ft)
Pre
ss
ure
(in
ch
es
of
me
rcu
ry)
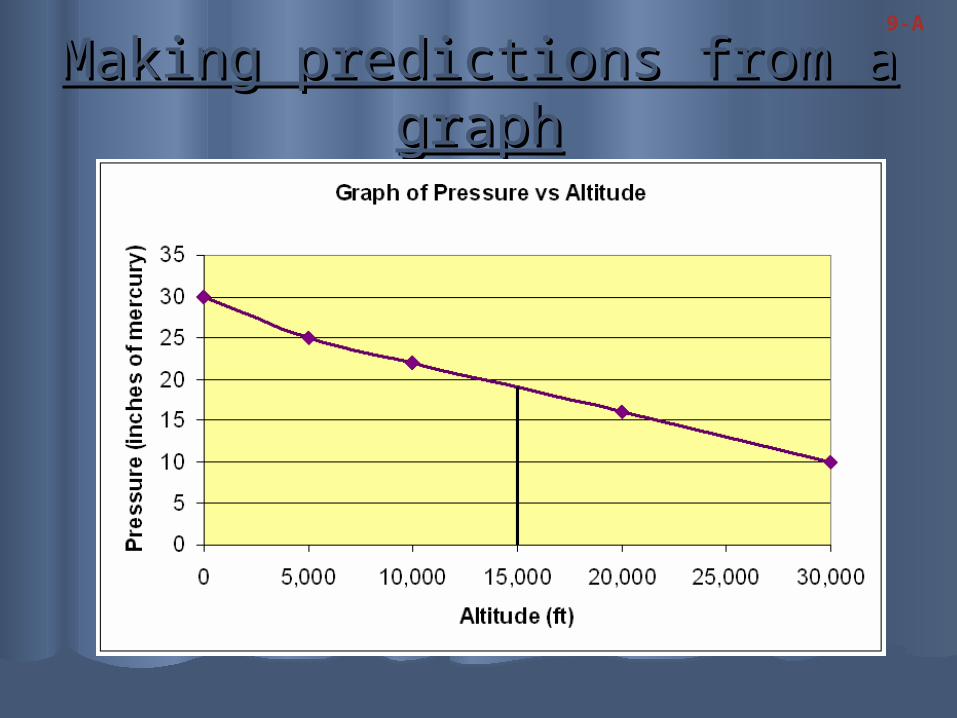
Making predictions from a Making predictions from a graphgraph
9-A
Pressure as a function of AltitudePressure as a function of Altitude P = f(A)P = f(A)
9-A
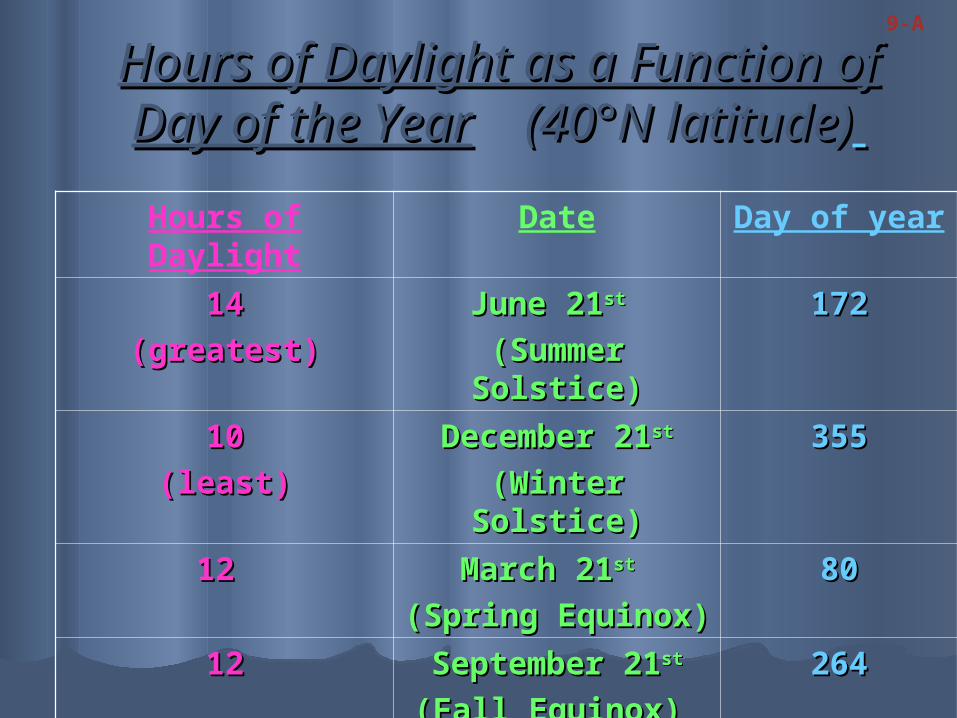
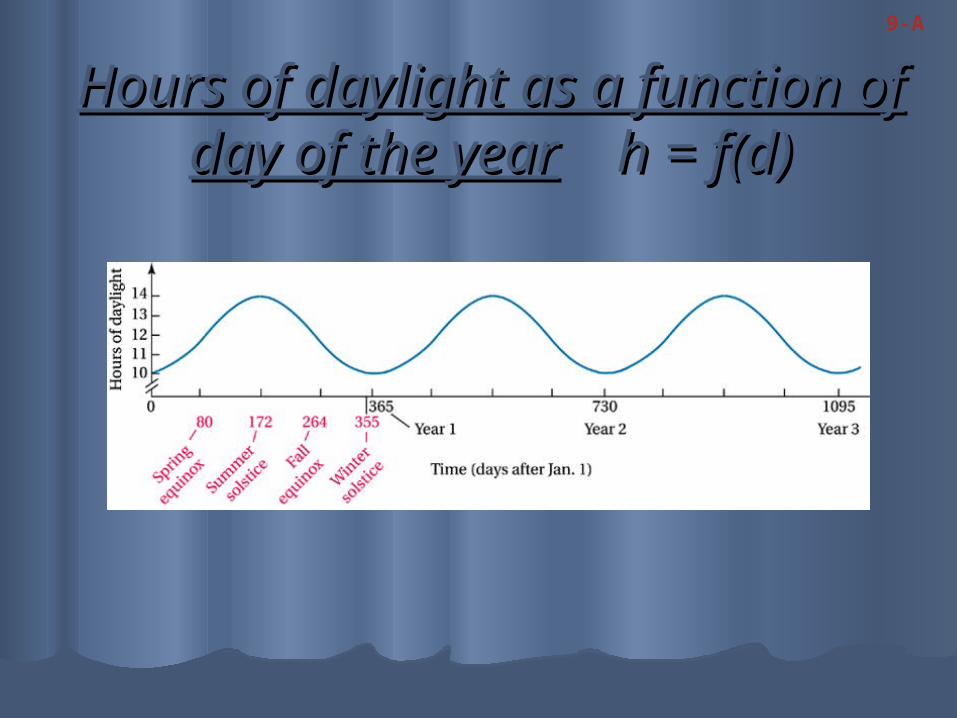
Hours of Daylight as a Function of Hours of Daylight as a Function of Day of the YearDay of the Year (40°N latitude) (40°N latitude)
Hours of Daylight Date Day of year
1414
(greatest)(greatest)June 21June 21stst
(Summer (Summer Solstice)Solstice)
172172
1010
(least)(least)December 21December 21stst
(Winter Solstice)(Winter Solstice)355355
12 12 March 21March 21stst
(Spring Equinox)(Spring Equinox)8080
1212 September 21September 21stst
(Fall Equinox) (Fall Equinox) 264264
9-A
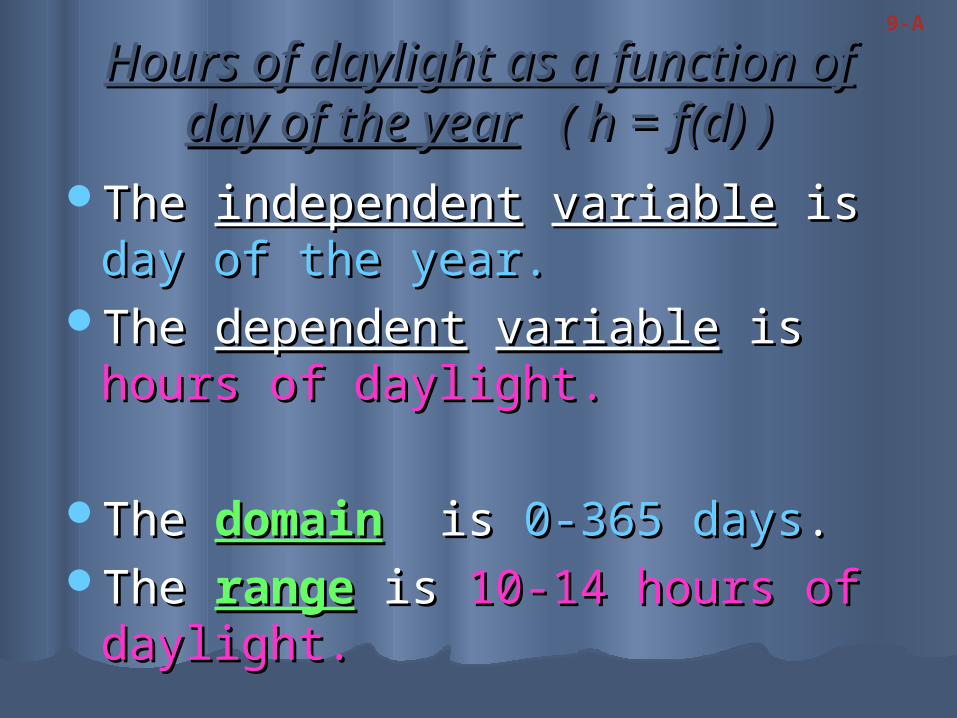
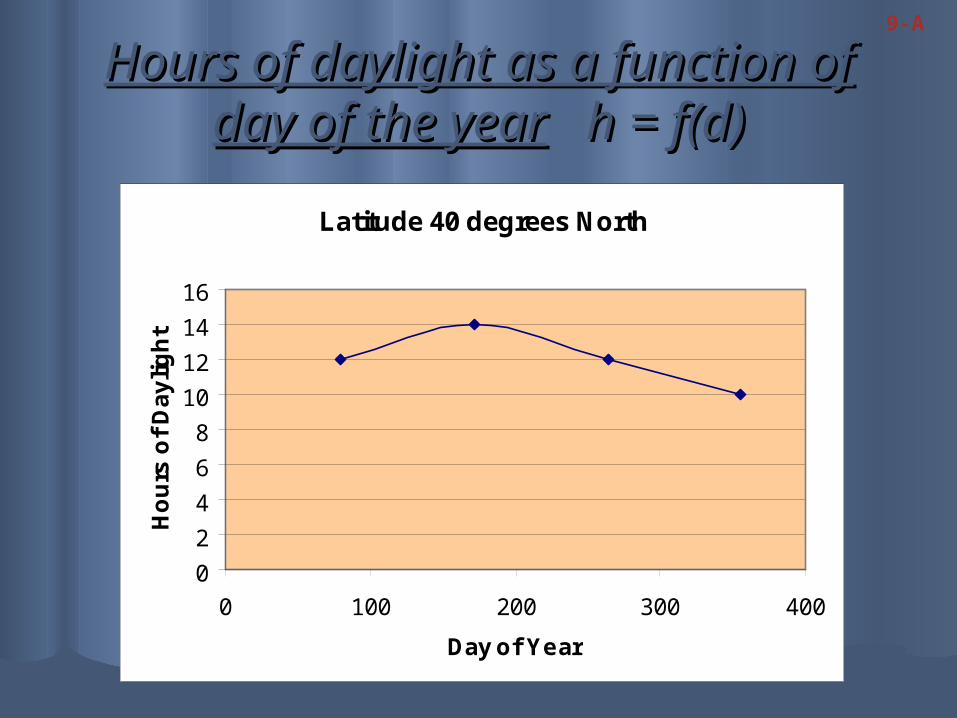
Hours of daylight as a function of day of Hours of daylight as a function of day of the yearthe year ( h = f(d) ) ( h = f(d) )
The The independentindependent variablevariable is is day day of the year.of the year.
The The dependentdependent variablevariable is is hours hours of daylight.of daylight.
The The domaindomain is is 0-365 days0-365 days..The The rangerange is is 10-14 hours of 10-14 hours of
daylight.daylight.
9-A
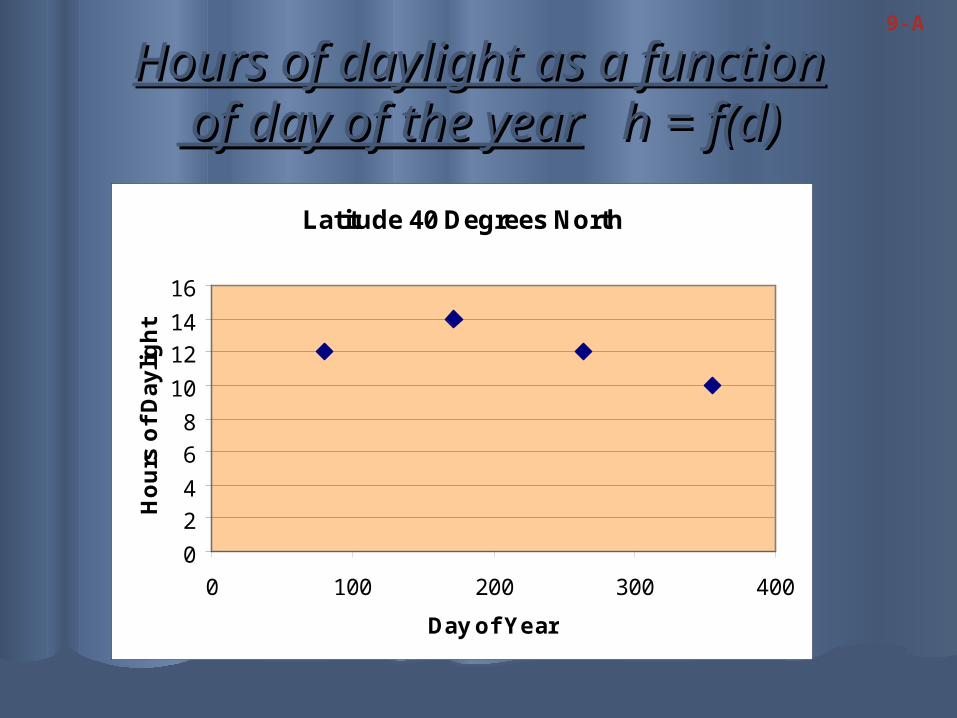
Hours of daylight as a functionHours of daylight as a function of day of the year of day of the year h = f(d) h = f(d)
9-A
Latitude 40 Degrees North
0
2
4
6
8
10
12
14
16
0 100 200 300 400
Day of Year
Ho
urs
of
Da
yli
gh
t
Hours of daylight as a function of day of Hours of daylight as a function of day of the yearthe year h = f(d) h = f(d)
9-A
Latitude 40 degrees North
0
2
4
6
8
10
12
14
16
0 100 200 300 400
Day of Year
Ho
urs
of
Da
yli
gh
t
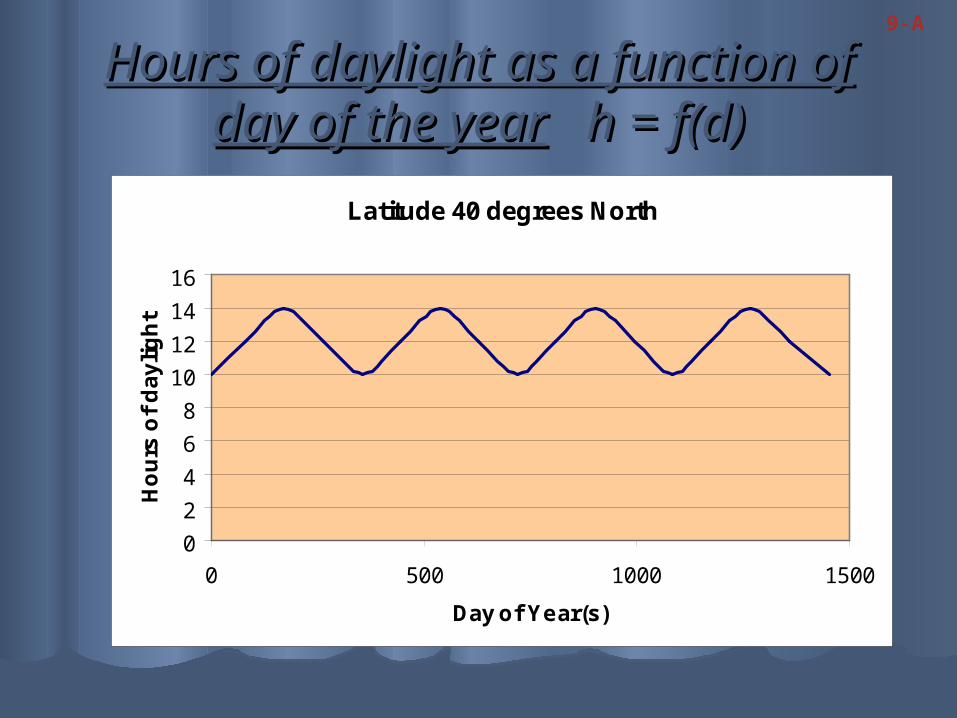
Hours of daylight as a function of day of Hours of daylight as a function of day of the yearthe year h = f(d) h = f(d)
Latitude 40 degrees North
0
2
4
6
8
10
12
14
16
0 500 1000 1500
Day of Year(s)
Ho
urs
of
da
yli
gh
t
9-A
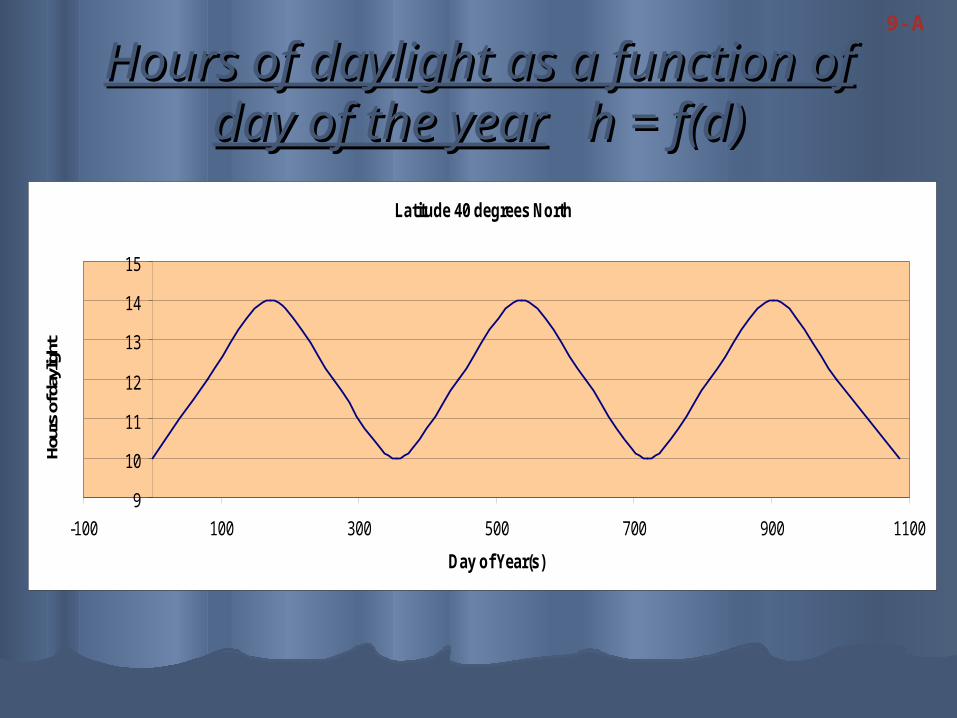
Hours of daylight as a function of day of Hours of daylight as a function of day of the yearthe year h = f(d) h = f(d)
9-A
Latitude 40 degrees North
9
10
11
12
13
14
15
-100 100 300 500 700 900 1100
Day of Year(s)
Hour
s of
day
light
Hours of daylight as a function of day Hours of daylight as a function of day of the yearof the year h = f(d) h = f(d)
9-A
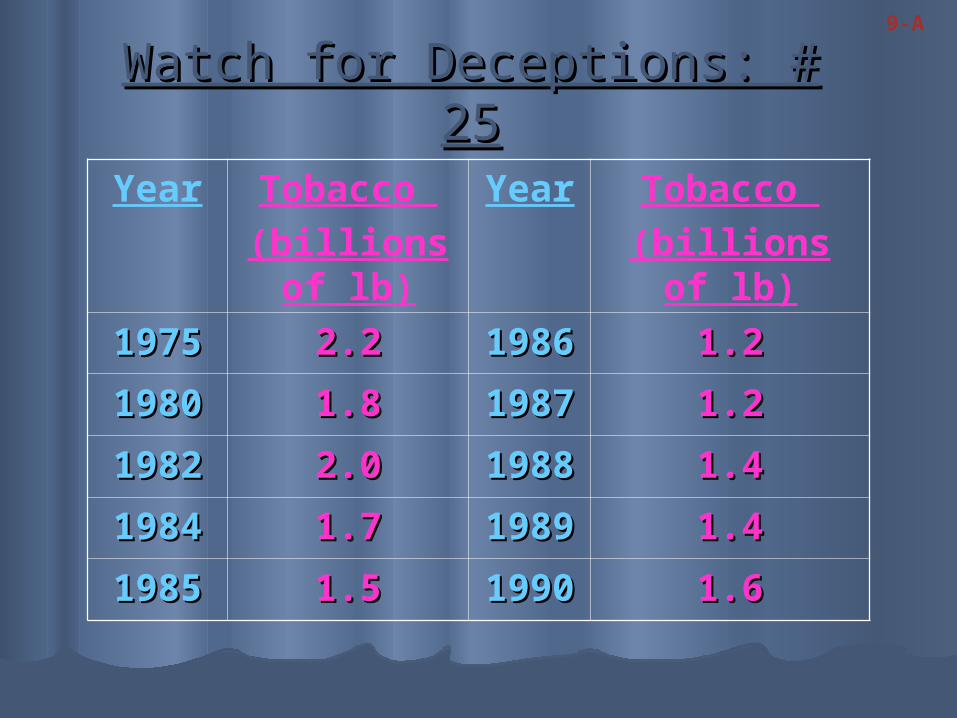
Watch for Deceptions: # 25Watch for Deceptions: # 25
Year Tobacco (billions
of lb)
Year Tobacco (billions of
lb)
19751975 2.22.2 19819866
1.21.2
19801980 1.81.8 19819877
1.21.2
19821982 2.02.0 19819888
1.41.4
19841984 1.71.7 19819899
1.41.4
19851985 1.51.5 19919900
1.61.6
9-A
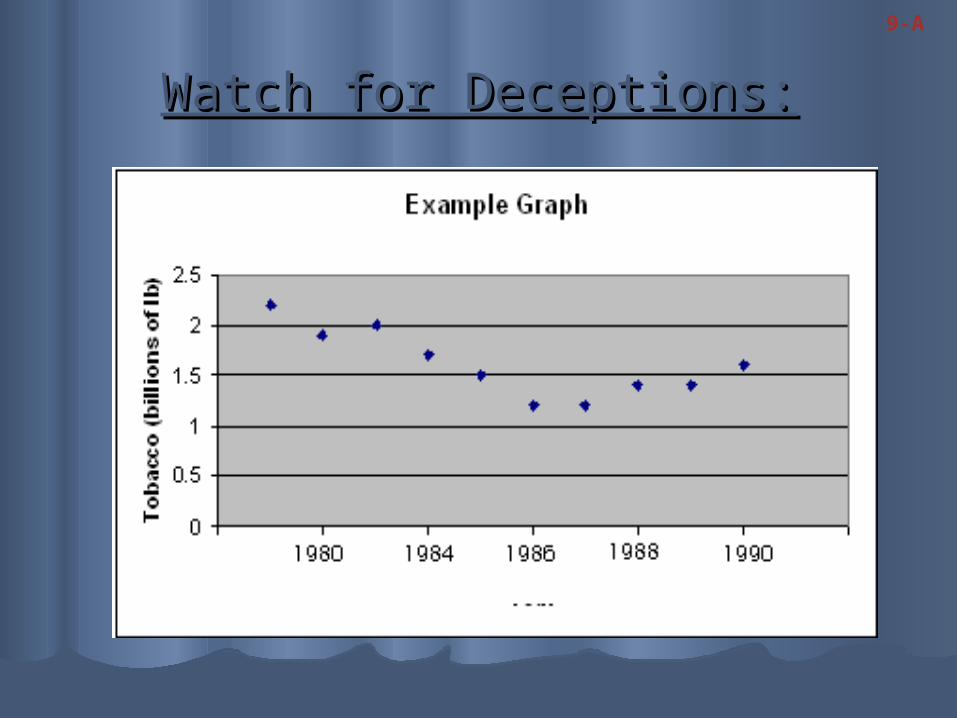
Watch for Deceptions:Watch for Deceptions:
9-A
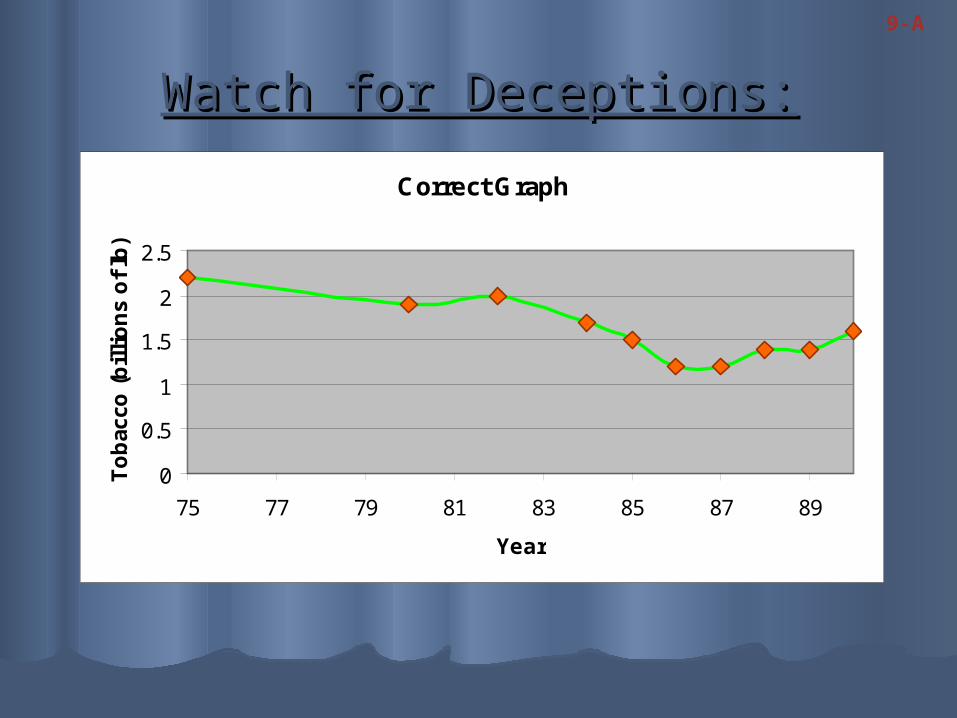
Watch for Deceptions:Watch for Deceptions:
9-A
Correct Graph
0
0.5
1
1.5
2
2.5
75 77 79 81 83 85 87 89
Year
To
bac
co (
bil
lio
ns
of
lb)
Homework for Wednesday:Homework for Wednesday:
Pages 540-542Pages 540-542# 19a-b, 20a-c, 22, 24, 26# 19a-b, 20a-c, 22, 24, 26
You may use Excel to graph the You may use Excel to graph the functions in # 24, 26.functions in # 24, 26.
9-A