Embed Size (px)
Citation preview

SECTION B:
STATUS QUO
ANALYSIS

INTEGRATED DEVELOPMENT PLAN 2012-2017: SECTION B 22
JOHN TAOLO GAETSEWE DISTRICT MUNICIPALITY
2.1 The John Taolo Gaetsewe District Area
The John Taolo Gaetsewe District Municipality (JTGDM) is situated in the Northern Cape Province and is
bordered by (1) The Siyanda and Francis Baard District Municipalities to the south and west; (2) The
North West Province (Dr. Ruth Segomotsi Mompati District Municipality) to the east and northeast; and
(3) Botswana to the northwest. Administratively, the JTGDM comprises three Local Municipalities: (1) The
Gamagara Local Municipality; (2) The Ga-Segonyana Local Municipality; and (3) The Joe Morolong Local
Municipality, which encapsulates the geographical area covered by the former District Management Area
and the former Moshaweng Local Municipality. (Source: JT Gaetsewe 2011-12 SDF Review)
JT Gaetsewe is the second smallest district in the Northern Cape, occupying only 6% of the Province (27
293 km2). The largest area within JT Gaetsewe is the former District Management Area (DMA) with over
10 000 km2. Joe Morolong covers the next largest area of 9 477 km
2 (KDM, IDP 2006). The JT Gaetsewe
District comprises of 186 towns and settlements of which the majority (80%) are villages in the Joe
Morolong Municipality.
Table / Graph 4: The JT Gaetsewe Municipal Area
(Source: 2007 SDF, JT Gaetsewe DM)
2.1.1 Population and Demographics
In terms of local population dynamics, the Joe Morolong LM experienced the bulk of the population
decline, with this LM’s population shrinking from 97 945 in 2001 to 89 530 i.e. a decline of -8.6%. The two
biggest contributing factors for this dynamic are (1) out-migration from this LM to the Ga-Segonyana and
Gamagara LM's, notably the towns of Kuruman and Kathu, and (2) the prevalence of HIV and AIDS in the
area. While both the Ga-Segonyana and Gamagara LM's have been recipients of migrants from the Joe
Morolong LM, it is the Gamagara LM that has seen a 79.40% and Ga-Segonyana LM an increase of 33%
in population during the period 2001 to 2011. There is an increase of 1.60% in the population of the
District, compared to the 1.44% for the Northern Cape Province. This may be indicative of the growth in
mining activities since 2001.

INTEGRATED DEVELOPMENT PLAN 2012-2017: SECTION B 23
JOHN TAOLO GAETSEWE DISTRICT MUNICIPALITY
Table / Graph 5: Population Distribution
Census 2001
Census 2011 Census 2001
Census 2011
% Variance
% Distribution
Male Female Total
Northern Cape Province
991919 564972 580889 1145861
DC45: John Taolo Gaetsewe
191539 108966 115833 224799 19.31 19.62 85.20
NC451: Joe Morolong
97945 41262 48268 89530 37.87 39.83 -8.60
NC452: Ga-Segonyana
70392 44994 48658 93651 41.29 39.83 33.00
NC453: Gamagara 23202 22710 18907 41617 12.11 18.51 79.40
(Source: JT Gaetsewe 2011-12 SDF Review and Census 2011)
The average household size in the DM in 2007 was 4.06, which was slightly higher than the provincial figure of 3.93 and the national figure of 3.81. It was also the second highest figure amongst the five DM's in the NC Province. The JTGDM figure is markedly lower than the figure for 2001, when the household size in the district was 4.3 (CSIR, 2011). The same downward trend is visible in two of the three LM’s in the district, with the household size in (1) the Gamagara LM declining from 4.4 in 2001 to 3.7 in 2004, and (2) the Joe Morolong LM from 4.1 to 3.7. The decline is largely the result of a decline in the former DMA, with the household size declining from 3.6 in 2001 to 2.9 in 2007. In the case of the former Moshaweng LM, the household size declined only marginally from 4.6 in 2001 to 4.5 in 2007 (Source: JT Gaetsewe 2011-12 SDF Review). The downward trend in the average household size continued in the 2011 and was 3.73. The household sizes for all the LM areas are illustrated in Table / Graph 6 below. Table / Graph 6: Average Household sizes
Source: Census 2011

INTEGRATED DEVELOPMENT PLAN 2012-2017: SECTION B 24
JOHN TAOLO GAETSEWE DISTRICT MUNICIPALITY
Table / Graph 7: Household size
Household size
Northern Cape
DC45: John Taolo
Gaetsewe
NC451: Joe
Morolong
NC452: Ga-
Segonyana
NC453: Gamagara
1 68774 16989 6706 7060 3222
2 58914 9905 3259 4438 2208
3 46962 8103 2830 3759 1514
4 45977 8089 2867 3791 1431
5 29554 5974 2284 2831 860
6 19381 4310 1822 1924 564
7 12329 2809 1252 1192 365
8 7559 1851 934 692 224
9 4680 1227 630 449 148
10+ 7276 2074 1125 679 271
Total 301405 61331 23707 26816 10808
Source: Census 2011
The age profile of the JTGDM in 2011 was as follows: 0-14 years: 34%; 15-64 years: 61.2%; and older than 65: 4.8%. While it is not that different from the national profile (0-14 years: 31.03%; 15-64 years: 63.59%; and older than 65: 5.39%), it is substantially different from the provincial profile in the 0-14 and the 15-64 age brackets.
Table / Graph 8: Age profile
AGE Northern
Cape
DC45: John
Taolo Gaetsewe
NC451: Joe
Morolong
NC452: Ga-
Segonyana
NC453:
Gamagara0-14 345373 76325 35293 30440 10592
15-64 735713 137671 48510 59224 29938
65-120 64766 10800 5726 3983 1086
TOTAL 1145861 224799 89530 93651 41617
Source: Census 2011
The gender split in the JTGDM is: 51.53% female and 48.47% male. This is slightly different from
the provincial split of 50.69% female 49.30% male, and slightly different from the provincial split of
50.91% female and 49.09% male.
Table / Graph 9: Gender profile
Gender Northern
Cape
DC45:
John
Taolo
Gaetsewe
NC451:
Joe
Morolong
NC452: Ga-
Segonyana
NC453:
Gamagara
Male 564972 108966 41262 44994 22710
Female 580889 115833 48268 48658 18907
Total 1145861 224799 89530 93651 41617

INTEGRATED DEVELOPMENT PLAN 2012-2017: SECTION B 25
JOHN TAOLO GAETSEWE DISTRICT MUNICIPALITY
Source: Census 2011
The racial profile of the JTGDM is as follows: Black/African: 84.84%; Coloured: 9.26%; Asian and
Indian: 0.38%; White: 4.96% and other 0.56% (Census 2011).
Table / Graph 10: Racial distribution
Source: Census 2011
0
200000
400000
600000
800000
1000000
1200000
1400000
Sum of Northern Cape
Sum of DC45: John TaoloGaetsewe
Sum of NC451: JoeMorolong
Sum of NC452: Ga-Segonyana
Sum of NC453: Gamagara

INTEGRATED DEVELOPMENT PLAN 2012-2017: SECTION B 26
JOHN TAOLO GAETSEWE DISTRICT MUNICIPALITY
2.1.2 Spatial Analysis
Table / Graph 11: Strategic policy framework of the JT Gaetsewe Municipal Area
(Source: 2011/12 revised SDF)
IDP Objectives:
Gamagara Local Municipality
The IDP sets out the following objectives for the integrated development of the Gamagara Local
Municipality: (1) to render quality, effective and sufficient services; (2) to promote the general wellbeing
through a safe and healthy environment amongst all residents; (3) to promote equality and fairness in the
allocation of resources; and (4) to promote sound and sustainable economic growth in the municipal
area.
Ga-Segonyana Local Municipality
The values that guide development in the Ga-Segonyana Local Municipality are: (1) to deliver quality, affordable and sustainable services; (2) to serve the community in an accountable, equitable and transparent manner; (3) to nourish the spirit of self-reliance and co-operative governance; (4) to build a

INTEGRATED DEVELOPMENT PLAN 2012-2017: SECTION B 27
JOHN TAOLO GAETSEWE DISTRICT MUNICIPALITY
culture of payment and a spirit of belonging and ownership amongst our people; (5) to promote and support a sustainable socio-economic development; (6) to implement all our plans through leadership and commitment; (7) to promote integrated human settlement; and (8) to deal with our customers in a friendly and honest manner that respects their dignity.
Joe Morolong Local Municipality
According to this IDP, the following are identified as priority realities, dynamics and issues in the municipality: (1) the rural nature of the municipality, characterized by vast distances and a lack of resources to adequately sponsor public participation infrastructure; (2) the need to prioritize the most fundamental and pressing needs of the community, who are faced with major survival challenges, including access to clean, potable water within reasonable distance from homes, acceptable standards of sanitation facilities and shelter; (3) the need to promote the interest of special interest groups, such as women, the youth and persons with disabilities; (4) the need to fast-track the growth of the local economy, and, simultaneously, create employment opportunities; and (5) the need to transform the Municipal Administration into an efficient vehicle for delivery. (Source: 2011/12 revised SDF)
INTEGRATED DEVELOPMENT PLAN 2012-2017: SECTION B 28
JOHN TAOLO GAETSEWE DISTRICT MUNICIPALITY
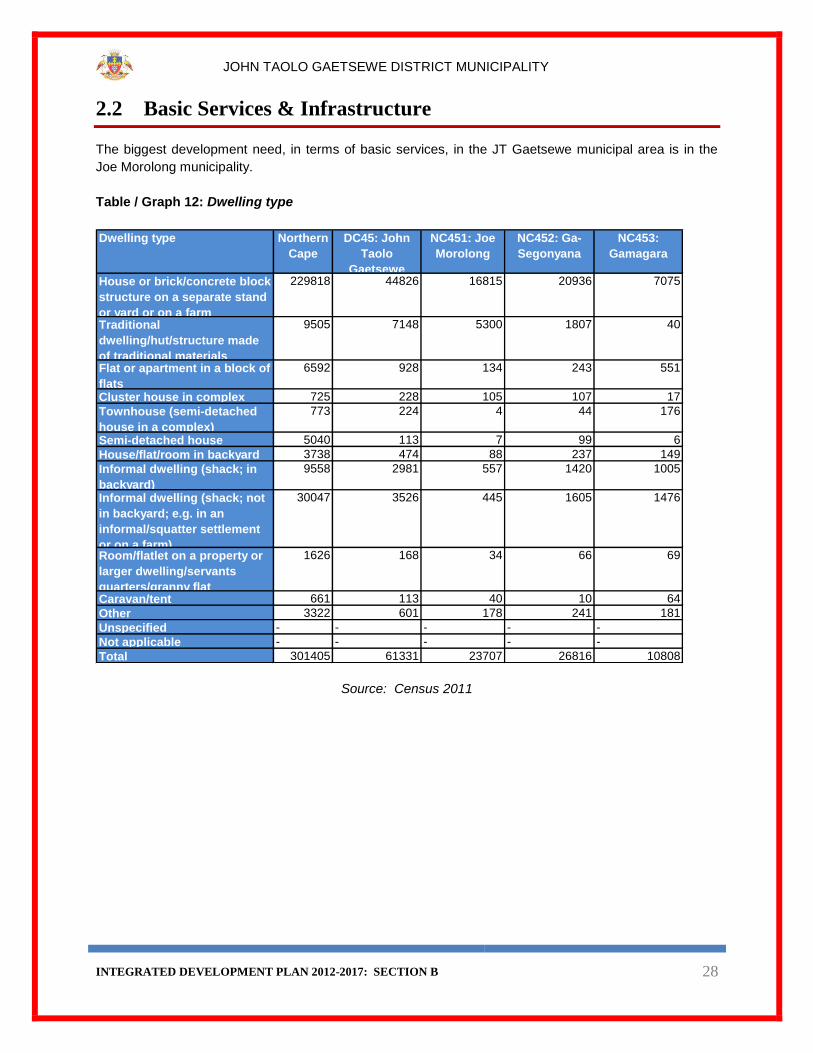
2.2 Basic Services & Infrastructure
The biggest development need, in terms of basic services, in the JT Gaetsewe municipal area is in the
Joe Morolong municipality.
Table / Graph 12: Dwelling type
Dwelling type Northern
Cape
DC45: John
Taolo
Gaetsewe
NC451: Joe
Morolong
NC452: Ga-
Segonyana
NC453:
Gamagara
House or brick/concrete block
structure on a separate stand
or yard or on a farm
229818 44826 16815 20936 7075
Traditional
dwelling/hut/structure made
of traditional materials
9505 7148 5300 1807 40
Flat or apartment in a block of
flats
6592 928 134 243 551
Cluster house in complex 725 228 105 107 17
Townhouse (semi-detached
house in a complex)
773 224 4 44 176
Semi-detached house 5040 113 7 99 6
House/flat/room in backyard 3738 474 88 237 149
Informal dwelling (shack; in
backyard)
9558 2981 557 1420 1005
Informal dwelling (shack; not
in backyard; e.g. in an
informal/squatter settlement
or on a farm)
30047 3526 445 1605 1476
Room/flatlet on a property or
larger dwelling/servants
quarters/granny flat
1626 168 34 66 69
Caravan/tent 661 113 40 10 64
Other 3322 601 178 241 181
Unspecified - - - - -
Not applicable - - - - -
Total 301405 61331 23707 26816 10808
Source: Census 2011
INTEGRATED DEVELOPMENT PLAN 2012-2017: SECTION B 29
JOHN TAOLO GAETSEWE DISTRICT MUNICIPALITY
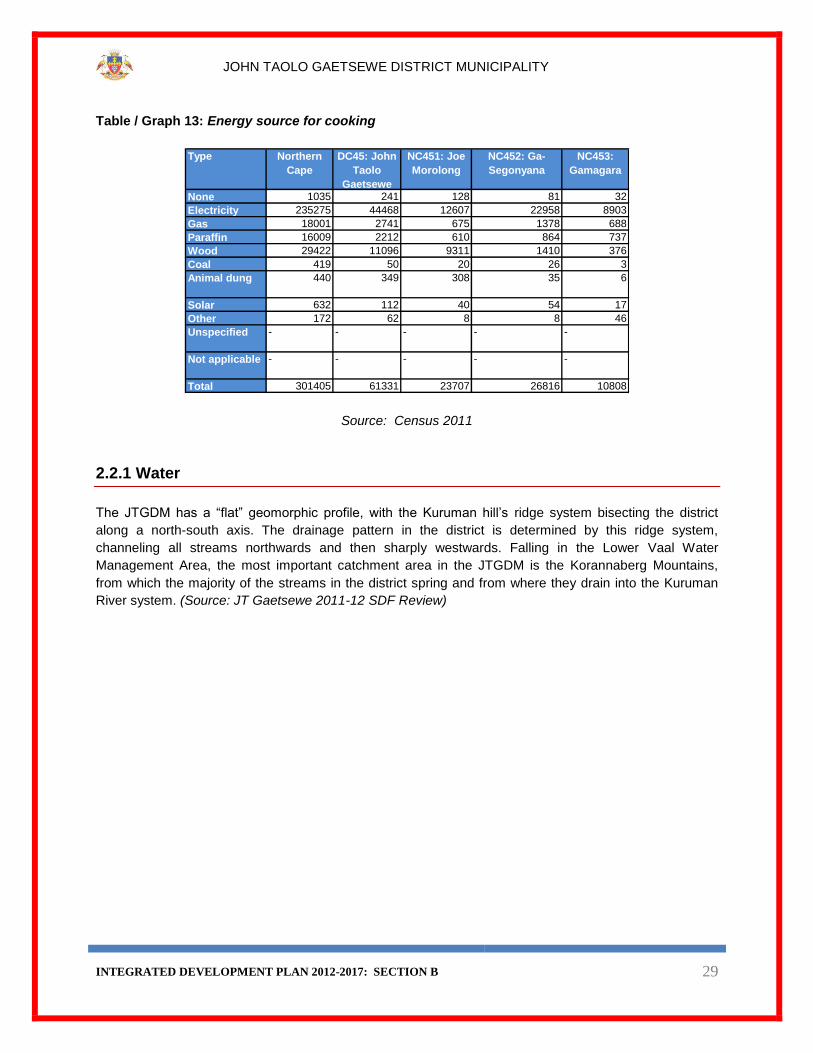
Table / Graph 13: Energy source for cooking
Type Northern
Cape
DC45: John
Taolo
Gaetsewe
NC451: Joe
Morolong
NC452: Ga-
Segonyana
NC453:
Gamagara
None 1035 241 128 81 32
Electricity 235275 44468 12607 22958 8903
Gas 18001 2741 675 1378 688
Paraffin 16009 2212 610 864 737
Wood 29422 11096 9311 1410 376
Coal 419 50 20 26 3
Animal dung 440 349 308 35 6
Solar 632 112 40 54 17
Other 172 62 8 8 46
Unspecified - - - - -
Not applicable - - - - -
Total 301405 61331 23707 26816 10808
Source: Census 2011
2.2.1 Water
The JTGDM has a “flat” geomorphic profile, with the Kuruman hill’s ridge system bisecting the district
along a north-south axis. The drainage pattern in the district is determined by this ridge system,
channeling all streams northwards and then sharply westwards. Falling in the Lower Vaal Water
Management Area, the most important catchment area in the JTGDM is the Korannaberg Mountains,
from which the majority of the streams in the district spring and from where they drain into the Kuruman
River system. (Source: JT Gaetsewe 2011-12 SDF Review)

INTEGRATED DEVELOPMENT PLAN 2012-2017: SECTION B 30
JOHN TAOLO GAETSEWE DISTRICT MUNICIPALITY
Table / Graph 14: Groundwater yields
(Source: JT Gaetsewe 2011-12 SDF Review)
Table / Graph 15: Access to water sources
Water source Northern
Cape
DC45: John
Taolo
Gaetsewe
NC451:
Joe
Morolon
NC452: Ga-
Segonyana
NC453:
Gamagara
Regional/local water scheme
(operated by municipality or
other water services provider)
250360 50483 17002 23534 9947
Borehole 24120 5170 3708 866 596
Spring 653 140 74 38 29
Rain water tank 930 270 139 111 21
Dam/pool/stagnant water 5060 815 600 202 13
River/stream 6444 597 381 207 9
Water vendor 1388 351 181 123 47
Water tanker 6698 2424 1380 986 57
Other 5753 1079 243 748 88
Not applicable - - - - -
Total 301405 61331 23707 26816 10808
Source: Census 2011

INTEGRATED DEVELOPMENT PLAN 2012-2017: SECTION B 31
JOHN TAOLO GAETSEWE DISTRICT MUNICIPALITY
Table / Graph 16: Percentage of people with access to piped water
Source: Census 2011

INTEGRATED DEVELOPMENT PLAN 2012-2017: SECTION B 32
JOHN TAOLO GAETSEWE DISTRICT MUNICIPALITY
Source: Department of Water Affairs
2.2.2 Sanitation
All of the municipalities within the area of jurisdiction of the JT Gaetsewe District Municipality (DC45) reported that they performed a sanitation function during the August 2008 capacity assessment review; in each case the function is rendered by the Technical Services (Basic Services and Infrastructure) Department, together with the Community Services Department in the case of the Ga-Segonyana Local Municipality (NC452), and consists in the main of the provision of waterborne and dry sanitation facilities. In this regard it is noted that two of the municipalities within the area of jurisdiction of the JT Gaetsewe District Municipality (DC45) have officials managing the sanitation function who each hold a national diploma in civil engineering qualification. (Source: 2008 Municipal Demarcation Board Municipal Capacity Assessment Report) Table / Graph 17: Household access to sanitation (toilet facilities)
Type Northern
Cape DC45: John
Taolo Gaetsewe
NC451: Joe Morolong
NC452: Ga-Segonyana
NC453: Gamagara
None 24218 5826 2432 3017 377
Flush toilet (connected to sewerage system)
181081 16098 1424 6287 8387

INTEGRATED DEVELOPMENT PLAN 2012-2017: SECTION B 33
JOHN TAOLO GAETSEWE DISTRICT MUNICIPALITY
Flush toilet (with septic tank) 17744 2129 308 739 1082
Chemical toilet 1748 738 399 262 76
Pit toilet with ventilation (VIP) 27563 13623 9563 3637 423
Pit toilet without ventilation 32376 20841 8691 11852 298
Bucket toilet 11950 993 469 463 61
Other 4726 1083 421 558 103
Unspecified - - - - -
Not applicable - - - - -
Total 301405 61331 23707 26816 10808
Source: Census 2011
Table / Graph 18: Household access to sanitation (toilet facilities)
Source: Census 2011
The maps below illustrate progress in terms of sanitation and the eradication of bucket systems respectively:
0
5
10
15
20
25
30
35
40
Percentage of households with access to sanitation
Total

INTEGRATED DEVELOPMENT PLAN 2012-2017: SECTION B 34
JOHN TAOLO GAETSEWE DISTRICT MUNICIPALITY
Source: Department of Water Affairs

INTEGRATED DEVELOPMENT PLAN 2012-2017: SECTION B 35
JOHN TAOLO GAETSEWE DISTRICT MUNICIPALITY
Source: Department of Water Affairs
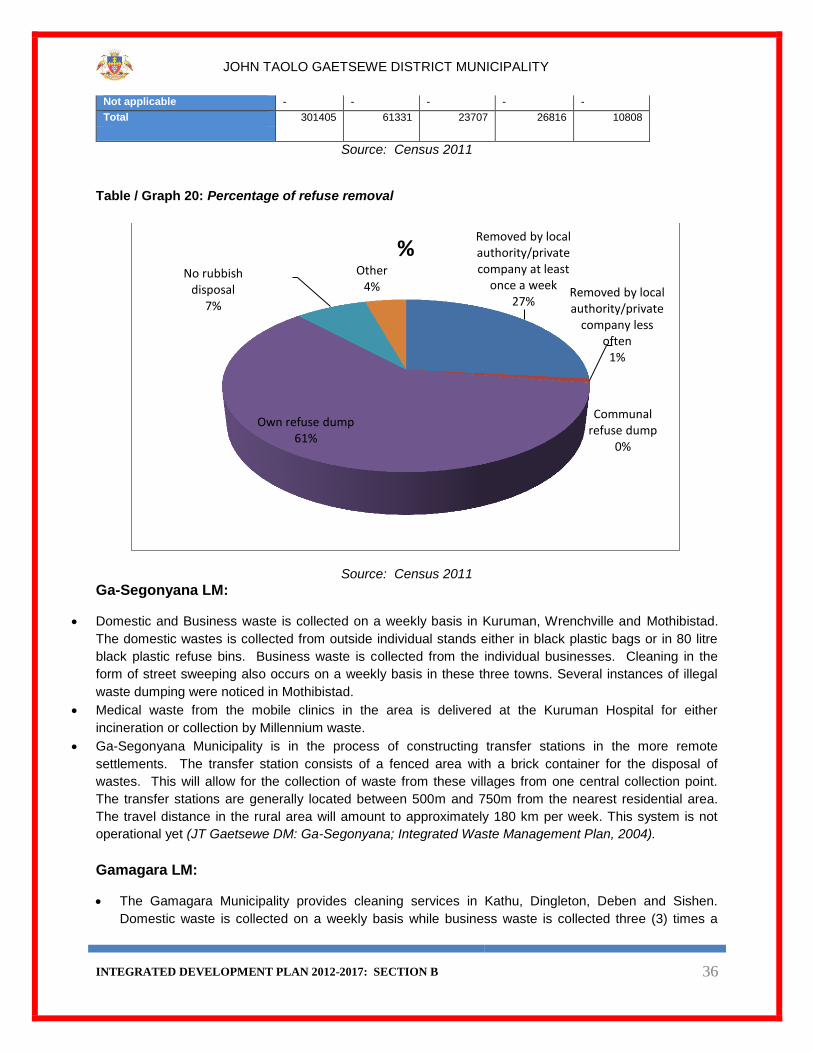
2.2.3 Refuse Removal
Refuse removal in the JT Gaetsewe district area is not currently on the level required by national and
provincial planning and development plans and strategies.
Table / Graph 19: Household level of refuse removal
Type Northern
Cape DC45: John
Taolo Gaetsewe
NC451: Joe Morolong
NC452: Ga-Segonyana
NC453: Gamagara
Removed by local authority/private company at least once a week
193020 15962 1455 4713 9793
Removed by local authority/private company less often
6694 487 126 120 241
Communal refuse dump 4970 1379 231 1064 83
Own refuse dump 74401 36391 18915 17131 345
No rubbish disposal 16357 4517 2707 1643 167
Other 5964 2595 273 2144 179
Unspecified - - - - -
INTEGRATED DEVELOPMENT PLAN 2012-2017: SECTION B 36
JOHN TAOLO GAETSEWE DISTRICT MUNICIPALITY
Not applicable - - - - -
Total 301405 61331 23707 26816 10808
Source: Census 2011
Table / Graph 20: Percentage of refuse removal
Source: Census 2011
Ga-Segonyana LM:
Domestic and Business waste is collected on a weekly basis in Kuruman, Wrenchville and Mothibistad.
The domestic wastes is collected from outside individual stands either in black plastic bags or in 80 litre
black plastic refuse bins. Business waste is collected from the individual businesses. Cleaning in the
form of street sweeping also occurs on a weekly basis in these three towns. Several instances of illegal
waste dumping were noticed in Mothibistad.
Medical waste from the mobile clinics in the area is delivered at the Kuruman Hospital for either
incineration or collection by Millennium waste.
Ga-Segonyana Municipality is in the process of constructing transfer stations in the more remote
settlements. The transfer station consists of a fenced area with a brick container for the disposal of
wastes. This will allow for the collection of waste from these villages from one central collection point.
The transfer stations are generally located between 500m and 750m from the nearest residential area.
The travel distance in the rural area will amount to approximately 180 km per week. This system is not
operational yet (JT Gaetsewe DM: Ga-Segonyana; Integrated Waste Management Plan, 2004).
Gamagara LM:
The Gamagara Municipality provides cleaning services in Kathu, Dingleton, Deben and Sishen.
Domestic waste is collected on a weekly basis while business waste is collected three (3) times a
Removed by local authority/private company at least
once a week 27%
Removed by local authority/private
company less often
1%
Communal refuse dump
0%
Own refuse dump 61%
No rubbish disposal
7%
Other 4%
%

INTEGRATED DEVELOPMENT PLAN 2012-2017: SECTION B 37
JOHN TAOLO GAETSEWE DISTRICT MUNICIPALITY
week. The domestic waste is collected from outside individual stands either in black plastic bags or in
85 litre black plastic refuse bins.
Business waste is collected from the individual businesses in 240 litre drums. Garden waste is
collected by prior arrangement and costs an additional fee.
Private persons can dispose domestic garden waste at the transfer station.
Oil reclamation also takes place at the transfer station by means of an oil collection point.
Cleaning in the form of street sweeping, on only the main streets, also occurs on a weekly basis. The
Municipal area has three dumping facilities (Kathu, Deben & Dingleton), one licensed and two not
licensed. The medical waste from the private clinic in the area is collected by Millennium Waste while
the state operated clinics remove their waste to the Kuruman Hospital (JT Gaetsewe DM: Gamagara;
Integrated Waste Management Plan, 2004)
Joe Morolong LM:
There are currently no records available for the amount of waste generated in the area. Due to the
rural and remote character of the area the expected waste generation is less than it would be in a
more urbanised area. The excessive distances to the nearest formal town and general shopping
facilities necessitates the recycling of general items such as plastic bags, cans and glass bottles. The
areas surrounding most of the settlements are therefore relatively litter free.
The Joe Morolong Municipality currently operates no waste collection services or cleansing services
in the area. The erf sizes in the area are generally big and therefore allow for the disposal of waste in
some part of the erf. The general method of disposal is a hole in the back yard. The majority of the
population in this area uses this technique. The area surrounding the mini disposal holes looked
relatively clean without any signs of scavenger animal presence. Most of the villages are however
located on groundwater reservoirs and the disposal of waste in this manner might be detrimental to
the quality of the water in the area (JT Gaetsewe DM: Joe Morolong; Integrated Waste Management
Plan, 2004).
Hotazel town falls under the jurisdiction of Joe Morolong Municipality. The Hotazel mine, as well as
the Wessels and Mamatwan mines, is ISO 9000 and ISO 14000 certified and operate under strictly
audited principles. Hazardous materials are stored in a concrete holding area with a bund wall and an
oil sump. These materials are collected by Waste Tech. Oils used in the workshops are collected in
clearly marked bins and collected by OILKOL. Medical refuse generated in the town is collected in
containers to be collected by SANUMED. Domestic and garden refuge is either collected from green
drums at each house or green skips located throughout the town. This refuge is then dumped at the
licensed facility just outside Hotazel. This facility is licenced to Hotazel Mine. Hazardous waste drop-
of facilities are also located at strategic places in the town to provide for oil and fluorescent bulb
disposal.
2.2.4 Electricity / Energy
With regards to the energy/fuel source for cooking, heating and lighting,
(1) 72.50% of households in the JTGDM use electricity for cooking;
(2) 54.34% use electricity for heating; and (3) 86.95% use electricity for lighting.
Table / Graph 21 below indicate the sources of electricity used for heating purposes and Table / Graph 22
indicate the energy sources used for cooking.
Table / Graph 21: Access to energy for heating purposes

INTEGRATED DEVELOPMENT PLAN 2012-2017: SECTION B 38
JOHN TAOLO GAETSEWE DISTRICT MUNICIPALITY
Type Northern
Cape
DC45: John
Taolo
Gaetsewe
NC451: Joe
Morolong
NC452: Ga-
Segonyana
NC453:
Gamagara
None 31755 6988 2089 3467 1432
Electricity 187404 33326 8474 16971 7880
Gas 6884 1092 213 580 299
Paraffin 11700 1098 203 631 264
Wood 60031 17949 12128 4954 868
Coal 1684 161 70 80 11
Candles (not a valid
option)
- - - - -
Animal dung 752 578 499 63 16
Solar 1184 134 29 67 39
Other 10 4 2 2 -
Source: Census 2011
Source: Census 2011
Table / Graph 23: Access to electricity
0%
73%
4%
4%
18%
0%
1%
0%
0%
1%
Table / Graph 22: Energy source for cooking
None
Electricity
Gas
Paraffin
Wood
Coal
Animal dung
Solar

INTEGRATED DEVELOPMENT PLAN 2012-2017: SECTION B 39
JOHN TAOLO GAETSEWE DISTRICT MUNICIPALITY
Source: Census 2011
Below is an illustration of Eskom infrastructure projects in the area
INTEGRATED DEVELOPMENT PLAN 2012-2017: SECTION B 40
JOHN TAOLO GAETSEWE DISTRICT MUNICIPALITY
Source: Eskom
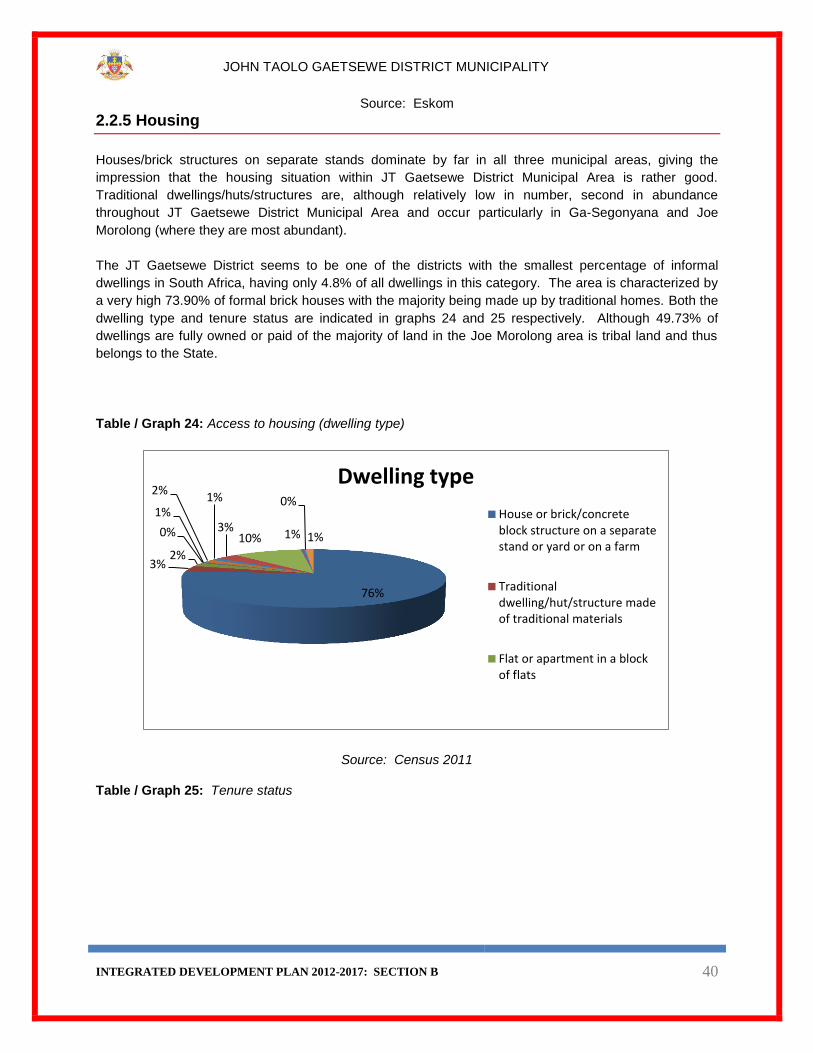
2.2.5 Housing
Houses/brick structures on separate stands dominate by far in all three municipal areas, giving the
impression that the housing situation within JT Gaetsewe District Municipal Area is rather good.
Traditional dwellings/huts/structures are, although relatively low in number, second in abundance
throughout JT Gaetsewe District Municipal Area and occur particularly in Ga-Segonyana and Joe
Morolong (where they are most abundant).
The JT Gaetsewe District seems to be one of the districts with the smallest percentage of informal
dwellings in South Africa, having only 4.8% of all dwellings in this category. The area is characterized by
a very high 73.90% of formal brick houses with the majority being made up by traditional homes. Both the
dwelling type and tenure status are indicated in graphs 24 and 25 respectively. Although 49.73% of
dwellings are fully owned or paid of the majority of land in the Joe Morolong area is tribal land and thus
belongs to the State.
Table / Graph 24: Access to housing (dwelling type)
Source: Census 2011
Table / Graph 25: Tenure status
76%
3% 2%
0%
1%
2% 1%
3% 10% 1%
0%
1%
Dwelling type
House or brick/concreteblock structure on a separatestand or yard or on a farm
Traditionaldwelling/hut/structure madeof traditional materials
Flat or apartment in a blockof flats
INTEGRATED DEVELOPMENT PLAN 2012-2017: SECTION B 41
JOHN TAOLO GAETSEWE DISTRICT MUNICIPALITY
Type Northern Cape DC45: John
Taolo
Gaetsewe
NC451: Joe
Morolong
NC452: Ga-
Segonyana
NC453:
Gamagara
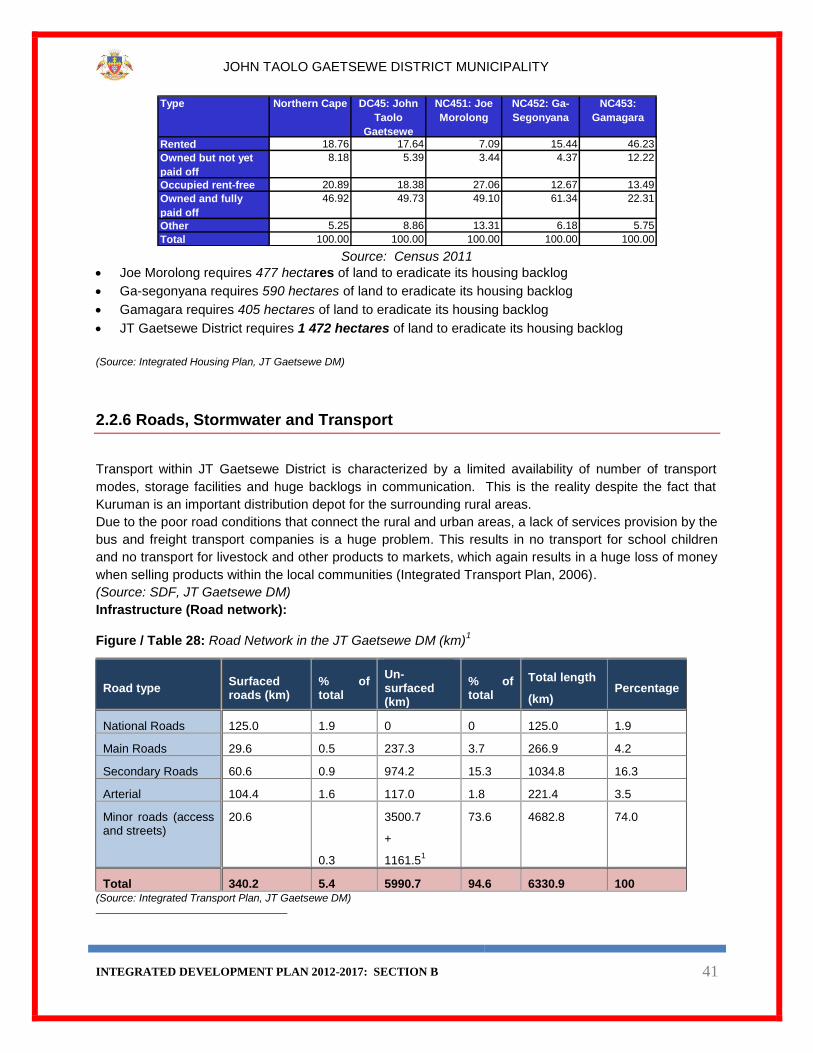
Rented 18.76 17.64 7.09 15.44 46.23
Owned but not yet
paid off
8.18 5.39 3.44 4.37 12.22
Occupied rent-free 20.89 18.38 27.06 12.67 13.49
Owned and fully
paid off
46.92 49.73 49.10 61.34 22.31
Other 5.25 8.86 13.31 6.18 5.75
Total 100.00 100.00 100.00 100.00 100.00 Source: Census 2011
Joe Morolong requires 477 hectares of land to eradicate its housing backlog
Ga-segonyana requires 590 hectares of land to eradicate its housing backlog
Gamagara requires 405 hectares of land to eradicate its housing backlog
JT Gaetsewe District requires 1 472 hectares of land to eradicate its housing backlog
(Source: Integrated Housing Plan, JT Gaetsewe DM)
2.2.6 Roads, Stormwater and Transport
Transport within JT Gaetsewe District is characterized by a limited availability of number of transport
modes, storage facilities and huge backlogs in communication. This is the reality despite the fact that
Kuruman is an important distribution depot for the surrounding rural areas.
Due to the poor road conditions that connect the rural and urban areas, a lack of services provision by the
bus and freight transport companies is a huge problem. This results in no transport for school children
and no transport for livestock and other products to markets, which again results in a huge loss of money
when selling products within the local communities (Integrated Transport Plan, 2006).
(Source: SDF, JT Gaetsewe DM)
Infrastructure (Road network):
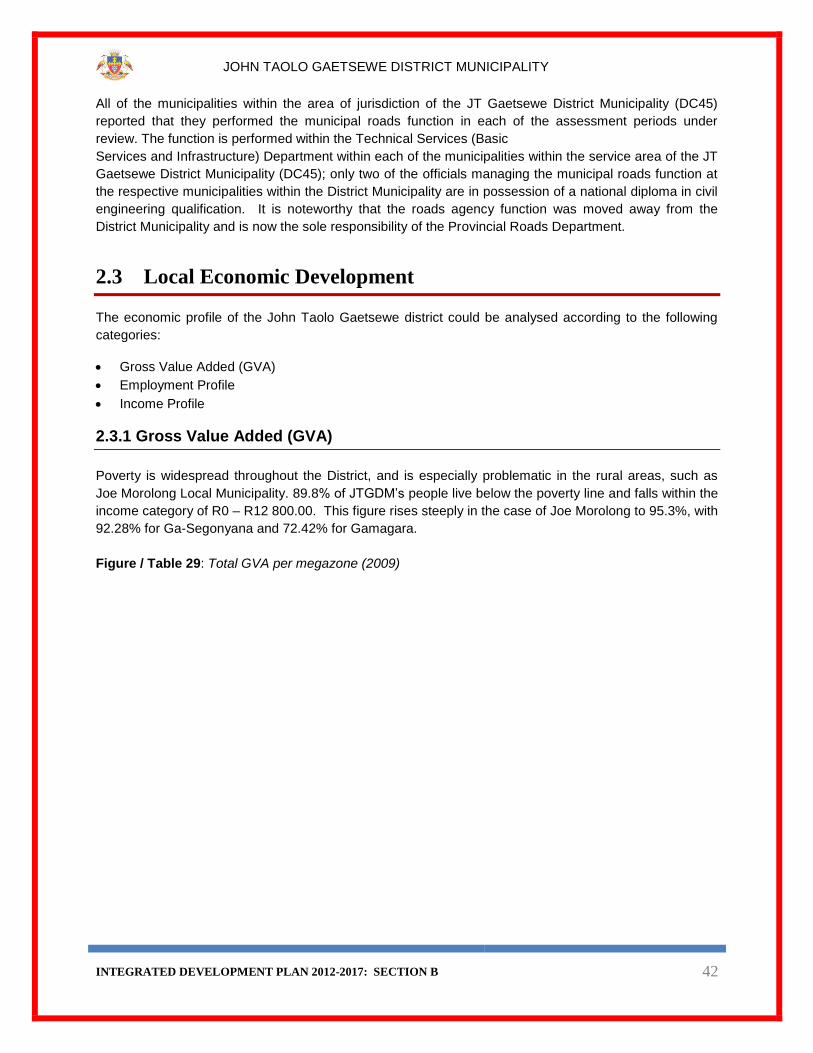
Figure / Table 28: Road Network in the JT Gaetsewe DM (km)1
Road type Surfaced roads (km)
% of total
Un-surfaced (km)
% of total
Total length
(km) Percentage
National Roads 125.0 1.9 0 0 125.0 1.9
Main Roads 29.6 0.5 237.3 3.7 266.9 4.2
Secondary Roads 60.6 0.9 974.2 15.3 1034.8 16.3
Arterial 104.4 1.6 117.0 1.8 221.4 3.5
Minor roads (access and streets)
20.6
0.3
3500.7
+
1161.51
73.6 4682.8 74.0
Total 340.2 5.4 5990.7 94.6 6330.9 100 (Source: Integrated Transport Plan, JT Gaetsewe DM)
INTEGRATED DEVELOPMENT PLAN 2012-2017: SECTION B 42
JOHN TAOLO GAETSEWE DISTRICT MUNICIPALITY
All of the municipalities within the area of jurisdiction of the JT Gaetsewe District Municipality (DC45)
reported that they performed the municipal roads function in each of the assessment periods under
review. The function is performed within the Technical Services (Basic
Services and Infrastructure) Department within each of the municipalities within the service area of the JT
Gaetsewe District Municipality (DC45); only two of the officials managing the municipal roads function at
the respective municipalities within the District Municipality are in possession of a national diploma in civil
engineering qualification. It is noteworthy that the roads agency function was moved away from the
District Municipality and is now the sole responsibility of the Provincial Roads Department.
2.3 Local Economic Development
The economic profile of the John Taolo Gaetsewe district could be analysed according to the following
categories:
Gross Value Added (GVA)
Employment Profile
Income Profile
2.3.1 Gross Value Added (GVA)
Poverty is widespread throughout the District, and is especially problematic in the rural areas, such as
Joe Morolong Local Municipality. 89.8% of JTGDM’s people live below the poverty line and falls within the
income category of R0 – R12 800.00. This figure rises steeply in the case of Joe Morolong to 95.3%, with
92.28% for Ga-Segonyana and 72.42% for Gamagara.
Figure / Table 29: Total GVA per megazone (2009)

INTEGRATED DEVELOPMENT PLAN 2012-2017: SECTION B 43
JOHN TAOLO GAETSEWE DISTRICT MUNICIPALITY
(Source: JT Gaetsewe 2011/12 SDF Review)
In 2007 the mining sector was the most significant contributor (49.6%) to the JTGDM’s GDP, followed by
the government services sector (12.6%), the trade sector (9.1%), and the finance and business services
(7.7%). The JTGDM is heavily dependent on mining.
2.3.2 Employment Profile
The unemployment rate is 8.24% for the District as a whole. 28.63% of people fall within the category of other or not economically active and 3.48% are discouraged work seekers. The employment rate is 19.50%. Figure / Table 30: Employment profile
Area Category
Employed Unemployed Discouraged work-seeker
Other not economically
active
Age less than 15 years
Not applicable
Total
Northern Cape 282791 106723 39913 306291 - 410143 1145861
DC45: John Taolo Gaetsewe
43825 18518 10967 64361 - 87127 224799
NC451: Joe Morolong 7828 4912 6200 29569 - 41022 89530
NC452: Ga-Segonyana 19940 10154 3895 25238 - 34426 93651
NC453: Gamagara 16058 3453 873 9553 - 11680 41617

INTEGRATED DEVELOPMENT PLAN 2012-2017: SECTION B 44
JOHN TAOLO GAETSEWE DISTRICT MUNICIPALITY
Source: Census 2011
2.3.3 Income Profile
The low employment level in the JTGDM is reflected in the income figures for the district, with 40.76% of
the population of the JTGDM receiving no income. In terms of the spatial distribution of those earning no
income in the district, 40.85% are resident in the Joe Morolong LM, 44.59% in Ga-Segonyana LM and
14.55% in Gamagara LM.
Table / Graph 31 Income categories
Category Northern
Cape
DC45: John
Taolo
Gaetsewe
NC451: Joe
Morolong
NC452: Ga-
Segonyana
NC453:
Gamagara
No income 446759 91618 37428 40856 13334
R 1 - R 400 211687 54726 30237 21626 2863
R 401 - R 800 39314 6435 2702 2557 1177
R 801 - R 1 600 181198 24659 11228 9561 3870
R 1 601 - R 3 200 61469 9429 1411 4345 3673
R 3 201 - R 6 400 44516 7624 1097 3873 2654
R 6 401 - R 12 800 40617 7395 1215 3612 2569
R 12 801 - R 25 600 24971 4438 772 1903 1763
R 25 601 - R 51 200 7085 1468 202 510 756
R 51 201 - R 102 400 1688 266 35 93 138
R 102 401 - R 204 800 984 135 23 52 60
R 204 801 or more 703 89 14 38 36
Unspecified 66693 13160 2540 3708 6912
Not applicable 18178 3356 625 917 1814
Total 1145861 224799 89530 93651 41617
Source: Census 2011
Table / Graph 32: Employment by sector

INTEGRATED DEVELOPMENT PLAN 2012-2017: SECTION B 45
JOHN TAOLO GAETSEWE DISTRICT MUNICIPALITY
2.4 Community and Social Facilities
During the August 2008 capacity assessment only the JT Gaetsewe District Municipality (DC45) and the
Ga-Segonyana Local Municipality (NC452) indicated that they performed the air pollution function; in both
cases the function was performed by officials within the Community Services Department under the
direction of an appropriately qualified manager. While the JT Gaetsewe District Municipality (DC45)
indicated that it performed the air pollution function in both the 2006 capacity assessment review and the
2008 capacity assessment review, the Ga-Segonyana Local Municipality (NC452) indicated that it
performed the function during the 2005 capacity assessment review and the 2008 capacity assessment
review. However, the Gamagara Local Municipality (NC453) indicated that it rendered the air pollution
function in each capacity assessment review from 2003 to 2007 but not in the August 2008 capacity
assessment review.
(Source: Municipal Demarcation Board Assessment of Capacity for the 2008/09 period, District Municipality Report and the SDF, JT
Gaetsewe)
15%
2%
3% 0%
80% 80%
Table / Graph 32: Employment by sector
In the formal sector
In the informal sector
Private household
Do not know
Not applicable

INTEGRATED DEVELOPMENT PLAN 2012-2017: SECTION B 46
JOHN TAOLO GAETSEWE DISTRICT MUNICIPALITY
Figure / Table 33: Health Facilities
(Source: JT Gaetsewe 2011/12 SDF Review)

INTEGRATED DEVELOPMENT PLAN 2012-2017: SECTION B 47
JOHN TAOLO GAETSEWE DISTRICT MUNICIPALITY
Figure / Table 34: Educational Facilities
(Source: JT Gaetsewe 2011/12 SDF Review)
With regard to education facilities in the JTGDM, data gathered in the “Kgalagadi District LED and SMME
Research Project” indicated that, in terms of the number and location of schools, there seems to be an
abundance of primary schools. The quality of education offered at these schools, especially in the Joe
Morolong LM with its large rural population, is however an area of concern.
The education profile of the JTGDM reflects the high levels of poverty and deprivation in especially the
Joe Morolong LM and the socio-economic differences amongst the three LM’s in the district. Both in the
case of the percentage of those that have no schooling in the JTGDM, and the percentage of those that
completed Grade 12, the district’s figures are worse than the national and the provincial figures. Whereas
the percentage of those that have no schooling in the district is 3.52%, compared to the provincial figure
of 3.24%. In the case of those that completed Grade 12, the provincial figure of 0.64% is lower than the
figure 0.87% for the District. As for higher education only 0.76% of the population has a qualification at
tertiary level, with Joe Morolong at 0.4% (Census 2011). The education levels in the District are clearly
reason for concern, as is illustrated in Tables / Graphs 35 and 36 below.

INTEGRATED DEVELOPMENT PLAN 2012-2017: SECTION B 48
JOHN TAOLO GAETSEWE DISTRICT MUNICIPALITY
Figure / Table 35: Educational Levels
Source: Census 2011
Table / Graph 36: Detail breakdown of educational levels in the District
Highest level Northern
Cape DC45: John Taolo
Gaetsewe
NC451: Joe
Morolong
NC452: Ga-Segonyana
NC453: Gamagara
Grade 0 37138 7913 3665 3165 1083
Grade 1 / Sub A 36782 8024 3888 3053 1082
Grade 2 / Sub B 36154 8487 4211 3284 993
Grade 3 / Std 1/ABET 1Kha Ri Gude;SANLI
41309 9528 4765 3722 1041
Grade 4 / Std 2 48378 11628 5878 4394 1356
Grade 5 / Std 3/ABET 2 50256 10612 4954 4100 1558
Grade 6 / Std 4 56565 11267 5107 4563 1597
Grade 7 / Std 5/ ABET 3 68244 11426 4724 4568 2135
Grade 8 / Std 6 / Form 1 87490 13231 4928 5990 2312
Grade 9 / Std 7 / Form 2/ ABET 4
69790 11226 4406 4986 1834
Grade 10 / Std 8 / Form 3 94841 16276 5109 7541 3626
Grade 11 / Std 9 / Form 4 66239 14173 4744 6695 2734
Grade 12 / Std 10 / Form 5 164511 27027 6523 13193 7311
NTC I / N1/ NIC/ V Level 2 1188 312 44 156 111
0
20
40
60
80
Northern CapeDC45: John
TaoloGaetsewe
NC451: JoeMorolong NC452: Ga-
Segonyana NC453:Gamagara
Figure / Graph 35: Educational levels
Grade 0 Grade 0-12 Higher diploma / degree

INTEGRATED DEVELOPMENT PLAN 2012-2017: SECTION B 49
JOHN TAOLO GAETSEWE DISTRICT MUNICIPALITY
Highest level Northern Cape
DC45: John Taolo
Gaetsewe
NC451: Joe
Morolong
NC452: Ga-Segonyana
NC453: Gamagara
NTC II / N2/ NIC/ V Level 3 1428 524 55 191 278
NTC III /N3/ NIC/ V Level 4 1978 654 85 232 336
N4 / NTC 4 2060 744 98 301 344
N5 /NTC 5 1527 502 39 219 243
N6 / NTC 6 2578 908 95 374 439
Certificate with less than Grade 12 / Std 10
1108 239 44 145 50
Diploma with less than Grade 12 / Std 10
1316 181 43 77 61
Certificate with Grade 12 / Std 10
7347 1964 299 1169 496
Diploma with Grade 12 / Std 10 11085 1790 405 929 455
Higher Diploma 9812 1717 359 965 393
Post Higher Diploma Masters; Doctoral Diploma
1581 233 72 106 54
Bachelor’s Degree 6469 965 190 498 278
Bachelor’s Degree and Post graduate Diploma
2275 308 53 145 110
Honours degree 2947 481 97 267 117
Higher Degree Masters / PhD 1566 205 43 91 71
Other 1798 459 55 319 85
No schooling 90282 20789 11334 6165 3290
Unspecified - - - - -
Not applicable 139817 31006 13215 12048 5743
Total 1145861 224799 89530 93651 41617
Source: Census 2011
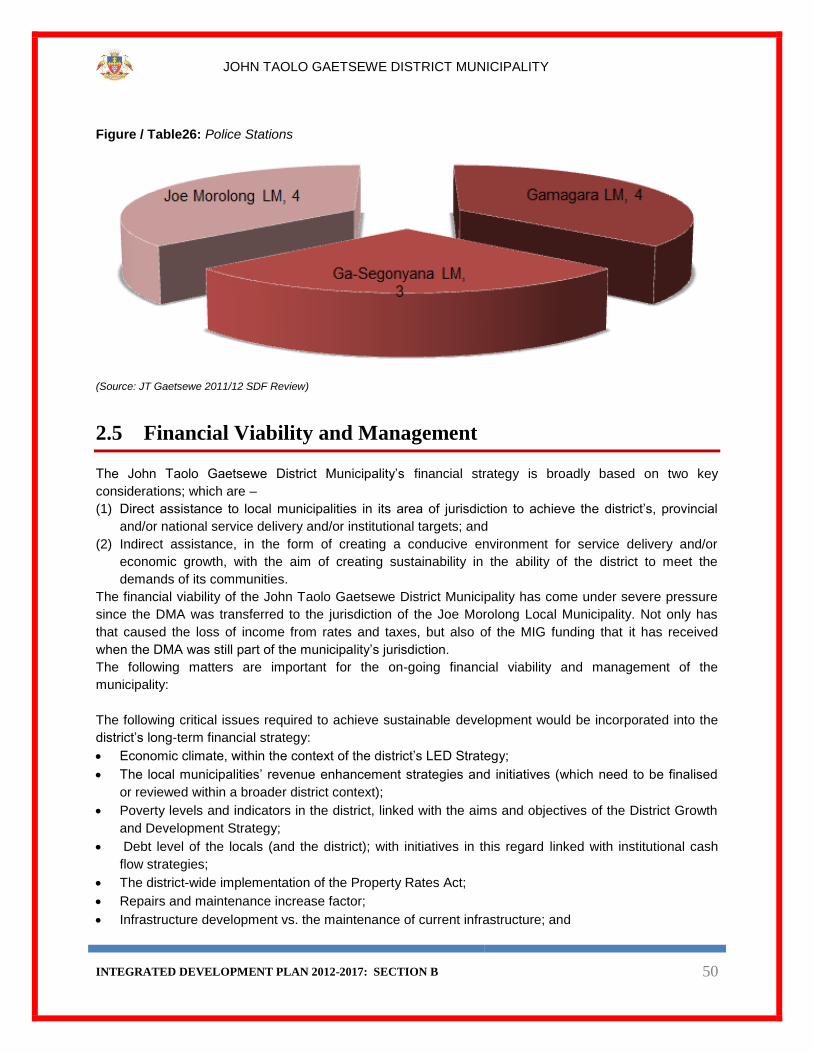
Regarding safety and security services, there are 11 Police Stations/Precincts in the JTGDM, four of
which are located in the Gamagara LM, three in the Ga-Segonyana LM and four in the Joe Morolong LM .
According to the statistics received from eight of the Police Stations, “Assault with intent to inflict grievous
bodily harm” and “Common assault”, are the most common crimes in all three the LM’s in the district, with
the highest concentrations in Kuruman (Ga-Segonyana LM) and Olifantshoek (Gamagara LM). Serious
crimes, such a “Murder” and “Attempted murder” are most prominent in Kuruman and Olifantshoek,
although the levels are relative to the national figures, low. “Rape” is most common in Kuruman,
Olifantshoek and Tsineng. However, the number of reported rapes is relatively low (e.g. only 14 cases
were reported between April and December 2009 in Kuruman). “Malicious damage to property” is very
prevalent in Kuruman, in comparison to other areas (e.g. 154 cases were reported in Kuruman in 2009 in
comparison to the 32 reported in Olifantshoek). This same trend is visible with regard to “Burglary at
residential premises” and “Burglary at Business premises”. “Theft out of or from motor vehicles” is more
prominent in the more urbanised areas in the JTGDM, with 432 instances of this type of theft reported in
Kuruman in 2009. (Obtained from the 2011/12 revised SDF)
INTEGRATED DEVELOPMENT PLAN 2012-2017: SECTION B 50
JOHN TAOLO GAETSEWE DISTRICT MUNICIPALITY
Figure / Table26: Police Stations
(Source: JT Gaetsewe 2011/12 SDF Review)
2.5 Financial Viability and Management
The John Taolo Gaetsewe District Municipality’s financial strategy is broadly based on two key
considerations; which are –
(1) Direct assistance to local municipalities in its area of jurisdiction to achieve the district’s, provincial
and/or national service delivery and/or institutional targets; and
(2) Indirect assistance, in the form of creating a conducive environment for service delivery and/or
economic growth, with the aim of creating sustainability in the ability of the district to meet the
demands of its communities.
The financial viability of the John Taolo Gaetsewe District Municipality has come under severe pressure
since the DMA was transferred to the jurisdiction of the Joe Morolong Local Municipality. Not only has
that caused the loss of income from rates and taxes, but also of the MIG funding that it has received
when the DMA was still part of the municipality’s jurisdiction.
The following matters are important for the on-going financial viability and management of the
municipality:
The following critical issues required to achieve sustainable development would be incorporated into the
district’s long-term financial strategy:
Economic climate, within the context of the district’s LED Strategy;
The local municipalities’ revenue enhancement strategies and initiatives (which need to be finalised
or reviewed within a broader district context);
Poverty levels and indicators in the district, linked with the aims and objectives of the District Growth
and Development Strategy;
Debt level of the locals (and the district); with initiatives in this regard linked with institutional cash
flow strategies;
The district-wide implementation of the Property Rates Act;
Repairs and maintenance increase factor;
Infrastructure development vs. the maintenance of current infrastructure; and
INTEGRATED DEVELOPMENT PLAN 2012-2017: SECTION B 51
JOHN TAOLO GAETSEWE DISTRICT MUNICIPALITY
Service delivery cost increases and analysis of per capita service costs.
Based on an analysis of the above-mentioned investment obligations, the district has decided to
incorporate the following key issues in its long-term financial planning framework:
(1) Assist the local municipalities in its area of jurisdiction to determine the long-term (10-15 year)
investment requirements. This will be done within the context of current development patterns and
concerns, and within the framework of the district’s SDF.
(2) Assist the local municipalities to strengthen their internal (institutional) financial management capacity
by finalising and regularly updating its financial policies, systems and structures. This will be done in
collaboration with key national and provincial stakeholders, such as national and provincial
Treasuries, the Office of the Auditor-General and appropriate funding agencies.
(3) Maintain and further strengthen the district municipality’s own financial management structures and
capacity.
2.6 Institutional Transformation and Development
There is a noticeable improvement in the appointment of people in key positions in the Municipality. All
the senior management positions were filled in the past year. Issues that are currently priorities in the
institutional development and management of the municipalities are as follows:
To ensure that the management framework for HR is updated and relevant
To ensure that adequate opportunities for the development of employees and councillors exist to
ensure an effective organization
All permanent employees and councillors completed skills audit questionnaires
To develop individual learning plans
To comply with the Skills Development Act (Act 97/1998)
Equity Plans in place and implemented and reports submitted to Department of Labour
Organisational structure reviewed and aligned with IDP and budget
Filling of all critical positions
To promote and maintain sound labour relations in the JT Gaetsewe DM, as a caring employer
It is the policy of the JT Gaetsewe District Municipality to annually review its staff establishment to
make sure that it reflects the requirements of the IDP. The latest reviewed organisational structure, on
a macro organisational level, makes provision for a political structure that focuses on the positions of
the Speaker, the Executive Mayor and the Mayoral Committees.
2.7 Good Governance and Public Participation
It is a key aim of the JT Gaetsewe DM to promote the effective participation of the communities of the JT
Gaetsewe district in the decisions and affairs of Council. Other priorities flowing from this aim are as
follows:
To improve the functionality and stability of the Council and ensure effective exercise of its oversight
role
To maintain stability in the Municipality
To establish and maintain sound cooperative governance in the District
To ensure effective integrated development planning and performance management
INTEGRATED DEVELOPMENT PLAN 2012-2017: SECTION B 52
JOHN TAOLO GAETSEWE DISTRICT MUNICIPALITY
To ensure effective risk management in the district
To deal with fraud and corruption and promote ethical behavior in the Municipality
To improve and maintain the network and IT systems
Attached hereto as Annexure A is an additional overview of the District as issued by the Northern Cape
Provincial Treasury.
ANNEXURE A
John Taolo Gaetsewe District Municipality and Local Municipalities
6.1 John Taolo Gaetsewe District Municipality
6.1.1 Demographic Profile
6.1.1.1 Population Profile
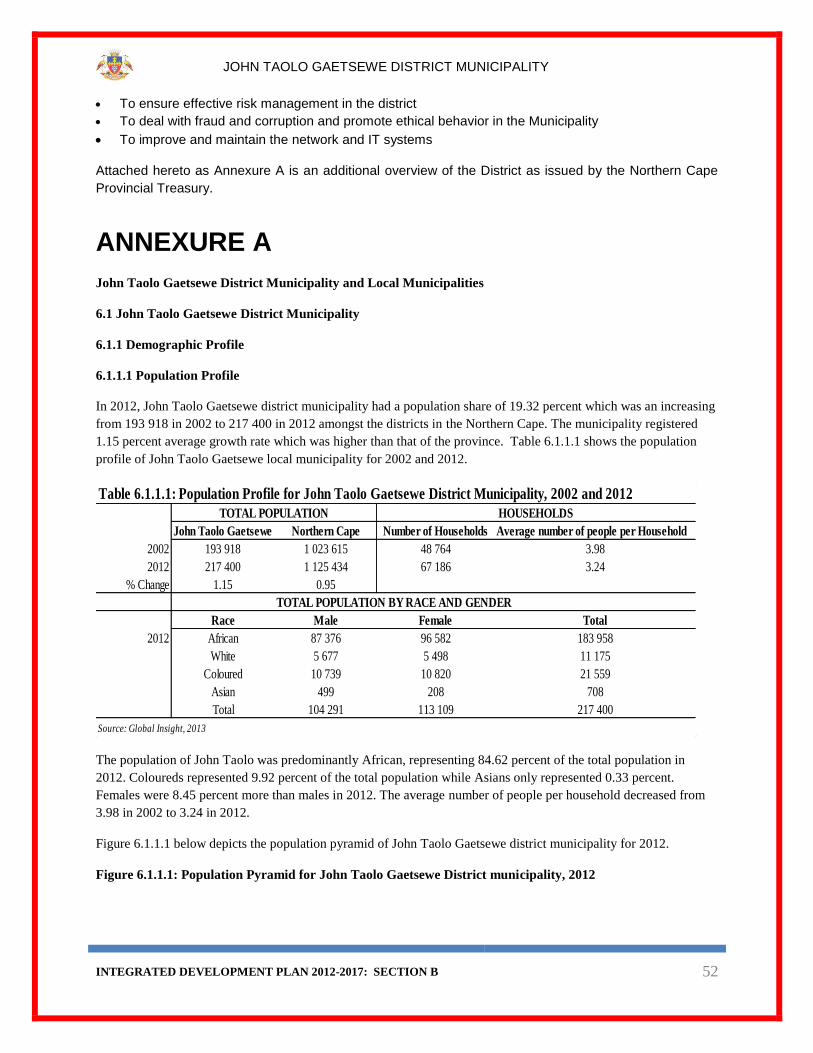
In 2012, John Taolo Gaetsewe district municipality had a population share of 19.32 percent which was an increasing
from 193 918 in 2002 to 217 400 in 2012 amongst the districts in the Northern Cape. The municipality registered
1.15 percent average growth rate which was higher than that of the province. Table 6.1.1.1 shows the population
profile of John Taolo Gaetsewe local municipality for 2002 and 2012.
The population of John Taolo was predominantly African, representing 84.62 percent of the total population in
2012. Coloureds represented 9.92 percent of the total population while Asians only represented 0.33 percent.
Females were 8.45 percent more than males in 2012. The average number of people per household decreased from
3.98 in 2002 to 3.24 in 2012.
Figure 6.1.1.1 below depicts the population pyramid of John Taolo Gaetsewe district municipality for 2012.
Figure 6.1.1.1: Population Pyramid for John Taolo Gaetsewe District municipality, 2012
Table 6.1.1.1: Population Profile for John Taolo Gaetsewe District Municipality, 2002 and 2012
John Taolo Gaetsewe Northern Cape Number of Households Average number of people per Household
2002 193 918 1 023 615 48 764 3.98
2012 217 400 1 125 434 67 186 3.24
% Change 1.15 0.95
TOTAL POPULATION BY RACE AND GENDER
Race Male Female Total
2012 African 87 376 96 582 183 958
White 5 677 5 498 11 175
Coloured 10 739 10 820 21 559
Asian 499 208 708
Total 104 291 113 109 217 400
Source: Global Insight, 2013
TOTAL POPULATION HOUSEHOLDS

INTEGRATED DEVELOPMENT PLAN 2012-2017: SECTION B 53
JOHN TAOLO GAETSEWE DISTRICT MUNICIPALITY
Source: Global Insight, 2013
The above pyramid is expansive indicates the large number of youth in the municipality. The age cohort with the
largest population size is 00-04 while the age cohort with the smallest population size is 70-74. The pyramid skewed
to the right which shows that there are more females than males in this district municipality.
Figure 6.1.1.2 below shows the population growth rate of John Taolo Gaetsewe for the period 2002 to 2012.
Figure 6.6.1.2: Population Growth Rate for John Taolo Gaetsewe, 2002-2012
20 000 15 000 10 000 5 000 0 5 000 10 000 15 000 20 000
00-04
05-09
10-14
15-19
20-24
25-29
30-34
35-39
40-44
45-49
50-54
55-59
60-64
65-69
70-74
75+
Population Pyramid for John Taolo Gaetsewe District Municipality, 2012
Male Female

INTEGRATED DEVELOPMENT PLAN 2012-2017: SECTION B 54
JOHN TAOLO GAETSEWE DISTRICT MUNICIPALITY
Source: Global Insight, 2013
John Taolo recorded a negative population growth rate between 2002 and 2005. The figure above shows an
increasing trend which started with a negative growth rate of 1.5 percent in 2002 to 2.6 percent in 2012. The average
population growth rate was 1.15 percent for the period under study.
6.1.1.2 Population Health
Figure 6.1.1.3 below illustrates the percentage of patients receiving treatment in John Taolo Gaetsewe District
Municipality for the 2012/13 financial year.
Figure 6.1.1.3: New Patients receiving treatment, 2012/13.
2002 2003 2004 2005 2006 2007 2008 2009 2010 2011 2012
Population Growth Rate -1.5% -1.2% -0.9% -0.5% 0.1% 0.9% 2.5% 2.6% 2.7% 2.7% 2.6%
-2.0%
-1.5%
-1.0%
-0.5%
0.0%
0.5%
1.0%
1.5%
2.0%
2.5%
3.0%
Population Growth Rate forJohn Taolo Gaetsewe, 2002-2012

INTEGRATED DEVELOPMENT PLAN 2012-2017: SECTION B 55
JOHN TAOLO GAETSEWE DISTRICT MUNICIPALITY
Source: Department of Health, 2013
The majority of new patients on treatment were treated for Hypertension and HIV, with 40 percent and 35 percent
respectively, while only 6 percent was treated for Diabetes.
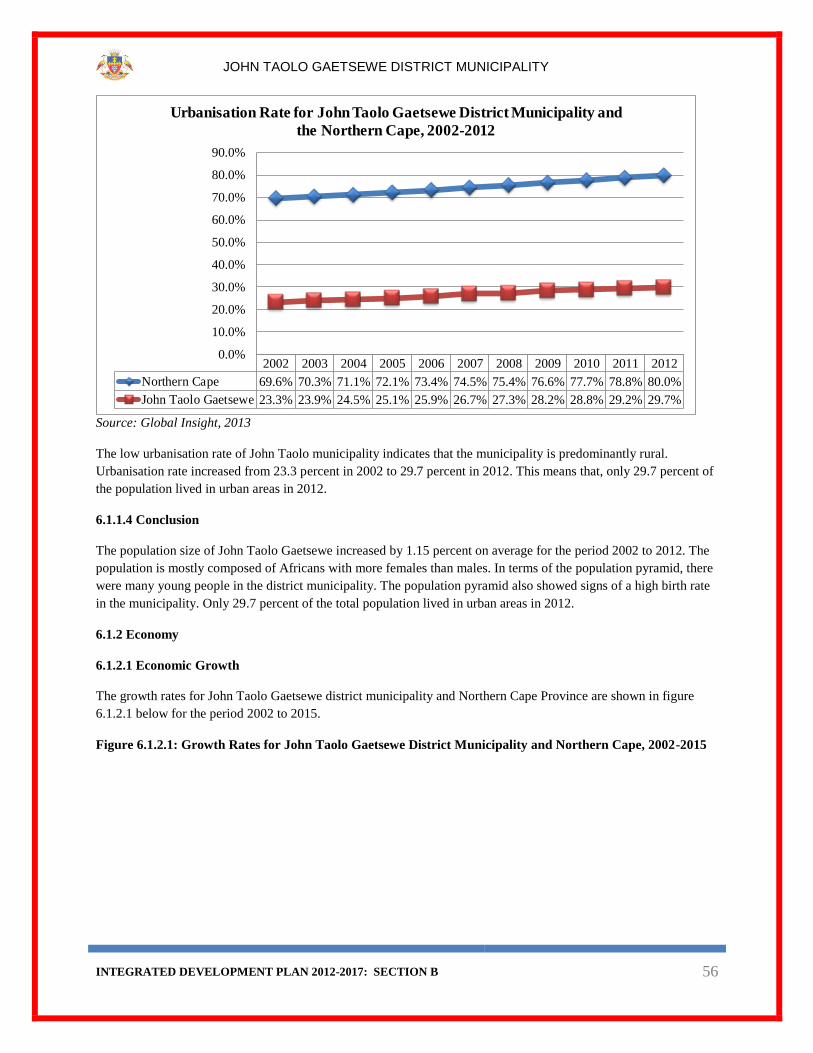
6.1.1.3 Urbanisation
Figure 6.1.1.4 below shows the urbanisation rate for John Taolo Gaetsewe District Municipality compared to that of
the Northern Cape for the period 2002-2012
Figure 6.1.1.4: Urbanisation Rate for John Taolo Gaetsewe District Municipality and the Northern Cape,
2002-2012
TB
19%
Hypertension
40%
HIV
35%
Diabetes
6%
New Patient receiving treatment, 2012/13
INTEGRATED DEVELOPMENT PLAN 2012-2017: SECTION B 56
JOHN TAOLO GAETSEWE DISTRICT MUNICIPALITY
Source: Global Insight, 2013
The low urbanisation rate of John Taolo municipality indicates that the municipality is predominantly rural.
Urbanisation rate increased from 23.3 percent in 2002 to 29.7 percent in 2012. This means that, only 29.7 percent of
the population lived in urban areas in 2012.
6.1.1.4 Conclusion
The population size of John Taolo Gaetsewe increased by 1.15 percent on average for the period 2002 to 2012. The
population is mostly composed of Africans with more females than males. In terms of the population pyramid, there
were many young people in the district municipality. The population pyramid also showed signs of a high birth rate
in the municipality. Only 29.7 percent of the total population lived in urban areas in 2012.
6.1.2 Economy
6.1.2.1 Economic Growth
The growth rates for John Taolo Gaetsewe district municipality and Northern Cape Province are shown in figure
6.1.2.1 below for the period 2002 to 2015.
Figure 6.1.2.1: Growth Rates for John Taolo Gaetsewe District Municipality and Northern Cape, 2002-2015
2002 2003 2004 2005 2006 2007 2008 2009 2010 2011 2012
Northern Cape 69.6% 70.3% 71.1% 72.1% 73.4% 74.5% 75.4% 76.6% 77.7% 78.8% 80.0%
John Taolo Gaetsewe 23.3% 23.9% 24.5% 25.1% 25.9% 26.7% 27.3% 28.2% 28.8% 29.2% 29.7%
0.0%
10.0%
20.0%
30.0%
40.0%
50.0%
60.0%
70.0%
80.0%
90.0%
Urbanisation Rate for John Taolo Gaetsewe District Municipality and
the Northern Cape, 2002-2012

INTEGRATED DEVELOPMENT PLAN 2012-2017: SECTION B 57
JOHN TAOLO GAETSEWE DISTRICT MUNICIPALITY
Source: Global Insight, 2013
The provincial and district economies averaged 2.17 and 3.28 percent respectively for the period 2002 to 2012. They
are both expected to grow between 0.9 and 4 percent in the outer years mainly due to the increasing mining activities
in the area. The John Taolo Gaetsewe district recorded the highest growth in 2006 at 8 percent and the least in 2007
at a negative 3.1 percent.
6.1.2.2 Sector Contribution
The sector and respective industry contributions for John Taolo Gaetsewe district municipality is presented in table
5.2.2.1 below for the period 2002 to 2012.
The table shows that the primary sector followed by tertiary contributed the most to the economy at 67.65 and 28.67
percent respectively while the secondary contributed the least at 3.69 percent. The highest contributions in these
sectors were as a result of activities in the mining, community services and the manufacturing industries. The
finance industry had the highest year-on-year growth at 15.73 percent while the manufacturing although one the
highest contributors, had the least at 6.35 percent.
6.1.2.3 Trade
Figure 6.1.2.2 below shows the value of imports and exports for John Taolo Gaetsewe district municipality for the
period 2002 to 2012.
Figure 6.1.2.2: Value of Exports and Imports for John Taolo Gaetsewe District Municipality, 2001-2012
2002 2003 2004 2005 2006 2007 2008 2009 2010 2011 2012 2013 2014 2015
John Taolo Gaetsewe 7.0 0.7 0.5 0.2 8.0 -3.1 7.6 5.8 4.2 3.9 1.3 4.0 3.7 3.9
Northern Cape 2.8 2.4 2.5 3.6 4.2 3.9 2.1 -3.3 2.6 2.2 0.9 3.2 3.2 3.6
-4.0
-2.0
0.0
2.0
4.0
6.0
8.0
10.0
Per
cen
tage
Growth Rates for John Taolo Gaetsewe District Municipality and Northern
Cape, 2002-2015
Table 5.2.2.1: Sector Contribution for John Taolo Gaetsewe District Municipality, 2002-2012
Sectors (R1000) 2002 2003 2004 2005 2006 2007 2008 2009 2010 2011 2012 % Change
Primary 3,020,447 2,526,266 2,689,001 3,018,503 3,891,371 4,004,097 5,544,269 6,596,376 7,203,457 8,134,139 8,382,495 10.75
Agriculture 173,530 213,615 225,322 200,850 245,019 303,523 347,635 362,858 363,624 354,386 396,231 8.61
Mining 2,846,918 2,312,651 2,463,680 2,817,653 3,646,353 3,700,573 5,196,634 6,233,518 6,839,832 7,779,753 7,986,264 10.87
Secondary 163,347 158,850 174,370 185,057 218,311 230,954 314,499 378,275 360,809 396,517 419,072 9.88
Manufacturing 73,737 79,273 82,553 91,564 98,005 91,939 138,847 115,609 119,639 122,274 136,434 6.35
Electricity 38,984 36,185 38,953 35,017 43,762 39,631 55,852 104,494 97,286 119,646 123,259 12.20
Construction 50,626 43,392 52,865 58,476 76,544 99,384 119,800 158,173 143,885 154,597 159,378 12.15
Tertiary 1,144,217 1,251,029 1,334,857 1,563,106 1,753,689 2,055,000 2,310,116 2,496,245 2,763,061 3,168,955 3,470,539 11.73
Trade 228,168 267,284 297,087 332,369 407,997 468,629 475,590 522,940 566,413 630,263 690,917 11.72
Transport 125,710 126,837 131,631 153,325 175,096 198,009 214,312 220,355 228,951 298,036 324,393 9.94
Finance 174,139 168,341 193,693 240,383 324,249 424,288 520,909 472,794 549,283 652,526 750,581 15.73
Community services 616,200 688,568 712,445 837,029 846,347 964,074 1,099,305 1,280,156 1,418,414 1,588,131 1,704,649 10.71
Total Industries 4,328,012 3,936,146 4,198,229 4,766,666 5,863,371 6,290,051 8,168,883 9,470,896 10,327,327 11,699,611 12,272,105 10.98
Taxes less Subsidies on products 251,600 304,433 368,383 413,254 515,971 719,218 762,379 859,496 948,228 1,107,636 1,174,662 16.66
Total (Gross Domestic Product - GDP) 4,579,612 4,240,578 4,566,612 5,179,920 6,379,342 7,009,269 8,931,262 10,330,392 11,275,555 12,807,247 13,446,767 11.37Source: Global Insight, 2013

INTEGRATED DEVELOPMENT PLAN 2012-2017: SECTION B 58
JOHN TAOLO GAETSEWE DISTRICT MUNICIPALITY
Source: Global Insight, 2013
Evident from the figure above, the value of exports were higher than those of imports for the most part of the period,
however imports increased sharply from R719 thousand in 2010 to R3.7 million in 2011 nevertheless the trade
balance remained favourable.
6.1.2.4 Local Economic Development
The municipality has identified in their IDP that the communities of the district are not benefitting enough from
economic activities such as mining, procurements, etc. and a coordinated approach with mines is planned to deal
with the matter. Furthermore, there is too much emphasis on the mining sector, therefore economic planning in the
district must be more balanced. There is an opportunity in the sand mining that is not adequately pursued; however
this will be explored in the current financial year.
6.1.2.5 Natural Resources
6.1.2.5.1 Land
John Taolo Gaetsewe is the second smallest district in the Northern Cape, occupying only 6 percent of the Province.
6.1.2.5.2 Tourism
Amongst the projects identified in the area, as well as SMME business opportunities that will boost the economy
and bring in more investments are the increase in adventure and eco-tourism activities & facilities, desert astronomy
and cultural villages and events.
6.1.2.6 Economic Infrastructure
Kuruman which is the main town in the region is an important distribution depot for the surrounding rural and urban
areas and therefore a well maintained road infrastructure is necessary. There is currently work in progress with
regards to improving the current roads infrastructure. Several infrastructure projects such as Molahari, Bosra
Infrastructure Development, Metsimantsi infrastructure, etc. are envisaged and require external funding. The district
will also focus on the water and fencing infrastructure for livestock production in the current financial year.
6.1.2.7 Conclusion
2002 2003 2004 2005 2006 2007 2008 2009 2010 2011 2012
Imports (R1000) 1,408 291 423 382 786 1,362 1,215 922 719 3,771 753
Exports (R1000) 2,602 1,794 725 1,678 1,674 1,865 1,724 295 1,304 364 634
0
500
1,000
1,500
2,000
2,500
3,000
3,500
4,000
Th
ou
san
ds
Value of Exports and Imports for John Taolo Gaetsewe District Municipality, 2002-2012

INTEGRATED DEVELOPMENT PLAN 2012-2017: SECTION B 59
JOHN TAOLO GAETSEWE DISTRICT MUNICIPALITY
Even though the province and the country experienced a negative growth in 2009, the district’s economy remained
resilient with a positive growth mainly due to the mining industry. The district municipality recorded a favourable
trade balance for the period under review. The municipality will engage in talks with the mines to see to it that the
community also benefit in the industry. Funding in infrastructure remains a challenge, however several projects are
envisaged in the current financial year.
6.1.3 Labour Analysis
6.1.3.1 Labour Status
The labour characteristics for John Taolo Gaetsewe district municipality for 2002 and 2012 is shown in table 6.1.3.1
below. The number of employed people experienced a significant increase between 2002 and 2012 by 11 071 while
those unemployed increase by 16 for the same period.
The economically active formed 39 percent of the working age 15-64 population in 2012 while not economically
active was 61 percent in the same year. The working age 15-64 population in 2002 was at 113 602 while in 2012
was at 131 311.
Table 6.1.3.2 below shows employment and unemployment by race and gender for John Taolo Gaetsewe district
municipality for 2002 and 2012.
The number of employed Africans and Whites increased by 6 950 and 2 918 respectively between 2002 and 2012.
The number of unemployed Coloureds increased from 1 986 in 2002 to 2 502 in 2012. Asians were the least
employed while Africans were the most employed in 2002 and 2012. For the period under study males were the
most employed while females were the least.
The electricity industry employed the least workers in 2002 and 2012 at 0.5 and 0.3 percent respectively as shown in
table 6.1.3.3 below.
Table 6.1.3.1: Labour Characteristics for John Taolo Gaetsewe District Municipality, 2002 and 2012
Number % Rate Number % Rate
Employed 24,794 61.7 35,865 70.0
Unemployed 15,388 38.3 15,404 30.0
Economically active 40,182 100.0 51,269 100.0
Economically Active 40,182 35.4 51,269 39.0
Not Economically Active 73,419 64.6 80,042 61.0
Working Age 15-64 Population 113,602 100.0 131,311 100.0
Source: Global Insight, 2013
2002 2012
Table 6.1.3.2: Employment and Unemployment by Race and Gender for John Taolo Gaetsewe District Municipality, 2002 and 2012
2002 2012 2002 2012
African 19,098 26,048 13,186 12,706
White 3,497 6,415 205 186
Coloured 2,147 3,213 1,986 2,502
Asian 53 188 12 11
Gender
Male 14,696 22,248 8,878 8,980
Female 10,098 13,617 6,510 6,424
Source: Global Insight, 2013
Race
Employment Unemployment

INTEGRATED DEVELOPMENT PLAN 2012-2017: SECTION B 60
JOHN TAOLO GAETSEWE DISTRICT MUNICIPALITY
In 2002 community services employed most workers at 24.4 percent while in 2012 it was mining at 41.1 percent.
The mining industry experienced the highest year-on-year increase in employment at 11.4 percent while agriculture
recorded the highest decrease at 2.2 percent between 2002 and 2012. The total number of employment distribution
by industries increase by 8 912 for the period under review.
6.1.3.2 Remuneration
Table 6.1.3.4 below shows remuneration by industry for John Taolo Gaetsewe district municipality for 2002 and
2012.
According to the table above the mining industry recorded the largest share of remuneration at 38.3 percent and 44.7
in 2002 and 2012 respectively while the least was electricity at 1.7 and 1.8 percent for the same period. The
agriculture and transport industries experienced the least growth in remuneration at 8.0 and 8.2 percent between
2002 and 2012. The total amount of remuneration by industries grew by 2.7 billion for the period under study.
6.1.3.3 Conclusion
The number of employed people experienced an increase between 2002 and 2012. In terms of race the number of
employed Africans and Whites increased for the same period. The community services recorded the highest number
of employed people in 2002 and 2012 while mining had the largest share of remuneration for the period under
review.
Table 6.1.3.3: Employment Distribution by Industry for John Taolo Gaetsewe District Municipality, 2002 and 2012
Number % Share Number % Share
Agriculture 4,277 19.1 3,408 10.9 -2.2
Mining 4,378 19.5 12,890 41.1 11.4
Manufacturing 646 2.9 566 1.8 -1.3
Electricity 115 0.5 101 0.3 -1.3
Construction 774 3.5 884 2.8 1.3
Trade 2,446 10.9 2,536 8.1 0.4
Transport 813 3.6 720 2.3 -1.2
Finance 896 4.0 999 3.2 1.1
Community services 5,470 24.4 6,498 20.7 1.7
Households 2,602 11.6 2,728 8.7 0.5
Total 22,418 100.0 31,330 100.0 3.4
Source: Global Insight, 2013
Industries2002 2012
% Change
Table 6.1.3.4: Remuneration by Industry for John Taolo Gaetsewe District Municipality, 2002 and 2012
Amount (R'000) % Share Amount (R'000) % Share
Agriculture 42,339 3.1 91,521 2.3 8.0
Mining 519,525 38.3 1,800,079 44.7 13.2
Manufacturing 39,204 2.9 101,777 2.5 10.0
Electricity 22,399 1.7 73,730 1.8 12.7
Construction 30,517 2.2 69,496 1.7 8.6
Trade 108,358 8.0 265,360 6.6 9.4
Transport 51,395 3.8 112,746 2.8 8.2
Finance 68,769 5.1 184,244 4.6 10.4
Community services 474,893 35.0 1,332,373 33.1 10.9
Total 1,357,401 100.0 4,031,328 100.0 11.5
Source: Global Insight, 2013
Industries2002 2012
% Change

INTEGRATED DEVELOPMENT PLAN 2012-2017: SECTION B 61
JOHN TAOLO GAETSEWE DISTRICT MUNICIPALITY
6.1.4 Human Development Profile
6.1.4.1 Poverty Indicators
The table below compares the poverty indicators for John Taolo Gaetsewe district municipality and Northern Cape
(NC) for 2002 and 2012.
Table 6.1.4.1 above shows that the population of John Taolo Gaetsewe (JTG) district municipality increased from
193 918 in 2002 to 217 400 in 2012. However, the number of people living in poverty declined resulting in a
percentage decline from 55.1 to 38.1 percent from 2002 to 2012 respectively.
The figure below shows the Human Development Index (HDI) for both John Taolo and NC for the period 2002 to
2012.
Figure 6.1.4.1: Human Development Index for John Taolo Gaetsewe District Municipality and the Northern
Cape, 2002-2012
Sources: Global Insight, 2013
The HDI for both JTG and NC increased over the years and was at its highest in 2012. The JTG municipality is
categorised as semi-developed.
6.1.4.2: Income Distribution
The figure below shows the Gini Coefficient for JGT and NC from 2002 to 2012.
Figure 6.1.4.2: Gini Coefficient for John Taolo Gaetsewe District Municipality and the Northern Cape, 2002-
2012
Table 6.1.4.1: Poverty Indicators for John Taolo Gaetsewe District Municipality and the Northern Cape, 2002 and 2012
Municipalities Total Population
No. of People in
Poverty
% of People
in Poverty
Poverty Gap
(R million) Total Population
No. of People in
Poverty
% of People in
Poverty
Poverty Gap
(R million)
John Taolo Gaetsewe 193,918 106,946 55.1% 251 217,400 82,526 38.0% 401
Northern Cape 1,023,615 450,636 44.0% 760 1,125,434 400,075 35.5% 1,182
Source: Global Insight, 2013
20122002
2002 2003 2004 2005 2006 2007 2008 2009 2010 2011 2012
John Taolo Gaetsewe 0.51 0.51 0.52 0.54 0.55 0.55 0.56 0.57 0.59 0.63 0.64
Northern Cape 0.56 0.56 0.57 0.58 0.59 0.59 0.61 0.62 0.63 0.67 0.67
0.00
0.10
0.20
0.30
0.40
0.50
0.60
0.70
0.80
Human Development Index for John Taolo Gaetsewe District Municipality and the Northern
Cape, 2002-2012

INTEGRATED DEVELOPMENT PLAN 2012-2017: SECTION B 62
JOHN TAOLO GAETSEWE DISTRICT MUNICIPALITY
Sources: Global Insight, 2013
The income distribution for JTG is not equitable; it was recorded at 0.67 in 2002 but declined to 0.63 in 2012, which
is still relatively high showing a wide gap between the poor and the rich in this region.
Figure 6.1.4.3 below shows the JTG income distribution per household for the year 2012.
Figure 6.1.4.3: Income Distribution per Household for John Taolo Gaetsewe Municipality, 2012
Source: Global Insight 2013
According to the figure above, the majority of households earned within income category (30 000-54 000) followed
by (12 000-30 000) and income category with the lowest number of households was (0-2400) and (2 400 000+).
6.1.4.3 Access to services
6.1.4.3.1 Education
2002 2003 2004 2005 2006 2007 2008 2009 2010 2011 2012
John Taolo Gaetsewe 0.67 0.67 0.67 0.66 0.66 0.65 0.65 0.64 0.63 0.63 0.63
Northern Cape 0.64 0.64 0.64 0.64 0.63 0.63 0.62 0.61 0.61 0.62 0.62
0.57
0.58
0.59
0.60
0.61
0.62
0.63
0.64
0.65
0.66
0.67
0.68
Gini Coefficient for John Taolo Gaetsewe District Municipality and the Northern Cape,
2002-2012
0
2,000
4,000
6,000
8,000
10,000
12,000
14,000
16,000
18,000
No
of
ho
use
ho
ld
Income in Rands
Income Distribution per Household for John Taolo Gaetsewe District Municipality, 2012

INTEGRATED DEVELOPMENT PLAN 2012-2017: SECTION B 63
JOHN TAOLO GAETSEWE DISTRICT MUNICIPALITY
According to figure 6.1.4.4 below the highest qualification attained by the majority of the population was grade 7-9
with 24 percent, followed by grade 10-11 with 21 percent.
Figure 6.1.4.4: Education Attained in John Taolo Gaetsewe District Municipality, 2012
Source: Global Insight 2013
It is worth noting that 20 percent of the population attained matric qualifications and in contrast only less than 2
percent were able to attained post matric qualifications. There is a still a large percent of people with no schooling in
the area.
6.1.4.3.2 Health Care
The figure below illustrates the number of health facilities in the John Taolo Gaetsewe district for the year 2013.
Figure 6.1.4.5: Number of Health Facilities in the John Taolo District Municipality, 2013
10%
3%
14%
24%21%1%
20%
6%
1% 0%
Education Attaiened in John Taolo Gaetsewe District Municipality, 2012
No schooling
Grade 0-2
Grade 3-6
Grade 7-9
Grade 10-11
Certificate / diploma without matric
Matric only
Matric & certificate / diploma
Matric & Bachelors degree
Matric & Postgrad degree

INTEGRATED DEVELOPMENT PLAN 2012-2017: SECTION B 64
JOHN TAOLO GAETSEWE DISTRICT MUNICIPALITY
Source: Global Insight 2013
According to the figure above there were no satellite clinics or regional hospitals in John Taolo Gaetsewe district,
however there were 36 clinics and 2 district hospitals. For those who can reside far from the hospitals or clinics the
department made provision for 5 community health centres ad 5 mobile clinics.
6.1.4.3.3 Housing
The figure below shows the formal dwelling backlog for JTG for 2002 to 2012.
Figure 6.1.4.6: Formal Dwelling Backlog for John Taolo Gaetsewe District Municipality, 2002-2012
Source: Global Insight 2013
0
5
10
15
20
25
30
35
40
Clinics Community
Health Centres
District Hospitals Mobile Services Regional Hospital Satelite clinics
2013 36 5 2 5 0 0
Number of Health Facilities in the John Taolo Gaetsewe District Municipality , 2013
0 2,000 4,000 6,000 8,000 10,000 12,000 14,000 16,000
2002
2003
2004
2005
2006
2007
2008
2009
2010
2011
2012
Formal Dwelling Backlog for John Taolo Gaetsewe District Municipality, 2002-2012

INTEGRATED DEVELOPMENT PLAN 2012-2017: SECTION B 65
JOHN TAOLO GAETSEWE DISTRICT MUNICIPALITY
According to the figure above the formal dwelling backlog has increased continuously over the years from 2002 to
2012. The lowest backlog was recorded at 6 749 in 2002 and the number more than doubled to 15 119 in 2012.
6.1.4.4 Access to Basic Services
Table 6.1.4.7 below shows the households with and without access to basic services such as piped water, flush
toilets and electricity from 2002 to 2012.
According to table 6.1.4.2 above there was a general improvement with regards to access to basic services. The
number of households with access to electricity increased from 17 215 in 2002 to 41 126 in 2012 and the number of
households without access decreased from 18 065 to 7 424 over the same period. The same trend applied for access
to flush toilets, piped water and refuse removal.
6.1.4.5 Conclusion
There was a decline in the percentage of people living in poverty in John Taolo Gaetsewe district municipality
between 2002 and 2012. There municipality is semi developed and has a high income inequality level. There was an
improvement with regards to the provision of basic services with the exception housing.
6.2. Gamagara Local Municipality
6.2.1 Demographic Profile
6.2.1.1 Population Profile
Gamagara local municipality had the highest average population growth amongst the local municipality under John
Taolo Gaetsewe district municipality. The population size of Gamagara increased from 24 923 in 2002 to 41 840 in
2012, registering 5.32 percent average population growth for this period. In 2002, Gamagara represented 12.85
percent of the total population of John Taolo Gaetsewe, this percentage increased to 19.24 percent in 2012. Table
6.2.1.1 shows the population profile of Gamagara local municipality for 2002 and 2012.
Table 6.1.4.2: Access to Basics Services for Households in John Taolo Gaetsewe Municipality, 2002 and 2012
Basic Services Households with access Households without access Households with access Households without access
Electricity 17,215 18,065 41,126 7,424
Flush Toilets 19,149 12,798 23,844 5,318
Piped water 27,506 8,573 27,150 5,768
Refuse Removal 15,151 18,035 6,488 3,158
Source: Global Insight 2013
2002 2012

INTEGRATED DEVELOPMENT PLAN 2012-2017: SECTION B 66
JOHN TAOLO GAETSEWE DISTRICT MUNICIPALITY
The majority of the Gamagara population was Africans followed by Coloureds, representing 55.50 and 29.91
percent respectively in 2012. There were only 227 Asians living in the municipality. The number of people living in
one household decreased from 3.26 in 2002 to 3.04 in 2012 on average.
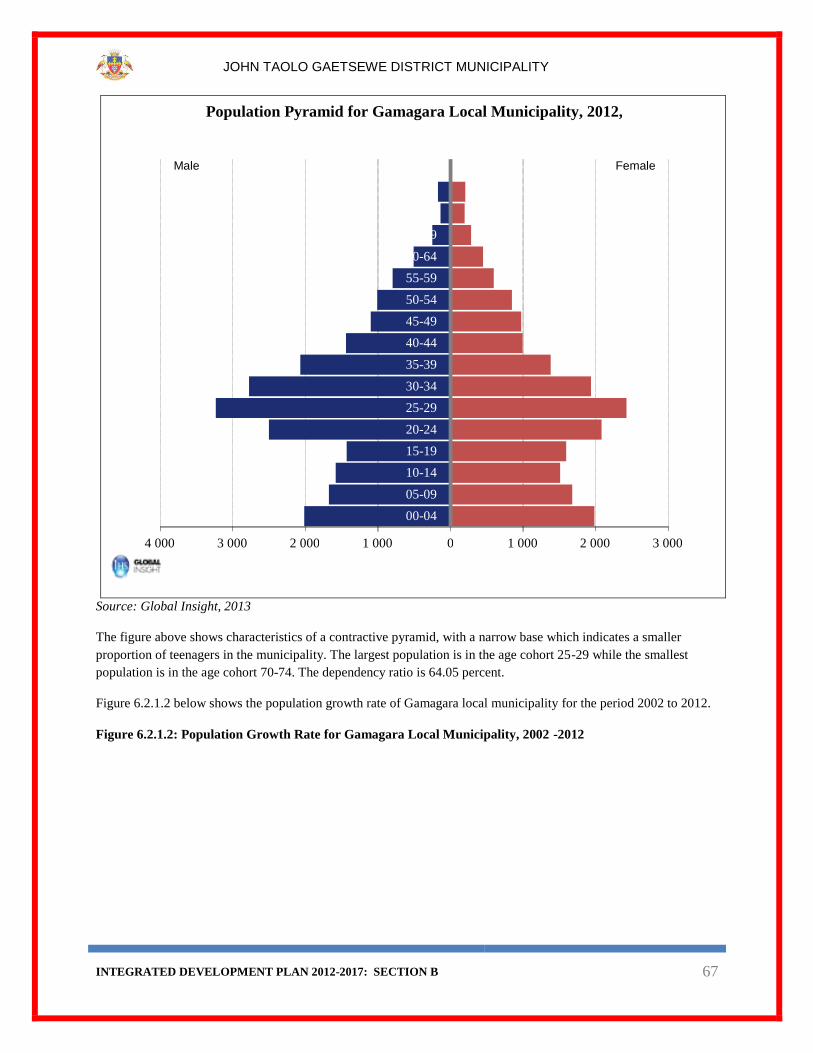
Figure 6.2.1.1 below show the population pyramid of Gamagara local municipality for 2012.
Figure 6.2.1.1: Population Pyramid for Gamagara Local Municipality, 2012
Table 6.2.1.1: Population Profile for Gamagara Local Municipality, 2002 and 2012
Gamagara John Taolo Gaetsewe Number of Households Average number of people per Household
2002 24 923 193 918 7 652 3.26
2012 41 840 217 400 13 758 3.04
% Change 5.32 1.15
TOTAL POPULATION BY RACE AND GENDER
Race Male Female Total
2012 African 13 173 10 047 23 220
White 3 057 2 820 5 877
Coloured 6 337 6 179 12 516
Asian 148 78 227
Total 22 715 19 125 41 840
Source:Global Insight, 2013
TOTAL POPULATION HOUSEHOLDS
INTEGRATED DEVELOPMENT PLAN 2012-2017: SECTION B 67
JOHN TAOLO GAETSEWE DISTRICT MUNICIPALITY
Source: Global Insight, 2013
The figure above shows characteristics of a contractive pyramid, with a narrow base which indicates a smaller
proportion of teenagers in the municipality. The largest population is in the age cohort 25-29 while the smallest
population is in the age cohort 70-74. The dependency ratio is 64.05 percent.
Figure 6.2.1.2 below shows the population growth rate of Gamagara local municipality for the period 2002 to 2012.
Figure 6.2.1.2: Population Growth Rate for Gamagara Local Municipality, 2002 -2012
4 000 3 000 2 000 1 000 0 1 000 2 000 3 000
00-04
05-09
10-14
15-19
20-24
25-29
30-34
35-39
40-44
45-49
50-54
55-59
60-64
65-69
70-74
75+
Population Pyramid for Gamagara Local Municipality, 2012,
Male Female

INTEGRATED DEVELOPMENT PLAN 2012-2017: SECTION B 68
JOHN TAOLO GAETSEWE DISTRICT MUNICIPALITY
Source: Global Insight, 2013
The population growth rate inconsistently increased from 3.0 percent in 2002 to 4.9 percent in 2012. Between 2002
and 2008, Gamagara population grew on average by 3.9 percent. Thereafter, it decreased from 6.9 percent in 2008 to
4.9 percent in 2012. The average growth rate was 5.32 percent for the period under review.
6.2.1.2 Urbanisation
Figure 6.2.1.3 below shows the urbanisation rate for Gamagara local and John Taolo Gaetsewe municipality for the
period 2002-2012.
Figure 6.2.1.3: Urbanisation Rate for Gamagara Local and John Taolo Gaetsewe District Municipalities,
2002-2012
2002 2003 2004 2005 2006 2007 2008 2009 2010 2011 2012
Population Growth Rate 3.0% 3.7% 4.3% 4.8% 5.4% 6.5% 6.9% 6.4% 5.6% 4.9% 4.9%
0.0%
1.0%
2.0%
3.0%
4.0%
5.0%
6.0%
7.0%
8.0%
Population Growth Rate for Gamagara, 2002-2012

INTEGRATED DEVELOPMENT PLAN 2012-2017: SECTION B 69
JOHN TAOLO GAETSEWE DISTRICT MUNICIPALITY
Source: Global Insight, 2013
The urbanisation rate for Gamagara municipality was much higher than that of John Taolo Gaetsewe municipality.
The urbanisation rate for Gamagara municipality increased by only 1.2 percent, from 95.1 percent in 2002 to 96.3
percent in 2012. Only 3.7 percent of the total population lived in rural areas.
6.2.1.3 Conclusion
Gamagara municipality recorded a significant increase in population size for the period under review. The
population size of Gamagara increased from 24 923 in 2002 to 41 840 in 2012 with 5.32 percent average population
growth. The population is mostly composed of Africans with more females than males. In terms of the population
pyramid, there were few teenagers in the municipality. The population pyramid also showed signs of a relatively low
birth rate in the municipality. Only 3.7 percent of the total population lived in rural areas.
6.2.2 Economy
6.2.2.1 Economic Growth
The economic growth rates of both Gamagara local and John Taolo Gaetsewe District Municipalities are shown in
figure 6.2.2.1 below which averaged 3.8 and 3.3 percent respectively for the period 2002 to 2012.
Figure 6.2.2.1: Growth Rates for Gamagara Local and John Taolo Gaetsewe District Municipalities, 2001-
2015
2002 2003 2004 2005 2006 2007 2008 2009 2010 2011 2012
John Taolo Gaetsewe 23.3% 23.9% 24.5% 25.1% 25.9% 26.7% 27.3% 28.2% 28.8% 29.2% 29.7%
Gamagara 95.1% 94.6% 94.2% 94.1% 94.1% 94.2% 94.4% 96.0% 96.1% 96.2% 96.3%
0.0%
20.0%
40.0%
60.0%
80.0%
100.0%
120.0%
Urbanisation Rate for Gamagara Local and John Taolo Gaetsewe District
Municipalities, 2002-2012

INTEGRATED DEVELOPMENT PLAN 2012-2017: SECTION B 70
JOHN TAOLO GAETSEWE DISTRICT MUNICIPALITY
Source: Global Insight, 2013
Both economies followed an almost similar trend for the period under review; they also recorded negative growths
in 2007 at 3.1 and 3.7 percent respectively. The growths of these economies are projected to average 3.9 percent
each between 2013 and 2015.
6.2.2.2 Sector Contribution
Table 6.2.2.1 below presents the sector contributions and their respective industries for Gamagara Local
Municipality for the 2002 to 2012 period.
The primary sector contributed the highest at 72 percent and this was mainly due to activities in the mining industry
while the secondary sector contributed the least at 4 percent. The construction industry contributed the least amongst
all the industries in the region for the period under review.
6.2.2.3 Trade
The figure below shows the value of imports and exports for the Gamagara local municipality for the period 2002 to
2012.
Figure 6.2.2.2: Value of Imports and Exports for the Gamagara Local Municipality, 2002-2012
2002 2003 2004 2005 2006 2007 2008 2009 2010 2011 2012 2013 2014 2015
Gamagara 9.8 0.0 2.1 0.0 7.3 -3.7 6.9 6.8 4.9 5.1 2.6 4.1 3.7 3.8
John Taolo Gaetsewe 7.0 0.7 0.5 0.2 8.0 -3.1 7.6 5.8 4.2 3.9 1.3 4.0 3.7 3.9
-6.0
-4.0
-2.0
0.0
2.0
4.0
6.0
8.0
10.0
12.0
Per
cen
tag
e
Growth Rates for Gamagara Local and John Taolo Gaetsewe District
Mucipalities, 2002-2015
Table 6.2.2.1: Sector Contribution for Gamagara Local Municipality, 2002-2012
Sectors (R'000) 2002 2003 2004 2005 2006 2007 2008 2009 2010 2011 2012 % Change
Primary 950,478 803,587 868,276 977,061 1,237,826 1,277,695 1,773,858 2,131,213 2,327,168 2,643,163 2,783,803 11.34
Agriculture 51,323 63,114 66,554 59,269 72,388 89,722 102,723 107,237 107,214 104,352 116,584 8.55
Mining 899,156 740,472 801,723 917,792 1,165,438 1,187,973 1,671,135 2,023,976 2,219,954 2,538,810 2,667,219 11.49
Secondary 57,688 57,985 63,727 68,159 77,474 77,639 108,295 124,365 124,591 145,209 159,106 10.68
Manufacturing 33,785 36,459 38,047 42,267 44,667 41,770 62,342 52,010 54,168 58,609 66,410 6.99
Electricity 13,499 12,604 14,795 13,875 17,270 16,129 22,426 40,736 39,507 49,789 52,869 14.63
Construction 10,404 8,922 10,885 12,016 15,537 19,740 23,527 31,619 30,916 36,812 39,827 14.37
Tertiary 278,555 301,848 322,054 381,441 421,517 490,687 542,220 601,031 674,195 807,113 902,826 12.48
Trade 59,561 69,774 77,673 86,771 105,411 118,848 119,359 133,372 154,493 188,811 216,300 13.77
Transport 50,270 50,712 52,695 61,292 69,388 77,226 82,919 86,436 94,777 133,132 150,076 11.56
Finance 36,843 34,540 41,410 49,233 63,535 79,840 93,975 91,572 110,513 137,581 161,125 15.90
Community services 131,881 146,823 150,275 184,145 183,184 214,773 245,966 289,650 314,412 347,588 375,325 11.03
Total Industries 1,286,721 1,163,420 1,254,058 1,426,660 1,736,818 1,846,021 2,424,373 2,856,609 3,125,953 3,595,484 3,845,735 11.57
Taxes less Subsidies on products 59,798 72,666 88,803 101,845 125,031 192,636 200,922 231,964 257,004 305,265 324,294 18.42
Total (Gross Domestic Product - GDP) 1,346,519 1,236,086 1,342,861 1,528,506 1,861,848 2,038,657 2,625,295 3,088,573 3,382,958 3,900,749 4,170,029 11.97Source: Global Insight, 2013

INTEGRATED DEVELOPMENT PLAN 2012-2017: SECTION B 71
JOHN TAOLO GAETSEWE DISTRICT MUNICIPALITY
Source: Global Insight, 2013
The data on the value of exports was not available from 2003 to 2010 resulting in an unfavourable balance for the
period under review.
6.2.2.4 Local Economic Development
The Gamagara local municipality’s economy has been guided mainly by the iron ore mine in Sishen which has been
providing jobs and it is also the reason for the establishment of the town of Kathu the economic centre of the region.
The municipality has embarked on Several job creation projects with the involvement of mining such as the brick
making, coffin making, Gamagara integrated cleaning enterprise, Kathu car wash and Zonke arts and craft.
6.2.2.5 Natural Resources
6.2.2.5.1 Land
Gamagara local municipality which covers an area of about 2 619 square kilometres consists of five towns which are
mostly farming and mining areas namely: Kathu, Sishen, Dibeng, Dingleton, and Olifantshoek.
6.2.2.5.2 Tourism
The tourism attractions in this area include amongst other things, the Kathu archeologialcal complex which
comprises of Kathu townlands, Kathu pan 1 and the Best wood pan.
6.2.2.6 Economic Infrastructure
The municipality intends to upgrade its electricity supply and roads in the region. Some areas will also benefit from
the construction of new roads in the next five years.
6.2.2.7 Conclusion
The economic growth for Gamagara local municipality was mainly driven by the iron ore mine in Sishen and also
created job opportunities. The construction industry contributed the least for the period under review. The
unavailability of data on the value of exports resulted in an unfavourable trade balance for this municipality. The
municipality is involved in a number of LED projects that will help create job opportunities and boost the economy.
6.2.3 Labour Analysis
6.2.3.1 Labour Status
The labour Characteristics for Gamagara local municipality for 2002 and 2012 is shown in table 6.2.3.1 below.
2002 2003 2004 2005 2006 2007 2008 2009 2010 2011 2012
Imports (R'000) 1,052 13 0 184 567 274 130 385 550 3,262 586
Exports (R'000) 1 0 0 0 0 0 0 0 0 17 16
0
500
1,000
1,500
2,000
2,500
3,000
3,500
Th
ou
san
ds
Value of Imports and Exports for the Gamagara Local Municipality, 2002-2012

INTEGRATED DEVELOPMENT PLAN 2012-2017: SECTION B 72
JOHN TAOLO GAETSEWE DISTRICT MUNICIPALITY
The number of employed people increased from 74.8 percent in 2002 to 83.1 percent in 2012 while the unemployed
decreased from 25.2 to 16.9 percent for the period assessed. The number of economically active population was
more than that of not economically active in 2002 and 2012. For the period under study working age 15-64
population increased by 13 418.
Table 6.2.3.2 below shows employment and unemployment by race and gender for Gamagara local municipality for
2002 and 2012.
Evident from the table above, employment in Africans increased from 59.8 percent in 2002 to 62 percent in 2012
while those for Whites and Coloureds decreased during the same period. Asians were the least employed at 0.1 and
0.2 percent in 2002 and 2012 respectively. Females were the most unemployed compared to their counterparts for
the period under study.
Table 6.2.3.3 shows employment distribution by industry for Gamagara local municipality for 2002 and 2012. In
2002 community services industry recorded the highest number of workers at 1 805 while in 2012 it was mining at 3
720.
Table 6.2.3.1: Labour Characteristics for Gamagara Local Municipality, 2002 and 2012
Number % Rate Number % Rate
Employed 7,492 74.8 13,535 83.1
Unemployed 2,524 25.2 2,748 16.9
Economically active 10,016 100.0 16,283 100.0
Economically Active 10,016 59.9 16,283 54.0
Not Economically Active 6,719 40.1 13,870 46.0
Working Age 15-64 Population 16,735 100.0 30,153 100.0
Source: Global Insight 2013
2002 2012
Table 6.2.3.2: Employment and Unemployment by Race and Gender for Gamagara Local Municipality, 2002 and 2012
2002 2012 2002 2012
African 59.8% 62.0% 18.7% 10.4%
White 26.1% 25.7% 5.2% 2.7%
Coloured 14.0% 12.2% 56.6% 50.5%
Asian 0.1% 0.2% 0.0% 0.0%
Gender
Male 62.4% 65.8% 19.1% 12.5%
Female 37.6% 34.2% 33.5% 24.1%
Source: Global Insight 2013
Race
Employment Unemployment

INTEGRATED DEVELOPMENT PLAN 2012-2017: SECTION B 73
JOHN TAOLO GAETSEWE DISTRICT MUNICIPALITY
The electricity industry had the least number of workers at 35 and 33 in 2002 and 2012 respectively. The total
employment distribution by industry in Gamagara local municipality grew at 3.5 percent between 2002 and 2012.
6.2.3.2 Remuneration
The mining industry had the largest remuneration at 36.9 percent and 44.8 in 2002 and 2012 as shown in table
6.2.3.4 below.
For the period under study electricity industry had the least remuneration at 1.7 and 2.1 percent while transport had
the least year-on-year growth at 7.1 percent. The total amount for remuneration by industries grew by 860 million
rand between 2002 and 2012.
6.2.3.3 Conclusion
Between 2002 and 2012 the working age 15-64 population increased while unemployment for Africans, Whites and
Coloured decreased for the same period. In 2002 community services industry had the highest number of workers
while in 2012 it was mining. The total amount for remuneration by industries increased for the period under review.
6.2.4 Human Development Profile
Table 6.2.3.3: Employment Distribution by Industry for Gamagara Local Municipality, 2002 and 2012
Number % Share Number % Share
Agriculture 1,625 21.0 1,384 12.7 -1.6
Mining 1,198 15.5 3,720 34.2 12.0
Manufacturing 211 2.7 177 1.6 -1.8
Electricity 35 0.4 33 0.3 -0.5
Construction 317 4.1 376 3.5 1.7
Trade 979 12.6 1,058 9.7 0.8
Transport 313 4.0 292 2.7 -0.7
Finance 363 4.7 442 4.1 2.0
Community services 1,805 23.3 2,411 22.2 2.9
Households 904 11.7 990 9.1 0.9
Total 7,750 100.0 10,883 100.0 3.5
Source: Global Insight 2013
Industry
2002 2012
% Change
Table 6.2.3.4: Remuneration by Industry for Gamagara Local Municipality, 2002 and 2012
Amount (R'000) % Share Amount (R'000) % Share
Agriculture 14,951 3.4 32,368 2.5 8.0
Mining 163,155 36.9 583,696 44.8 13.6
Manufacturing 11,386 2.6 27,333 2.1 9.2
Electricity 7,667 1.7 27,780 2.1 13.7
Construction 13,390 3.0 28,775 2.2 7.9
Trade 44,519 10.1 101,043 7.8 8.5
Transport 16,859 3.8 33,452 2.6 7.1
Finance 28,134 6.4 70,926 5.4 9.7
Community services 142,201 32.2 397,735 30.5 10.8
Total Industries 442,262 100.0 1,303,108 100.0 11.4
Source: Global Insight, 2013
Indusries
2002 2012
% Change

INTEGRATED DEVELOPMENT PLAN 2012-2017: SECTION B 74
JOHN TAOLO GAETSEWE DISTRICT MUNICIPALITY
6.2.4.1 Poverty Indicators
The table below shows the poverty indicators for Gamagara local municipality compared to the John Taolo
Gaetsewe district municipality from 2002 to 2012.
According to the table above, the number of people living in poverty in poverty increased however this was due to
the increase in population size, but the percentage declined from 49.5 percent in 2002 to 44.2 in 2012. The poverty
gap increased by a minimal of R2 million over a ten year period.
The figure below shows the Human Development Index (HDI) for both Gamagara local and John Taolo Gaetsewe
district municipalities from 2002 to 2012.
Figure 6.2.4.1: Human Development Index for Gamagara Local and John Taolo Gaetsewe District
Municipalities, 2002-2012
Source: Global Insight 2013
The HDI for Gamagara and John Taolo both increased over the years and both municipalities experienced their
highest HDI in 2012 at 0.68 and 0.64 respectively. Gamagara is classified as semi-developed as it had an HDI that
was less than 0.8 but above 0.5.
6.2.4.2 Income Distribution
Figure 6.2.4.2 shows the Gini Coefficient for Gamagara and John Taolo Gaetsewe for the period 2002 to 2012.
Figure 6.2.4.2: Gini Coefficient for Gamagara Local and John Taolo Gaetsewe District Municipalities, 2002-
2012
Table 6.2.4.1: Poverty Indicators for Gamagara Local and John Taolo Gaetsewe District Municipalities, 2002 and 2012
Municipalities Total Population
No. of People
in Poverty
% of People
in Poverty
Poverty Gap
(R million) Total Population
No. of People
in Poverty
% of People
in Poverty
Poverty Gap
(R million)
Gamagara 24,923 12,336 49.5% 17 41,840 18,481 44.2% 22
John Taolo Gaetsewe 193,918 106,946 55.1% 251 217,400 82,526 38.0% 401
Source: Global Insight, 2013
2002 2012
2002 2003 2004 2005 2006 2007 2008 2009 2010 2011 2012
Gamagara 0.60 0.59 0.60 0.60 0.61 0.60 0.62 0.63 0.63 0.67 0.68
John Taolo Gaetsewe 0.51 0.51 0.52 0.54 0.55 0.55 0.56 0.57 0.59 0.63 0.64
0.00
0.10
0.20
0.30
0.40
0.50
0.60
0.70
0.80
Human Development Indext for Gamagara Local and John Taolo Gaetsewe District
Muncipalities, 2002-2012

INTEGRATED DEVELOPMENT PLAN 2012-2017: SECTION B 75
JOHN TAOLO GAETSEWE DISTRICT MUNICIPALITY
Source: Global Insight 2013
Gamagara had a high Gini Coefficient which was at 0.70 from 2002 to 2006; it decreased slightly from 2008 till
2009, before reaching the highest Gini Coefficient of 0.71 in 2012.
Figure 6.2.4.3 below shows the income distribution for Gamagara local municipality for 2012.
Figure 6.2.4.3: Income Distribution per Household for Gamagara Local Municipality, 2012
Source: Global Insight 2013
Figure above shows the varying households income distribution, there were more households earning within income
category (R12 000-30 000) and income category (R30 000-R54 000). The number of households begin to drop from
income categories above R360 000.
6.2.4.3 Access to Services
6.2.4.3.1 Education
The figure below shows the highest level of education attained in Gamagara for 2012.
2002 2003 2004 2005 2006 2007 2008 2009 2010 2011 2012
Gamagara 0.70 0.70 0.70 0.70 0.70 0.69 0.69 0.68 0.69 0.70 0.71
John Taolo Gaetsewe 0.67 0.67 0.67 0.66 0.66 0.65 0.65 0.64 0.63 0.63 0.63
0.58
0.60
0.62
0.64
0.66
0.68
0.70
0.72
Gini Coefficient for Gamagara Local and John Taole Gaetsewe District Municipalities,
2002-2012
0
500
1,000
1,500
2,000
2,500
3,000
3,500
4,000
No
of
Ho
ush
old
s
Income in Rands
Income Distribution per Household for Gamagara Local Municipality, 2012

INTEGRATED DEVELOPMENT PLAN 2012-2017: SECTION B 76
JOHN TAOLO GAETSEWE DISTRICT MUNICIPALITY
Figure 6.2.4.4: Education Attained in Gamagara Local Municipality, 2012
Source: Global Insight 2013
There were more people attaining matric only in 2012 with 27 percent, followed by grade 7-9 with 22 percent.
Education attainment still remains a challenge as 10 percent of the population still don’t have any form of education
and lesser percentages of people attaining post matric qualifications.
6.2.4.3.3 Housing
Figure 6.2.4.5 below shows the formal dwelling backlog for Gamagara local municipality from the year 2002 to
2012.
Figure 6.2.4.5: Formal Dwelling Backlog for Gamagara Local Municipality, 2002-2012
10%2%
11%
22%
18%
1%
27%
7%
1% 1%
Education Attained in Gamagara Local Municipality, 2012
No schooling
Grade 0-2
Grade 3-6
Grade 7-9
Grade 10-11
Certificate / diploma without matric
Matric only
Matric & certificate / diploma
Matric & Bachelors degree
Matric & Postgrad degree
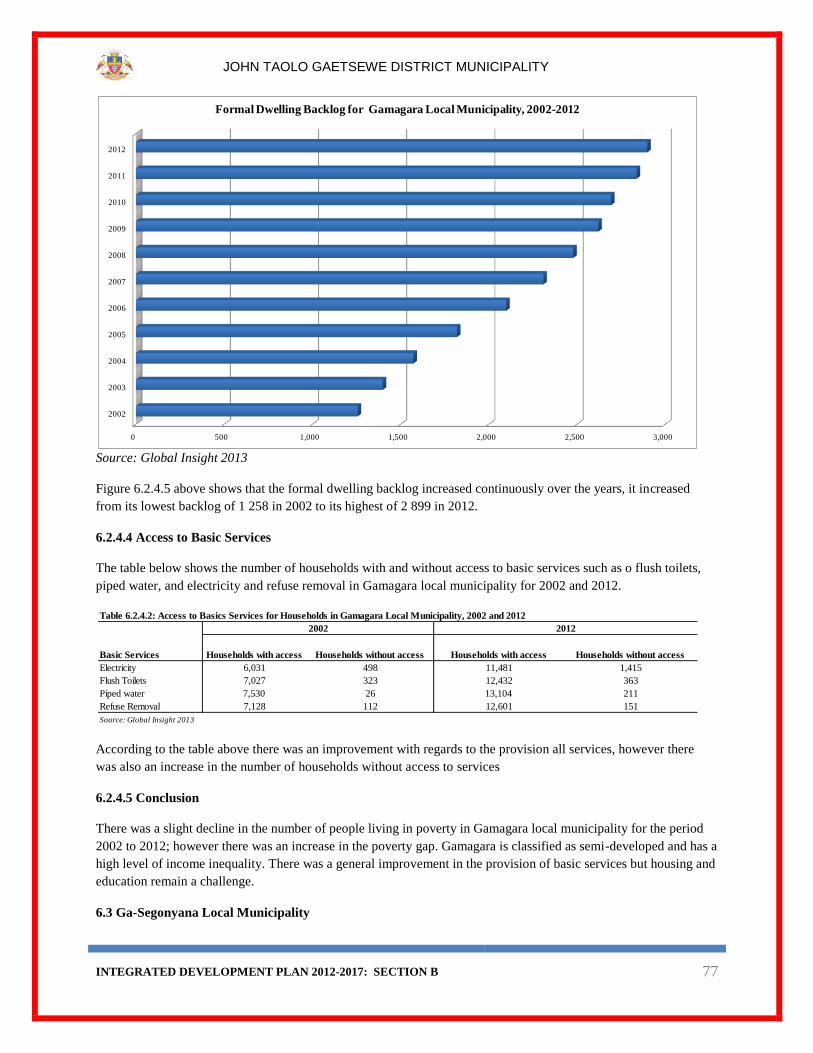
INTEGRATED DEVELOPMENT PLAN 2012-2017: SECTION B 77
JOHN TAOLO GAETSEWE DISTRICT MUNICIPALITY
Source: Global Insight 2013
Figure 6.2.4.5 above shows that the formal dwelling backlog increased continuously over the years, it increased
from its lowest backlog of 1 258 in 2002 to its highest of 2 899 in 2012.
6.2.4.4 Access to Basic Services
The table below shows the number of households with and without access to basic services such as o flush toilets,
piped water, and electricity and refuse removal in Gamagara local municipality for 2002 and 2012.
According to the table above there was an improvement with regards to the provision all services, however there
was also an increase in the number of households without access to services
6.2.4.5 Conclusion
There was a slight decline in the number of people living in poverty in Gamagara local municipality for the period
2002 to 2012; however there was an increase in the poverty gap. Gamagara is classified as semi-developed and has a
high level of income inequality. There was a general improvement in the provision of basic services but housing and
education remain a challenge.
6.3 Ga-Segonyana Local Municipality
0 500 1,000 1,500 2,000 2,500 3,000
2002
2003
2004
2005
2006
2007
2008
2009
2010
2011
2012
Formal Dwelling Backlog for Gamagara Local Municipality, 2002-2012
Table 6.2.4.2: Access to Basics Services for Households in Gamagara Local Municipality, 2002 and 2012
Basic Services Households with access Households without access Households with access Households without access
Electricity 6,031 498 11,481 1,415
Flush Toilets 7,027 323 12,432 363
Piped water 7,530 26 13,104 211
Refuse Removal 7,128 112 12,601 151
Source: Global Insight 2013
2002 2012
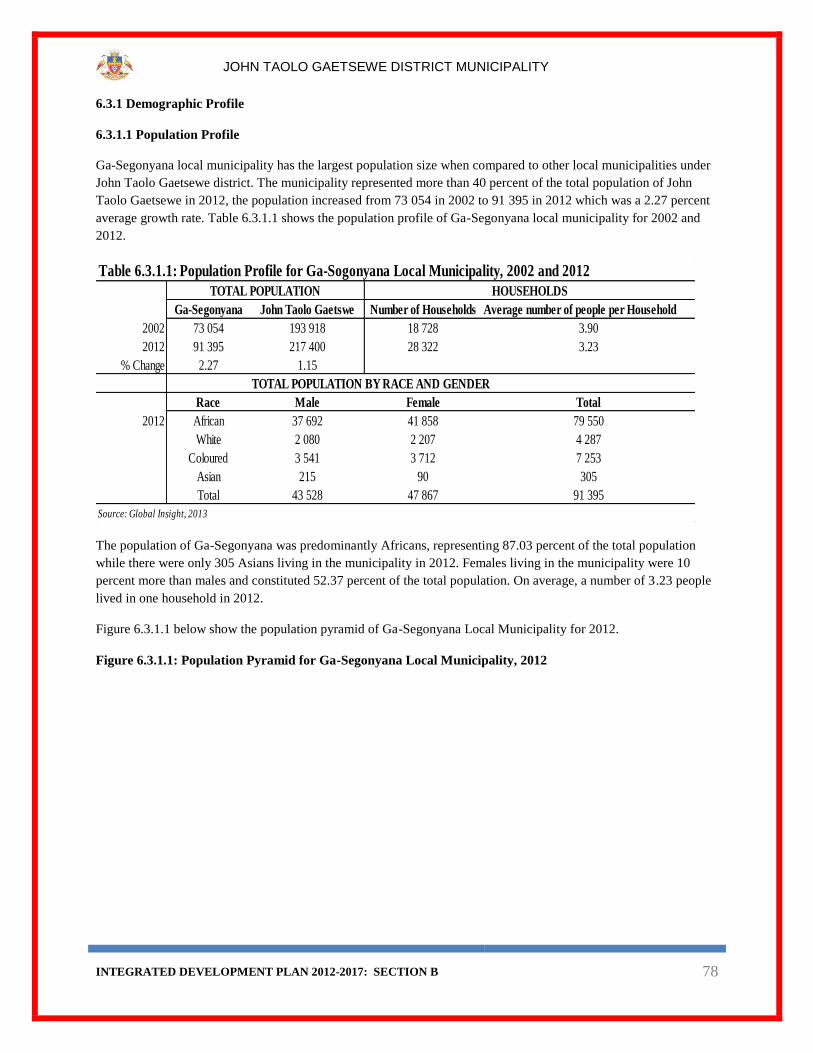
INTEGRATED DEVELOPMENT PLAN 2012-2017: SECTION B 78
JOHN TAOLO GAETSEWE DISTRICT MUNICIPALITY
6.3.1 Demographic Profile
6.3.1.1 Population Profile
Ga-Segonyana local municipality has the largest population size when compared to other local municipalities under
John Taolo Gaetsewe district. The municipality represented more than 40 percent of the total population of John
Taolo Gaetsewe in 2012, the population increased from 73 054 in 2002 to 91 395 in 2012 which was a 2.27 percent
average growth rate. Table 6.3.1.1 shows the population profile of Ga-Segonyana local municipality for 2002 and
2012.
The population of Ga-Segonyana was predominantly Africans, representing 87.03 percent of the total population
while there were only 305 Asians living in the municipality in 2012. Females living in the municipality were 10
percent more than males and constituted 52.37 percent of the total population. On average, a number of 3.23 people
lived in one household in 2012.
Figure 6.3.1.1 below show the population pyramid of Ga-Segonyana Local Municipality for 2012.
Figure 6.3.1.1: Population Pyramid for Ga-Segonyana Local Municipality, 2012
Table 6.3.1.1: Population Profile for Ga-Sogonyana Local Municipality, 2002 and 2012
Ga-Segonyana John Taolo Gaetswe Number of Households Average number of people per Household
2002 73 054 193 918 18 728 3.90
2012 91 395 217 400 28 322 3.23
% Change 2.27 1.15
TOTAL POPULATION BY RACE AND GENDER
Race Male Female Total
2012 African 37 692 41 858 79 550
White 2 080 2 207 4 287
Coloured 3 541 3 712 7 253
Asian 215 90 305
Total 43 528 47 867 91 395
Source: Global Insight, 2013
TOTAL POPULATION HOUSEHOLDS

INTEGRATED DEVELOPMENT PLAN 2012-2017: SECTION B 79
JOHN TAOLO GAETSEWE DISTRICT MUNICIPALITY
Source: Global Insight, 2013
The pyramid above is broad-based indicating the possibility of a high birth rate in Ga-Segonyana municipality, with
the age group 0-4 years having the largest population while 70-74 years has the smallest population. The pyramid is
skewed to the right, reflecting the large number of females than males.
Figure 6.3.1.2 below shows the population growth rate of Ga-Segonyana local municipality for the period 2002 to
2012.
8 000 6 000 4 000 2 000 0 2 000 4 000 6 000 8 000
00-04
05-09
10-14
15-19
20-24
25-29
30-34
35-39
40-44
45-49
50-54
55-59
60-64
65-69
70-74
75+
- Population Pyramid for Ga-Segonyana Local Municipality, 2012
Male Female
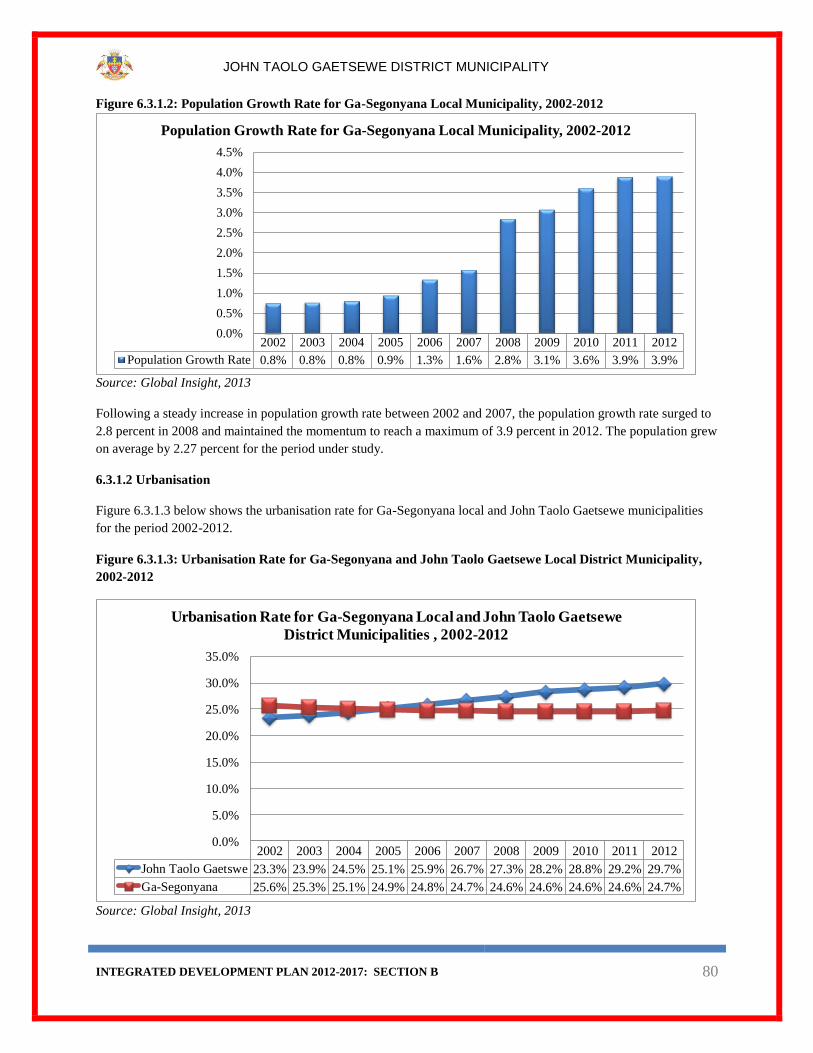
INTEGRATED DEVELOPMENT PLAN 2012-2017: SECTION B 80
JOHN TAOLO GAETSEWE DISTRICT MUNICIPALITY
Figure 6.3.1.2: Population Growth Rate for Ga-Segonyana Local Municipality, 2002-2012
Source: Global Insight, 2013
Following a steady increase in population growth rate between 2002 and 2007, the population growth rate surged to
2.8 percent in 2008 and maintained the momentum to reach a maximum of 3.9 percent in 2012. The population grew
on average by 2.27 percent for the period under study.
6.3.1.2 Urbanisation
Figure 6.3.1.3 below shows the urbanisation rate for Ga-Segonyana local and John Taolo Gaetsewe municipalities
for the period 2002-2012.
Figure 6.3.1.3: Urbanisation Rate for Ga-Segonyana and John Taolo Gaetsewe Local District Municipality,
2002-2012
Source: Global Insight, 2013
2002 2003 2004 2005 2006 2007 2008 2009 2010 2011 2012
Population Growth Rate 0.8% 0.8% 0.8% 0.9% 1.3% 1.6% 2.8% 3.1% 3.6% 3.9% 3.9%
0.0%
0.5%
1.0%
1.5%
2.0%
2.5%
3.0%
3.5%
4.0%
4.5%
Population Growth Rate for Ga-Segonyana Local Municipality, 2002-2012
2002 2003 2004 2005 2006 2007 2008 2009 2010 2011 2012
John Taolo Gaetswe 23.3% 23.9% 24.5% 25.1% 25.9% 26.7% 27.3% 28.2% 28.8% 29.2% 29.7%
Ga-Segonyana 25.6% 25.3% 25.1% 24.9% 24.8% 24.7% 24.6% 24.6% 24.6% 24.6% 24.7%
0.0%
5.0%
10.0%
15.0%
20.0%
25.0%
30.0%
35.0%
Urbanisation Rate for Ga-Segonyana Local and John Taolo Gaetsewe
District Municipalities , 2002-2012

INTEGRATED DEVELOPMENT PLAN 2012-2017: SECTION B 81
JOHN TAOLO GAETSEWE DISTRICT MUNICIPALITY
The figure above shows a declining urbanisation rate in Ga-Segonyana, having declined from 25.6 percent in 2002
to 24.7 percent in 2012. In 2012, only 24.7 percent of the total population of Ga-Segonyana resided in urban areas.
6.3.1.3 Conclusion
Ga-Segonyana municipality had an increase in population size for the period under review, from 75 054 in 2002 to
91 395 in 2012 which was an average growth 2.27 percent. The population was mostly Africans with females
dominating. In terms of the population pyramid, the population of Ga-Segonyana consisted mainly of youth. The
population pyramid also showed signs of a relatively high birth rate in the municipality. Only 24.7 percent of the
total population lived in urban areas in 2012.
6.3.2 Economy
6.3.2.1 Economic Growth
The figure below shows that the economies of both Ga-Segonyana Local and John Taolo district municipalities grew
on average at 3.56 and 3.37 percent respectively for the period 2002 to 2012.
Figure 6.3.2.1 Growth Rate for Ga-Segonyana Local and John Taolo Gaetsewe District Municipalities, 2002-
2015
Source: Global Insight, 2013
Figure 6.3.2.1 above shows that both economies recorded negative growths in 2007 at 3.1 and 3.2 respectively,
however, even though the whole world was going through a recession in 2009, they managed to record positive
growths of 5.8 and 6.6 percent apiece. Even though their growths were under pressure in 2012 at 0.6 and 1.3 percent
respectively, they are expected to grow further in the outer years.
6.3.2.2 Sector Contribution
The table below shows the Sector Contribution and their respective industries for Ga-Segonyana local municipality
for the period 2002 to 2012.
2002 2003 2004 2005 2006 2007 2008 2009 2010 2011 2012 2013 2014 2015
Ga-Segonyana 8.2 0.8 0.6 0.5 8.5 -3.2 8.7 6.6 4.2 3.7 0.6 4.2 3.8 4.0
John Taolo Gaetsewe 7.0 0.7 0.5 0.2 8.0 -3.1 7.6 5.8 4.2 3.9 1.3 4.0 3.7 3.9
-4.0
-2.0
0.0
2.0
4.0
6.0
8.0
10.0
Per
cen
tage
Growth Rates for Ga-Segonyana Local and John Taolo Gaetsewe District
Municipalities, 2002-2015

INTEGRATED DEVELOPMENT PLAN 2012-2017: SECTION B 82
JOHN TAOLO GAETSEWE DISTRICT MUNICIPALITY
Evident from the table above the primary sector contributed the most followed by the tertiary, while the secondary
was the least. The highest contributions were mainly due to activities in the mining, construction and community
services industries. Even though the mining industry contributed the most amongst all the industries, the finance
industry recorded the highest year-on-year growth at 17.29 percent while manufacturing was the least at 5.77
percent for the period under review.
6.3.2.3 Trade
Figure 6.3.2.2 below is a presentation of the value of imports and exports for the Ga-Segonyana local municipality
for the period 2002-2012.
Figure 6.3.2.2: Value of Imports and Exports for Ga-Segonyana Local Municipality, 2002-2012
Source: Global Insight, 2013
The value of imports averaged R444 thousand while those of exports were R1.4 million resulting in a favourable
trade balance for the period under review.
6.3.2.4 Local Economic Development
The municipality strives to create a better life through sustainable development for its people by involving the
community in the affairs of decision-making about LED. In order to further boost the economy, the municipality
will improve economic development opportunities in coordination with all LED stakeholders, review the LED
Table 6.3.2.1: Sector Contribution for Ga-Segonyana Local Municipality, 2002-2012
Sectors (R'000) 2002 2003 2004 2005 2006 2007 2008 2009 2010 2011 2012 % Change
Primary 1,223,101 1,021,753 1,093,523 1,232,211 1,598,255 1,638,070 2,269,663 2,704,036 2,968,908 3,360,625 3,433,736 10.87
Agriculture 74,564 91,863 96,921 86,462 105,374 130,477 149,484 156,012 156,637 152,820 170,971 8.65
Mining 1,148,538 929,890 996,602 1,145,750 1,492,880 1,507,593 2,120,179 2,548,024 2,812,271 3,207,805 3,262,765 11.01
Secondary 54,639 52,676 59,033 63,620 76,590 84,200 114,030 137,453 128,246 135,963 140,866 9.93
Manufacturing 23,049 24,727 25,764 28,700 31,270 29,614 45,412 37,587 38,460 37,005 40,400 5.77
Electricity 9,254 8,783 9,881 8,895 10,888 9,219 13,504 27,850 26,089 33,032 33,838 13.84
Construction 22,335 19,165 23,389 26,026 34,433 45,367 55,113 72,016 63,697 65,926 66,627 11.55
Tertiary 391,345 427,996 460,661 540,293 622,288 741,116 841,937 890,803 977,437 1,108,710 1,210,469 11.95
Trade 87,415 102,691 114,425 128,966 160,230 187,179 191,720 208,226 217,653 231,898 248,395 11.01
Transport 40,575 41,105 42,663 49,982 57,738 66,513 72,452 73,350 72,724 88,750 93,444 8.70
Finance 72,710 70,726 82,346 103,539 142,345 190,358 238,438 215,456 250,081 297,779 343,136 16.79
Community services 190,644 213,474 221,228 257,806 261,974 297,066 339,327 393,771 436,979 490,282 525,495 10.67
Total Industries 1,669,085 1,502,426 1,613,218 1,836,125 2,297,133 2,463,386 3,225,630 3,732,292 4,074,592 4,605,298 4,785,071 11.11
Taxes less Subsidies on products 90,708 109,259 132,198 148,435 187,799 272,387 292,034 329,876 363,532 424,465 447,109 17.29
Total (Gross Domestic Product - GDP) 1,759,792 1,611,684 1,745,416 1,984,560 2,484,931 2,735,773 3,517,665 4,062,168 4,438,124 5,029,763 5,232,180 11.51Source: Global Insight, 2013
2002 2003 2004 2005 2006 2007 2008 2009 2010 2011 2012
Imports (R'000) 350 235 371 173 138 1,027 1,024 538 126 467 131
Exports (R'000) 2,601 1,794 725 1,678 1,674 1,865 1,724 295 1,304 347 618
0
500
1,000
1,500
2,000
2,500
3,000
Th
ou
san
ds
Value of Imports and Exports for the Ga-Segonyana Local Municipality, 2002-2012
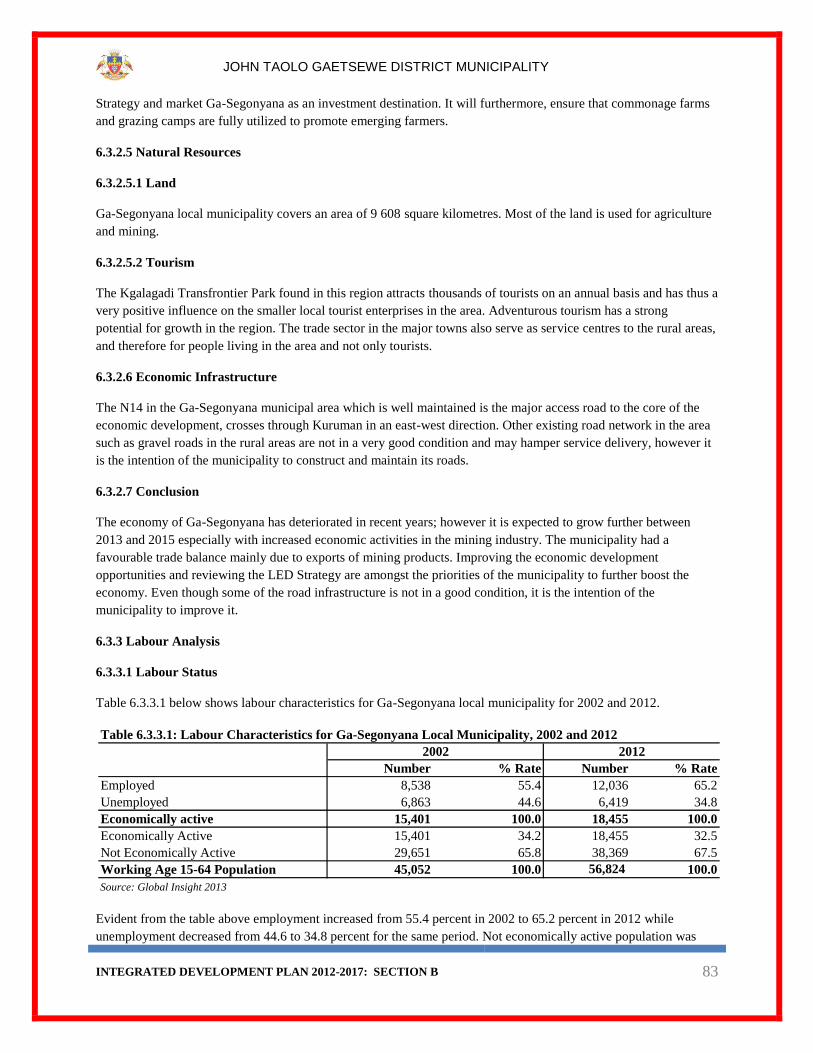
INTEGRATED DEVELOPMENT PLAN 2012-2017: SECTION B 83
JOHN TAOLO GAETSEWE DISTRICT MUNICIPALITY
Strategy and market Ga-Segonyana as an investment destination. It will furthermore, ensure that commonage farms
and grazing camps are fully utilized to promote emerging farmers.
6.3.2.5 Natural Resources
6.3.2.5.1 Land
Ga-Segonyana local municipality covers an area of 9 608 square kilometres. Most of the land is used for agriculture
and mining.
6.3.2.5.2 Tourism
The Kgalagadi Transfrontier Park found in this region attracts thousands of tourists on an annual basis and has thus a
very positive influence on the smaller local tourist enterprises in the area. Adventurous tourism has a strong
potential for growth in the region. The trade sector in the major towns also serve as service centres to the rural areas,
and therefore for people living in the area and not only tourists.
6.3.2.6 Economic Infrastructure
The N14 in the Ga-Segonyana municipal area which is well maintained is the major access road to the core of the
economic development, crosses through Kuruman in an east-west direction. Other existing road network in the area
such as gravel roads in the rural areas are not in a very good condition and may hamper service delivery, however it
is the intention of the municipality to construct and maintain its roads.
6.3.2.7 Conclusion
The economy of Ga-Segonyana has deteriorated in recent years; however it is expected to grow further between
2013 and 2015 especially with increased economic activities in the mining industry. The municipality had a
favourable trade balance mainly due to exports of mining products. Improving the economic development
opportunities and reviewing the LED Strategy are amongst the priorities of the municipality to further boost the
economy. Even though some of the road infrastructure is not in a good condition, it is the intention of the
municipality to improve it.
6.3.3 Labour Analysis
6.3.3.1 Labour Status
Table 6.3.3.1 below shows labour characteristics for Ga-Segonyana local municipality for 2002 and 2012.
Evident from the table above employment increased from 55.4 percent in 2002 to 65.2 percent in 2012 while
unemployment decreased from 44.6 to 34.8 percent for the same period. Not economically active population was
Table 6.3.3.1: Labour Characteristics for Ga-Segonyana Local Municipality, 2002 and 2012
Number % Rate Number % Rate
Employed 8,538 55.4 12,036 65.2
Unemployed 6,863 44.6 6,419 34.8
Economically active 15,401 100.0 18,455 100.0
Economically Active 15,401 34.2 18,455 32.5
Not Economically Active 29,651 65.8 38,369 67.5
Working Age 15-64 Population 45,052 100.0 56,824 100.0
Source: Global Insight 2013
2002 2012

INTEGRATED DEVELOPMENT PLAN 2012-2017: SECTION B 84
JOHN TAOLO GAETSEWE DISTRICT MUNICIPALITY
more than economically active in 2002 and 2012. The working age 15-64 population increased by 11 772 between
2002 and 2012.
The employment and unemployment by race and gender for Ga-Segonyana local municipality is shown in table
6.3.3.2 below.
According to the table above the most unemployed race were Africans at 48.7 percent in 2002 and Coloured at 40.1
in 2012. Whites were the least unemployed at 7.0 and 3.8 percent in 2002 and 2012 respectively and Asians were the
least at employed at 0.5 and 0.9 percent for the period under review.
Table 6.3.3.3 below shows employment distribution by industry for Ga-Segonyana local municipality for 2002 and
2012. The electricity industry had the least workers at 0.4 and 0.3 percent in 2002 and 2012 respectively.
The mining industry had the highest number of worker followed by community services in 2012. The total number
of workers in Ga-Segonyana local municipality increased by 3 133 between 2002 and 2012.
6.3.3.2 Remuneration
Table 6.3.3.4 below shows remuneration by industry for Ga-Segonyana local municipality for 2002 and 2012.
Table 6.3.3.2: Employment and Unemployment by Race and Gender for Ga-segonyana Local Municipality, 2002 and 2012
2002 2012 2002 2012
African 76.6% 73.6% 48.7% 38.9%
White 13.1% 16.8% 7.0% 3.8%
Coloured 9.8% 8.7% 40.5% 40.1%
Asian 0.5% 0.9% 19.5% 7.9%
Gender
Male 54.0% 57.7% 42.2% 31.2%
Female 46.0% 42.3% 47.1% 39.1%
Source: Global Insight, 2013
Race
Employment Unemployment
Table 6.3.3.3: Employment Distribution by Industry for Ga-Segonyana Local Municipality, 2002 and 2012
Number % Share Number % Share
Agriculture 1,625 21.0 1,384 12.7 -1.6
Mining 1,198 15.5 3,720 34.2 12.0
Manufacturing 211 2.7 177 1.6 -1.8
Electricity 35 0.4 33 0.3 -0.5
Construction 317 4.1 376 3.5 1.7
Trade 979 12.6 1,058 9.7 0.8
Transport 313 4.0 292 2.7 -0.7
Finance 363 4.7 442 4.1 2.0
Community services 1,805 23.3 2,411 22.2 2.9
Households 904 11.7 990 9.1 0.9
Total 7,750 100.0 10,883 100.0 3.5
Source: Global Insight 2013
Industry
2002 2012
% Change
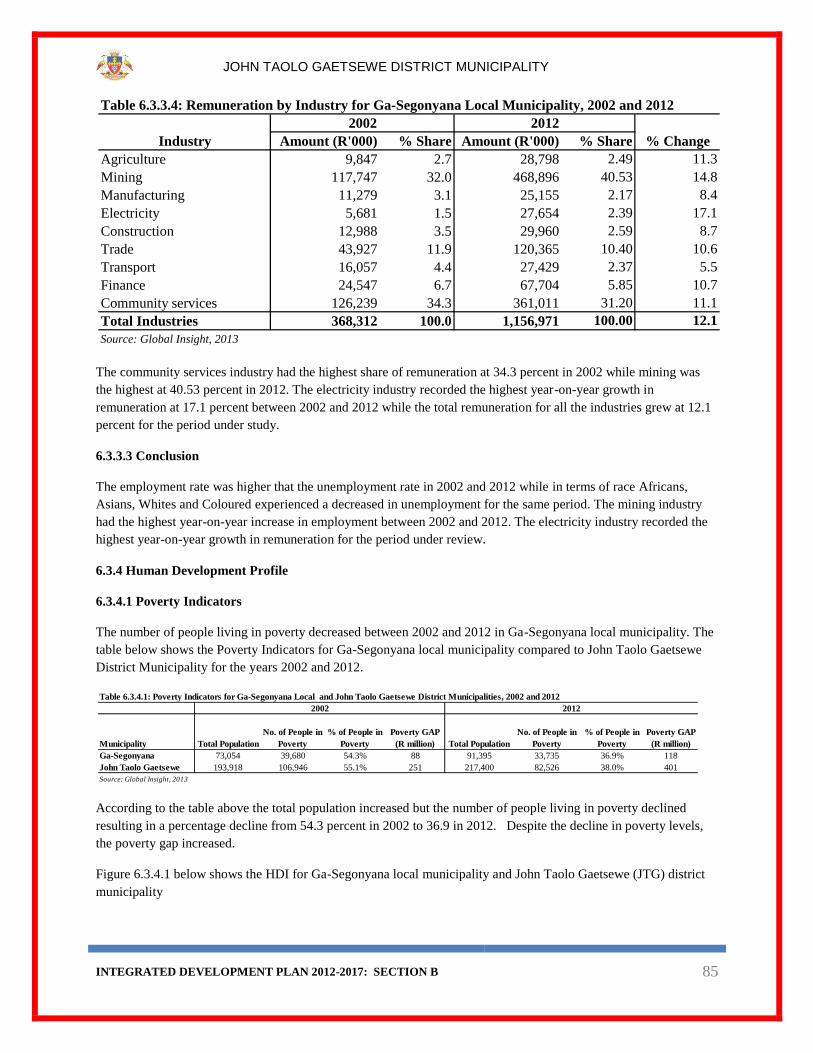
INTEGRATED DEVELOPMENT PLAN 2012-2017: SECTION B 85
JOHN TAOLO GAETSEWE DISTRICT MUNICIPALITY
The community services industry had the highest share of remuneration at 34.3 percent in 2002 while mining was
the highest at 40.53 percent in 2012. The electricity industry recorded the highest year-on-year growth in
remuneration at 17.1 percent between 2002 and 2012 while the total remuneration for all the industries grew at 12.1
percent for the period under study.
6.3.3.3 Conclusion
The employment rate was higher that the unemployment rate in 2002 and 2012 while in terms of race Africans,
Asians, Whites and Coloured experienced a decreased in unemployment for the same period. The mining industry
had the highest year-on-year increase in employment between 2002 and 2012. The electricity industry recorded the
highest year-on-year growth in remuneration for the period under review.
6.3.4 Human Development Profile
6.3.4.1 Poverty Indicators
The number of people living in poverty decreased between 2002 and 2012 in Ga-Segonyana local municipality. The
table below shows the Poverty Indicators for Ga-Segonyana local municipality compared to John Taolo Gaetsewe
District Municipality for the years 2002 and 2012.
According to the table above the total population increased but the number of people living in poverty declined
resulting in a percentage decline from 54.3 percent in 2002 to 36.9 in 2012. Despite the decline in poverty levels,
the poverty gap increased.
Figure 6.3.4.1 below shows the HDI for Ga-Segonyana local municipality and John Taolo Gaetsewe (JTG) district
municipality
Table 6.3.3.4: Remuneration by Industry for Ga-Segonyana Local Municipality, 2002 and 2012
Amount (R'000) % Share Amount (R'000) % Share
Agriculture 9,847 2.7 28,798 2.49 11.3
Mining 117,747 32.0 468,896 40.53 14.8
Manufacturing 11,279 3.1 25,155 2.17 8.4
Electricity 5,681 1.5 27,654 2.39 17.1
Construction 12,988 3.5 29,960 2.59 8.7
Trade 43,927 11.9 120,365 10.40 10.6
Transport 16,057 4.4 27,429 2.37 5.5
Finance 24,547 6.7 67,704 5.85 10.7
Community services 126,239 34.3 361,011 31.20 11.1
Total Industries 368,312 100.0 1,156,971 100.00 12.1
Source: Global Insight, 2013
% ChangeIndustry
2002 2012
Table 6.3.4.1: Poverty Indicators for Ga-Segonyana Local and John Taolo Gaetsewe District Municipalities, 2002 and 2012
Municipality Total Population
No. of People in
Poverty
% of People in
Poverty
Poverty GAP
(R million) Total Population
No. of People in
Poverty
% of People in
Poverty
Poverty GAP
(R million)
Ga-Segonyana 73,054 39,680 54.3% 88 91,395 33,735 36.9% 118
John Taolo Gaetsewe 193,918 106,946 55.1% 251 217,400 82,526 38.0% 401
Source: Global Insight, 2013
20122002

INTEGRATED DEVELOPMENT PLAN 2012-2017: SECTION B 86
JOHN TAOLO GAETSEWE DISTRICT MUNICIPALITY
Figure 6.3.4.1: Human Development Index Ga-Segonyana local and John Taolo Gaetsewe District
Municipalities, 2002-2012
Source: Global Insight 2013
The HDI for Ga-Segonyana increased from 0.53 in 2002 to 0.66 in 2012, despite the increase the municipality is still
categorised as semi-developed and it worth noting that it had a higher HDI than JTG.
6.3.4.2 Income Distribution
Figure below shows the Gini Coefficient for Ga-Segonyana and John Taolo from 2002 to 2012.
Figure 6.3.4.2: Gini Coefficient for Ga-Segonyana Local and John Taolo District Municipalities, 2002-2012
Source: Global Insight 2013
2002 2003 2004 2005 2006 2007 2008 2009 2010 2011 2012
Ga-Segonyana 0.53 0.53 0.55 0.56 0.58 0.58 0.59 0.60 0.61 0.65 0.66
Joh Taolo Gaetsewe 0.51 0.51 0.52 0.54 0.55 0.55 0.56 0.57 0.59 0.63 0.64
0.00
0.10
0.20
0.30
0.40
0.50
0.60
0.70
Human Development Index Ga-Segonyana Local and John Taolo Gaetsewe District
Municipalities, 2002-2012
2002 2003 2004 2005 2006 2007 2008 2009 2010 2011 2012
Ga-Segonyana 0.67 0.67 0.66 0.65 0.65 0.64 0.63 0.62 0.61 0.61 0.60
John Taolo Gaetsewe 0.67 0.67 0.67 0.66 0.66 0.65 0.65 0.64 0.63 0.63 0.63
0.56
0.58
0.60
0.62
0.64
0.66
0.68
Gini Coefficient Index for Ga-Segonyana Local and John Taolo Gaetsewe District
Municipalities, 2002- 2012

INTEGRATED DEVELOPMENT PLAN 2012-2017: SECTION B 87
JOHN TAOLO GAETSEWE DISTRICT MUNICIPALITY
Ga-Segonyana had a Gini Coefficient of 0.67 in 2002 and it declined to 0.60 in 2012, in order to achieve equitable
income distribution the Gini-Coefficient would have to decline at a faster rate.
Figure 6.3.4.3 below shows the household income distribution for Ga-Segonyana local municipality in 2012.
Figure 6.3.4.3: Income Distribution per Household for Ga-Segonyana Local Municipality, 2012
Source: Global Insight 2013
The figure above shows the unequal income distribution per household. The income category with the lowest
number of household was (0-2400) and (2 400 000+) with 16 and 32 households respectively, and the income
category with the highest number of households was (30 000-54 000) with 17 731.
6.3.4.3 Access to Services
6.3.4.3.1 Education
The figure below shows the level of education attainment by the population of Ga-Segonyana local municipality for
2012.
Figure 6.3.4.4: Education Attained in Ga-Segonyana Local Municipality, 2012
0
1,000
2,000
3,000
4,000
5,000
6,000
7,000
8,000
No
of
Ho
use
ho
lds
Income in Rands
Income Distribution per Houshold for Ga-Segonyana Local Municipality, 2012

INTEGRATED DEVELOPMENT PLAN 2012-2017: SECTION B 88
JOHN TAOLO GAETSEWE DISTRICT MUNICIPALITY
Source: Global Insight 2013
The number of people who attained Grade 7-9 and grade 10-11 had a combined percentage of 47 in Ga-Segonyana.
22 percent of the population attained matric and on 2 percent managed to attained post matric qualifications.
6.3.4.3.2 Housing
Figure 6.3.4.5 shows the formal dwelling back for Ga-Segonyana local municipality from 2002 to 2012.
Figure 6.3.4.5: Formal Dwelling Backlog for Ga-Segonyana Local Municipality, 2002-2012
8%2%
12%
23%
24%1%
22%
6%
1% 1%
Education Attained in Ga-Segonyana Local Municipality, 2012
No schooling
Grade 0-2
Grade 3-6
Grade 7-9
Grade 10-11
Certificate / diploma without matric
Matric only
Matric & certificate / diploma
Matric & Bachelors degree
Matric & Postgrad degree

INTEGRATED DEVELOPMENT PLAN 2012-2017: SECTION B 89
JOHN TAOLO GAETSEWE DISTRICT MUNICIPALITY
Source: Global Insight 2013
The formal dwelling backlog increased from 6 749 in 2002 to 15 119 in 2012 and expected to increase further due to
the increase in population and shortage of resources.
6.3.4.4 Access to Basic Services
Table 6.3.4.2 below shows the total number of households with and without access to basic services for the years
2002 and 2012.
There was a measly decline of 233 with regards to households with access to electricity, but the number of
households without access to electricity declined from 3 596 in 2002 to 2 688 in 2012. There was a relative increase
in the number of households with access to general basic services and a decline in the number of households without
with the exception of access to refuse removal and flush toilets. The number of households without access to flush
toilets increased from 1 042 to 1 787.
6.3.4.5 Conclusion
The percentage of people living in poverty decreased from 54.3 percent in 2002 to 36.9 in 2012. The Gini
Coefficient declined over the years showing an improvement with regards to income inequality and most of the
0 500 1,000 1,500 2,000 2,500 3,000 3,500 4,000 4,500 5,000
2002
2003
2004
2005
2006
2007
2008
2009
2010
2011
2012
Formal Dwelling Backlog for Ga-Segonyana Local Municipality, 2002-2012
Table 6.3.4.2: Access to Basics Services for Households in Gamagara Local Municipality, 2002 and 2012
Basic Services
Households with
access Households without access Households with access
Households without
access
Electricity 9,372 3,596 9,139 2,688
Flush Toilets 13,321 1,042 10,674 1,787
Piped water 8,162 4,612 19,951 2,109
Refuse Removal 38 105 2,083 1,214
Source: Global Insight 2013
2002 2012

INTEGRATED DEVELOPMENT PLAN 2012-2017: SECTION B 90
JOHN TAOLO GAETSEWE DISTRICT MUNICIPALITY
households in the area earn between R30 000 to R54 000. Formal dwelling backlog was at its highest in 2012, which
is a challenge as population continues to increase.
6.4 Joe Morolong Local Municipality
6.4.1 Demographic Profile
6.4.1.1 Population Profile
On average, the population size of Joe Morolong local municipality contracted by 1.30 percent between 2002 and
2012. Despite the contraction, Joe Morolong continued to be the second mostly populated municipality in John
Taolo Gaetsewe district. In 2002, Joe Morolong had a population share of 49.47 percent. However, this share
declined to 38.71 percent in 2012. Table 6.4.1.1 shows the population profile of Joe Morolong local municipality for
2002 and 2012.
About 96 percent of the total population of Joe Morolong was Africans while there were only 176 Asians living in
the municipality. The population of Joe Morolong was mostly females, representing more than 54 percent of the
total population. Despite the decrease in the population size, the number of households continued to increase, hence
the municipality had a decrease in the average number of people living in one household.
Figure 6.4.1.1 below show the population pyramid of Joe Morolong local municipality for 2012.
Figure 6.4.1.1: Population Pyramid for Joe Morolong Local Municipality, 2012
Table 6.4.1.1: Population Profile for Joe Morolong Local Municipality, 2002 and 2012
Joe Morolong John Taolo Gaetsewe Number of Households Average number of people per Household
2002 95 941 193 918 22 384 4.29
2012 84 165 217 400 25 106 3.35
% Change -1.30 1.15
TOTAL POPULATION BY RACE AND GENDER
Race Male Female Total
2012 African 36 511 44 677 81 189
White 540 471 1 011
Coloured 861 929 1 790
Asian 136 40 176
Total 38 048 46 117 84 165
Source: Global Insight, 2013
TOTAL POPULATION HOUSEHOLDS

INTEGRATED DEVELOPMENT PLAN 2012-2017: SECTION B 91
JOHN TAOLO GAETSEWE DISTRICT MUNICIPALITY
Source: Global Insight, 2013
The pyramid above is expansive, characterised by a wide base which indicates a large number of youth. The age
group with the largest population is 00-04 while the age group with the smallest population is 70-74. The pyramid is
right-skewed, reflecting the large number of females.
Figure 6.4.1.2 below shows the population growth rate of Joe Morolong local municipality for the period 2002 to
2012.
Figure 6.4.1.2: Population Growth Rate for Joe Morolong, 2002-2012.
8 000 6 000 4 000 2 000 0 2 000 4 000 6 000 8 000
00-04
05-09
10-14
15-19
20-24
25-29
30-34
35-39
40-44
45-49
50-54
55-59
60-64
65-69
70-74
75+
Population Pyramid for Joe Morolong Local Municipality, 2012
Male Female

INTEGRATED DEVELOPMENT PLAN 2012-2017: SECTION B 92
JOHN TAOLO GAETSEWE DISTRICT MUNICIPALITY
Source: Global Insight, 2013
Joe Morolong recorded a negative growth rate between 2002 and 2007. Population growth rate started with -4.2
percent in 2002 and increased to 0.7 percent in 2009 before dropping to 0.2 percent in 2012. The average population
growth rate was -1.30 for the period under study.
6.4.1.2 Urbanisation
Figure 6.4.1.3 below shows the urbanisation rate for Joe Morolong local and John Gaetsewe district municipalities
for the period 2002-2012.
Figure 6.4.1.3: Urbanisation Rate for Joe Morolong Local and John Gaetsewe District Municipalities, 2002-
2012
2002 2003 2004 2005 2006 2007 2008 2009 2010 2011 2012
Population Growth Rate -4.2% -4.0% -3.7% -3.4% -2.6% -1.6% 0.5% 0.7% 0.7% 0.4% 0.2%
-5.0%
-4.0%
-3.0%
-2.0%
-1.0%
0.0%
1.0%
Population Growth Rate for Joe Morolong, 2002-2012

INTEGRATED DEVELOPMENT PLAN 2012-2017: SECTION B 93
JOHN TAOLO GAETSEWE DISTRICT MUNICIPALITY
Source: Global Insight, 2013
The figure above shows that the majority of people in Joe Morolong live in rural areas. Urbanisation rate decreased
from 3.0 percent in 2002 to 2.1 percent in 2012.
6.4.1.3 Conclusion
The population size of Joe Morolong decreased from 95 941 in 2002 to 84 165 in 2012, with -1.30 average
population growth rate. Africans constituted about 96 percent of the total population with females dominating. In
terms of the population pyramid, the population of Joe Morolong consisted mainly of youth. The local municipality
is mostly rural
6.4.2 Economy
6.4.2.1 Economic Growth
The graph below shows the growth rates for Joe Morolong local and John Taolo Gaetsewe district municipalities for
the period 2002-2015.
Figure 6.4.2.1: Growth Rate for Joe Morolong Local and John Taolo Gaetsewe District Municipalities, 2002-
2015
2002 2003 2004 2005 2006 2007 2008 2009 2010 2011 2012
John Taolo Gaetsewe 23.3% 23.9% 24.5% 25.1% 25.9% 26.7% 27.3% 28.2% 28.8% 29.2% 29.7%
Joe Morolong 3.0% 2.9% 2.7% 2.6% 2.6% 2.5% 2.5% 2.4% 2.3% 2.2% 2.1%
0.0%
5.0%
10.0%
15.0%
20.0%
25.0%
30.0%
35.0%
Urbanisation Rate for Joe Morolong Local and John Taolo Gaetsewe
District Municipalities, 2002-2012

INTEGRATED DEVELOPMENT PLAN 2012-2017: SECTION B 94
JOHN TAOLO GAETSEWE DISTRICT MUNICIPALITY
Source: Global Insight, 2013
Joe Morolong and John Taolo Gaetsewe municipalities registered negative growth rates of 2.3 and 3.1 percent
respectively in 2007. The whole world was going through a recession in 2009; however these economies recorded
positive growths of 4 and 5.8 percent apiece. Even though their growths were slightly lower in 2012, it is forecasted
to grow further in the outer years.
6.4.2.2 Sector Contribution
Table 6.4.2.1 below shows the sector contribution and their respective industries for Joe Morolong local
municipality for the period 2002-2012.
The table above shows that the primary sector contributed the most at 59 percent followed by the tertiary at 38
percent while the secondary was the least at 4 percent. The highest contributions in the respective sectors were
mainly due to activities in the mining, construction and community services industries. The finance industry
recorded the highest year-on-year growth at 14.32 percent while manufacturing was the least at 5.77 percent.
6.4.2.3 Trade
The figure below shows the value of only imports for the Joe Morolong local municipality, from 2002 to 2012.
There is no data recorded for the exported goods and services.
2002 2003 2004 2005 2006 2007 2008 2009 2010 2011 2012 2013 2014 2015
Joe Morolong 3.4 0.7 -1.1 0.1 7.9 -2.3 7.1 4.0 3.7 3.2 0.9 3.7 3.4 3.7
John Taolo Gaetsewe 7.0 0.7 0.5 0.2 8.0 -3.1 7.6 5.8 4.2 3.9 1.3 4.0 3.7 3.9
-4.0
-2.0
0.0
2.0
4.0
6.0
8.0
10.0P
erce
nta
ge
Growth Rates for Joe Morolong Local and John Taolo Gaetsewe District
Municipalities, 2002-2015
Table 6.4.2.1: Sector Contribution for Joe Morolong Local Municipality, 2002-2012
Sectors (R'000) 2002 2003 2004 2005 2006 2007 2008 2009 2010 2011 2012 % Change
Primary 846,867 700,926 727,202 809,231 1,055,290 1,088,331 1,500,748 1,761,127 1,907,381 2,130,351 2,164,956 9.84
Agriculture 47,643 58,637 61,847 55,120 67,256 83,324 95,427 99,609 99,774 97,214 108,676 8.60
Mining 799,224 642,289 665,355 754,111 988,034 1,005,007 1,405,321 1,661,519 1,807,607 2,033,137 2,056,280 9.91
Secondary 51,021 48,189 51,610 53,278 64,246 69,115 92,174 116,457 107,972 115,345 119,100 8.85
Manufacturing 16,903 18,086 18,742 20,597 22,068 20,556 31,092 26,012 27,011 26,660 29,625 5.77
Electricity 16,232 14,798 14,277 12,247 15,604 14,283 19,922 35,907 31,690 36,826 36,552 8.46
Construction 17,887 15,305 18,591 20,433 26,574 34,276 41,160 54,538 49,272 51,859 52,924 11.46
Tertiary 474,318 521,185 552,141 641,372 709,884 823,198 925,959 1,004,410 1,111,429 1,253,133 1,357,243 11.09
Trade 81,192 94,819 104,989 116,633 142,356 162,602 164,511 181,341 194,268 209,553 226,222 10.79
Transport 34,865 35,019 36,273 42,050 47,970 54,270 58,941 60,569 61,450 76,153 80,873 8.78
Finance 64,585 63,075 69,937 87,611 118,369 154,090 188,496 165,766 188,688 217,167 246,320 14.32
Community services 293,675 328,272 340,942 395,078 401,188 452,236 514,012 596,734 667,023 750,260 803,828 10.59
Total Industries 1,372,207 1,270,300 1,330,953 1,503,881 1,829,420 1,980,644 2,518,881 2,881,995 3,126,781 3,498,829 3,641,299 10.25
Taxes less Subsidies on products 101,095 122,508 147,383 162,974 203,141 254,194 269,422 297,655 327,692 377,906 403,259 14.84
Total (Gross Domestic Product - GDP) 1,473,302 1,392,808 1,478,336 1,666,855 2,032,562 2,234,838 2,788,303 3,179,650 3,454,473 3,876,735 4,044,558 10.63Source: Global Insight, 2013

INTEGRATED DEVELOPMENT PLAN 2012-2017: SECTION B 95
JOHN TAOLO GAETSEWE DISTRICT MUNICIPALITY
Figure 6.3.2.2: Value of Imports for Joe Morolong Local Municipality, 2002-2012
Source: Global Insight, 2013
The municipality recorded the least value of imports in 2002 at R5 thousand and the highest in 2006 at R82
thousands. Even though the municipality had zero imports in 2009, it recorded R43 thousand in 2010 and 2011 and
R35 thousand in 2012.
6.4.2.4 Local Economic Development
Amongst the projects in the municipality’s IDP for the 2013/14 financial year is the Manyeding cultivation
supported by Kumba Iron Ore, Tsineng and Ncwaneng food plot that will help with alleviating poverty supported by
Assmang Blackrock mine, Surprise cattle farming supported by BHP Billiton and Dithakong Sand mining also
supported by Assmang Blackrock mine. The municipality also plans to construct a business incubator centre in the
area of Hotazel that will benefit the local entrepreneurs. These projects will help in reducing unemployment,
alleviating poverty and ultimately boosting the economy of the region.
6.4.2.5 Natural Resources
6.4.2.5.1 Land
Joe Morolong local municipality is an average small area spreading over about 9 477 square kilometres. The area is
mostly rural with about 60 percent of it compromising virgin land surface.
6.4.2.5.2 Tourism
In order to stimulate the municipality will in the 2013/14 financial year open a tourism office in Vanzylsrus and
Kiangkop will be an ideal tourism destination. Furthermore, it will embark on annual tourism marketing exhibition
shows and tourism Indaba.
6.4.2.6 Economic Infrastructure
The municipality will amongst the planned infrastructure development, upgrade the existing roads and construction
of new ones where necessary in the 2013/14 financial year. To further better the standard of living for its
community, 1000 houses will be built in several villages within the area.
6.4.2.7 Conclusion
2002 2003 2004 2005 2006 2007 2008 2009 2010 2011 2012
Imports (R'000) 5 43 53 25 82 60 62 0 43 43 35
0
10
20
30
40
50
60
70
80
90
Th
ou
sad
ns
Value of Imports for the Joe Morolong Local Municipality, 2002-2012

INTEGRATED DEVELOPMENT PLAN 2012-2017: SECTION B 96
JOHN TAOLO GAETSEWE DISTRICT MUNICIPALITY
The economies of Joe Morolong local and John Taolo Gaetsewe district municipalities followed the same trend
averaging 2.5 and 3.3 percent respectively for the period 2002 to 2012. The contribution in the area was mainly due
to activities in the mining, construction and community services industries. The municipality has identified several
projects in the IDP to ultimately boost the economy of the area. Furthermore, the tourism sector will be revived by
involving relevant stakeholders. The municipality will also embark on the infrastructure development for the current
financial year.
6.4.3 Labour Analysis
6.4.3.1 Labour Status
The labour characteristics for Joe Morolong local municipality for 2002 and 2012 is shown in table 6.4.3.1 below.
The employment contribution towards economically active population increased from 59.4 percent in 2002 to 62.3
percent in 2012 while unemployment decreased from 40.6 percent to 37.7 for the same period. The number of not
economically active population was higher than that of economically active in 2002 and 2012. The number of
working age 15-64 population decreased by 7 481 between 2002 and 2012.
Table 6.4.3.2 below shows the employment and unemployment by race and gender for Joe Morolong local
municipality for 2002 and 2012.
The employment rate in Whites increased from 4.9 percent in 2002 to 8.9 percent in 2012 while unemployment
decreased from 3.6 percent to 0.9 for the same period. Africans were the most employed while Asians were the least
for the period under study. Male were the most employed compared to their counter parts in 2002 and 2012.
The employment distribution by industry for Joe Morolong local municipality for 2002 and 2012 is shown in table
6.4.3.3 below. The mining industry had the highest year-on-year growth in employment at 6.6 percent while
agriculture had the highest negative growth at 4.6 percent. The total growth for all the industries recorded a negative
growth at 0.7 percent for the period under review.
Table 6.4.3.1: Labour Characteristics for Joe Morolong Local Municipality, 2002 and 2012
Number % Rate Number % Rate
Employed 8,764 59.4 10,294 62.3
Unemployed 6,001 40.6 6,237 37.7
Economically active 14,765 100.0 16,531 100.0
Economically Active 14,765 28.5 16,531 37.3
Not Economically Active 37,050 71.5 27,802 62.7
Working Age 15-64 Population 51,815 100.0 44,334 100.0
Source: Global Insight, 2013
2002 2012
Table 6.4.3.2: Employment and Unemployment by Race and Gender for Joe Morolong Local Municipality, 2002 and 2012
2002 2012 2002 2012
African 92.1% 85.5% 42.2% 41.0%
White 4.9% 8.9% 3.6% 0.9%
Coloured 2.9% 5.1% 26.5% 18.9%
Asian 0.1% 0.5% 21.5% 3.2%
Gender
Male 61.7% 62.2% 44.9% 41.5%
Female 38.3% 37.8% 32.2% 30.2%
Source: Global Insight, 2013
Race
Employment Unemployment

INTEGRATED DEVELOPMENT PLAN 2012-2017: SECTION B 97
JOHN TAOLO GAETSEWE DISTRICT MUNICIPALITY
The community services had the largest share of employment at 32.5 and 30.6 percent in 2002 and 2012 respectively
followed by agriculture at 20.6 percent in 2002 and mining at 28.1 percent in 2012. The electricity had the least
share in employment at 0.5 and 0.4 percent for the period under study.
6.4.3.2 Remuneration
Table 6.4.3.4 below shows remuneration by industry for Joe Morolong municipality for 2002 and 2012.
The community services industry had the largest share of remuneration at 48.2 and 48.9 percent in 2002 and 2012
respectively while electricity was the least at 1.7 and 1.6 percent for the same period. The total remuneration by
industry increased by R804 million between 2002 and 2012.
6.4.3.3 Conclusion
The employment contribution towards economically active population increased between 2002 and 2012 while
Africans were the only race that experienced a decrease in employment. The community services industry had the
largest share of employment in 2002 and 2012 while electricity had the least share in employment for the period
under study. The total remuneration by industry experienced an increase between 2002 and 2012.
Table 6.4.3.3: Employment Distribution by Industry for Joe Morolong Local Municipality, 2002 and 2012
Number % Share Number % Share
Agriculture 1,547 20.6 964 13.8 -4.6
Mining 1,040 13.9 1,967 28.1 6.6
Manufacturing 163 2.2 96 1.4 -5.1
Electricity 41 0.5 27 0.4 -4.1
Construction 220 2.9 194 2.8 -1.2
Trade 696 9.3 548 7.8 -2.4
Transport 242 3.2 158 2.3 -4.1
Finance 292 3.9 238 3.4 -2.0
Community services 2,439 32.5 2,143 30.6 -1.3
Households 830 11.1 664 9.5 -2.2
Total 7,509 100.0 7,000 100.0 -0.7
Source: Global Insight, 2013
Industry
2002 2012
% Change
Table 6.4.3.4: Remuneration by Industry for Joe Morolong Local Municipality, 2002 and 2012
Amount (R'000) % Share Amount (R'000) % Share
Agriculture 14,131 3.0 30,530 2.4 8.0
Mining 126,422 27.3 387,832 30.6 11.9
Manufacturing 8,788 1.9 20,361 1.6 8.8
Electricity 7,656 1.7 20,210 1.6 10.2
Construction 10,618 2.3 22,769 1.8 7.9
Trade 33,937 7.3 77,489 6.1 8.6
Transport 14,656 3.2 28,693 2.3 6.9
Finance 23,895 5.2 59,284 4.7 9.5
Community services 223,525 48.2 620,518 48.9 10.7
Total Industries 463,629 100.0 1,267,686 100.0 10.6
Source: Global Insight 2013
Indusries
2002 2012
% Change

INTEGRATED DEVELOPMENT PLAN 2012-2017: SECTION B 98
JOHN TAOLO GAETSEWE DISTRICT MUNICIPALITY
6.4.4 Human Development Profile
6.4.4.1 Poverty Indicators
The table below presents the poverty indicators for Joe Morolong local municipality compared to John Taolo
Gaetsewe district municipality for 2002 and 2012.
The total population decreased from 95 941 in 2002 to 84 165 in 2012, which contributed to a decline in the number
of people living in poverty. However the poverty gap almost doubled over the same period.
Figure below shows the Human Development Index (HDI) for Joe Morolong and John Taolo from 2002 to 2012.
Figure 6.4.4.1: Human Development Index for Joe Morolong and John Taolo Gaetsewe District
Municipalities, 2002-2012
Source: Global Insight 2013
Joe Morolong municipality was under-developed from 2002 to 2006 and improved from 2007 to 2012. Joe
Morolong is one of the poorer and rural local municipalities in the Northern Cape.
6.4.4.2 Income Distribution
Figure 6.4.4.2 below shows the Gini Coefficient for Joe Morolong local municipality and John Taolo district
municipality from 2002 to 2012.
Figure 6.4.4.2: Gini Coefficient for Joe Morolong Local and John Taolo Gaetsewe District Municipalities,
2001-2012
Table 6.4.4.1: Poverty for Joe Morolong Local and John Gaetsewe District Municipalities, 2002 and 2012
Municipalities Total Population
No. of People in
Poverty
% of People
in Poverty
Poverty GAP
(R million) Total Population
No. of People in
Poverty
% of People
in Poverty
Poverty GAP
(R million)
Joe Morolong 95,941 54,929 57.3% 146 84,165 30,309 36.0% 261
John Taolo Gaetsewe 193,918 106,946 55.1% 251 217,400 82,526 38.0% 401
Source: Global Insight, 2013
2002 2012
2002 2003 2004 2005 2006 2007 2008 2009 2010 2011 2012
Joe Morolong 0.45 0.46 0.47 0.49 0.49 0.50 0.51 0.52 0.53 0.58 0.59
John Taolo Gaetsewe 0.51 0.51 0.52 0.54 0.55 0.55 0.56 0.57 0.59 0.63 0.64
0.00
0.10
0.20
0.30
0.40
0.50
0.60
0.70
Human Development Index for Joe Morolong Local and John Taolo Gaetsewe
District Municipalities, 2002-2012
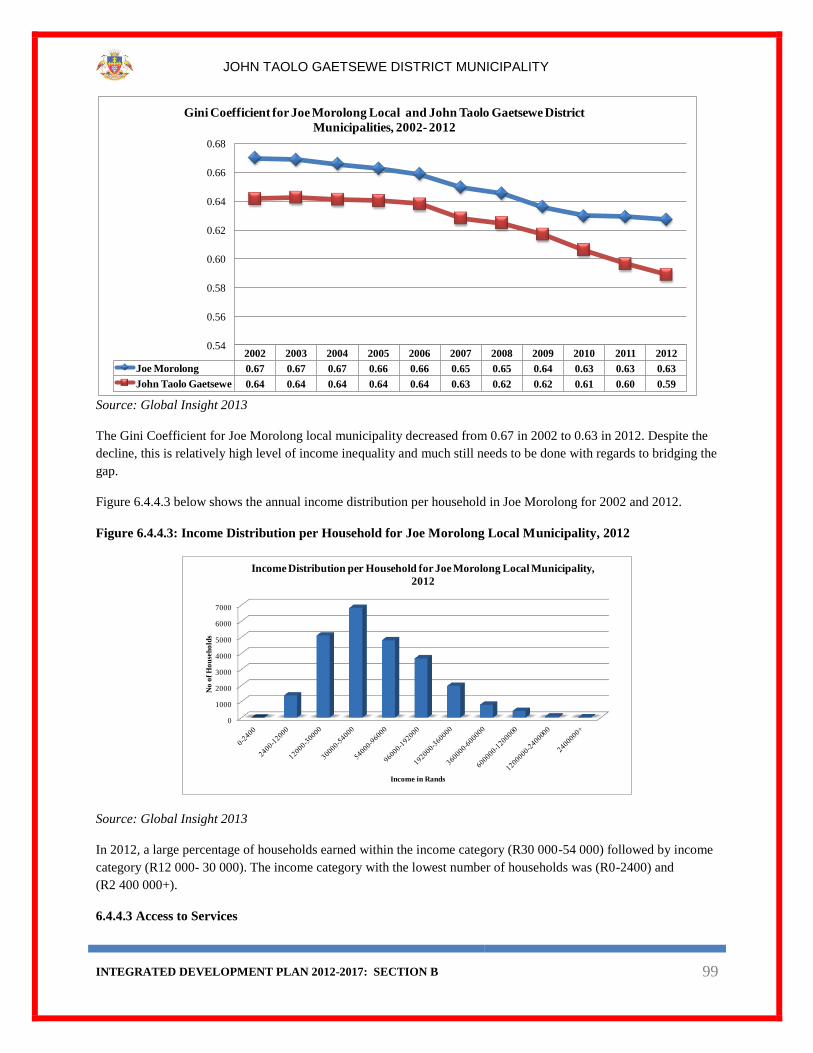
INTEGRATED DEVELOPMENT PLAN 2012-2017: SECTION B 99
JOHN TAOLO GAETSEWE DISTRICT MUNICIPALITY
Source: Global Insight 2013
The Gini Coefficient for Joe Morolong local municipality decreased from 0.67 in 2002 to 0.63 in 2012. Despite the
decline, this is relatively high level of income inequality and much still needs to be done with regards to bridging the
gap.
Figure 6.4.4.3 below shows the annual income distribution per household in Joe Morolong for 2002 and 2012.
Figure 6.4.4.3: Income Distribution per Household for Joe Morolong Local Municipality, 2012
Source: Global Insight 2013
In 2012, a large percentage of households earned within the income category (R30 000-54 000) followed by income
category (R12 000- 30 000). The income category with the lowest number of households was (R0-2400) and
(R2 400 000+).
6.4.4.3 Access to Services
2002 2003 2004 2005 2006 2007 2008 2009 2010 2011 2012
Joe Morolong 0.67 0.67 0.67 0.66 0.66 0.65 0.65 0.64 0.63 0.63 0.63
John Taolo Gaetsewe 0.64 0.64 0.64 0.64 0.64 0.63 0.62 0.62 0.61 0.60 0.59
0.54
0.56
0.58
0.60
0.62
0.64
0.66
0.68
Gini Coefficient for Joe Morolong Local and John Taolo Gaetsewe District
Municipalities, 2002- 2012
0
1000
2000
3000
4000
5000
6000
7000
No
of
Ho
use
ho
lds
Income in Rands
Income Distribution per Household for Joe Morolong Local Municipality,
2012

INTEGRATED DEVELOPMENT PLAN 2012-2017: SECTION B 100
JOHN TAOLO GAETSEWE DISTRICT MUNICIPALITY
6.4.4.3.1 Education
Figure 6.4.4.4 below shows the level of education attained in Joe Morolong for 2012.
Figure 6.4.4.4: Education Attained in Joe Morolong Local Municipality, 2012
Source: Global Insight 2013
According to figure above 25 percent of the population managed to attain grade 7-9 education, there was a fewer
percentage of people who attained matric only with 13 percent. Education remains a concern as less than 1 percent
managed to attain post matric qualification and 14 percent have no schooling.
6.4.4.3.2 Housing
The formal dwelling backlog was at its lowest in 2003 at 3 019 and increased to its highest backlog of 7 691 in
2012. Figure 6.4.4.5 below presents dwelling backlog for Joe Morolong local municipality for the period 2002 to
2012.
Figure 6.4.4.5: Formal Dwelling Backlog for Joe Morolong Local Municipality, 2002-2012
Source: Global Insight 2013
The increase in formal dwelling backlog could be attributed to the increasing demand on housing as a result of
increasing population.
14%
4%
19%
25%
20%
1%
13%
4%
0%0%
Education Attained in Joe Morolong Local Municipality, 2012
No schooling
Grade 0-2
Grade 3-6
Grade 7-9
Grade 10-11
Certificate / diploma without matric
Matric only
Matric & certificate / diploma
Matric & Bachelors degree
Matric & Postgrad degree
0 1,000 2,000 3,000 4,000 5,000 6,000 7,000 8,000
2002
2003
2004
2005
2006
2007
2008
2009
2010
2011
2012
Formal Dwelling Backlog for Joe Morolong Local Municipalty, 2002-2012
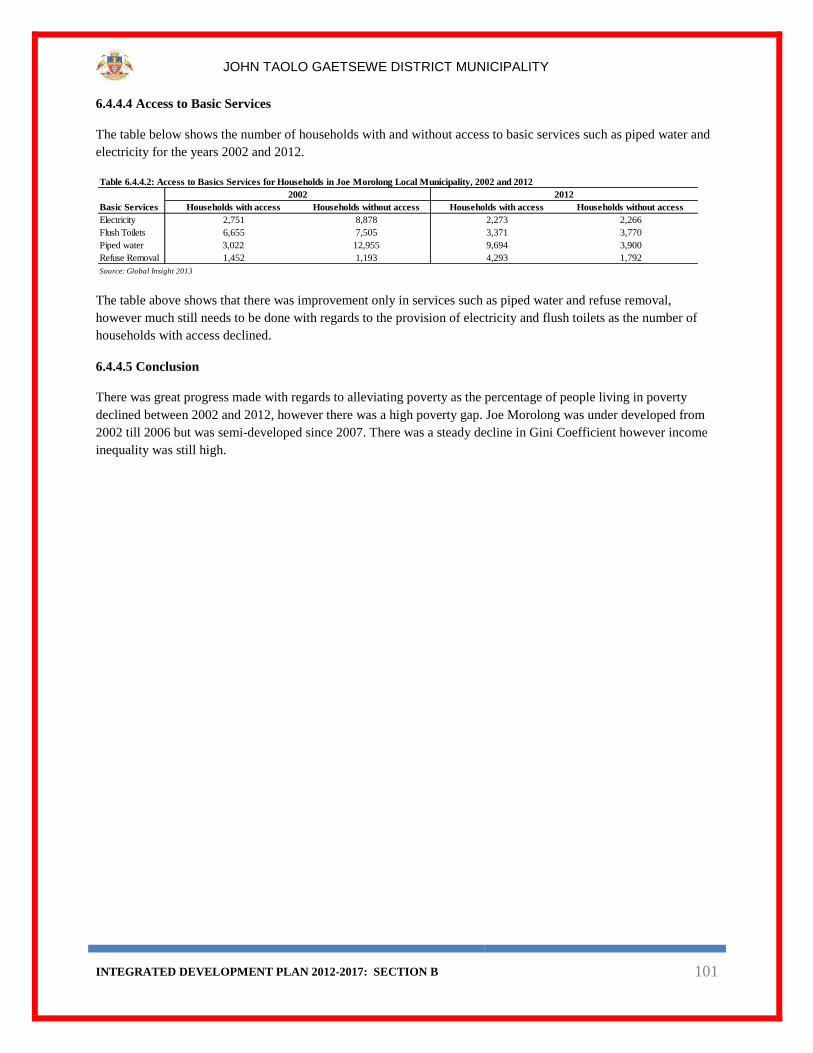
INTEGRATED DEVELOPMENT PLAN 2012-2017: SECTION B 101
JOHN TAOLO GAETSEWE DISTRICT MUNICIPALITY
6.4.4.4 Access to Basic Services
The table below shows the number of households with and without access to basic services such as piped water and
electricity for the years 2002 and 2012.
The table above shows that there was improvement only in services such as piped water and refuse removal,
however much still needs to be done with regards to the provision of electricity and flush toilets as the number of
households with access declined.
6.4.4.5 Conclusion
There was great progress made with regards to alleviating poverty as the percentage of people living in poverty
declined between 2002 and 2012, however there was a high poverty gap. Joe Morolong was under developed from
2002 till 2006 but was semi-developed since 2007. There was a steady decline in Gini Coefficient however income
inequality was still high.
Table 6.4.4.2: Access to Basics Services for Households in Joe Morolong Local Municipality, 2002 and 2012
Basic Services Households with access Households without access Households with access Households without access
Electricity 2,751 8,878 2,273 2,266
Flush Toilets 6,655 7,505 3,371 3,770
Piped water 3,022 12,955 9,694 3,900
Refuse Removal 1,452 1,193 4,293 1,792
Source: Global Insight 2013
2002 2012