Embed Size (px)
Citation preview

Section C and D: Quality and Treatment of Data & Written
AnalysisCommon Problems in previous years,
Advice and Tips to do Your Best
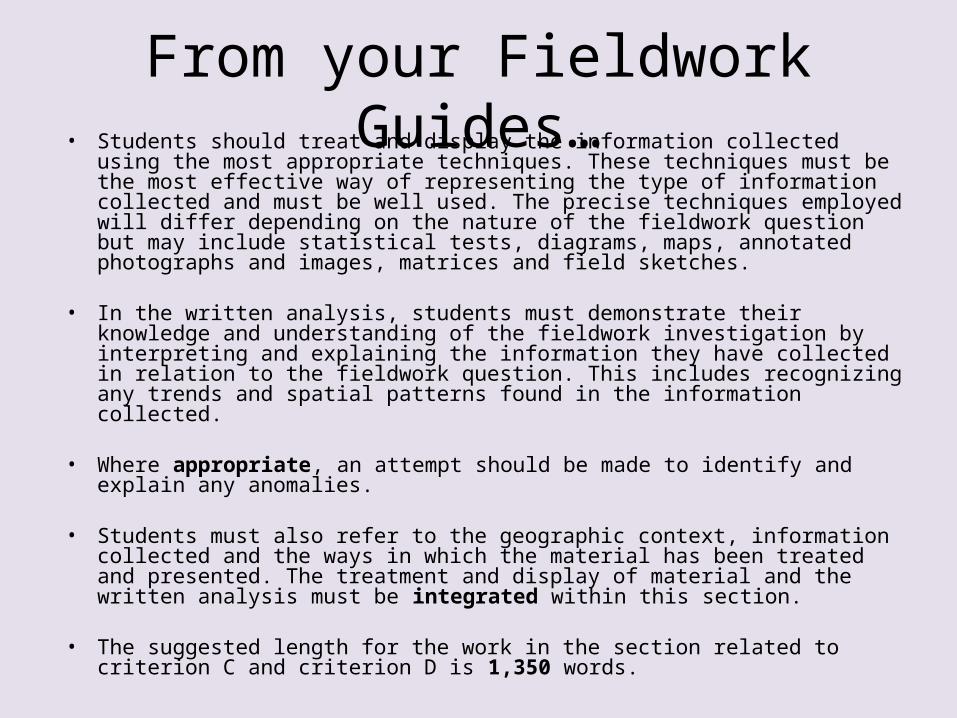
From your Fieldwork Guides…• Students should treat and display the information collected using the most
appropriate techniques. These techniques must be the most effective way of representing the type of information collected and must be well used. The precise techniques employed will differ depending on the nature of the fieldwork question but may include statistical tests, diagrams, maps, annotated photographs and images, matrices and field sketches.
• In the written analysis, students must demonstrate their knowledge and understanding of the fieldwork investigation by interpreting and explaining the information they have collected in relation to the fieldwork question. This includes recognizing any trends and spatial patterns found in the information collected.
• Where appropriate, an attempt should be made to identify and explain any anomalies.
• Students must also refer to the geographic context, information collected and the ways in which the material has been treated and presented. The treatment and display of material and the written analysis must be integrated within this section.
• The suggested length for the work in the section related to criterion C and criterion D is 1,350 words.
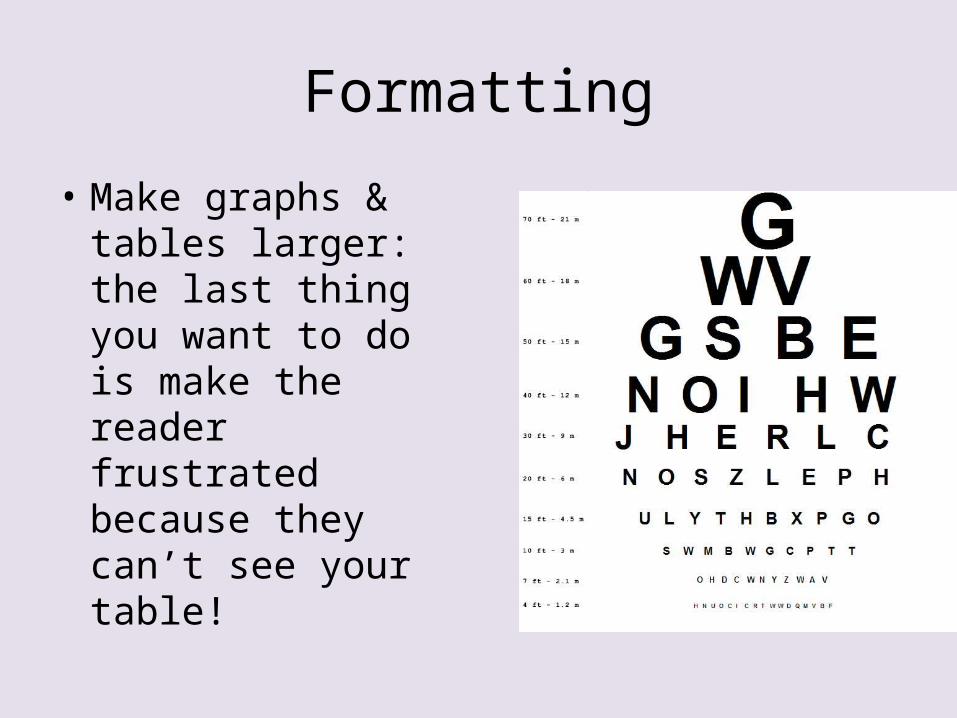
Formatting
• Make graphs & tables larger: the last thing you want to do is make the reader frustrated because they can’t see your table!
Formatting
• Check Units on ALL Graphs! – Fertility 150? 150
what? That’s Crazy! Is it the Duggars?
– Fertility: What’s the Units? (Children per woman)
Formatting
• In your writing, always use actual numbers, not words.
• Wrong: Thirty seven percent of African Americans have an Associates Degree.
• Right: 37% of African Americans have an Associate’s Degree.
Formatting
• No Contractions: • They’ve• We’d • I’d • I’m• Use the whole word: They have, We had, I
had, I am, etc.
Formatting
• Pretty please, proofread your work. No Excuses to sound Stupid!
Formatting
• Label All Graphs, (Figure 1, Table 1, etc)• Then refer to them by that label: • Example: As shown in Figure 2, blah blah
blah. • Not: As shown in the graph below…
Formatting
• Use the word CHILDREN
• Never use the word KIDS!!!
• A “kid” is the name for a young goat!!
• It’s just slang in the US!
Formatting
• This section is supposed to be around 1350 words!
• This is the most important piece of the paper!
• Being below 1000 will yield a low scoring paper.
Analytical Advice
• Your paragraphs should be set up in MelCon• M: your claim about dominant factors
contributing to high fertility• E: your data! • L: Analysis of Data• Many people in previous years began
paragraphs with a description of the graph. NO! Don’t describe graphs at all! USE graphs to help you analyze.
Analytical Advice
• No need for Introductions• Don’t tell me that you’re now going to analyze
your data. Just analyze your data!• If you begin your analysis with something that
sounds like this “After I collected data, I organized it into various scatter graphs. Now I am going to use those graphs to analyze…”
• Delete it!
Analytical Advice
• Don’t forget about secondary data!
• Idea: use it! Let it help you! If your data shows you that Mexicans have more babies on the SE side, and then you find a secondary source showing you that nationally it’s the same… You just found more data that supports your argument!!
Analytical Advice
• Don’t Forget about Interviews • Feel free to drop a line like this, – “75% of the people surveyed said
they believe that abortion is morally wrong. Furthermore, a Hispanic female in her 40s stressed in an interview that “Abortion is the Devil” thus supporting this viewpoint shared by 75% of the survey responders.”


![Untitled-1 [static.squarespace.com]€¦ · getting ready for Porsche. The previous owner wentbackto Allard Works and asked them advice about installing the Cobra engine to replace](https://img.pdfslide.net/doc/110x75/6003df22af65491a027dc4e6/untitled-1-getting-ready-for-porsche-the-previous-owner-wentbackto-allard-works.jpg)