Embed Size (px)
Citation preview

Section II: Students and Staff
Salem Student Demographics
Student Achievement Data
Student Enrollment: History and Projections
Organizational Chart of Staff
Current and Proposed Staffing Profiles
Section II | Page 1
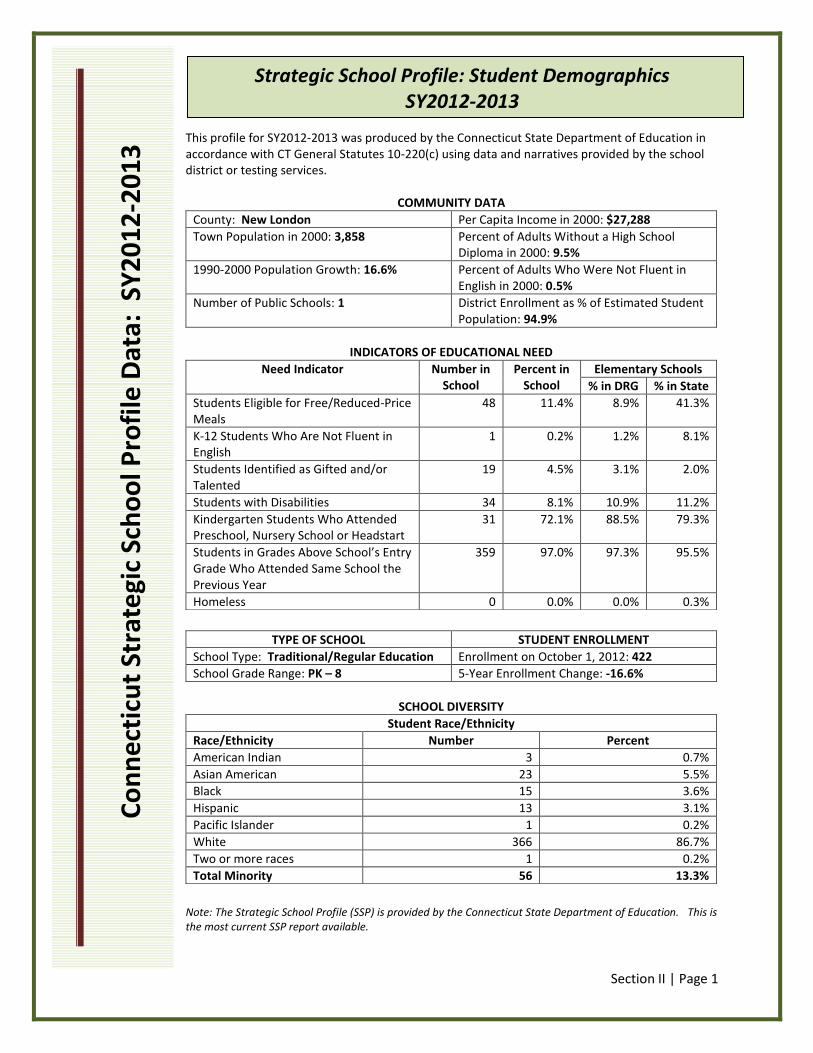
This profile for SY2012-2013 was produced by the Connecticut State Department of Education in accordance with CT General Statutes 10-220(c) using data and narratives provided by the school district or testing services.
COMMUNITY DATA
County: New London Per Capita Income in 2000: $27,288
Town Population in 2000: 3,858 Percent of Adults Without a High School Diploma in 2000: 9.5%
1990-2000 Population Growth: 16.6% Percent of Adults Who Were Not Fluent in English in 2000: 0.5%
Number of Public Schools: 1 District Enrollment as % of Estimated Student Population: 94.9%
INDICATORS OF EDUCATIONAL NEED
Need Indicator Number in School
Percent in School
Elementary Schools
% in DRG % in State
Students Eligible for Free/Reduced-Price Meals
48 11.4% 8.9% 41.3%
K-12 Students Who Are Not Fluent in English
1 0.2% 1.2% 8.1%
Students Identified as Gifted and/or Talented
19 4.5% 3.1% 2.0%
Students with Disabilities 34 8.1% 10.9% 11.2%
Kindergarten Students Who Attended Preschool, Nursery School or Headstart
31 72.1% 88.5% 79.3%
Students in Grades Above School’s Entry Grade Who Attended Same School the Previous Year
359 97.0% 97.3% 95.5%
Homeless 0 0.0% 0.0% 0.3%
TYPE OF SCHOOL STUDENT ENROLLMENT
School Type: Traditional/Regular Education Enrollment on October 1, 2012: 422
School Grade Range: PK – 8 5-Year Enrollment Change: -16.6%
SCHOOL DIVERSITY
Student Race/Ethnicity
Race/Ethnicity Number Percent
American Indian 3 0.7%
Asian American 23 5.5%
Black 15 3.6%
Hispanic 13 3.1%
Pacific Islander 1 0.2%
White 366 86.7%
Two or more races 1 0.2%
Total Minority 56 13.3%
Note: The Strategic School Profile (SSP) is provided by the Connecticut State Department of Education. This is the most current SSP report available.
Strategic School Profile: Student Demographics SY2012-2013
C
on
nec
ticu
t St
rate
gic
Sch
oo
l Pro
file
Dat
a: S
Y2
01
2-2
01
3
Section II | Page 2
In school year 2013-14, Salem students in Grades 3 through 8 participated in the Connecticut State Department of Education sponsored Smarter Balanced Assessment “field tests” in English Language Arts, Reading and Writing as well as Mathematics. Since this was a “field test”, no individual student or school results were reported. However, our 5th and 8th grade students did participate in the Connecticut Mastery Test in Science. Our students surpassed the State School Performance Index Target of 88 with a composite score of 89.9. Our students had a 100% participation rate. None of the subgroups that are reported in a typical School performance Index Score which include Black, Hispanic, English Language Learners, Free and Reduced Lunch, Students with Disabilities, and High Needs Students, were reported for Salem because our numbers are too small.
Student Demographics: 2014 School Performance Index For Connecticut Mastery Test (CMT) Science
2
01
4 S
cho
ol P
erf
orm
ance
Ind
ex
for
Co
nn
ect
icu
t M
aste
ry T
est
(C
MT)
Sci
en
ce
Section II | Page 3
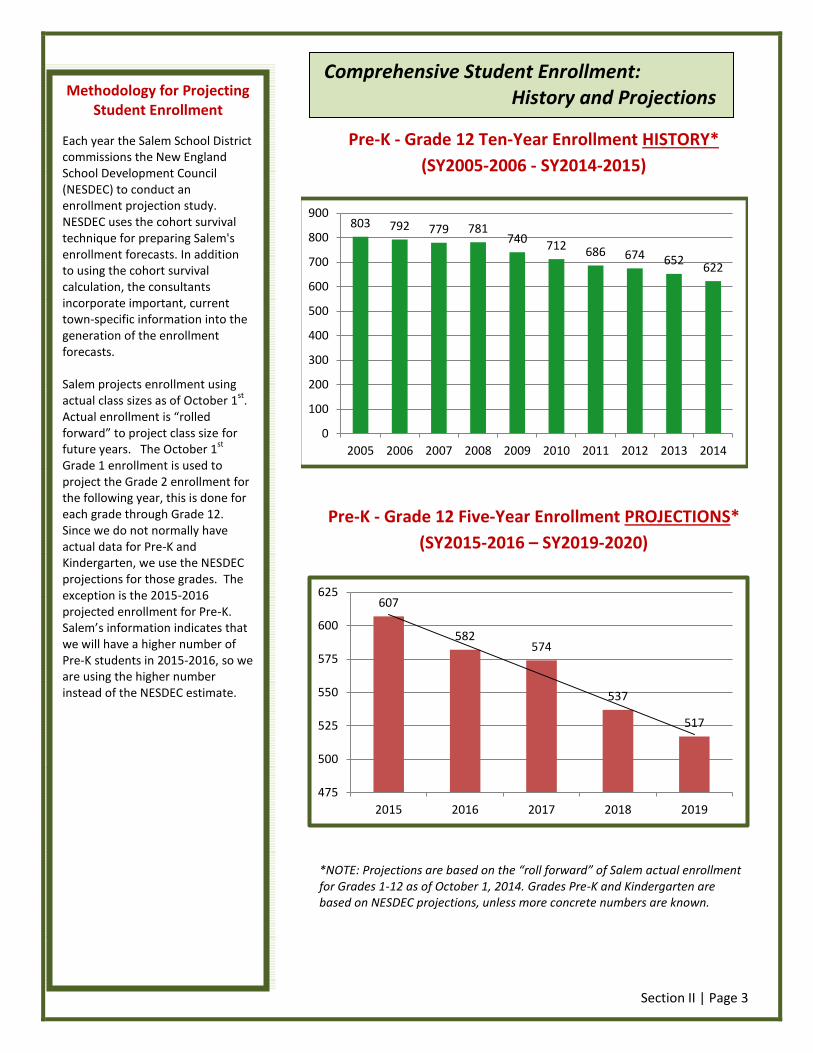
Pre-K - Grade 12 Ten-Year Enrollment HISTORY*
(SY2005-2006 - SY2014-2015)
Pre-K - Grade 12 Five-Year Enrollment PROJECTIONS*
(SY2015-2016 – SY2019-2020)
*NOTE: Projections are based on the “roll forward” of Salem actual enrollment for Grades 1-12 as of October 1, 2014. Grades Pre-K and Kindergarten are based on NESDEC projections, unless more concrete numbers are known.
607
582 574
537
517
475
500
525
550
575
600
625
2015 2016 2017 2018 2019
Comprehensive Student Enrollment: History and Projections
Methodology for Projecting Student Enrollment
Each year the Salem School District commissions the New England School Development Council (NESDEC) to conduct an enrollment projection study. NESDEC uses the cohort survival technique for preparing Salem's enrollment forecasts. In addition to using the cohort survival calculation, the consultants incorporate important, current town-specific information into the generation of the enrollment forecasts. Salem projects enrollment using actual class sizes as of October 1
st.
Actual enrollment is “rolled forward” to project class size for future years. The October 1
st
Grade 1 enrollment is used to project the Grade 2 enrollment for the following year, this is done for each grade through Grade 12. Since we do not normally have actual data for Pre-K and Kindergarten, we use the NESDEC projections for those grades. The exception is the 2015-2016 projected enrollment for Pre-K. Salem’s information indicates that we will have a higher number of Pre-K students in 2015-2016, so we are using the higher number instead of the NESDEC estimate.
803 792 779 781 740
712 686 674 652 622
0
100
200
300
400
500
600
700
800
900
2005 2006 2007 2008 2009 2010 2011 2012 2013 2014
Section II | Page 4
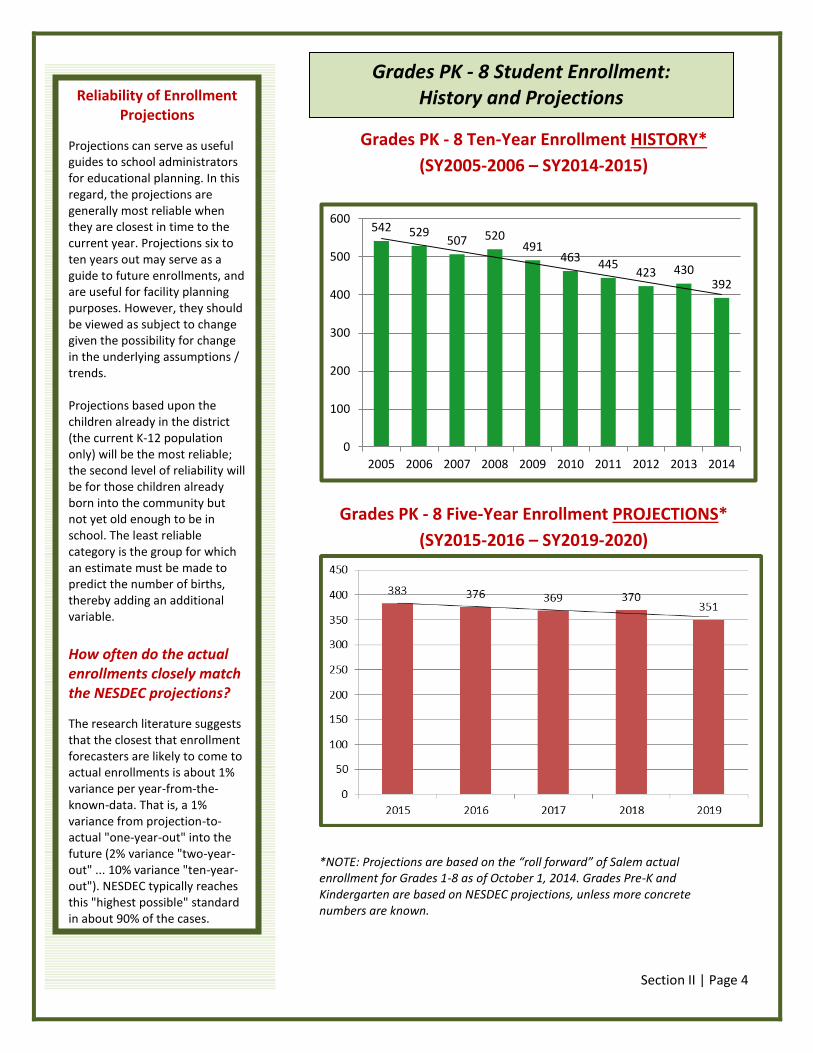
Grades PK - 8 Ten-Year Enrollment HISTORY*
(SY2005-2006 – SY2014-2015)
Grades PK - 8 Five-Year Enrollment PROJECTIONS*
(SY2015-2016 – SY2019-2020)
*NOTE: Projections are based on the “roll forward” of Salem actual enrollment for Grades 1-8 as of October 1, 2014. Grades Pre-K and Kindergarten are based on NESDEC projections, unless more concrete numbers are known.
542 529 507 520
491 463
445 423 430
392
0
100
200
300
400
500
600
2005 2006 2007 2008 2009 2010 2011 2012 2013 2014
Grades PK - 8 Student Enrollment: History and Projections
Reliability of Enrollment Projections
Projections can serve as useful guides to school administrators for educational planning. In this regard, the projections are generally most reliable when they are closest in time to the current year. Projections six to ten years out may serve as a guide to future enrollments, and are useful for facility planning purposes. However, they should be viewed as subject to change given the possibility for change in the underlying assumptions / trends. Projections based upon the children already in the district (the current K-12 population only) will be the most reliable; the second level of reliability will be for those children already born into the community but not yet old enough to be in school. The least reliable category is the group for which an estimate must be made to predict the number of births, thereby adding an additional variable.
How often do the actual enrollments closely match the NESDEC projections?
The research literature suggests that the closest that enrollment forecasters are likely to come to actual enrollments is about 1% variance per year-from-the-known-data. That is, a 1% variance from projection-to-actual "one-year-out" into the future (2% variance "two-year-out" ... 10% variance "ten-year-out"). NESDEC typically reaches this "highest possible" standard in about 90% of the cases.
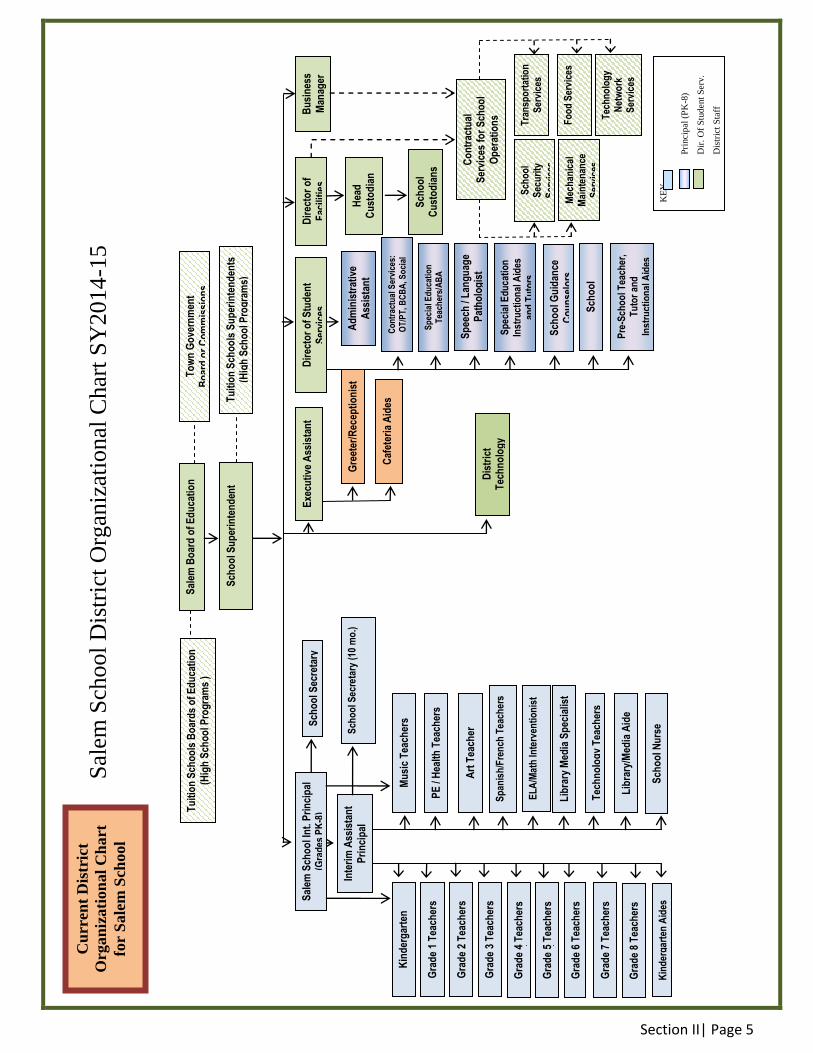
Sal
em S
chool
Dis
tric
t O
rgan
izat
ional
Char
t S
Y2014
-15
KE
Y
Pri
ncip
al
(PK
-8)
Dir
. O
f S
tudent
Serv
.
Dis
tric
t S
taff
Dir
ecto
r o
f S
tud
ent
Ser
vice
s
Sch
oo
l Sec
reta
ry (
10 m
o.)
Dir
ecto
r o
f F
acili
ties
Hea
d
Cu
sto
dia
n
Sch
oo
l C
ust
od
ian
s
Dis
tric
t T
ech
no
log
y
Sch
oo
l Sec
reta
ry
Sp
ecia
l Ed
uca
tio
n
Tea
cher
s/A
BA
C
on
sult
ants
Sp
eech
/ L
ang
uag
e P
ath
olo
gis
t
Sp
ecia
l Ed
uca
tio
n
Inst
ruct
ion
al A
ides
an
d T
uto
rs
Exe
cuti
ve A
ssis
tan
t
Sch
oo
l Su
per
inte
nd
ent
Co
ntr
actu
al
Ser
vice
s fo
r S
cho
ol
Op
erat
ion
s
Tu
itio
n S
cho
ols
Su
per
inte
nd
ents
(H
igh
Sch
oo
l Pro
gra
ms)
(Hig
h S
cho
ols
)
Gre
eter
/Rec
epti
on
ist
Sp
anis
h/F
ren
ch T
each
ers
Mu
sic
Tea
cher
s
PE
/ H
ealt
h T
each
ers
Art
Tea
cher
EL
A/M
ath
Inte
rven
tio
nis
t
Lib
rary
Med
ia S
pec
ialis
t
Tec
hn
olo
gy
Tea
cher
s
Lib
rary
/Med
ia A
ide
Inte
rim
Ass
ista
nt
Pri
nci
pal
Sch
oo
l Gu
idan
ce
Co
un
selo
rs
Bu
sin
ess
Man
ager
Sal
em S
cho
ol I
nt.
Pri
nci
pal
(G
rad
es P
K-8
)
Caf
eter
ia A
ides
Sal
em B
oar
d o
f E
du
cati
on
T
ow
n G
ove
rnm
ent
Bo
ard
or
Co
mm
issi
on
s T
uit
ion
Sch
oo
ls B
oar
ds
of
Ed
uca
tio
n
(Hig
h S
cho
ol P
rog
ram
s )
Tra
nsp
ort
atio
n
Ser
vice
s
Fo
od
Ser
vice
s
Tec
hn
olo
gy
Net
wo
rk
Ser
vice
s
Sch
oo
l S
ecu
rity
S
ervi
ces
Mec
han
ical
M
ain
ten
ance
S
ervi
ces
Sch
oo
l P
sych
olo
gis
t
Kin
der
gar
ten
T
each
ers
Gra
de
1 T
each
ers
Gra
de
2 T
each
ers
Gra
de
3 T
each
ers
G
rad
e 4
Tea
cher
s
G
rad
e 5
Tea
cher
s
Gra
de
6 T
each
ers
Gra
de
7 T
each
ers
Sch
oo
l Nu
rse
Gra
de
8 T
each
ers
Kin
der
gar
ten
Aid
es
Ad
min
istr
ativ
e A
ssis
tan
t
Co
ntr
actu
al S
ervi
ces:
O
T/P
T, B
CB
A, S
oci
al
Wo
rker
Pre
-Sch
oo
l Tea
cher
, T
uto
r an
d
Inst
ruct
ion
al A
ides
Section II| Page 5
Cu
rren
t D
istr
ict
Org
an
izati
on
al
Ch
art
for
Sale
m S
chool
Section II | Page 6
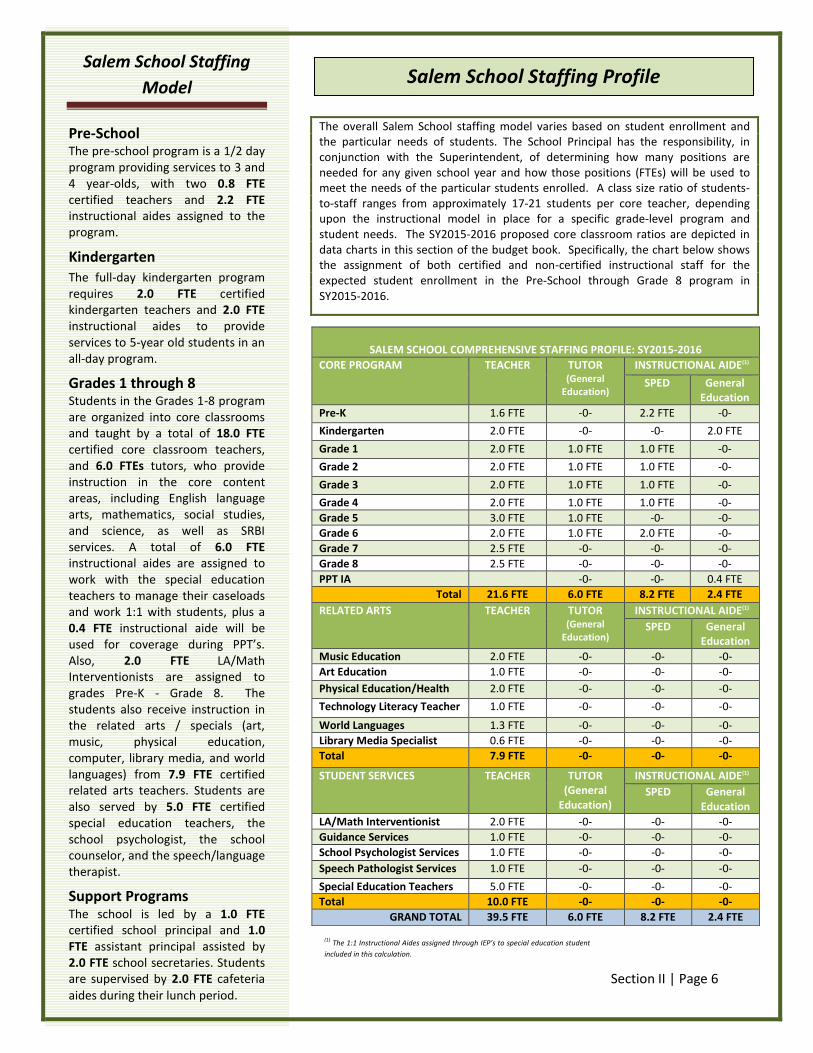
The overall Salem School staffing model varies based on student enrollment and the particular needs of students. The School Principal has the responsibility, in conjunction with the Superintendent, of determining how many positions are needed for any given school year and how those positions (FTEs) will be used to meet the needs of the particular students enrolled. A class size ratio of students-to-staff ranges from approximately 17-21 students per core teacher, depending upon the instructional model in place for a specific grade-level program and student needs. The SY2015-2016 proposed core classroom ratios are depicted in data charts in this section of the budget book. Specifically, the chart below shows the assignment of both certified and non-certified instructional staff for the expected student enrollment in the Pre-School through Grade 8 program in SY2015-2016.
SALEM SCHOOL COMPREHENSIVE STAFFING PROFILE: SY2015-2016
CORE PROGRAM TEACHER TUTOR (General
Education)
INSTRUCTIONAL AIDE(1)
SPED General Education
Pre-K 1.6 FTE -0- 2.2 FTE -0-
Kindergarten 2.0 FTE -0- -0- 2.0 FTE
Grade 1 2.0 FTE 1.0 FTE 1.0 FTE -0-
Grade 2 2.0 FTE 1.0 FTE 1.0 FTE -0-
Grade 3 2.0 FTE 1.0 FTE 1.0 FTE -0-
Grade 4 2.0 FTE 1.0 FTE 1.0 FTE -0-
Grade 5 3.0 FTE 1.0 FTE -0- -0-
Grade 6 2.0 FTE 1.0 FTE 2.0 FTE -0-
Grade 7 2.5 FTE -0- -0- -0-
Grade 8 2.5 FTE -0- -0- -0-
PPT IA -0- -0- 0.4 FTE
Total 21.6 FTE 6.0 FTE 8.2 FTE 2.4 FTE
RELATED ARTS TEACHER TUTOR (General
Education)
INSTRUCTIONAL AIDE(1)
SPED General Education
Music Education 2.0 FTE -0- -0- -0-
Art Education 1.0 FTE -0- -0- -0-
Physical Education/Health 2.0 FTE -0- -0- -0-
Technology Literacy Teacher 1.0 FTE -0- -0- -0-
World Languages 1.3 FTE -0- -0- -0-
Library Media Specialist 0.6 FTE -0- -0- -0-
Total 7.9 FTE -0- -0- -0-
STUDENT SERVICES TEACHER
TUTOR (General
Education)
INSTRUCTIONAL AIDE(1)
SPED General Education
LA/Math Interventionist 2.0 FTE -0- -0- -0-
Guidance Services 1.0 FTE -0- -0- -0-
School Psychologist Services 1.0 FTE -0- -0- -0-
Speech Pathologist Services 1.0 FTE -0- -0- -0-
Special Education Teachers 5.0 FTE -0- -0- -0-
Total 10.0 FTE -0- -0- -0-
GRAND TOTAL 39.5 FTE 6.0 FTE 8.2 FTE 2.4 FTE
(1) The 1:1 Instructional Aides assigned through IEP’s to special education students are
included in this calculation.
Salem School Staffing
Model
Pre-School The pre-school program is a 1/2 day program providing services to 3 and 4 year-olds, with two 0.8 FTE certified teachers and 2.2 FTE instructional aides assigned to the program.
Kindergarten The full-day kindergarten program requires 2.0 FTE certified kindergarten teachers and 2.0 FTE instructional aides to provide services to 5-year old students in an all-day program.
Grades 1 through 8 Students in the Grades 1-8 program are organized into core classrooms and taught by a total of 18.0 FTE certified core classroom teachers, and 6.0 FTEs tutors, who provide instruction in the core content areas, including English language arts, mathematics, social studies, and science, as well as SRBI services. A total of 6.0 FTE instructional aides are assigned to work with the special education teachers to manage their caseloads and work 1:1 with students, plus a 0.4 FTE instructional aide will be used for coverage during PPT’s. Also, 2.0 FTE
LA/Math
Interventionists are assigned to grades Pre-K - Grade 8. The students also receive instruction in the related arts / specials (art, music, physical education, computer, library media, and world languages) from 7.9 FTE certified related arts teachers. Students are also served by 5.0 FTE certified special education teachers, the school psychologist, the school counselor, and the speech/language therapist.
Support Programs
The school is led by a 1.0 FTE certified school principal and 1.0 FTE assistant principal assisted by 2.0 FTE school secretaries. Students are supervised by 2.0 FTE cafeteria
aides during their lunch period.
Salem School Staffing Profile
Section II | Page 7
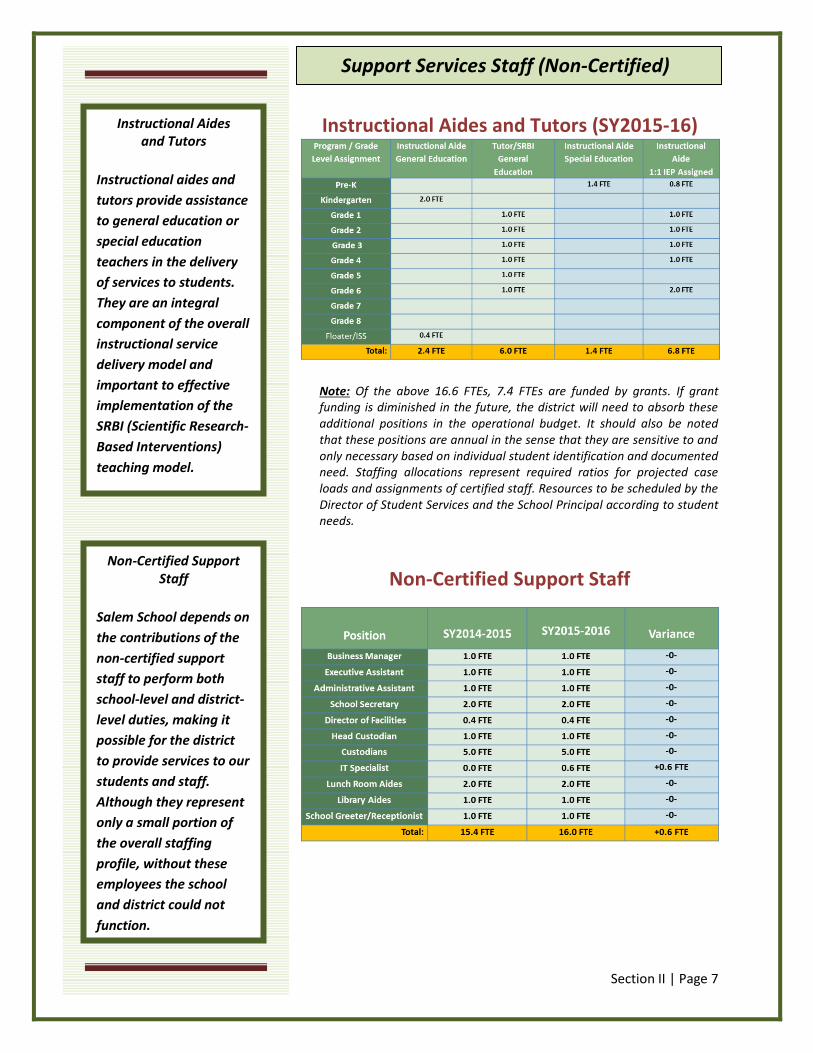
Instructional Aides and Tutors (SY2015-16)
Note: Of the above 16.6 FTEs, 7.4 FTEs are funded by grants. If grant funding is diminished in the future, the district will need to absorb these additional positions in the operational budget. It should also be noted that these positions are annual in the sense that they are sensitive to and only necessary based on individual student identification and documented need. Staffing allocations represent required ratios for projected case loads and assignments of certified staff. Resources to be scheduled by the Director of Student Services and the School Principal according to student needs.
Non-Certified Support Staff
Support Services Staff (Non-Certified)
Instructional Aides
and Tutors
Instructional aides and
tutors provide assistance
to general education or
special education
teachers in the delivery
of services to students.
They are an integral
component of the overall
instructional service
delivery model and
important to effective
implementation of the
SRBI (Scientific Research-
Based Interventions)
teaching model.
Non-Certified Support Staff
Salem School depends on
the contributions of the
non-certified support
staff to perform both
school-level and district-
level duties, making it
possible for the district
to provide services to our
students and staff.
Although they represent
only a small portion of
the overall staffing
profile, without these
employees the school
and district could not
function.

Section II | Page 8
Administrators
Staffing Profile Summary
People are our most important asset!
They make it possible for us to educate
the youth of Salem.
Administrative Staff and Staffing Summary
Administrative Staff
Both school and district
administrators provide
the leadership and
management required
for successful operation
of the Salem School. The
duties they perform and
the responsibilities they
have are varied and
comprehensive. Salem's
current administrative
team model is both
efficient and effective in
meeting the needs of our
students and staff.
Staffing Profile Summary
The SY2015-2016 Salem
School Operational
Budget supports a
responsible staffing
profile designed to
provide services to all
students at all levels of
need, while controlling
for overall costs.


![ENROLLMENT ANALYSIS JANUARY 9, 2017 · ENROLLMENT PROJECTION DISTRICTWIDE STUDENT ENROLLMENT PROJECTIONS BY SCHOOL YEAR[2] Projection Window [1] School Year 2016/2017 Enrollment is](https://img.pdfslide.net/doc/110x75/5f8b9146b2f36505874904a0/enrollment-analysis-january-9-2017-enrollment-projection-districtwide-student-enrollment.jpg)