Embed Size (px)
Citation preview
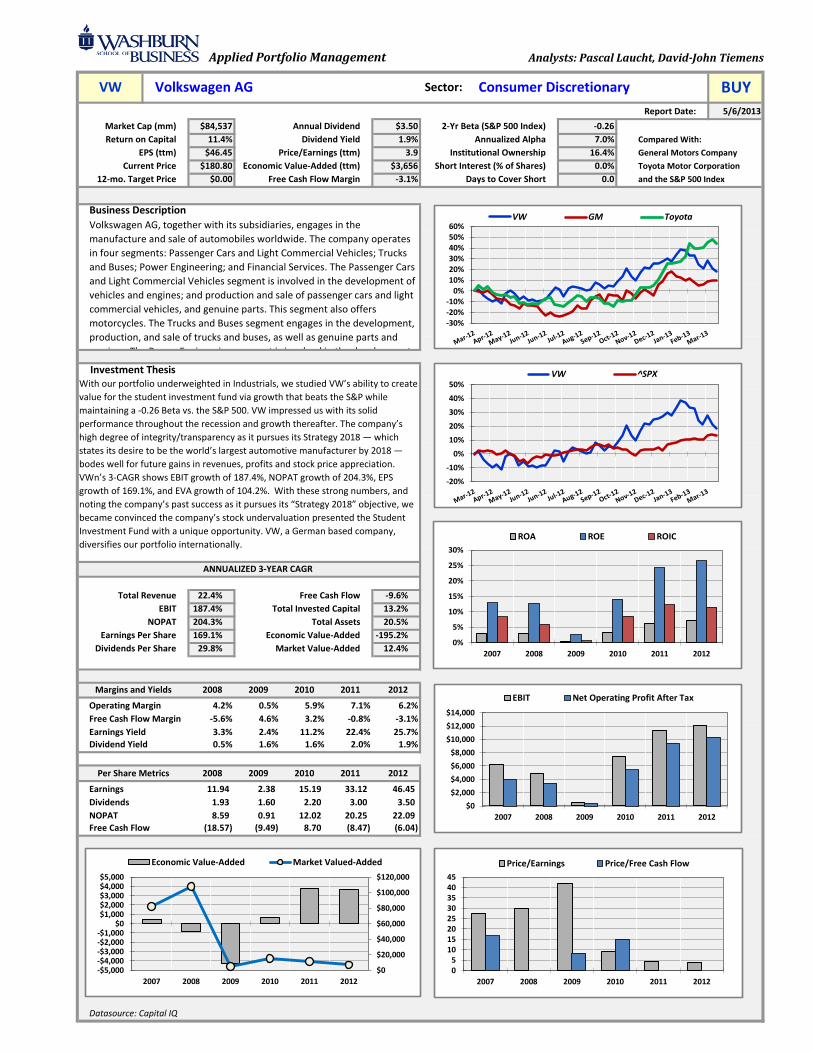
Applied Portfolio Management Analysts: Pascal Laucht, David-John Tiemens
Report Date: 5/6/2013
Market Cap (mm) $84,537 Annual Dividend $3.50 2-Yr Beta (S&P 500 Index) -0.26
Return on Capital 11.4% Dividend Yield 1.9% Annualized Alpha 7.0% Compared With:
EPS (ttm) $46.45 Price/Earnings (ttm) 3.9 Institutional Ownership 16.4% General Motors Company
Current Price $180.80 Economic Value-Added (ttm) $3,656 Short Interest (% of Shares) 0.0% Toyota Motor Corporation
12-mo. Target Price $0.00 Free Cash Flow Margin -3.1% Days to Cover Short 0.0 and the S&P 500 Index
Business Description
Total Revenue 22.4% Free Cash Flow -9.6%
EBIT 187.4% Total Invested Capital 13.2%
NOPAT 204.3% Total Assets 20.5%
Earnings Per Share 169.1% Economic Value-Added -195.2%
Dividends Per Share 29.8% Market Value-Added 12.4%
2008 2009 2010 2011 2012
4.2% 0.5% 5.9% 7.1% 6.2%
-5.6% 4.6% 3.2% -0.8% -3.1%
3.3% 2.4% 11.2% 22.4% 25.7%
0.5% 1.6% 1.6% 2.0% 1.9%
2008 2009 2010 2011 2012
11.94 2.38 15.19 33.12 46.45
1.93 1.60 2.20 3.00 3.50
8.59 0.91 12.02 20.25 22.09
(18.57) (9.49) 8.70 (8.47) (6.04)
Datasource: Capital IQ
Volkswagen AG Sector: Consumer Discretionary BUYVW
Volkswagen AG, together with its subsidiaries, engages in the
manufacture and sale of automobiles worldwide. The company operates
in four segments: Passenger Cars and Light Commercial Vehicles; Trucks
and Buses; Power Engineering; and Financial Services. The Passenger Cars
and Light Commercial Vehicles segment is involved in the development of
vehicles and engines; and production and sale of passenger cars and light
commercial vehicles, and genuine parts. This segment also offers
motorcycles. The Trucks and Buses segment engages in the development,
production, and sale of trucks and buses, as well as genuine parts and
services. The Power Engineering segment is involved in the development
Investment Thesis
ANNUALIZED 3-YEAR CAGR
With our portfolio underweighted in Industrials, we studied VW’s ability to create
value for the student investment fund via growth that beats the S&P while
maintaining a -0.26 Beta vs. the S&P 500. VW impressed us with its solid
performance throughout the recession and growth thereafter. The company’s
high degree of integrity/transparency as it pursues its Strategy 2018 — which
states its desire to be the world’s largest automotive manufacturer by 2018 —
bodes well for future gains in revenues, profits and stock price appreciation.
VWn’s 3-CAGR shows EBIT growth of 187.4%, NOPAT growth of 204.3%, EPS
growth of 169.1%, and EVA growth of 104.2%. With these strong numbers, and
noting the company’s past success as it pursues its “Strategy 2018” objective, we
became convinced the company’s stock undervaluation presented the Student
Investment Fund with a unique opportunity. VW, a German based company,
diversifies our portfolio internationally.
Margins and Yields
Operating Margin
Per Share Metrics
Earnings
NOPAT
Free Cash Flow
Dividends
Free Cash Flow Margin
Earnings Yield
Dividend Yield
-20%
-10%
0%
10%
20%
30%
40%
50%VW ^SPX
-30%-20%-10%
0%10%20%30%40%50%60%
VW GM Toyota
05
1015202530354045
2007 2008 2009 2010 2011 2012
Price/Earnings Price/Free Cash Flow
$0
$2,000
$4,000
$6,000
$8,000
$10,000
$12,000
$14,000
2007 2008 2009 2010 2011 2012
EBIT Net Operating Profit After Tax
$0
$20,000
$40,000
$60,000
$80,000
$100,000
$120,000
-$5,000-$4,000-$3,000-$2,000-$1,000
$0$1,000$2,000$3,000$4,000$5,000
2007 2008 2009 2010 2011 2012
Economic Value-Added Market Valued-Added
0%
5%
10%
15%
20%
25%
30%
2007 2008 2009 2010 2011 2012
ROA ROE ROIC
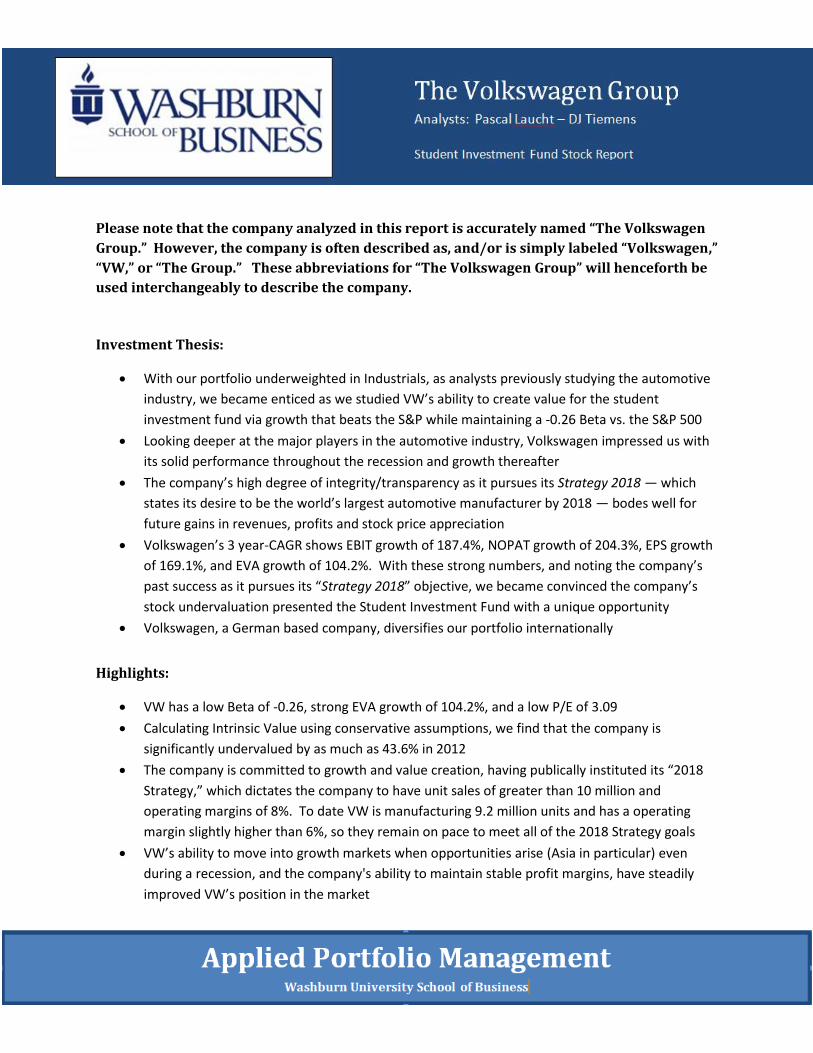
Please note that the company analyzed in this report is accurately named “The Volkswagen
Group.” However, the company is often described as, and/or is simply labeled “Volkswagen,”
“VW,” or “The Group.” These abbreviations for “The Volkswagen Group” will henceforth be
used interchangeably to describe the company.
Investment Thesis:
With our portfolio underweighted in Industrials, as analysts previously studying the automotive
industry, we became enticed as we studied VW’s ability to create value for the student
investment fund via growth that beats the S&P while maintaining a -0.26 Beta vs. the S&P 500
Looking deeper at the major players in the automotive industry, Volkswagen impressed us with
its solid performance throughout the recession and growth thereafter
The company’s high degree of integrity/transparency as it pursues its Strategy 2018 — which
states its desire to be the world’s largest automotive manufacturer by 2018 — bodes well for
future gains in revenues, profits and stock price appreciation
Volkswagen’s 3 year-CAGR shows EBIT growth of 187.4%, NOPAT growth of 204.3%, EPS growth
of 169.1%, and EVA growth of 104.2%. With these strong numbers, and noting the company’s
past success as it pursues its “Strategy 2018” objective, we became convinced the company’s
stock undervaluation presented the Student Investment Fund with a unique opportunity
Volkswagen, a German based company, diversifies our portfolio internationally
Highlights:
VW has a low Beta of -0.26, strong EVA growth of 104.2%, and a low P/E of 3.09
Calculating Intrinsic Value using conservative assumptions, we find that the company is
significantly undervalued by as much as 43.6% in 2012
The company is committed to growth and value creation, having publically instituted its “2018
Strategy,” which dictates the company to have unit sales of greater than 10 million and
operating margins of 8%. To date VW is manufacturing 9.2 million units and has a operating
margin slightly higher than 6%, so they remain on pace to meet all of the 2018 Strategy goals
VW’s ability to move into growth markets when opportunities arise (Asia in particular) even
during a recession, and the company's ability to maintain stable profit margins, have steadily
improved VW’s position in the market
Macroeconomic Analysis of the Automotive Industry:
The Automobile industry is slowly pulling itself out of the past recession, although overall industry
growth remains sluggish. The future of the industry is forecasted to grow at a slow yet stable pace.
Generally speaking, the automotive industry is cyclical, and though we are forecasting a relatively slow
recovery, we expect it to not only reach pre-recession levels, but see further growth into the future. It is
important to note however, that Volkswagen has already grown past its pre-recession numbers.
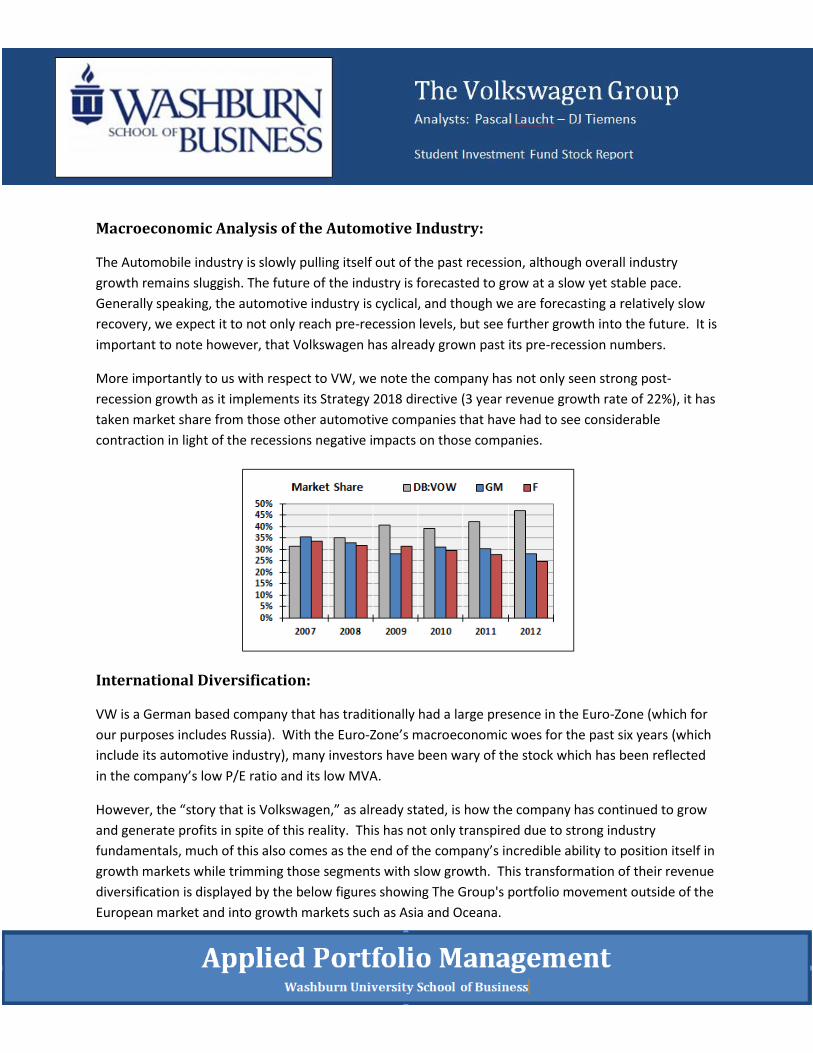
More importantly to us with respect to VW, we note the company has not only seen strong post-
recession growth as it implements its Strategy 2018 directive (3 year revenue growth rate of 22%), it has
taken market share from those other automotive companies that have had to see considerable
contraction in light of the recessions negative impacts on those companies.
International Diversification:
VW is a German based company that has traditionally had a large presence in the Euro-Zone (which for
our purposes includes Russia). With the Euro-Zone’s macroeconomic woes for the past six years (which
include its automotive industry), many investors have been wary of the stock which has been reflected
in the company’s low P/E ratio and its low MVA.
However, the “story that is Volkswagen,” as already stated, is how the company has continued to grow
and generate profits in spite of this reality. This has not only transpired due to strong industry
fundamentals, much of this also comes as the end of the company’s incredible ability to position itself in
growth markets while trimming those segments with slow growth. This transformation of their revenue
diversification is displayed by the below figures showing The Group's portfolio movement outside of the
European market and into growth markets such as Asia and Oceana.
International Diversification continued:
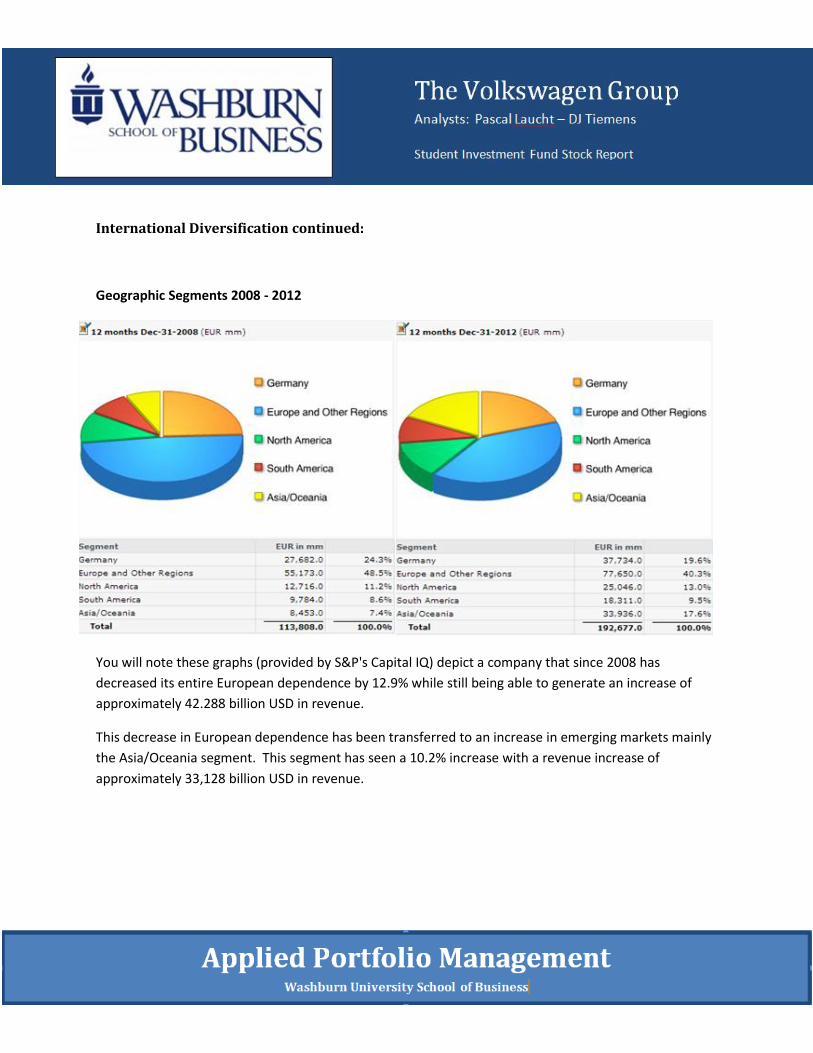
Geographic Segments 2008 - 2012
You will note these graphs (provided by S&P's Capital IQ) depict a company that since 2008 has
decreased its entire European dependence by 12.9% while still being able to generate an increase of
approximately 42.288 billion USD in revenue.
This decrease in European dependence has been transferred to an increase in emerging markets mainly
the Asia/Oceania segment. This segment has seen a 10.2% increase with a revenue increase of
approximately 33,128 billion USD in revenue.
“Strategy 2018:”
A large part of understanding The Volkswagen Group's future value involves understanding its
commitment and the transparency that comes from its “Strategy 2018” vision statement. This strategy
states that the company intends to become the world’s most successful automaker by 2018.
This vision consists of four major initiatives (as taken from The VW’s 10-K):
Volkswagen intends to deploy intelligent innovations and technologies to become a world
leader in customer satisfaction and quality.
The goal is to increase unit sales to more than 10 million vehicles per year; in particular,
Volkswagen intends to capture an above-average share of the development of the major growth
markets.
Volkswagen intends to increase its return on sales before tax to at least 8% so as to ensure that
the Group’s solid financial position and ability to act are guaranteed even in difficult market
periods.
Volkswagen aims to become the top employer across all brands, companies and regions, which will allow the company to build a first-class team.
Continued on next page.
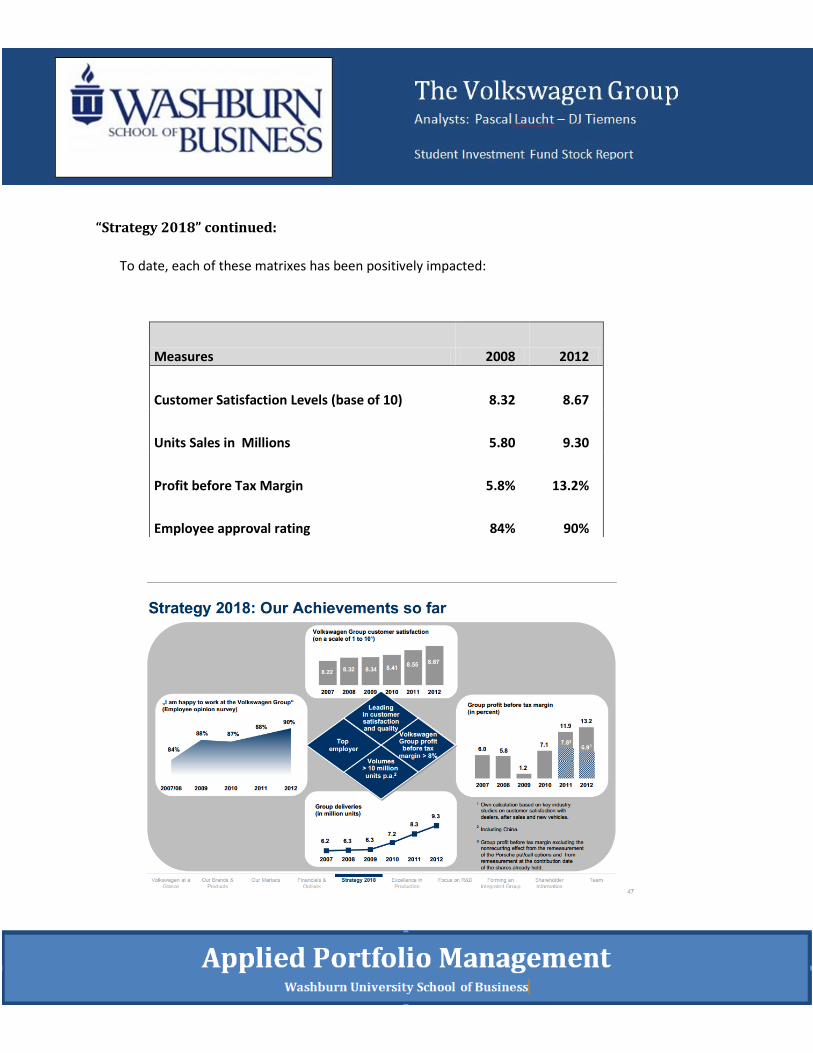
“Strategy 2018” continued:
To date, each of these matrixes has been positively impacted:
Measures 2008 2012
Customer Satisfaction Levels (base of 10) 8.32 8.67
Units Sales in Millions 5.80 9.30
Profit before Tax Margin 5.8% 13.2%
Employee approval rating 84% 90%
Financial Analysis:
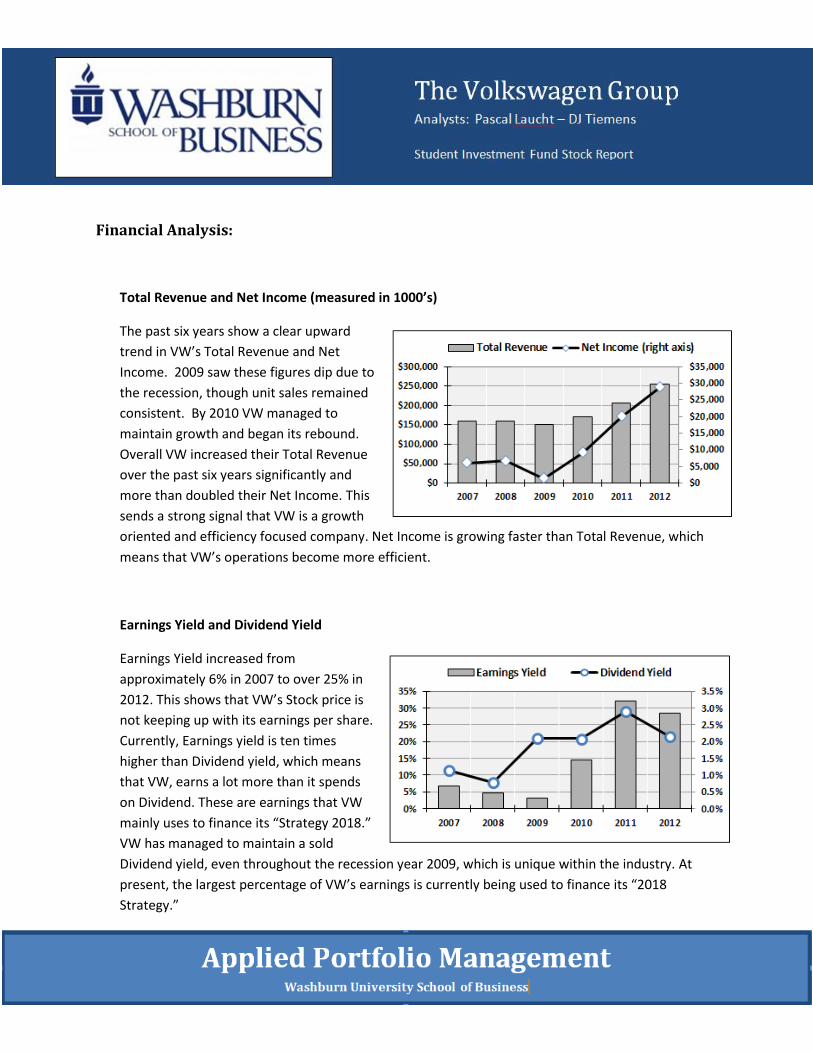
Total Revenue and Net Income (measured in 1000’s)
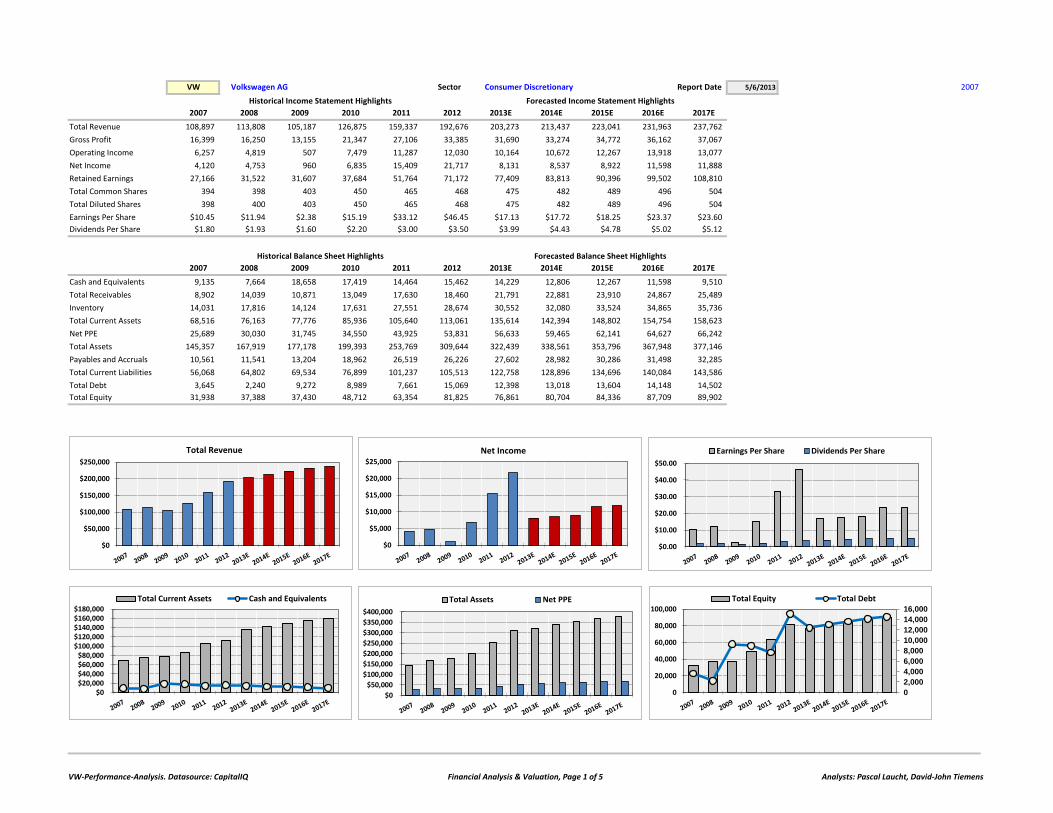
The past six years show a clear upward
trend in VW’s Total Revenue and Net
Income. 2009 saw these figures dip due to
the recession, though unit sales remained
consistent. By 2010 VW managed to
maintain growth and began its rebound.
Overall VW increased their Total Revenue
over the past six years significantly and
more than doubled their Net Income. This
sends a strong signal that VW is a growth
oriented and efficiency focused company. Net Income is growing faster than Total Revenue, which
means that VW’s operations become more efficient.
Earnings Yield and Dividend Yield
Earnings Yield increased from
approximately 6% in 2007 to over 25% in
2012. This shows that VW’s Stock price is
not keeping up with its earnings per share.
Currently, Earnings yield is ten times
higher than Dividend yield, which means
that VW, earns a lot more than it spends
on Dividend. These are earnings that VW
mainly uses to finance its “Strategy 2018.”
VW has managed to maintain a sold
Dividend yield, even throughout the recession year 2009, which is unique within the industry. At
present, the largest percentage of VW’s earnings is currently being used to finance its “2018
Strategy.”
05
1015202530354045
2007 2008 2009 2010 2011 2012
Price/Earnings Price/Free Cash Flow
0%
5%
10%
15%
20%
25%
30%
2007 2008 2009 2010 2011 2012
ROA ROE ROIC
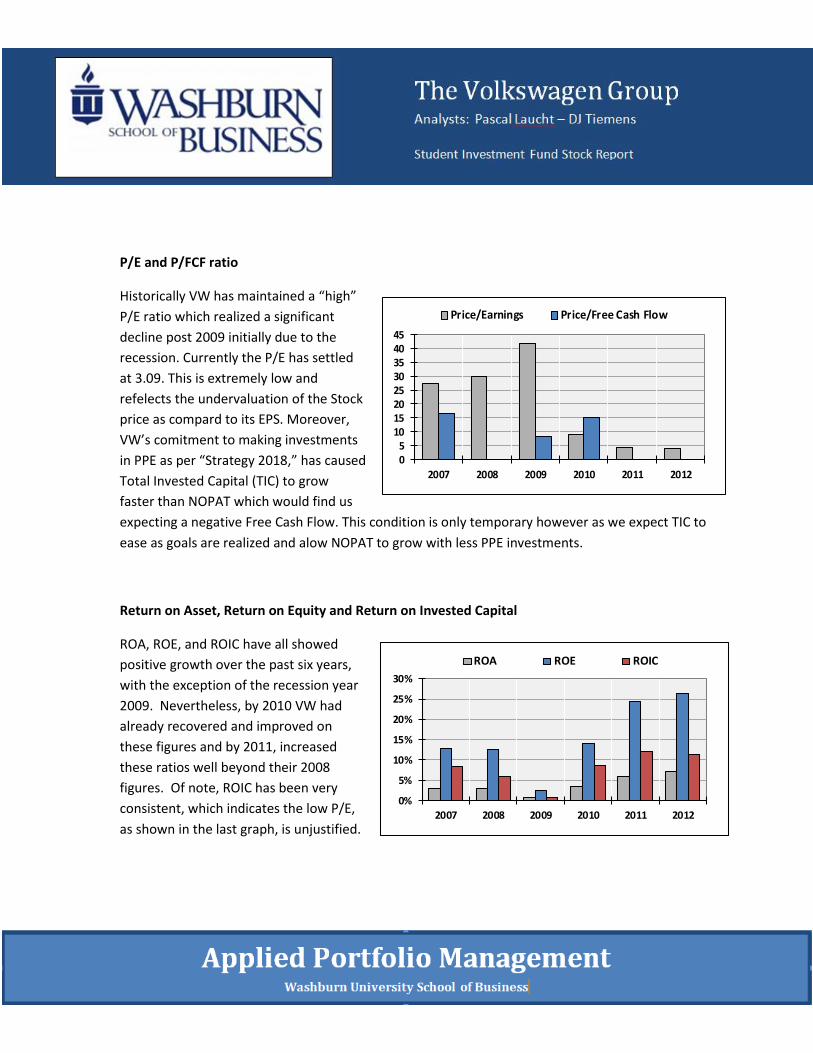
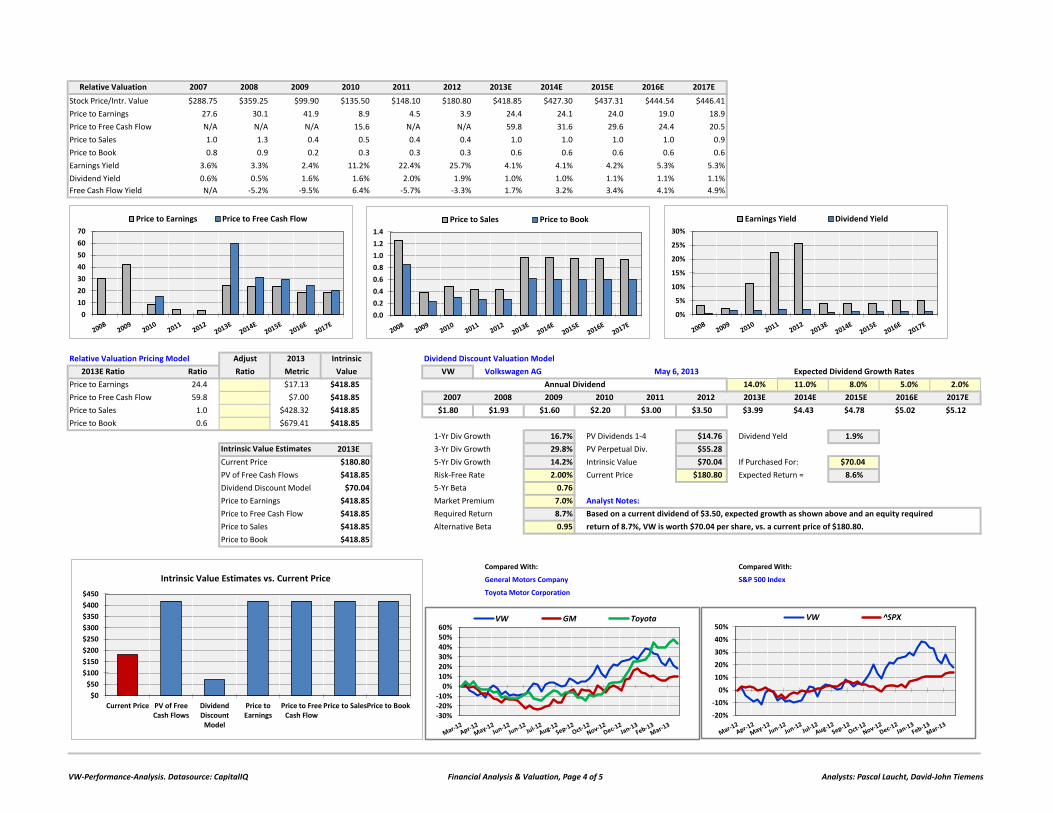
P/E and P/FCF ratio
Historically VW has maintained a “high”
P/E ratio which realized a significant
decline post 2009 initially due to the
recession. Currently the P/E has settled
at 3.09. This is extremely low and
refelects the undervaluation of the Stock
price as compard to its EPS. Moreover,
VW’s comitment to making investments
in PPE as per “Strategy 2018,” has caused
Total Invested Capital (TIC) to grow
faster than NOPAT which would find us
expecting a negative Free Cash Flow. This condition is only temporary however as we expect TIC to
ease as goals are realized and alow NOPAT to grow with less PPE investments.
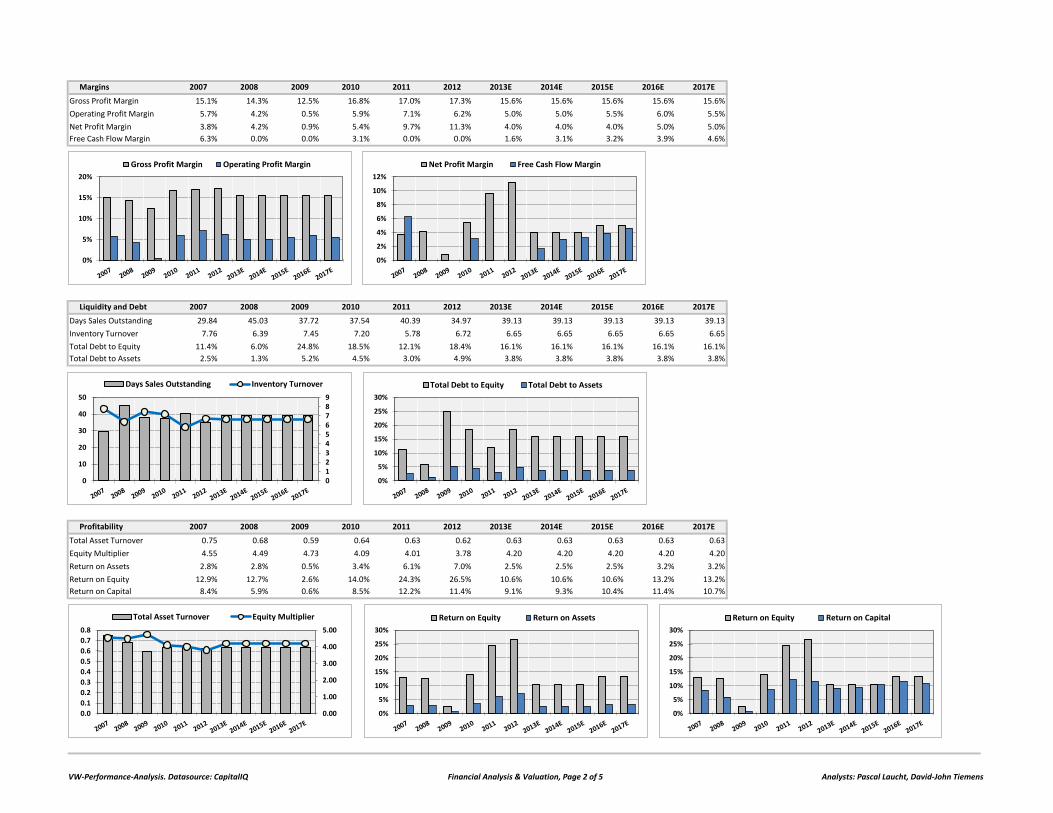
Return on Asset, Return on Equity and Return on Invested Capital
ROA, ROE, and ROIC have all showed
positive growth over the past six years,
with the exception of the recession year
2009. Nevertheless, by 2010 VW had
already recovered and improved on
these figures and by 2011, increased
these ratios well beyond their 2008
figures. Of note, ROIC has been very
consistent, which indicates the low P/E,
as shown in the last graph, is unjustified.
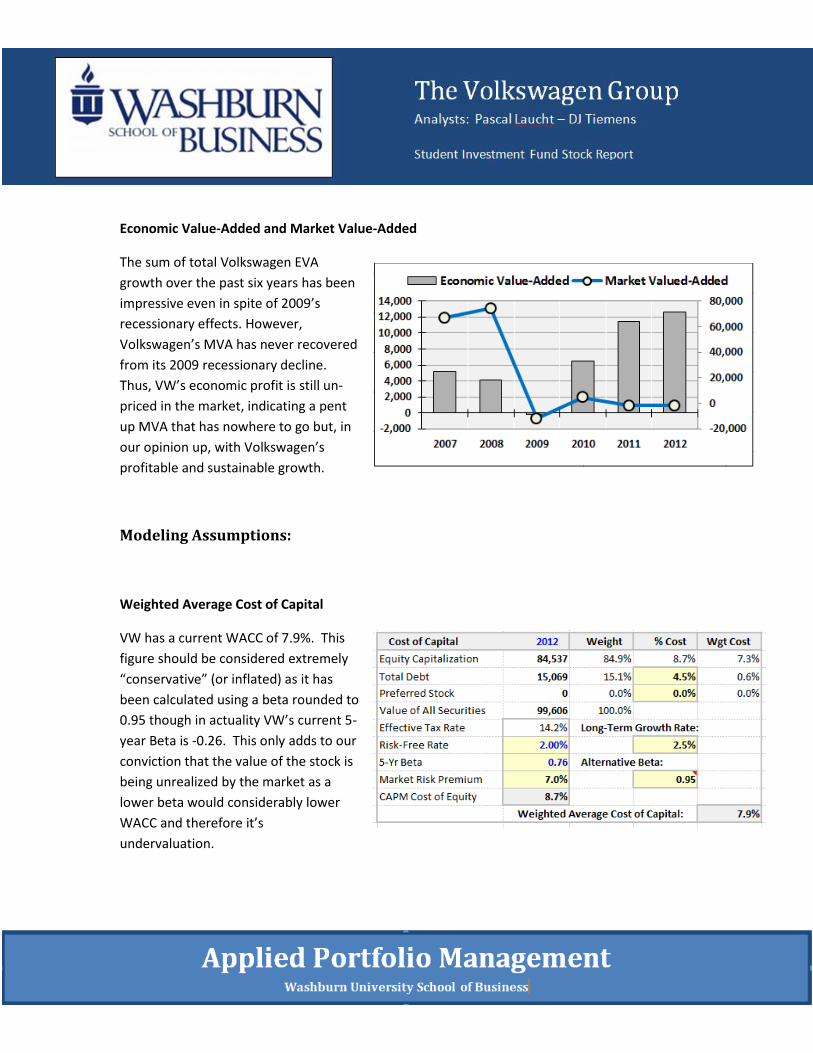
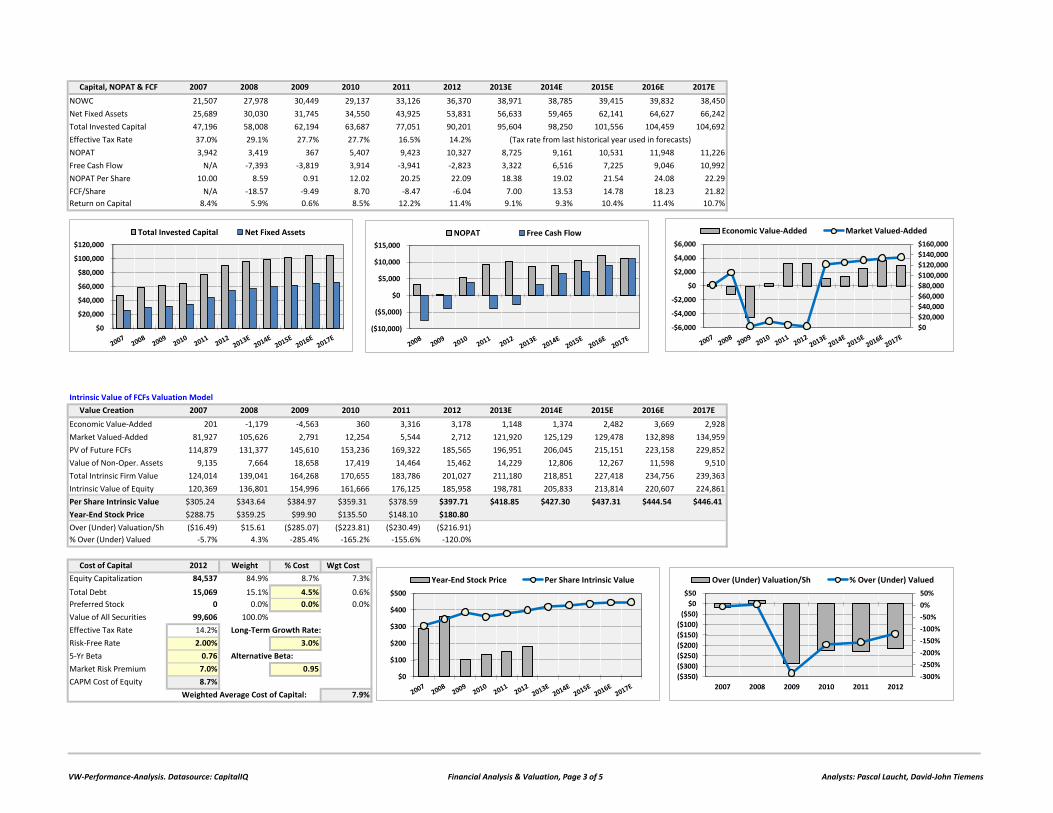
Economic Value-Added and Market Value-Added
The sum of total Volkswagen EVA
growth over the past six years has been
impressive even in spite of 2009’s
recessionary effects. However,
Volkswagen’s MVA has never recovered
from its 2009 recessionary decline.
Thus, VW’s economic profit is still un-
priced in the market, indicating a pent
up MVA that has nowhere to go but, in
our opinion up, with Volkswagen’s
profitable and sustainable growth.
Modeling Assumptions:
Weighted Average Cost of Capital
VW has a current WACC of 7.9%. This
figure should be considered extremely
“conservative” (or inflated) as it has
been calculated using a beta rounded to
0.95 though in actuality VW’s current 5-
year Beta is -0.26. This only adds to our
conviction that the value of the stock is
being unrealized by the market as a
lower beta would considerably lower
WACC and therefore it’s
undervaluation.
Comparing ROIC to WACC
Currently, VW has a ROIC of 11.4% which gives us a spread of 3.5% over our conservative WACC. Having
calculated the WACC very conservatively and expecting ROIC to increase, indicates that we can expect
an even higher spread for the future.
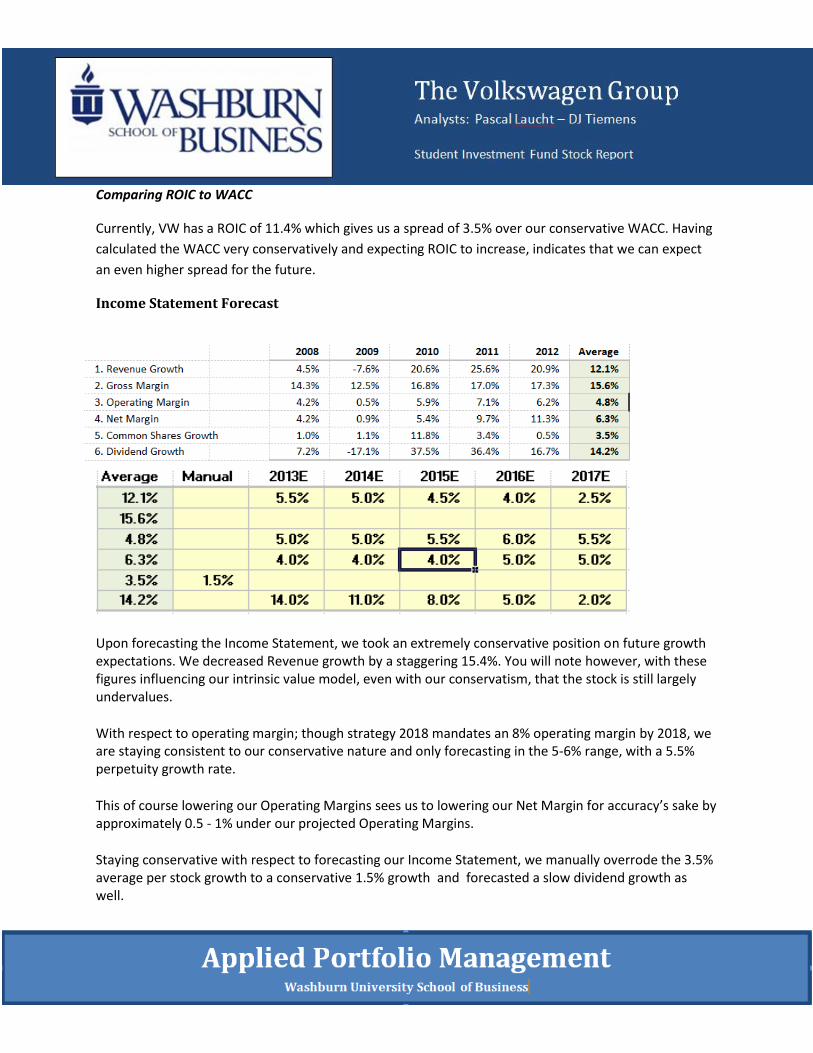
Income Statement Forecast
Upon forecasting the Income Statement, we took an extremely conservative position on future growth expectations. We decreased Revenue growth by a staggering 15.4%. You will note however, with these figures influencing our intrinsic value model, even with our conservatism, that the stock is still largely undervalues.
With respect to operating margin; though strategy 2018 mandates an 8% operating margin by 2018, we are staying consistent to our conservative nature and only forecasting in the 5-6% range, with a 5.5% perpetuity growth rate.
This of course lowering our Operating Margins sees us to lowering our Net Margin for accuracy’s sake by approximately 0.5 - 1% under our projected Operating Margins.
Staying conservative with respect to forecasting our Income Statement, we manually overrode the 3.5% average per stock growth to a conservative 1.5% growth and forecasted a slow dividend growth as well.
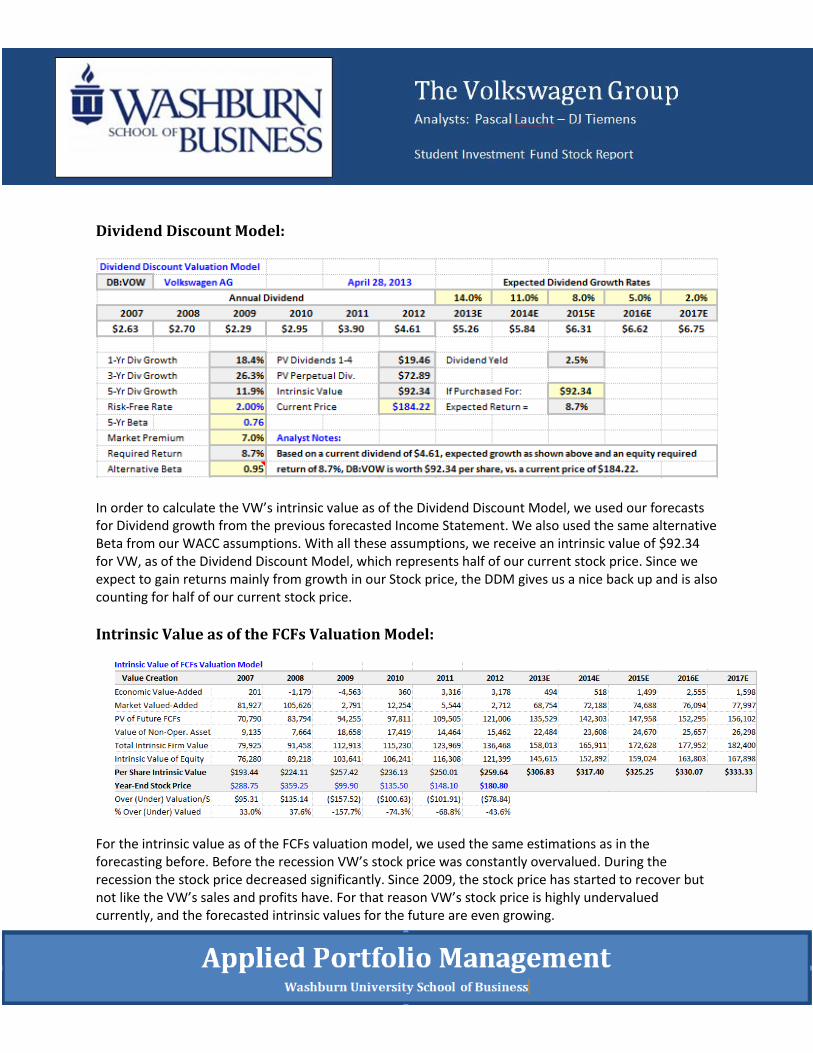
Dividend Discount Model:
In order to calculate the VW’s intrinsic value as of the Dividend Discount Model, we used our forecasts for Dividend growth from the previous forecasted Income Statement. We also used the same alternative Beta from our WACC assumptions. With all these assumptions, we receive an intrinsic value of $92.34 for VW, as of the Dividend Discount Model, which represents half of our current stock price. Since we expect to gain returns mainly from growth in our Stock price, the DDM gives us a nice back up and is also counting for half of our current stock price.
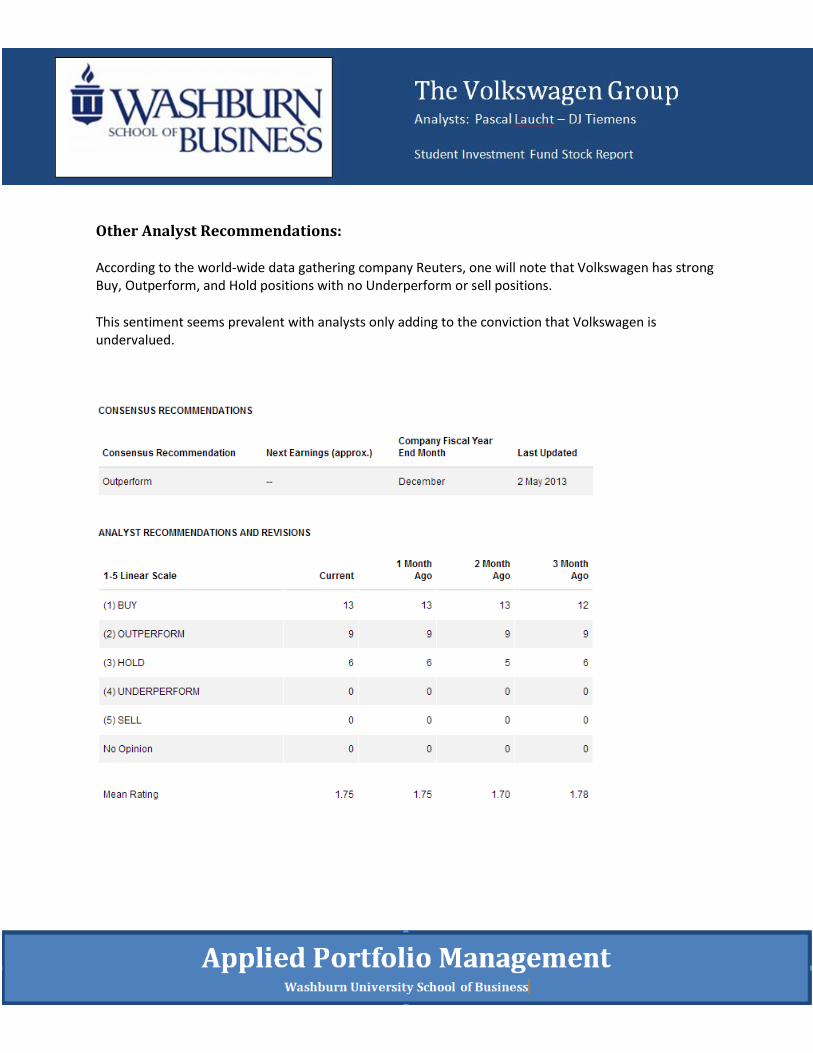
Intrinsic Value as of the FCFs Valuation Model:
For the intrinsic value as of the FCFs valuation model, we used the same estimations as in the forecasting before. Before the recession VW’s stock price was constantly overvalued. During the recession the stock price decreased significantly. Since 2009, the stock price has started to recover but not like the VW’s sales and profits have. For that reason VW’s stock price is highly undervalued currently, and the forecasted intrinsic values for the future are even growing.
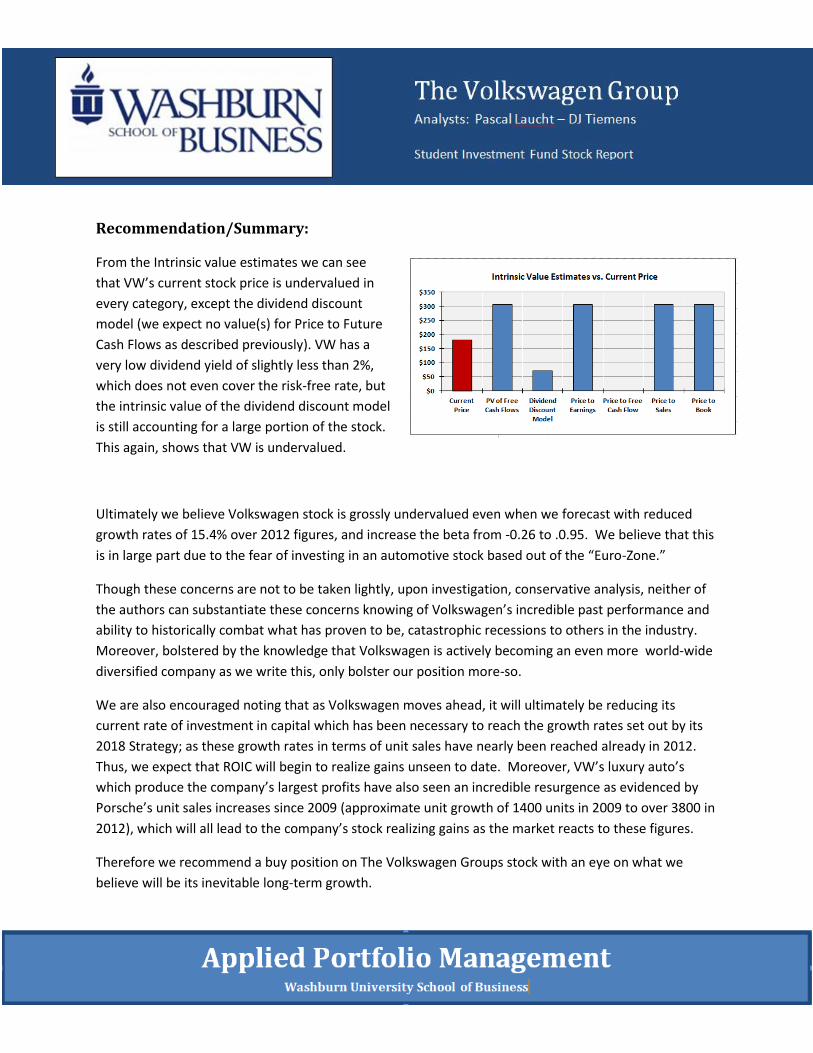
Other Analyst Recommendations:
According to the world-wide data gathering company Reuters, one will note that Volkswagen has strong Buy, Outperform, and Hold positions with no Underperform or sell positions.
This sentiment seems prevalent with analysts only adding to the conviction that Volkswagen is undervalued.
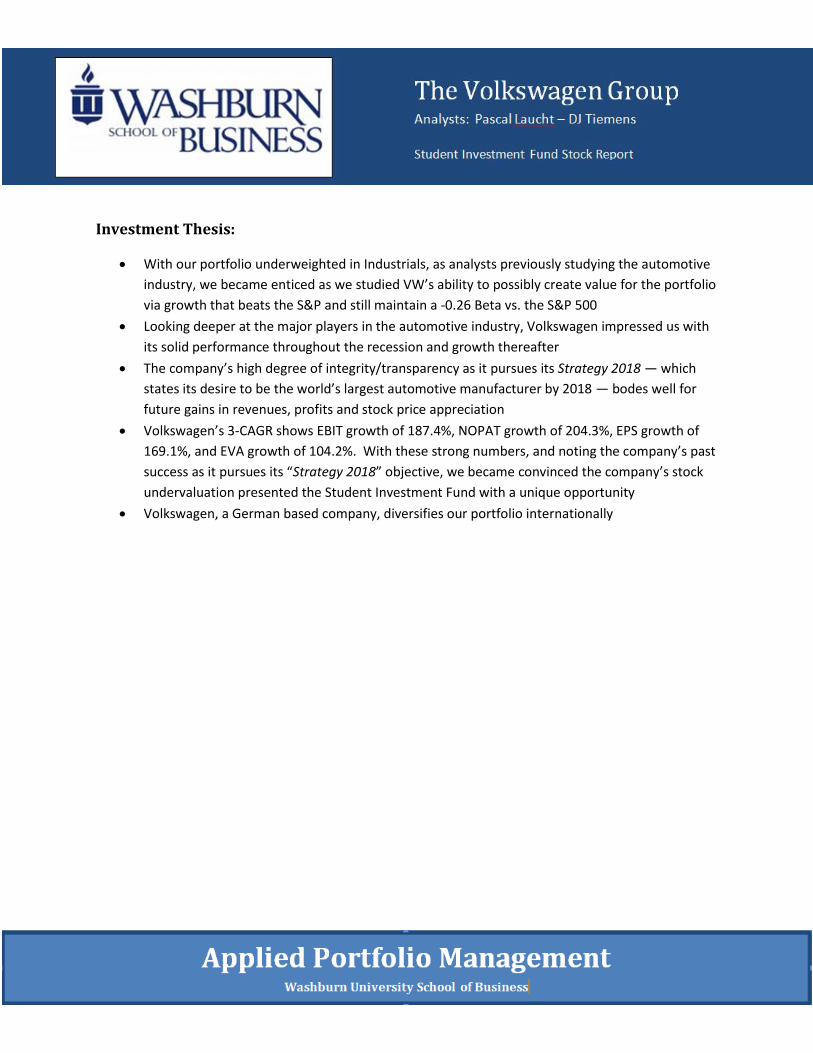
Recommendation/Summary:
From the Intrinsic value estimates we can see
that VW’s current stock price is undervalued in
every category, except the dividend discount
model (we expect no value(s) for Price to Future
Cash Flows as described previously). VW has a
very low dividend yield of slightly less than 2%,
which does not even cover the risk-free rate, but
the intrinsic value of the dividend discount model
is still accounting for a large portion of the stock.
This again, shows that VW is undervalued.
Ultimately we believe Volkswagen stock is grossly undervalued even when we forecast with reduced
growth rates of 15.4% over 2012 figures, and increase the beta from -0.26 to .0.95. We believe that this
is in large part due to the fear of investing in an automotive stock based out of the “Euro-Zone.”
Though these concerns are not to be taken lightly, upon investigation, conservative analysis, neither of
the authors can substantiate these concerns knowing of Volkswagen’s incredible past performance and
ability to historically combat what has proven to be, catastrophic recessions to others in the industry.
Moreover, bolstered by the knowledge that Volkswagen is actively becoming an even more world-wide
diversified company as we write this, only bolster our position more-so.
We are also encouraged noting that as Volkswagen moves ahead, it will ultimately be reducing its
current rate of investment in capital which has been necessary to reach the growth rates set out by its
2018 Strategy; as these growth rates in terms of unit sales have nearly been reached already in 2012.
Thus, we expect that ROIC will begin to realize gains unseen to date. Moreover, VW’s luxury auto’s
which produce the company’s largest profits have also seen an incredible resurgence as evidenced by
Porsche’s unit sales increases since 2009 (approximate unit growth of 1400 units in 2009 to over 3800 in
2012), which will all lead to the company’s stock realizing gains as the market reacts to these figures.
Therefore we recommend a buy position on The Volkswagen Groups stock with an eye on what we
believe will be its inevitable long-term growth.
Investment Thesis:
With our portfolio underweighted in Industrials, as analysts previously studying the automotive
industry, we became enticed as we studied VW’s ability to possibly create value for the portfolio
via growth that beats the S&P and still maintain a -0.26 Beta vs. the S&P 500
Looking deeper at the major players in the automotive industry, Volkswagen impressed us with
its solid performance throughout the recession and growth thereafter
The company’s high degree of integrity/transparency as it pursues its Strategy 2018 — which
states its desire to be the world’s largest automotive manufacturer by 2018 — bodes well for
future gains in revenues, profits and stock price appreciation
Volkswagen’s 3-CAGR shows EBIT growth of 187.4%, NOPAT growth of 204.3%, EPS growth of
169.1%, and EVA growth of 104.2%. With these strong numbers, and noting the company’s past
success as it pursues its “Strategy 2018” objective, we became convinced the company’s stock
undervaluation presented the Student Investment Fund with a unique opportunity
Volkswagen, a German based company, diversifies our portfolio internationally
VW Volkswagen AG Sector Consumer Discretionary Report Date 5/6/2013 2007
2007 2008 2009 2010 2011 2012 2013E 2014E 2015E 2016E 2017E
Total Revenue 108,897 113,808 105,187 126,875 159,337 192,676 203,273 213,437 223,041 231,963 237,762
Gross Profit 16,399 16,250 13,155 21,347 27,106 33,385 31,690 33,274 34,772 36,162 37,067
Operating Income 6,257 4,819 507 7,479 11,287 12,030 10,164 10,672 12,267 13,918 13,077
Net Income 4,120 4,753 960 6,835 15,409 21,717 8,131 8,537 8,922 11,598 11,888
Retained Earnings 27,166 31,522 31,607 37,684 51,764 71,172 77,409 83,813 90,396 99,502 108,810
Total Common Shares 394 398 403 450 465 468 475 482 489 496 504
Total Diluted Shares 398 400 403 450 465 468 475 482 489 496 504
Earnings Per Share $10.45 $11.94 $2.38 $15.19 $33.12 $46.45 $17.13 $17.72 $18.25 $23.37 $23.60
Dividends Per Share $1.80 $1.93 $1.60 $2.20 $3.00 $3.50 $3.99 $4.43 $4.78 $5.02 $5.12
2007 2008 2009 2010 2011 2012 2013E 2014E 2015E 2016E 2017E
Cash and Equivalents 9,135 7,664 18,658 17,419 14,464 15,462 14,229 12,806 12,267 11,598 9,510
Total Receivables 8,902 14,039 10,871 13,049 17,630 18,460 21,791 22,881 23,910 24,867 25,489
Inventory 14,031 17,816 14,124 17,631 27,551 28,674 30,552 32,080 33,524 34,865 35,736
Total Current Assets 68,516 76,163 77,776 85,936 105,640 113,061 135,614 142,394 148,802 154,754 158,623
Net PPE 25,689 30,030 31,745 34,550 43,925 53,831 56,633 59,465 62,141 64,627 66,242
Total Assets 145,357 167,919 177,178 199,393 253,769 309,644 322,439 338,561 353,796 367,948 377,146
Payables and Accruals 10,561 11,541 13,204 18,962 26,519 26,226 27,602 28,982 30,286 31,498 32,285
Total Current Liabilities 56,068 64,802 69,534 76,899 101,237 105,513 122,758 128,896 134,696 140,084 143,586
Total Debt 3,645 2,240 9,272 8,989 7,661 15,069 12,398 13,018 13,604 14,148 14,502
Total Equity 31,938 37,388 37,430 48,712 63,354 81,825 76,861 80,704 84,336 87,709 89,902
Historical Income Statement Highlights Forecasted Income Statement Highlights
Historical Balance Sheet Highlights Forecasted Balance Sheet Highlights
$0
$50,000
$100,000
$150,000
$200,000
$250,000
Total Revenue
$0
$5,000
$10,000
$15,000
$20,000
$25,000
Net Income
$0$20,000$40,000$60,000$80,000
$100,000$120,000$140,000$160,000$180,000
Total Current Assets Cash and Equivalents
0
2,000
4,000
6,000
8,000
10,000
12,000
14,000
16,000
0
20,000
40,000
60,000
80,000
100,000
Total Equity Total Debt
$0.00
$10.00
$20.00
$30.00
$40.00
$50.00
Earnings Per Share Dividends Per Share
$0
$50,000
$100,000
$150,000
$200,000
$250,000
$300,000
$350,000
$400,000
Total Assets Net PPE
VW-Performance-Analysis. Datasource: CapitalIQ Financial Analysis & Valuation, Page 1 of 5 Analysts: Pascal Laucht, David-John Tiemens
Margins 2007 2008 2009 2010 2011 2012 2013E 2014E 2015E 2016E 2017E
Gross Profit Margin 15.1% 14.3% 12.5% 16.8% 17.0% 17.3% 15.6% 15.6% 15.6% 15.6% 15.6%
Operating Profit Margin 5.7% 4.2% 0.5% 5.9% 7.1% 6.2% 5.0% 5.0% 5.5% 6.0% 5.5%
Net Profit Margin 3.8% 4.2% 0.9% 5.4% 9.7% 11.3% 4.0% 4.0% 4.0% 5.0% 5.0%
Free Cash Flow Margin 6.3% 0.0% 0.0% 3.1% 0.0% 0.0% 1.6% 3.1% 3.2% 3.9% 4.6%
Liquidity and Debt 2007 2008 2009 2010 2011 2012 2013E 2014E 2015E 2016E 2017E
Days Sales Outstanding 29.84 45.03 37.72 37.54 40.39 34.97 39.13 39.13 39.13 39.13 39.13
Inventory Turnover 7.76 6.39 7.45 7.20 5.78 6.72 6.65 6.65 6.65 6.65 6.65
Total Debt to Equity 11.4% 6.0% 24.8% 18.5% 12.1% 18.4% 16.1% 16.1% 16.1% 16.1% 16.1%
Total Debt to Assets 2.5% 1.3% 5.2% 4.5% 3.0% 4.9% 3.8% 3.8% 3.8% 3.8% 3.8%
Profitability 2007 2008 2009 2010 2011 2012 2013E 2014E 2015E 2016E 2017E
Total Asset Turnover 0.75 0.68 0.59 0.64 0.63 0.62 0.63 0.63 0.63 0.63 0.63
Equity Multiplier 4.55 4.49 4.73 4.09 4.01 3.78 4.20 4.20 4.20 4.20 4.20
Return on Assets 2.8% 2.8% 0.5% 3.4% 6.1% 7.0% 2.5% 2.5% 2.5% 3.2% 3.2%
Return on Equity 12.9% 12.7% 2.6% 14.0% 24.3% 26.5% 10.6% 10.6% 10.6% 13.2% 13.2%
Return on Capital 8.4% 5.9% 0.6% 8.5% 12.2% 11.4% 9.1% 9.3% 10.4% 11.4% 10.7%
0.00
1.00
2.00
3.00
4.00
5.00
0.0
0.1
0.2
0.3
0.4
0.5
0.6
0.7
0.8
Total Asset Turnover Equity Multiplier
0123456789
0
10
20
30
40
50
Days Sales Outstanding Inventory Turnover
0%
5%
10%
15%
20%
Gross Profit Margin Operating Profit Margin
0%
2%
4%
6%
8%
10%
12%
Net Profit Margin Free Cash Flow Margin
0%
5%
10%
15%
20%
25%
30%
Total Debt to Equity Total Debt to Assets
0%
5%
10%
15%
20%
25%
30%
Return on Equity Return on Assets
0%
5%
10%
15%
20%
25%
30%
Return on Equity Return on Capital
VW-Performance-Analysis. Datasource: CapitalIQ Financial Analysis & Valuation, Page 2 of 5 Analysts: Pascal Laucht, David-John Tiemens
Capital, NOPAT & FCF 2007 2008 2009 2010 2011 2012 2013E 2014E 2015E 2016E 2017E
NOWC 21,507 27,978 30,449 29,137 33,126 36,370 38,971 38,785 39,415 39,832 38,450
Net Fixed Assets 25,689 30,030 31,745 34,550 43,925 53,831 56,633 59,465 62,141 64,627 66,242
Total Invested Capital 47,196 58,008 62,194 63,687 77,051 90,201 95,604 98,250 101,556 104,459 104,692
Effective Tax Rate 37.0% 29.1% 27.7% 27.7% 16.5% 14.2%
NOPAT 3,942 3,419 367 5,407 9,423 10,327 8,725 9,161 10,531 11,948 11,226
Free Cash Flow N/A -7,393 -3,819 3,914 -3,941 -2,823 3,322 6,516 7,225 9,046 10,992
NOPAT Per Share 10.00 8.59 0.91 12.02 20.25 22.09 18.38 19.02 21.54 24.08 22.29
FCF/Share N/A -18.57 -9.49 8.70 -8.47 -6.04 7.00 13.53 14.78 18.23 21.82
Return on Capital 8.4% 5.9% 0.6% 8.5% 12.2% 11.4% 9.1% 9.3% 10.4% 11.4% 10.7%
Intrinsic Value of FCFs Valuation Model
Value Creation 2007 2008 2009 2010 2011 2012 2013E 2014E 2015E 2016E 2017E
Economic Value-Added 201 -1,179 -4,563 360 3,316 3,178 1,148 1,374 2,482 3,669 2,928
Market Valued-Added 81,927 105,626 2,791 12,254 5,544 2,712 121,920 125,129 129,478 132,898 134,959
PV of Future FCFs 114,879 131,377 145,610 153,236 169,322 185,565 196,951 206,045 215,151 223,158 229,852
Value of Non-Oper. Assets 9,135 7,664 18,658 17,419 14,464 15,462 14,229 12,806 12,267 11,598 9,510
Total Intrinsic Firm Value 124,014 139,041 164,268 170,655 183,786 201,027 211,180 218,851 227,418 234,756 239,363
Intrinsic Value of Equity 120,369 136,801 154,996 161,666 176,125 185,958 198,781 205,833 213,814 220,607 224,861
Per Share Intrinsic Value $305.24 $343.64 $384.97 $359.31 $378.59 $397.71 $418.85 $427.30 $437.31 $444.54 $446.41
Year-End Stock Price $288.75 $359.25 $99.90 $135.50 $148.10 $180.80
Over (Under) Valuation/Sh ($16.49) $15.61 ($285.07) ($223.81) ($230.49) ($216.91)
% Over (Under) Valued -5.7% 4.3% -285.4% -165.2% -155.6% -120.0%
Cost of Capital 2012 Weight % Cost Wgt Cost
Equity Capitalization 84,537 84.9% 8.7% 7.3%
Total Debt 15,069 15.1% 4.5% 0.6%
Preferred Stock 0 0.0% 0.0% 0.0%
Value of All Securities 99,606 100.0%
Effective Tax Rate 14.2% Long-Term Growth Rate:
Risk-Free Rate 2.00% 3.0%
5-Yr Beta 0.76 Alternative Beta:
Market Risk Premium 7.0% 0.95
CAPM Cost of Equity 8.7%
7.9%
(Tax rate from last historical year used in forecasts)
Weighted Average Cost of Capital:
$0
$20,000
$40,000
$60,000
$80,000
$100,000
$120,000
$140,000
$160,000
-$6,000
-$4,000
-$2,000
$0
$2,000
$4,000
$6,000
Economic Value-Added Market Valued-Added
$0
$100
$200
$300
$400
$500
Year-End Stock Price Per Share Intrinsic Value
-300%
-250%
-200%
-150%
-100%
-50%
0%
50%
($350)
($300)
($250)
($200)
($150)
($100)
($50)
$0
$50
2007 2008 2009 2010 2011 2012
Over (Under) Valuation/Sh % Over (Under) Valued
$0
$20,000
$40,000
$60,000
$80,000
$100,000
$120,000
Total Invested Capital Net Fixed Assets
($10,000)
($5,000)
$0
$5,000
$10,000
$15,000
NOPAT Free Cash Flow
VW-Performance-Analysis. Datasource: CapitalIQ Financial Analysis & Valuation, Page 3 of 5 Analysts: Pascal Laucht, David-John Tiemens
Relative Valuation 2007 2008 2009 2010 2011 2012 2013E 2014E 2015E 2016E 2017E
Stock Price/Intr. Value $288.75 $359.25 $99.90 $135.50 $148.10 $180.80 $418.85 $427.30 $437.31 $444.54 $446.41
Price to Earnings 27.6 30.1 41.9 8.9 4.5 3.9 24.4 24.1 24.0 19.0 18.9
Price to Free Cash Flow N/A N/A N/A 15.6 N/A N/A 59.8 31.6 29.6 24.4 20.5
Price to Sales 1.0 1.3 0.4 0.5 0.4 0.4 1.0 1.0 1.0 1.0 0.9
Price to Book 0.8 0.9 0.2 0.3 0.3 0.3 0.6 0.6 0.6 0.6 0.6
Earnings Yield 3.6% 3.3% 2.4% 11.2% 22.4% 25.7% 4.1% 4.1% 4.2% 5.3% 5.3%
Dividend Yield 0.6% 0.5% 1.6% 1.6% 2.0% 1.9% 1.0% 1.0% 1.1% 1.1% 1.1%
Free Cash Flow Yield N/A -5.2% -9.5% 6.4% -5.7% -3.3% 1.7% 3.2% 3.4% 4.1% 4.9%
Relative Valuation Pricing Model Adjust 2013 Intrinsic Dividend Discount Valuation Model
2013E Ratio Ratio Ratio Metric Value VW Volkswagen AG
Price to Earnings 24.4 $17.13 $418.85 14.0% 11.0% 8.0% 5.0% 2.0%
Price to Free Cash Flow 59.8 $7.00 $418.85 2007 2008 2009 2010 2011 2012 2013E 2014E 2015E 2016E 2017E
Price to Sales 1.0 $428.32 $418.85 $1.80 $1.93 $1.60 $2.20 $3.00 $3.50 $3.99 $4.43 $4.78 $5.02 $5.12
Price to Book 0.6 $679.41 $418.85
1-Yr Div Growth 16.7% PV Dividends 1-4 $14.76 Dividend Yeld 1.9%
2013E 3-Yr Div Growth 29.8% PV Perpetual Div. $55.28
Current Price $180.80 5-Yr Div Growth 14.2% Intrinsic Value $70.04 If Purchased For: $70.04
PV of Free Cash Flows $418.85 Risk-Free Rate 2.00% Current Price $180.80 Expected Return = 8.6%
Dividend Discount Model $70.04 5-Yr Beta 0.76 ($70.04) $3.99 $4.43 $4.78 $82.06 $77.03
Price to Earnings $418.85 Market Premium 7.0% Analyst Notes:
Price to Free Cash Flow $418.85 Required Return 8.7% Based on a current dividend of $3.50, expected growth as shown above and an equity required
Price to Sales $418.85 Alternative Beta 0.95 return of 8.7%, VW is worth $70.04 per share, vs. a current price of $180.80.
Price to Book $418.85
Compared With: Compared With:
General Motors Company S&P 500 Index
Toyota Motor Corporation
Expected Dividend Growth Rates
Intrinsic Value Estimates vs. Current Price
May 6, 2013
Annual Dividend
0
10
20
30
40
50
60
70
Price to Earnings Price to Free Cash Flow
0.0
0.2
0.4
0.6
0.8
1.0
1.2
1.4
Price to Sales Price to Book
0%
5%
10%
15%
20%
25%
30%
Earnings Yield Dividend Yield
$0
$50
$100
$150
$200
$250
$300
$350
$400
$450
Current Price PV of FreeCash Flows
DividendDiscount
Model
Price toEarnings
Price to FreeCash Flow
Price to SalesPrice to Book
Intrinsic Value Estimates vs. Current Price
-30%-20%-10%
0%10%20%30%40%50%60%
VW GM Toyota
-20%
-10%
0%
10%
20%
30%
40%
50%VW ^SPX
VW-Performance-Analysis. Datasource: CapitalIQ Financial Analysis & Valuation, Page 4 of 5 Analysts: Pascal Laucht, David-John Tiemens
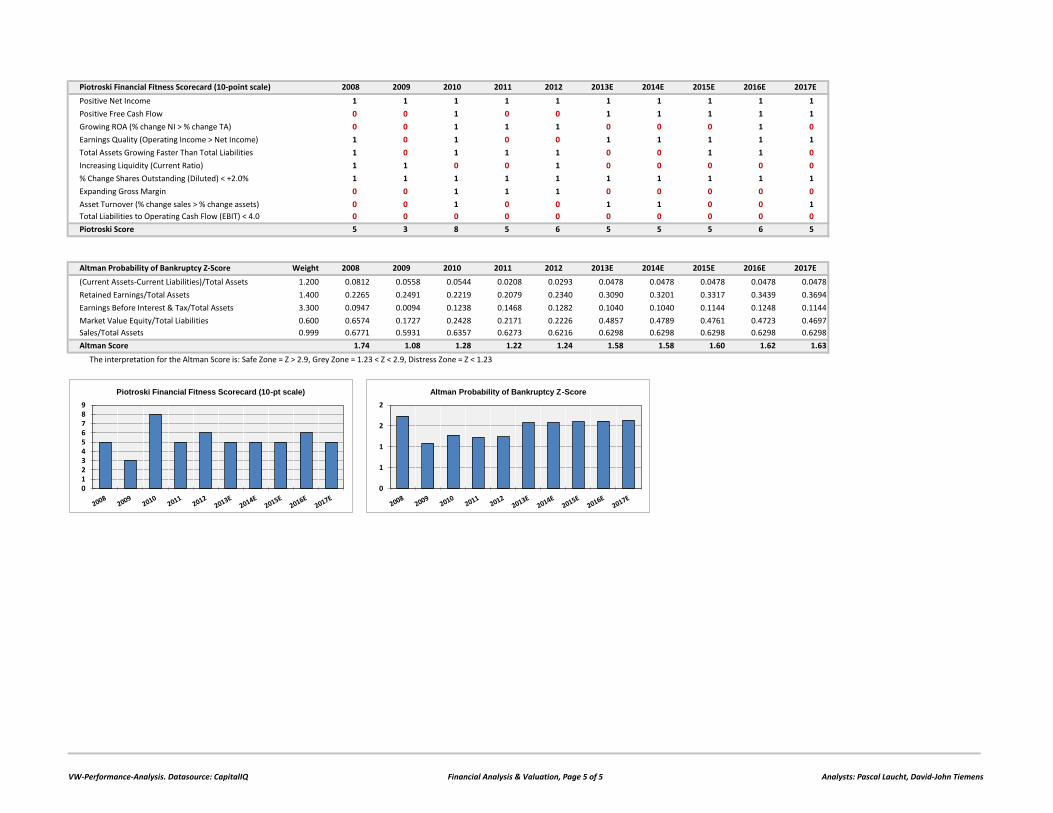
Piotroski Financial Fitness Scorecard (10-point scale) 2008 2009 2010 2011 2012 2013E 2014E 2015E 2016E 2017E
Positive Net Income 1 1 1 1 1 1 1 1 1 1
Positive Free Cash Flow 0 0 1 0 0 1 1 1 1 1
Growing ROA (% change NI > % change TA) 0 0 1 1 1 0 0 0 1 0
Earnings Quality (Operating Income > Net Income) 1 0 1 0 0 1 1 1 1 1
Total Assets Growing Faster Than Total Liabilities 1 0 1 1 1 0 0 1 1 0
Increasing Liquidity (Current Ratio) 1 1 0 0 1 0 0 0 0 0
% Change Shares Outstanding (Diluted) < +2.0% 1 1 1 1 1 1 1 1 1 1
Expanding Gross Margin 0 0 1 1 1 0 0 0 0 0
Asset Turnover (% change sales > % change assets) 0 0 1 0 0 1 1 0 0 1
Total Liabilities to Operating Cash Flow (EBIT) < 4.0 0 0 0 0 0 0 0 0 0 0
Piotroski Score 5 3 8 5 6 5 5 5 6 5
Altman Probability of Bankruptcy Z-Score Weight 2008 2009 2010 2011 2012 2013E 2014E 2015E 2016E 2017E
(Current Assets-Current Liabilities)/Total Assets 1.200 0.0812 0.0558 0.0544 0.0208 0.0293 0.0478 0.0478 0.0478 0.0478 0.0478
Retained Earnings/Total Assets 1.400 0.2265 0.2491 0.2219 0.2079 0.2340 0.3090 0.3201 0.3317 0.3439 0.3694
Earnings Before Interest & Tax/Total Assets 3.300 0.0947 0.0094 0.1238 0.1468 0.1282 0.1040 0.1040 0.1144 0.1248 0.1144
Market Value Equity/Total Liabilities 0.600 0.6574 0.1727 0.2428 0.2171 0.2226 0.4857 0.4789 0.4761 0.4723 0.4697
Sales/Total Assets 0.999 0.6771 0.5931 0.6357 0.6273 0.6216 0.6298 0.6298 0.6298 0.6298 0.6298
Altman Score 1.74 1.08 1.28 1.22 1.24 1.58 1.58 1.60 1.62 1.63
The interpretation for the Altman Score is: Safe Zone = Z > 2.9, Grey Zone = 1.23 < Z < 2.9, Distress Zone = Z < 1.23
0123456789
Piotroski Financial Fitness Scorecard (10-pt scale)
0
1
1
2
2
Altman Probability of Bankruptcy Z-Score
VW-Performance-Analysis. Datasource: CapitalIQ Financial Analysis & Valuation, Page 5 of 5 Analysts: Pascal Laucht, David-John Tiemens