Embed Size (px)
Citation preview
Sector note
Egyptian Telecom SectorTelecoms | Egypt MENA research
A yield game Real penetration of 95% implies limited subscriber growth going forward,
mainly driven by an increase in dual/triple SIMs and a young population A relatively high telecom spending to GDP implies low revenue growth for
the sector (2011–14e CAGR of 2.8%), making it no longer a growth story
We remain Overweight on TE (TP EGP21.1/share, 2010e FCF and dividend yield of 16.6% and 8.1%) and Neutral on Mobinil (TP EGP179.6/share)
The penetration rate in Egypt is higher than it seems as real penetration is expected to reach 95% by the end of 2010e. We forecast an addressable population of 55.7m (adjusted for age and income distribution) versus a total population of 81.3m. Based on our calculations, we estimate dual SIMs stand at 39% of the total subscriber base, which implies 53.1m human subscribers versus reported subscribers of 74.9m. Accordingly, we expect limited subscriber growth, with a 2011–14e CAGR of 5.9% mainly driven by dual/triple SIMs (reaching 53% by 2012e) and new additions (1.4m per year) from the youth segment (21% of the population). We expect ARPU dilution to continue on the back of price cuts into 2011e as operators fight for subscribers. Blended ARPU is expected to dilute at a 4.5% 2011–14e CAGR, offsetting market subscriber growth. Accordingly, we expect Telecom Egypt (TE), Mobinil, and Vodafone Egypt’s (VFE) revenue to grow at a 2011–14e CAGR below 2.7%. Our revenue growth estimates are supported by Egypt’s relatively high telecom spending to GDP (3.3%) compared to other emerging and developed markets. We believe the Egyptian telecom story suits value investors, as such TE remains our top pick. We reiterate our Overweight rating on TE (TP EGP 21.1/share) a defensive stock with a high yield. We expect dividend yields of 8.1% for 2010e and 8.7% for 2011e, supported by strong cash flow generation (FCF yield of 16.6% and 11.2%) and a solid balance sheet (TE’s cash balance is expected to reach 17% of total assets in 2013e). Our cash flow assumptions take into account an MVNO license fee (EGP550m) in 2011e, related annual CAPEX of EGP150m onwards and further broadband expansion. TE is cheap on multiples, trading at a 10% discount to peers on 2011e PE and 36% on adjusted EV/EBITDA. We maintain our Neutral rating on Mobinil (TP EGP179.6/share) as we expect FCF yield and net profit growth to come under pressure given expected high CAPEX and margin compression due to competition. We expect a dividend yield of 4.3% for 2010e and 5.8% for 2011e (payout ratio of 50% and 70%). Upside risks to our valuation are lower ARPU dilution and Orascom Telecom exercising its put option, thereby forcing France Telecom to launch a mandatory tender offer to minorities at EGP221.7/share.
Mobinil Neutral
Target price (EGP) 179.6Current price (EGP) 166.7Potential return 7.7%Bloomberg EMOB EYReuters EMOB.CAMCap (USDbn) 2.9Daily volume (USDm) 2.6
All prices as of 12 December 2010
14 December 2010
Karim Khadr Analyst
+971 4 293 5381 karim.khadr@hc‐si.com
Sarah Shabayek Analyst
+971 4 293 5389 sarah.shabayek@hc‐si.com
Disclaimer: See page 40
Telecom Egypt Overweight
Target price (EGP) 21.1Current price (EGP) 17.6Potential return 20.0%Bloomberg ETEL EYReuters ETEL.CAMCap (USDbn) 5.2Daily volume (USDm) 3.9
Sector note Telecoms | Egypt 14 December 2010
2
Muted growth outlook
Limited subscriber growth as real penetration is expected to reach 95% in 2010e, dual/triple SIMs to drive 2011–12e growth, the young to remain long‐term drivers
Continuing ARPU dilution (2011–14e CAGR of ‐5%) as operators are subscriber acquisition oriented
Relatively high telecom spending to GDP indicates growth at par with real GDP, albeit at a lower rate in the short term due to competition, 2011–14e CAGR of 2.8%
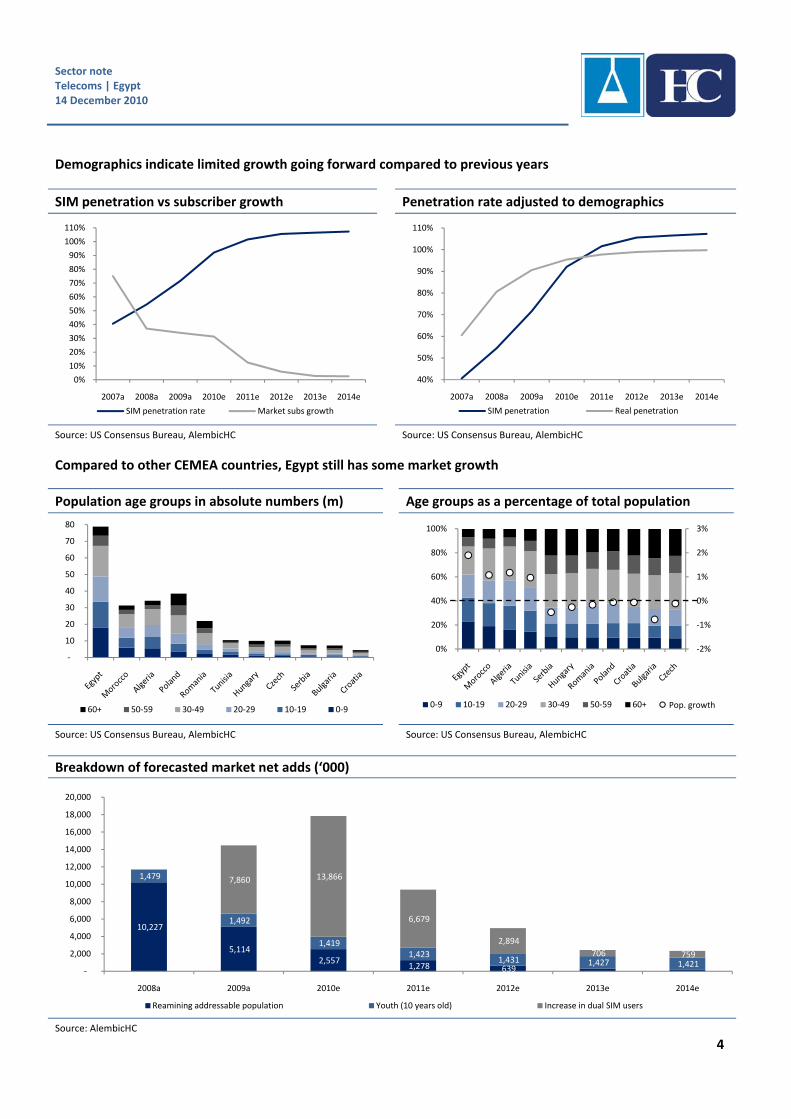
Real penetration of 95% in 2010e Egypt’s penetration rate is higher than it seems since the addressable market is considerably smaller than Egypt’s population (55.7m versus 81.3m). We calculated the penetration rate by taking into account age and income distribution and subtracting those below 9 years of age, those above 75, and half of those under the poverty line (to avoid double counting). Dual SIM users are expected to represent 39% of total subscribers (supported by Mobinil and TE’s management guidance of c35%) leading to human subscribers of 53.1m versus reported market subscribers of 74.9m. Dual/triple SIMs to drive growth in 2011e and 2012e We believe price competition in the mobile sector ensures some short‐term growth as it stimulates dual and even triple SIMs. Mobinil is back in the game fighting for its market share, and VFE changed its strategy from focusing on value‐added propositions to subscriber acquisitions. The fight on market leadership and Etisalat’s efforts to further increase its market share ensure that competition remains in the market and that the percentage of dual SIMs could increase to 50% in 2011e and 53% in 2012e from 39% in 2010e. We believe the pricing environment will stabilize by 2012e and therefore going forward headline prices should remain unchanged. The on‐net/off‐net price differential should be maintained and therefore subscribers would have no incentive to purchase another SIM or drop one they own. New additions of 1.4m/annum from the youth segment to continue to drive growth in the long term Some growth should still take place driven by those below 9 years of age. The Egyptian population’s growth rate is c1.9% (most CEMEA countries are experiencing negative growth), and a significant part of the population is under the age of 9 (21% of the total population). New subscribers are expected to be the main source of market growth (c1.4m new subscribers per year). We increased our estimates for market subscribers in 2010e and 2011e to reflect continuing intense competition but lowered the rate by which subscribers grow in the long run to reflect market maturity.
Sector note Telecoms | Egypt 14 December 2010
3
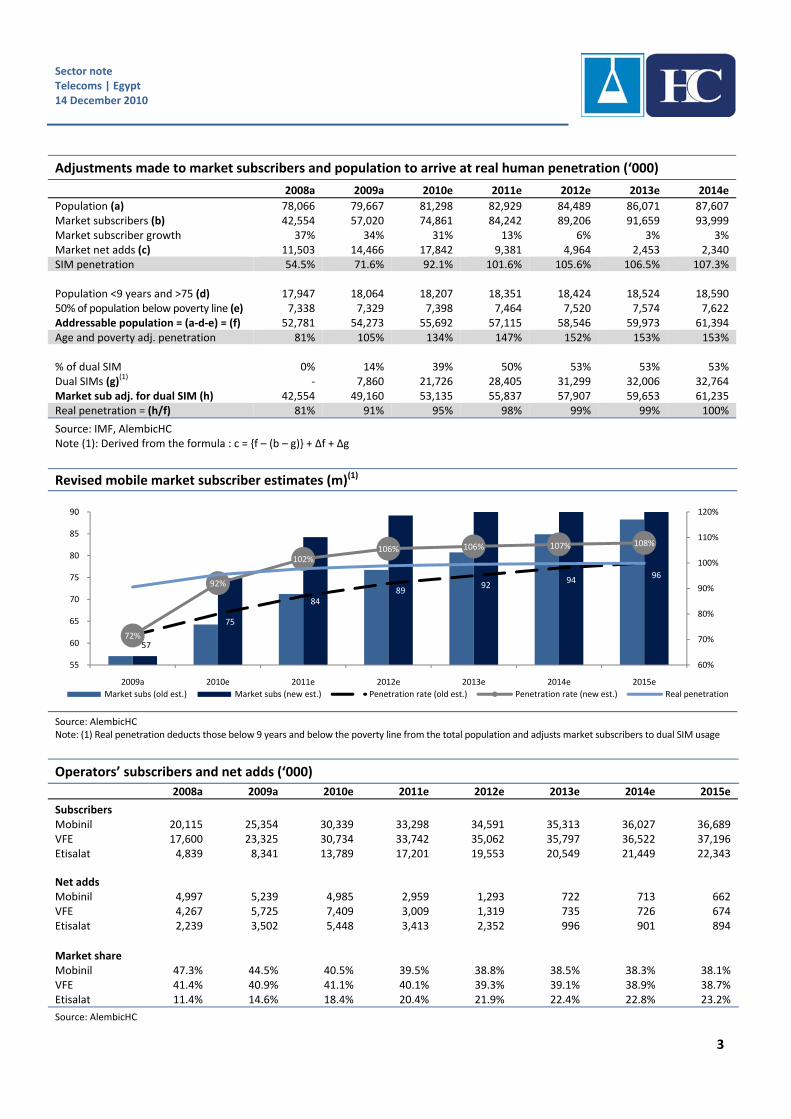
Adjustments made to market subscribers and population to arrive at real human penetration (‘000)
2008a 2009a 2010e 2011e 2012e 2013e 2014e
Population (a) 78,066 79,667 81,298 82,929 84,489 86,071 87,607 Market subscribers (b) 42,554 57,020 74,861 84,242 89,206 91,659 93,999 Market subscriber growth 37% 34% 31% 13% 6% 3% 3% Market net adds (c) 11,503 14,466 17,842 9,381 4,964 2,453 2,340 SIM penetration 54.5% 71.6% 92.1% 101.6% 105.6% 106.5% 107.3% Population <9 years and >75 (d) 17,947 18,064 18,207 18,351 18,424 18,524 18,590 50% of population below poverty line (e) 7,338 7,329 7,398 7,464 7,520 7,574 7,622 Addressable population = (a‐d‐e) = (f) 52,781 54,273 55,692 57,115 58,546 59,973 61,394 Age and poverty adj. penetration 81% 105% 134% 147% 152% 153% 153% % of dual SIM 0% 14% 39% 50% 53% 53% 53% Dual SIMs (g)(1) ‐ 7,860 21,726 28,405 31,299 32,006 32,764 Market sub adj. for dual SIM (h) 42,554 49,160 53,135 55,837 57,907 59,653 61,235 Real penetration = (h/f) 81% 91% 95% 98% 99% 99% 100%
Source: IMF, AlembicHC Note (1): Derived from the formula : c = {f – (b – g)} + Δf + Δg
Revised mobile market subscriber estimates (m)(1)
Source: AlembicHC Note: (1) Real penetration deducts those below 9 years and below the poverty line from the total population and adjusts market subscribers to dual SIM usage
Operators’ subscribers and net adds (‘000)
2008a 2009a 2010e 2011e 2012e 2013e 2014e 2015e
Subscribers Mobinil 20,115 25,354 30,339 33,298 34,591 35,313 36,027 36,689 VFE 17,600 23,325 30,734 33,742 35,062 35,797 36,522 37,196 Etisalat 4,839 8,341 13,789 17,201 19,553 20,549 21,449 22,343 Net adds Mobinil 4,997 5,239 4,985 2,959 1,293 722 713 662 VFE 4,267 5,725 7,409 3,009 1,319 735 726 674 Etisalat 2,239 3,502 5,448 3,413 2,352 996 901 894
Market share Mobinil 47.3% 44.5% 40.5% 39.5% 38.8% 38.5% 38.3% 38.1% VFE 41.4% 40.9% 41.1% 40.1% 39.3% 39.1% 38.9% 38.7% Etisalat 11.4% 14.6% 18.4% 20.4% 21.9% 22.4% 22.8% 23.2%
Source: AlembicHC
57
75
8489
9294
96
72%
92%
102%106% 106% 107% 108%
60%
70%
80%
90%
100%
110%
120%
55
60
65
70
75
80
85
90
2009a 2010e 2011e 2012e 2013e 2014e 2015e
Market subs (old est.) Market subs (new est.) Penetration rate (old est.) Penetration rate (new est.) Real penetration
Sector note Telecoms | Egypt 14 December 2010
4
Demographics indicate limited growth going forward compared to previous years
SIM penetration vs subscriber growth Penetration rate adjusted to demographics
Source: US Consensus Bureau, AlembicHC Source: US Consensus Bureau, AlembicHC
Compared to other CEMEA countries, Egypt still has some market growth
Population age groups in absolute numbers (m) Age groups as a percentage of total population
Source: US Consensus Bureau, AlembicHC Source: US Consensus Bureau, AlembicHC
Breakdown of forecasted market net adds (‘000)
Source: AlembicHC
0%
10%
20%
30%
40%
50%
60%
70%
80%
90%
100%
110%
2007a 2008a 2009a 2010e 2011e 2012e 2013e 2014e
SIM penetration rate Market subs growth
40%
50%
60%
70%
80%
90%
100%
110%
2007a 2008a 2009a 2010e 2011e 2012e 2013e 2014e
SIM penetration Real penetration
‐
10
20
30
40
50
60
70
80
60+ 50‐59 30‐49 20‐29 10‐19 0‐9
‐2%
‐1%
0%
1%
2%
3%
0%
20%
40%
60%
80%
100%
0‐9 10‐19 20‐29 30‐49 50‐59 60+ pop. growth
10,227
5,114 2,557
1,278 639
1,479
1,492
1,419 1,423
1,431 1,427 1,421
7,860 13,866
6,679
2,894
706 759
‐
2,000
4,000
6,000
8,000
10,000
12,000
14,000
16,000
18,000
20,000
2008a 2009a 2010e 2011e 2012e 2013e 2014e
Reamining addressable population Youth (10 years old) Increase in dual SIM users
Pop. growth

Sector note Telecoms | Egypt 14 December 2010
5
ARPU to dilute by a 2011–14e CAGR of 5% New subscribers are younger than 9 years or hold another SIM We believe ARPU dilution will continue as long as market volatility persists, which is expected to end in 2012e. The fact that real penetration is expected to reach 95% by the end of 2010e means that every additional subscriber should be harder to add since he/she would either be less than 9 years old, already subscribed to another operator, or one of the few remaining from the addressable population. We believe the existing fierce competition (based on our calculation for incremental ARPU) is eroding value, suggesting that existing subscribers for Mobinil and VFE are spending less.
Incremental ARPU Calculation (EGP)(1) ARPU forecast (EGP)
Source: Mobinil, VG, TE, AlembicHC Note: (1) Negative incremental ARPU means that existing subscribers are spending less
Source: Mobinil, VG, TE, AlembicHC
Tariff plans mirror operator strategies, all targeting subscriber acquisitions There are 3 main tariff plans in the Egyptian market apart from the recently introduced per second billing. The plans say much about the strategies of the different operators. Mobinil’s plans speak of its recent change of strategy in 3Q10. Previously focusing on enhancing usage with plans characterized by a higher first‐minute rate, call set‐up and subscription fees, Mobinil has clearly signaled its return to the subscriber acquisition war with its newest offer, Bedoun Sheroot (Without Conditions), introduced on 21 October to match VFE and Etisalat’s flat rate on off‐net (19pt) and offering a lower on‐net minute rate (14pt).
37
2814
‐5
46
33
7
1
(10)
0
10
20
30
40
50
2007a 2008a 2009a 2010e
Mobinil VFE
‐14%
‐15%
‐21%‐10% ‐5% ‐1% 0%
‐12%
‐22%
‐24%
‐14%‐5% ‐1% 1%
20
25
30
35
40
45
50
55
60
65
70
75
2007a 2008a 2009a 2010e 2011e 2012e 2013e 2014e
Mobinil VFE

Sector note Telecoms | Egypt 14 December 2010
6
Current prepaid tariff plans
Mobinil Vodafone Etisalat
A) Flat Rate
Al Masry Bedoun Sheroot Kol El Masryeen Kol El Nas
On‐net rates
19pt 19pt
First 2 minutes 18pt 14pt
Starting the third minute 8pt
Off‐net rates
First minute 28pt 19pt
Starting the second minute 18pt
Analysis:
Encourages usage beyond Third min. (on net), Second min. (off net)
NA NA
Targeted ARPU(1) EGP13.2/month NA NA Cheapest on‐net rate
B) Preferred on‐net numbers
Ahsan Nas Hakawy Friends Yes
Number of preferred numbers 4 3 3 Preferred number rate 5pt(2) 5pt(2) 5pt On‐net rate 20pt 20pt 15pt Off‐net rate 30pt 30pt 25pt
Analysis:
Encourages usage beyond 3 minutes/day 3 minutes/day NA Targeted ARPU(1) EGP18.0/Month EGP18.0/month NA Cheapest rate
C) Targeting areas outside Greater Cairo Baladna Hakawy Regional Mohafazat
Rates for customers outside Greater Cairo On net 8pt 14pt
15pt Off net 14pt 24pt Rates for customers inside Greater Cairo On net 22pt 19pt
20pt Off net 35pt 24pt Call set up fee 11pt NA NA
Analysis:
Encourages usage beyond First minute of the call NA NA Targeted ARPU(1) EGP8.1/month NA NA Cheapest on net outside Greater Cairo Cheapest off net outside Greater Cairo Cheapest on net inside Greater Cairo Cheapest off net inside Greater Cairo
Source: Mobinil, VFE, Etisalat Egypt Note: (1) Assuming usage is enhanced beyond targeted minutes and multiplied by 30 (2) VFE and Mobinil: Customers can make calls to preferred numbers for free (12am–6pm for no more than 120 minutes/day) on the condition that they use three charged minutes per day
Sector note Telecoms | Egypt 14 December 2010
7
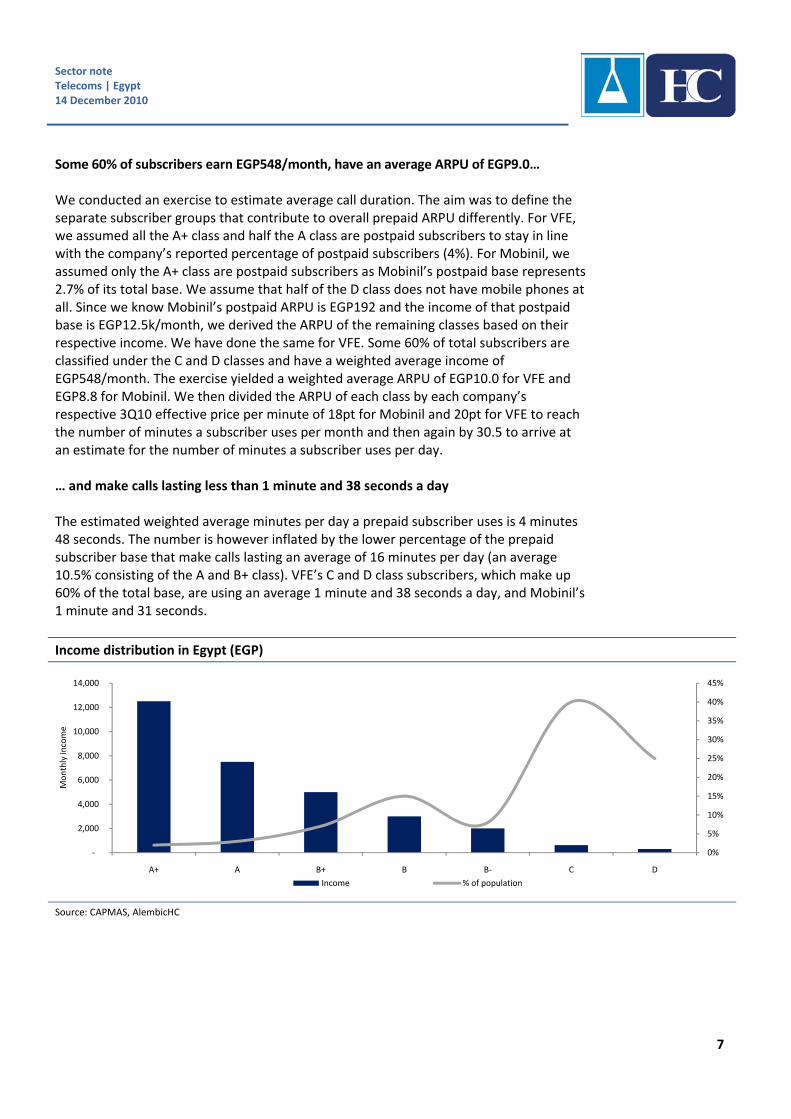
Some 60% of subscribers earn EGP548/month, have an average ARPU of EGP9.0… We conducted an exercise to estimate average call duration. The aim was to define the separate subscriber groups that contribute to overall prepaid ARPU differently. For VFE, we assumed all the A+ class and half the A class are postpaid subscribers to stay in line with the company’s reported percentage of postpaid subscribers (4%). For Mobinil, we assumed only the A+ class are postpaid subscribers as Mobinil’s postpaid base represents 2.7% of its total base. We assume that half of the D class does not have mobile phones at all. Since we know Mobinil’s postpaid ARPU is EGP192 and the income of that postpaid base is EGP12.5k/month, we derived the ARPU of the remaining classes based on their respective income. We have done the same for VFE. Some 60% of total subscribers are classified under the C and D classes and have a weighted average income of EGP548/month. The exercise yielded a weighted average ARPU of EGP10.0 for VFE and EGP8.8 for Mobinil. We then divided the ARPU of each class by each company’s respective 3Q10 effective price per minute of 18pt for Mobinil and 20pt for VFE to reach the number of minutes a subscriber uses per month and then again by 30.5 to arrive at an estimate for the number of minutes a subscriber uses per day. … and make calls lasting less than 1 minute and 38 seconds a day The estimated weighted average minutes per day a prepaid subscriber uses is 4 minutes 48 seconds. The number is however inflated by the lower percentage of the prepaid subscriber base that make calls lasting an average of 16 minutes per day (an average 10.5% consisting of the A and B+ class). VFE’s C and D class subscribers, which make up 60% of the total base, are using an average 1 minute and 38 seconds a day, and Mobinil’s 1 minute and 31 seconds.
Income distribution in Egypt (EGP)
Source: CAPMAS, AlembicHC
0%
5%
10%
15%
20%
25%
30%
35%
40%
45%
‐
2,000
4,000
6,000
8,000
10,000
12,000
14,000
A+ A B+ B B‐ C D
Monthly income
Income % of population
Sector note Telecoms | Egypt 14 December 2010
8
Calculation for Mobinil’s ARPU by subscriber group and implied call duration
Class % of pop. Income/ month (EGP)
Implied ARPU
(EGP) (a)
Address. pop.
(‘000)(2)
% of total subs(3)
(b)
% of prepaid subs (c)
Min/ month
(4) Min/day
(d)
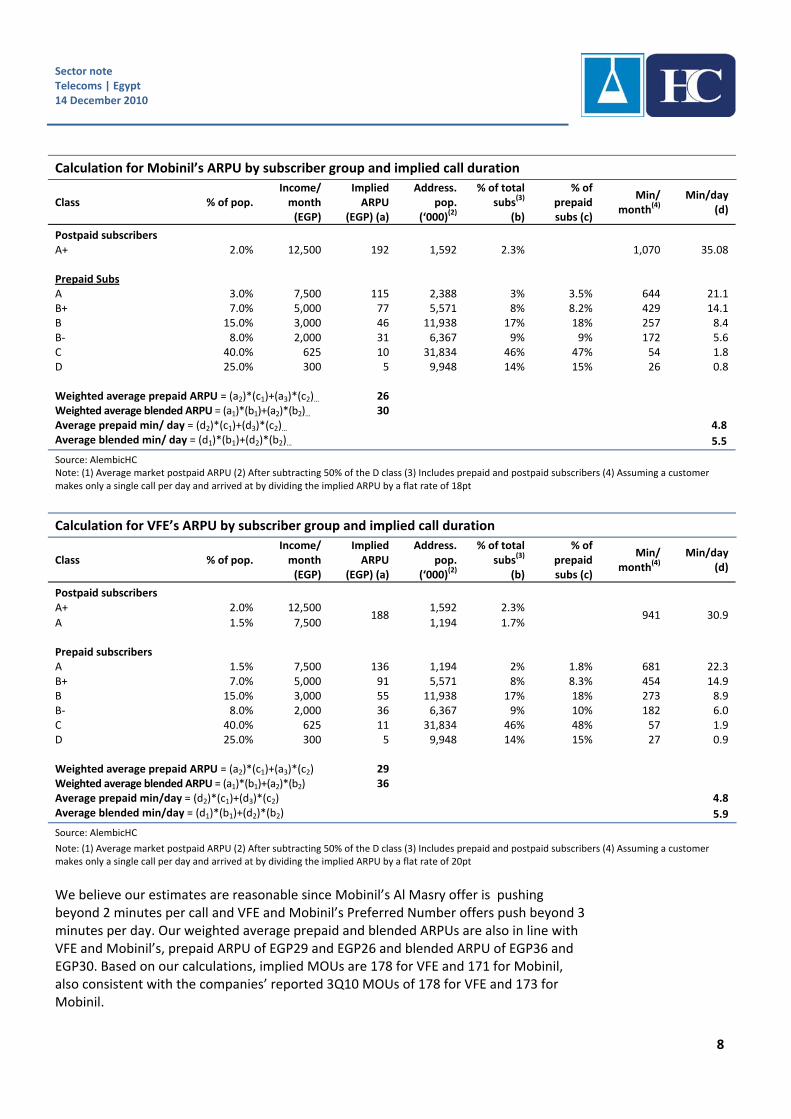
Postpaid subscribers A+ 2.0% 12,500 192 1,592 2.3% 1,070 35.08 Prepaid Subs A 3.0% 7,500 115 2,388 3% 3.5% 644 21.1 B+ 7.0% 5,000 77 5,571 8% 8.2% 429 14.1 B 15.0% 3,000 46 11,938 17% 18% 257 8.4 B‐ 8.0% 2,000 31 6,367 9% 9% 172 5.6 C 40.0% 625 10 31,834 46% 47% 54 1.8 D 25.0% 300 5 9,948 14% 15% 26 0.8 Weighted average prepaid ARPU = (a2)*(c1)+(a3)*(c2)… 26 Weighted average blended ARPU = (a1)*(b1)+(a2)*(b2)… 30 Average prepaid min/ day = (d2)*(c1)+(d3)*(c2)… 4.8 Average blended min/ day = (d1)*(b1)+(d2)*(b2)… 5.5
Source: AlembicHC Note: (1) Average market postpaid ARPU (2) After subtracting 50% of the D class (3) Includes prepaid and postpaid subscribers (4) Assuming a customer makes only a single call per day and arrived at by dividing the implied ARPU by a flat rate of 18pt
Calculation for VFE’s ARPU by subscriber group and implied call duration
Class % of pop. Income/ month (EGP)
Implied ARPU
(EGP) (a)
Address. pop.
(‘000)(2)
% of total subs
(3)
(b)
% of prepaid subs (c)
Min/ month
(4) Min/day
(d)
Postpaid subscribers A+ 2.0% 12,500
188 1,592 2.3%
941 30.9 A 1.5% 7,500 1,194 1.7% Prepaid subscribers A 1.5% 7,500 136 1,194 2% 1.8% 681 22.3 B+ 7.0% 5,000 91 5,571 8% 8.3% 454 14.9 B 15.0% 3,000 55 11,938 17% 18% 273 8.9 B‐ 8.0% 2,000 36 6,367 9% 10% 182 6.0 C 40.0% 625 11 31,834 46% 48% 57 1.9 D 25.0% 300 5 9,948 14% 15% 27 0.9 Weighted average prepaid ARPU = (a2)*(c1)+(a3)*(c2) 29 Weighted average blended ARPU = (a1)*(b1)+(a2)*(b2) 36 Average prepaid min/day = (d2)*(c1)+(d3)*(c2) 4.8 Average blended min/day = (d1)*(b1)+(d2)*(b2) 5.9
Source: AlembicHC
Note: (1) Average market postpaid ARPU (2) After subtracting 50% of the D class (3) Includes prepaid and postpaid subscribers (4) Assuming a customer makes only a single call per day and arrived at by dividing the implied ARPU by a flat rate of 20pt
We believe our estimates are reasonable since Mobinil’s Al Masry offer is pushing beyond 2 minutes per call and VFE and Mobinil’s Preferred Number offers push beyond 3 minutes per day. Our weighted average prepaid and blended ARPUs are also in line with VFE and Mobinil’s, prepaid ARPU of EGP29 and EGP26 and blended ARPU of EGP36 and EGP30. Based on our calculations, implied MOUs are 178 for VFE and 171 for Mobinil, also consistent with the companies’ reported 3Q10 MOUs of 178 for VFE and 173 for Mobinil.

Sector note Telecoms | Egypt 14 December 2010
9
ARPU call duration among subscriber groups for Mobinil(1)
Source: IMF, AlembicHC
Note: (1) Assuming subscribers make a single call per day
ARPU call duration among subscriber groups for VFE(1)
Source: IMF, AlembicHC
Note: (1) Assuming subscribers make a single call per day
Mobinil targeting net additions by cutting its off‐net rate with Bedoun Sheroot Mobinil’s newest tariff plan cannibalizes its older plan, Al Masry, offering the lowest on‐net minute rate in Egypt of 8pt (see page 6 for tariff plans). With Bedoun Sheroot, a 2 minute call costs 28pt and a 3 minute call costs 42pt. With Al Masry, a 2 minute call costs 36pt and a 3 minute call costs 44pt. Bedoun Sheroot is cheaper for those making calls less than 4 minutes, yet more expensive for calls longer than that. Since we calculated that 60% of Mobinil’s subscribers make calls lasting less than 1 minute and 31 seconds per day, we believe once customers migrate to the plan it will be ARPU dilutive for Mobinil unless subscribers make calls longer than 4 minutes. We find this unlikely since Mobinil tried to push beyond the second minute with Al Masry, which seems to have failed, causing the company to offer a plan that cannibalizes its previous one. The new plan offers a lower off‐net rate of 19pt, matching VFE and Etisalat’s flat rates. While this actually stimulates cross‐net usage, it will compress margins due to interconnect costs.
2%
3%
8%
17%9%
46%14%
(50)
‐
50
100
150
200
250
(2) ‐ 2 4 6 8 10 12 14 16 18 20 22 24 26 28 30 32 34
ARPU (EG
P)
Call duration (minutes) % of Total Subs
4%
2%
8%
17%9%
46%14%
(50)
‐
50
100
150
200
250
(2) ‐ 2 4 6 8 10 12 14 16 18 20 22 24 26 28 30 32 34
ARPU (EG
P)
Call duration (minutes) Series1
Weighted avg. ARPU = EGP8
Calc. prepaid ARPU = EGP26
Calc. blended ARPU = EGP30
% of total subscribers
Weighted avg. ARPU = EGP10
Calc. prepaid ARPU = EGP29
Calc. blended ARPU = EGP36
% of total subscribers
Sector note Telecoms | Egypt 14 December 2010
10
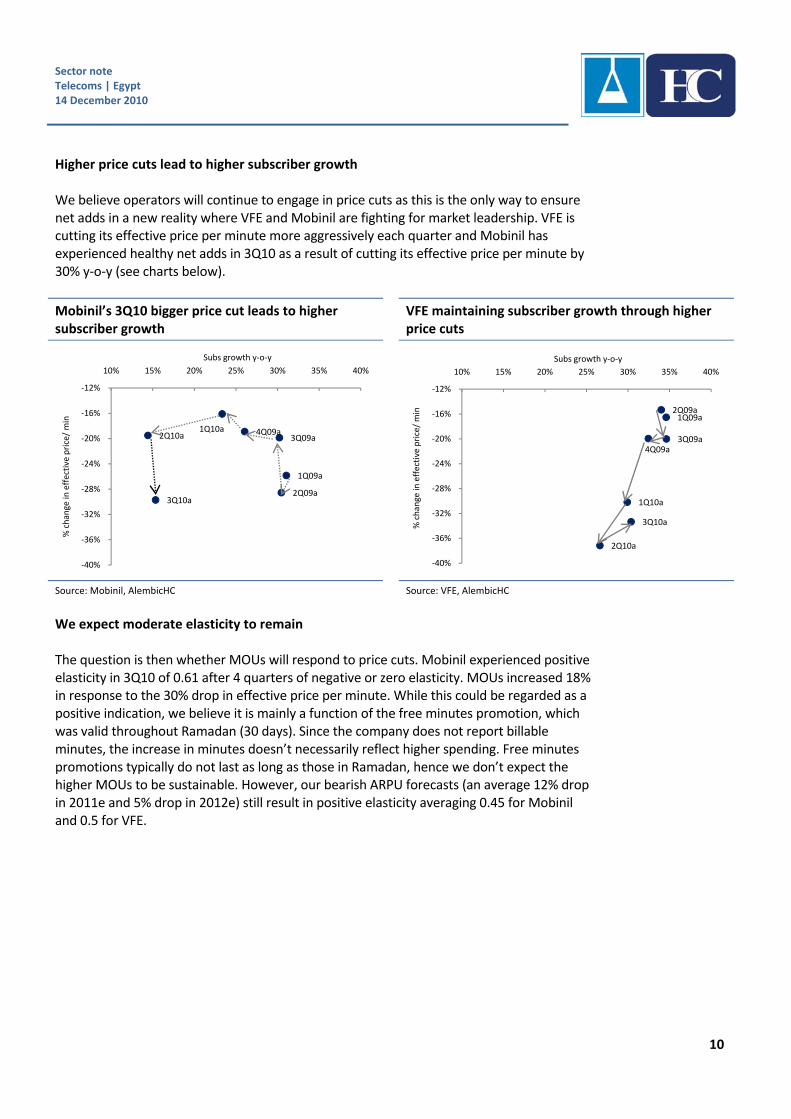
Higher price cuts lead to higher subscriber growth We believe operators will continue to engage in price cuts as this is the only way to ensure net adds in a new reality where VFE and Mobinil are fighting for market leadership. VFE is cutting its effective price per minute more aggressively each quarter and Mobinil has experienced healthy net adds in 3Q10 as a result of cutting its effective price per minute by 30% y‐o‐y (see charts below).
Mobinil’s 3Q10 bigger price cut leads to higher subscriber growth
VFE maintaining subscriber growth through higher price cuts
Source: Mobinil, AlembicHC Source: VFE, AlembicHC
We expect moderate elasticity to remain The question is then whether MOUs will respond to price cuts. Mobinil experienced positive elasticity in 3Q10 of 0.61 after 4 quarters of negative or zero elasticity. MOUs increased 18% in response to the 30% drop in effective price per minute. While this could be regarded as a positive indication, we believe it is mainly a function of the free minutes promotion, which was valid throughout Ramadan (30 days). Since the company does not report billable minutes, the increase in minutes doesn’t necessarily reflect higher spending. Free minutes promotions typically do not last as long as those in Ramadan, hence we don’t expect the higher MOUs to be sustainable. However, our bearish ARPU forecasts (an average 12% drop in 2011e and 5% drop in 2012e) still result in positive elasticity averaging 0.45 for Mobinil and 0.5 for VFE.
1Q09a
2Q09a
3Q09a4Q09a1Q10a
2Q10a
3Q10a
‐40%
‐36%
‐32%
‐28%
‐24%
‐20%
‐16%
‐12%
10% 15% 20% 25% 30% 35% 40%
% change in
effective price/ min
Subs growth y‐o‐y
1Q09a2Q09a
3Q09a4Q09a
1Q10a
2Q10a
3Q10a
‐40%
‐36%
‐32%
‐28%
‐24%
‐20%
‐16%
‐12%
10% 15% 20% 25% 30% 35% 40%
% change in
effective price/ min
Subs growth y‐o‐y

Sector note Telecoms | Egypt 14 December 2010
11
Mobinil: Usage vs effective price/minute Vodafone: Usage vs effective price/minute
Source: Mobinil, AlembicHC Source: VFE, AlembicHC
Mobinil and VFE’s forecasted (4Q10e–4Q11e) MOUs, effective price/minute (EGP), and elasticity
Mobinil VFE
1Q10 2Q10 3Q10 4Q10 1Q11 2Q11 3Q11 4Q11 1Q10 2Q10 3Q10 4Q10 1Q11 2Q11 3Q11 4Q11
MOUs 141 159 173 161 165 167 188 168 159 179 178 172 181 201 200 192 Ef. price/min 0.22 0.19 0.18 0.18 0.16 0.16 0.14 0.15 0.24 0.20 0.20 0.20 0.17 0.16 0.15 0.16 Elasticity ‐0.21 ‐0.23 0.61 0.63 0.67 0.28 0.41 0.25 0.31 0.60 0.51 0.51 0.48 0.51 0.51 0.51
Source: Mobinil, Vodafone Group, AlembicHC
Tariffs to drop as SIM penetration increases
Egypt’s mobile tariffs are relatively high compared to other emerging markets. We carried out an exercise using ITU ICT basket data and concluded that Egypt’s tariff basket as measured by ITU is 23% higher than it should be compared to other countries. The mobile tariff basket represents the price of standard monthly usage in USD for 25 outgoing calls per month (on net, off net, and to a fixed line, and for peak, off‐peak, and weekends according to predetermined ratios) and 30 SMS messages. The basket is based on 2H09 prepaid tariffs since they represent the dominant payment method. The basket is then divided by GNI per capita to ensure comparability between countries. We use the chart below only as an indication for tariff trend.
Relative mobile tariff baskets (USD) vs penetration rates for emerging markets
Source: ITU, AlembicHC
‐40%
‐30%
‐20%
‐10%
0%
10%
20%
30%
Mar‐09
Jun‐09
Sep‐09
Dec‐09
Mar‐10
Jun‐10
Sep‐10
Dec‐10
Mar‐11
Jun‐11
Sep‐11
Dec‐11
Change in usage y‐o‐y Change in effective price/ min y‐o‐y
‐40%
‐30%
‐20%
‐10%
0%
10%
20%
30%
Mar‐09
Jun‐09
Sep‐09
Dec‐09
Mar‐10
Jun‐10
Sep‐10
Dec‐10
Mar‐11
Jun‐11
Sep‐11
Dec‐11
% Change in effective price/ min y‐o‐y % Change in usage y‐o‐y
Bahrain
Brazil
ChileChina
Colombia
Czech Repupblic
Egypt in 2009a
HungaryIndiaIndonesia
IsraelKoreaMalaysia
Mexico
Peru
Philippines
Poland Russia
Slovenia
South Africa
Thailand
Turkey
2010e 2011e2012e
0
1
2
3
4
5
6
40% 60% 80% 100% 120% 140% 160% 180% 200%
ITU basket/ GNI
Sector note Telecoms | Egypt 14 December 2010
12
Our exercise implies an inverse relationship between penetration rates and tariffs, which is consistent with lower incremental ARPU as a result of acquiring more lower‐income subscribers. Applying our forecasted penetration rate for Egypt of 92% in 2010e, 102% in 2011e, and 106% in 2012e yields a basket/GNI per capita of 1.9%, 1.8%, and 1.7% respectively, implying a drop of 8% in 2011e and 4% in 2012e. VFE and Etisalat launched per second billing, Mobinil not competing
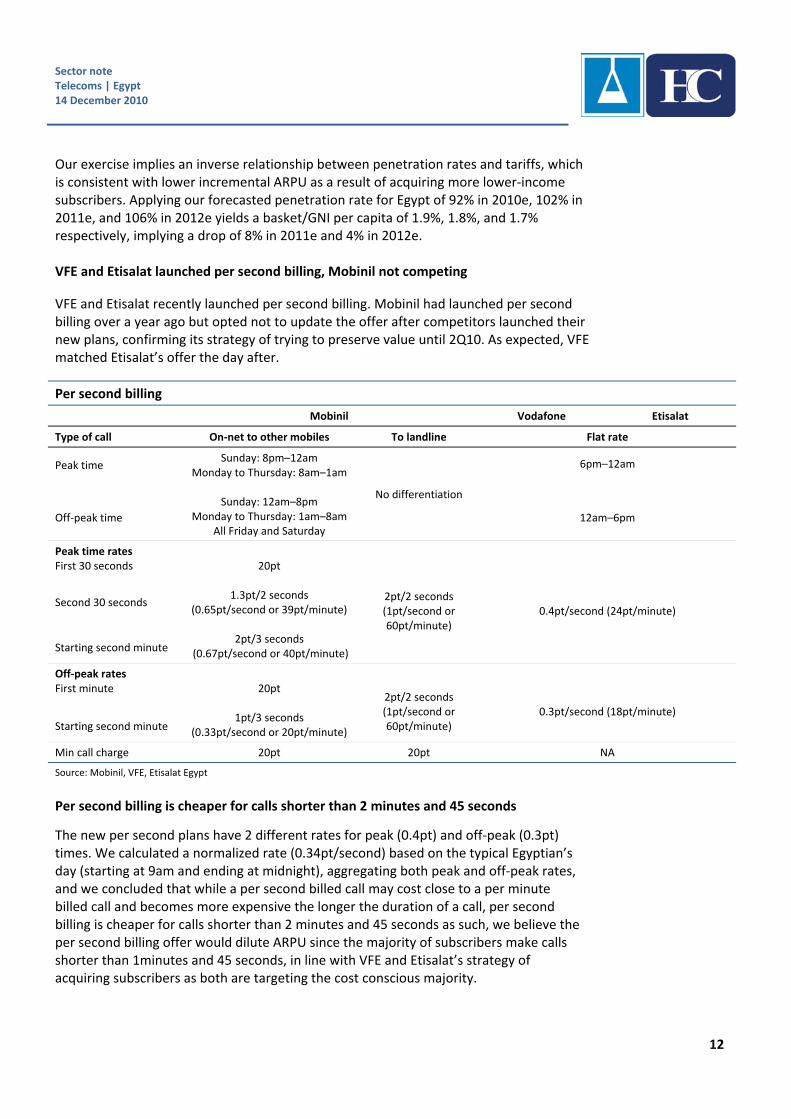
VFE and Etisalat recently launched per second billing. Mobinil had launched per second billing over a year ago but opted not to update the offer after competitors launched their new plans, confirming its strategy of trying to preserve value until 2Q10. As expected, VFE matched Etisalat’s offer the day after.
Per second billing
Mobinil Vodafone Etisalat
Type of call On‐net to other mobiles To landline Flat rate
Peak time Sunday: 8pm–12am
Monday to Thursday: 8am–1am
No differentiation
6pm–12am
Off‐peak time
Sunday: 12am–8pm Monday to Thursday: 1am–8am
All Friday and Saturday 12am–6pm
Peak time rates First 30 seconds 20pt
2pt/2 seconds (1pt/second or 60pt/minute)
0.4pt/second (24pt/minute)
Second 30 seconds 1.3pt/2 seconds
(0.65pt/second or 39pt/minute)
Starting second minute 2pt/3 seconds
(0.67pt/second or 40pt/minute)
Off‐peak rates First minute 20pt
2pt/2 seconds (1pt/second or 60pt/minute)
0.3pt/second (18pt/minute)
Starting second minute 1pt/3 seconds
(0.33pt/second or 20pt/minute)
Min call charge 20pt 20pt NA
Source: Mobinil, VFE, Etisalat Egypt
Per second billing is cheaper for calls shorter than 2 minutes and 45 seconds
The new per second plans have 2 different rates for peak (0.4pt) and off‐peak (0.3pt) times. We calculated a normalized rate (0.34pt/second) based on the typical Egyptian’s day (starting at 9am and ending at midnight), aggregating both peak and off‐peak rates, and we concluded that while a per second billed call may cost close to a per minute billed call and becomes more expensive the longer the duration of a call, per second billing is cheaper for calls shorter than 2 minutes and 45 seconds as such, we believe the per second billing offer would dilute ARPU since the majority of subscribers make calls shorter than 1minutes and 45 seconds, in line with VFE and Etisalat’s strategy of acquiring subscribers as both are targeting the cost conscious majority.

Sector note Telecoms | Egypt 14 December 2010
13
VFE and Etisalat’s per‐second billing for a 20 minute call
Source: Mobinil, VFE, Etisalat Egypt, AlembicHC Note: (1) Assumes a day constitutes 9 off‐peak and 7 peak hours
VFE and Etisalat’s per‐second billing for a 5 minute call
Source: Mobinil, VFE, Etisalat Egypt, AlembicHC Note: (1) Assumes a day constitutes 9 off‐peak and 7 peak hours
0.0
0.5
1.0
1.5
2.0
2.5
3.0
3.5
4.0
4.5
5.0
1 2 3 4 5 6 7 8 9 10 11 12 13 14 15 16 17 18 19 20
Call cost (EG
P)
Call duration (min)
Per‐second peak rate Per‐second off peak rate Per‐second normalized rate (1) Minute rate
0
20
40
60
80
100
120
1 2 3 4 5
Call cost (pt)
Call duration (min)
Per‐second peak rate Per‐second off peak rate Per‐second normalized rate (1) Minute rate
Peak rate starts becoming more expensive
Before this point the normalized rate is always cheaper
Sector note Telecoms | Egypt 14 December 2010
14
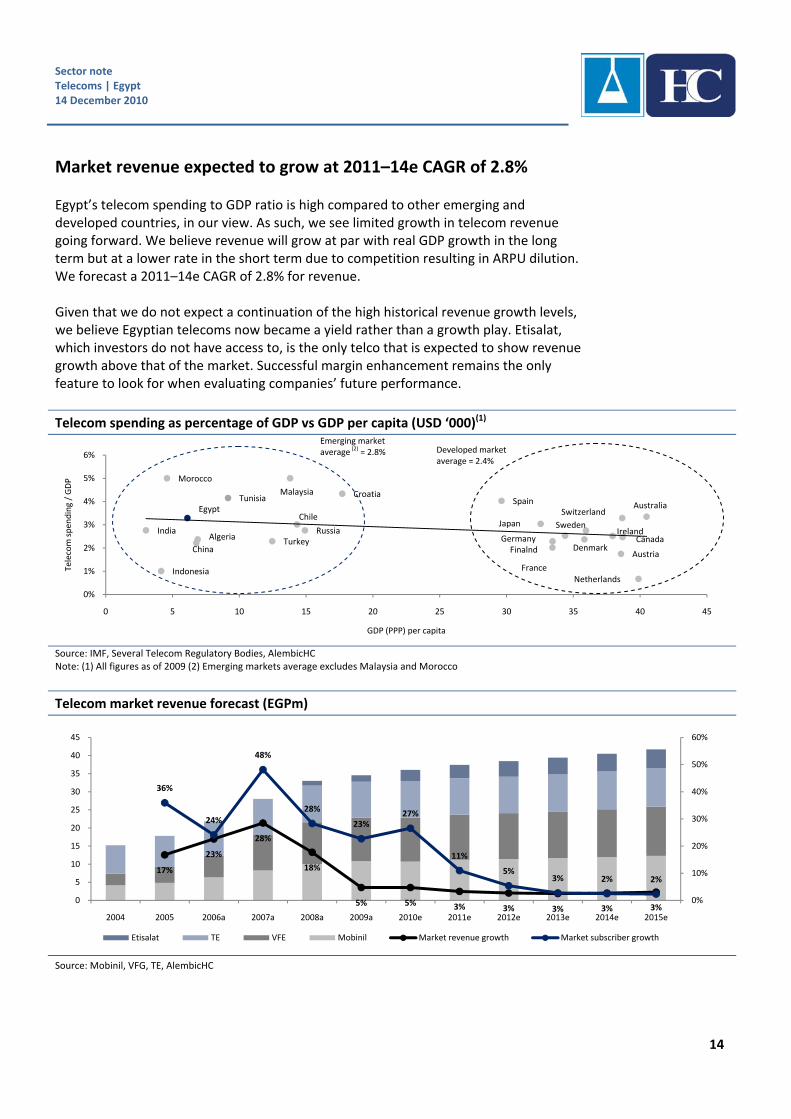
Market revenue expected to grow at 2011–14e CAGR of 2.8% Egypt’s telecom spending to GDP ratio is high compared to other emerging and developed countries, in our view. As such, we see limited growth in telecom revenue going forward. We believe revenue will grow at par with real GDP growth in the long term but at a lower rate in the short term due to competition resulting in ARPU dilution. We forecast a 2011–14e CAGR of 2.8% for revenue. Given that we do not expect a continuation of the high historical revenue growth levels, we believe Egyptian telecoms now became a yield rather than a growth play. Etisalat, which investors do not have access to, is the only telco that is expected to show revenue growth above that of the market. Successful margin enhancement remains the only feature to look for when evaluating companies’ future performance.
Telecom spending as percentage of GDP vs GDP per capita (USD ‘000)(1)
Source: IMF, Several Telecom Regulatory Bodies, AlembicHC Note: (1) All figures as of 2009 (2) Emerging markets average excludes Malaysia and Morocco
Telecom market revenue forecast (EGPm)
Source: Mobinil, VFG, TE, AlembicHC
Egypt
India
China
Indonesia
Chile
Turkey
Malaysia
Russia
Morocco
Algeria
Tunisia CroatiaAustralia
FinalndCanada
Ireland
Netherlands
Sweden
France
SwitzerlandJapan
Austria
Germany
Spain
Denmark
0%
1%
2%
3%
4%
5%
6%
0 5 10 15 20 25 30 35 40 45
Telecom spen
ding / GDP
GDP (PPP) per capita
17%
23%
28%
18%
5% 5% 3% 3% 3% 3% 3%
36%
24%
48%
28%
23%27%
11%
5%3% 2% 2%
0%
10%
20%
30%
40%
50%
60%
0
5
10
15
20
25
30
35
40
45
2004 2005 2006a 2007a 2008a 2009a 2010e 2011e 2012e 2013e 2014e 2015e
Etisalat TE VFE Mobinil Market revenue growth Market subscriber growth
Emerging market average (2) = 2.8% Developed market
average = 2.4%

Mobinil Telecoms | Egypt 14 December 2010
15
Mobinil
Subscriber growth at a high price Mobinil’s return to the subscriber acquisition game comes at the expense of
profitability, subscribers forecast to grow at a 2011–14e CAGR of 4.4%
Reconsider Mobinil by the end of next year, EPS expected to drop 30% y‐o‐y in 4Q10e and to remain flat in 2011e, while we forecast a dividend yield of 4.3% in 2010e and 5.8% in 2011e
We cut our TP 17% to EGP179.6/share and maintain our Neutral recommendation Limited subscriber growth going forward We believe subscriber growth should be limited going forward (2011–14e CAGR of 4.4%) given our expectations of limited market growth (real penetration of 95% in 2010e). ARPU dilution is expected to continue (2011–14e CAGR of ‐4%) as Mobinil is back in the subscriber acquisition fight, with operators competing for existing subscribers leading to increasing dual SIMs. The full consolidation of LINKdotNET will take place in 2011e and as such we expect revenue growth of 5.0% versus only 2.4% for the mobile segment. Profitability is expected to come under pressure until pricing stabilizes in 2012e. We forecast a 2011–14e CAGR of 2.7% for revenue and 3.0% for EBITDA. Operational pressures in 2010e and high expected CAPEX in 2011e lead to lower yields Mobinil’s EPS is expected to drop 30% in 2010e as a result of margin compression. Improvement in revenue is not expected to filter through to the bottom line in 2011e due to 11% higher interest cost leading to a flat EPS. FCF is expected to be negative in 2010e as a result of EBITDA dropping 15% and license payments, while 2011e FCF is expected to be pressured by increased CAPEX. We therefore assume a 50% dividend payout for 2010e, a yield of 4.3%, and expect the payout to increase to 70% in 2011e due to lower operational pressures, which would result in a 5.8% yield.
Paradigm shift confirmed Our view on Mobinil in our previous note Signs of a paradigm shift (29 April 2010) has been confirmed by 2Q10 and 3Q10. We cut our TP to reflect slower market growth, delaying market stability to 2012e, factoring in margin compression and higher interest expense. The stock is trading at a 16% premium on 2011e PE although it trades at a 16% discount to peers on 2011e EV/EBITDA. We still don’t view the discount as sufficiently attractive.
Mobinil Telecoms | Egypt 14 December 2010
16
3Q10 results (EGPm)
3Q10a 2Q10a %Δ q‐o‐q 3Q10e %Δ dev. 3Q09a %∆ y‐o‐y 3Q10c %Δ dev.
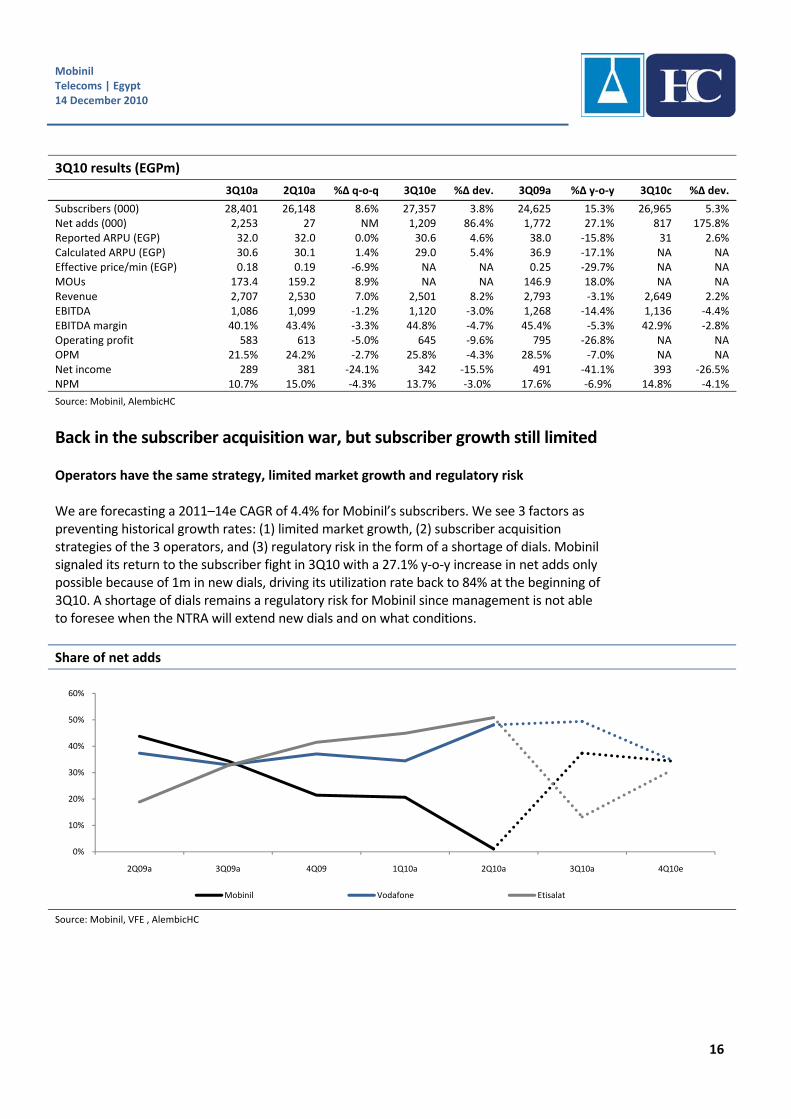
Subscribers (000) 28,401 26,148 8.6% 27,357 3.8% 24,625 15.3% 26,965 5.3% Net adds (000) 2,253 27 NM 1,209 86.4% 1,772 27.1% 817 175.8% Reported ARPU (EGP) 32.0 32.0 0.0% 30.6 4.6% 38.0 ‐15.8% 31 2.6% Calculated ARPU (EGP) 30.6 30.1 1.4% 29.0 5.4% 36.9 ‐17.1% NA NA Effective price/min (EGP) 0.18 0.19 ‐6.9% NA NA 0.25 ‐29.7% NA NA MOUs 173.4 159.2 8.9% NA NA 146.9 18.0% NA NA Revenue 2,707 2,530 7.0% 2,501 8.2% 2,793 ‐3.1% 2,649 2.2% EBITDA 1,086 1,099 ‐1.2% 1,120 ‐3.0% 1,268 ‐14.4% 1,136 ‐4.4% EBITDA margin 40.1% 43.4% ‐3.3% 44.8% ‐4.7% 45.4% ‐5.3% 42.9% ‐2.8% Operating profit 583 613 ‐5.0% 645 ‐9.6% 795 ‐26.8% NA NA OPM 21.5% 24.2% ‐2.7% 25.8% ‐4.3% 28.5% ‐7.0% NA NA Net income 289 381 ‐24.1% 342 ‐15.5% 491 ‐41.1% 393 ‐26.5% NPM 10.7% 15.0% ‐4.3% 13.7% ‐3.0% 17.6% ‐6.9% 14.8% ‐4.1%
Source: Mobinil, AlembicHC
Back in the subscriber acquisition war, but subscriber growth still limited Operators have the same strategy, limited market growth and regulatory risk We are forecasting a 2011–14e CAGR of 4.4% for Mobinil’s subscribers. We see 3 factors as preventing historical growth rates: (1) limited market growth, (2) subscriber acquisition strategies of the 3 operators, and (3) regulatory risk in the form of a shortage of dials. Mobinil signaled its return to the subscriber fight in 3Q10 with a 27.1% y‐o‐y increase in net adds only possible because of 1m in new dials, driving its utilization rate back to 84% at the beginning of 3Q10. A shortage of dials remains a regulatory risk for Mobinil since management is not able to foresee when the NTRA will extend new dials and on what conditions.
Share of net adds
Source: Mobinil, VFE , AlembicHC
0%
10%
20%
30%
40%
50%
60%
2Q09a 3Q09a 4Q09 1Q10a 2Q10a 3Q10a 4Q10e
Mobinil Vodafone Etisalat

Mobinil Telecoms | Egypt 14 December 2010
17
Operational efficiency to determine the success of operators in the short term
We believe Mobinil and VFE will most probably lose market share to Etisalat equally in the long term as we believe Mobinil and VFE should reach about the same utilization rate (89%, 90%) and would therefore put both in the same competitive position. It will be a matter of which operator has the operational efficiency to manage its existing dials, recycle old dials in a timely manner, make use of special algorithms, and manage dials allocated to roaming partners. Mobinil was able to increase its operational efficiency in 3Q10 – in 1Q10 it had the same utilization rate and added only 767,000 subscribers. We expect the company to add another 1.9m in 4Q10e with the activation of 1m dials in October and an additional 2m to activate this year. This way of looking at the market puts VFE in the lead but only slightly with a market share just 0.5% higher than Mobinil.
Market share and subscriber growth (quarterly) Market share and subscriber growth (annual)
Source: Mobinil press releases, AlembicHC Source: Mobinil press releases, AlembicHC
ARPU dilution driven by collective acquisition strategy and increase in dual SIMs in light of market maturity
Subscriber growth remains the source of revenue growth in Egypt as usage does not respond well to moderate price cuts. This was demonstrated by Mobinil in 1H10 when it cut its effective price per minute more cautiously and, as a result, saw 2 quarters of inelasticity. Realizing that usage only responds to aggressive cuts and having more dials on hand, Mobinil cut its effective price per minute 29.7% y‐o‐y in 3Q10, up from an average 18.6% in the previous year, and was consequently able to stimulate usage (MOUs increased an impressive 18% y‐o‐y). Its Bedoun Sheroot offer also indicates that it plans to continue competing on pricing. VFE on the other hand has been experiencing 3 quarters of positive elasticity as it is increasing its price cut each quarter. We believe that at current market maturity level, operators will continue cutting prices as they vie for each others’ subscribers. The increase in dual SIMs is going to put additional pressure on ARPU as subscribers divide their spending wallet on different operators.
0%
10%
20%
30%
40%
50%
60%
70%
80%
90%
100%
2Q09a 3Q09a 4Q09 1Q10a 2Q10a 3Q10a 4Q10e
Marke share Utilization rate Subs growth y‐o‐y
0%
10%
20%
30%
40%
50%
60%
70%
2007a 2008a 2009a 2010e 2011e 2012e 2013e 2014e
Marke share Subs growth (y‐o‐y)
Mobinil Telecoms | Egypt 14 December 2010
18
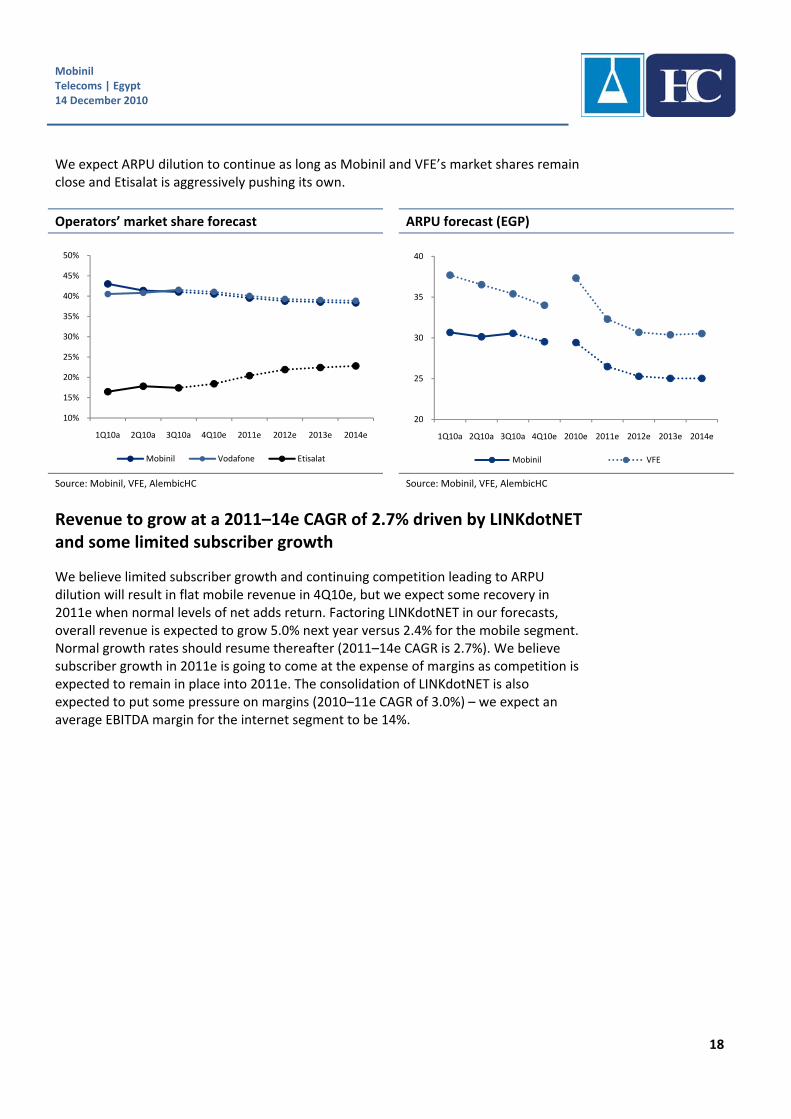
We expect ARPU dilution to continue as long as Mobinil and VFE’s market shares remain close and Etisalat is aggressively pushing its own.
Operators’ market share forecast ARPU forecast (EGP)
Source: Mobinil, VFE, AlembicHC Source: Mobinil, VFE, AlembicHC
Revenue to grow at a 2011–14e CAGR of 2.7% driven by LINKdotNET and some limited subscriber growth
We believe limited subscriber growth and continuing competition leading to ARPU dilution will result in flat mobile revenue in 4Q10e, but we expect some recovery in 2011e when normal levels of net adds return. Factoring LINKdotNET in our forecasts, overall revenue is expected to grow 5.0% next year versus 2.4% for the mobile segment. Normal growth rates should resume thereafter (2011–14e CAGR is 2.7%). We believe subscriber growth in 2011e is going to come at the expense of margins as competition is expected to remain in place into 2011e. The consolidation of LINKdotNET is also expected to put some pressure on margins (2010–11e CAGR of 3.0%) – we expect an average EBITDA margin for the internet segment to be 14%.
10%
15%
20%
25%
30%
35%
40%
45%
50%
1Q10a 2Q10a 3Q10a 4Q10e 2011e 2012e 2013e 2014e
Mobinil Vodafone Etisalat
20
25
30
35
40
1Q10a 2Q10a 3Q10a 4Q10e 2010e 2011e 2012e 2013e 2014e
Mobinil VFE
Mobinil Telecoms | Egypt 14 December 2010
19
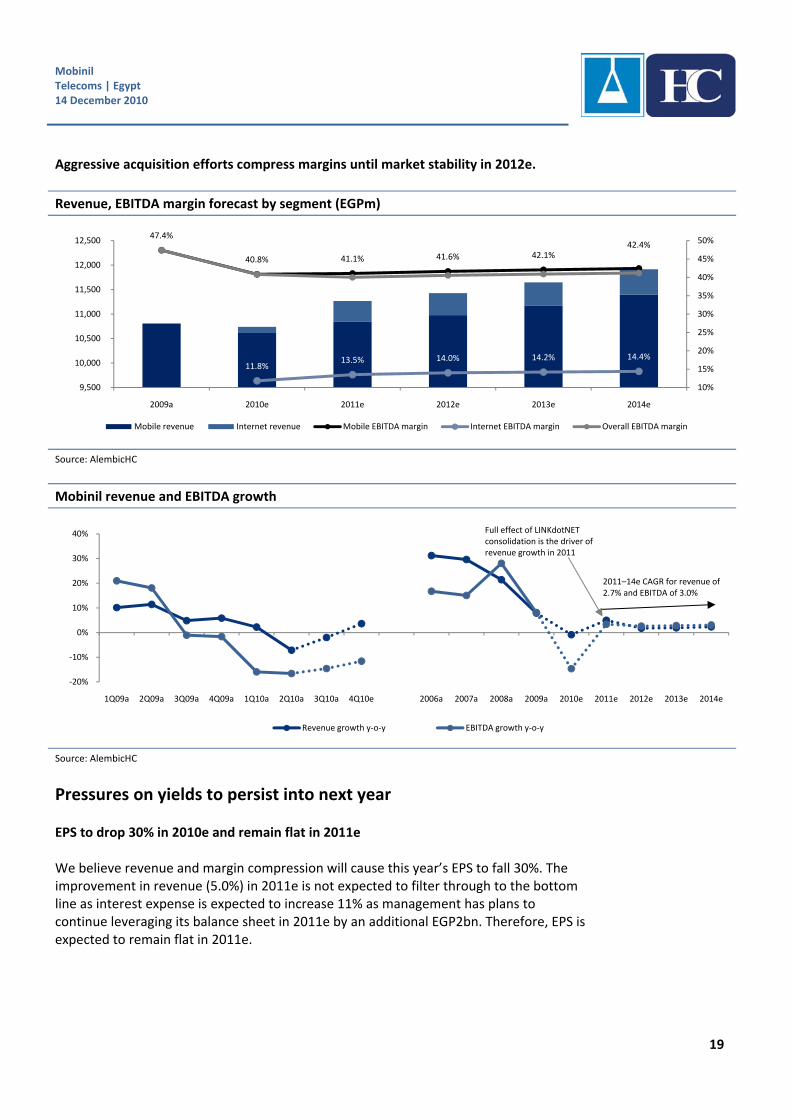
Aggressive acquisition efforts compress margins until market stability in 2012e.
Revenue, EBITDA margin forecast by segment (EGPm)
Source: AlembicHC
Mobinil revenue and EBITDA growth
Source: AlembicHC
Pressures on yields to persist into next year EPS to drop 30% in 2010e and remain flat in 2011e We believe revenue and margin compression will cause this year’s EPS to fall 30%. The improvement in revenue (5.0%) in 2011e is not expected to filter through to the bottom line as interest expense is expected to increase 11% as management has plans to continue leveraging its balance sheet in 2011e by an additional EGP2bn. Therefore, EPS is expected to remain flat in 2011e.
47.4%
40.8% 41.1% 41.6% 42.1%42.4%
11.8%13.5% 14.0% 14.2% 14.4%
10%
15%
20%
25%
30%
35%
40%
45%
50%
9,500
10,000
10,500
11,000
11,500
12,000
12,500
2009a 2010e 2011e 2012e 2013e 2014e
Mobile revenue Internet revenue Mobile EBITDA margin Internet EBITDA margin Overall EBITDA margin
‐20%
‐10%
0%
10%
20%
30%
40%
1Q09a 2Q09a 3Q09a 4Q09a 1Q10a 2Q10a 3Q10a 4Q10e 2006a 2007a 2008a 2009a 2010e 2011e 2012e 2013e 2014e
Revenue growth y‐o‐y EBITDA growth y‐o‐y
Full effect of LINKdotNET consolidation is the driver of revenue growth in 2011
2011–14e CAGR for revenue of 2.7% and EBITDA of 3.0%

Mobinil Telecoms | Egypt 14 December 2010
20
Debt accumulation until 2011e will put additional pressure on the bottom line (EGPm)
Source: Mobinil, AlembicHC
EPS (EGP) and EPS growth
Source: Mobinil, AlembicHC
Unattractive FCF and dividend yield in 2010e and 2011e FCF is expected to be negative this year given our forecast of 15% drop in EBITDA along with EGP1.85bn in license payments (of which EGP1.1bn expected to be made in 4Q10e). FCF in 2011e is expected to be pressured (FCF yield of 3.0%) by additional CAPEX (20% of sales versus 16% in 2010e) as we expect normal levels of CAPEX to resume after the company saved on CAPEX in 2010e to be able to make license payments and purchase LINKdotNET. As such, we assumed a dividend payout of 50% for 2010e (in line with 2009), leading to a dividend yield of 4.3%, and expect the payout to increase to 70% in 2011e as operational pressures recede, which will however still result in a 5.8% yield. We believe investors should consider Mobinil again by the end of next year when we expect operational recovery, and according to our estimates FCF yield reaches 9.6%, with dividend yield of 6.6% by 2012e.
25% 25%
22%
17%
24% 25%
32%
25%
6%5%
20%
22%
26%
30%28%
24%
20%
0%
5%
10%
15%
20%
25%
30%
35%
0
2,000
4,000
6,000
8,000
10,000
12,000
1Q08a 2Q08a 3Q08a 4Q08a 1Q10a 2Q10a 3Q10a 4Q10e 2006a 2007a 2008a 2009a 2010e 2011e 2012e 2013e 2014e
Total deb
t
Total debt Interest expense as % of EBIT
12%
5% 5%
‐30%
‐2%
6%10% 10%
‐35%
‐25%
‐15%
‐5%
5%
15%
25%
35%
0
2
4
6
8
10
12
14
16
18
20
2007a 2008a 2009a 2010e 2011e 2012e 2013e 2014e
EPS EPS growth
Exceptionally high due to USD60m of forex losses
Mobinil Telecoms | Egypt 14 December 2010
21
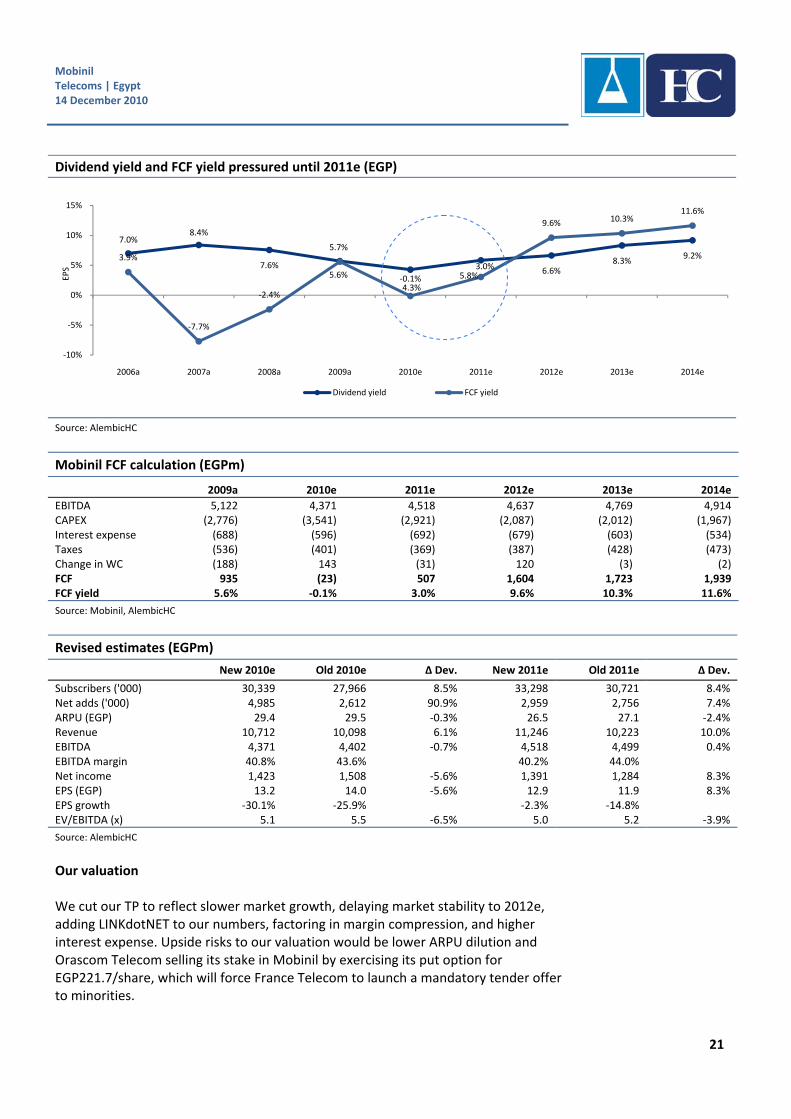
Dividend yield and FCF yield pressured until 2011e (EGP)
Source: AlembicHC
Mobinil FCF calculation (EGPm)
2009a 2010e 2011e 2012e 2013e 2014e
EBITDA 5,122 4,371 4,518 4,637 4,769 4,914 CAPEX (2,776) (3,541) (2,921) (2,087) (2,012) (1,967) Interest expense (688) (596) (692) (679) (603) (534) Taxes (536) (401) (369) (387) (428) (473) Change in WC (188) 143 (31) 120 (3) (2) FCF 935 (23) 507 1,604 1,723 1,939 FCF yield 5.6% ‐0.1% 3.0% 9.6% 10.3% 11.6%
Source: Mobinil, AlembicHC
Revised estimates (EGPm)
New 2010e Old 2010e ∆ Dev. New 2011e Old 2011e ∆ Dev.
Subscribers ('000) 30,339 27,966 8.5% 33,298 30,721 8.4% Net adds ('000) 4,985 2,612 90.9% 2,959 2,756 7.4% ARPU (EGP) 29.4 29.5 ‐0.3% 26.5 27.1 ‐2.4% Revenue 10,712 10,098 6.1% 11,246 10,223 10.0% EBITDA 4,371 4,402 ‐0.7% 4,518 4,499 0.4% EBITDA margin 40.8% 43.6% 40.2% 44.0% Net income 1,423 1,508 ‐5.6% 1,391 1,284 8.3% EPS (EGP) 13.2 14.0 ‐5.6% 12.9 11.9 8.3% EPS growth ‐30.1% ‐25.9% ‐2.3% ‐14.8% EV/EBITDA (x) 5.1 5.5 ‐6.5% 5.0 5.2 ‐3.9%
Source: AlembicHC
Our valuation We cut our TP to reflect slower market growth, delaying market stability to 2012e, adding LINKdotNET to our numbers, factoring in margin compression, and higher interest expense. Upside risks to our valuation would be lower ARPU dilution and Orascom Telecom selling its stake in Mobinil by exercising its put option for EGP221.7/share, which will force France Telecom to launch a mandatory tender offer to minorities.
7.0%8.4%
7.6%
5.7%
4.3%
5.8%6.6%
8.3%9.2%3.9%
‐7.7%
‐2.4%
5.6% ‐0.1%
3.0%
9.6% 10.3%11.6%
‐10%
‐5%
0%
5%
10%
15%
2006a 2007a 2008a 2009a 2010e 2011e 2012e 2013e 2014e
EPS
Dividend yield FCF yield
Mobinil Telecoms | Egypt 14 December 2010
22
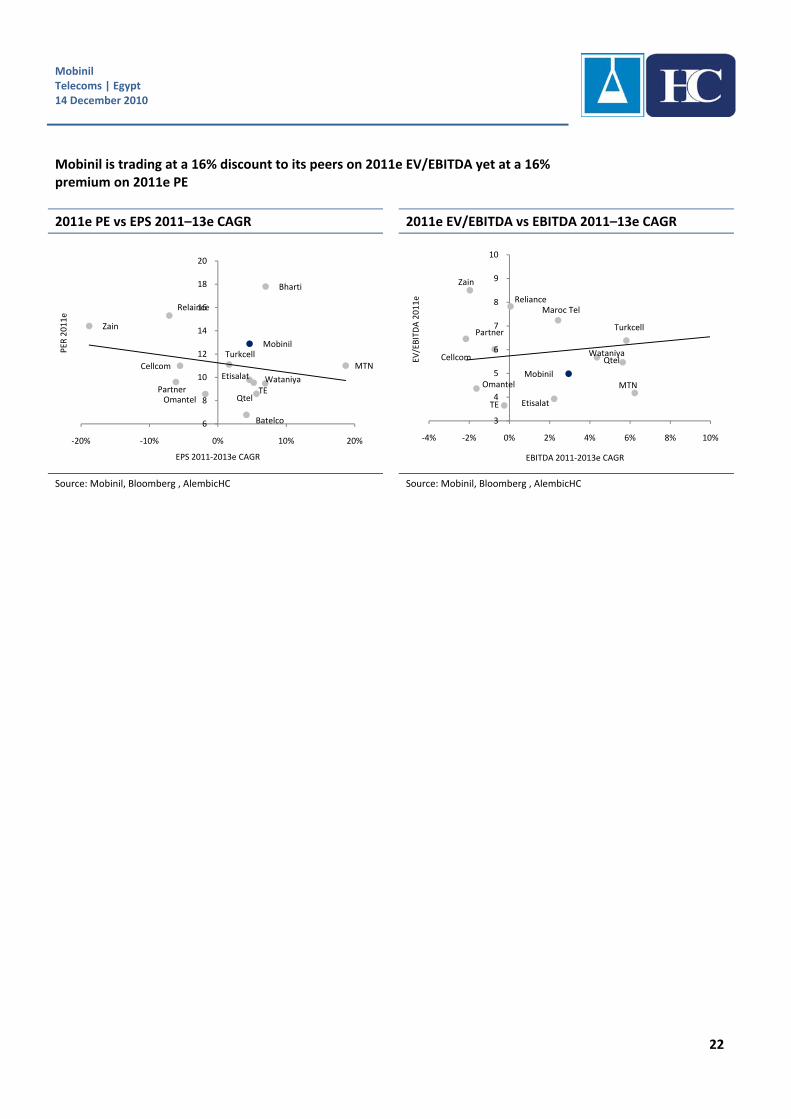
Mobinil is trading at a 16% discount to its peers on 2011e EV/EBITDA yet at a 16% premium on 2011e PE
2011e PE vs EPS 2011–13e CAGR 2011e EV/EBITDA vs EBITDA 2011–13e CAGR
Source: Mobinil, Bloomberg , AlembicHC Source: Mobinil, Bloomberg , AlembicHC
TE
Zain
Wataniya
Qtel
MTN
Bharti
Mobinil
Batelco
Omantel
Relaince
Partner
Cellcom
Turkcell
Etisalat
6
8
10
12
14
16
18
20
‐20% ‐10% 0% 10% 20%
PER
2011e
EPS 2011‐2013e CAGR
TE
Maroc Tel
Zain
WataniyaQtel
MTN Mobinil
Omantel
Reliance
Cellcom
PartnerTurkcell
Etisalat
3
4
5
6
7
8
9
10
‐4% ‐2% 0% 2% 4% 6% 8% 10%
EV/EBITDA 2011e
EBITDA 2011‐2013e CAGR
Mobinil Telecoms | Egypt 14 December 2010
23
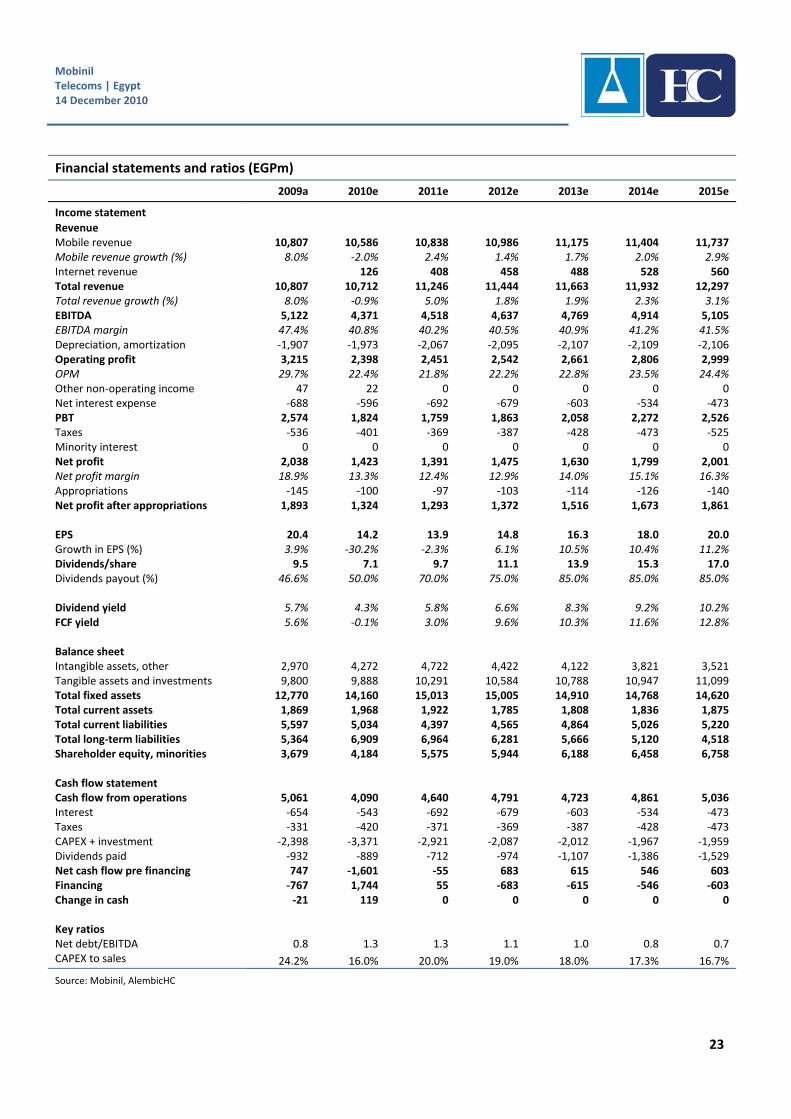
Financial statements and ratios (EGPm)
2009a 2010e 2011e 2012e 2013e 2014e 2015e
Income statement Revenue Mobile revenue 10,807 10,586 10,838 10,986 11,175 11,404 11,737 Mobile revenue growth (%) 8.0% ‐2.0% 2.4% 1.4% 1.7% 2.0% 2.9% Internet revenue 126 408 458 488 528 560 Total revenue 10,807 10,712 11,246 11,444 11,663 11,932 12,297 Total revenue growth (%) 8.0% ‐0.9% 5.0% 1.8% 1.9% 2.3% 3.1% EBITDA 5,122 4,371 4,518 4,637 4,769 4,914 5,105 EBITDA margin 47.4% 40.8% 40.2% 40.5% 40.9% 41.2% 41.5% Depreciation, amortization ‐1,907 ‐1,973 ‐2,067 ‐2,095 ‐2,107 ‐2,109 ‐2,106 Operating profit 3,215 2,398 2,451 2,542 2,661 2,806 2,999 OPM 29.7% 22.4% 21.8% 22.2% 22.8% 23.5% 24.4% Other non‐operating income 47 22 0 0 0 0 0 Net interest expense ‐688 ‐596 ‐692 ‐679 ‐603 ‐534 ‐473 PBT 2,574 1,824 1,759 1,863 2,058 2,272 2,526 Taxes ‐536 ‐401 ‐369 ‐387 ‐428 ‐473 ‐525 Minority interest 0 0 0 0 0 0 0 Net profit 2,038 1,423 1,391 1,475 1,630 1,799 2,001 Net profit margin 18.9% 13.3% 12.4% 12.9% 14.0% 15.1% 16.3% Appropriations ‐145 ‐100 ‐97 ‐103 ‐114 ‐126 ‐140 Net profit after appropriations 1,893 1,324 1,293 1,372 1,516 1,673 1,861 EPS 20.4 14.2 13.9 14.8 16.3 18.0 20.0 Growth in EPS (%) 3.9% ‐30.2% ‐2.3% 6.1% 10.5% 10.4% 11.2% Dividends/share 9.5 7.1 9.7 11.1 13.9 15.3 17.0 Dividends payout (%) 46.6% 50.0% 70.0% 75.0% 85.0% 85.0% 85.0% Dividend yield 5.7% 4.3% 5.8% 6.6% 8.3% 9.2% 10.2% FCF yield 5.6% ‐0.1% 3.0% 9.6% 10.3% 11.6% 12.8% Balance sheet Intangible assets, other 2,970 4,272 4,722 4,422 4,122 3,821 3,521 Tangible assets and investments 9,800 9,888 10,291 10,584 10,788 10,947 11,099 Total fixed assets 12,770 14,160 15,013 15,005 14,910 14,768 14,620 Total current assets 1,869 1,968 1,922 1,785 1,808 1,836 1,875 Total current liabilities 5,597 5,034 4,397 4,565 4,864 5,026 5,220 Total long‐term liabilities 5,364 6,909 6,964 6,281 5,666 5,120 4,518 Shareholder equity, minorities 3,679 4,184 5,575 5,944 6,188 6,458 6,758 Cash flow statement Cash flow from operations 5,061 4,090 4,640 4,791 4,723 4,861 5,036 Interest ‐654 ‐543 ‐692 ‐679 ‐603 ‐534 ‐473 Taxes ‐331 ‐420 ‐371 ‐369 ‐387 ‐428 ‐473 CAPEX + investment ‐2,398 ‐3,371 ‐2,921 ‐2,087 ‐2,012 ‐1,967 ‐1,959 Dividends paid ‐932 ‐889 ‐712 ‐974 ‐1,107 ‐1,386 ‐1,529 Net cash flow pre financing 747 ‐1,601 ‐55 683 615 546 603 Financing ‐767 1,744 55 ‐683 ‐615 ‐546 ‐603 Change in cash ‐21 119 0 0 0 0 0 Key ratios Net debt/EBITDA 0.8 1.3 1.3 1.1 1.0 0.8 0.7 CAPEX to sales 24.2% 16.0% 20.0% 19.0% 18.0% 17.3% 16.7%
Source: Mobinil, AlembicHC
Telecom Egypt Telecoms | Egypt 14 December 2010
24
Telecom Egypt
Strong yields
Revenue expected to remain flat in the medium term due to wholesale, but TE still offers high FCF and dividend yield of 16.6% and 8.1% expected in 2010e
In our view, concerns about interconnect dispute and MVNO are minimal
Reiterate Overweight view and lower TP 2.0% to EGP21.1/share
We forecast a flat top line growth
On the retail front, broadband revenue (2011–14e CAGR of 18.5%) is expected to offset the drop in voice and access (CAGR of ‐3.1%). Domestic wholesale is expected to grow at a CAGR of 5.6%, offsetting the drop in international revenue (CAGR of ‐2.4%) now that Etisalat also has an international gateway. We expect the EBITDA margin to remain volatile as TE recognizes different types of cable revenue. We expect continued pressure due to competition with mobile operators until stability kicks in 2012e, but EBITDA is expected to follow its normal trend going forward with a 2011–14e CAGR of 0.8%.
VFE to continue cutting prices
We expect VFE to continue cutting prices aggressively to maintain its market leadership position, which we believe will lead to considerable ARPU dilution (2011–14e CAGR of ‐4.9%). Compared to Mobinil, VFE might seem better poised, but we expect revenue and EBITDA to see increasing pressure compared to historical levels. We expect revenue to remain flat in 2010e and EBITDA to drop 4.7%. We believe revenue will grow at a 2011–14e CAGR of 2.3% and EBITDA 2.5%. We lower our TP for VFE to EGP8.5 per TE share based on revised estimates in line with our bearish view on the market and reflecting margin compression as a result of competition. Two concerns with minimal downside risk
On the interconnect dispute, we believe that if the old regime is restored it will bring down the EBITDA margin to 45.4% from 47.1% in 2011e and to 46.2% from 48.2% in 2015e, push the dividend yield down to 8.3% from 8.7%, and dilute our TP by 3.9% to EGP20.3. The other concern is the Mobile Virtual Network Operator (MVNO) setup, which we believe TE will take as a short‐term solution to penetrate the mobile market, which is also its cheapest option. TE’s plans to establish a full MVNO would require a level of investment (already factored in our numbers), which we believe would have a minimal effect on its dividend distribution although we did not forecast any potential upside in our model.
We cut our TP 2.0% to EGP21.1/share and maintain Overweight
We lower our TP 2.0% to EGP21.1/share and maintain our Overweight rating on the stock due to (1) TE’s strong balance sheet (cash balance to rise from 8% in 2010e to 24% of total assets in 2015e), (2) a sustainable high FCF yield averaging 14.2%, (3) an EPS 2011–14e CAGR of 5.6% fuelled by higher EBITDA and interest income, and (4) an expected dividend yield of 8.1% in 2010e and 8.7% in 2011e. We believe that dividend distribution can increase further given the strong cash accumulation. The stock trades at a 36% and 10% discount to peers on 2011e EV/EBITDA and PE, respectively.
Telecom Egypt Telecoms | Egypt 14 December 2010
25
Revenue expected to remain flat in the medium term
Retail revenue to remain under pressure (2010–14e CAGR of 1.5%) saved by the data segment (CAGR of 18.5%)
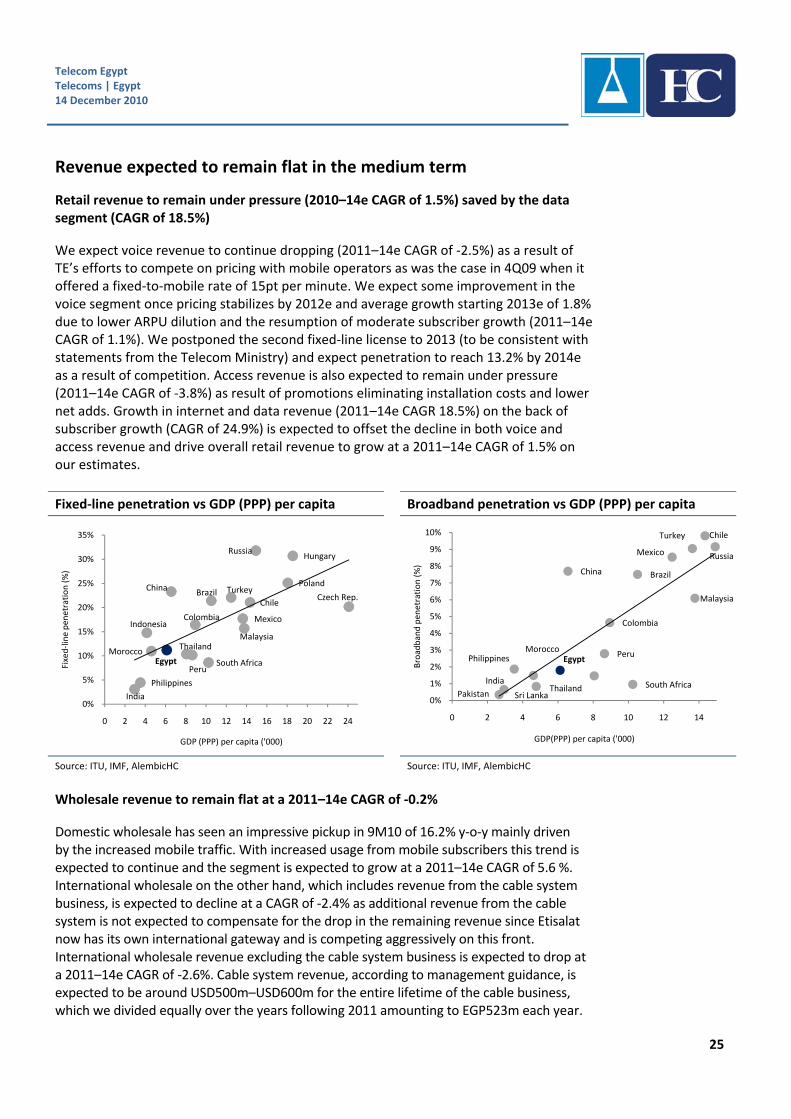
We expect voice revenue to continue dropping (2011–14e CAGR of ‐2.5%) as a result of TE’s efforts to compete on pricing with mobile operators as was the case in 4Q09 when it offered a fixed‐to‐mobile rate of 15pt per minute. We expect some improvement in the voice segment once pricing stabilizes by 2012e and average growth starting 2013e of 1.8% due to lower ARPU dilution and the resumption of moderate subscriber growth (2011–14e CAGR of 1.1%). We postponed the second fixed‐line license to 2013 (to be consistent with statements from the Telecom Ministry) and expect penetration to reach 13.2% by 2014e as a result of competition. Access revenue is also expected to remain under pressure (2011–14e CAGR of ‐3.8%) as result of promotions eliminating installation costs and lower net adds. Growth in internet and data revenue (2011–14e CAGR 18.5%) on the back of subscriber growth (CAGR of 24.9%) is expected to offset the decline in both voice and access revenue and drive overall retail revenue to grow at a 2011–14e CAGR of 1.5% on our estimates.
Fixed‐line penetration vs GDP (PPP) per capita Broadband penetration vs GDP (PPP) per capita
Source: ITU, IMF, AlembicHC Source: ITU, IMF, AlembicHC
Wholesale revenue to remain flat at a 2011–14e CAGR of ‐0.2%
Domestic wholesale has seen an impressive pickup in 9M10 of 16.2% y‐o‐y mainly driven by the increased mobile traffic. With increased usage from mobile subscribers this trend is expected to continue and the segment is expected to grow at a 2011–14e CAGR of 5.6 %. International wholesale on the other hand, which includes revenue from the cable system business, is expected to decline at a CAGR of ‐2.4% as additional revenue from the cable system is not expected to compensate for the drop in the remaining revenue since Etisalat now has its own international gateway and is competing aggressively on this front. International wholesale revenue excluding the cable system business is expected to drop at a 2011–14e CAGR of ‐2.6%. Cable system revenue, according to management guidance, is expected to be around USD500m–USD600m for the entire lifetime of the cable business, which we divided equally over the years following 2011 amounting to EGP523m each year.
India
Philippines
South AfricaPeru
ThailandMorocco
Egypt
Indonesia
Malaysia
Colombia Mexico
Czech Rep.Chile
Brazil TurkeyChina Poland
HungaryRussia
0%
5%
10%
15%
20%
25%
30%
35%
0 2 4 6 8 10 12 14 16 18 20 22 24
Fixed‐line pen
etration (%)
GDP (PPP) per capita ('000)
India
PhilippinesMorocco
Egypt
China
Thailand
Peru
Colombia
South Africa
Brazil
Turkey
Mexico
Malaysia
Chile
Russia
Sri LankaPakistan0%
1%
2%
3%
4%
5%
6%
7%
8%
9%
10%
0 2 4 6 8 10 12 14
Broadband pen
etration (%)
GDP(PPP) per capita ('000)
Telecom Egypt Telecoms | Egypt 14 December 2010
26
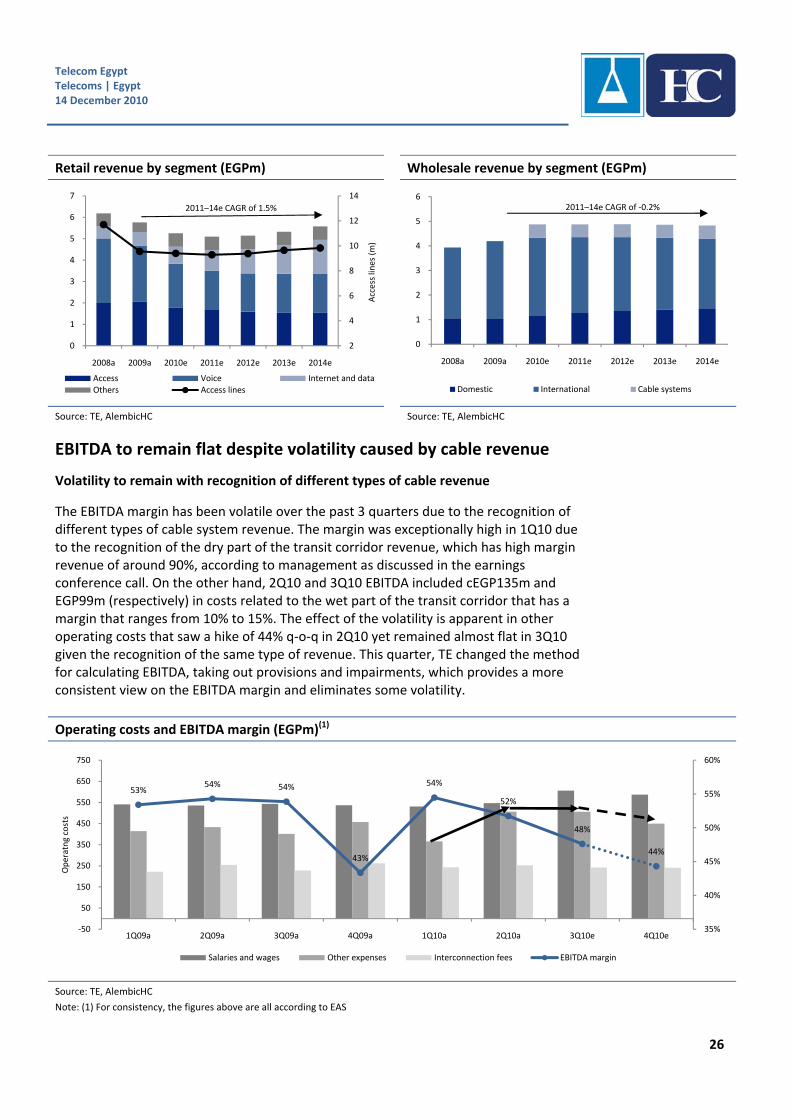
Retail revenue by segment (EGPm) Wholesale revenue by segment (EGPm)
Source: TE, AlembicHC Source: TE, AlembicHC
EBITDA to remain flat despite volatility caused by cable revenue
Volatility to remain with recognition of different types of cable revenue
The EBITDA margin has been volatile over the past 3 quarters due to the recognition of different types of cable system revenue. The margin was exceptionally high in 1Q10 due to the recognition of the dry part of the transit corridor revenue, which has high margin revenue of around 90%, according to management as discussed in the earnings conference call. On the other hand, 2Q10 and 3Q10 EBITDA included cEGP135m and EGP99m (respectively) in costs related to the wet part of the transit corridor that has a margin that ranges from 10% to 15%. The effect of the volatility is apparent in other operating costs that saw a hike of 44% q‐o‐q in 2Q10 yet remained almost flat in 3Q10 given the recognition of the same type of revenue. This quarter, TE changed the method for calculating EBITDA, taking out provisions and impairments, which provides a more consistent view on the EBITDA margin and eliminates some volatility.
Operating costs and EBITDA margin (EGPm)(1)
Source: TE, AlembicHC
Note: (1) For consistency, the figures above are all according to EAS
2
4
6
8
10
12
14
0
1
2
3
4
5
6
7
2008a 2009a 2010e 2011e 2012e 2013e 2014eAccess lines (m)
Access Voice Internet and dataOthers Access lines
0
1
2
3
4
5
6
2008a 2009a 2010e 2011e 2012e 2013e 2014e
Domestic International Cable systems
53%54% 54%
43%
54%
52%
48%
44%
35%
40%
45%
50%
55%
60%
‐50
50
150
250
350
450
550
650
750
1Q09a 2Q09a 3Q09a 4Q09a 1Q10a 2Q10a 3Q10e 4Q10e
Operatng costs
Salaries and wages Other expenses Interconnection fees EBITDA margin
2011–14e CAGR of 1.5% 2011–14e CAGR of ‐0.2%
Telecom Egypt Telecoms | Egypt 14 December 2010
27
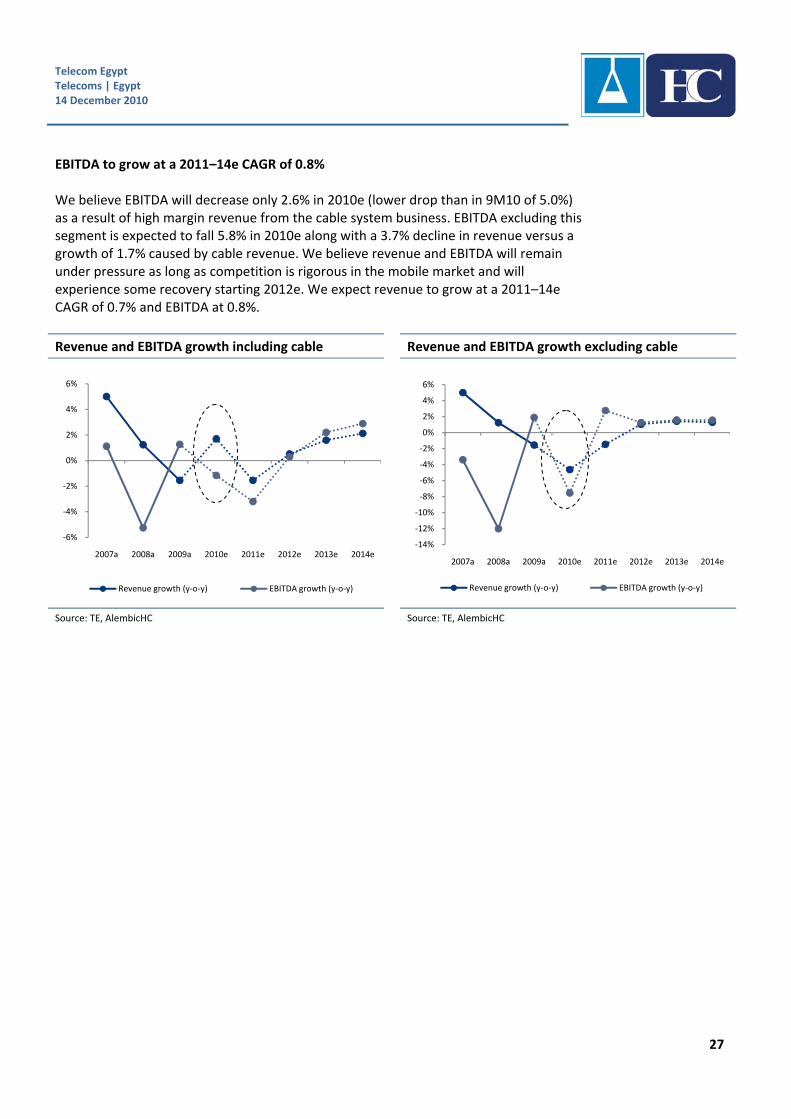
EBITDA to grow at a 2011–14e CAGR of 0.8% We believe EBITDA will decrease only 2.6% in 2010e (lower drop than in 9M10 of 5.0%) as a result of high margin revenue from the cable system business. EBITDA excluding this segment is expected to fall 5.8% in 2010e along with a 3.7% decline in revenue versus a growth of 1.7% caused by cable revenue. We believe revenue and EBITDA will remain under pressure as long as competition is rigorous in the mobile market and will experience some recovery starting 2012e. We expect revenue to grow at a 2011–14e CAGR of 0.7% and EBITDA at 0.8%.
Revenue and EBITDA growth including cable Revenue and EBITDA growth excluding cable
Source: TE, AlembicHC Source: TE, AlembicHC
‐6%
‐4%
‐2%
0%
2%
4%
6%
2007a 2008a 2009a 2010e 2011e 2012e 2013e 2014e
Revenue growth (y‐o‐y) EBITDA growth (y‐o‐y)
‐14%
‐12%
‐10%
‐8%
‐6%
‐4%
‐2%
0%
2%
4%
6%
2007a 2008a 2009a 2010e 2011e 2012e 2013e 2014e
Revenue growth (y‐o‐y) EBITDA growth (y‐o‐y)
Telecom Egypt Telecoms | Egypt 14 December 2010
28
More than a traditional MVNO: Differentiation through convergence Entering the mobile market through an MVNO setup is a first stage The Telecom Ministry decided to postpone offering a fourth mobile license beyond 2013 and discussions between TE and VG to purchase the latter’s stake in VFE were not concluded, meaning that TE’s only option to venture into the mobile space would be buying Egypt’s first MVNO license. TE is currently studying the viability of being a virtual mobile operator and is expected to reach a final decision by 1Q11. We believe TE will continue to eye VG’s stake in VFE or bid for Egypt’s fourth (4G) mobile license therefore the MVNO setup would provide TE with a short term solution (the cheapest as well) to access Egypt’s mobile market. We previously argued in favor of fixed‐to‐mobile convergence (FMC) In our last note Not a doomsday scenario (6 April 2010) we argued in favor of a fourth mobile license as we are confident in the opportunities FMC can offer. TE’s MVNO venture will still play on convergence but with an alternative technology deploying femtocells. Femtocells are small cellular base stations (very similar to Wi‐Fi routers) that allow a customer to connect to the broadband network once indoors and be charged lower rates in line with the fixed‐line rate. In essence, TE will be able to compete with mobile operators by utilizing femtocells to capture mobile users when at home (60% of voice and 70% of data usage occurs indoors) and divert their mobile originated voice and data calls to the fixed‐line network, like with VoIP. The femtocell value proposition Femtocells offer customers six main benefits: (1) improved in‐home mobile coverage, (2) enhancing video and audio downloading, (3) cheaper in‐home call/ data rates, (4) higher mobile internet speed, (5) improved phone battery life (especially for Wi‐Fi users), and (6) various value‐added services, of which the most appealing would be allowing customers to have a virtual home number, meaning they would require only one handset instead of two. As such, we see more to the story than the traditional minute reseller as we believe in the value proposition convergence could offer. Reasoning behind TE and VFE’s willingness to agree on an MVNO setup TE is likely to opt for an MVNO setup on VFE’s network since TE would probably receive a better wholesale price than from mobile operators. VFE’s CEO already expressed his willingness to the Egyptian press. We believe VFE would benefit from (1) delaying the issuance of a fourth mobile license in the market and ensuring that they get a share of the forth entrant’s revenue and (2) delaying TE’s acquisition talks regarding VG’s stake in VFE. Full MVNO: Relative independence of MNO and various synergies TE plans to launch a full (also called heavy) MVNO to capitalize on the synergies it can extract from its fixed‐line business including a large distribution network in all Egyptian governorates, a customer service call center, experienced employees in various functional areas, an international gateway, and the fixed‐line infrastructure (saving on
Telecom Egypt Telecoms | Egypt 14 December 2010
29
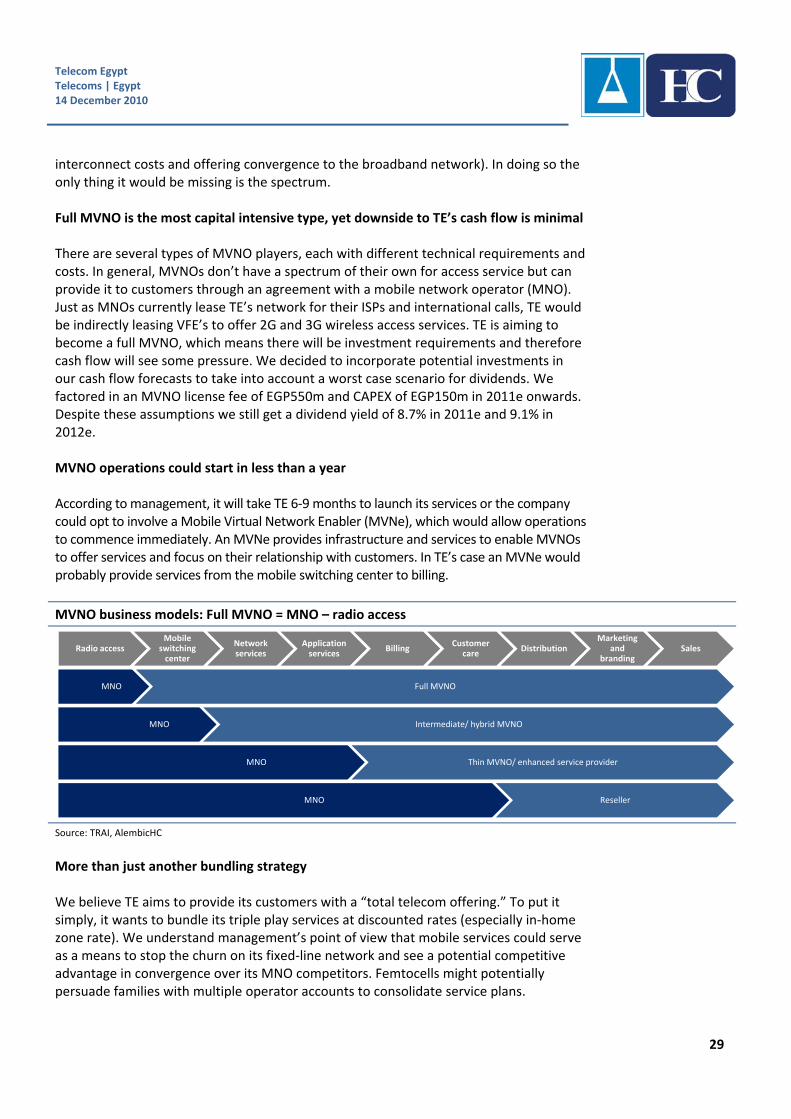
interconnect costs and offering convergence to the broadband network). In doing so the only thing it would be missing is the spectrum. Full MVNO is the most capital intensive type, yet downside to TE’s cash flow is minimal There are several types of MVNO players, each with different technical requirements and costs. In general, MVNOs don’t have a spectrum of their own for access service but can provide it to customers through an agreement with a mobile network operator (MNO). Just as MNOs currently lease TE’s network for their ISPs and international calls, TE would be indirectly leasing VFE’s to offer 2G and 3G wireless access services. TE is aiming to become a full MVNO, which means there will be investment requirements and therefore cash flow will see some pressure. We decided to incorporate potential investments in our cash flow forecasts to take into account a worst case scenario for dividends. We factored in an MVNO license fee of EGP550m and CAPEX of EGP150m in 2011e onwards. Despite these assumptions we still get a dividend yield of 8.7% in 2011e and 9.1% in 2012e. MVNO operations could start in less than a year According to management, it will take TE 6‐9 months to launch its services or the company could opt to involve a Mobile Virtual Network Enabler (MVNe), which would allow operations to commence immediately. An MVNe provides infrastructure and services to enable MVNOs to offer services and focus on their relationship with customers. In TE’s case an MVNe would probably provide services from the mobile switching center to billing.
MVNO business models: Full MVNO = MNO – radio access
Source: TRAI, AlembicHC
More than just another bundling strategy We believe TE aims to provide its customers with a “total telecom offering.” To put it simply, it wants to bundle its triple play services at discounted rates (especially in‐home zone rate). We understand management’s point of view that mobile services could serve as a means to stop the churn on its fixed‐line network and see a potential competitive advantage in convergence over its MNO competitors. Femtocells might potentially persuade families with multiple operator accounts to consolidate service plans.
Radio accessMobile switching center
Network services
Application services
BillingCustomer
careDistribution
Marketing and
brandingSales
MNO Full MVNO
MNO Intermediate/ hybrid MVNO
MNO Thin MVNO/ enhanced service provider
MNO Reseller
Telecom Egypt Telecoms | Egypt 14 December 2010
30
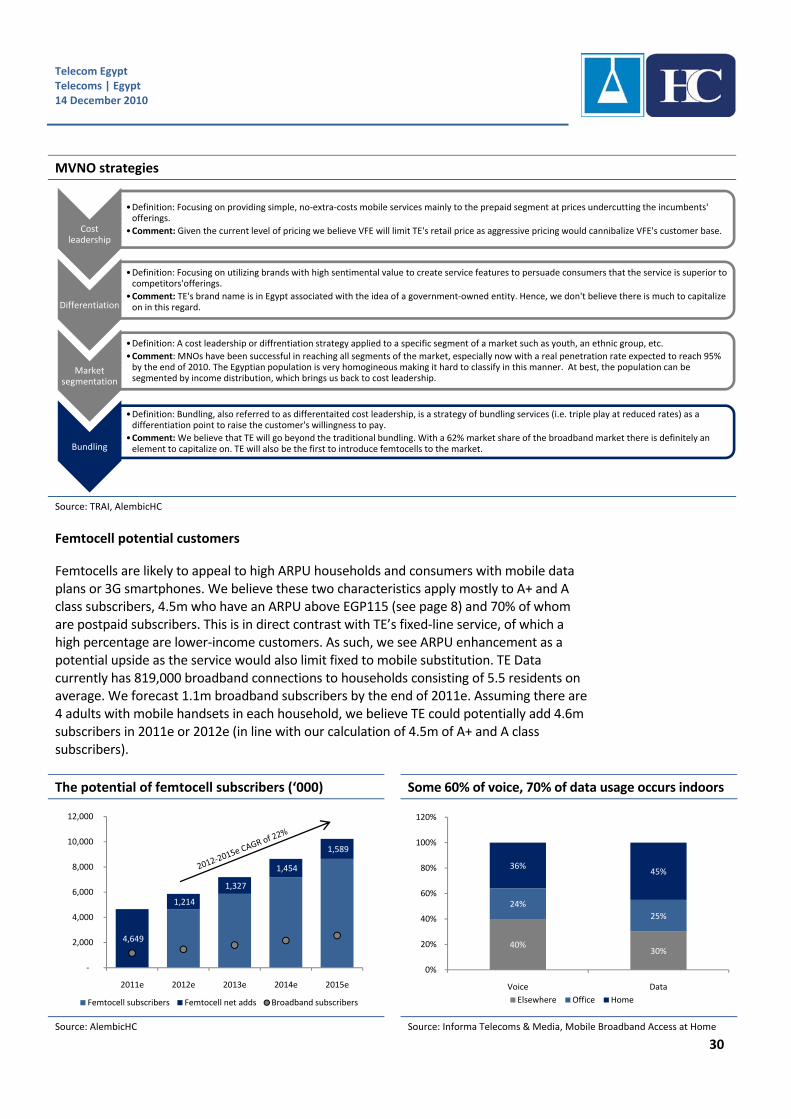
MVNO strategies
Source: TRAI, AlembicHC
Femtocell potential customers
Femtocells are likely to appeal to high ARPU households and consumers with mobile data plans or 3G smartphones. We believe these two characteristics apply mostly to A+ and A class subscribers, 4.5m who have an ARPU above EGP115 (see page 8) and 70% of whom are postpaid subscribers. This is in direct contrast with TE’s fixed‐line service, of which a high percentage are lower‐income customers. As such, we see ARPU enhancement as a potential upside as the service would also limit fixed to mobile substitution. TE Data currently has 819,000 broadband connections to households consisting of 5.5 residents on average. We forecast 1.1m broadband subscribers by the end of 2011e. Assuming there are 4 adults with mobile handsets in each household, we believe TE could potentially add 4.6m subscribers in 2011e or 2012e (in line with our calculation of 4.5m of A+ and A class subscribers).
The potential of femtocell subscribers (‘000) Some 60% of voice, 70% of data usage occurs indoors
Source: AlembicHC Source: Informa Telecoms & Media, Mobile Broadband Access at Home
Cost leadership
•Definition: Focusing on providing simple, no‐extra‐costs mobile services mainly to the prepaid segment at prices undercutting the incumbents' offerings.
•Comment: Given the current level of pricing we believe VFE will limit TE's retail price as aggressive pricing would cannibalize VFE's customer base.
Differentiation
•Definition: Focusing on utilizing brands with high sentimental value to create service features to persuade consumers that the service is superior to competitors'offerings.
•Comment: TE's brand name is in Egypt associated with the idea of a government‐owned entity. Hence, we don't believe there is much to capitalize on in this regard.
Market segmentation
•Definition: A cost leadership or diffrentiation strategy applied to a specific segment of a market such as youth, an ethnic group, etc.
•Comment: MNOs have been successful in reaching all segments of the market, especially now with a real penetration rate expected to reach 95% by the end of 2010. The Egyptian population is very homogineous making it hard to classify in this manner. At best, the population can be segmented by income distribution, which brings us back to cost leadership.
Bundling
•Definition: Bundling, also referred to as differentaited cost leadership, is a strategy of bundling services (i.e. triple play at reduced rates) as a differentiation point to raise the customer's willingness to pay.
•Comment: We believe that TE will go beyond the traditional bundling. With a 62% market share of the broadband market there is definitely an element to capitalize on. TE will also be the first to introduce femtocells to the market.
4,649
1,214
1,327
1,454
1,589
‐
2,000
4,000
6,000
8,000
10,000
12,000
2011e 2012e 2013e 2014e 2015e
Femtocell subscribers Femtocell net adds Broadband subscribers
40%30%
24%
25%
36%45%
0%
20%
40%
60%
80%
100%
120%
Voice Data
Elsewhere Office Home
Telecom Egypt Telecoms | Egypt 14 December 2010
31
Concerns surrounding the MVNO endeavor While we believe in the opportunities the service has to offer, its implementation and customer appeal remain questionable. The technology is new, and although 17 operators in 11 countries have already adopted it, subscriber numbers are not disclosed and marketing initiatives have not been aggressive. The only exception to this has been Vodafone UK, which has slashed femtocell prices 70% since their launch in 2009 and rebranded the service to Sure Signal in an attempt to market it for areas with limited coverage. Pricing is also a potential issue since a femtocell’s selling price is cUSD200, and operators are still testing retail pricing schemes to offset the cost of service and equipment while stimulating adoption. Pricing ranges from a complete subsidy (KDDI and Softbank in Japan) to monthly installments (ranging from USD9 to USD32). Our bearish outlook on the mobile market is based on real penetration reaching 95% in 2010e, which indicates that there is no room for another market entrant, and means high churn for other operators if the service gains customer appeal. Therefore, we chose not to reflect any upside potential in our model but only the worst case scenario (CAPEX cash out flows) on dividend distribution. MVNO setup with VFE is a double‐edged sword for TE Cannibalizing VFE’s market share would affect its revenue, which will eventually reflect on TE’s investment income booked from VFE. On the other hand, VFE would be adding a new revenue segment that would reflect positively on TE’s investment income. Whether these 2 phenomena would offset each other and how they will eventually affect investment income from VFE (an important element to TE’s bottom line) is uncertain in our view as it will be dependent on the wholesale agreement and the MVNO’s rate of success.
Telecom Egypt Telecoms | Egypt 14 December 2010
32
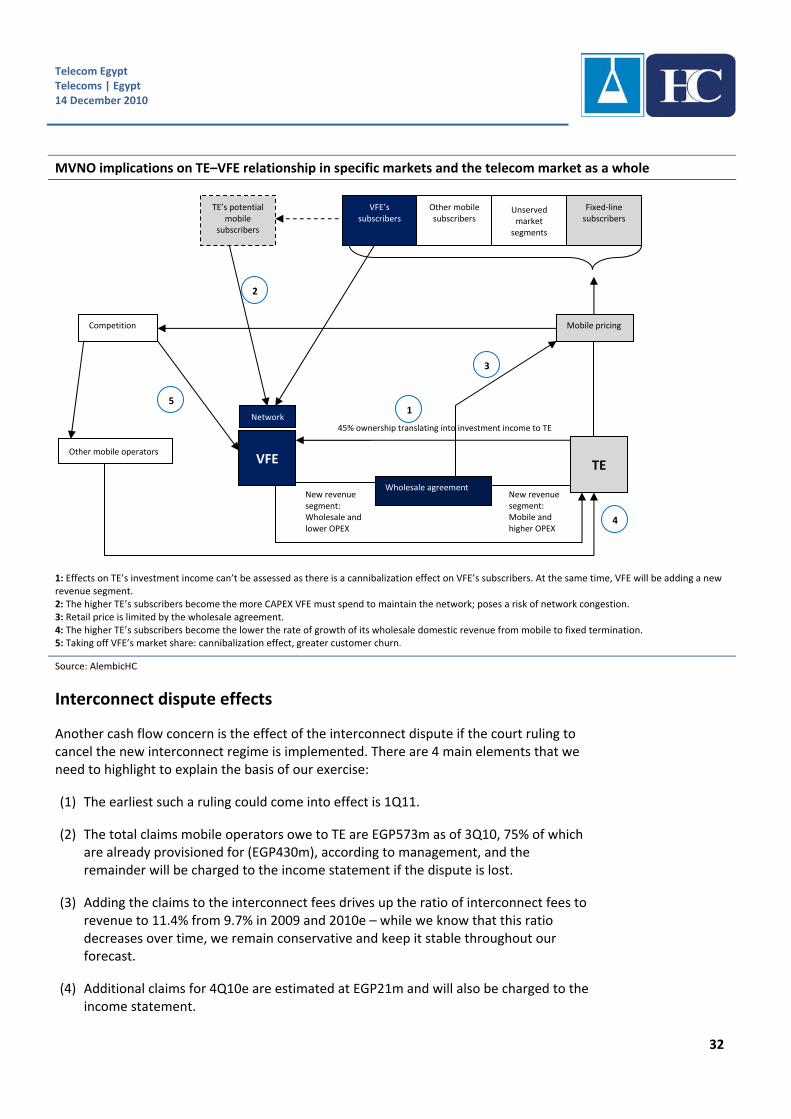
MVNO implications on TE–VFE relationship in specific markets and the telecom market as a whole
1: Effects on TE’s investment income can’t be assessed as there is a cannibalization effect on VFE’s subscribers. At the same time, VFE will be adding a new revenue segment. 2: The higher TE’s subscribers become the more CAPEX VFE must spend to maintain the network; poses a risk of network congestion. 3: Retail price is limited by the wholesale agreement. 4: The higher TE’s subscribers become the lower the rate of growth of its wholesale domestic revenue from mobile to fixed termination. 5: Taking off VFE’s market share: cannibalization effect, greater customer churn.
Source: AlembicHC
Interconnect dispute effects
Another cash flow concern is the effect of the interconnect dispute if the court ruling to cancel the new interconnect regime is implemented. There are 4 main elements that we need to highlight to explain the basis of our exercise:
(1) The earliest such a ruling could come into effect is 1Q11.
(2) The total claims mobile operators owe to TE are EGP573m as of 3Q10, 75% of which are already provisioned for (EGP430m), according to management, and the remainder will be charged to the income statement if the dispute is lost.
(3) Adding the claims to the interconnect fees drives up the ratio of interconnect fees to revenue to 11.4% from 9.7% in 2009 and 2010e – while we know that this ratio decreases over time, we remain conservative and keep it stable throughout our forecast.
(4) Additional claims for 4Q10e are estimated at EGP21m and will also be charged to the income statement.
VFE TE Other mobile operators
Unserved market segments
Fixed‐line subscribers
VFE’s subscribers
Other mobile subscribers
TE’s potential mobile
subscribers
Wholesale agreement
45% ownership translating into investment income to TE
Mobile pricing Competition
Network
New revenue segment: Mobile and higher OPEX
New revenue segment: Wholesale and lower OPEX
5
2
3
1
4
Telecom Egypt Telecoms | Egypt 14 December 2010
33
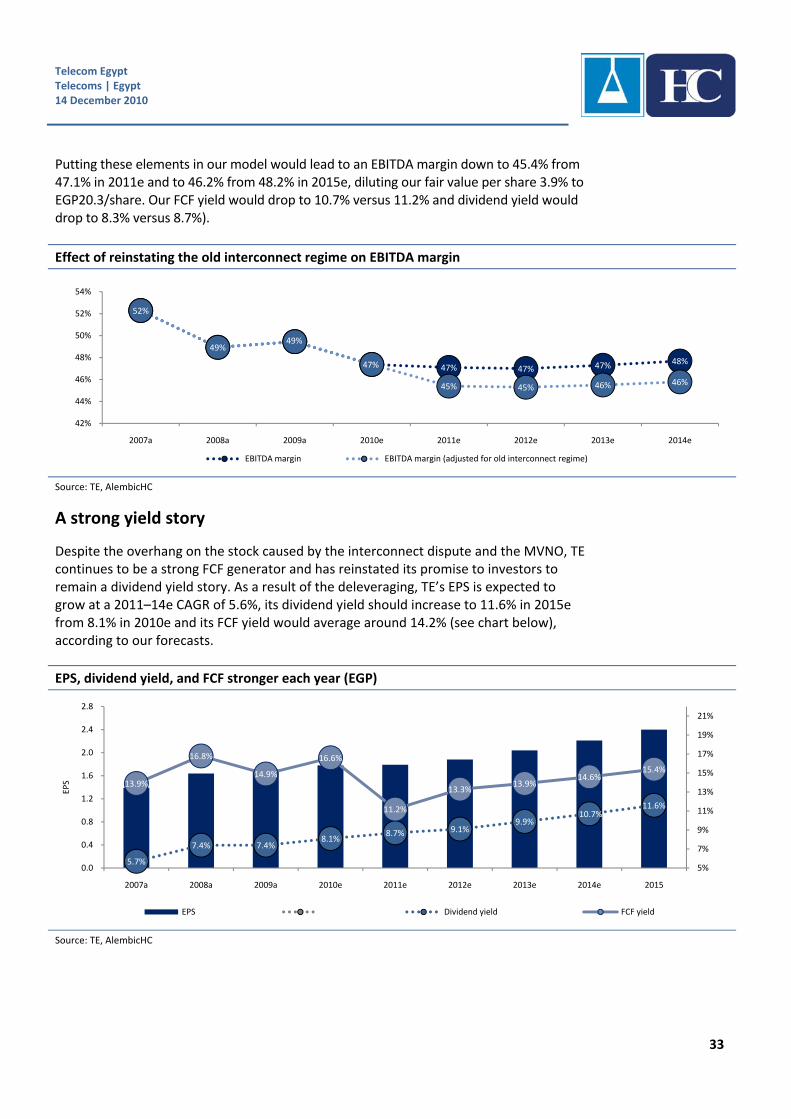
Putting these elements in our model would lead to an EBITDA margin down to 45.4% from 47.1% in 2011e and to 46.2% from 48.2% in 2015e, diluting our fair value per share 3.9% to EGP20.3/share. Our FCF yield would drop to 10.7% versus 11.2% and dividend yield would drop to 8.3% versus 8.7%).
Effect of reinstating the old interconnect regime on EBITDA margin
Source: TE, AlembicHC
A strong yield story
Despite the overhang on the stock caused by the interconnect dispute and the MVNO, TE continues to be a strong FCF generator and has reinstated its promise to investors to remain a dividend yield story. As a result of the deleveraging, TE’s EPS is expected to grow at a 2011–14e CAGR of 5.6%, its dividend yield should increase to 11.6% in 2015e from 8.1% in 2010e and its FCF yield would average around 14.2% (see chart below), according to our forecasts.
EPS, dividend yield, and FCF stronger each year (EGP)
Source: TE, AlembicHC
47% 47% 47% 48%
52%
49%49%
47%
45% 45% 46% 46%
42%
44%
46%
48%
50%
52%
54%
2007a 2008a 2009a 2010e 2011e 2012e 2013e 2014e
EBITDA margin EBITDA margin (adjusted for old interconnect regime)
5.7%
7.4% 7.4%8.1%
8.7% 9.1%9.9%
10.7%11.6%
13.9%
16.8%
14.9%
16.6%
11.2%
13.3%13.9%
14.6%15.4%
5%
7%
9%
11%
13%
15%
17%
19%
21%
0.0
0.4
0.8
1.2
1.6
2.0
2.4
2.8
2007a 2008a 2009a 2010e 2011e 2012e 2013e 2014e 2015
EPS
EPS Dividend yield FCF yield
Telecom Egypt Telecoms | Egypt 14 December 2010
34
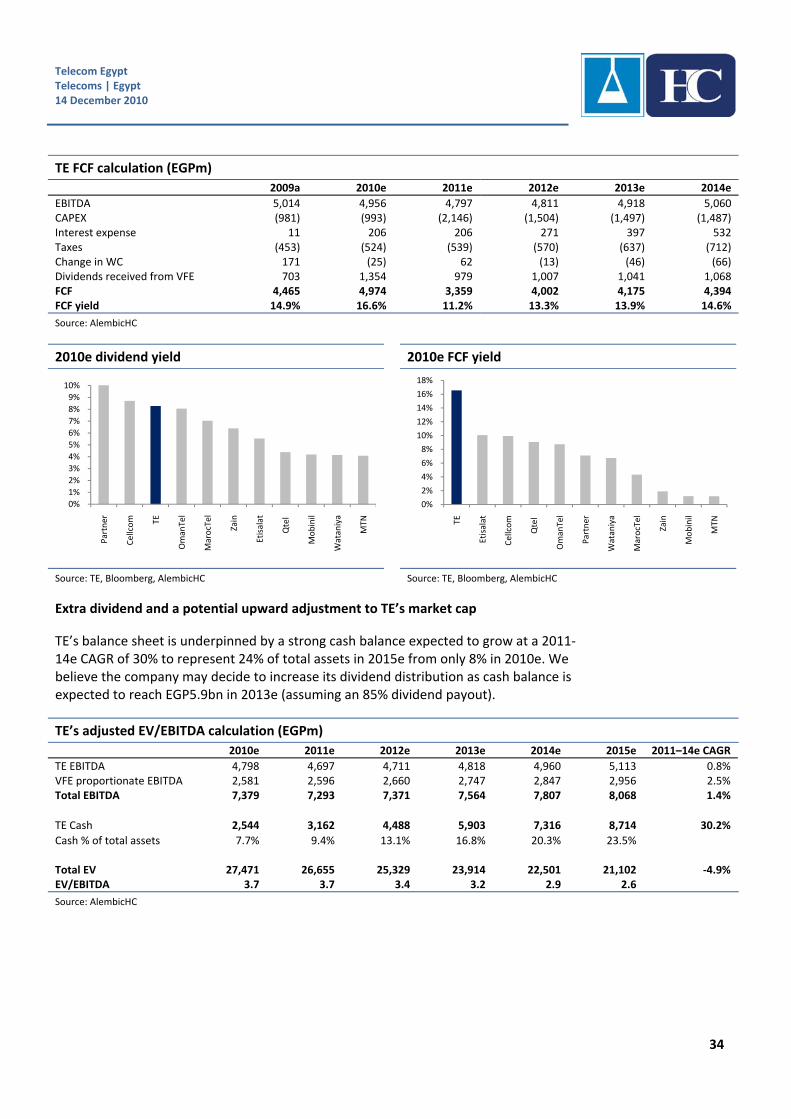
TE FCF calculation (EGPm)
2009a 2010e 2011e 2012e 2013e 2014e
EBITDA 5,014 4,956 4,797 4,811 4,918 5,060 CAPEX (981) (993) (2,146) (1,504) (1,497) (1,487) Interest expense 11 206 206 271 397 532 Taxes (453) (524) (539) (570) (637) (712) Change in WC 171 (25) 62 (13) (46) (66) Dividends received from VFE 703 1,354 979 1,007 1,041 1,068 FCF 4,465 4,974 3,359 4,002 4,175 4,394 FCF yield 14.9% 16.6% 11.2% 13.3% 13.9% 14.6%
Source: AlembicHC
2010e dividend yield 2010e FCF yield
Source: TE, Bloomberg, AlembicHC Source: TE, Bloomberg, AlembicHC
Extra dividend and a potential upward adjustment to TE’s market cap
TE’s balance sheet is underpinned by a strong cash balance expected to grow at a 2011‐14e CAGR of 30% to represent 24% of total assets in 2015e from only 8% in 2010e. We believe the company may decide to increase its dividend distribution as cash balance is expected to reach EGP5.9bn in 2013e (assuming an 85% dividend payout).
TE’s adjusted EV/EBITDA calculation (EGPm)
2010e 2011e 2012e 2013e 2014e 2015e 2011–14e CAGR
TE EBITDA 4,798 4,697 4,711 4,818 4,960 5,113 0.8% VFE proportionate EBITDA 2,581 2,596 2,660 2,747 2,847 2,956 2.5% Total EBITDA 7,379 7,293 7,371 7,564 7,807 8,068 1.4%
TE Cash 2,544 3,162 4,488 5,903 7,316 8,714 30.2%
Cash % of total assets 7.7% 9.4% 13.1% 16.8% 20.3% 23.5% Total EV 27,471 26,655 25,329 23,914 22,501 21,102 ‐4.9% EV/EBITDA 3.7 3.7 3.4 3.2 2.9 2.6
Source: AlembicHC
0%
1%
2%
3%
4%
5%
6%
7%
8%
9%
10%
Partner
Cellcom TE
OmanTel
MarocTel
Zain
Etisalat
Qtel
Mobinil
Wataniya
MTN
0%
2%
4%
6%
8%
10%
12%
14%
16%
18%
TE
Etisalat
Cellcom
Qtel
OmanTel
Partner
Wataniya
MarocTel
Zain
Mobinil
MTN
Telecom Egypt Telecoms | Egypt 14 December 2010
35
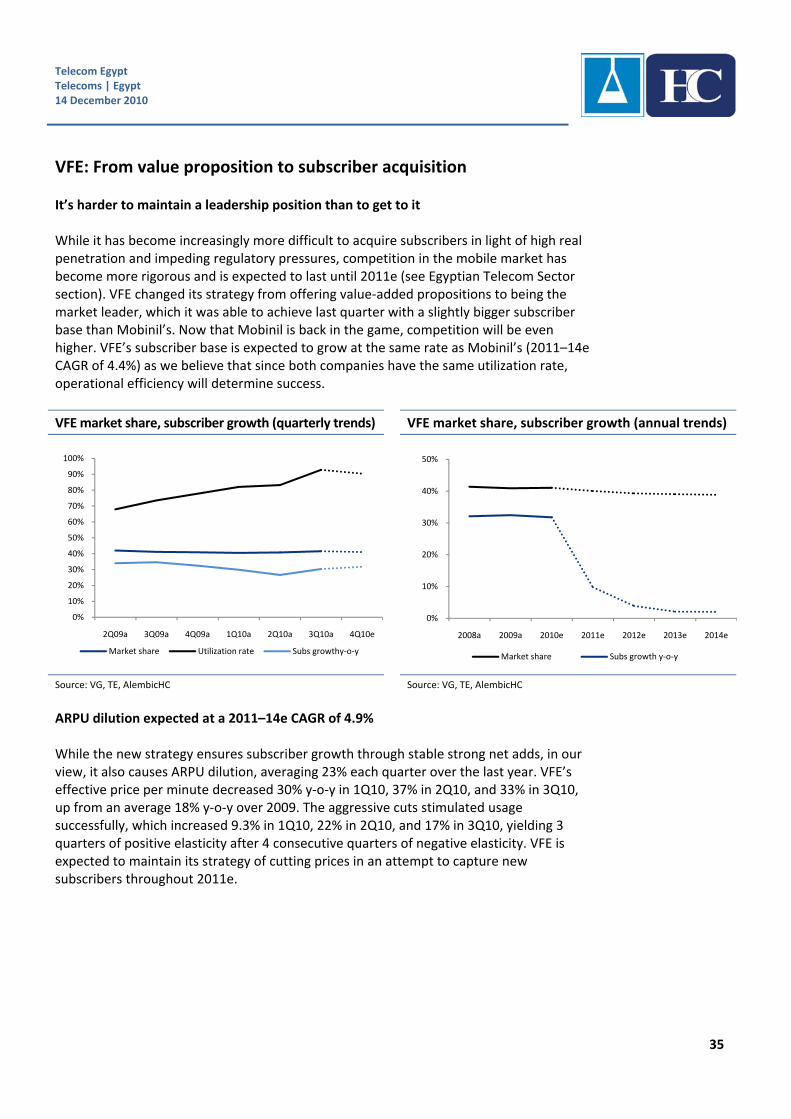
VFE: From value proposition to subscriber acquisition It’s harder to maintain a leadership position than to get to it While it has become increasingly more difficult to acquire subscribers in light of high real penetration and impeding regulatory pressures, competition in the mobile market has become more rigorous and is expected to last until 2011e (see Egyptian Telecom Sector section). VFE changed its strategy from offering value‐added propositions to being the market leader, which it was able to achieve last quarter with a slightly bigger subscriber base than Mobinil’s. Now that Mobinil is back in the game, competition will be even higher. VFE’s subscriber base is expected to grow at the same rate as Mobinil’s (2011–14e CAGR of 4.4%) as we believe that since both companies have the same utilization rate, operational efficiency will determine success.
VFE market share, subscriber growth (quarterly trends) VFE market share, subscriber growth (annual trends)
Source: VG, TE, AlembicHC Source: VG, TE, AlembicHC
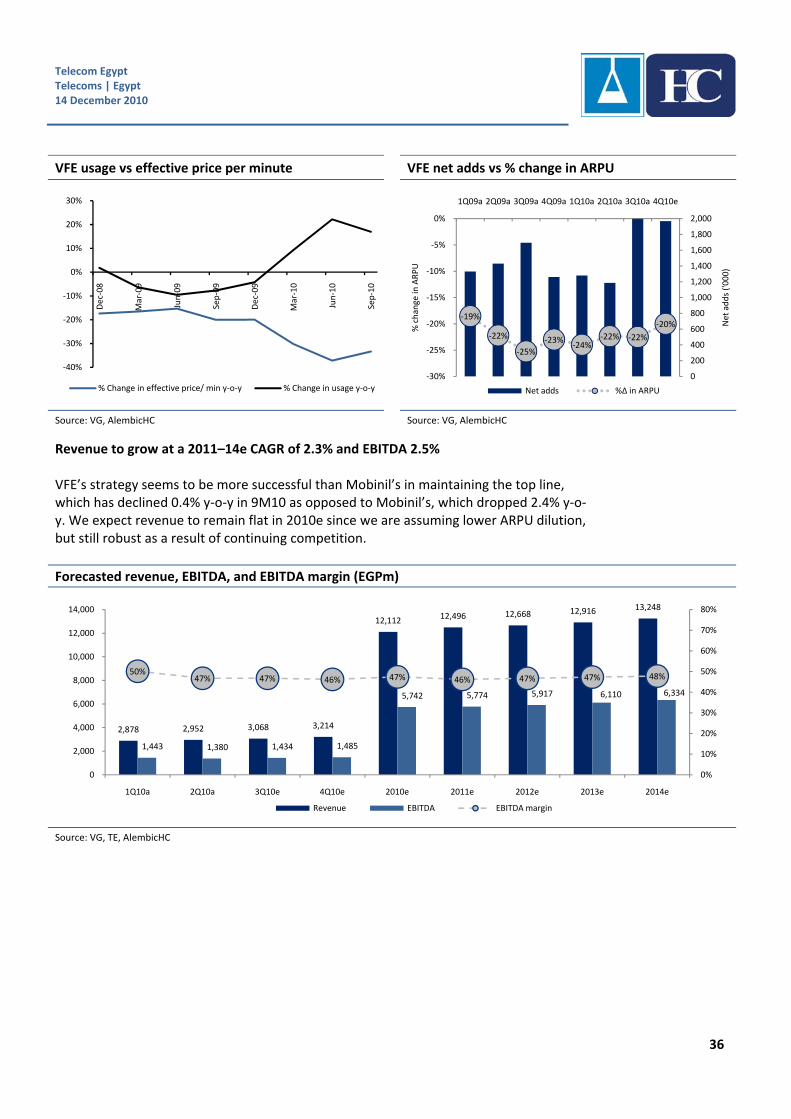
ARPU dilution expected at a 2011–14e CAGR of 4.9% While the new strategy ensures subscriber growth through stable strong net adds, in our view, it also causes ARPU dilution, averaging 23% each quarter over the last year. VFE’s effective price per minute decreased 30% y‐o‐y in 1Q10, 37% in 2Q10, and 33% in 3Q10, up from an average 18% y‐o‐y over 2009. The aggressive cuts stimulated usage successfully, which increased 9.3% in 1Q10, 22% in 2Q10, and 17% in 3Q10, yielding 3 quarters of positive elasticity after 4 consecutive quarters of negative elasticity. VFE is expected to maintain its strategy of cutting prices in an attempt to capture new subscribers throughout 2011e.
0%
10%
20%
30%
40%
50%
60%
70%
80%
90%
100%
2Q09a 3Q09a 4Q09a 1Q10a 2Q10a 3Q10a 4Q10e
Market share Utilization rate Subs growthy‐o‐y
0%
10%
20%
30%
40%
50%
2008a 2009a 2010e 2011e 2012e 2013e 2014e
Market share Subs growth y‐o‐y
Telecom Egypt Telecoms | Egypt 14 December 2010
36
VFE usage vs effective price per minute VFE net adds vs % change in ARPU
Source: VG, AlembicHC Source: VG, AlembicHC
Revenue to grow at a 2011–14e CAGR of 2.3% and EBITDA 2.5% VFE’s strategy seems to be more successful than Mobinil’s in maintaining the top line, which has declined 0.4% y‐o‐y in 9M10 as opposed to Mobinil’s, which dropped 2.4% y‐o‐y. We expect revenue to remain flat in 2010e since we are assuming lower ARPU dilution, but still robust as a result of continuing competition.
Forecasted revenue, EBITDA, and EBITDA margin (EGPm)
Source: VG, TE, AlembicHC
‐40%
‐30%
‐20%
‐10%
0%
10%
20%
30%
Dec‐08
Mar‐09
Jun‐09
Sep‐09
Dec‐09
Mar‐10
Jun‐10
Sep‐10
% Change in effective price/ min y‐o‐y % Change in usage y‐o‐y
‐19%
‐22%
‐25%
‐23%‐24%
‐22% ‐22%
‐20%
0
200
400
600
800
1,000
1,200
1,400
1,600
1,800
2,000
‐30%
‐25%
‐20%
‐15%
‐10%
‐5%
0%
1Q09a 2Q09a 3Q09a 4Q09a 1Q10a 2Q10a 3Q10a 4Q10e
Net adds ('000)
% change in
ARPU
Net adds %∆ in ARPU
2,878 2,952 3,068 3,214
12,112 12,496 12,668 12,916 13,248
1,443 1,380 1,434 1,485
5,742 5,774 5,917 6,110 6,334
50%47% 47% 46% 47% 46% 47% 47% 48%
0%
10%
20%
30%
40%
50%
60%
70%
80%
0
2,000
4,000
6,000
8,000
10,000
12,000
14,000
1Q10a 2Q10a 3Q10e 4Q10e 2010e 2011e 2012e 2013e 2014e
Revenue EBITDA EBITDA margin
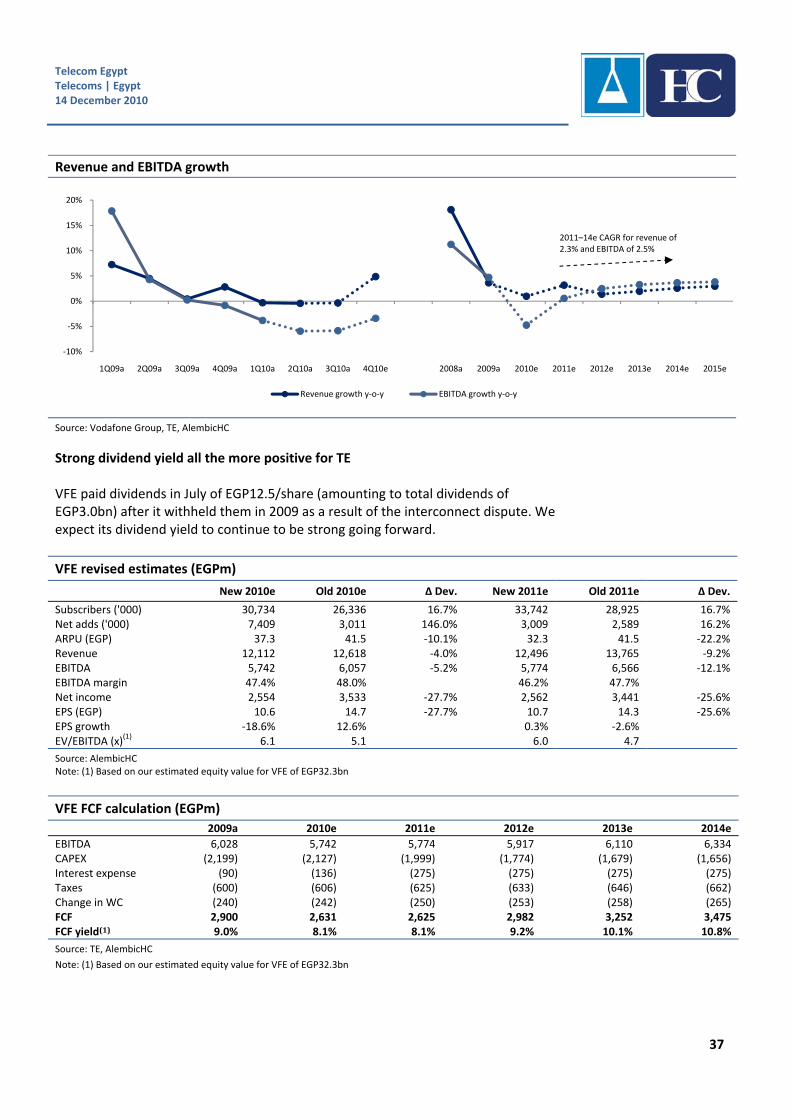
Telecom Egypt Telecoms | Egypt 14 December 2010
37
Revenue and EBITDA growth
Source: Vodafone Group, TE, AlembicHC
Strong dividend yield all the more positive for TE VFE paid dividends in July of EGP12.5/share (amounting to total dividends of EGP3.0bn) after it withheld them in 2009 as a result of the interconnect dispute. We expect its dividend yield to continue to be strong going forward.
VFE revised estimates (EGPm)
New 2010e Old 2010e ∆ Dev. New 2011e Old 2011e ∆ Dev.
Subscribers ('000) 30,734 26,336 16.7% 33,742 28,925 16.7% Net adds ('000) 7,409 3,011 146.0% 3,009 2,589 16.2% ARPU (EGP) 37.3 41.5 ‐10.1% 32.3 41.5 ‐22.2% Revenue 12,112 12,618 ‐4.0% 12,496 13,765 ‐9.2% EBITDA 5,742 6,057 ‐5.2% 5,774 6,566 ‐12.1% EBITDA margin 47.4% 48.0% 46.2% 47.7% Net income 2,554 3,533 ‐27.7% 2,562 3,441 ‐25.6% EPS (EGP) 10.6 14.7 ‐27.7% 10.7 14.3 ‐25.6% EPS growth ‐18.6% 12.6% 0.3% ‐2.6% EV/EBITDA (x)
(1) 6.1 5.1 6.0 4.7
Source: AlembicHC Note: (1) Based on our estimated equity value for VFE of EGP32.3bn
VFE FCF calculation (EGPm)
2009a 2010e 2011e 2012e 2013e 2014e
EBITDA 6,028 5,742 5,774 5,917 6,110 6,334 CAPEX (2,199) (2,127) (1,999) (1,774) (1,679) (1,656) Interest expense (90) (136) (275) (275) (275) (275) Taxes (600) (606) (625) (633) (646) (662) Change in WC (240) (242) (250) (253) (258) (265) FCF 2,900 2,631 2,625 2,982 3,252 3,475 FCF yield(1) 9.0% 8.1% 8.1% 9.2% 10.1% 10.8%
Source: TE, AlembicHC
Note: (1) Based on our estimated equity value for VFE of EGP32.3bn
‐10%
‐5%
0%
5%
10%
15%
20%
1Q09a 2Q09a 3Q09a 4Q09a 1Q10a 2Q10a 3Q10a 4Q10e 2008a 2009a 2010e 2011e 2012e 2013e 2014e 2015e
Revenue growth y‐o‐y EBITDA growth y‐o‐y
2011–14e CAGR for revenue of 2.3% and EBITDA of 2.5%
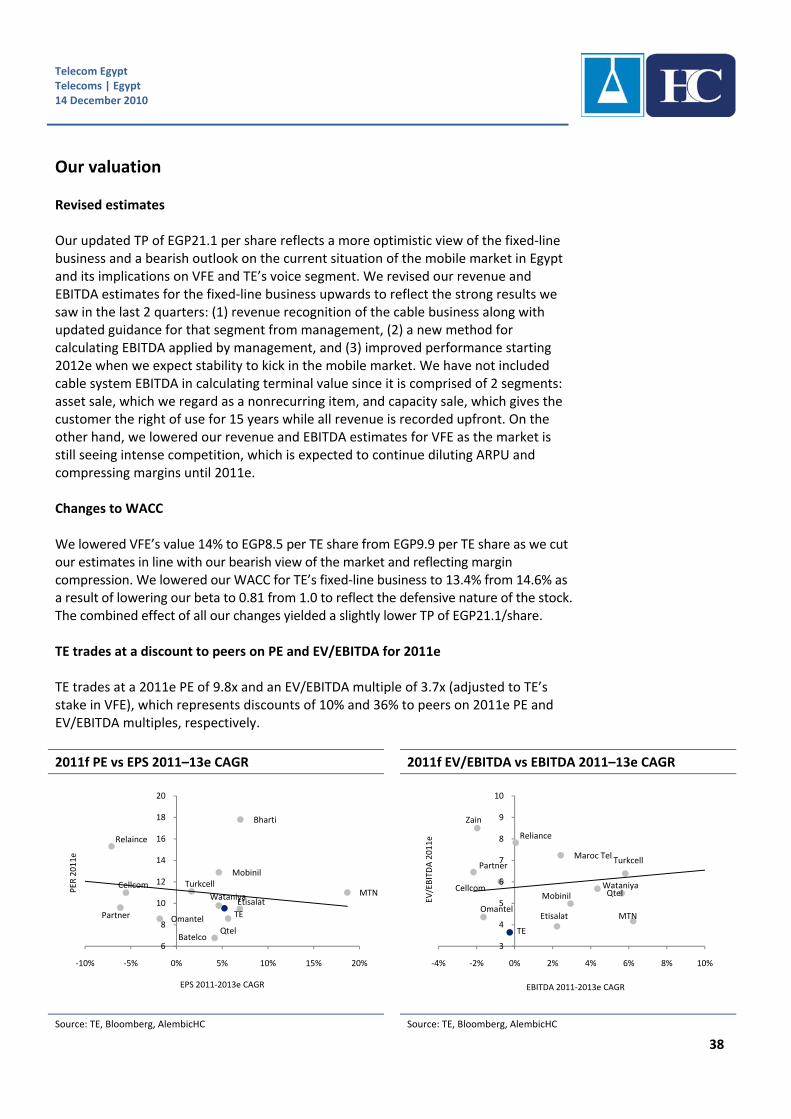
Telecom Egypt Telecoms | Egypt 14 December 2010
38
Our valuation Revised estimates Our updated TP of EGP21.1 per share reflects a more optimistic view of the fixed‐line business and a bearish outlook on the current situation of the mobile market in Egypt and its implications on VFE and TE’s voice segment. We revised our revenue and EBITDA estimates for the fixed‐line business upwards to reflect the strong results we saw in the last 2 quarters: (1) revenue recognition of the cable business along with updated guidance for that segment from management, (2) a new method for calculating EBITDA applied by management, and (3) improved performance starting 2012e when we expect stability to kick in the mobile market. We have not included cable system EBITDA in calculating terminal value since it is comprised of 2 segments: asset sale, which we regard as a nonrecurring item, and capacity sale, which gives the customer the right of use for 15 years while all revenue is recorded upfront. On the other hand, we lowered our revenue and EBITDA estimates for VFE as the market is still seeing intense competition, which is expected to continue diluting ARPU and compressing margins until 2011e. Changes to WACC We lowered VFE’s value 14% to EGP8.5 per TE share from EGP9.9 per TE share as we cut our estimates in line with our bearish view of the market and reflecting margin compression. We lowered our WACC for TE’s fixed‐line business to 13.4% from 14.6% as a result of lowering our beta to 0.81 from 1.0 to reflect the defensive nature of the stock. The combined effect of all our changes yielded a slightly lower TP of EGP21.1/share. TE trades at a discount to peers on PE and EV/EBITDA for 2011e TE trades at a 2011e PE of 9.8x and an EV/EBITDA multiple of 3.7x (adjusted to TE’s stake in VFE), which represents discounts of 10% and 36% to peers on 2011e PE and EV/EBITDA multiples, respectively.
2011f PE vs EPS 2011–13e CAGR 2011f EV/EBITDA vs EBITDA 2011–13e CAGR
Source: TE, Bloomberg, AlembicHC Source: TE, Bloomberg, AlembicHC
TE
Wataniya
Qtel
MTN
Bharti
Mobinil
Batelco
Omantel
Relaince
Partner
Cellcom Turkcell
Etisalat
6
8
10
12
14
16
18
20
‐10% ‐5% 0% 5% 10% 15% 20%
PER
2011e
EPS 2011‐2013e CAGR
TE
Maroc Tel
Zain
WataniyaQtel
MTN
Mobinil
Omantel
Reliance
Cellcom
PartnerTurkcell
Etisalat
3
4
5
6
7
8
9
10
‐4% ‐2% 0% 2% 4% 6% 8% 10%
EV/EBITDA 2011e
EBITDA 2011‐2013e CAGR
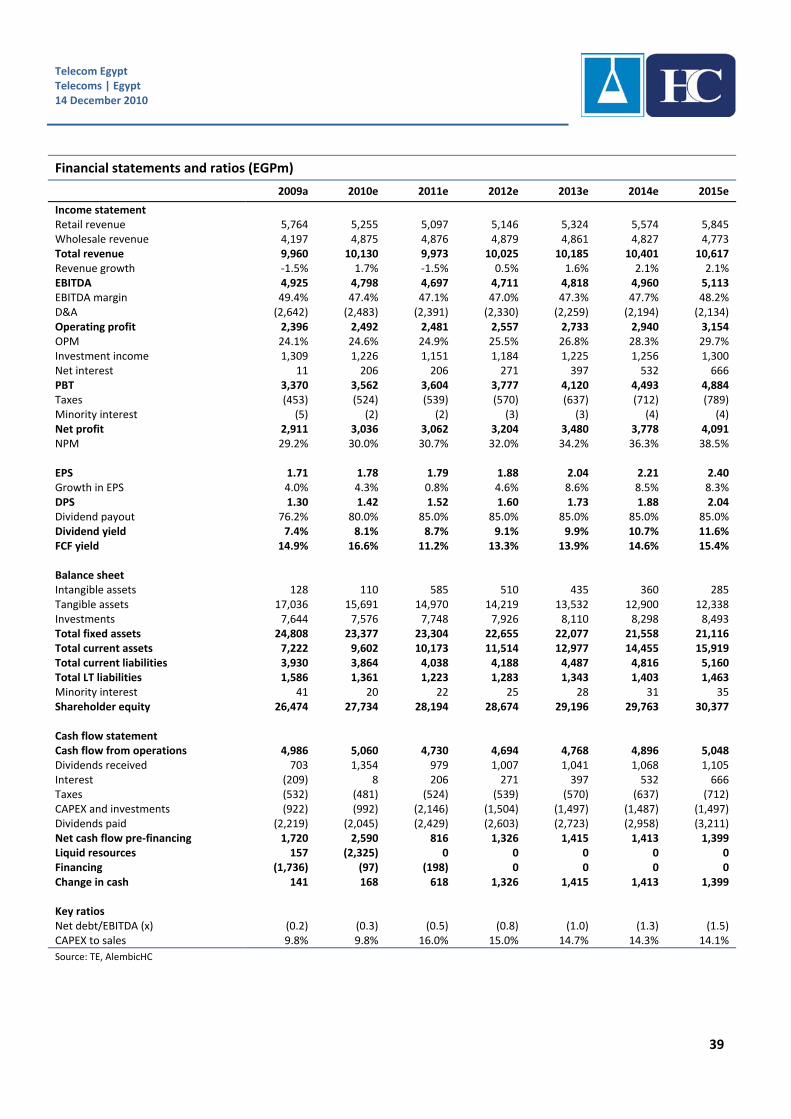
Telecom Egypt Telecoms | Egypt 14 December 2010
39
Financial statements and ratios (EGPm)
2009a 2010e 2011e 2012e 2013e 2014e 2015e
Income statement Retail revenue 5,764 5,255 5,097 5,146 5,324 5,574 5,845 Wholesale revenue 4,197 4,875 4,876 4,879 4,861 4,827 4,773 Total revenue 9,960 10,130 9,973 10,025 10,185 10,401 10,617 Revenue growth ‐1.5% 1.7% ‐1.5% 0.5% 1.6% 2.1% 2.1% EBITDA 4,925 4,798 4,697 4,711 4,818 4,960 5,113 EBITDA margin 49.4% 47.4% 47.1% 47.0% 47.3% 47.7% 48.2% D&A (2,642) (2,483) (2,391) (2,330) (2,259) (2,194) (2,134) Operating profit 2,396 2,492 2,481 2,557 2,733 2,940 3,154 OPM 24.1% 24.6% 24.9% 25.5% 26.8% 28.3% 29.7% Investment income 1,309 1,226 1,151 1,184 1,225 1,256 1,300 Net interest 11 206 206 271 397 532 666 PBT 3,370 3,562 3,604 3,777 4,120 4,493 4,884 Taxes (453) (524) (539) (570) (637) (712) (789) Minority interest (5) (2) (2) (3) (3) (4) (4) Net profit 2,911 3,036 3,062 3,204 3,480 3,778 4,091 NPM 29.2% 30.0% 30.7% 32.0% 34.2% 36.3% 38.5% EPS 1.71 1.78 1.79 1.88 2.04 2.21 2.40 Growth in EPS 4.0% 4.3% 0.8% 4.6% 8.6% 8.5% 8.3% DPS 1.30 1.42 1.52 1.60 1.73 1.88 2.04 Dividend payout 76.2% 80.0% 85.0% 85.0% 85.0% 85.0% 85.0% Dividend yield 7.4% 8.1% 8.7% 9.1% 9.9% 10.7% 11.6% FCF yield 14.9% 16.6% 11.2% 13.3% 13.9% 14.6% 15.4% Balance sheet Intangible assets 128 110 585 510 435 360 285 Tangible assets 17,036 15,691 14,970 14,219 13,532 12,900 12,338 Investments 7,644 7,576 7,748 7,926 8,110 8,298 8,493 Total fixed assets 24,808 23,377 23,304 22,655 22,077 21,558 21,116 Total current assets 7,222 9,602 10,173 11,514 12,977 14,455 15,919 Total current liabilities 3,930 3,864 4,038 4,188 4,487 4,816 5,160 Total LT liabilities 1,586 1,361 1,223 1,283 1,343 1,403 1,463 Minority interest 41 20 22 25 28 31 35 Shareholder equity 26,474 27,734 28,194 28,674 29,196 29,763 30,377 Cash flow statement Cash flow from operations 4,986 5,060 4,730 4,694 4,768 4,896 5,048 Dividends received 703 1,354 979 1,007 1,041 1,068 1,105 Interest (209) 8 206 271 397 532 666 Taxes (532) (481) (524) (539) (570) (637) (712) CAPEX and investments (922) (992) (2,146) (1,504) (1,497) (1,487) (1,497) Dividends paid (2,219) (2,045) (2,429) (2,603) (2,723) (2,958) (3,211) Net cash flow pre‐financing 1,720 2,590 816 1,326 1,415 1,413 1,399 Liquid resources 157 (2,325) 0 0 0 0 0 Financing (1,736) (97) (198) 0 0 0 0 Change in cash 141 168 618 1,326 1,415 1,413 1,399 Key ratios Net debt/EBITDA (x) (0.2) (0.3) (0.5) (0.8) (1.0) (1.3) (1.5) CAPEX to sales 9.8% 9.8% 16.0% 15.0% 14.7% 14.3% 14.1%
Source: TE, AlembicHC
Sector note Telecoms | Egypt 14 December 2010
40
Rating Scale
Recommendation Potential Return
Overweight Greater than 20% Neutral 0% to 20% Underweight Less than 0%
Disclaimer This document was issued by HC Brokerage, which is an affiliate of HC Securities and Investments (henceforth referred to as “HC”) – a fully fledged investment bank providing investment banking, asset management, securities brokerage, research, and custody services – and Alembic Global Advisors, which is registered with US‐based broker dealer Pulse Trading Inc. (collectively the “Firms”). The information used to produce this document is based on sources that the Firms believe to be reliable and accurate. This information has not been independently verified and may be condensed or incomplete. The Firms do not make any guarantee, representation, or warranty and accept no responsibility or liability to the accuracy and completeness of such information. Expression of opinion contained herein is based on certain assumptions and with the use of specific financial techniques that reflect the personal opinion of the authors of the commentary and is subject to change without notice. The information in these materials reflects the Firms equity rating on a particular stock. The Firms, their affiliates, and/or their employees may publish or otherwise express other viewpoints or trading strategies that may conflict with the views included in this report. Please be aware that the Firms and/or their affiliates and the investment funds and managed accounts they manage may take positions contrary to the included equity rating. This material is for informational purposes only and is not an offer to sell or the solicitation of an offer to buy. Ratings and general guidance are not personal recommendations for any particular investor or client and do not take into account the financial, investment, or other objectives or needs of, and may not be suitable for any particular investor or client. Investors and clients should consider this only a single factor in making their investment decision while taking into account the current market environment. Foreign currency‐denominated securities are subject to fluctuations in exchange rates that could have an adverse effect on the value or price of, or income derived from, the investment. Investors in securities such as ADRs, the values of which are influenced by foreign currencies, effectively assume currency risk. Neither HC nor any officer or employee of HC accepts liability for any direct, indirect, or consequential damages or losses arising from any use of this report or its contents. Disclosures We, Karim Khadr and Sarah Shabayek, certify that the views expressed in this document accurately reflect our personal views about the subject securities and companies. We also certify that we do not hold a beneficial interest in the securities traded. The Firms are not a market maker in the securities of the subject company. The Firms, their affiliates, and/or directors and employees may own or have positions in and effect transactions of companies mentioned in this document. The firms and their affiliates may also seek to perform or have performed investment‐banking services for companies mentioned in this memorandum. Copyright No part or excerpt of its content may be redistributed, reproduced, or conveyed in any form, written or oral, to any third party without prior written consent of the Firms. The information within this research report must not be disclosed to any other person if and until The Firms have made their information publicly available. Issuer of report: US distributor of report:
HC Brokerage Building F15‐B224, Smart Village KM28 Cairo‐Alexandria Desert Road 6 October 12577, Egypt Telephone: +202 3535 7666 Fax: +202 3535 7665 Website: www.hc‐si.com
Alembic Global Advisors 780 Third Avenue, 8th Floor New York, NY 10017 Telephone: +1 212 359 8292 Website: www.alembicglobal.com
Pulse Trading 2 Liberty Square, 2nd Floor Boston, MA 02109 Telephone: +1 617 316 5620 Website: www.pulsetrading.com

Sector note Telecoms | Egypt 14 December 2010
41
Research research@hc‐si.com
Karim Khadr Head of Research (ME)/Telecoms karim.khadr@hc‐si.com +971 4 293 5381Sarah Shabayek Telecoms sarah.shabayek@hc‐si.com +971 4 293 5389
Hassan Ahmed Head of Research (US)/Chemicals [email protected] +1 212 359 8291Registered with US‐based broker dealer Pulse Trading Inc.
Lovetesh Singh Chemicals lovetesh.singh@hc‐si.com +91 9772 755 777
Jaap Meijer, CFA Financials jaap.meijer@hc‐si.com +971 4 293 5383
Janany Vamadeva Financials janany.vamadeva@hc‐si.com +971 4 293 5384
Majed Azzam Real Estate & Construction majed.azzam@hc‐si.com +971 4 293 5385
Ankur Khetawat Real Estate & Construction ankur.khetawat@hc‐si.com +971 4 293 5387
Nermeen Abdel Gawad Real Estate & Construction nermeen.abdelgawad@hc‐si.com +20 2 3535 7362
Sapna Sharma Real Estate & Construction sapna.sharma@hc‐si.com +971 4 293 5382
Hatem Alaa, CFA Diversified hatem.alaa@hc‐si.com +20 2 3535 7354
Mennatallah El Hefnawy Diversified menna.elhefnawy@hc‐si.com +20 2 3535 7360
Mai Nehad Diversified mai.nehad@hc‐si.com +20 2 3535 7356
Tudor Allin‐Khan, CFA Chief Economist tudor.allin‐khan@hc‐si.com +971 4 293 5386
Amr Abdel Khalek Economist amr.abdelkhalek@hc‐si.com +20 2 3535 7368
Rehaam Romero Editor rehaam.romero@hc‐si.com +20 2 3535 7364
Danielle Bouchard Editor danielle.bouchard@hc‐si.com +20 2 3535 7370
Mohamed El Saiid, MFTA Head of TA Research melsaiid@hc‐si.com +20 2 3535 7390
Sameh Khalil, CFTe Technical Analyst skhalil@hc‐si.com +20 2 3535 7392
Sales and Trading – Cairo, Egypt salesandtrading@hc‐si.com
Shawkat El‐Maraghy Managing Director selmaraghy@hc‐si.com +20 2 3535 7500
Mohamed Helmy Sales mohamed.helmy@hc‐si.com +20 2 3535 7502
Aboubakr Shaaban Sales aboubakr.shaaban@hc‐si.com +20 2 3535 7518
Hossam Wahid Sales Trading hwahid@hc‐si.com +20 2 3535 7522
Hassan Kenawi Sales Trading hkenawi@hc‐si.com +20 2 3535 7528
Nihal Hany Sales Trading nhany@hc‐si.com +20 2 3535 7532
Ahmed Nabil Sales Trading anabil@hc‐si.com +20 2 3535 7516
Sales and Trading – Dubai, UAE
Hassan Aly Choucri Managing Director/Sales Trading hassan.choucri@hc‐si.com +971 4 293 5305Nadia Kabbani Sales nadia.kabbani@hc‐si.com +971 4 293 5365
Anne Marie Browne Sales annemarie.browne@hc‐si.com +971 4 293 5301
Samer Azzam Sales samer.azzam@hc‐si.com +971 4 293 5302
Mohamed Galal Sales Trading mohammed.galal@af‐hc.com +971 4 293 5309Wael Atta Sales Trading wael.atta@hc‐si.com +971 4 293 5388
Sales and Trading – New York, US
Stephen Matthews Sales [email protected] +1 212 359 8292Registered with US‐based broker dealer Pulse Trading Inc.