Embed Size (px)
Citation preview

Sector Skills Assessment for the Creative Industries of the UK
&
January 2011

Contents Page
1. Introduction ............................................................................................................. 2
1.1 Defining the Creative Industries ..................................................................... 2
1.2 A cornerstone sector of the UK economy .................................................... 11
2. What drives demand in the Creative Industries? ................................................ 19
2.1 The Contribution of the Sector ..................................................................... 19
2.2 Drivers of Growth, Drivers of Change .......................................................... 20
2.3 The Creative Industries Economy ................................................................ 21
2.4 The Creative Industries Workforce .............................................................. 28
2.5 Skills mismatches, acquisition and utilisation ............................................... 38
2.6 The Sub-Sector Story .................................................................................. 42
3. Current Skills Needs ............................................................................................ 44
3.1 Overview ..................................................................................................... 44
3.2 Skills Shortages ........................................................................................... 45
3.3 Skills Gaps .................................................................................................. 45
3.4 Skills Supply: The External Versus the Internal Labour Market Conundrum 48
3.5 Sub-Sectors ................................................................................................ 58
4. Anticipating What Lies Ahead ........................................................................... 126
4.1 A Necessary Broadening and Deepening of the Skills Base ...................... 132
5. The Geography of the Creative Industries ........................................................ 135
Annex A: Methodology Section ............................................................................. 137
Annex B: Creative Industries and Gaps in Official Data Sources ....................... 139
Annex C: Research strategies developed by CCSkills and Skillset .................... 141
Annex D: Data Sources .......................................................................................... 146

2
Introduction
This Sector Skills Assessment (SSA) provides comprehensive Labour Market
Information on the Creative Industries for sector employers to use in strategic planning
and communication of occupational needs. It contains information from both national
secondary sources as well as original research undertaken by Sector Skills Councils.
Three Sector Skills Councils represent employers across the majority of the sectors
within the Creative Industries; they are Skillset, Creative & Cultural Skills (CCSkills)
and e-Skills UK. This SSA should be read in conjunction with the SSAs for Creative
Media, Fashion and Textiles, Creative & Cultural Skills, and e-Skills UK: Technology
Insights 2011.
Defining the Creative Industries
Box 1 below outlines the scope of the sectors covered by the Creative Industries as
defined by the Sector Skills Councils and recognised by the sectors.
Box 1: The Scope of Creative Industries
Advertising, Fashion, Textiles, Film, Television, Radio, Photo Imaging, Interactive
Media, Publishing, Animation, Interactive Media, Content for Computer Games,
Software, Commercials and Promos, Corporate Production, Post Production and Visual
Special Effects and Other Specialist Facilities, Craft, Cultural Heritage, Design,
Literature, Music, Performing Arts and the Visual Arts, and Architecture.
The routine availability of data from official sources with the precision needed by
Skillset and CCSkills and the Creative Industries to respond to skills demand is limited.
Indeed the unique character of the sector with its long tail of micro businesses and
greater proportion of self-employed and contractors in comparison to the overall UK
economy requires the Sector Skills Councils to deliver far more primary labour market
research to fill gaps in knowledge than many, if not the majority of, other Sector Skills
Councils (SSCs). See Annex A for further details.
An analysis of data from the Labour Force Survey (LFS) and National Employer Skills
Survey (NESS) was undertaken for this report drawing on the combined contractual
footprints of Skillset and Creative and Cultural Skills. The figures, which appear
throughout the report, represent some of the Standard Industrial Classification (SIC)
codes contracted to Skillset and CCSkills by the UKCES, but they do not represent the
full extent of the creative sectors that these sector skills councils are licensed to

3
support. For example, the data excludes many of those working in Interactive Media,
Content for Computer Games, Facilities, and freelancers currently not in employment.
Other sectors poorly represented by the data are Design, Literature, Visual Arts, Music,
Performing Arts and all Craft activity. See Annex B for full methodology.
Industry wide figures quoted in this report, such as those reported by the DCMS and
NESTA, include all sectors in the DCMS definition. However, where Creative Industries
are referred to throughout the remainder of the report, Software and Electronic
publishing1, Computer Games2 and Architecture3 are excluded except when referring to
the DCMS Creative Industries Economic Estimates.
For Fashion and Textiles specifically, industry-wide figures quoted for the Creative
Industries such as those from DCMS and NESTA include the Designer Fashion sector
only, whereas other research referenced in this report cover all Fashion and Textiles
sectors 4 (except for the analysis of data from the LFS and NESS).
Given these caveats, it is worth outlining the range of approaches used to define and
collect accurate data for the creative industries.
Department for Culture, Media and Sport (DCMS)
The most widespread definition of the creative industries currently being used is the
Department for Culture, Media and Sport‟s Creative Industries Mapping Project. From
key publications in 19985 and 20016 it has brought together a disparate group of
industrial categories under the broad heading of the „creative industries‟. These
categories are described below. These industrial sectors are defined by their core
activities, namely managing creativity and innovation; and the production and
consumption of original ideas.
1. Advertising
2. Architecture
3. Art and antiques
4. Crafts
1 For Software refer to research produced by e-skills UK.
2 Computer Games (and Visual Effects) are excluded from this SSA in view of the forthcoming
Livingstone/Nesta review of skills in CG and VFX due for publication in January 2011 to which Skillset and e-skills UK have contributed. In the Facilities and Animation Sub-Sector sections of this report, VFX data are included as it is difficult to disaggregate this data for reporting purposes. 3 Architecture is not covered by any of the sector skills councils at present.
4 Fashion and Textiles sectors: Design, Apparel and Sewing Products, Textiles/ Technical textiles,
Footwear, Leather and Leather Goods, Laundry and Dry Cleaning. 5 1998 Creative Industries Mapping Document, DCMS
6 2001 Creative Industries Mapping Document, DCMS

4
5. Design
6. Designer fashion
7. Film and video
8. Digital and entertainment media
9. Music
10. The performing arts
11. Publishing
12. Software and electronic publishing
13. Television and radio
This approach is not without its critics. O‟Connor7 for example states that “The
immediate problem was that the DCMS definition simply did not describe the complex
structure of the creative industries sector or the employment and remuneration
arrangements of the majority of those within it.” This is certainly the case for a number
of sectors within its remit, for example craft and design. Part of the issue here is the
lack of resources given to such an industry strategy and importantly, the absence of
any real intelligence about it.
The fundamental difficulty associated with deriving robust, replicable, sustainable and
comparable statistics for the creative industries is that in order to do so, one must use
the classic Standard Industrial and Standard Occupational classification systems. SIC
and SOC systems are widely used and relied upon for defining sectors, industries,
workforces and occupational groups, but they have significant shortcomings,
particularly when associated with emerging industries and those that are defined more
broadly by the activity that occurs within organisations rather than a pure assessment
of output. Furthermore, the size of the surveys that underpin key data sources (e.g.
APS and ABI) are in fact too small to offer robust detailed analysis of smaller sub-
sectors.
This problem of accessing appropriate statistical data will continue to prove problematic
for meaningful assessment of the creative industries to take place. However, building
on the work of the DCMS, a number of other definitions have been considered.
7 2007 The Creative Industries: A Review of the Literature, O'Connor, J.

5
David Throsby
At around the same time as the DCMS Mapping Project, Professor David Throsby8
developed an economic model to describe the economic inter-dependencies between
some of what became the DCMS 13. His model described concentric circles, with the
„cultural value of cultural goods‟ being passed outward from an inner „core‟ to broader
economic categories which further nalyzing ized those cultural goods.
Core creative arts: Literature; Music; Performing arts; Visual arts.
Other core cultural industries: Film; Museums and libraries.
Wider cultural industries: Heritage services; Publishing; Sound recording;
Television and Radio; Video and computer games
Related industries: Advertising; Architecture; Design; Fashion
Throsby‟s assessment of the creative industries led directly to Staying Ahead9 by the
Work Foundation.
The Work Foundation
Staying Ahead built on Throsby‟s central ideas to create a typology and model of the
creative industries. The model highlights the connections, similarities and points of
differentiation between the „core creative fields‟, the „cultural industries‟ and the
„creative industries‟, which articulates the way in which the creative industries
commercialise acts of origination of expressive value and sets them within the wider
economic context (see Figure 1a). Within this approach, “A clear connection is being
established … between economic and cultural policy; this cultural policy has real
economic impacts – and these impacts are identified in this as in many other reports –
but promotes these cultural values as valuable and legitimate in themselves, part of
contemporary public culture10.”
8 2001 The Economics of Culture, Throsby, D.
9 2007 Staying Ahead: The Economic Performance of the UKs Creative Industries, The Work Foundation
10 2010 Creative Block: The Future of the UKs Creative Industries, The Work Foundation

6
Figure 1a: Work Foundation definition of the creative industries11
Sector Grouping and Categorisation
Other approaches, as exemplified by NESTA in Creating Growth12 suggest grouping
the sector by activity in order to encourage a greater awareness of the differences
between (and within) the sectors; and to draw out commonalities based on the ways in
which commercial value is created.
NESTA‟s model segments the creative industries into four groups, bringing together
those sectors that have sufficient commonalities (in terms of business models, value
chains, market structure and so on) as to warrant a common approach for policy (see
figure 1b). Essentially the model is as follows:
Creative originals producers – artisans, craft workers, design makers
Creative experience providers – where the experience is consumed at the time
and place of performance – theatre, opera, dance
Creative content producers – where original intellectual property is creative –
film. TV, games and music, publishing, fashion
11
2007 Staying Ahead: The Economic Performance of the UKs Creative Industries, The Work Foundation
12 2006 Creating Growth: How the UK Develop World Class Creative Industries, NESTA

7
Creative Service providers
Figure 1b: NESTA Creating Growth creative industries model13
In 2008, NESTA furthered this idea by providing a methodological approach for the
collection and analysis of statistical data for the creative industries14. This Creative
Trident model brought together those working in the creative industries and those
working in specialist creative jobs in other firms and organisations in order to analyse
the number of people employed in creative activities and industries.
Three types of employment were focused on:
Specialist artists, professionals or creative individuals working in creative
industries;
Support staff in those industries providing management, secretarial,
administrative or accountancy back-up;
Creative individuals „embedded‟ in other industries not defined as „creative‟.
13
Ibid
14 2008 Beyond the Creative Industries: Mapping the Creative Economy in the UK, NESTA

8
Collectively, they are the creative workforce
The workforce was then categorized into six further classifications; advertising and
marketing; architecture, visual arts and design; film, TV, radio and photography; music
and performing arts; publishing; and software, computer games and electronic
publishing.
While it differs from previous models in that it uses population data (from the 2001
census); an assessment of creative occupations inside and outside of core creative
industries; and provides a model to assess earned income, it does suffer from similar
problems as those described above – namely the availability and analytical power of
using national statistics.
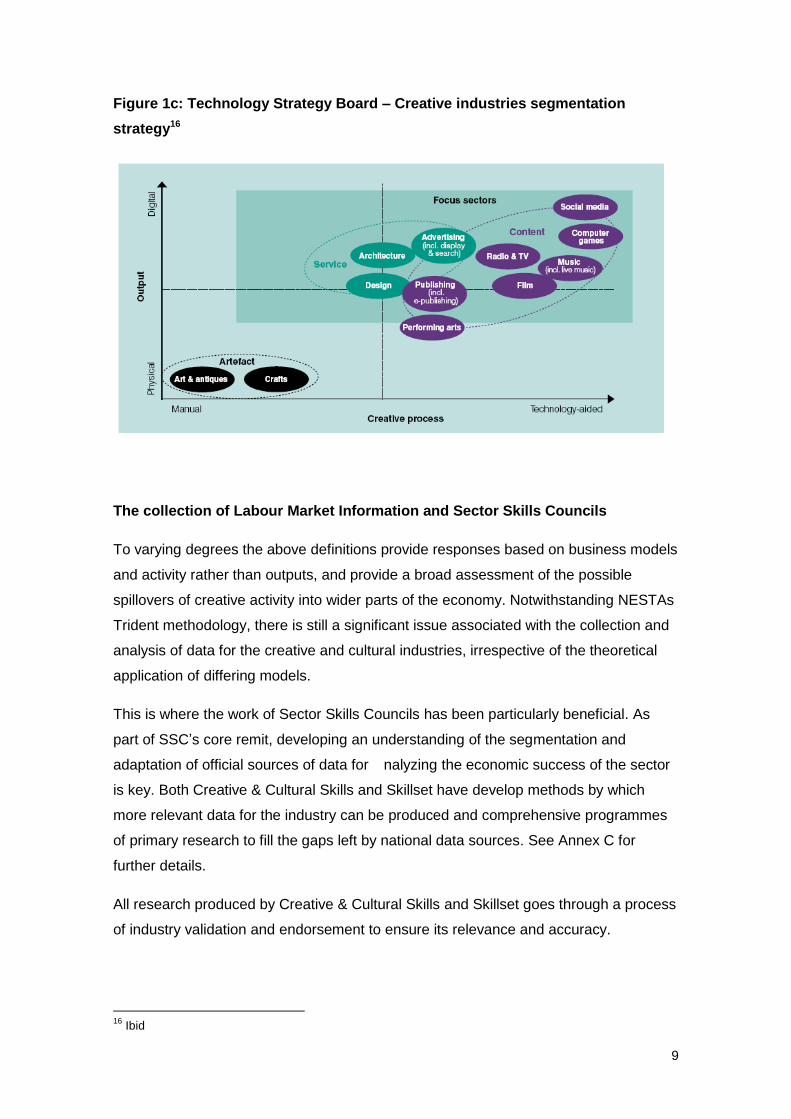
The Technology Strategy Board
The Technology Strategy Board15 provide a final, further approach based on
segmentation. Given the speed of technological change and market development since
the original definition of the creative industries was first coined by DCMS in 1998 and
2000, and the resulting blurring of boundaries between some sub-sectors and increase
in the degree of disparity in others, they suggest identifying areas of commonality and
clustering of sub-sectors. This has involved identifying the impact of two key factors:
the importance of technology to innovation occurring in the specific creative industries
and the nature of the final output. This has led to three main categories:
Services – Advertising, Architecture and Design (including Fashion Design);
Content – Games, Film, TV, Radio, Publishing, Music (and Performing Arts:
dance, theatre etc); and
Artefacts – Fine Arts, Crafts
Social media – a new category focusing on consumer generated content
15
2009 Creative Industries Technology Strategy 2009-2010, Technology Strategy Board
9
Figure 1c: Technology Strategy Board – Creative industries segmentation
strategy16
The collection of Labour Market Information and Sector Skills Councils
To varying degrees the above definitions provide responses based on business models
and activity rather than outputs, and provide a broad assessment of the possible
spillovers of creative activity into wider parts of the economy. Notwithstanding NESTAs
Trident methodology, there is still a significant issue associated with the collection and
analysis of data for the creative and cultural industries, irrespective of the theoretical
application of differing models.
This is where the work of Sector Skills Councils has been particularly beneficial. As
part of SSC‟s core remit, developing an understanding of the segmentation and
adaptation of official sources of data for nalyzing the economic success of the sector
is key. Both Creative & Cultural Skills and Skillset have develop methods by which
more relevant data for the industry can be produced and comprehensive programmes
of primary research to fill the gaps left by national data sources. See Annex C for
further details.
All research produced by Creative & Cultural Skills and Skillset goes through a process
of industry validation and endorsement to ensure its relevance and accuracy.
16
Ibid

10
Creative and digital
Defining the Creative Industries accurately is thus a major and ongoing challenge,
particularly in view of the increasing overlap of creative and digital. A report published
by NESTA in November 2010 describes the relationship between digital and creative
thus „digitisation is making creative firms more technology-intensive.‟17 The report goes
on to comment that „To remain competitive in online, convergent and data-rich markets,
they (Creative Industry firms) are procuring and producing technologies, tools and
technology related knowledge that could be used in other tech-rich sectors of the
economy.‟18 As a report published by BIS in December 2010 highlighted: „Digital and
Creative Industries‟ are among the first set of sectors that the forthcoming Government
Growth Review will focus on.19
One common defining characteristic of all Creative Industries is that they exist primarily
to generate creative content and are dependent on exploitation of IP, but increasingly
the boundaries between these businesses and sectors are becoming blurred.20
Whilst there are still key distribution platforms including; cinema, TV, books/print media
and online and mobile, companies creating content are doing so in a way that can be
used for multiple platforms. The business context is providing an opening of channels
for distribution and „multi-platform content‟ that is a key determinant for growth.
The nature of and activities associated with the creative industries mean that the
development of one consistent understanding of the structure, spillovers and influence
of the sector will always be a complex issue, open to many competing and
complementary theories. As with all data published about the sector, the reader is
advised to exercise caution in deriving conclusions and to use this report to provide a
broad understanding of some of the issues at hand.
17
www.nesta.org.uk/areas_of_work/creative_industries/geography_of_innovation/assets/features/creative_clusters_and_innovation_report 18
Ibid 19
www.bis.gov.uk/assets/biscore/corporate/docs/p/10-1296-path-to-strong-sustainable-and-balanced-growth. 20
www.nesta.org.uk/areas_of_work/creative_industries/geography_of_innovation/assets/features/creative_clusters_and_innovation_report

11
1.2 A cornerstone sector of the UK economy
The Creative Industries are now a major contributor to the UK economy. The latest
figures for the whole of the Creative Industries21, excluding Crafts, showed that
Creative Industries accounted for 5.6% of Gross Value Added (GVA) in 2008, with
crafts contributing an additional £3.1billion of GVA in 2009 and Literature an additional
£2billion.22 In addition the Creative Industries grew by an average of 5% per annum
between 1997 and 2008. This compares to an average of 3% for the whole of the
economy over this period.23
Table1: Employment, GVA and number of businesses within the Creative
Industries
Employment (2010) GVA (2008) Businesses (2010)
Total No.
% of UK total
GVA (£bn)
% of UK total
Total No.
% of UK total
Advertising 299,200 1.0% 7,800 0.7% 14,800 0.7%
Architecture24 128,400 0.4% 3,600 0.3% 11,500 0.5%
Art & Antiques 9,800 0.0% 300 0.0% 2,700 0.1%
Crafts 111,400 0.4% - - - -
Design 225,400 0.8% 1,600 0.2% 14,200 0.7%
Designer Fashion
9,700 0.0% 100 0.0% 900 0.0%
Film, Video & Photography
60,500 0.2% 2,700 0.3% 9,900 0.5%
Music & Visual and Performing Arts
305,800 1.0% 3,200 0.3% 30,800 1.5%
Publishing 236,600 0.8% 10,100 1.0% 7,700 0.4%
Software & Electronic Publishing13
753,000 2.6% 26,400 2.5% 81,700 3.9%
Digital & Entertainment Media25
6,200 0.0% 200 0.0% 200 0.0%
21
DCMS Creative Industries Economic Estimates, December 2010 www.culture.gov.uk/what_we_do/research_and_statistics/4848.aspx. 22
Creative & Cultural Skills (2011) Creative and Cultural Industries: Impact and Footprint 2010/11
23 DCMS Creative Industries Economic Estimates, February 2010. Estimates of GVA growth of the
Creative Industries have not yet been fully updated in latest DCMS statistical release (December 2010)
24 These sectors are not included in the remainder of the report.
25 This sector includes SIC codes 58.21 Publishing of Computer Games and 62.01Computer Programming
Activities. Computer Games are excluded from this SSA in view of the forthcoming Livingstone/Nesta
review of skills in CG due for publication in January 2011 to which Skillset and e-skills UK have contributed

12
TV & Radio 132,300 0.5% 3,200 0.3% 7,700 0.4%
Total Creative Industries
2,278,500 7.8% 59,100 5.6% 182,100 8.7%
Source: DCMS Creative Industries Economic Estimates, December 2010
Moreover exports of services by the Creative Industries totalled £17.3 billion in 2008.
This equated to 4.1% of all goods and services exported.
Growth in the Creative Industries has been robust. In the summer quarter of 2010,
creative employment totalled 2.3 million jobs. This comprised over 1.3 million jobs in
the Creative Industries and over 1 million further creative jobs within businesses
outside these industries. This was double the whole economy growth rate for jobs of
1%.26 The Software, Computer Games & Electronic Publishing sector showed growth
in employment of 5% per annum between 1997 and 2008, the highest across the
Creative Industries.27 The Music and Visual & Performing Arts sector had the highest
numbers of self-employed people, with over 200,000.28
1.3 A globally competitive sector
Reflecting this performance profile the UK Creative Industries sector continues to rank
impressively against international competition. Exports from across the Creative
Industries are worth £16 billion annually to the UK economy, 4.3 per cent of all goods
and services.29 In terms of the export of creative services it is estimated that the UK is
second only to the US in world rankings.30
There is also strong evidence that the UK has developed a leadership position within
Europe. In a recent study of the top 100 European MediaTech companies to watch, the
UK dominated with a 60% share. This highlights UK leadership in exploiting the
potential of digital content, with search, games, advertising and social media
26
DCMS Creative Industries Economic Estimates, December 2010
www.culture.gov.uk/what_we_do/research_and_statistics/4848.aspx.
27 DCMS Creative Industries Economic Estimates, February 2010.
www.culture.gov.uk/what_we_do/research_and_statistics/4848.aspx. 28
It should be noted that here and elsewhere that labour market data collated by the Sector Skills Councils
is often more closely defined and delivers different results. For example CCSkills own data show that the
combined total for self employed workers for Music and Visual and Performing Arts is approximately
164,000. But the largest single sector for self employed workers is design with nearly 105,000. Indeed the
logic of combining these three sectors as DCMS has done is somewhat at odds with how those sub
sectors view themselves.
29 BIS, HM Treasury (2010.22) „The path to strong, sustainable and balanced growth’
30 See Technology Strategy Board (2009) „ Creative Industries: Technology Strategy 2009-2012’ quoting
DCMS: Creative Industries Economic Estimates Statistical Bulletin (January 2009)
13
generating the most interest.31
1.4 Striking growth potential balanced with cautious business
optimism
This strong historical performance is creating significant future opportunities – in terms
of the striking growth potential of the UK‟s digital and Creative Industries. NESTA
estimate that if the Creative Industries can identify successful business models, they
will contribute £85 billion in value added by 2013, employing 1.3 million, more than the
financial services sector.32 Apart from the digital elements of the Creative Industries
other sub sectors have also been growing strongly. Performing Arts has grown by 4% a
year since 2003. The demands of the so called „experience economy‟ are proving
invaluable for many parts of the Creative Industries.
Recent forecasts by PwC suggested that the UK entertainment and media market
would grow by 3.7% per annum on average for the 4 years to 2014.33 This compares to
whole economy growth over this period predicted at just over 2%.34 Given the optimism
reported by industry representatives in Skillset‟s October 2010 qualitative research
these assumptions look highly realistic.35 Global growth in the E&M market is expected
to reach 5% year-on-year and total $1.7 trillion by 2014.
CCSkills footprint is expected to grow in employment terms by 32% over the next 10
years. This is compared to 6% growth across the whole UK economy. This
employment growth is driven mainly by performing arts (year on year growth of 6.4%);
visual arts (year on year growth of 5.2%) and design (year on year growth of 3.9%).36
In economic terms the GVA of the CCSkills footprint is expected to increase by 31%
over the next decade, compared to 25% for the UK economy in general. This growth is
driven by performing arts (year on year growth of 5.7%); visual arts (year on year
growth of 4.5%); and design (year on year growth of 3.22%).37
31
See Technology Strategy Board (2009.16) „ Creative Industries: Technology Strategy 2009-2012’
32 Kestenbaum, J (2009) „Ensuring economic growth of the UK’s Creative Industries’; Creative Industries
Conference, 2009
33 Towards 2014, the search for value in the digital supply chain PwC 2010
34 http://budgetresponsibility.independent.gov.uk/d/pre_budget_forecast_140610.pdf
35 Skillset‟s employer and stakeholder qualitative framework 2010
36 Creative & Cultural Skills (2011) Occupational, Skills and Productivity Forecasting
37 Ibid

14
In the face of these bullish predictions, the industry as a whole is cautiously optimistic
about the prospects for future growth but is concerned about the skills match of many
new entrants and those already working to the needs of industry within the Creative
Industries, and ongoing rigidities in the educational and training infrastructure in
adapting to changing needs.
1.5 Supporting Future Growth
Perhaps unsurprisingly then the Government‟s recently announced Growth Review
includes the Digital and Creative Industries as one of six priority growth sectors which
they believe are likely to justify prioritised actions to support future growth. The
Treasury and BIS note that the sector is driven by clusters of interdependent firms both
within and outside Creative Industries, suppliers and institutions. This SSA underlines
that the Government‟s Growth Strategy needs to be mindful of the atypical
characteristics of the creative sector (a strong start-up culture; an external labour
market made up of a few large firms and many sole traders and freelancers). Future
industrial and skills policy must address these features more directly to create a
genuinely supportive environment for future growth. Further reform of the „supply side‟
(provision of education and training) will be required to bridge persistent skills gaps,
alongside a range of other appropriate fiscal interventions.
Additionally, one might expect the Growth Review to enrich our understanding of
creative firms as increasingly technology-intensive, which is broadening their ability to
connect with and work alongside other technology led businesses. As NESTA have
noted, to remain competitive in online, convergent and data-rich markets, creative firms
are procuring and producing technologies, tools and technology-related knowledge that
could be used in other tech-rich sectors of the economy, increasing their value added
contribution to the rest of the economy.38
1.6 An ongoing need for methodological innovation around
measurement
This growing scope of creative firms, and the heightened public policy interest in
supporting their future growth, underlines the need for ongoing methodological
innovation around measuring their value creating activities. Measurement of the
Creative Industries continue to be beset by two key challenges – the pace of change,
38
Chapain, C et al (2010.43) „Creative clusters and innovation: putting creativity on the map’ NESTA
15
and the changing nature of creative and digital innovation, which is embedding the
innovations of creative businesses across other sectors of the economy, and
expanding their future economic reach and potential.
Both in the UK and internationally, the key challenge is the inability of official statistics
to keep pace with rapid changes and consequent classification problems that occur in
the Creative Industries. Other challenges relate to the scope of particular sectors,
where statistics cannot identify all of the constituent parts of an industry.39
As importantly, recent work from NESTA has reaffirmed that the innovation and growth
potential of the sector is being underplayed by standard approaches to measurement.
For example traditional indicators of innovation (such as R&D investments or number
of patents) fail to capture many innovative activities in the Creative Industries. The
innovation outputs from creative businesses are instead very often intangible, „co-
produced with consumers‟, simultaneous (consumed as they are produced),
heterogeneous and perishable, making them extremely difficult to measure.40
All of which underlines the ongoing priority for Skillset, e-skills UK and CCSkills and
other key agencies to build on the work they have done over the last 10 years to
develop a more granular and accurate set of labour market data that both government
and industry can use.
1.7 An atypical sector that will have to innovate to meet
current and future skills needs
The Creative Industries sector as a whole is fundamentally a sector that remains
dominated by small and medium size enterprises that illustrate the characteristics of an
external labour market. „Tournaments for entry‟41 are common requiring high levels of
adaptive capacity within the individuals who want to work in the sector, high levels of
resilience and often the ability to work for a period without pay. It is a freelance sector.
39
The British Council (2010) „Mapping the Creative Industries: A toolkit.‟ Creative and Cultural Economy
series 2.
40 Chapain, C et al (2010.17) „Creative clusters and innovation: putting creativity on the map’ NESTA
41 Tournaments for entry are increasingly replacing the more structured routes into a sector that prevailed
a generation ago. People wishing to enter a sector engage in an extended „tournament‟ with other would
be entrants often offering services for free and building networks of patronage to enable them to succeed.
For a good discussion see http://cep.lse.ac.uk/pubs/download/dp0989.pdf

16
Despite employee and freelance demand for learning and development being high the
latest evidence suggests that employer‟s provision to meet the demand is not at the
same level.
1.8 Current Skills Needs
The main areas of skills needs and shortage reflecting the challenges of digitization
and a markedly different public sector environment are:
Multi-skilling: an understanding of different technology platforms and their
impact on content development and digital work flow, and new approaches to
working in cross-functional creative / technical teams within and across
companies.
Multiplatform skills (relevant to some digital sectors of the Creative Industries):
the creative and technical skills to produce content for distribution across all
potential platforms, and the ability to understand and exploit technological
advances. Recent research confirms that creative businesses and having to
invest heavily in in-house R&D and new software and hardware, which in turn
means that a significant and growing proportion of their staff are focused on
activities that require high levels of technology rated skills.42
Management, leadership, business and entrepreneurial skills: especially project
management for multiplatform development; the hybrid skills combining
effective leadership with innovation, creativity and understanding of technology,
and the analytical skills to understand audience interests and translate it into
business intelligence.
IP and monetisation of multiplatform content: understanding of intellectual
property legislation to protect from piracy, and exploiting intellectual property
internationally to take full advantage of emerging markets – with particular focus
on the ability to deal with the problem of illegal downloading and copyright
infringement.
Broadcast engineering: continuing to be an area of skills shortage.
Archiving: archiving of digital content being an area which is attracting
increased attention as a challenging issue for the future.
Sales and marketing: being particularly important in Commercial Radio and an
emerging need in other sectors.
42
Chapain, C et al (2010.32) „Creative clusters and innovation: putting creativity on the map’ NESTA

17
Diagonal thinking skills: the ability to tell great stories, then know how to
monetise those stories to the best effect utilising media that cross platforms and
territories well.
Supply chain management: managing disaggregated production processes
across continents
Foreign language skills: as part of operating in a global marketplace
Other Business Skills: These include Human Resources competency, Financial
management and project management
Fundraising skills: These are particularly in demand for Performing Arts, Visual
Arts and Cultural Heritage.
Creative skills: These include skills such as story-writing, music composition,
etc and are often in demand for Film, Literature, Performing Arts, Music and
Cultural Heritage sub sectors.
Appropriate “associate professional and technical roles”: these relate
specifically to specialist skills relevant to specific occupations. The sector is
highly qualified, but has skills shortages and gaps in specialist roles. Much of
the training that occurs, does so to re-skill individuals entering the sector, which
is then very ad hoc and informal and resource heavy for small businesses.
1.9 The emergence of more dynamic and responsive training
provision
The sector as a whole is characterised by high levels of level 4 and above
qualifications. Around 60% of the Creative Industries have degrees or equivalent and
many in subjects directly relevant to the industry. Within Creative Industries there is a
wide variation in the numbers holding degrees with for example 92% in animation, 88%
in web and internet, 79% in visual arts, 78% in literature, down to 51% in cinema
exhibition, 42% in music and 28% in craft.43 This compares with just 37% of adults who
hold level 4 qualifications or above across the whole UK workforce.44
43
Skillset (2008) Creative Media Workforce Survey, Skillset/UK Film Council (2008) Feature Film Production Workforce Survey, LFS, ONS July 2009 – June 2010; Creative and Cultural Industries: Workforce Survey 2009 44
LFS, ONS July 2009 – June 2010.

18
But more needs to be done to create a better supply of „job-ready‟ graduates into the
Creative Industries as a whole. A better fit between employers and FE and HE
providers needs to be developed with more relevant and up-to-date courses. For
example Skillset‟s Media and Film Academy Network and Accredited courses seem to
be generating impressive results, with a third (33%) of students completing Skillset
Accredited Courses finding employment in all Skillset relevant industries within 6
months after graduating45, almost twice the percentage of students from Skillset
relevant courses.46 The National Skills Academy (NSA) for Creative and Cultural is a
key delivery partner for their Apprenticeships programme. Through the Apprenticeship
Training Service offered by the NSA, new relationships with employers and partners
are being brokered and more Apprentices are thus being developed in the sector.
Though many of the SMEs in the Creative Industries sector continue to rely on ad hoc
training and work base learning on the job there is a growing recognition that more
support is required. As a consequence employers are becoming much keener to
promote greater uptake of Sector Skills Council backed courses and accreditation
services which identify provision that best meet industry needs, although this does
depend on the sector in question. However, developing a more honed supply chain into
the Creative Industries will require additional resources at a time when the public purse
is more constrained than ever. This will require an even higher degree of self reliance
across the Creative Industries than previously.
45
All Skillset relevant industries are industries that Skillset has sole responsibility for and those it shares
with other SSCs.
46 DLHE Survey, HESA 2007/08 from Skillset/Research As Evidence (October, 2010) Mapping Creative
Media Industries and Fashion & Textiles Relevant Education and Learning and development Provision in FE, HE, and the Private Sector in the UK.

19
2. What drives demand in the Creative Industries?
2.1 The Contribution of the Sector
Creative Industries is one the UK‟s major industrial sectors. It is a highly productive
provider of creative content that is innovative and world class and makes the UK a
world-class player in Creative Industries and the market leader in Europe. According to
Prime Minister, David Cameron, the Creative Industries are central to the new
opportunities for growth over the next 10 years. „We have great industrial strengths
across our country, underpinned by world-beating companies. Green technologies in
the North East. Creative Industries in London, Manchester and Glasgow. Financial
services in Edinburgh. In retail, pharmaceuticals and advanced engineering. We have
made the strategic decision to get behind these strengths‟.47
As Table 1 below shows, the Creative Industries have now established themselves as
one of the most important industry sectors, both in terms of GVA contribution and total
employment generated across the sector.
Table 2 – Comparison of individual economic indicators between the Creative Industries and other leading UK Industries
Industry type Employment Contribution to GVA
Aerospace – 1 1,124,000 1.7%#
Pharmaceuticals – 1 72,000 4%
Energy – 2 137,800 4.8%
EPES* & ICT – 2 1,820,000 10%
Construction – 1 1,862,000 1.8%#
Financial Services – 2 1,028,000 7.9%
Manufacturing – 2 3,000,000 12%
Creative Industries – 3 1,300,000 5.6%
1 2006; 2 2007; Source ONS and Industry Estimates. Includes software and reproduction of computer media; 3 DCMS experimental statistics
* Electronics, Photonics and Electrical Systems
# GDP
Moreover in comparison to some other knowledge economy sectors the Creative
Industries are now outstripping other high performing sectors in terms of the rate of job
growth. According to the Government‟s own data Creative Industries created job
growth of over 2% per annum between 1997 and 2010 compared with job growth of
47
www.number10.gov.uk/news/speeches-and-transcripts/2010/10/creating-a-new-economic-dynamism-
56115

20
around 1% in financial services over the same period.48 This amounts to jobs growth of
over 400,000 new jobs compared with 120,000 in financial intermediation services for
that period and year-on-year growth in GVA of 4% against 8% for financial
intermediation services.49 In short 1% growth in GVA creates roughly four times as
many jobs as similar levels of growth in GVA in financial intermediation services.
Fashion and Textiles however saw jobs fall between 2004 and 2008 by around 4%.50
In terms of the broader economy, creative functions are also deeply embedded in other
sectors. One of the reasons for this is the level of innovation that creative occupations
enjoy. Innovation has always been an important driver of productivity and performance
but in creative occupations it is arguably the driver of value adding output. This is
especially true of the core content producing areas. The increase in co-production with
end-users who utilise the developments in digital technology and new viral marketing
techniques that encourage positive feedback loops also accentuate the importance of
innovation and the innovation process.51
2.2 Drivers of Growth, Drivers of Change
The UK‟s knowledge economy, in which Creative Industries, financial services, health,
education and high–medium tech manufacturing form the core, is driven by increasing
levels of innovation and co-production with users and customers. Such co-production
enables Creative Industries to respond more quickly to new developments. This is
particularly the case with digital innovation.52
Certain segments of the Creative Industries are predicted to grow particularly strongly
in the years ahead. Employment growth projections, extrapolated from LFS data only
and excluding some sub-sectors and freelancers, assume employment growth across
the sector of over 4% by 2012 from a benchmark of 2007.53 This is against a backdrop
48
Extrapolated by authors from labour market and other government statistics - www.statistics.gov.uk/statbase/Source.asp?vlnk=358 and Creative Industries Economic Estimates Statistical Bulletin, DCMS January 2009 49
Ibid 50
DCMS definitions of Fashion and Textiles only includes Designer Fashion
51 See:
www.nesta.org.uk/areas_of_work/creative_industries/geography_of_innovation/assets/features/
creative_clusters_and_innovation_report and Miles,I and Green,L (2008) Hidden Innovation in the
Creative Industries, NESTA, London 52
www.berr.gov.uk/files/file51023.pdf 53
Working Futures (2007-2017) (2008) SC/IER/CE electronic resource. Please note that the Working Futures projections are based on a model that uses official Government data sources so they do not include Facilities, Interactive Content, Content for Computer Games, freelancers between jobs (LFS) or any freelancers at all (ABI). As such they are likely to be highly conservative estimates of growth.

21
of growth in the whole economy over the next 4 years that will see 2 million private
sector jobs created at a growth rate of less than 2% per annum.54
Specifically the Creative and Cultural industries are expected to grow significantly over
the next ten years. Employment in the industry will increase by 32% in the coming
decade. This is approximately five times the rate of the UK economy in general. In the
industry, there will be a need for more than 310,000 more people to enter the sector
whether it is by replacing existing jobs or through natural expansion55. Research
undertaken by the UKCES56 suggests that growth in the industry (55%) will be in
„associated professional and technical roles‟, those requiring specialist technical skills.
Meanwhile, employment in “professional” and “associated and technical roles” (i.e.,
specialist technical roles) will increase at a faster rate than compared to the UK as a
whole (26% compared to 15% respectively)57. This places a huge emphasis on the
industry and its support mechanisms to prepare people with the right skills for these
growth areas. It would seem vital, therefore, that businesses begin to invest in training
in associate professional and technical roles as soon as possible.
2.3 The Creative Industries Economy
2.3.1 Growth
Across the sector employers are showing growing confidence that growth is in the air.
From qualitative research conducted by Skillset in October 2010 in Scotland, Wales,
England and Northern Ireland and research by Creative & Cultural Skills in 2009 and
201058 it is clear that most employers are optimistic about growth prospects in the
years ahead.59 In Fashion and Textiles the story is a little more mixed. But even in
these established sectors it is clear that between 2005 and 2009 household spending
on Fashion and Textile goods had increased by 9.5% from £49 million to 53 million with
a dip through the heart of the recession in 2008 but swift recovery thereafter.
54
http://budgetresponsibility.independent.gov.uk/d/pre_budget_forecast_140610.pdf 55
Creative & Cultural Skills (2011) Occupational, Skills and Productivity Forecasting. Creative & Cultural
Skills
56 UKCES (2008) Working Futures 3
57 Ibid
58 Creative & Cultural Skills (2011) Creative and Cultural Industries: Impact and Footprint 2010/11
59 See methodology section for further information regarding Skillset‟s employer and stakeholder
qualitative framework 2010.

22
The underlying reason for optimism in growth for the Creative Industries sector is the
opening up of new markets and new opportunities globally as a result of digital
communications and global supply networks. The global market for traded goods and
services of the Creative Industries has enjoyed an unprecedented dynamism in recent
years. The value of world exports of Creative Industries‟ goods and services reached
$424.4 billion in 2005, accounting for 3.4% of world trade as compared with $227.4
billion in 1996 according to UNCTAD.60 Exports of Creative Industries‟ products during
the period 1996-2005 were led by Europe (The EU-27), dominating the market with
43% of world exports of these goods. The OECD estimates suggest that the UK is the
world‟s biggest exporter of cultural goods, surpassing even the US: in 2002, it exported
$8.5 billion of cultural goods (compared with $7.6 billion by the US, and $5.2 billion by
China).
And the developing nations have been playing a fast game of catch up. Asia became
the second largest exporting region in 2002, when the total value of its exports of
creative goods surpassed the total exports of creative goods from North America.
Future trends confirm the likelihood of further unbroken growth. For example India is
anticipating more than 500% growth in broadband capability between 2008 and 2013.61
China is set to have more than 700 million mobile phone subscribers soon and is
adding nearly 100 million subscribers a year.62
Digital TV and video on demand (VOD) have also reached a powerful tipping point.
Across Europe digital TV revenues jumped by a striking 20% in 2009, and digital now
accounts for over half of all TV revenues as Digital TV services and VOD have made
their first breakthrough tipping past the half way point at 51% of all TV revenues. VOD
revenue growth jumped by 18% in 2009.63
Domestically the rise of the so called „experience‟ economy is evidenced by the large
rises in demand for cultural and performance goods. More people are attending live
performances, visiting museums and attending live theatre than ever before hence the
near record growth in the number of performing artists over the decade and during the
recession. In an age of austerity people may be cutting back on spending in most areas
but their consumption of entertainment, art and literature continues to grow.
60
UNCTAD (2008) „Creative Economy Report – The Challenge of Assessing the Creative Economy: towards informed policy-making‟ United Nations 61
www.indiabroadband.net/india-broadband-telecom-news/11682-india-register-500-growth-broadband-services-within-5-years.html 62
www.pcworld.com/businesscenter/article/148851/china_mobile_phone_subscribers_pass_600_million_mark.tml 63
European Broadband Cable 2010 – Cable Europe – Screen Digest

23
The pace of convergence of technology and the rise of multi-platform opportunities
raise the stakes in terms of skills provision. The introduction next year of YouView64 is
a key example of this. The need for a high skills base is particularly important in a world
of convergent technologies. It is no longer enough to be an expert in a particular
creative field: employees must also understand how to create, market and distribute
content across a range of channels65, with multi-platform skills needs now more
marked than even a year ago. The broader content industry includes cultural
institutions that foster, create and maintain digital content; businesses that produce
content, and allied industries that provide or require content, with growing linkages
between cultural institutions, Creative Industries, digital content producers, and other
industry sectors.66 The future emphasis must be on growth and the need to have a
range of skills and fusion of skills.
2.3.2 The Business Context - Digital Britain and London 2012
Digital Britain, established by the previous administration, set an ambitious agenda, to
ensure the UK is at the leading edge of the global digital economy. The current
coalition government are similarly committed to very quickly improving the UK‟s digital
infrastructure and encouraging digital innovation. 67 The Creative Industries sectors
most affected by rapid technological change are those utilising digital technologies.
Content for Computer Games, Animation, Film, Television and Visual Effects are all
rapidly adjusting to fast-changing new developments and technological breakthroughs.
The UK has the largest Visual Effects industry outside Hollywood in the United States.
3D will fast become the industry norm in Television as well as Film. According to
Skillset‟s qualitative research evidence the supply side (provision of education and
training) is struggling to keep pace with the speed of such change.68
E-learning is another facet of Digital Britain. Developing sufficiently flexible, responsive
and adapted e-learning solutions is critical. Major organisations such as the BBC are
taking a valuable lead in this area but more will need to be done quickly to help keep
64 YouView is a partnership between the BBC, ITV, BT, Channel 4, Five, Arqiva and Talk Talk to develop a common interface for Internet Protocol Television (IPTV) in the UK. To be launched in 2011, YouView will attempt to replicate the success of Freeview for internet television. See www.youview.com 65
CBI (2010) Creating Growth – A Blueprint for the Creative Industries 66
OECD (2006) Working Party on the Information Economy – Digital Broadband Context – Digital content strategies and policies 67
www.number10.gov.uk/news/speeches-and-transcripts/2010/10/creating-a-new-economic-dynamism-56115 68
Skillset‟s employer and stakeholder qualitative framework 2010
24
learners and those engaged in continuous professional development abreast of the
latest changes in the scope and scale of digital innovations.
The expected impact on the Creative and Cultural industry of the London 2012 Olympic
and Paralympic Games is enormous. The Games will attract up to 300,000 overseas
visitors, one million UK visitors and five million visitors from London, as well as 50,000
athletes, press and officials. The 2008-2012 Cultural Olympiad, a UK-wide programme
of events and projects run by cultural organisations, will accompany it. These huge
events will need senior technical staff, specialist technicians and a variety of
practitioners and is an opportunity for „upskilling‟ across the sector.
2.3.3 Opportunities and Challenges - Globalisation
Globalisation offers significant opportunities for the Creative Industries. In summary
these are:
Growing potential markets for UK-produced content in all formats, across all
media;
An increasing range of foreign competitors with access to the UK market;
Increasing potential for sourcing services from the UK to overseas („off
shoring‟).
In all three cases, it is the emerging economies of India and China that will have
greatest impact on the UK industry. The growing populations of both countries will help
to ensure that they maintain their emerging roles as both suppliers and markets: by
2010, India had added 83 million workers to the global economy, China 56 million, and
the EU just 100,000.69 Crucially this is leading to the globalisation of high level skills,
with massive increases in the global supply of highly educated workers able to
compete on price as well as knowledge. China for example, now has more people in
higher education than the United States70. These figures reflect the coming size and
shape not only of the labour market, but also the media content market. However, it is
currently expected that successfully entering the Chinese market in particular will
require both patience and precision, not least as income levels will prohibit
consumption of content on a Western scale, even as GDP and average earnings
continue their steady increase. The current orthodoxy is to treat China and India as key
suppliers in the short term and key markets only in the longer term.
69
Deloitte 200 70
Brown, P. et al (2010 „Skills are not enough: the globalisation of knowledge and the future UK economy‟ Praxis, No 4, Vol 10.

25
Perhaps of more concern to the UK‟s Creative Industries is the use by different
governments of tax breaks and other fiscal incentives to lure producers to site their
operations away from the UK. Clearly with global opportunities comes the threat of
genuinely „footloose‟ international sectors, such as much of the Creative Industries
sector. Government support and encouragement is thus vital for these sectors to
remain indigenous and competitive, such as tax breaks offered to Film makers wanting
to make films in the UK.
The economic dividend of doing so is substantial as recent European research
confirms that those regions with high concentrations of Creative and Cultural industries
have Europe‟s highest prosperity levels.71
For the more established industries of Fashion and Textiles their story over the last 15
years has been one of losing manufacturing employment to cheaper overseas
producers. Liberalisation of the supply chain in Fashion and Textiles has been helped
by a more liberal trade regime. The Agreement on Textiles and Clothing (ATC) was
abolished in 2005 for example. Today most Fashion and Textile manufacturers are now
engaged in higher value adding, higher quality activity where margins and profitability
can be sustained. For instance, apparel manufacturers have moved increasingly to
balanced sourcing, concentrating on design and finishing activities and finding high
value niche markets, whilst textiles firms have increasingly moved into technical
textiles. Due to these changes wholesaling activities in Fashion and Textiles have
increased employment in this period. The depreciation of sterling, and the high quality
reputation of British designer brands overseas, also offers Fashion and Textiles major
export opportunities. Sales to overseas markets represent around 20% of turnover and
sales to the emerging economies of Russia, United Arab Emirates and China are also
growing. While sales to established markets in the EU, US and Japan remain robust.
It is also worth stating that the UK‟s strength in being the originator of the world‟s
business language, English, allows a considerable competitive advantage for the UK‟s
Creative Industries. Our Literature sector goes from strength to strength on the basis of
growing demand for English language writers and Cultural Heritage also benefits from
the UK‟s unique position and reputation across the world as a world heritage exemplar.
71
European Cluster Observatory (2010) „Priority Sector Report: Creative and Cultural Industries

26
2.3.4 Competition and Industrial Structure
It is likely that as the processes of convergence progress, competitive boundaries will
become increasingly blurred. The common feature of the global opportunities
presented by new and developing technology is that they will be beyond the scope and
scale of almost all single companies, even large established multinationals or
conglomerates. Alliances and partnerships will therefore need to be formed for
opportunities to be realised, commonly with companies in technology and telecoms,
and sometimes with companies that will be competitors in other markets.
Supply chains will necessarily lengthen and the freelance and contract based nature of
so much of the Creative Industries sector will offer both opportunity and threat to the
industry. Supply chain and project management will become an increasing skill need
for Creative Industries organisations – what Susan Berger describes as coordination
capabilities.72
These are the skills that will enable key individuals to coordinate the functions of often
disaggregated supply chains. Indeed rather than just needing to coordinate matters
inside a single company, individuals need to be able to coordinate activity across many
different companies and suppliers – all part of the same supply chain – and as
importantly across different cultures.
2.3.5 Convergence and Audience Fragmentation
Audience fragmentation is driving growth in demand – in the last ten years, for
example, cable and satellite subscription revenue has tripled, while DVD revenues
have increased fifteen-fold and downloading has enabled audiences to access content
in more personalised ways.73 Consumption of video across multiple platforms is now a
global phenomenon, with approximately 70% of global online customers now watching
online video, but with North America and Europeans lagging in adoption.74 According to
figures from PwC75 over the next four years to 2014 Internet Advertising will grow by
10.5% and advertising in video games will grow by 13.7%. This compares with 4.3% for
TV advertising and reductions of 1.2% for Newspapers, 11.9% for Print Directories and
1.3% for Trade magazines.
72
Berger, S et al (2005), How We Compete, Currency/Doubleday, New York, NY 73
Media Predictions, TMT Trends, Deloitte 2009. 74
How People Watch: A Global Neilson Consumer Report – August 2010 75
Stokes, P (2010) Towards 2014: the Search for Value in the Digital Value Chain, PwC

27
2.3.6 Technological and consumer driven change
User-led innovation has become increasingly important and several of the UK‟s existing
creative businesses such as web content and video games have been cited as
examples of excellence.76 This includes User Generated Content (UGC) through, for
example Twitter and other social media sites and blogs. Indeed social media sites such
as Facebook have also opened up their platforms to individuals and businesses to
create Apps and have created and developed the structure to support the
commercialisation of these applications. The key conclusion is that digitisation and
platform proliferation are enabling the end-user far more control over when, where and
how they access content.
For Fashion and Textiles opportunities are emerging in the areas of technical textiles
working within industries such as Aerospace, Agriculture, Automotives, Construction,
Defence and Medicine. Textiles serving these end-user markets have highly advanced
properties and are devised for performance rather than aesthetic reasons. Alternatively
the rise of „fast Fashion‟ is placing increasing demands on the industry to respond to
faster changing consumer demand. This means shorter production cycles and leaner
distribution capability.
In the music industry for example, the effects of digitisation are numerous, from
convergence of product delivery onto digital platforms, to the ease of creating and
recording new music, to digital publishing and marketing. 95% of all UK single sales
are now digital, and the future is likely to be driven by the adoption of music delivery
platforms which enable on-demand access regardless of location.
Digital technology has also had a major impact on the design sector, including
shortened design timescales, faster communication, the emergence of rapid
prototyping and businesses requiring fewer people carrying out more tasks. The
majority of designers think skills needs are changing and the most commonly cited
reason is technological advance77.
While the rise of e-publishing and e-books creates a new vista of opportunity for both
Publishers and people working in the Literature sector.
76
Annual Review, NESTA, Feb 2009. 77
Ibid

28
2.3.7 Intellectual Property and Digital Management
Monetising intellectual property rights is a major obstacle for employers in Creative
Industries. Indeed the ability to monetise IP across platforms and content areas was
probably one of the biggest challenges cited by employers in the qualitative research
Skillset undertook for this report.78 Digital archiving was another oft-cited issue for
employers. Alongside this was a dearth of people who could genuinely think
„diagonally‟ and be both creative and entrepreneurial. Too often digital rights are very
hard to disentangle.
2.3.8 Product Market Structure
The Creative Industries operate in many different marketplaces. They are a genuinely
globally interfacing industry. Disaggregation of supply chains and the speed of
production cycles and response to consumer demand has been discussed above.
Increasing use of new technologies in the Creative Media sectors, Fashion and Textiles
in particular will intensify changes to product market structures.
2.4 The Creative Industries Workforce
According to DCMS data there are an estimated 182,100 Creative Industries‟
companies (not including sole-traders) and a breakdown by broad sector can be found
in Table 2.79 It is worth noting at this stage that the SSAs for CCSkills, Skillset and e-
Skills contain more accurate and detailed workforce data and should be referred to in
conjunction with this report. The vast majority (84%) of companies are small (fewer
than 10 people) and just 2% of companies are large (100 people and more).80
78
Skillset‟s employer and stakeholder qualitative framework 2010 79
Skillset 2010 Company Database (created from a variety of sources including previous research participants, Trade Association membership lists and Industry Directories). All figures have been verified with sector representatives. NESTA (Content for Computer Games) and IDBR 2009 (Photo Imaging, Publishing and Advertising). 80
Skillset (2009) Employment Census and IDBR 2009 (Photo Imaging, Publishing and Advertising).

29
Table 3 Company breakdown
Sector Number of enterprises
As a proportion of Creative
Industry Enterprises (%)
As a proportion of all enterprises
(%)
1. Advertising 14,800 8.1% 0.7%
2. Architecture* 11,500 6.3% 0.5%
3. Art & Antiques 2,700 1.5% 0.1%
5. Design 14,200 7.8% 0.7%
6. Designer Fashion 900 0.5% 0.04%
7. Film, Video & Photography 9,900 5.4% 0.5%
9 & 10. Music & Visual and Performing Arts 30,800 16.9% 1.5%
11. Publishing 7,700 4.2% 0.4%
8 &12. Software & Electronic Publishing* 81,700 44.9% 3.9%
8 & 12. Digital & Entertainment Media^ 200 0.1% 0.01%
13. TV & Radio 7,700 4.2% 0.4%
Total 182,100 100.0% 8.7%
All enterprises 2,100,400 Source: DCMS Creative Industries Economic Estimates December 2010 * These sectors are not included in this SSA . ^This sector includes SIC codes 58.21 Publishing of Computer Games and 62.01Computer Programming
Activities. Computer Games are excluded from this SSA in view of the forthcoming Livingstone/Nesta review of skills in CG due for publication in January 2011 to which Skillset and e-skills UK have contributed
The distribution of enterprises by employment size band is similar to the employment
distribution in the wider economy.81 According to skills survey data, 65% of employers
in the combined creative footprint of Skillset and CCSkills in England employ four or
less members of staff, and just 5% employ 25 people or more 82. Based on official
figures, some 43% of the total creative workforce in the UK is employed outside the
Creative Industries. Not far off the proportion found in financial services (39%).83 This
helps explain the considerable spill over effects that emanate from those holding a
creative content skills base.
Creativity is recognised as an important driver of innovation and the Creative Industries
show significantly higher values of innovation and creativity than other UK enterprises
81
www.statistics.gov.uk/cci/nugget.asp?id=1238 82
NESS 2009. The figures represent an analysis of data by the Standard Industrial Classification (SIC)
codes contracted to Skillset and CCSkills by the UKCES. Exclusions apply - see Annex A for methodology.
83 Higgs,P, Cunningham, S and Bakshi, H (2008) Beyond the Creative Industries: Mapping the Creative
Economy, NESTA, London

30
(70% as against 55%).84 In Literature, Cultural Heritage, Film, Animation, Television,
Radio, Performing Arts, Visual Arts, Music, Design, Fashion, Craft, Photography and
Architecture arguably creativity is the key ingredient that enables organizations and
individuals to succeed more than in any other sector of the economy.
As a recent report from CIHE notes, quoting senior BBC technical staff, producers,
engineers and technologists will increasingly converge into teams working together to
deliver interface, service and content – as one product – rather than different teams
working in isolation and then hoping to tie the solution together.
It is therefore hardly a surprise, that e-Skills, Skillset and Creative & Cultural Skills have
in recent years consistently begun to identify the development of hybrid skills –
technical, business, creative, and interpersonal – as the vital pre-requisite of
monetising content and services.85
2.4.1 Employment Profile
Overall, 25%86 of those working or available for work in the Creative Media Industries
are „freelance‟ and the remaining operate on an „employee‟87 basis. While for the
Creative and Cultural Skills footprint 44% describe themselves as „self-employed.
Table 3 below shows the employment profile for the Creative Industries as a whole.
84
Includes all Creative Industries which includes software and reproduction of computer media, DTI Occasional Paper No. 6. Innovation in the UK: Indicators and Insights, July 2006. 85
CIHE (2010) „The Fuse – Igniting High Growth for Creative, Digital and Information Technology Industries in the UK‟ 86
Skillset (2009) Employment Census, Skillset/UK Film Council (2008) Feature Film Production Workforce Survey and LFS, ONS July 2009 – June 2010. 87
„Freelance‟ = contract of less than 365 days and „employee‟=contract of 365 days or more.

31
Table 4: Creative Employment, Great Britain
2010 Data (July - September)
Sector
Employees in Creative Industries
Self-employed
in Creative
Industries
Employees doing
creative jobs in other
industries
Self-employed
people doing
creative jobs in other
industries Total
Employment
1. Advertising 89,100 25,400 163,800 21,000 299,200
2. Architecture* 63,300 35,300 26,300 3,500 128,400
3. Art & Antiques 6,600 3,200 9,800
4. Crafts 66,300 45,100 111,400
5. Design 35,000 56,600 113,500 20,400 225,400
6. Designer Fashion 2,500 3,700 3,200 400 9,700
7. Film, Video & Photography 26,000 13,300 10,700 10,500 60,500
9 & 10. Music & Visual and Performing Arts 67,200 136,300 33,300 69,000 305,800
11. Publishing 151,100 20,500 55,700 9,300 236,600
8 & 12. Software & Electronic Publishing* 347,000 81,000 290,600 34,500 753,000
8 & 12. Digital & Entertainment Media^ 5,600 700 6,200
13. TV & Radio 77,300 37,300 10,500 7,200 132,300
Total 870,600 413,200 774,000 220,700 2,278,500 Source: Labour Force Survey (LFS), Office for National Statistics. Again note that each of the SSCs separate SSAs have more detailed and accurate breakdown‟s for many sub-sectors of Creative Industries * These sectors are not included in this SSA. ^This sector includes SIC codes 58.21 Publishing of Computer Games and 62.01Computer Programming
Activities. Computer Games are excluded from this SSA in view of the forthcoming Livingstone/Nesta review of skills in CG due for publication in January 2011 to which Skillset and e-skills UK have contributed
As Table 4 shows, freelancing or self employment dominates some occupational
groups more than others. More than half the workforce in some occupational groups
are freelance such as Design, Film, Performing Arts, Visual Arts, Music, Television and
Designer Fashion. This rises to 64% in Literature and 87% in Visual Arts while Cultural
Heritage bucks the trend in having only 4% freelance compared to a whole UK
economy of 13%.

32
An analysis of Labour Force Survey data using the combined creative footprints of
Skillset and Creative and Cultural Skills, suggests that a third of the workforce (34%) is
self-employed compared to 14% across other sectors 88
The Creative Industries workforce is also slightly younger than the whole economy
averages as Table 5 indicates with the exception of Fashion and Textiles where 46% of
the workforce is aged over 45 and getting older.
Table 5: Workforce Age by Sub-Sector
16-24 25-34 35-49 50+
Total Creative Industries 9% 29% 41% 21%
UK Economy 13% 22% 37% 28%
Sources: LFS July 2009 – June 2010
Representation of women is lower in Creative Industries than across the economy as a
whole (38% compared with 47%, but note 50% of Fashion and Textiles are female) and
varies considerably by sector. Representation of women is also lower in the combined
creative footprints of Skillset and Creative and Cultural Skills (41%) compared to the
wider economy.
Female freelancers make up just over a third of the workforce overall and the
proportion of female freelancers varies from just 31% of the total number in Advertising
to well over half of those freelancing in Publishing.89 CCSkills research shows that
30% of the workforce in Craft, 58% in Cultural Heritage, 45% in Performing Arts and
53% in Visual Arts are female. For the Creative and Cultural workforce as a whole 41%
are female.90 The UK economy average is 38% female compared to 62% male
freelancers.91
88 LFS (Jul 2009 - Jun 2010). The figures represent Standard Industrial Classification (SIC) codes
contracted to Skillset and CCSkills by the UKCES but do not represent the full extent of the creative sectors that these sector skills councils are licensed to support. See Annex A for methodology. 89
Skillset (2009) Employment Census, Skillset/UK Film Council (2008) Feature Film Production Workforce Survey and LFS, ONS July 2009 – June 2010. 90
Creative & Cultural Skills (2011) Creative and Cultural Industries: Impact and Footprint 2011/12
91www.pcg.org.uk/cms/documents/POLICY_AND_CAMPAIGNS/research/UK_Freelance_Workforce_B08-
21_1.1.pdf

33
Skillset‟s research92 has also shown that representation is dropping, whereas the
opposite is the case for the economy as a whole. Skillset research has also repeatedly
shown that representation of older women is extremely low and has identified the
cause of this to be the particular challenges of balancing starting and raising a family
with working in the Creative Industries, for example due to long and unpredictable
hours with some notable exceptions.93 In CCSkills footprint women are also likely to
earn a lower wage than their male counterparts while at the same time tending to be
more highly qualified than men94.
Fewer in the footprint of Skillset and CCSkills compared with the economy as a whole
is from a Black Asian or Minority Ethnic Background (BAME) (7% compared with 9%)
and 31% of London‟s economy is from a BAME background, which is where a third of
those working in those parts of the Creative Industries are based.95 However in
Fashion and Textiles the BAME figure rises to 18% and 46% in London. In CCSkills
footprint 9% of those working in Cultural Heritage are from a BAME background, the
same number as for the UK economy as a whole. Whereas most of the footprint are
slightly below the UK average with Craft, Design, Music, Visual Arts at 7%, Literature at
8% and Performing Arts at 6%.
While fewer than one in ten (9%) in the Creative Industries workforce is disabled (as
defined by the Disability Discrimination Act)96 which is lower than across the economy
as a whole where 14% are disabled (including both DDA disabled and work-limiting
disabled).97 But this is not true of all sub sectors of Creative Industries. Across CCSkills
footprint the figure for disabled workers is 13% - much closer to the national average.
The Creative Industries sector is highly skilled and one of the most highly qualified in
the economy; c60%98 in Creative Industries has a degree or equivalent level 4
qualification compared with 36% of the population of working age across the
92
Skillset (2009) Employment Census. Excludes Film Production freelancers, Photo Imaging, Publishing and Advertising. 93
Skillset (2006) Balancing Children and Work in the Creative Industries. 94
Creative & Cultural Skills (2011) Creative and Cultural Industries: Impact and Footprint 2011/12
95 Creative Media Industries: Skillset (2009) Employment Census, Skillset/UK Film Council (2008) Feature
Film Production Workforce Survey and LFS, ONS July 2009 – June 2010; All UK: LFS, ONS July 2009 – June 2010 96
Skillset (2008) Creative Industries Workforce Survey, Skillset/UK Film Council (2008) Feature Film Production Workforce Survey and LFS, ONS July 2009 – June 2010. 97
LFS, ONS July 2009 – June 2010. 98
Skillset (2008) Creative Industries Workforce Survey, Skillset/UK Film Council (2008) Feature Film
Production Workforce Survey, Skillset (2007) Photo Imaging Workforce Survey reported in Skillset (2009)
Photo Imaging Labour Market Intelligence Digest and LFS, ONS July 2009 – June 2010; Creative &
Cultural Skills (2009) Creative and Cultural Industries Workforce Survey.

34
economy.99 Again the picture is a little different for Fashion and Textiles who have a
higher proportion of people with below Level 4 qualifications100.
2.4.2 Recruitment at Entry Level Onwards
Recruitment across the Creative Industries has been mixed over the last 12 months.
Among those employers that fall within Skillset‟s footprint almost half (49%) have
actually taken on new employees or short-term contracted staff over the past 12
months. The majority of these employers (68%) have actually taken on freelancers,
with 29% taking on employees and just 2% taking on both.101 For Fashion and Textiles
the picture is a little different with only 10% of employers having any vacancies during
2009. For those businesses falling within CCSkills footprint employment has grown by
over 4% during the past year – well above the whole economy average. And over the
period 2004 – 2010 that growth in some parts of the Creative Industries has been
explosive (see Table 6 below).
Table 6: Change in Creative and Cultural industries employment
Sector % Change in employment, 2004-2010
Design + 23%
Music + 4%
Performing arts + 38%
Craft - 27%
Literature + 6%
Cultural heritage + 4%
Visual arts + 37%
Creative and Cultural industry
total
+ 11%
UK employment total - 0.2%
Creative & Cultural Skills. (2011). Creative and Cultural Industry: Occupational, Skills and Productivity Forecasting
The number of employers reporting vacancies in the combined creative footprint of
Skillset and CCSkills in England is slightly lower (9%) than for employers across other
99
LFS, ONS July 2009 – June 2010. 100
19 per cent in Annual Population Survey 2009
101 Skillset (2010) Creative Media Employer Survey. Excludes Advertising.

35
sectors in England (12%). The percentage of employers in the combined footprint
reporting hard-to-fill vacancies mirrors that reported by employers in England (3%).
Employers reporting vacancies in Skillset and CCSkills combined creative
footprint 102
9%
3%2%
12%
3% 3%
0%
2%
4%
6%
8%
10%
12%
14%
Employers with
vacancies
Employers with hard-
to-fill vacancies
Whether have any
skills shortage
vacancies
Combined footprint
All England
Almost half of employers (47%) in the combined footprint cited a low number of
applicants with the required skills as a main cause of having hard-to-fill vacancies. This
was followed by lack of work experience the company demands; cited by 26% of
employers.
The impact of hard-to-fill vacancies as reported by employers is illustrated in the chart
below. An increased workload for other staff is the most reported consequence, and a
higher proportion of employers report this in the combined footprint (81%) compared to
other sectors employers in England (75%).
102
NESS 2009. The figures represent an analysis of data by the Standard Industrial Classification (SIC)
codes contracted to Skillset and CCSkills by the UKCES. Exclusions apply - see Annex A for methodology.

36
Impact of having hard-to-fill vacancies in combined creative footprint 103
30%
31%
32%
40%
41%
53%
81%
36%
23%
32%
33%
33%
40%
75%
0% 10% 20% 30% 40% 50% 60% 70% 80% 90%
Increased operating costs
Need to outsource work
Difficulties meeting quality
standards
Lose business or orders to
competitors
Difficulties introducing new
working practices
Delays to developing new
products or services
Increased workload for
other staff
All England
Combined footprint
Most sectors of the industry have long been characterised by highly motivated
individuals wanting to work in an industry commonly seen as glamorous and exciting.
Acting, playing music, designing, Film producing, Television broadcasting and Radio
broadcasting are among the most attractive jobs in the eyes of many aspirants to the
sector.
One result of demand from individuals wanting to work in some parts of the sector has
been a high level of voluntary or unpaid working, undertaken in order to get a foot in
the door and a first paid job. For example more than two fifths (44%) of the workforce in
Creative Media Industries report having worked unpaid in order to get into the industry.
Formal recruitment measures such as advertising and recruitment agents are still
relatively uncommon in most sectors of the Creative Industries and a third report
entering the industry this way and this reduces to a quarter for those already in the
industry. More people in the industry report securing both their first and current job
through informal channels such as word of mouth or personal contact.104 In Fashion
and Textiles some 42% of employers do not even have formal job descriptions for all
their employees.105
103
NESS 2009. The figures represent an analysis of data by the Standard Industrial Classification (SIC)
codes contracted to Skillset and CCSkills by the UKCES. Exclusions apply - see Annex A for methodology.
104 Skillset (2008) Creative Industries Workforce Survey. Excludes Film Production, Photo Imaging,
Publishing and Advertising. 105
NESS, 2009

37
Across Creative Industries the main barriers to better recruitment encompass the
following:
1. Across many parts of the industry, routes to entry have been characterised by
knowing people in the industry. This makes recruitment less diverse than it
otherwise might be.
2. Demographic change presents considerable challenges to the sector and too
often the sector does not follow best practice in its recruitment practices.
3. Career paths across the sector are not necessarily well-known or understood by
school leavers, graduates or their careers advisors.
4. Whilst some employers are doing a considerable amount of learning and
development (accredited and non-accredited), the sector as a whole is
characterised by a lack of formality or comparability in its approach to learning
and development.
5. There is a general lack of the right formal qualifications post first degree level
and scepticism over the quality of qualifications provided by many of the
existing suppliers. There is also an acute fear of more bureaucracy and red
tape.
6. People offer themselves free to gain work experience (at school leaver, student
and graduate level). This means employers do not need to invest or engage
with these volunteers in the same way as they would if they were trainees or
employees.
7. Existing demand from applicants wanting to work in the industry in some sub-
sectors creates a strong economic disincentive to change. In many sectors such
as Music, Cultural heritage, Design, Performing Arts, Advertising, Film and
Television there is huge demand for placements and work from people with
level 4 qualifications and above. However employers still complain that too
many graduates are not job ready and lack basic industry specific skills.
8. Poor perceptions in some parts of the sector erode the ability of employers to
recruit new entrants. While low entry level wages also act as a disincentive to
recruit.
9. Finally poor industry into education links affect the ability of the sector to recruit
widely and fairly.

38
2.4.3 Retention
Qualitative research confirmed that freelancers will remain at high levels in many
sectors due to the general project based nature of the work in sectors such as Film and
Television.106 Overall retention levels are relatively high across the Creative Industries
Sector.
2.4.4 Creative Industries Workforce and Travel
Most key occupational groups within the industry operate within a national or
international labour market; people will generally need to be willing to travel to
wherever work is in order to develop or sustain a career in the industry. There are few
differences between the proportion of the workforce working and living in each nation
or region, except in London where fewer people live than work, and the South East and
East of England where fewer people work than live. This is presumably attributable to
substantial proportions of the workforce commuting from those latter regions into
London.107
2.5 Skills mismatches, acquisition and utilisation
In many parts of the Creative Industries there are a plethora of skills mismatches. For
example 60% of jobs in the Creative and Cultural industries are classed as „associate
professional or technical‟, i.e. specialist skilled roles. Individuals within these industries
are much more likely to have at least one degree than across employment in the UK in
general, and yet the rate of skills shortages and gaps is significant. Employers in the
industry state that the higher education system is not fit for purpose; supposedly highly-
qualified graduates are not entering the sector „job-ready‟, and thus need to acquire
further skills. This tends to happen either on the job or through ongoing training
opportunities, for which employers usually pay. Creative and Cultural businesses
struggle to access funding to engage in this training.
Meanwhile businesses in the Creative and Cultural industries do not tend to think
strategically regarding current and future skills needs and/or potential economic
change. Many access training only as and when immediate needs arise, as opposed to
planning staff development in advance of upcoming business requirements. This is
106
Skillset‟s employer and stakeholder qualitative framework 2010
107 Ibid

39
often exacerbated by the limited time and finances available to engage actively in
sustained workforce development.
With the higher education system moving toward a consumer choice model of supply,
tuition fees increasing and with significant cuts occurring to university funding (and to
arts-based courses in particular), the decisions that students and potential Creative and
Cultural practitioners make in terms of their education are becoming more and more
vital. Information, advice and guidance (IAG) for those planning a career in the
industry, those that are mid-career, and for those needing to develop leadership skills
is key for the health of the sector. Sector-led IAG is very important, and impartial,
industry-relevant information should be available to all to help skills blockages to clear.
The UK‟s Creative and Cultural industries have a significantly greater proportion of the
workforce qualified to above level 4 compared with the rest of the economy (58%108
compared to 37%109).
Figure 1: Qualification structure of the Creative and Cultural industries and the
UK economy (2009)
Creative & Cultural Skills. (2011). Creative and Cultural Industry: Impact and Footprint 2010/2011
Nearly a quarter (24%) of Creative and Cultural businesses have experienced
problems recruiting into particular roles. Over half of these (43%) say that this is
because applicants lack experience, and over a third (38%) that they lack the right
specialist skills for the job.
108
Creative & Cultural Skills (2011) Creative and Cultural Industry: Impact and Footprint 2010/11 109
Ibid

40
A key issue is that a high proportion of the Creative and Cultural workforce consists of
„qualified‟ potential recruits who do not have the specific „associate professional and
technical‟ skills that more than 60% of jobs require (15% across the UK). In addition,
the Creative and Cultural industries are not particularly engaged with „associate
professional and technical‟ areas when it comes to planning training, or with how the
qualifications and skills sector can prepare individuals for these roles. As such, the
acquisition and retention of hands-on skills and the existence of specialist training
centres is absolutely crucial.
It is also important to note that, in administrative, support and management roles,
Creative and Cultural organisations often recruit from the rich over-supply of general
Creative and Cultural graduates to roles that do not require higher-level or Creative and
Cultural-specific qualifications. In specific specialist areas such as IT, finance,
customer services and administration, the sector often misses out on the wider pool of
talent available from other areas of study or those without formal qualifications.
In particular, vacancies and skills shortages in the Creative and Cultural industries are
much greater in the „associate professional and technical‟ occupational category than
across the general economy110. This is despite the fact that three quarters of those
working in the „associate professional and technical‟ category are qualified to level 4 or
above.
Investing in training in „associate professional and technical‟ occupations is vital, given
the fact that these roles comprise 60% of the industry. However, approximately only a
fifth of all individuals in the industry who undertake training do so in this category.
An appropriate range of relevant occupational and vocational qualifications must be
available to meet the current and future needs of employers. It is vital that industry
retains a say in which vocational qualifications are developed and which are
considered for priority support.
In order to achieve this the development of new National Occupational Standards
(NOS), Apprenticeship pathways and qualifications for new occupational areas in
response to industry demand are key.
Apprenticeships in particular offer employers within the industry the opportunity to
recruit and train individuals in specific occupational and skills areas. Encouraging more
employers to take on an Apprentice will help the industry to recruit and develop people
with appropriate skills for the jobs that are available.
110
UKCES (2010) National Employer Skills Survey 2009

41
Significantly, given the small business structure of the creative and cultural industries,
the costs of taking on an Apprentice are significant. This is particularly true in terms of
business lost due to training commitments. Managing Apprentices directly, liaising with
colleges and dealing with bureaucratic protocol can also be difficult to deal with,
especially for micro-businesses.
Enabling employers to take on an Apprentice is vital for the continuing success of the
Creative and Cultural industries. In particular, the following recommendations are
made:
The Apprenticeship Training Service (ATS) offered by the National Skills
Academy for Creative and Cultural is in a position to help employers cut through
the red tape, and can help broker alternative funding structures to encourage
employers to take up more Apprentices.
In particular, an important change in funding would be to reallocate a portion of
the funding currently directed to the further education sector for Apprenticeships
towards employers, in order to support associated training and management
costs.
This reallocation of funding would ensure that the overwhelming majority of an
Apprentice‟s training could happen within the workplace. It would also be more
efficient for FE colleges to have an intermediary role rather than a specific
delivery role.
This small amount of investment would make an enormous impact. Businesses across
the Creative and Cultural industries are keen to take on Apprentices, but the significant
cost barriers often prevent them (especially micro-businesses) from doing so.
UK employees across all industries who undertake regular training earn on average
between 5% and 6% higher than those who do not undertake workplace training111.
Given that there are considerable issues around skills shortages and gaps in the
industry, training staff and investing in training is vital if the industry is to remain
economically successful.
The proportion of jobs requiring higher levels of qualifications has been rising in the
Creative and Cultural industries, whilst the proportion requiring low or no qualifications
has been declining. The Creative and Cultural industries currently have low job
111
BERR. (2006). Non-certified learning and skills: incidence in the UK, variation across countries and links to productivity.

42
vacancy numbers compared to the UK in total112 and reasonably low hard-to-fill
vacancies in comparison with other industrial sectors113. This may be driven by the
perception within the industry that there is a need for re-skilling as opposed to „up-
skilling‟, with new skills acquired in post and „on the job‟. The availability of training to
meet high skills demands is one potential problem114.
It is particularly interesting to look at whether the training on offer to individuals reflects
the wide range of occupational roles in the industry. Since the development of both
qualifications and training opportunities has been driven by student demand rather than
industry need, there is a particularly large number of generalist courses and
qualifications but many fewer for specialist technical roles115.
As such, and in many instances, employers have needed to create bespoke training
solutions that, not being accredited and not leading to recognised qualifications, do not
attract public funding. This has further exacerbated the divide between the needs of the
sector and the offer from traditional training providers.
2.6 The Sub-Sector Story
A more detailed breakdown of current skills needs by sub-sector can be found in
Section 3.5116. The Creative Industries story is a complex one as each sector has
particular idiosyncrasies and nuances that command attention. Video, film and
photography saw employment fall by 3% between 2007 and 2008, and GVA growth of
2% per annum between 1997 and 2007.117 Whereas for Design, Performing Arts and
Visual Arts the story has been of relentless employment growth of 23%, 38% and 37%
respectively between 2004 and 2010 – a quite remarkable story of growth. The other
sectors have enjoyed at, or just above, whole economy trend rates of growth of
between 2% and 3%.118 Though the recession hit some sectors hard - Advertising for
example shrank by 10%119 and Craft has seen employment fall by 27% over the last 6
112
UKCES. (2010). Employment and Skills Almanac.
113 Ibid
114 Ibid
115 As can be seen by consulting the National Database of Accredited Qualifications
(www.accreditedqualifications.org.uk).
116 Excluding Content for Computer Games as the Livingstone/ Nesta review of skills in CG and VFX to
which Skillset and e-Skills have contributed is due for publication in January 2010.
117 DCMS Creative Industries Statistical Bulletin, December 2010.
118 Ibid
119 Stokes, P (2010) Towards 2014: the search for position in the digital value chain, PWC

43
years - employers in most sectors feel moderately confident about their future
prospects despite public spending cuts and reduced Government spending on
advertising and marketing (see Table 7 for more detail on CCSkills footprint as an
example of GVA growth overall.)
Table 7: CCSkills Footprint change in GVA
Sector % Change in GVA 2004-2010
Craft -20
Cultural heritage -2
Design 25
Literature 7
Music 4
Performing arts 20
Visual arts 15
Creative and Cultural
industries total
11
UK economy total 6
Source: Creative & Cultural Skills. (2011). Creative and Cultural Industry: Occupational, Skills and
Productivity Forecasting

44
3. Current Skills Needs
3.1 Overview
Overall the Creative Industries sector is in confident mood. It has grown at twice the
rate of the whole economy up until 2008 and contributed 5.6% of the UK‟s gross value
added in 2009. By 2017 employment growth in the sector is expected to have reached
40% from the total employed in 1997.120
It has also created jobs at twice the rate of the financial intermediation sector over the
same period. This is good news. And yet, as has been mentioned above, there are
many challenges.
In many parts of the Creative Industries sector digitisation is demanding ongoing
continuous professional development (CPD) across many parts of the Creative
Industries sector at higher rates than ever before. New entrants from education need to
be prepared for being in inter-disciplinary teams with a new emphasis on the fusion of
skills required in each new entrant in order for them to be able to create content across
multiple platforms. „Diagonal thinking‟ (i.e. those able to think creatively and practically)
are the skills requirements of the day. Individuals need to be more entrepreneurial,
understand how to monetise IP from digital and other content and show forward
thinking leadership and management skills. The need for increased levels of diversity
as a business driver will grow in the future since content needs to reflect the more
disaggregated and global marketplace.
Globalisation, the speed of disaggregation of supply chains and the need to compete
on price and quality represent major challenges for textiles for example.
In other parts of the sector it is a lack of management and leadership skills that may
slow expansion along with the shape and size of the businesses in many parts of the
Creative Industries Sector. A long tail of micro businesses imposes an external labour
market dynamic on the sector which requires somewhat different policy responses for
example. Nor is there as yet any evidence of a major merger strategy emerging across
the Creative Industries sector where economies of scale and a reservoir of crossover
skills can be developed.
120
Working Futures (2007-2017) (2008) SC/IER/CE electronic resource. Please note that the Working Futures projections are based on a model that uses official Government data sources so they do not include facilities, interactive content, Content for Computer Games, freelancers between jobs (LFS) or any freelancers at all (ABI). As such they are likely to be highly conservative estimates of growth.

45
There are too many reported barriers to learning and development from employers and
employees and freelancers alike. While FE/HE integration with the sector‟s employers
has some way still to develop so that new entrants leave colleges and universities
more „job ready‟ than they presently seem to be.
Finally too many employers are training in inappropriate occupational areas, they lack
time and money to invest in developing their staff, and too often there is a mismatch
between the skills employers want and the skills potential recruits actually have.
3.2 Skills Shortages
Most areas of the Creative Industries have long been characterised by an oversupply
of potential new entrants. One result of this, as has already been noted, has been a
high level of voluntary or unpaid working, with nearly half the workforce in Creative
Industries reporting having worked unpaid in order to get into the industry.121 While the
mismatch of applicants‟ skills to the needs of the job is a common issue, and
experience in work is often given a much greater priority than academic qualifications.
Fashion and Textiles however report that 59% of UK employers in that sector were
anticipating skills shortages when they seek to recruit in the future122.
Across the Creative Industries, skills in short supply from new entrants include sales
and marketing skills, multi-skilling, using software packages such as Photoshop, Avid
and Final Cut Pro, pattern cutting and grading, textile technologists, supervisors, and
generally across associate and professional occupations in areas such as Crafts,
Performing Arts, Visual Arts, Design etc.123
3.3 Skills Gaps
On the whole across the Creative Industries sector skills gaps are intensifying. This is
in part due to the speed of digital change being enjoyed by most employers. The stock
of workers currently employed often do not have the adaptability and investment in
development technological change demands. In Fashion and Textiles only 16% of
121
Skillset (2008) Creative Industries Workforce Survey. Excludes Film Production, Photo Imaging, Publishing and Advertising. 122
Fashion and Textiles Employer Survey 2008
123 Skillset (2010) Creative Media Employer Survey. Excludes Advertising; Fashion and Textiles Survey of
Employers 2008; Creative and Cultural Skills (2009) Workforce Survey

46
establishments have recently reported skills gaps124. Whereas in other areas such as
those organisations within the footprint of CCSkills 37% of employers are reporting
skills gaps. The most commonly cited skills gaps across the sector include software
development and ICT; management and leadership, customer facing skills, marketing
and business development, technical and craft specific skills.125
Reasons cited for skills gaps included the lack of experience of recently recruited staff,
a failure to train and develop staff, an inability of the workforce to keep up with change,
poor management and leadership.126
Thirteen per cent of employers in the combined creative footprint of Skillset and
CCSkills in England reported skills gaps in their establishments. The skills gaps cited
most by employers were technical, practical or job-specific skills (63%), customer
handling skills (44%), problem-solving skills (43%) and management skills (40%). The
most frequently reported impact of skills gaps was the increased workload for other
staff (61%). Two thirds of employers (68%) forecasted that technical, practical or job-
specific skills will need improving or updating in the next 12 months. 127
Taking Skillset‟s 2010 Employer Survey as evidence, skills gaps have some fairly
major impacts on businesses. These include delaying the development of new
products/services (63% of employers), causing companies to outsource work they
would prefer to keep in-house (48%), increasing operating costs (47%) and the actual
loss of business to competitors (43%). However, seven in ten of employers in this
survey have taken actions to address the skills gaps they‟re experiencing. The actions
most commonly taken by employers are skilling up the existing workforce (69% of
employers) and increasing/expanding trainee programmes (54%).128
Whereas for those businesses in the footprint of CCSkills the implications of skills
shortages and skills gaps are well illustrated in Table 8 below:
124
Fashion and Textiles Employer Survey 2008
125 Skillset (2010) Creative Media Employer Survey. Excludes Advertising; Fashion and Textiles Survey of
Employers 2008; Creative and Cultural Skills (2009) Workforce Survey 126
Ibid 127
NESS 2009. The figures represent an analysis of data by the Standard Industrial Classification (SIC)
codes contracted to Skillset and CCSkills by the UKCES. Exclusions apply - see Annex A for methodology.
128 Skillset (2010) Creative Media Employer Survey. Excludes Advertising;

47
Table 8: Consequences of skills shortages and gaps for Creative and Cultural businesses
Skills shortages Skills gaps
Lost business 10% 26%
Increased workload for others 45% 18%
Delays to developing new products or services 22% 14%
More work is outsourced 9% 12%
Other 15% 12%
Turned away business 26% 12%
Increased operating costs 7% 8%
Difficulties introducing new working practices 14% 7%
Difficulties meeting quality standards 15% 7%
Creative & Cultural Skills. (2009). Creative and Cultural Industries Workforce Survey
Thirty-seven percent of businesses in the Creative and Cultural industries identify skills
gaps in their current workforce129. These issues are exacerbated by the small business
structure in the industry. In many cases, one or two individuals are required to perform
a variety of different roles in the organisation, such as fundraising and programming,
for example. Many employees take on management and business-related
responsibilities, which are not in their areas of expertise.
As such, administration skills suffer from as much of a skills gap as technical skills.
Creative and Cultural businesses experience skills gaps due to staff lacking
experience, no time for training and/or a limited budget, while only 7% say that their
skills gaps were caused by the limited availability of relevant training; the issue is not
how the Creative and Cultural industries workforce can fill their skills gaps, but how
they can find time for, and finance, training.
Skills gaps identified by employers suggest the need for a more professional approach
to training delivery in the Creative and Cultural industries. Traditionally, Government
investment is targeted primarily at further and higher education and at support to
acquire additional vocational qualifications.
However, employers report a number of barriers stopping them from offering adequate
training to their staff. A common issue in training provision is the lack of available time
129
Creative & Cultural Skills (2009) Creative and Cultural Industries Workforce Survey

48
or a lack of funds available. Many Creative and Cultural organisations also feel that
their staff are already fully proficient and are in no need of continuing professional
development (CPD) – indicating that they may not be thinking sufficiently about future
skills issues130.
The consequence of a potential workforce that is highly qualified but skills deficient is
that businesses and employees already in the industry, as well as those wanting to
enter it, require re-skilling in specific areas to be adequately prepared for work (and
thus to increase productivity). Funding for Level 3 or 4 qualifications for those who
already hold equivalent qualifications is not always possible. As a result, the cost of
such training falls either on the individual or their employer.
The continued availability of finance to support investment in skills is vital in the
Creative and Cultural industries, where 94% of organisations are micro-businesses131,
but ensuring that sufficient finance mechanism are in place to support all aspects of the
business can be challenging. The vast majority of businesses (94%) have neither an
internal training budget nor any record of accessing external training funding (89%)132.
Almost three quarters of businesses (73%) say that their turnover has either stayed the
same or declined during the previous two years133. Despite this, when training does
occur, 42% of Creative and Cultural businesses fully fund it.
Only 11% of Creative and Cultural businesses have accessed public funding134. Nearly
a third of businesses in the industry do not do so because they are not sure how to
apply, and nearly one in five do not believe that they are even eligible.
3.4 Skills Supply: The External Versus the Internal Labour
Market Conundrum
Perhaps the most interesting facet of the Creative Industries sector is the fact that it is
so atypical of the general labour market with its heavy reliance on freelancers. Most of
the last century our economy has been dominated by employment rather than self-
employment.135 This leads many observers to conclude that such an atypical situation
is in need of correction in order to conform with the mainstream. Yet this is to miss the
130
Creative & Cultural Skills (2009) Creative and Cultural Industries Workforce Survey 131
Creative & Cultural Skills (2011) Creative and Cultural Industries: Impact and Footprint 2010/11 132
Creative & Cultural Skills (2009) Creative and Cultural Industries Workforce Survey 133
Ibid. 134
Ibid
135www.emeraldinsight.com/Insight/viewContentItem.do?contentType=Article&hdAction=lnkhtml&contentId
=872020

49
point about the unique dynamics of the sector with its concentration of small
organisations and sole traders. The industrial structures and institutions have not
emerged in many of the sub-sectors to support organisational labour markets of the
kind that typify many other sectors. This is because of the nature of the project based
work on offer across the sector and the need to keep overheads low and margins
sharp.
Intrinsically this type of external labour market has many advantages to employers –
flexibility, adaptability, the speed of matching skills to task, lower fixed costs, and lower
management costs. These vibrant external labour markets are a source of competitive
strength to the sector, which need to be enhanced in such a way that some of the
downsides for individual contractors are minimised. For example some academics
have described the evolution of the Creative Industries‟ labour markets as being like
the introduction of a „tournament‟ culture to these industries.136 In short this means that
aspiring entrants compete with each other for no, or little, financial reward in order to
gain network and social capital that will enable them to join their chosen profession and
be paid for their skills.
People who work in the Creative Industries quickly accommodate to the higher levels of
labour market insecurity their chosen professions lead to. In these industries you are
often only as good as your last commission which is why awards are such an important
element in badging and branding quality and success - perhaps far more than
qualifications in some parts of the sector. They assume that their external labour
market situation is the norm, not the exception, and embrace the fact that their external
or secondary labour market is in fact - for them - a primary labour market. Adaptability
is a key aptitude of the Creative Industries worker.
It should be noted that this is not entirely true for all sub-sectors of Creative Industries.
Sectors such as Cultural Heritage, Textiles, Publishing and Archives have more
traditional internal labour market routes for progression.
3.4.1 Skills Supply: the Education System
Eight in ten employers (81%) in the combined creative footprints of Skillset and
CCSkills in England who had recruited new graduates from Higher Education in the
past year perceived them as being well prepared for work; a similar figure to employers
generally in England (84%).
136
Guile, D (2009) Learning to work in the Creative and Cultural sector: new spaces, pedagogies and expertise

50
Employer perception of how prepared education leavers have been for work 137
66%
75%
28%
19%15%
81%
16 year old school
leavers
17-18 year old
school/college
leavers
Under 24 year old
university/higher
education leavers
Well/ very well
Poorly/ very poorly
With the notable exception of Fashion and Textiles the sector as a whole is
characterised by high levels of level 4 and above qualifications. Around 60% of people
employed in the Creative Media sector have level 4 and above qualifications.
Similarly, 54% of the workforce in the combined creative footprint of Skillset and
CCSkills are qualified to NQF Level 4 as illustrated in Table 2.1.
Highest qualification held – combined creative footprint 138
Highest qualification held
Combined
footprint
NQF Level 4 and above 54%
NQF Level 3 12%
Trade Apprenticeships 3%
NQF Level 2 12%
Below NQF Level 2 8%
Other qualifications 6%
No qualifications 5%
Total 100%
Source: LFS (Jul 2009 - Jun 2010). The figures represent Standard Industrial Classification (SIC) codes contracted to Skillset and CCSkills by the UKCES. Exclusions apply - see Annex A for methodology.
137
NESS 2009. The figures represent an analysis of data by the Standard Industrial Classification (SIC)
codes contracted to Skillset and CCSkills by the UKCES. Exclusions apply - see Annex A for methodology.
138 LFS (Jul 2009 - Jun 2010). The figures represent Standard Industrial Classification (SIC) codes
contracted to Skillset and CCSkills by the UKCES. Exclusions apply - see Annex A for methodology.

51
Demand for highly skilled and well qualified workers emerging from the Further and
Higher Education systems is evident. But so too is a degree of scepticism reported
from employers as to the relevance of the content of many FE and HE courses. This is
why Skillset academies and CCSkills National Skills Academy, for example, seem to be
faring better in terms of the employability of their graduates into sector relevant jobs
when compared with many other education providers. The „fit‟ between course and
what might be expected in the workplace is tighter. Employers are thus more confident
about what they will get from these institutions and courses.
For example just over a quarter (26.2%) of all Skillset Accredited Course students who
find employment 6 months after graduating find work in Skillset relevant industries
(industries that Skillset has a sole contracted responsibility for). This is over 2.5 times
the 10% of students on all Skillset relevant courses who find employment 6 months
after their course in Skillset industries. Furthermore, almost a third (32.8%) of
accredited course students find employment in all Skillset relevant industries 6 months
after graduating (e.g. those industries that Skillset has sole responsibility for and those
it shares with other SSCs) almost twice the 17.7% of students from Skillset relevant
courses.139
In addition, of the Creative Industries employers that had used Skillset‟s learning and
development services, including Skillset Academies and accredited courses, 74%
stated it had made their company more productive and/or competitive.140
An important step change has been that the Media and Film Academy Network are
offering not only entry level type programmes at Foundation Degree and
undergraduate level, but also short courses and CPD for experienced professionals
with a wider range of business development and applied research programmes.
It is self evident that a range of relevant occupational and prioritised vocational
qualifications should be accessible to meet the current and future needs of employers
across the sector. Just as Skillset has been developing approaches to ensure this
happens so too Creative & Cultural Skills has been developing approaches that ensure
that employers across their footprint have a strong say in which qualifications should be
developed and in influencing the content of occupational qualifications. The key
activities being undertaken to achieve this include:
139
DLHE Survey, HESA 2007/08 from Skillset/Research As Evidence (October, 2010) Mapping Creative Industries and Fashion & Textiles Relevant Education and Learning and development Provision in FE, HE, and the Private Sector in the UK. 140
Skillset (2010) Creative Media Employer Survey. Excludes Advertising.

52
The development of new National Occupational Standards (NOS),
Apprenticeship pathways and qualifications for new occupational areas in
response to industry demand
The piloting of new Apprenticeships in other sectors and at higher levels based
on need
The continuation of close partnership work with the National Skills Academy, as
a key delivery partner for our Apprenticeships programme. Through the
Apprenticeship Training Service offered by the NSA, CCSkills are in a position
to broker new relationships with employers and partners and support the take
up of Apprentices in the sector
Further consultation on different elements of the Sector Qualifications Strategy
as required by the sector
The development of Creative Choices for information advice and guidance
regarding the industry and Apprenticeships across the footprint.
As a consequence employers are becoming much keener to promote greater uptake of
Sector Skills Council backed courses and accreditation services, which identify
provision that best meet industry needs. For example Foundation degrees have
already proved to be a success in enabling better access to careers due largely to the
work placement element of the course. This helps foundation degree takers to gain a
foothold in the industry and build up much-needed social capital at an early stage in
their careers.
Barriers remain in creating cross-disciplinary pathways in education that would add
significant value for the Creative Industries. To support progression there is a need to
bring students together across disciplines to collaborate, innovate and pursue new
research and development. Industry needs to be more engaged with Higher Education
to help shape provision, support delivery and provide work experiences that enable
graduates to become more work ready.
In the school system and at FE and HE institutions there are significant issues with
careers advice. Students generally are not receiving high quality advice to help them
understand the opportunities across the digital and other creative and cultural sectors
and make appropriate subject choices. Too many careers‟ advisors have only a shady
knowledge of how to advise students interested in a career in the Creative Industries.
The degree of network capital required to enter many of the professions is also a
handicap. Changes to the funding of higher education will mean that there is greater
need for information, advice and guidance for individuals entering the sector. There is

53
currently an over-supply of graduates with arts degrees aspiring to get jobs in the
Creative and Cultural industries. Despite this over-supply, employers say that the
majority of graduates lack the relevant skills for work. The need for improved advice
that is tailored to the sector is vital.
In terms of solving these skills blockages, there are two areas that need to be
considered; firstly, how the higher education system can better align itself with the
needs of employers in the Creative Industries, and, secondly, how the industries
themselves can access structured and appropriate continuing professional
development.
It is vital that industry works closely with higher education institutions, especially given
the high number of graduates within the sector. In those areas that are particularly
relevant to the Creative and Cultural sectors, universities should be encouraged to
equip students to gain employment in the industry. This is particularly true of specialist
schools which directly feed the industry (including drama and dance schools, music
conservatoires and specialist craft colleges, as well as universities offering specialist
courses such as creative writing, arts management and museum studies).
In order to achieve this, the following practical solutions can be utilised:
Increase the number of high-quality industry work placements for students;
Facilitate industry exchanges and professional development for tutors; and
Encourage the Creative and Cultural industries to support and endorse high-
quality courses.
Support for the Creative and Cultural industries to access continuous professional
development opportunities is also vital. The importance of CPD to the Creative and
Cultural industries should not be underestimated:
Employers say that training is often irrelevant, uncontextualised and difficult to
find;
10% of employers say they would provide more training if they knew where to
source it;
Government support for business and skills development is regularly untapped
by the Creative and Cultural industries who seldom engage with it; and
The current challenging economic climate, especially given that employers also
need to keep pace with changes in regulations and technology and to respond
proactively to new opportunities, exacerbates the need for training and support.

54
In the current climate business skills and the management of change are likely
to be essential elements.
The often informal and ad hoc nature of training in the Creative and Cultural industries
means that the quality and relevance of much of it is unknown. However, there is a
broad range of CPD resources, courses and training available in the market place, and
it is important that it is appropriately mapped to identify relevant provision, gaps and
mismatches with the industry.
Businesses in the Creative and Cultural industries have tended not to influence
provision in further and higher education. This is because the sector perceives the
development of higher education as being determined by student demand rather than
by employers‟ needs, meaning that they do not get involved in course provision.
A knock-on effect of this lack of alignment between the education system and the
Creative and Cultural industries is that the sector is less successful in benefiting from
funding for vocational qualifications, because their workforce tends already to be
qualified to a higher level than the average across the UK‟s workforce.
However, employers raise concerns that highly qualified graduates are not „job-ready‟
and need to acquire further skills, either on the job or through ongoing training
opportunities.
There is currently an over-supply of graduates with arts degrees aspiring to find
employment in the Creative and Cultural industries. Despite this over-supply,
employers say that the majority of graduates lack the relevant skills for work; proper
signposting of education, training and development opportunities is therefore vital.
Changes to the funding of the higher education system will mean that there is even
greater need for guidance for individuals planning their education and career paths.
The industry needs clear information, advice and guidance for individuals aspiring to
enter the sector. Creative Choices (www.creative-choices.co.uk) is an example of such
a bespoke industry-endorsed IAG tool.
In order to achieve this, the following practical solutions can be utilised:
The continued provision and signposting of relevant knowledge, tools and
support to potential and current employees and employers in the Creative and
Cultural industries; and
55
The use of sector-endorsed labour market information and industry intelligence
to help users make informed choices.
3.4.2 Skills Supply: Workforce Development
Demand for learning and development remains high in the Creative Industries. In
Skillset‟s 2010 Creative Industries Employer Survey employers reported software
packages such as Photoshop, Avid and Final Cut Pro, technical skills and sales and
marketing as the areas of learning and development most commonly completed by
their workforce.
One in two members of the workforce declared a current need for learning and
development. However, less than half of Creative Industries employers had funded or
arranged learning or development for their workforce in the past 12 months.141
Compared to employees, freelancers were more likely to need learning and
development (60%). A smaller proportion of freelancers in the Creative Media footprint
had undertaken learning and development (43% v. 65%) but those who did had
undertaken more (an average of 13 days v. 9 days).142
Barriers to learning and development are also a challenge for the Creative Industries.
Reported barriers or obstacles to learning and development include, fees are too high,
employers were unwilling to pay for learning and development, difficulty in assessing
the quality of courses, proximity of learning and development provider; lack of formal
requirements for CPD in some professions such as Performing Arts or Music for
example; and lack of time/cost to the business of staff being away being developed.
There were considerable differences between the experiences of employees and
freelancers. A far higher proportion of freelancers than employees reported virtually
every type of barrier.
Skillset‟s Creative Media Employer Survey 2010 investigated the usage of
apprenticeships, graduate internships and work placements/work experience posts.
Less than one in ten Creative Media Industries employers offer apprenticeships (9%)
though half would consider doing so in the future. This is a clear priority area for the
Coalition Government and more resources are being invested in developing
141
Skillset (2010) Creative Media Employer Survey. Excludes Advertising.; Creative and Cultural Skills (2009) Workforce Survey 142
Skillset (2008) Creative Industries Workforce Survey. Excludes Film Production, Photo Imaging, Publishing and Advertising.

56
apprenticeship approaches.143 The proportion of employers that offer apprenticeships
ranges from 24% in Film Distribution and Exhibition to just 2% in Publishing of Journals
and Periodicals. This mirrors trends within the wider Film and Publishing sectors. The
occupations that employers most frequently have or would consider offering
apprenticeships in are art and design (18%), camera/photography (16%), technical
development (15%) and distribution, sales and marketing (15%).144
Graduate internships were twice as likely as apprenticeships to be offered by Creative
Media Industries employers (18%). In addition, another 36% would consider offering an
internship. A significantly higher proportion of employers than average within Other
Content Creation (44%) and Film Production (43%) offer graduate internships.145
Although many Creative and Cultural businesses in CCSkills footprint have made use
of training advice and accreditation schemes, only 39% of businesses engaged in
training for staff in 2008/9146. In fact, the percentage of those arranging training for staff
has steadily declined over the last seven years147. This may reflect the fact that there
are few inbuilt requirements in the sector for employees to update their practice or to
acquire and develop formal qualifications.
A lower percentage of employers in the combined creative footprint of Skillset and
CCSkills in England report that they formally assess their employees‟ skills gaps (47%)
compared to employers in all sectors (57%). Reported provision of both on-the-job and
off-the-job training is also lower among employers in the combined footprint compared
to other sectors. 148
Training provision for staff Combined
footprint
All
Sectors
Formally assesses whether individual employees have gaps in their skills
47% 57%
Has funded or arranged any off-the-job training for staff over past 12 months
40% 51%
Has funded or arranged any on-the-job training for staff over past 12 months
46% 55%
143
www.hm-treasury.gov.uk/spend_sr2010_speech.htm 144
Skillset (2010) Creative Media Employer Survey. Excludes Advertising 145
Ibid 146
Creative & Cultural Skills (2009) Creative and Cultural Industries Workforce Survey 147
UKCES (2010) Employment and Skills Almanac 148
NESS 2009. The figures represent an analysis of data by the Standard Industrial Classification (SIC)
codes contracted to Skillset and CCSkills by the UKCES. Exclusions apply - see Annex A for methodology.

57
Employers report a number of barriers to offering their staff training (see table 9). A
common issue in training provision is lack of available time (cited by 27% of
businesses) or a lack of funds available (14%). Many Creative and Cultural
organisations (50%) also feel that their staff are already fully proficient and are in no
need of continuing professional development (CPD) –indicating that they may not be
thinking sufficiently about future skills issues149.
Table 9: Reasons for not training
Creative and Cultural
industries
Your staff are already fully proficient 50%
There is not enough time for training 27%
Other 24%
Your establishment lacks the funds for training 14%
No appropriate training is available in terms of
subject area
7%
There is a lack of cover for training 5%
Training is not considered to be a business priority 4%
Your staff are not keen to participate in training 1%
Training is available but not at the right level 1%
No suitable training is available in terms of mode
of delivery
1%
Creative & Cultural Skills. (2009). Creative and Cultural Industries Workforce Survey
3.4.3 Skills Supply: Diversity
A particular issue with the notable exception of Fashion and Textiles, in terms of skills
supply into the Creative Industries is the changing profile in terms of women and Black,
Asian and Minority Ethnic representation, which has fallen sharply in recent years in
some sub-sectors, along with an increase in people leaving the industries in their
thirties and forties.150
149
Creative & Cultural Skills (2009) Creative and Cultural Industries Workforce Survey 150
Skillset (2008) Creative Industries Workforce Survey; Skillset (2006) Balancing Children and Work in the Audio Visual Industries; Skillset (2005) Survey of the Audio Visual Industries‟ Workforce; Skillset (2003) Workforce Survey, Creative & Cultural Skills (2011) Creative and Cultural Impact and Footprint 2010/11.

58
3.5 Sub-Sectors
Television
Overview
Television is one of the major sectors within the Creative Industries. It comprises
Broadcast Television (Terrestrial and digital/satellite/cable), Independent Production,
Distribution and Video on demand, DVD, Interactive Television. Current estimates
suggest that around 50,000 people are employed across the sector in the UK.151 The
majority of jobs - around 43% - are in the Independent Production sub-sector while
Terrestrial Broadcast and Cable and Satellite respectively enjoy 31% and 25% of the
total.152
The Television sector comprises over 1,250 businesses (350 Broadcast TV and 850
Independent Production).153 The independent sector is made up of mainly small
companies (some 85% employ less than 50 people) though some companies operate
at scale.154
An estimated 34,000 people work in Broadcast TV in the UK.155 The BBC is the largest
employer and producer of the Public Service Broadcasters (PSBs). The Broadcast TV
industry comprises just over 350 businesses including the eight Terrestrial Broadcast
TV companies (BBC, ITV, Channel 4, Five, S4C, STV, UTV and Channel Television).
In addition to the main terrestrials there are over 300 digital, cable, satellite and
distribution companies. The current age of austerity has meant that all the public sector
broadcasters are under considerable pressure to cut budgets. The BBC has taken on
the funding of the World Service for example and S4C will come into its funding remit
from 2013. The government will cut S4C‟s funding by 94% over the next four years as
a consequence. While the BBC will see 16% cut from its budget over the next six years
as a consequence of these decisions.156
151
Skillset (2009) Employment Census 152
Ibid 153
Skillset 2010 Company Database (created from a variety of sources including previous research participants, Trade Association membership lists and Industry Directories). All figures have been verified with sector representatives. 154
Skills Review: A Skills Review for the TV and Radio Sector: A Report for Skillset, Ofcom and BTSR (May 2009). 155
Skillset (2009) Employment Census 156
www.bbc.co.uk/news/uk-politics-10924719

59
Broadcast TV, like the rest of the Creative Industries, is characterised by a much higher
proportion of freelance and short-term contract working than the economy as a whole.
Overall, 28% of the TV sector works freelance (though figures vary from 44% in
Independent Production to 11% in Cable and Satellite TV). The sector also draws on
the Facilities and Animation sector for support.157 The sector is highly qualified with
71% of workers holding a degree.158
Around two thirds of the TV industry (66%) is based in London, but there are creative
clusters in cities around the UK. The North West is the second largest centre of activity,
with 10% of the workforce, but there are both broadcasting and production companies
in Glasgow, Cardiff, Bristol, Birmingham, Leeds and Liverpool, among others.
A recent study carried out by NESTA maps the UK‟s creative clusters and shows that a
large number of „Television and Radio‟ (combined) firms are based around London,
Manchester, Bristol, and outside of England Cardiff and Glasgow. There is a significant
presence in the South West of London. On a more local level additional „creative
agglomerations‟ are concentrated in London and its surrounding areas (Wycombe and
Slough), Brighton, Bristol, Cardiff and the North of Wales and Scotland.159
A number of factors suggest a growing importance for the TV sector as an employer
within the Creative Industries. These include:
Developments in high definition, interactive and online television together with
professionally produced content which have strengthened the sector in the face of
pressure from user generated content;
Proliferation of digital TV channels providing an increasing market for the
independent production sector;
Regulatory and other commitments to increase output outside of London
including commitments by the BBC.
The development of local community television
The rise of 3DTV
157
Ibid 158
Skillset (2008) Creative Industries Workforce Survey 159
Creative clusters and innovation: Putting creativity on the map, NESTA, November 2010

60
Supply
In HE: 6,020 TV courses exist across the UK and these courses were being studied by
125,152 students in 2008/09. An above average proportion of these learners are
female (59%), whilst 10% are BAME and 14% had an identified disability. In 2008/09
40,193 individuals attained a TV related qualification (consisting of 7,423 Postgraduate,
27,504 first degrees, 1,382 foundation degrees and 3,883 other undergraduate
qualifications). 160
In FE: 756 courses exist in England that have learning aims that are in some way
relevant to the TV sector and these account for 312,448 learners in 2008/09 (second
only to Film in the Creative Industries). 45% of these learners are female, 14% are
BAME and 12% had an identified disability.161
In the private sector: Of the 25 providers supplying usable information regarding
provision to the TV sector a total of 560 courses were identified. These courses most
commonly covered Broadcast Journalism, TV Writing and Project Management
(specific to Management and Leadership). Specific skills covered commonly included
TV Pitching Skills, Creative Development and Post Production Workflows.
Demand for learning and development by the TV sector workforce according to
respondents to the Skillset 2008 Creative Industries Workforce Survey in the three
main sub-sectors remained high at more than 50% of respondents but down on the
more than 60% of 2005. The most requested subjects of learning and development
was in „editing‟ (11% of respondents), software specific to the industry (16%)
production (10%) and camera (8%).162
Approaching two-thirds (64%) of Television employers fund or arrange learning or
development for staff, compared to 47% of employers across the Creative Industries.163
There was slight variation between TV Broadcasters (including Terrestrial, Cable &
Satellite and Distributors - 69%) and TV Production companies (60%). Three quarters
160
Figures from HESA 2008/09 quoted in Skillset/Research As Evidence (October, 2010) Mapping Creative Industries and Fashion & Textiles Relevant Education and Training Provision in FE, HE, and the Private Sector in the UK. Further information regarding this study can be found in the methodology section. 161
Figures from Individual Learner Record (ILR) 2008/09 for England only quoted in Skillset/Research As Evidence (October, 2010) Mapping Creative Industries and Fashion & Textiles Relevant Education and Training Provision in FE, HE, and the Private Sector in the UK. Further information regarding this study can be found in the methodology section. 162
Skillset (2008) Creative Industries Workforce Survey 163
Skillset (2010) Creative Media Employer Survey

61
(76%) of TV employers who use freelancers also extend learning and development
opportunities to them.164
A third (33%) of TV employers have a learning and development plan for the year
ahead (varying from 52% of TV Broadcasters to 23% of TV Production companies).
This is higher than the 18% of employers across the wider Creative Industries.165
Skills Shortages
A third (32%) of TV employers have current vacancies, and of these employers three in
ten (31%) report having hard to fill vacancies and hence skills shortages (varying from
22% of TV Broadcasters to 43% of TV Production companies). The TV average is
actually lower than the Creative Industries employer average of 46%.166 The
occupation in which these skills shortages exist most commonly is Production (for 38%
of TV employers).
TV employers also highlighted a number of skills that they found difficult to obtain in
applicants direct from education. Broad skills areas most commonly cited are
leadership and management (32%), creative talent (23%), sales and marketing (22%),
multi-skilling (20%) and skills in using software packages such as Photoshop, Avid and
Final Cut Pro (19%).167
Other evidence also highlights specific shortages in the following areas:
A shortage of skills in special effects generation (which is also a problem in the
context of the film sub-sector);
A shortage of leadership and management skills within independent production
companies cited as a learning and development need by 13% of the
workforce.168
A shortage in higher level business skills, including management and
leadership, amongst senior executives (e.g. in securing multi strand funding
packages and brand sponsorship for commercial TV projects);
A shortage in entrepreneurial skills (and confidence) both in terms of those
employed at various levels within the industry, and also amongst freelancers,
164
Ibid 165
Ibid 166
Ibid 167
Ibid 168
Skillset (2008) Creative Industries Workforce Survey

62
particularly freelancers who may have been forced to take this route as a result
of redundancy.169
A shortage of new graduates into the industry with the ability to develop strong
stories for Television drama, though journalistic skills remain well supplied.
Current Skills Gaps
A third (32%) of TV employers report a skills gap within their current workforce, with
little variation by sub-sector and only slightly higher than the Creative Industries
employer average (28%).170
More than half of TV employers highlighted leadership and management (53%), and
sales and marketing (53%) as broad areas in which skills gaps exist amongst
employees. Creative talent (40%), skills in using software packages such as
Photoshop, Avid and Final Cut Pro (32%) and technical skills (32%) were also
highlighted as skills gap areas by between three and four in ten TV employers. Within
the broad category of „technical skills‟ – editing, TV/video production, camera and
sound were the most common specific areas of skills gaps.
Amongst freelancers areas of skills gaps are very similar. TV employers most
frequently mentioned skills gaps relating to sales and marketing (36%), skills in using
software packages such as Photoshop, Avid and Final Cut Pro (32%), leadership and
management (30%), creative talent (29%) and technical skills (28%). Again camera,
sound and editing were the most frequently mentioned types of technical skills.
Skills gaps amongst their current workforce were most frequently associated with
strategic management (43%) and production (29%) roles for employees and production
(42%) roles for freelancers.171
Furthermore, other evidence direct from the workforce shows that:
Over half (55%) of the TV workforce had received some learning and development.
This varied from two thirds (64%) of the Broadcast TV workforce, to 53% of the
Cable and Satellite workforce and 48% of the Independent Production workforce.
169
Skills Review: A Skills Review for the TV and Radio Sector: A Report for Skillset, Ofcom and BTSR (May 2009) 170
Skillset (2010) Creative Media Employer Survey 171
Ibid

63
Two thirds (64%) of permanent employees working in the TV industry had received
some learning and development compared to just 37% of freelancers.172
On average the TV workforce received 5.1 days learning and development.
Individuals working in independent production received the greatest number of
days learning and development on average (5.5 days) compared with an average
of 4.9 days for both the cable and satellite and broadcast TV workforce.
Freelancers received an average of 3.7 days, compared to the 5.9 days received by
employees.173
The TV workforce were most likely to have received learning and development in
health and safety (19%), specific software applications (16%), editing (14%),
camera (11%), production (10%) and ethics/ safeguarding trust (9%).174
Future skills
Skillset‟s 2010 Creative Industries Employer Survey asked employers to identify any
potential future skills gaps. Interestingly TV employers predicted that there would be
gaps in a wide variety of broad skills areas: Technical skills (mentioned by 33% of TV
employers), skills to develop content for multiple platforms (30%), leadership and
management (30%), sales and marketing (28%), multi-skilling (28%), creative talent
(27%) and skills in using software packages such as Photoshop, Avid and Final Cut
Pro (27%).
Within the broad category of „technical skills‟, TV employers were most likely to
specifically mention editing (13%), TV/Video production (11%) and camera skills (7%).
Likewise within „skills to develop content for multiple platforms‟ there were a huge
variety of specific potential future skills gaps mentioned, the most common relating to
general computer skills (predicted by 9% of TV employers).
In terms of identifiable skill needs in the future, the main focus for the TV sub-sector
seems to be:
Programme innovation;
Deal structuring;
Cross media ownership;
172
Skillset (2008) Creative Industries Workforce Survey 173
Ibid 174
Ibid

64
IP issues;
Extended scheduling skills;
Diagonal skills of creativity and entrepreneurialism;
Multi-platform awareness.
The skills will be most needed in commissioning, scheduling, transmission and
distribution, followed by production and post production, and lastly concept
development. All skills will need to be applied across a variety of output platforms.175
The introduction of YouView next year is particularly likely to create related skills needs
around the production of content for multiple-platforms.176 Underpinning these skills
areas, high quality management skills will also increasingly be in demand, including:
Asset exploitation and management;
Risk management;
Project management;
Partnership and investor relation management;
Marketing and promotional management.
Finally, technical expertise will continue to be highly important as digitisation continues
to increase the technical content of the Creative Industries processes, products and
services.177
Film
Overview
Despite the shockwaves created by the demise of the UK Film Council, the Film sector
in the UK has much latent potential and is a repository of fine technical talent.
Indicative findings also suggest that the sector enjoys relatively strong levels of
workforce diversity: 43% of the Film Production workforce is female.178 This despite
the reportedly long hours and intensive culture associated with film - with 43% of the
175
Ibid 176 YouView is a partnership between the BBC, ITV, BT, Channel 4, Five, Arqiva and Talk Talk to develop a common interface for Internet Protocol Television (IPTV) in the UK. To be launched in 2011, YouView will attempt to replicate the success of Freeview for internet television. See www.youview.com 177
Skills Review: A Skills Review for the TV and Radio Sector: A Report for Skillset, Ofcom and BTSR (May 2009) 178
Skillset (2009) Employment Census, Skillset/UK Film Council (2008) Feature Film Production Workforce Survey.

65
sub-sector‟s workforce across the UK reporting that they worked between 11 and 12
hours a day.179 The sub-sector has a 6% representation of BAME groups across the
UK Film sector (4% in Film Production).180 Around 3% of the UK Film Production sub-
sector consider themselves to be disabled with 42% of these reportedly below 35 years
of age.181
The Film sector comprises over 500 businesses (250 Film Production, 150 Cinemas
and 100 Film Distribution).182 Employers report confidence across the sector and the
UK has an enviable position in the global market context in areas such as Facilities,
particularly VFX, acting talent, and technical skills such as camera, sound, lighting, set
design etc.
A recent study carried out by NESTA maps the UK‟s creative clusters and shows that a
large number of „Video, Film and Photography‟ firms are based in London, Manchester,
Birmingham, Brighton, Bristol and Glasgow. On a more local level additional „creative
agglomerations‟ are concentrated in London and its surrounding area (towards Oxford
and Guildford, as well as Slough and Wycombe), and Brighton, Bristol and Bath.183
2009 was the year cinema bucked the recession. UK cinema visits of 174 million made
2009 the second highest year for admissions since 1971, while the UK box office grew
to a record £944 million. 2009 was also an excellent year overall for film production in
the UK, with studios busy with inward investment films such as Harry Potter and the
Deathly Hallows, Robin Hood, Gulliver’s Travels and Clash of the Titans. The UK
spend of inward investment films reached £753 million, the highest on record, while the
total UK spend of £957 million was, after 2003, the second best year on record.
However, within this positive scene, domestic UK films had a tougher time, finding it
harder to raise money and lowering their budgets as a result. Co-productions have
been most affected by changes in the regulatory and economic environment. Only 22
were made in 2009, with a combined UK spend of £35 million.184
The nature of the Film Production sector raises concerns surrounding retention. The
Film Production sub-sector is characterised by very high levels of freelance working –
179
Although it might be surmised that the long hours are worked for blocks of time associated with film shoots, rather than on an ongoing basis. 180
Skillset (2009) Employment Census, Skillset/UK Film Council (2008) Feature Film Production Workforce Survey. 181
Ibid 182
Skillset 2010 Company Database (created from a variety of sources including previous research participants, Trade Association membership lists and Industry Directories). All figures have been verified with sector representatives. 183
Creative clusters and innovation: Putting creativity on the map, NESTA, November 2010 184
UK Film Council (2010) Statistical Yearbook

66
89% – suggesting a highly mobile workforce.185 Associated with this finding, 85% of
the surveyed UK Film Sector workforce stated that they had received no learning and
development over the previous year.186
Production occupations are most numerous; 24% of the workforce reportedly working
in this role. Similarly, 23% work in Art and Design and 10% in Camera/Photography
jobs roles giving rise to concerns that freelancing may be overly concentrated in these
sub-sectors.187
Supply
In HE: 6,414 Film courses exist across the UK and these courses were being studied
by 128,539 students in 2008/09. An above average proportion of these learners are
female (58%), whilst 10% are BAME and 14% had an identified disability. In 2008/09
41,328 individuals attained a Film related qualification (consisting of 7,261
Postgraduate, 28,911 first degrees, 1,400 foundation degrees and 3,755 other
undergraduate qualifications). 188
In FE: 757 courses exist in England that have learning aims that are in some way
relevant to the Film sector and these account for 318,988 learners in 2008/09 (the
highest of all Creative Industries sectors). 45% of these learners are female, 14% are
BAME and 12% had an identified disability.189
In the private sector: Of the 42 providers supplying usable information regarding
provision to the Film sector a total of 650 courses were identified. These courses most
commonly covered Cinematography, Film Music Copyright and Project Management
and Film Leadership Skill Development (specific to Management and Leadership).
Specific skills covered commonly included Design Skills for Art Directors, Adobe and
Apple Products and Film Archiving.
185
Skillset (2009) Employment Census, Skillset/UK Film Council (2008) Feature Film Production Workforce Survey. 186
Skillset/UK Film Council (2008) Feature Film Production Workforce Survey 187
Skillset (2009) Employment Census and Skillset/UK Film Council (2008) Feature Film Production Workforce Survey. Caution should be taking in drawing conclusions based on these findings due to sample sizes. 188
Figures from HESA 2008/09 quoted in Skillset/Research As Evidence (October, 2010) Mapping Creative Industries and Fashion & Textiles Relevant Education and Training Provision in FE, HE, and the Private Sector in the UK. Further information regarding this study can be found in the methodology section. 189
Figures from Individual Learner Record (ILR) 2008/09 for England only quoted in Skillset/Research As Evidence (October, 2010) Mapping Creative Industries and Fashion & Textiles Relevant Education and Training Provision in FE, HE, and the Private Sector in the UK. Further information regarding this study can be found in the methodology section.

67
Skills Shortages
Just 15% of Film employers in the UK reported having vacancies at the time of
Skillset‟s 2010 Creative Industries Employer Survey, and very few of these employers
had any hard to fill vacancies and hence skills shortages.190 Those that did have hard
to fill vacancies were mainly in Creative Development roles.
Film employers in England highlighted a number of skills that they found difficult to
obtain in applicants direct from education. Broad skills areas most commonly cited are
leadership and management (55%) and sales and marketing (35%).191
Data from the Skillset/UK Film Council Feature Film Production Workforce Survey 2008
revealed that First Aid/Health and Safety was the most frequently undertaken learning
and development in the UK Film Production sub-sector. 17% of the workforce
undertaking learning and development in the last 12 months received this type of
learning and development. Art/Design, Camera and construction were all undertaken
by 12% of those receiving some learning and development. Overall, freelancers
tended to undertake less learning and development than those permanently employed,
though much of this finding can be put down to regulatory/compliance and business
administration learning and development being mainly undertaken by permanent
workers. For specialist technical areas, the percentages trained were broadly similar.
Of the UK Film Production sector 52% stated they needed learning and development in
the future. Of these, 19% mentioned they were looking to up-skill on core business
skills – (including finance, leadership and management, marketing and management).
Interestingly, the percentage of freelancers requesting learning and development in
core business skills was much higher than the percentage that had recently received
learning and development in this area. Some 16% required learning and development
in art/design, 13% camera, 12% general computer/administration skills and 8%
technical skills in editing/post production/digital production/visual effects.192
190
Ibid 191
Ibid 192
Skillset (2008) Creative Industries Workforce Survey and Skillset/UK Film Council (2008) Feature Film Production Workforce Survey.

68
Current Skills Gaps
Over a third (38%) of Film employers report a skills gap within their current workforce,
which is higher than the English Creative Industries average (28%).193
More than half of Film employers highlighted sales and marketing (53%) an area in
which a skills gap exists amongst employees. Skills in using software packages such
as Photoshop, Avid and Final Cut Pro (43%) and business skills (particularly business
planning/strategy 41%) were also highlighted as skills gap areas. Similar skills gaps
were linked to the freelance workforce, with the addition of finance skills and multi-
skilling. 194
Skills gaps amongst their current workforce were most frequently associated with
business management roles for employees and production roles for freelancers.195
Approaching three fifths (59%) of Film employers fund or arrange learning or
development for staff, compared to 47% of employers across the Creative Industries.196
Approaching half (46%) of Film employers who use freelancers also extend learning
and development opportunities to them.197
A fifth (19%) of Film employers have a learning and development plan for the year
ahead (similar to the 18% of employers across the wider Creative Industries).198
Further research on skills gaps and shortages has revealed that current generic skill
needs in the context of the film sub-sector included:199
Negotiation and diplomacy (with colleagues and customers);
Management and leadership (for example, team motivation and conflict
resolution);
Commercial skills (commercial acumen, knowledge of the firm‟s value chain,
finance for non-finance managers);
High end production skills, particularly in areas outside London;
Story or narrative skills.
193
Skillset (2010) Creative Media Employer Survey 194
Ibid 195
Ibid 196
Ibid 197
Ibid 198
Ibid 199
Skillset (2009): Film Sector Employers Skills and Training Needs in Production, Distribution and Exhibition.

69
Moreover, current specialist skills needs include:200
Shortage of production accountants due to low pay relative to other sectors;
Development executives with insight and commercial acumen;
Location managers with up to date knowledge of legal developments;
Producers with commercial acumen;
Experienced crew spread throughout the UK;
Information Management (including market analysis) using ICT;
Business models for small businesses;
Film buyers with commercial insight from marketing or audience perspective;
Fundraising for small businesses;
Exploiting new business opportunities (corporate events and lets).
Future Skills
Skillset‟s 2010 Creative Industries Employer Survey asked employers to identify any
potential future skills gaps. Film employers predicted that there would be gaps in
relation to leadership and management (40%), finance skills (30%), sales and
marketing (30%) and skills to develop content for multiple platforms (28%, including
13% specifically mentioning digital broadcasting and digital projection).
To compete in the global market and maintain previous inward investment levels, a
highly skilled workforce is essential. As HD, digital and 3D technologies are introduced
production crew must be re-skilled to understand new work practices.
It is anticipated that future skill needs within film will centre on developments in new
digital technology.201 Specifically, this will require skills in change management and
exploiting opportunities such as online and digital sales as well as dealing with threats
such as file sharing. Respondents also noted the need to:
Keep up to date in camera technology;
Data management (particularly in relation to the logistics of tracking master
materials in digital format);
Health and safety (especially risk assessment by HoD and Producers);
Availability of construction and lighting crew (as a result of the Olympic Games
in 2012 likely to take up much of this capacity);
Management level learning and development around new business models
200
Ibid 201
Ibid

70
Radio
Overview
The Radio industry consists of around 750 organisations, independent stations and
other companies comprising BBC Radio, around 250 commercial radio groups and
independent stations, 400 community and voluntary radio stations and over 50
independent production companies for radio.202
The Radio industry is characterised by a small number of large radio groups and a
large number of smaller groups and independent stations. The BBC, Global Radio and
Bauer dominate the landscape of „traditional‟ larger businesses and between them now
account for a high proportion of the radio sector workforce. Current trends point
towards increasing listening through digital platforms, a shift in balance from public
service to commercial radio at national level, and growth of community radio. The
community sector contains a range of non-profit organisations offering radio services to
specific communities on a local level. It includes student radio, hospital radio and
British Forces Broadcasting Services.
A recent study carried out by NESTA maps the UK‟s creative clusters and shows that a
large number of „Television and Radio‟ (combined) firms are based around London,
Manchester, Bristol, and outside of England Cardiff and Glasgow. There is a significant
presence in the South West of London. On a more local level additional „creative
agglomerations‟ are concentrated in London and its surrounding areas (Wycombe and
Slough), Brighton, Bristol, Cardiff and the North of Wales and Scotland.203
The sector numbers 20,900 people204 and the employment profile shows somewhat
higher levels of diversity than that found in other parts of the Creative Industries sector,
with the second highest ratio of female workers (44%) of any sector. Though that falls
to just 30% in the independent sector. Representation from BAME groups is around
7%. Overall, just under a quarter (23%) of the workforce is freelance, but substantially
more amongst the 4,450 people working in the sector within the broadcast
management occupational group (62%).205
Key developments and trends in the UK Radio market include:
202
Skillset 2010 Company Database (created from a variety of sources including previous research participants, Trade Association membership lists and Industry Directories). All figures have been verified with sector representatives. 203
Creative clusters and innovation: Putting creativity on the map, NESTA, November 2010 204
Skillset (2009) Employment Census 205
Ibid
71
RAJAR (Radio Joint Audience Research Ltd) figures released for the first
quarter of 2010, show that radio listening is at an all time high, with the number
of listeners tuning into a Commercial Radio service increasing to over 32 million
weekly listeners - the highest figure since 2002. Commercial Radio‟s weekly
reach has increased quarter on quarter and year on year by almost 0.8m and
0.7m listeners respectively, with both national and local commercial radio
recording gains in the number of listeners tuning in.
Increased competition: across the UK with 9% more stations in the UK in 2008
than 2003.206
Increased use of Digital technology: Recommendations in Digital Britain report
are for an analogue to digital „migration' of the majority of radio services in the
UK by 2015.207 30% of UK households were thought to have DAB Digital radio
in 2008 compared to 2% in 2003.208
Increased demand for multi-platform output and content: A third of adults had
listened to radio online, according to the RAJAR internet and audio services
survey carried out in May 2009. This was up from 29% a year earlier and 24%
18 months ago.
All this points to future skills demand not only in relation to core roles - like sound and
broadcast engineering - but also, increasingly, in relation to digital technology and
multi-platform / multi-media content.
Supply
In HE: 3,266 Radio courses exist across the UK and these courses were being studied
by 60,564 students in 2008/09. An above average proportion of these learners are
female (51%), whilst 10% are BAME and 12% had an identified disability. In 2008/09
18,715 individuals attained a Radio related qualification (consisting of 3,437
Postgraduate, 12,785 first degrees, 477 foundation degrees and 2,045 other
undergraduate qualifications). 209
206
Ibid 207
Ibid 208
Ibid 209
Figures from HESA 2008/09 quoted in Skillset/Research As Evidence (October, 2010) Mapping Creative Industries and Fashion & Textiles Relevant Education and Training Provision in FE, HE, and the Private Sector in the UK. Further information regarding this study can be found in the methodology section.

72
In FE: 502 courses exist in England that have learning aims that are in some way
relevant to the Radio sector and these account for 208,566 learners in 2008/09. 23% of
these learners are female, 15% are BAME and 10% had an identified disability.210
In the private sector: Of the 11 providers supplying usable information regarding
provision to the Radio sector the courses most commonly covered were: Writing for
Radio and Compliance in a Radio Environment. Specific skills covered commonly
included Radio Post-Production and News and Speech in a Radio Environment.
Skills Shortages
A third (32%) of Radio employers have current vacancies, and of these employers 35%
report having hard to fill vacancies and hence skills shortages (lower than the Creative
Industries employer average of 46%).211 The occupations in which these skills
shortages exist most commonly are distribution, sales and marketing, editorial,
journalism and sport and performers.
Radio employers also highlighted a number of skills that they found difficult to obtain in
applicants direct from education. Broad skills areas most commonly cited are
leadership and management (33%), sales and marketing (32%), multi-skilling (27%)
and finance skills (23%).212
Other evidence indicates that craft skills remain a high priority for the sector especially
in the field of digital content. T-skills are in short supply with people who are technically
expert but also in possession of strong creative skills and communication skills such as
teamwork. Entrepreneurialism, management and general business acumen is still
lacking in much of the sector. In particular having managers who can coordinate many
functions and understand all of them. Finally sales and marketing skills are missing at a
sufficiently high level across much of the sector.213
210
Figures from Individual Learner Record (ILR) 2008/09 for England only quoted in Skillset/Research As Evidence (October, 2010) Mapping Creative Industries and Fashion & Textiles Relevant Education and Training Provision in FE, HE, and the Private Sector in the UK. Further information regarding this study can be found in the methodology section. 211
Skillset (2010) Creative Media Employer Survey 212
Ibid 213
Skills Review: A Skills Review for the TV and Radio Sector: A Report for Skillset, Ofcom and BTSR (May 2009)

73
Current Skills Gaps
A third (32%) of Radio employers report a skills gap within their current workforce,
higher than the English Creative Industries average (28%).214
More than half of Radio employers highlighted sales and marketing (60%) and
leadership and management (50%) as broad areas in which skills gaps exist amongst
employees. Finance skills (40%), business skills (35%), multi-skilling (33%) and
technical skills (33%) were also highlighted as skills gap areas. Amongst freelancers
skills gaps are very similar with the addition of production and technical skills (including
editing and sound). 215
Skills gaps amongst their current workforce were most frequently associated with
distribution, sales and marketing roles for both employees and freelancers.216
Over two-thirds (68%) of Radio employers fund or arrange learning or development for
staff (varying from 77% of those in Broadcast Radio to 59% in Community/Voluntary
Radio), compared to 63% across all Creative Industries employers. Over four fifths
(83%) of Radio employers who use freelancers also extend learning and development
opportunities to them.217
Four fifths (39%) of Radio employers have a learning and development plan for the
year ahead (much higher than the 18% of employers across the wider Creative
Industries).218
Overall, 51% of the UK Radio workforce were thought to have unmet learning and
development needs. Areas of training most commonly cited by the Radio workforce are
production (18%), journalism/presenting (15%), management and leadership (14%),
on-line/web design/interactive media/electronic games (12%), editing (11%) and
specific software (11%).219
Future Skills
Skillset‟s 2010 Creative Industries Employer Survey asked employers to identify any
potential future skills gaps. The most common future skills gap predicted by Radio
214
Skillset (2010) Creative Media Employer Survey 215
Ibid 216
Ibid 217
Ibid 218
Ibid 219
Skillset (2080) Creative Industries Workforce Survey

74
employers in England is sales and marketing (mentioned by 40% of employers).
Leadership and management (30%), multi-skilling (28%), creative talent (25%), skills to
develop content for multiple platforms (24%) and production skills (22%) were also
common.
Within „skills to develop content for multiple platforms‟ there were a huge variety of
specific potential future skills gaps mentioned, the most common relating to „online and
social media publishing or content distribution‟ and „design and development of web
sites or web applications (both predicted by 7% of Radio employers in England).
Animation
Overview
The Animation sector employs around 4,300 people of which 46% are freelance, 19%
female and only 2% from a BAME background.220 The animation workforce has
healthy clusters in Wales and Scotland (9% and 12% respectively of the total UK
workforce) and 20% are in London.221
There are in excess of 600 Animation businesses in the UK.222 The vast majority with
fewer than 50 staff.
Whilst many will think of Aardman Animation as being the quintessential British
Animation company (Wallace and Gromit, Sean the Sheep), Animation underpins many
other sectors of the Creative Industries – hundreds of animators work in VFX
companies such as Double Negative, Framestore and MPC within the square mile of
Soho; or within large Content for Computer Games companies across the UK223.
However, the sector‟s reliance on other Creative Industries such as Television, VFX
and Games, means it is susceptible to changes in those Industries. Furthermore, the
UK sector is seeing competition from low cost but increasingly highly quality producing
220
Skillset (2009) Employment Census 221
Ibid 222
Skillset 2010 Company Database (created from a variety of sources including previous research participants, Trade Association membership lists and Industry Directories). All figures have been verified with sector representatives. 223
For the most current data on skills within VFX and Computer Games sectors please refer to the
forthcoming Livingstone/Nesta review due for publication in January 2011 to which Skillset and e-Skills
have contributed.

75
international competitors from countries such as China, Korea and Singapore and from
tax-friendly regimes in other countries, notably Canada.224
Nevertheless, 2009 was a good year for the UK Animation Industry with 191 hours of
Animation worth £102m produced (or co-produced) by British Companies, more than
any year since Screen Digest started monitoring. The UK was behind the US (330
hours), Canada (382) and France (259), but unlike these, saw a rise from the previous
year.225
Growth in computer generated animation has opened up new markets but the need for
novelty and innovation has led to a revisitation of stop frame animation (Fantastic Mr
Fox and Tim Burton‟s Frankenweenie both shot in the UK). However, falling
advertising revenues for children‟s programmes – linked to new restrictions on
advertising to children – have seen a reduced number of broadcasting commissions for
animation.226 Indeed animation productions made in the UK have more than halved in
the last five years.227
We can see two levels of skills – core and specialist – intertwined within today‟s
Animation companies.
There is the creativity, inventiveness and innovation of small companies supplying the
Broadcast and Advertising Industries and harnessing new cross-platform opportunities
and exploiting European markets. Companies like Blue Zoo, Passion Pictures and
Studio AKA compete in a global market with music promos, commercials and TV
idents, built on a bedrock of traditional art skills. Whilst relatively small in terms of
employees they represent and feed a strategically important industry for the UK - that
of Advertising.
Secondly, there are the larger Film-centred companies, such as Aardman, Framestore
and Double Negative. The modern Animation company is as much about pipelines and
efficient workflows as it is about animation craft.
This is all giving rise to demands for a highly skilled, specialist but flexible workforce.
Increased outsourcing is also likely to reduce the demand for animators and increase
the demand for pre-production artists, producers and technical directors. The need for
technical skills such as software development and core business skills such as client
224
http://news.bbc.co.uk/1/hi/entertainment/8225954.stm 225
Screen Digest figures reported in „The Global Animation Industry: facts and stats‟ in IMAGINE Nov/Dec 2009 226
Ofcom and PACT 227
http://news.bbc.co.uk/1/hi/entertainment/8225954.stm

76
liaison e.g. working with clients to develop briefs, financial management and marketing
are also likely to continue to grow, especially as Television commissions for higher cost
productions are being constrained by ever tighter budgets.228
Supply
In HE: 1,049 Animation courses exist across the UK and these courses were being
studied by 22,789 students in 2008/09. Approaching half (48%) of these learners are
female, whilst 13% are BAME and 15% had an identified disability. In 2008/09 16,578
individuals attained an Animation related qualification (consisting of 2,827
Postgraduate, 11,966 first degrees, 425 foundation degrees and 1,357 other
undergraduate qualifications).229
In FE: 57 courses exist in England that have learning aims that are in some way
relevant to the Animation sector and these account for 2,341 learners in 2008/09. 52%
of these learners are female, 18% are BAME and 14% had an identified disability.230
In the private sector: Of the 11 providers supplying usable information regarding
provision to the Animation sector a total of 55 courses were identified. These courses
most commonly covered 2D/3D Animation, Stop Motion and Computer
Cinematography. Specific skills covered commonly included Adobe After Effects Suite,
Software skills – Maya, XSi, cinema 4D, Special effects compositing and Newtek light
wave and 3D shadow max.
Skills Shortages
A fifth (21%) of Animation employers reported having vacancies at the time of Skillset‟s
2010 Creative Industries Employer Survey, and around half (51%) of these employers
had hard to fill vacancies and hence skills shortages.231 Those that did have hard to fill
vacancies were mainly in Animator, Art & Design, Creative Development and Business
Management roles.
228
Skillset (2009) Employment Census; www.otakunews.com/article.php?story=1548
229 Figures from HESA 2008/09 quoted in Skillset/Research As Evidence (October, 2010) Mapping
Creative Industries and Fashion & Textiles Relevant Education and Training Provision in FE, HE, and the Private Sector in the UK. Further information regarding this study can be found in the methodology section. 230
Figures from Individual Learner Record (ILR) 2008/09 for England only quoted in Skillset/Research As Evidence (October, 2010) Mapping Creative Industries and Fashion & Textiles Relevant Education and Training Provision in FE, HE, and the Private Sector in the UK. Further information regarding this study can be found in the methodology section. 231
Skillset (2010) Creative Media Employer Survey

77
Animation employers also highlighted a number of skills that they found difficult to
obtain in applicants direct from education. Broad areas most commonly cited are skills
in using software packages such as Photoshop, Avid and Final Cut Pro (27%), multi-
skilling (25%), finance (24%), leadership and management (23%) and sales and
marketing (21%).232
In addition, there is some indicative evidence of recruitment difficulties (though not
necessarily skill shortages) in respect of producer roles, and at assistant producer level
as with Television and Radio.233
Current Skills Gaps
Three in ten (30%) Animation employers report a skills gap within their current
workforce, slightly higher than the Creative Industries average (28%).234
Animation employers highlighted a wide variety of areas in which skills gaps exist
amongst employees: most commonly technical skills (mainly CGI:
3D/Animation/VFX/Graphic design and computer usage), skills in using software
packages such as Photoshop, Avid and Final Cut Pro, multi-skilling, sales and
marketing, skills to develop content for multiple platforms (particularly the design and
creation of digital content and web sites or web applications), production skills
(particularly production management) and business skills (particularly commercial
awareness and pitching, presentation and proposal writing). Amongst freelancers
creative talent, multi-skilling and skills to develop content for multiple platforms (mainly
knowledge of new technology and platforms) were the most common skill gaps.
Skills gaps amongst their current workforce were most frequently associated with
strategic management and animator roles for employees and animator roles for
freelancers.235
44% of Animation employers fund or arrange learning or development for staff, slightly
less than the 47% across all Creative Industries employers. Three quarters (73%) of
232
Ibid 233
Skillset (2008) Creative Industries Workforce Survey; Skillset (2005) Survey of the Audio Visual Industries‟ Workforce 234
Skillset (2010) Creative Media Employer Survey 235
Ibid

78
Animation employers who use freelancers also extend learning and development
opportunities to them.236
Just 14% of Animation employers have a learning and development plan for the year
ahead (lower than the 18% of employers across the wider Creative Industries).237
More than seven in ten (71%) of the Animation workforce stated they need learning
and development. Some 47% of the sector had received learning and development in
the last year with 37 days per head received. This is nearly twice as much per head as
the next sector and indicates what a resource intense industry Animation is. More than
50% of learning and development fees were paid by the employer and 99% of those
trained found the learning and development of direct benefit. Over 65% of those
employed in the sector are seeking learning and development in areas identified as
needed by the sector. While the major barrier to learning and development is the cost
involved.238
Future Skills
Skillset‟s 2010 Creative Industries Employer Survey asked employers to identify any
potential future skills gaps. Interestingly Animation employers predicted that there
would be gaps in a wide variety of broad skills areas: Technical skills including CGI:
3D/Animation/VFX/Graphic design (mentioned by 31% of employers), skills in using
software packages such as Photoshop, Avid and Final Cut Pro (30%), business skills
(particularly entrepreneurial skills, 29%), sales and marketing (26%), skills to develop
content for multiple platforms (22%) and creative talent (22%).239
We are also on the edge of huge demand for Stereo 3D skills (although these are of a
different order and type to Film Cinematographic Stereo 3D skills, since the 3D can be
applied retrospectively to any CGI file). Also skills in Nuke software are in demand.240
236
Ibid 237
Ibid 238
Skillset (2008) Creative Industries Workforce Survey 239
Skillset (2010) Creative Media Employer Survey 240
Skillset‟s employer and stakeholder qualitative framework 2010

79
Facilities
Overview
The Facilities sector provides specialised technical equipment and services to every
other audio visual sector. Key roles include Post Production, Studio and Equipment
Hire, Outside Broadcast, Visual Effects241, Special Physical Effects, Manufacture of
Equipment, Processing Laboratories and Other Services for Film and Television.
Overall UK wide estimates point to a workforce of around 43,000 people.242 Nearly
30% of the total work as freelancers (rising to 44% in Studio and Equipment Hire, 42%
in Other Services for Film and Television and 40% in Outside Broadcast) and the
Facilities workforce has just 26% female representation. Though Processing
Laboratories at 46% and Special Physical Effects and the Manufacture of AV
Equipment at 36% and 34% respectively are considerably higher. While Post
Production at 12%, Outside Broadcast at 9% and Visual FX at 19% are lower. There is
also 7% representation from BAME groups overall with a high of 17% in Processing
Laboratories and a low of 3% in Outside Broadcast.243 Though caveats should be
made around the relatively small sample sizes in the census in the outside broadcast
sub-sector.
It is important to understand that the VFX sector (most of which is in the square mile of
Soho) is not only the largest VFX industry for US Film work outside of the USA but is
also of strategic importance to inward investment in the UK Film value chain. Current or
recent „blockbusters‟ with UK VFX work are Harry Potter, John Carter of Mars, Narnia:
Dawn Treader, Inception and the latest Xmen movie due in 2011. As such the UK Film
industry has asked Skillset to prioritise this sub-sector of Facilities. An action plan that
involves a series of roundtables of key industry personnel is leading to a VFX
accreditation system, training for tutors in VFX technologies and practices, and an
ahead of the curve rewiring of how VFX is taught in Skillset Media Academies. This
programme intends to stem the need for the industry to go abroad for talent, taking
contracts with it due to the lack of a sufficiently talented workforce in the UK.
In practice the sector is strongly London-centric. Some 80% of Post Production, 92% of
VFX and around 45% of Studio and Equipment Hire and Studio and Equipment Hire
are located in London. The notable sub-sector exceptions are the Manufacture of AV
241
For the most current data on skills within VFX and Computer Games sectors please refer to the
forthcoming Livingstone/Nesta review due for publication in January 2011 to which Skillset and e-Skills
have contributed.
242 Skillset (2009) Employment Census
243 Ibid

80
Equipment and Processing Laboratories which are almost exclusively found in the
South East. This geographic concentration is hardly surprising given that the supportive
role of the sector means that Facilities companies will cluster around the main markets
they serve.244
There are an estimated 3,200 Facilities businesses in the UK (comprising over 300
Post Production businesses, 1,050 Studios or Technical Equipment Hire businesses
and over 1,800 other Facilities businesses including VFX).245
Supply
In HE: 3,954 Facilities courses exist across the UK and these courses were being
studied by 77,251 students in 2008/09. A below average proportion of these learners
are female (31%), whilst 14% are BAME and 10% had an identified disability. In
2008/09 22,490 individuals attained a Facilities related qualification (consisting of 5,700
Postgraduate, 13,754 first degrees, 546 foundation degrees and 2,476 other
undergraduate qualifications). 246
In FE: 46 courses exist in England that have learning aims that are in some way
relevant to the Facilities sector and these account for 66,912 learners in 2008/09. Just
2% of these learners are female, 12% are BAME and 6% had an identified disability.247
In the private sector: Of the 4 providers supplying usable information regarding
provision to the Facilities sector a total of 600 courses were identified. These courses
most commonly covered post production technical environment. Specific skills covered
commonly included IT infrastructure and management.
Skills Shortages
Just 15% of Facilities employers have current vacancies, and of these employers 46%
report having hard to fill vacancies and hence skills shortages (the same as the
244
Ibid 245
Skillset 2010 Company Database (created from a variety of sources including previous research participants, Trade Association membership lists and Industry Directories). All figures have been verified with sector representatives. 246
Figures from HESA 2008/09 quoted in Skillset/Research As Evidence (October, 2010) Mapping Creative Industries and Fashion & Textiles Relevant Education and Training Provision in FE, HE, and the Private Sector in the UK. Further information regarding this study can be found in the methodology section. 247
Figures from Individual Learner Record (ILR) 2008/09 for England only quoted in Skillset/Research As Evidence (October, 2010) Mapping Creative Industries and Fashion & Textiles Relevant Education and Training Provision in FE, HE, and the Private Sector in the UK. Further information regarding this study can be found in the methodology section.

81
Creative Industries employer average of 46%).248 The occupations in which these skills
shortages exist most commonly are Distribution, Sales and Marketing, Art and Design
and Business Management.
Facilities employers also highlighted a number of skills that they found difficult to obtain
in applicants direct from education. Broad skills areas most commonly cited are
leadership and management (37%), multi-skilling (32%), sales and marketing (29%)
and skills in using software packages such as Photoshop, Avid and Final Cut Pro
(23%).249
It needs to be remembered that the Facilities industry, whilst fragmented has a
commonality around the need for client facing skills as much as technology. The Post
Production sub-sector in particular complains of the shortage of can-do attitude,
customer skills and awareness of team responsibilities within recent graduates. There
is a prevalent feeling that FE and HE are not giving students the hard truths about the
importance of progressing from being a runner or an assistant, but are rather asserting
the idea that students will go straight into more „creative‟ roles such as editing or
camera.
Skillset has previously worked with the Facilities sector across the UK to create First
Post, a learning and development scheme designed for new employees of Facilities
sector companies, which was judged a great success, but very expensive to be
scalable.250
Graduate new entrants in the VFX sub-sector lack computer operating system,
visual effects and specific software skills, and a lack of basic understanding of
techniques, work pipelines and the industry as a whole;
Severe difficulties in recruiting for engineering roles within Post Production (“There
are more lucrative areas than broadcasting for engineers to work in”).251 As what
used to be the “Machine Room” stacked with VCRs and patch panels in the Post
Houses has transformed into the IT room, the old engineering skills need to be
combined with IT skills - a difficult mix.
248
Skillset (2010) Creative Media Employer Survey 249
Ibid 250
Review of the First Post scheme revealed a strongly positive response from those with some
involvement. However, concern has been raised about the extent to which the scheme was been promoted, particularly amongst the freelance workforce. See also Skillset (2008) Creative Industries Workforce Survey. 251
Skillset Review of First Post scheme

82
Current Skills Gaps
Three in ten (31%) Facilities employers report a skills gap within their current
workforce, only slightly higher than the English Creative Industries average (28%).252
More than half of Facilities employers highlighted sales and marketing (51%) as a skills
gap area amongst employees. Leadership and management (49%), multi-skilling
(42%), business skills (particularly business planning/strategy 40%) and technical skills
(38%) were also highlighted as skills gap areas. Facilities employers were most likely
to cite multi-skilling (43%), skills in using software packages such as Photoshop, Avid
and Final Cut Pro (41%) and technical skills (particularly sound, 36%) as skills gap
areas amongst freelancers. 253
Skills gaps amongst their current workforce were most frequently associated with
engineering and transmission, strategic management, art and design and distribution,
sales and marketing roles.254
Over half (57%) of Facilities employers fund or arrange learning or development for
staff, higher than the 47% of employers across the Creative Industries.255 Approaching
three quarters (72%) of Facilities employers who use freelancers also extend learning
and development opportunities to them.256
Over a fifth (22%) of Facilities employers have a learning and development plan for the
year ahead (slightly higher than the 18% of employers across the wider Creative
Industries).257
Demand for learning and development by the workforce in this sector is varied. Two
per cent of graduates and non-graduates alike wanted learning and development in
Post Production and 3% of non-graduates wanted learning and development in driving
and operating lifts and vehicles.258
The 2008 Creative Industries Workforce Survey and UK wide review of the First Post
scheme revealed:
252
Skillset (2010) Creative Media Employer Survey 253
Ibid 254
Ibid 255
Ibid 256
Ibid 257
Ibid 258
Skillset (2008) Creative Industries Workforce Survey

83
Skills gaps in the Visual Effects sub-sector workforce in relation to project
management, people management, and basic administration;
A growing fear that the industry doesn‟t have a sufficient culture of skills
development in the area of leadership and management: many managers start out
as „runners‟ and progress from there without having formal management learning
and development. However, there was also a level of distrust of management –
many associating it mainly with cost cutting.
Future Skills
Skillset‟s 2010 Creative Industries Employer Survey asked employers to identify any
potential future skills gaps. Interestingly Facilities employers predicted that there would
be gaps in a wide variety of broad skills areas: Sales and marketing (29%), technical
skills (28%), leadership and management (25%), multi-skilling (24%), skills in using
software packages such as Photoshop, Avid and Final Cut Pro (22%) and business
skills (21%).259
As mentioned earlier in this report, the Vaisey review of the Computer Games and VFX
Industries is a current debate of great importance to the VFX sub-sector
Interactive Media
Overview
The Interactive Media sector covers a range of specialist companies and jobs including
the design and development of web sites and web applications, online content, offline
multimedia experiences, mobile applications and content, and interactive television.
The sector fulfils a key support function in the wider Creative Industries as well as other
industries. This role clouds measurement of the sector‟s output and importance - as
Skillset note: Interactive Media is becoming more of a discipline than a sector.260
About 34,300 people work in the Interactive Media sector.261 Just over three quarters
of all jobs in the sub-sector are in „online content‟. In terms of employment profile, the
21% of the sector‟s workforce are freelancers, with only 6% of the total employed being
259
Skillset (2010) Creative Media Employer Survey 260
www.skillset.org/interactive/industry/ 261
Skillset (2009) Employment Census

84
women and a mere 4% coming from a BAME background. This shrinks to just 1% in
other Interactive Media.262
The Interactive Media sector‟s workforce is highly educated - nine in ten (88%) have an
undergraduate or postgraduate degree or diploma (the highest amongst all Creative
Industries sectors).263
There are an estimated 7,450 Interactive Media businesses in the UK.264 The vast
majority (95%) have less than 50 staff.265
Supply
In HE: 3,627 Interactive Media courses exist across the UK and these courses were
being studied by 66,473 students in 2008/09. A below average proportion of these
learners are female (32%), whilst 22% are BAME and 9% had an identified disability. In
2008/09 23,226 individuals attained an Interactive Media related qualification
(consisting of 6,900 postgraduate qualifications, 12,307 first degrees, 972 foundation
degrees and 3,038 other undergraduate qualifications). 266
In FE: 106 courses exist in England that have learning aims that are in some way
relevant to the Interactive Media sector and these account for 8,336 learners in
2008/09. 47% of these learners are female, 24% are BAME and 14% had an identified
disability.267
In the private sector: Of the 18 providers supplying usable information regarding
provision to the Interactive Media sector, the courses most commonly covered were:
cross platform storytelling, E commerce models, interactive magazine design and
managing multi-platform teams and strategy development (specific to management and
leadership). Specific skills covered commonly included Joomla and other open source
tools and Adobe and Apple Products.
262
Ibid 263
www.skillset.org/uploads/pdf/asset_13233.pdf?4 264
Skillset 2010 Company Database (created from a variety of sources including previous research participants, Trade Association membership lists and Industry Directories). All figures have been verified with sector representatives. 265
Skillset (2009) Employment Census. 266
Figures from HESA 2008/09 quoted in Skillset/Research As Evidence (October, 2010) Mapping
Creative Industries and Fashion & Textiles Relevant Education and Training Provision in FE, HE, and the Private Sector in the UK. Further information regarding this study can be found in the methodology section. 267
Figures from Individual Learner Record (ILR) 2008/09 for England only quoted in Skillset/Research As Evidence (October, 2010) Mapping Creative Industries and Fashion & Textiles Relevant Education and Training Provision in FE, HE, and the Private Sector in the UK. Further information regarding this study can be found in the methodology section.

85
Skills Shortages
A fifth (21%) of Interactive Media employers have current vacancies, and of these
employers 56% report having hard to fill vacancies and hence skills shortages (higher
than the Creative Industries employer average across England of 46%).268 The
occupations in which these skills shortages exist most commonly are Technical
Development, and Distribution, Sales and Marketing.
Interactive Media employers also highlighted a number of skills that they found difficult
to obtain in applicants direct from education. Broad skills areas most commonly cited
are sales and marketing (28%), leadership and management (26%), skills in using
software packages such as Photoshop, Avid and Final Cut Pro (20%) and multi-skilling
(20%).269
Employers report shortages in entrants with the appropriate combinations of „hybrid'
skills – a mix of specialist skills (e.g. graphic design), and core generic skills (e.g.
business/commercial acumen) with cross sector awareness (the ability to provide
services to clients from other sectors of the wider economy).270
Current Skills Gaps
Three in ten (29%) Interactive Media employers report a skills gap within their current
workforce, similar to the UK Creative Industries average (28%).271
More than half of Interactive Media employers highlighted sales and marketing (55%)
as a broad area in which a skills gap exists amongst employees. Technical skills
(commonly computer programming - 44%), leadership and management (43%),
business skills (32%) and skills in using software packages such as Photoshop, Avid
and Final Cut Pro (31%) were also highlighted as skills gap areas. Amongst freelancers
- technical skills (again commonly computer programming, 40%), skills in using
software packages such as Photoshop, Avid and Final Cut Pro (30%) and skills to
develop content for multiple platforms (mainly the design and development of mobile
applications and web sites and web applications, 26%) were the most common skills
gap areas cited. 272
268
Skillset (2010) Creative Media Employer Survey 269
Ibid 270
www.skillset.org/interactive/industry/article_6921_1.asp
271 Skillset (2010) Creative Media Employer Survey
272 Ibid

86
Skills gaps amongst their current workforce were most frequently associated with
technical development (42%) and distribution, sales and marketing (25%) roles for
employees, and technical development (45%) roles for freelancers.273
Over half (52%) of Interactive Media employers fund or arrange learning or
development for staff, higher than the 47% of employers across the Creative
Industries.274 Approaching half (48%) of these employers who also use freelancers
extend learning and development opportunities to them.275
Approaching a quarter (23%) of Interactive Media employers have a learning and
development plan for the year ahead (higher than the 18% of employers across the
wider Creative Industries).276
Around two thirds of the Interactive Media workforce had received some learning or
development over a twelve month period between 2007/08.277 One in ten (11%) of the
workforce in the Broadcast, Facilities, Animation, Interactive Media and Content for
Computer Games sectors stated a need for learning and development in online, web
design, interactive media or electronic games.278 Data suggest that amongst the web
and internet sub-sector the most common areas of learning and development received
are online/web design/interactive media/electronic games (29%), specific software
applications (19%) and legal (18%). In other sub-sectors as a whole, 25% of those
trained in 2007/08 received learning or development in specific software applications.
Regulatory/compliance training in ethics/ safeguarding trust (25%) and health and
safety (23%) were also relatively common.279
Over half (55%) of the Interactive Media workforce in the UK cited a learning or
development need in 2007/08, which was lower than in 2004/05 (70%). The most
commonly cited areas of learning and development required were on-line/web
design/interactive media/electronic games (27%), specific software applications (22%)
and business skills (17%).280
273
Ibid 274
Ibid 275
Ibid 276
Ibid 277
Skillset (2008) Creative Industries Workforce Survey 278
Ibid 279
Ibid 280
Ibid

87
The cost of learning and development, and time available seem to be the main barriers
to take up.281
Future Skills
Skillset‟s 2010 Creative Industries Employer Survey asked employers to identify any
potential future skills gaps. Interestingly Interactive Media employers predicted that
there would be gaps in a wide variety of broad skills areas: Technical skills (mentioned
by 34% of employers), sales and marketing (32%), leadership and management (27%),
multi-skilling (25%), skills to develop content for multiple platforms (25%) and skills in
using software packages such as Photoshop, Avid and Final Cut Pro (24%).282
Within the broad category of „technical skills‟, Interactive Media employers were most
likely to specifically mention computer programming (14%). Likewise within „skills to
develop content for multiple platforms‟ there were a huge variety of specific potential
future skills gaps mentioned, the most common relating to the design and development
of mobile applications (predicted by 7% of employers). 283
Despite the recession, medium term forecasts are for an ever increasing demand for
online and offline output. This will be driven by, amongst other things, continuing falls
in the real price of software, widening access to cheap broadband and 360 degree
commissioning models – where content is commissioned for dissemination across
more than one platform. In the future it is anticipated that technical software and
website design skills and project management skills will be most needed.
Photo Imaging
Overview
The Photo Imaging sector encompasses four main sub-sectors: Photographers; Image
Producers and Photo Retailers; Picture Libraries and Agencies and Manufacturing and
Support services. Currently 45,000 people are thought to work in the sector across the
281
Ibid 282
Skillset (2010) Creative Media Employer Survey 283
Ibid

88
UK, Photographers comprising the largest sub-sector.284 Some 67% of the workforce
are freelance, 42% female and 5% from a BAME background.285
There are an estimated 8,650 Photo Imaging businesses in the UK (comprising 4,950
Photographic Activity businesses and 3,750 other Photo Imaging businesses). The vast
majority (91%) have just 1-4 staff.286
Supply
In HE: 1,663 Photo Imaging courses exist across the UK and these courses were being
studied by 30,403 students in 2008/09. An above average proportion of these learners
are female (54%), whilst 13% are BAME and 13% had an identified disability. In
2008/09 9,001 individuals attained a Photo Imaging related qualification (consisting of
2,491 Postgraduate, 5,451 first degrees, 209 foundation degrees and 848 other
undergraduate qualifications). 287
In FE: 127 courses exist in England that have learning aims that are in some way
relevant to the Photo Imaging sector and these account for 14,253 learners in 2008/09.
56% of these learners are female, 21% are BAME and 14% had an identified
disability.288
In the private sector: Of the 8 providers supplying usable information regarding
provision to the Photo Imaging sector the courses most commonly covered were:
digital photo image manipulation, DSLR Camera, and freelancing skills and business
skills for photographers (specific to Management and Leadership). Specific skills
covered commonly included Adobe and Apple products, archiving and picture libraries,
copyrighting and contracting and specialist photography – wedding, products, and
studio portraiture.
284
Labour Force Survey July 2009 – June 2010 285
Ibid 286
IDBR 2009 – some very small businesses operating without VAT or PAYE schemes (self employed and those with low turnover and without employees) may be missing from this estimate 287
Figures from HESA 2008/09 quoted in Skillset/Research As Evidence (October, 2010) Mapping Creative Industries and Fashion & Textiles Relevant Education and Training Provision in FE, HE, and the Private Sector in the UK. Further information regarding this study can be found in the methodology section. 288
Figures from Individual Learner Record (ILR) 2008/09 for England only quoted in Skillset/Research As Evidence (October, 2010) Mapping Creative Industries and Fashion & Textiles Relevant Education and Training Provision in FE, HE, and the Private Sector in the UK. Further information regarding this study can be found in the methodology section.

89
Skills Shortages
Just 6% of Photo Imaging employers have current vacancies, and of these employers,
65% report having hard to fill vacancies and hence skills shortages (higher than the
Creative Industries employer average of 46%).289 The occupation in which these skills
shortages exist most commonly is Distribution, Sales and Marketing.
Photo Imaging employers also highlighted a number of skills that they found difficult to
obtain in applicants direct from education. Broad skills areas most commonly cited are
sales and marketing (46%), leadership and management (37%), skills in using software
packages such as Photoshop, Avid and Final Cut Pro (34%) and multi-skilling (31%).290
Current Skills Gaps
Just under a quarter (24%) of Photo Imaging employers report a skills gap within their
current workforce, lower than the English Creative Industries average (28%).291
Approaching three quarters of Photo Imaging employers highlighted sales and
marketing (72%) as an area in which a skills gap exists amongst employees. Skills in
using software packages such as Photoshop, Avid and Final Cut Pro (58%) and
technical skills – including computer programming and usage (46%) were also
highlighted as skills gap areas. Amongst freelancers the most commonly identified
skills gap areas were skills in using software packages such as Photoshop, Avid and
Final Cut Pro (60%), technical skills (commonly photographic skills and
computer/software usage, 42%) and sales and marketing (41%).
Skills gaps amongst their current workforce were most frequently associated with
camera/photography, distribution, sales and marketing and library/archives roles for
employees and camera/photography for freelancers.292
More than three in ten (34%) of Photo Imaging employers fund or arrange learning or
development for staff, lower than the 47% of employers across the Creative
289
Skillset (2010) Creative Media Employer Survey 290
Ibid 291
Skillset (2010) Creative Media Employer Survey 292
Ibid

90
Industries.293 Three fifths (62%) of these employers who also use freelancers extend
learning and development opportunities to them.294
Just 12% of Photo Imaging employers have a learning and development plan for the
year ahead (lower than the 18% of employers across the wider Creative Industries).295
Across the industry as a whole, the most significant specialist skills gaps continue to be
around the use of digital technology, knowledge of digital workflow and management of
digital assets.296 In meeting these skills gaps the sector is likely to draw heavily upon
informal approaches to learning and development - including on the job mentoring and
in-house learning and development.297
The Skillset (2007) Photo Imaging Workforce Survey did however reveal that 26% had
received learning and development in the last 12 months in relation to „customer
service and other retail‟ and „exhibition, display and large format‟. „Specialist software‟
(23%), „business skills‟ (21%) and „Marketing‟ (18%) were also identified.
Future Skills
Skillset‟s 2010 Creative Industries Employer Survey asked employers to identify any
potential future skills gaps. Interestingly Photo Imaging employers predicted that there
would be gaps in a wide variety of broad skills areas: Skills in using software packages
such as Photoshop, Avid and Final Cut Pro (36%), sales and marketing (35%), multi-
skilling (26%) and technical skills (20%).298
Three fifths (57%) of the workforce identified a future learning or development need.
Some 25% cited as a reason for learning and development that they wanted to keep up
with the field and improve their effectiveness at work. Of those 60% stated a need for
„specialist software learning and development‟. The next most frequently identified
were „business skills‟ (15%) and „minilab and printing skills‟ (13%).299
293
Ibid 294
Ibid 295
Ibid 296
Ibid 297
Ibid 298
Skillset (2010) Creative Media Employer Survey 299
Skillset (2007) Photo Imaging Workforce Survey reported in Skillset (2009) Photo Imaging Labour Market Intelligence Digest

91
Publishing
Overview
The Publishing sector includes Book and Newspaper Publishing, Journals and
Periodicals, News Agencies, Publishing of Directories and Mailing Lists and other
Services and Activities. Publishing accounted for 1% of UK Gross Value Added (GVA)
in 2008, an estimated figure of £10.1bn.300
There are over 178,000 people employed throughout publishing of whom 47,000 work
in newspaper publishing, 44,000 in journals and periodical publishing, 31,000 in book
publishing and 37,000 in other publishing. Some 13% are freelance, 46% female, 5%
from a BAME background and 11% disabled. Some 5% of those who work in
newspaper publishing are freelancers rising to 21% in book publishing.301
Two thirds (67%) of the Publishing workforce is aged 35 or over. Amongst the
Publishing Industry sub-sectors, the Other Publishing workforce has the highest
proportion of individuals aged 35 or over (74%). Seven in ten (70%) of the Book
Publishing workforce are aged 35+, as are around two-thirds of the workforce in each
of Newspaper Publishing and Journals & Periodicals. Seven in ten (69%) men in the
Publishing workforce are aged 35 and over, compared to 64% of women. 302
There are an estimated 11,600 Publishing businesses in the UK. The majority of
establishments in the sector are small with 88% having 10 employees or fewer and
97% fewer than 50.303
A recent study carried out by NESTA maps the UK‟s creative clusters and shows that a
large number of Publishing firms are based in London, its surroundings, Cambridge,
Oxford, Bristol and Bath, Manchester (plus Glasgow and Edinburgh outside of
England). On a more local level strong concentrations of „creative agglomerations‟ are
identified in Oxford, Bath and Minehead. There is further significant specialisation in
London, Cambridge, Peterborough, Ludlow and the North of Scotland. 304
300
DCMS Economic Estimates, December 2010
301 Labour Force Survey July 2009 – June 2010
302 Labour Force Survey July 2009 – June 2010
303 IDBR 2009
304 Creative clusters and innovation: Putting creativity on the map, NESTA, November 2010

92
According to the Labour Force Survey, over a third (36%) of the Publishing workforce is
based in London. Other significant bases in England are the South East (13%), East of
England (11%) and South West (10%).305
Across the UK the Magazine and Newspaper Publishing sub-sectors have undergone
major structural changes. This has been driven by both the recession and a longer
term movement away from the traditional advertising revenue model to more online
content. This process is set to speed up over the next decade and will revolutionise
the sub-sector, making it harder to generate revenue from content alone and
emphasising the need for a multi-platform and diverse approach to delivery, marketing
and promotion.
The result has been fewer titles and jobs – particularly freelance - and the loss of some
functions such as sub-editing.306 The migration to online content is however being
hindered by a number of commercial challenges including how to monetize online
content, ownership of content issues, and inertia amongst some socio economic
groups to access content online.307 Elsewhere, while book sales have held firm the
overall value of sales has fallen. The increasing popularity of tablets (e.g. iPad) and
mobile smart phone technology are also anticipated to have a major impact on the
industry.
The Publishing workforce is fairly concentrated in associate professional and technical
roles (40% of the workforce) and managers and senior officials (28%). A further one in
ten (11%) work in administrative and secretarial roles. Interestingly the proportion
employed as managers and senior officials within the Publishing industry is steadily
increasing (from 23% in 2007).308
Supply
Half (51%) of the Publishing workforce are graduates. The Book Publishing sub-sector
has the highest proportion of graduates of all the Publishing sub-sectors (75%),
followed by Journals & Periodicals (65%). The Newspaper Publishing workforce has a
much lower proportion of graduates in comparison (35%).309
305
Labour Force Survey July 2009 – June 2010
306 Creative clusters and innovation: Putting creativity on the map, NESTA, November 2010
307 Deloitte Media Predictions 2009
308 Labour Force Survey July 2009 – June 2010
309 Ibid

93
In HE: 1,922 Publishing courses exist across the UK and these courses were being
studied by 39,743 students in 2008/09. An above average proportion of these learners
are female (53%), whilst 13% are BAME and 11% had an identified disability. In
2008/09 12,838 individuals attained a Publishing related qualification (consisting of
2,568 Postgraduate, 8,622 first degrees, 560 foundation degrees and 1,088 other
undergraduate qualifications). 310
In FE: 238 courses exist in England that have learning aims that are in some way
relevant to the Publishing sector and these account for 127,350 learners in 2008/09
(second only to Film in the Creative Industries). 60% of these learners are female, 19%
are BAME and 19% had an identified disability.311
In the private sector: Of the 9 providers supplying usable information regarding
provision to the Publishing sector the courses most commonly covered were: layout
development, sub-editing, magazine design and news editing, and legal issues and
business and finance development (specific to Management and Leadership). Specific
skills covered commonly included academic marketing, editorial, Adobe Indesign and
Quark Xpress.
Workforce Development
Approaching half (46%) of Publishing employers fund or arrange learning or
development for staff, similar to the wider Creative Media Industries (47%).312 This
varied from 50% of employers in the Other Publishing sub-sector, to 44% of Book
Publishers, 42% of Journals & Periodicals Publishers and 40% of Newspaper
Publishers.
Half (52%) of these employers who also use freelancers extend learning and
development opportunities to them (varying from 60% of Newspaper Publishing
employers, to 55% of Book Publishing employers and 53% of Journals & Periodicals
employers).313
310
Figures from HESA 2008/09 quoted in Skillset/Research As Evidence (October, 2010) Mapping
Creative Industries and Fashion & Textiles Relevant Education and Training Provision in FE, HE, and the
Private Sector in the UK. Further information regarding this study can be found in the methodology section.
311 Figures from Individual Learner Record (ILR) 2008/09 for England only quoted in Skillset/Research As
Evidence (October, 2010) Mapping Creative Industries and Fashion & Textiles Relevant Education and Training Provision in FE, HE, and the Private Sector in the UK. Further information regarding this study can be found in the methodology section. 312
Skillset (2010) Creative Media Employer Survey
313 Ibid

94
Amongst employers offering learning and development to staff, the majority favour
sending staff out to an external course or seminar (70%). Other common methods of
delivery are structured support on the job by another employee e.g. mentoring,
coaching (57%) and ad-hoc non-structured support on the job by another employee
(54%). Books and other printed materials (44%) and in-house training sessions
conducted by other employees (39%) were also relatively popular methods, with
internet based/online training (30%) a less popular option. Newspaper Publishing
employers were most likely to favour in-house training sessions conducted by another
member of their workforce (75%). Book Publishers, like many other employers,
favoured sending staff out to an external course or seminar (76%) but unlike other
sectors were also very likely to opt for books or printed materials (68%).314
Just 13% of Publishing employers have a learning and development plan for the year
ahead. Approaching a quarter (23%) of Newspaper Publishing employers have such a
plan, much higher than the 12-13% of all other Publishing sub-sectors.315
Seven in ten (69%) Publishing employers have seen no change to their learning and
development budget over the past year. One in ten (10%) had seen a decrease, whilst
a slightly higher proportion (14%) had actually seen an increase in their learning and
development budget.
Skillset‟s (2010) Creative Media Employer Survey investigated employer usage of
apprenticeships, graduate internships and work placements/work experience posts.
Just 5% of Publishing employers offer apprenticeships, though a third (34%) would
consider doing so in the future. Graduate internships were four times as likely as
apprenticeships to be offered by Publishing employers (19%). In addition, another 35%
would consider offering an internship. Seven in ten (70%) Publishing employers offer or
would consider offering work placements or work experience posts. This includes 50%
of employers that already offer work placements/work experience posts.
Skills Shortages
Just 13% of Publishing employers have current vacancies, and of these employers,
36% report having hard to fill vacancies and hence skills shortages (lower than the
Creative Industries employer average across England of 46%).316 The occupations in
314
Ibid
315 Ibid
316 Skillset (2010) Creative Media Employer Survey

95
which these skills shortages exist most commonly are Distribution, Sales and
Marketing, Art and Design and Technical Development.
Publishing employers also highlighted a number of skills that they found difficult to
obtain in applicants direct from education. Broad skills areas most commonly cited are
sales and marketing (31%), creative talent (21%), Skills in using software packages
such as Photoshop, Avid and Final Cut Pro (17%) and multi-skilling (16%).317
Other evidence relating to new entrants points to the following skills shortages:318
Technical skills – in particular the ability to meet industry standards
requirements;
Strategic skills linked to maximising opportunities from the e-publishing
business;
Developing and implementing innovative, creative marketing using new
technology;
Multi-media journalism skills;
Core business skills, including management and leadership, since Publishing
sector companies tend to be editorially-driven;
Understanding the impact of change on intellectual property rights.
Approaching three quarters (73%) of Publishing employers that have reported hard to
fill vacancies have taken specific actions to overcome skills shortages. For the majority
of these employers this commonly meant using new recruitment methods or channels
(79%). More than four fifths of Publishing employers also took steps to increase or
expand trainee programmes (46%), increase advertising or recruitment spend (43%)
and increase salaries (42%).319
Current Skills Gaps
Over a quarter (28%) of Publishing employers report a skills gap within their current
workforce, the same as the Creative Industries average (28%).320
More than half of Publishing employers highlighted sales and marketing (64%) and
technical skills (50%) as broad areas in which skills gaps exist amongst employees.
Skills in using software packages such as Photoshop, Avid and Final Cut Pro (46%),
317
Ibid 318
Skillset (2009) From Recession to Recovery: an overview of the Impact of the Recession on the UK‟s Creative Industries and the Path to Recovery. Based on a sample of 262 employers. 319
Skillset (2010) Creative Media Employer Survey
320 Ibid
96
business skills (38%, including 17% specifically mentioning entrepreneurial skills) and
leadership and management (36%) were also highlighted as skills gap areas. Within
the broad category of „technical skills‟ – computer programming, usage and
web/internet design/development were the most common specific areas of skills gaps.
Amongst freelancers sales and marketing (40%) and technical skills (31%) were again
the main skills gaps.
Skills gaps amongst their current workforce were most frequently associated with
business management (24%), distribution, sales and marketing (24%), art and design
(17%) and production (16%) roles for employees and art and design (31%) and
business management (30%) roles for freelancers.321
Similarly, for incumbent staff the available evidence points to skills gaps relating to:322
Team working skills
Technical skills including web editing;
Marketing (especially innovative e-marketing);
Transferable skills including business skills such as management and
leadership and ICT;
Innovation and creativity;
Customer handling skills.
Future Skills
Skillset‟s 2010 Creative Industries Employer Survey asked employers to identify any
potential future skills gaps. Interestingly Publishing employers predicted that there
would be gaps in a wide variety of broad skills areas: sales and marketing (36%), skills
in using software packages such as Photoshop, Avid and Final Cut Pro (33%),
technical skills (22%), multi-skilling (21%), business skills (21%) and skills to develop
content for multiple platforms (21%).323
321
Ibid 322
National Employers Skills Survey 2005, The Learning and Skills Council in partnership with the Department for Education and Skills and the Sector Skills Development Agency, London 323
Skillset (2010) Creative Media Employer Survey

97
Advertising
Overview
The Advertising sector consists of advertising agencies and media representation
services. There are over 94,500 people employed throughout the sector of whom
72,000 work in advertising agencies and 23,500 in media representation services.
Some 20% are freelance, 42% female and 10% from a BAME background. Some 22%
of those who work in advertising agencies are freelancers falling to 13% in media
representation services.324
There are an estimated 13,900 Advertising businesses in the UK. The majority of
establishments in the sector are small with 91% having 10 employees or fewer and
98% fewer than 50.325 A small number of agencies account for a high proportion of total
business.326
A recent study carried out by NESTA maps the UK‟s creative clusters and shows that a
large number of Advertising firms are based in London and Manchester. On a more
local level additional „creative agglomerations‟ are identified in the South of London
(from St Albans to Tunbridge Wells and Guildford), a south belt around Manchester
and Birmingham and its south counties, Warwickshire and Worcestershire. There is
also a higher than average agglomeration in Harrogate and Ripon and Blackpool. 327
The Advertising industry is new to Skillset‟s footprint and full engagement with the
industry as a whole has not yet been possible. The focus to date has been on the
Advertising Agencies as included within the IPA membership. Despite the figures
quoted above being for Skillset‟s footprint as a whole the remainder of this section
therefore focuses on Advertising Agencies only.
The workforce as covered by IPA member companies has the following profile: 5% are
freelance, 48% female, 8% BAME and 55% aged over 30.328
In 2009, Cultural and Creative Skills (with TBR) conducted a survey of over 1,000
employers, which showed that 51% of employers reported at least some of their
employees as having received learning and development in the past year. 48% were
324
Labour Force Survey July 2009 – June 2010 325
IDBR 2009 326
IPA member agencies represent 270 of the top agencies, and service over 5000 client companies including the big corporates. 50% of the FTSE 100 use IPA member agencies. 327
Creative clusters and innovation: Putting creativity on the map, NESTA, November 2010 328
IPA 2009 Census

98
reported as having received informal learning and development, 42% formal learning
and development and 15% external learning and development.329 Moreover younger
entrants to the sector were less careerist than previous generations, and were very
keen to ensure good work/life integration.
Supply
In HE: 2,867 Advertising courses exist across the UK and these courses were being
studied by 51,252 students in 2008/09. An above average proportion of these learners
are female (57%), whilst 15% are BAME and 11% had an identified disability. In
2008/09 16,578 individuals attained a Advertising related qualification (consisting of
2,827 Postgraduate, 11,966 first degrees, 425 foundation degrees and 1,357 other
undergraduate qualifications). 330
In FE: 143 courses exist in England that have learning aims that are in some way
relevant to the Advertising sector and these account for 101,912 learners in 2008/09.
66% of these learners are female, 18% are BAME and 19% had an identified
disability.331
There is widespread dissatisfaction among employers with many creative courses as
too many such courses are too execution focused and do not pay enough attention to
upstream creative thinking. Marketing courses that have an advertising component also
too often miss out the problem solving skills and aptitudes required. It is indeed rare
that recruitment to client service positions within IPA represented agencies, for
example, come from marketing courses. Just over 100 creative courses are linked to
industry through D&AD.
Skills Shortages
The CCS/TBR survey showed:
Graphic design occupations to be the most common area in which recruitment
difficulties were reported by employers, cited by 46%. The next most common
problem area was retail/sales reported by 15% and ICT (13%).
329
CCS/TBR Workforce Survey, 2009 330
Figures from HESA 2008/09 quoted in Skillset/Research As Evidence (October, 2010) Mapping Creative Industries and Fashion & Textiles Relevant Education and Training Provision in FE, HE, and the Private Sector in the UK. Further information regarding this study can be found in the methodology section. 331
Figures from Individual Learner Record (ILR) 2008/09 for England only quoted in Skillset/Research As Evidence (October, 2010) Mapping Creative Industries and Fashion & Textiles Relevant Education and Training Provision in FE, HE, and the Private Sector in the UK. Further information regarding this study can be found in the methodology section.

99
The skill areas most often found lacking in new entrants were design (cited by
41%), and ICT skills (20%).332
Skillset undertook a consultation exercise with industry representatives in October
2010 and skills shortage areas highlighted were:333
Digital creatives;
Upstream creatives – big ideas people not just execution experts;
Business analysts;
Behavioural scientists;
Diagonal thinkers – i.e. those people who can shift seamlessly between linear and
lateral thinking, making them at once commercial as well as creative;
Illustrators;
Multi-skilled creatives i.e. an ability to work on online and offline briefs;
Social media specialists;
Top quality intellects.
And from a digital perspective:334
Digital strategists / Digital planners;
Information Architects;
Competent Digital Producers that have real knowledge of production, rather than
just making sure deadlines are met;
Capable Creative Technologists - someone with vast technical knowledge, but that
can apply that to ideas and work in a creative function.
Skill Gaps
46% of advertising companies report skills gaps among their current workforce. The
skill areas most often cited are ICT (28%), business development (24%), digital (13%)
and finance/accounting (13%).335
26% of companies report losing business due to skills gaps in their workforce.336
332
CCS/TBR Workforce Survey, 2009 333
Skillset‟s employer and stakeholder qualitative framework 2010 334
Ibid
335 CCS/TBR Workforce Survey, 2009
100
10% of companies said their employees had a specific entitlement to training and 8%
that they had a training budget.337
Skillset‟s consultation exercise with industry representatives in October 2010
suggested skills gaps specific to:338
Multi-platform all–rounders (including IT support staff working between platforms);
Management and leadership;
Commercial/Business skills;
Sales skills.
And from a digital perspective:339
Digital Strategy/Planning;
Creative Technology;
Creatives that understand digital.
Future skills
In 2006, The Future Foundation identified twelve key drivers expected to impact most
significantly over the next ten years to 2016.340 These can be grouped into three main
areas as follows:
Technological – ever-increasing bandwidth and developments in mobile/wireless
telephony e.g. the launch of mobile 4G planned for 2012 present both opportunities
for creative execution and challenges in terms of evolving demand. Increasing
navigation choice and complexity for consumers and particularly development of
tools to help consumers break through clutter will offer new business opportunities
for advertising and agencies.
Social – the 24 hour society sets a new framework for rethinking roles for
advertising. New media and channels have time shifted the possibility of
communication and purchase to any time of the day or night. An increasingly
networked society means that a greater number of links are possible between a
336
Ibid 337
Ibid 338
Skillset‟s employer and stakeholder qualitative framework 2010 339
Ibid 340
„The Future of Advertising and Agencies: A 10-Year Perspective‟, Future Foundation and Institute of Practitioners in Advertising, 2006

101
given consumer or company, and other consumers or companies, for less effort.
Consumer demand for novelty in products and experiences places an onus on
manufacturers and service providers to innovate more quickly and in a more
targeted way. In a prolific multi-media world, entertainment is increasingly seen to
be the key to breaking through the clutter, and the best way to „engage‟ the more
flighty and technology-savvy consumer of the future. Media owners, advertisers and
agencies, will be increasingly challenged to engage on a human level, in order to
capture and audience.
Economic and political – at the time of the Future Foundation report, most
indicators pointed towards long term economic prosperity. However, the recession
has obviously affected economic growth which in turn has adversely affected
commercial advertising expenditure. This pattern is obviously expected. The ageing
population is going to mean advertisers are going to have to get better at reaching
older segments of the population. Legislative creep (and increasing regulation) e.g.
on advertising of tobacco, alcohol, and certain types of food or drink mean
advertisers will have to get better at developing more responsible campaigns
identifying consumer risks as well as consumer opportunities. „Global mobility
growth‟ means the old „one message, one state‟ model no longer applies. Finally,
the economic growth of India and China is highlighted as a factor in terms of both
competition and evolving markets.
Craft
Overview
The craft sector is dominated by micro-businesses and the incidence of sole trading is
rising. This sector characteristic is well established and documented in contemporary
craft, with 87% of businesses known to be sole traders. It is also becoming more
prevalent in the traditional and heritage crafts, particularly in certain disciplines such as
lettering and calligraphy. In some cases identified sole traders may be the last
practising a particular craft. For the majority of individuals, professional practice
comprises several activities such as:
designing and making functional, conceptual and decorative objects by hand
curating
designing for small scale (batch) production in specialist companies

102
designing for large scale industrial manufacture
working collaboratively with architects and engineers on public art works
making props, objects or models for film, animation and TV working in the
community
teaching in schools, Further Education or Higher Education
craft research and materials consultancy
The craft sector covers more than 18,000 businesses and 75,900 individuals; of the
latter, 33% are self employed. Together, the craft sector makes an overall contribution
to the national economy of £3.1 billion per year (GVA341). 93% of the craft sector is
white, and 30% is female. 88% of the sector is based in England (14% in the South
East), 2% in Northern Ireland, 7% in Scotland, and 4% in Wales. 53% of the craft
sector earns less than £20,000 per year.342
The most common occupations in craft are jeweller (13%), stone mason (11%) and
administrator (10%). Over two thirds of businesses in the craft sector (67%) feel their
business is performing the same or worse that it was a year ago. Coupled with this,
three quarters (74%) have either seen no change in turnover or a decrease in
revenue.343
Supply
Across the Craft sector 26% of employers have arranged training for their workforce in
the last year. The most popular types of training or development tend to be informal,
such as on the job coaching (39%), Knowledge based sessions delivered by an
external provider (35%) and networking (25%). Apprenticeships, specific union learning
and structured CPD based on organisational needs are the least common modes of
training.
When evaluating training in terms of it enabling the business to be more productive,
employers in England rate the following highly:
NVQs or SVQs
341
GVA (Gross Value Added) measures the contribution to the economy of each individual producer,
industry or sector in the United Kingdom. Please see www.statistics.gov.uk/cci/nugget.asp?ID=254 for
more information.
342 Creative & Cultural Skills (2011) Creative and Cultural Industry: Impact and Footprint 2010/11
343 Creative & Cultural Skills (2009) Creative and Cultural Industries Workforce Survey

103
On-the-job coaching
Training developed internally by your business
Personal knowledge development e.g. reading
Structured CPD based on organisational needs
Mentoring344
It is interesting to note that only one of the most commonly used training methods (on-
the-job coaching) features on this list. With the possible exception of structured CPD all
the above training methods that enable increased productivity demand high outlays of
time. Only 13% of businesses across the craft sector provide a specific entitlement to
training for their employees. In addition to this over half of businesses (55%) state that
employees spend no time training in the year. In businesses that do spend time
training, 10% spend either 1-2 days or 5-7 days training each year.345
A very small proportion of employers in the sector (2%) have a dedicated training
budget. Of those who do spend money on training, nearly a quarter (22%) spend less
than £1000 a year. The majority (72%) spend nothing. This is reflected in the types of
training that are popular in the sector, which largely tend to cost time rather than
money.
Skills shortages
In the craft sector 28% of employers who have tried to recruit recently have faced
difficulties. Difficulties tend to be related to a lack of specialist skills and a general lack
of experience, although overall few difficulties were recorded. Occupations that pose
particular difficulties in terms of recruitment in the craft sector are jeweller (noted by
18% of employers), glass maker (13%) followed by stone mason, textile maker and
printer (all 9%).The major impacts of skills shortages for business operating in the craft
sector are an increased workload for others (45% of businesses), turned away
business (27%) lost business and delays to developing new products/services (both
23%).
344
Ibid
345 Ibid

104
Current Skills gaps
Only a quarter of employers (26%) feel that there are gaps in the skills base of their
workforce. These gaps are driven by a lack of time to train staff (noted by 42% of
employers) and a general lack of experience amongst staff (34%). Limited budget for
training is also a significant factor within the sector (24%).
Occupations to which skills gaps tend to relate are jeweller (noted by 18% of
employers), artist, potter, management roles and marketing positions (all 5%). Skills
gaps in creative positions reflect similar difficulties to those experienced by employers
in recruiting into these roles. The skills gaps have a much broader impact for
businesses than skills shortages; lost business and an increased workload for others
are the major impacts (each 24% of businesses), followed by delays to developing new
products/services (22%) and more outsourcing of work (16%).346
Future skills needs
When considering skills gaps that are likely to affect their business in the future,
employers in the craft sector predict that a lack of creative expertise and ICT skills to
be potentially problematic. Over a third of businesses (38.8%) feel that they will not be
adversely affected by skills gaps in the future.
In considering occupations that are likely to become increasingly important to the
success of the business, employers highlight ICT, marketing, sales/retail and finance
as key functions. The craft sector also highlighted jeweller, stone mason and glass
maker as likely to have an increased importance. However, nearly half of respondents
(46%) feel that all occupations will retain their current importance.347
Cultural Heritage
Overview
The cultural heritage sector includes museums, galleries with collections, built heritage,
conservation, heritage landscape, archaeology, and related member organisations.
The sector comprises all those who collect, preserve, study and communicate the past,
346
Ibid
347 Ibid

105
present and future in order to develop and promote understanding. It consists of a
variety of organisations, institutions, sector bodies and individuals. They operate at a
national level across the UK, for devolved nations or at a regional and grass-roots
level. A core part of the sector is publicly funded.
The cultural heritage sector covers more than 1,000 businesses and 53,700
individuals; of the latter, 4% are self employed. Together, the cultural heritage sector
makes an overall contribution to the national economy of £5.6 billion per year (GVA348);
79% of the cultural heritage sector is white, and 49% is female. 86% of the sector is
based in England (28% in London), 1% in Northern Ireland, 8% in Scotland, and 5% in
Wales. 87% of the cultural heritage sector earns less than £20,000 per year.349
The most common occupations in cultural heritage are visitor relations (19%),
archaeologist (12%) and curator (9%). Two thirds of businesses in the cultural heritage
sector (67%) feel their business is performing the same or worse that it was a year ago.
Consistent with this, two thirds (65%) have either seen no change in turnover or a
decrease in revenue.350
Supply
Across the sector over three quarters (79%) of employers have arranged training for
their workforce in the last year. The most popular types of training or development tend
to be informal, knowledge based sessions delivered by an external provider (63%),
networking (62%), personal knowledge development e.g. reading (61%), and on-the-
job coaching (61%). Apprenticeships and specific union learning are the least common
modes of training.351
When evaluating training in terms of it enabling the business to be more productive,
employers in England rate the following highly:
An apprenticeship (8.8%)
348
GVA (Gross Value Added) measures the contribution to the economy of each individual producer,
industry or sector in the United Kingdom. Please see http://www.statistics.gov.uk/cci/nugget.asp?ID=254
for more information.
349 Creative & Cultural Skills (2011) Creative and Cultural Industry: Impact and Footprint 2010/11
350 Creative & Cultural Skills (2009) Creative and Cultural Industries Workforce Survey
351 ibid
106
On-the-job coaching (7.8%)
Knowledge based sessions delivered by an external provider (7.2%)
Skills based sessions delivered by an external provider (7.2%)
Personal knowledge development e.g. reading (7.2%)
Mentoring (7.1%)
It is interesting to note that whilst apprenticeships are not often used, where they are
they are seen as valuable to productivity. There is correlation between popular types of
training and those that are seen as adding to productivity.
A comparatively high proportion of businesses across the sector, over a third (37%)
provide a specific entitlement to training for their employees. In keeping with this, over
a quarter of employees (26%) spend between 5-7 days training each year, whilst a
further 19% spend 1-2 days training and 17% 3-4 days. Only 14% spend no time
training each year.
A dedicated budget for training is also comparatively common in the cultural heritage
sector with nearly a quarter (22%) responding accordingly. Of those who have a
training budget, nearly a half (45%) spent less than £1000. One third (34%) spend
nothing. A further 12% spent between £1001 and £5000. These findings reflect the
types of training that are popular in the sector, which largely tend to cost time rather
than money.352
Skills shortages
In the cultural heritage sector 21% of employers who have tried to recruit recently have
faced difficulties recruiting. Difficulties tend to be related to a lack of experience
amongst applicants and a general lack of applicants, although overall few difficulties
were recorded. Occupations that pose particular difficulties in terms of recruitment in
the cultural heritage sector are archaeologist (noted by 41% of employers), visitor
relations positions (29%) and technician (15%).
The major impacts of skills shortages for business operating in England are an
increased workload for others (46% of businesses), turned away business (40%) and
lost business (29%).353
352
Ibid
353 Ibid

107
Skills gaps
Just over one third of employers (36%) feel that there are gaps in the skills base of
their workforce. These gaps are driven mainly by a lack of experience amongst staff
(noted by 46% of employers) and a limited budget for training (34%). Limited
availability of training is rarely an issue (7%). However, 28% of employers do note that
limited time for training is a contributory factor.
Few occupations to which skills gaps tend to relate were mentioned. Of those which
were, archaeologist, management, administrative and visitor relations roles were the
most problematic. Skills gaps relating to archaeologists and visitor relations roles
reflect the difficulties experienced by employers in recruiting into these roles.
The skills gaps have a much broader impact for businesses than skills shortages; an
increased workload for others is the major impact (34% of businesses), followed by lost
business (19%) turned away business (16%) and delays to developing new
products/services (12%).354
Future skills needs
When considering skills gaps that are likely to affect their business in the future,
employers in the cultural heritage sector predict that a lack of creative expertise, ICT
skills and fundraising abilities to be potentially problematic. Only a fifth of businesses
feel that they won‟t be adversely affected by skills gaps in the future.
In considering occupations that are likely to become increasingly important to the
success of the business, employers highlight fundraising and marketing as key
functions. Education, management and ICT skill are also noted as likely to have an
increased importance. However, over a third of respondents (37%) feel that all
occupations will retain their current importance.
354
Ibid

108
Design
Overview
The design industry comprises of a wide range of disciplines, including
communications, graphic design, product and industrial design, interior design, and
exhibitions, digital and multimedia design, and service design.
The design sector covers more than 15,000 businesses and 263,400 individuals; of the
latter, 64% are self employed. Together, the design sector makes an overall
contribution to the national economy of £8.25 billion per year (GVA355); 92% of the
design sector is white, and 33% is female. 88% of the sector is based in England (20%
in London), 3% in Northern Ireland, 6% in Scotland, and 3% in Wales. 46% of the
design sector earns less than £20,000 per year.356
The most common occupations in design are graphic designer (28%), interior designer
(12%) and administrator (8%). Almost three quarters of businesses in the design sector
(71%) feel their business is performing the same or worse that it was a year ago.
Coupled with this, nearly two thirds (63%) have either seen no change in turnover or a
decrease in revenue.357
Supply
Across the design sector 40% of employers have arranged training for their workforce
in the last year. The most popular types of training or development tend to be informal,
such as personal knowledge development (e.g. reading) (as noted by 58% of
employers), networking (48%), and attending conferences (44%). Apprenticeships,
post-graduate level training and specific union learning are the least common modes of
training.358
When evaluating training in terms of it enabling the business to be more productive,
employers across the design sector rate the following highly:
355
GVA (Gross Value Added) measures the contribution to the economy of each individual producer,
industry or sector in the United Kingdom. Please see www.statistics.gov.uk/cci/nugget.asp?ID=254 for
more information.
356 Creative & Cultural Skills (2011) Creative and Cultural Industry: Impact and Footprint 2010/11
357 Creative & Cultural Skills (2009) Creative and Cultural Industries Workforce Survey
358 Ibid

109
An apprenticeship
Mentoring
On-the-job training
Networking
Knowledge based sessions delivered by an external provider359
It is interesting to note that only one of the most commonly used training methods
(networking) features on this list and that whilst apprenticeships are not often used,
where they are they are seen as highly valuable to productivity.
Only 18% of businesses across the design sector provide a specific entitlement to
training for their employees. In addition to this 39% of businesses state that employees
spend no time training in the year. In businesses that do spend time training, 16%
spend either 5-7 days and 10% spend 1-2 days training each year.
A very small proportion of employers in the design sector (4%) have a dedicated
training budget. One third (33%) of employers spend less than £1000 per year on
training, while 53% spend nothing. This is reflected in the types of training that are
popular in the sector, which tend largely to cost time rather than money.360
Skills shortages
In the design sector 19% of employers who have tried to recruit recently have faced
difficulties recruiting. Difficulties tend to be related to a lack of both qualifications and
specialist skills amongst applicants; although overall few difficulties were recorded
.Occupations that pose particular difficulties in terms of recruitment in the design sector
are graphic designers (noted by 32% of employers), ICT (31%) and retail/sales (17%).
The major impacts of skills shortages for business operating in the design sector are an
increased workload for others (53% of businesses). Turned away business (20%) is
also a notable impact.361
359
Ibid
360 Ibid
361 Ibid

110
Skills gaps
Approaching half of employers (44%) feel that there are gaps in the skills base of their
workforce. These gaps are driven by a lack of time to train staff (noted by 39% of
employers) and a lack of experience amongst staff (25%). Limited availability of training
is very rarely an issue (4%). However, employers do note that a limited budget for
training (27%) is a contributory factor.
Occupations to which skills gaps tend to relate are graphic designers (noted by 78% of
employers), management roles (28%), interior designers (23%) and industrial
designers (17%). Skills gaps in design based roles reflect the difficulties experienced
by employers in recruiting into these roles.
The skills gaps have a much broader impact for businesses than skills shortages; lost
business is the major impact (24% of businesses), followed by more outsourcing of
work (23%), an increased workload for others (16%), delays to developing new
products or services (15%) and turned away business (14%).362
Future skills needs
When considering skills gaps that are likely to affect their business in the future,
employers in the design sector predict digital skills, online skills and creative expertise
to be potentially problematic. A quarter of businesses feel that they will not be
adversely affected by skills gaps in the future.
In considering occupations that are likely to become increasingly important to the
success of the business, employers highlight ICT and marketing as key functions.
Graphic design and product design are also noted as likely to have an increased
importance. However, a third of respondents (34%) feel that all occupations will retain
their current importance.363
362
Ibid
363 Ibid

111
Music
Overview
The music workforce as anyone involved in performing, creating, producing, recording,
promoting and selling music in the UK. This includes musicians and composers,
national and regional orchestras, the recording industry and its retail and distribution
arms, royalties and collection societies, live venues and festivals (both commercial and
subsidised), music publishers, artist management and promotion, and the audio sector.
Those music professionals who work in educational settings are also covered here, as
are those involved in the production and repair of musical instruments and audio
equipment.
There is a range of business models in the music sector, including publicly-subsidised
music organisations and venues, commercial companies and venues, and not-for-profit
organisations. These organisations range in size from multi-national corporations and
national foundations through to small and medium-sized companies and
freelancers/sole traders.
The music sector covers more than 7,900 businesses and 124,400 individuals; of the
latter, 36% are self employed. Together, the music sector makes an overall
contribution to the national economy of £4billion per year (GVA364); 93% of the music
sector is white, and 39% is female. 85% of the sector is based in England (29% in
London), 3% in Northern Ireland, 9% in Scotland, and 4% in Wales. 78% of the music
sector earns less than £20,000 per year.365
The most common occupations in the music sub sector are musician (15%), retail /
sales (14%) and management (12%). Over two thirds of businesses in the music sector
(69%) feel their business is performing the same or worse that it was a year ago.
Coupled with this, three quarters (76%) have either seen no change in turnover or a
decrease in revenue.366
364
GVA (Gross Value Added) measures the contribution to the economy of each individual producer,
industry or sector in the United Kingdom. Please see www.statistics.gov.uk/cci/nugget.asp?ID=254 for
more information.
365 Creative & Cultural Skills (2011) Creative and Cultural Industry: Impact and Footprint 2010/11
366 Creative & Cultural Skills (2009) Creative and Cultural Industries Workforce Survey

112
Supply
Across the music sector 30% of employers have arranged training for their workforce in
the last year. The most popular types of training or development tend to be informal,
such as on-the-job coaching, networking, and attending conferences (each noted by
over 40% of employers). Apprenticeships, NVQs, graduate and post-graduate level
training are the least common modes of training.
When evaluating training in terms of it enabling the business to be more productive,
employers in the music sector rate the following highly:
An apprenticeship
Networking
NVQ‟s or SVQ‟s
Mentoring
On-the-job coaching
Graduate level training367
It is interesting to note that while two one of the most commonly used training methods
(networking and on-the-job coaching) feature on this list, three of the least popular
training methods (NVQ‟s, apprenticeships and graduate level training) while they are
not often used, where they are they are seen as valuable to productivity.
Only 15% of businesses across the sector provide a specific entitlement to training for
their employees. In addition to this over half of businesses (55%) state that employees
spend no time training in the year. In businesses that do spend time training, 10%
spend 5-7 days training each year, 8% spent 1-2 days and 7% spent 3-4 days.
A very small proportion of employers in the music sector (8%) have a dedicated
training budget. One quarter (24%) of employers spend less than £1000 per year on
training, two thirds (67%) spent nothing. This is reflected in the types of training that are
popular in the sector, which largely cost time rather than money.368
367
Ibid
368 Ibid
113
Skills shortages
In the music sector 12% of employers who have tried to recruit recently have faced
difficulties recruiting. Few difficulties were recorded. Difficulties tend to be related to a
lack of both specialist and transferable skills and experience amongst applications.
Occupations that pose particular difficulties in terms of recruitment in the music sector
are production assistant (noted by 20% of employers), sound engineers, public
relations and agent positions (all 15%).
The major impact of skills shortages for business operating in the music sector is an
increased workload for others (58% of businesses). Lost business (24%), more work
being outsourced (23%) and delays to developing new products/services (23%) are
also noted as impacts.369
Skills gaps
Nearly one third of employers (30%) feel that there are gaps in the skills base of their
workforce. These gaps are driven by a general lack of experience amongst staff (noted
by 31% of employers) and a lack of time to train staff (26%). Limited availability of
training is very rarely an issue. However, 22% of employers do note that a limited
budget for training is a contributory factor
Occupations to which skills gaps tend to relate are management roles (noted by 18% of
employers), musician (15%) and retail/sales positions (12%)
The skills gaps have a much broader impact for businesses than skills shortages; lost
business is the major impact (21% of businesses), followed by turned away business
(15%) and more outsourcing of work (6%).370
Future skills needs
When considering skills gaps that are likely to affect their business in the future,
employers in the music sector predict digital, online and creative skills to be potentially
369
Ibid
370 Ibid

114
problematic. Nearly half of businesses feel that they won‟t be adversely affected by
skills gaps in the future.
In considering occupations that are likely to become increasingly important to the
success of the business, employers highlight ICT and marketing as key functions.
Management and retail/sales are also noted as likely to have an increased importance.
However, over a third of respondents (39%) feel that all occupations will retain their
current importance.371
Literature
Overview
The literature sector in the context of this publication refers to those individuals and
organisations involved with literary creation in all its forms. This includes professional
and aspiring creative writers (including, but not limited to, novelists, poets, playwrights,
screenplay writers, spoken word performers and storytellers), those working in
literature development and promotion, literary agents, literary critics, literary translators
and literature festival managers.
The literature sector covers more than 16,900 businesses and 74,390 individuals; of
the latter, 36% are freelance or sole traders and 69% are writers. Together, the
literature sector makes an overall contribution to the national economy of £2.1 billion
per year (GVA372); this figure does not include the publishing sector. 91% of the
literature sector is white, and 46% is female. 91% of the sector is based in England
(31% in London), 1% in Northern Ireland, 5% in Scotland, and 3% in Wales. 51% of the
literature sector earns less than £20,000 per year.373
The most common occupations in literature are editor (16%), copywriter (16%) and
management (11%). Almost three quarters of businesses in the literature sector (70%)
feel their business is performing the same or worse that it was a year ago. Coupled
371
Ibid
372 GVA (Gross Value Added) measures the contribution to the economy of each individual producer,
industry or sector in the United Kingdom. Please see www.statistics.gov.uk/cci/nugget.asp?ID=254 for
more information.
373 Creative & Cultural Skills (2011) Creative and Cultural Industry: Impact and Footprint 2010/11

115
with this, two thirds (68%) have either seen no change in turnover or a decrease in
revenue.374
Supply
Across the literature sector 41% of employers have arranged training for their
workforce in the last year. The most popular types of training or development tend to
be informal, such as personal knowledge development (e.g. reading) (56% of
employers) attending conferences and skills based sessions delivered by an external
provider (each 33%). Apprenticeships, specific union learning, graduate and
postgraduate level learning are among the least common modes of training.375
When evaluating training in terms of it enabling the business to be more productive,
employers in England rate the following highly:
On-the-job coaching
Mentoring
Skill based sessions delivered by an external provider
Structured CPD based on organisational needs
Personal knowledge development e.g. reading376
There is clear correlation between those training methods commonly used and those
seen as enabling increased productivity.
Only 9% of businesses across the literature sector provide a specific entitlement to
training for their employees. In addition to this almost half of businesses (50%) state
that employees spend no time training in the year. In businesses that do spend time
training, 23% spend 5-7 days and a further 9% each spend either 1-2 days or 21-30
days.
No employers in the literature sector have a dedicated training budget. Of those who
do invest in training, 32% spend less than £1000. Nearly two-thirds 64% spend
374
Creative & Cultural Skills (2009) Creative and Cultural Industries Workforce Survey
375 Ibid
376 Ibid

116
nothing. This is a clear reflection of the types of training that are popular in the sector,
which tend to cost time rather than money.377
Skills shortages
In the literature sector 29% of employers who have tried to recruit recently have faced
difficulties recruiting. Very few difficulties were recorded. The only occupation that
posed particular difficulties in terms of recruitment in the literature sector was for
trainees (noted by 49% of employers). Very few impacts caused by skills shortages in
the literature sector were recorded.378
Skills gaps
Just over one third of employers (36%) feel that there are gaps in the skills base of
their workforce. These gaps are driven by a lack of time to train staff (noted by 50% of
employers) and a general lack of experience amongst staff (25%). Limited availability
of training is rarely an issue. However, 38% of employers do note that a limited budget
for training is a contributory factor.
Occupations to which skills gaps tend to relate are editorial roles, administrative
positions (both noted by 13% of employers), management and marketing roles (both
6% of employers. The skills gaps in the current workforce are far broader than those
difficulties experienced by employers in recruiting.
The skills gaps have a much broader impact for businesses than skills shortages; lost
business and an increased workload for others are the major impacts (both 25% of
businesses), followed by delays to developing new products/services and more
outsourcing of work (both 13%) and difficulties meeting quality standards (12%).379
Future skills needs
When considering skills gaps that are likely to affect their business in the future,
employers in the literature sector predict ICT, digital and creative skills to be potentially
problematic. Administrative and management skills are also of potential future concern
377
Ibid
378 Ibid
379 Ibid

117
for the sector. One third of businesses feel that they will not be adversely affected by
skills gaps in the future.
In considering occupations that are likely to become increasingly important to the
success of the business, employers highlight ICT and creative writing as key functions.
Education, literary agent and storyteller are also noted as likely to have an increased
importance. However, a third of respondents (36%) feel that all occupations will retain
their current importance.380
Visual Arts
Overview
The visual arts sector is important not only in its own terms but also for its contribution
to other industries such as design, advertising, interactive media, game design, film
and publishing. The position of the visual arts within the creative industries has
important implications for wider workforce development and consequently for the UK
economy as a whole.
The visual arts sector covers more than 1,300 businesses and 44,800 individuals; of
the latter, 87% are self employed. Together, the visual arts sector makes an overall
contribution to the national economy of £0.34billion per year (GVA381); 93% of the
visual arts sector is white, and 53% is female. 83% of the sector is based in England
(25% in London), 1% in Northern Ireland, 11% in Scotland, and 5% in Wales.382
The most common occupations in visual art are artist (15%), management (11%) and
retail / sales (11%). Three quarters of businesses in England (75%) feel their business
is performing the same or worse that it was a year ago. Coupled with this, nearly three
quarters (71%) have either seen no change in turnover or a decrease in revenue.383
380
Ibid
381 GVA (Gross Value Added) measures the contribution to the economy of each individual producer,
industry or sector in the United Kingdom. Please see http://www.statistics.gov.uk/cci/nugget.asp?ID=254
for more information.
382 Creative & Cultural Skills (2011) Creative and Cultural Industry: Impact and Footprint 2010/11
383 Creative & Cultural Skills (2009) Creative and Cultural Industries Workforce Survey
118
Supply
Across the visual arts sector 35% of employers have arranged training for their
workforce in the last year. The most popular types of training or development tend to
be informal, such as personal knowledge development (e.g. reading) (noted by 44% of
employers) attending conferences (35%) and skills based training delivered by an
external provider (26%).384 Apprenticeships, NVQs and specific union learning are the
least common modes of training.
When evaluating training in terms of it enabling the business to be more productive,
employers in England rate the following highly:
Skills based sessions delivered by an external provider
Networking
On-the-job training
Mentoring
Postgraduate level training
Knowledge based sessions delivered by an external provider385
It is interesting to note that only one of the most commonly used training methods
(skills based training delivered by an external provider) features on this list.
Only 17% of businesses across the visual arts sector provide a specific entitlement to
training for their employees. In addition to this almost half of businesses (47%) state
that employees spend no time training in the year. In businesses that do spend time
training, 14% spend 5-7 days training each year while a further 11% spend 1-2 days.
A very small proportion of employers in the sector (6%) have a dedicated training
budget. Almost a quarter (21%) of employers spend less than £1000 per year on
training, two thirds spend nothing. This is reflected in the types of training that are
popular in the sector, which largely cost time rather than money.386
384
Ibid
385 Ibid
386 Ibid

119
Skills shortages
In the visual art sector 16% of employers who have tried to recruit recently have faced
difficulties recruiting. Difficulties tend to be related to a lack of specialist skills amongst
applications. Very few problems were recorded. Occupations that pose particular
difficulties in terms of recruitment in the visual arts sector are ICT roles, acting roles,
sculptors and conservators (each noted by 20% of employers).
The major impacts of skills shortages for business operating in England are an
increased workload for others (30% of businesses), lost business (20%) and more work
being outsourced (22%).387
Skills gaps
Just over one third of employers (36%) feel that there are gaps in the skills base of
their workforce. These gaps are driven by a lack of time to train staff (noted by 55% of
employers) and a general lack of experience amongst staff (28%). Limited availability
of training is very rarely an issue (4.3%). However, 25% of employers do note that a
limited budget for training is a contributory factor.
Occupations to which skills gaps tend to relate are artists (noted by 11% of employers),
retail/sales and administrative roles (both 6%) followed by management positions (4%).
The skills gaps have a much broader impact for businesses than skills shortages; lost
business is the major impact (33% of businesses), followed by delays to developing
new products or services (21%), an increased workload for others (14%) and difficulties
introducing new working practices (12%).
Future skills needs
When considering skills gaps that are likely to affect their business in the future,
employers in the sector predict ICT, digital and creative skills to be potentially
problematic. Marketing and Sales skills are also of particular concern within the sector.
One third of businesses feel that they will not be adversely affected by skills gaps in the
future.
387
Ibid

120
In considering occupations that are likely to become increasingly important to the
success of the business, employers highlight ICT and marketing as key functions.
Retail/sales and finance are also noted as likely to have an increased importance. A
third of respondents (32%) feel that all occupations will retain their current
importance.388
Performing Arts
Overview
The performing arts industry is defined as containing those venues, employers, small
businesses and freelancers in the live music industry (including live performances of
classical, pop, rock and all contemporary forms of music), dance, opera and theatre
(including classical, contemporary, street arts, carnival arts, circus and physical
theatre). This includes performers, promoters and those who provide backstage
technical input and administration, but excludes the recorded music sector and its
associated occupations.
The performing arts sector is characterised by a diversity of provision and business
models, including: publicly subsidised companies and venues supported by the arts
funding system (through the UK Arts Councils); local authority venues; smaller
companies accessing project funding; and commercial entities, some of whom are not-
for-profit organisations.
The performing arts sector covers more than 10,400 businesses and 148,000
individuals; of the latter, 55% are self employed. Together, the performing arts sector
makes an overall contribution to the national economy of £3.5billion per year (GVA389);
94% of the performing arts sector is white, and 45% is female. 88% of the sector is
based in England (31% in London), 1% in Northern Ireland, 7% in Scotland, and 4% in
Wales. 64% of the performing arts sector earns less than £20,000 per year.390
388
Ibid
389 GVA (Gross Value Added) measures the contribution to the economy of each individual producer,
industry or sector in the United Kingdom. Please see www.statistics.gov.uk/cci/nugget.asp?ID=254 for
more information.
390 Creative & Cultural Skills (2011) Creative and Cultural Industry: Impact and Footprint 2010/11

121
The most common occupations in performing arts are management (13%),
administrator (9%) and agent (9%). Almost three quarters of the performing art sector
(73%) feel their business is performing the same or worse that it was a year ago.
Coupled with this, over half (55%) have either seen no change in turnover or a
decrease in revenue.391
Supply
Across the performing arts sector 45% of employers have arranged training for their
workforce in the last year. The most popular types of training or development tend to
be informal, such as on-the-job coaching (noted by approximately 49% of employers),
attending conferences (42%) and networking (39%). Graduate and postgraduate level
training, apprenticeships, NVQs and specific union learning are the least common
modes of training.
When evaluating training in terms of it enabling the business to be more productive,
employers in England rate the following highly:
Mentoring
On-the-job coaching
Training developed internally by the business
Other vocational training
Structured CPD based on organisational needs
Networking392
There is clear correlation between those training methods that are popular with
employers and those which enable increased productivity. It is interesting to note that
none of the uncommon modes of training are seen as enabling increased productivity.
Only 19% of businesses across the sector provide a specific entitlement to training for
their employees. In addition to this almost half of businesses (40%) state that
employees spend no time training in the year. In businesses that do spend time
training, 15% spend 1-2 days and 13% 3-4 days training each year
391
Creative & Cultural Skills (2009) Creative and Cultural Industries Workforce Survey
392 Ibid

122
A very small proportion of employers in the performing arts sector (11%) have a
dedicated training budget. Just over one third (38%) of employers spend less than
£1000 per year on training, nearly half (47%) spend nothing. This is reflected in the
types of training that are popular in the sector, which largely cost time rather than
money.393
Skills shortages
In the performing arts sector 34% of employers who have tried to recruit recently have
faced difficulties recruiting. Difficulties tend to be related to a lack of both experience
and specialist skills and also a lack of applicants. Overall few difficulties were recorded.
Occupations that pose particular difficulties in terms of recruitment in the performing
arts sector are administrative roles (noted by 18% of employers), technician (14%) and
teacher (13%). The major impacts of skills shortages for business operating in the
performing arts sector are an increased workload for others (50% of businesses), lost
business (36%) and turned away business (24%).
Skills gaps
Just over one third of employers (38%) feel that there are gaps in the skills base of
their workforce. These gaps are driven by a general lack of experience amongst staff
(noted by 31% of employers) a lack of time to train staff (35%). Limited availability of
training is rarely an issue (13%). However, 25% of employers do note that a limited
budget for training is a contributory factor.
Occupations to which skills gaps tend to relate are management positions (noted by
46% of employers), marketing positions, entertainer roles (both 28%) and
administration positions (24%). Skills gaps in administrative positions reflect the
difficulties experienced by employers in recruiting to these roles.
The skills gaps have a much broader impact for businesses than skills shortages; an
increased workload for others is the major impact (32% of businesses), followed by lost
393
Ibid

123
business (31%), delays to developing new products or services (21%) and difficulties
introducing new working practices (12%).394
Future skills needs
When considering skills gaps that are likely to affect their business in the future,
employers in the performing arts predict marketing, ICT and creative skills to be
potentially problematic. One third of businesses feel that they will not be adversely
affected by skills gaps in the future.
In considering occupations that are likely to become increasingly important to the
success of the business, employers highlight ICT and marketing as key functions.
Management and fundraising are also noted as likely to have an increased importance.
However, half of respondents (51%) feel that all occupations will retain their current
importance.395
Fashion and Textiles
Overview
The Fashion and Textiles sector accounts for around 79,000 firms employing 340,000
people. Some 97% of all workplaces in the sector employ fewer than 50 people. Some
21% of the workforce are self employed slightly lower than the 25% average across the
whole Creative Industries sector but above the UK average of 13%. The North West is
the largest employing region with 53,890 employees whilst London (46,230), East
Midlands (45,570) and Yorkshire and Humber (35,910) all significant employment
areas with their own regional specialism‟s and clusters396.
More than 40% of businesses have been going for more than 10 years397. Over two
fifths of the workforce are process plant and machine operative occupations and
elementary occupations reflecting the large amount of manufacturing and laundry and
394
Ibid
395 Ibid
396 tbr 2008
397 IDBR 2008

124
dry-cleaning activity represented where occupations relating to these functions are
prominent. The sector has a better gender split. Some 50% of the workforce is female.
This is due in large part to many traditional female roles such as sewing machining
remaining heavily represented in the sector. and BAME representation is comparatively
high at 16%, while 47% of the workforce is over 45.398
Total GVA for the sector in the UK is £11.5 billion399. Confidence across the sector is
centred heavily on the emergence of high value added and niche production and
movement into wholesaling and technical areas as firms have adapted to the global
forces. The ability to exploit export markets keen for “the British brand” is a big area of
importance.
Supply
The Fashion and textile sector face several supply side issues. These include a poor
image among potential recruits, low entry level wages with a median wage of £17,000,
a lack of awareness of career opportunities across the sector, poor industry links into
education, poor recruitment mechanisms and a lack of suitably tailored learning and
development opportunities.
Skills shortages
Skills shortages are particularly evident in the East of England, the South West and the
North East. Employers in the Footwear and Leather sub-sector are the most likely to
have skills shortages with 67% reporting they felt skills shortages were an issue if they
were looking to recruit. In terms of occupations, sewn product operations, textile
process operations, laundry and dry cleaning operations, garment alteration and repair,
pattern cutting and grading, hand craft garment making, designers and textile
technologists were all in short supply. Particular shortages were noted among
supervisors and a concern identified that traditional skills were being lost, especially in
industries such as shoe making. Also in short supply were engineers, supply chain
managers, dyers and screen printers.
398
Annual Population Survey 2009
399 tbr 2008

125
Skills Gaps
Some 16% of establishments suffer from skills gaps.400 This rises to 21% in the South
West and 12% in Greater London. The design sub-sector reports the highest levels of
skills gaps with 20% and Footwear and Leather the smallest with 11%. Of those skills
gaps identified management and leadership skills, oral and written communication
skills, customer handling skills and general numeracy, literacy and problem solving
skills were the most frequently referenced. Moreover traditional craft skills such as
pattern cutting seem to be diminishing.
Future Skills Needs
A key area identified was keeping traditional craft skills alive as current practitioners
retire. Design remains a high priority area with 36% of employers employing a
designer. Technical, practical and job specific skills were identified as a key
requirement by 54% of businesses. But so too were customer handling, general IT
skills, team working and management and leadership skills. General business skills
such as marketing, finance and supply chain management were all required in the
future.
400
Fashion and Textiles Employer Survey 2008

126
4. Anticipating What Lies Ahead
Increasingly the Creative Industries market is a global market. Content for Computer
Games, Advertising, Film, Television (especially the UK‟s excellent record in exporting
TV formats), Animation, Literature, Fashion and Textiles Performing Arts, Music, and
Publishing are all globally integrated sectors. Even Cultural Heritage is competing on a
global stage with other countries with strong cultural heritage industries.
For example the Creative and Cultural industries under CCSkills footprint are expected
to grow significantly over the next ten years. Employment in the industry will increase
by 32% in the coming decade. This is approximately five times the rate of the UK
economy in general. In the industry, there will be a need for more than 310,000 more
people to enter the sector whether it is by replacing existing jobs or through natural
expansion401. Research undertaken by the UKCES402 suggests that growth in the
industry (55%) will be in „associated professional and technical roles‟, those requiring
specialist technical skills.
Meanwhile, employment in “professional” and “associated and technical roles” will
increase at a faster rate than compared to the UK as a whole (26% compared to 15%
respectively)403. This places a huge emphasis on the industry and its support
mechanisms to prepare people with the right skills for these growth areas. It would
seem vital, therefore, that businesses begin to invest in training in associate
professional and technical roles as soon as possible.
Currently, however, organisations in the industry tend not to „think forward‟ in terms of
the skills issues that might affect them in the future. Nearly a third of businesses (32%)
do not anticipate future skills gaps, and 11% are unable to predict what they might be,
though digital and ICT skills score highest (see table 10)404.
401
Creative & Cultural Skills (2011) Occupational, Skills and Productivity Forecasting. Creative & Cultural
Skills
402 UKCES (2008) Working Futures 3
403 Ibid
404 Creative & Cultural Skills (2009) Creative and Cultural Industries Workforce Survey
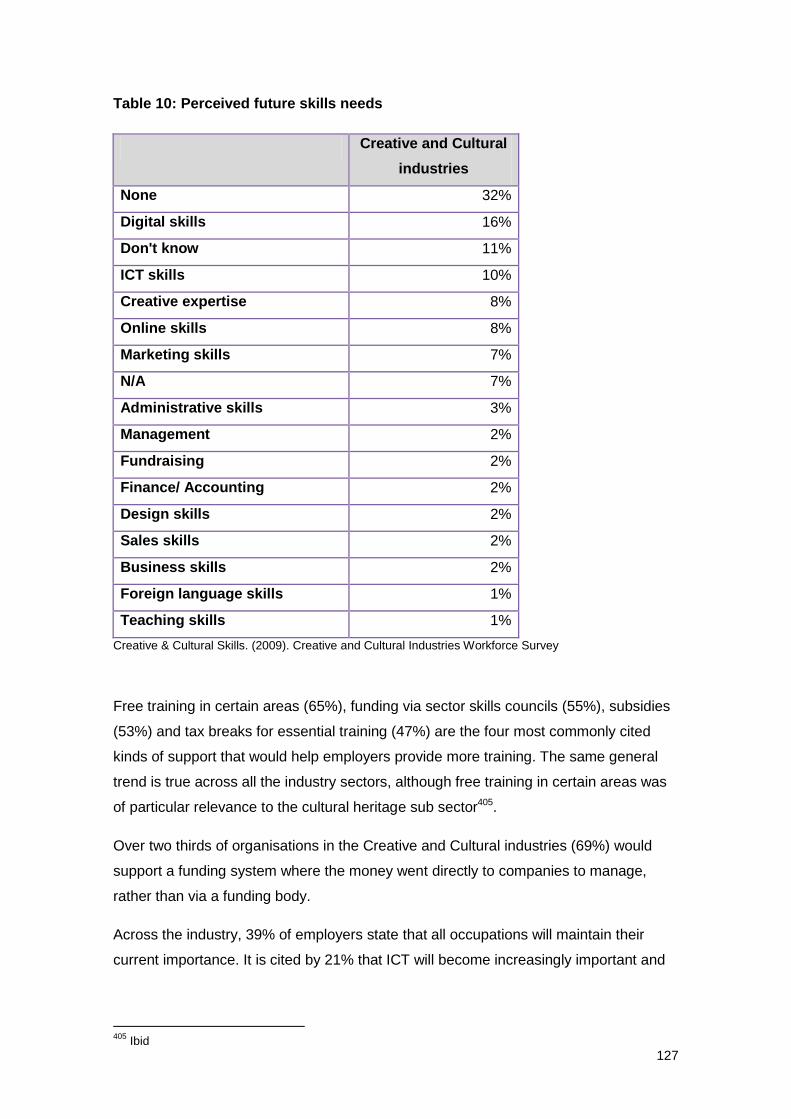
127
Table 10: Perceived future skills needs
Creative and Cultural
industries
None 32%
Digital skills 16%
Don't know 11%
ICT skills 10%
Creative expertise 8%
Online skills 8%
Marketing skills 7%
N/A 7%
Administrative skills 3%
Management 2%
Fundraising 2%
Finance/ Accounting 2%
Design skills 2%
Sales skills 2%
Business skills 2%
Foreign language skills 1%
Teaching skills 1%
Creative & Cultural Skills. (2009). Creative and Cultural Industries Workforce Survey
Free training in certain areas (65%), funding via sector skills councils (55%), subsidies
(53%) and tax breaks for essential training (47%) are the four most commonly cited
kinds of support that would help employers provide more training. The same general
trend is true across all the industry sectors, although free training in certain areas was
of particular relevance to the cultural heritage sub sector405.
Over two thirds of organisations in the Creative and Cultural industries (69%) would
support a funding system where the money went directly to companies to manage,
rather than via a funding body.
Across the industry, 39% of employers state that all occupations will maintain their
current importance. It is cited by 21% that ICT will become increasingly important and
405
Ibid

128
12% understand that marketing will become increasingly important to achieving a high
level of success over the next few years406.
Individual sectors generally follow the same pattern as the overall footprint, although
fundraising is forecast to be of increasing importance in the cultural heritage sub sector
(19%) and creative writers are expected to be important to success in the literary arts
sub sector (23%)407.
The UK‟s Creative Industries are likely to recover to resume at least the growth rates
they enjoyed before the recession both in terms of economic performance and
employment. The international competitiveness of the industry will remain steady. The
financial and political constraints faced by publicly funded organisations and cultural
institutions mean that occupational growth mainly occurs in the private sector until
2015; significant job cuts will be seen in the public sector. In an attempt to replace lost
income, fundraising and business development occupations in the public sector will
grow at an increased rate – necessitating an increase in fundraising, communication
and engagement skills to match demand. From 2010, annual public sector funding will
decrease until after 2015, where it levels out and begins to increase again annually,
though at a slower rate of growth than private funding. Occupational growth will
therefore be limited and slower in the public sector compared with the private sector
post-2015408.
Government procurement and private sector investment will be increasingly focused on
the green economy. Occupations and businesses in the design industry which support
work on these large-scale issues will grow, with a new green bank being established
for SMEs to access finance to undertake work in this area.409 Developments in digital
technology will result in higher growth rates for occupations having a strongly digital
element. ICT skills will also be in increasingly high demand as businesses and
organisations continually integrate new technologies into their operations410.
Both extremely specialised, highly skilled occupations requiring level 4 and above skills
and specific technical occupations that occur at level 3 will be in high demand. While
level 2 and below skills will not necessarily grow at a high rate, they are still essential to
the makeup of the sector and so occupations will not decline significantly in these
406
Ibid 407
Ibid 408
HM Treasury, Budget 2010, www.hm-treasury.gov.uk/d/junebudget_complete.pdf 409
Ibid. 410
BIS and DCMS (2009), Digital Britain, http://webarchive.nationalarchives.gov.uk/20100511084737/http://www.culture.gov.uk/images/publications/digitalbritain-finalreport-jun09.pdf

129
areas.411 The number of creative level 3 Apprenticeships being undertaken will
increase both amongst young people and adults, as individuals seek to up-skill or re-
skill in order to enter into specific roles within the sector. This slight shift towards
vocational qualifications is also facilitated by higher education policy under which
Higher Education (HE) qualifications are more expensive to the individual and are
accompanied by increased uncertainty surrounding finding work after the qualification
is completed.412 Internships and unpaid work experience will continue to be one of the
methods by which graduates can gain entry into such a sought after sector.413
Due to the consistent oversupply of graduates to the sector, creative occupations in
non-creative sectors continue to grow. This is also in part due to increasing recognition
by non-Creative and Cultural industries of the importance of creative thinking in
innovation and the role it can have in driving more general economic productivity414.
More generic employability and workplace skills are therefore in increased demand
from those in creative occupations outside the industry.
GVA contributed to the UK economy by the Creative and Cultural industries is forecast
to grow by 31% between 2010 and 2020. In contrast, GVA for the UK economy is
predicted to grow by only 25% over the same period. Annual GVA growth in the
industry is predicted to be lower between 2010 and 2012 than in the years following
this to 2020. Growth is lowest between 2012 and 2013, when it is predicted to increase
by 1%, compared to between 2019 and 2020, when it is forecast to grow by 4%.
Most Creative and Cultural sectors are expected to experience at least modest growth
in GVA over the period 2010 to 2020, with craft and cultural heritage the only
exceptions. The greatest GVA growth between 2010 and 2020 is predicted for the
performing arts, where GVA is expected to increase by approximately 74% by 2020.
Despite difficult economic conditions, employment in the Creative and Cultural
industries is forecast to grow by an average of 3% per year between 2010 and 2020
and have an overall increase of 32%. In contrast, the whole UK economy is predicted
to grow in employment by 6% in the same period.
411
UKCES, Skills for Jobs: Today and Tomorrow; The National Strategic Skills Audit for England 2010,
www.ukces.org.uk/upload/pdf/NSSA_Volume%201_FINAL_BOOKMARKED_110310.pdf
412 See, for example, www.guardian.co.uk/education/2010/jul/06/graduates-face-tougher-jobs-fight
413 New Deal of the Mind (2010), Creative Survival in Hard Times,
www.artscouncil.org.uk/media/uploads/publications/Creative_Survival_NDotM_for_ACE_march_2010_FIN
AL.pdf
414 NESTA (2008), Beyond the Creative Industries: Mapping the Creative Economy in the UK,
www.nesta.org.uk/library/documents/beyond-creative-industries-report.pdf

130
However there is an alternative more aspirational scenario for the Creative Industries
that places them at the very heart of Britain‟s economy. By 2020, the industry will
generate more GVA than the financial services sector415. The Creative Industries will
be a core player in the economy driving productivity and innovation within all areas of
industry.
Changes to legislation and general digital infrastructure will see the rapid growth and
democratisation of content creation and online services416. The music sub-sector will
experience growth from increased legal protection, allowing independent hobbyist
labels to achieve modest growth. Alongside this, content creation for cultural heritage,
certain areas of design and the digitalisation of literature will all create occupational
growth in their individual sectors417.
The implementation of infrastructure enabling wide-scale access to super-fast
broadband will open the online market to those currently barred due to inadequate
internet speeds; it will also increase the feasibility of relocation for creative businesses
to regional bases outside of London in order to lower operating costs. The spread of
occupational growth will therefore be wider, although creative clusters of high
occupational density will remain centred on current hotspots; including London,
Manchester, Edinburgh and the East of England.418
Despite increasingly open international markets, the UK is able to maintain its current
competitive advantage through high levels of innovation, as well as the continuing
cultural pervasiveness of the English language. The requirement for quality services
and products prevents outsourcing of creative work outside the UK, allowing the UK to
be the leading cultural centre in the world.419
Despite a continuing decrease in spending by the public sector on the arts, income is
supplemented by private philanthropy. This occurs both at individual and organisational
415
The Work Foundation, Innovation, Creativity and Entrepreneurship in 2020: A Work Foundation
Statement, www.theworkfoundation.com/assets/docs/publications/241_pre_budget2010a.pdf
416 BIS and DCMS (2009), Digital Britain,
http://webarchive.nationalarchives.gov.uk/20100511084737/http://www.culture.gov.uk/images/publications/
digitalbritain-finalreport-jun09.pdf
417 The Economist, The Future of Books,
http://globaltechforum.eiu.com/index.asp?layout=rich_story&channelid=5&categoryid=15&doc_id=10370
418 NESTA (2009), The Geography of Creativity, www.nesta.org.uk/library/documents/Report%2027%20-
%20Geography%20of%20Creativity%20v4.pdf
419 UKCES, Praxis: Skills are not enough: The globalisation of knowledge and the future UK economy,
www.ukces.org.uk/upload/pdf/PRAXIS%20Edition%204%20WEB%20READY_1.pdf

131
level, leading to improved links between creative businesses and organisations in other
sectors420. Public sector organisations thus become less bureaucratic and target-led,
instead being able to innovate and lead on large projects within the sector421.
The ability of the Creative and Cultural industries to help tackle large societal and
environmental problems is increasingly recognised. The design industry, alongside
science, technology, engineering and mathematics becomes crucial to supporting the
huge occupational surge towards the low carbon and green economy. The Creative
Industries are seen as having a large and fundamental part to play in this shift.422
Entry to occupations in the sector will start to come from a wider pool of talent.
Regulations on the payment of interns and the amount of unpaid labour that firms are
allowed to use will begin to come into effect, allowing people from different social
groups to gain valuable work experience that may otherwise have been closed to
them.423 While higher education qualifications at level 4 or above will remain the
dominant route into the sector, the main shift will be towards vocational qualifications,
manifested in Apprenticeships. This change will allow for skills shortages in
occupations relating to technical theatre, backstage and offstage to be satisfied.
Employers will increasingly employ people on the basis of having the correct skills
rather than a certain qualification.
Finally, creativity is seen as commanding such a premium that creative occupations in
non-creative industries grows rapidly, with the constant supply of highly educated
graduates able to make an impact on other sectors, leading to broader economic
productivity and growth.
In the aspirational scenario, within the industries under CCSkills footprint, total annual
employment demand is forecast to increase from approximately 288,000 in 2011 to
527,000 in 2020. This is the total number of individuals required to replace those who
have left their job in a year (replacement) plus any sector growth in overall employment
(expansion). The number of people required to satisfy replacement demand is
420
Conservative Party (2010), The Future of the Arts with a Conservative Government,
www.vaga.co.uk/images/stories/file/future-of-the-arts_ashx.pdf
421 Ibid.
422 The Work Foundation (June 2010), A 2020 Low Carbon Economy,
www.theworkfoundation.com/Assets/Docs/lowcarbonFINAL_CORRECTED.pdf
423 Skillset, Code of Practice for Graduate Internships in the Creative Industries,
www.skillset.org/uploads/pdf/asset_14315.pdf?1 and See, http://internsanonymous.co.uk/resources/

132
predicted to increase steadily in future years.
Creative Industries and the Current VET System
If the Creative Industries sector is going to maximise its future opportunities national
vocational educational training (VET) policy urgently needs to better address the
powerful singularity of the sector.
This is not a sector dominated by mature, large employers that can offer secure
organisational labour markets replete with a full suite of in-work and off-site provision.
The strength of the sector is its diverse provision of atypical employment characterised
by a strong external labour market (ELM).
But this strength in labour supply terms – a highly qualified, highly entrepreneurial and
adaptive talent pool – means the sector is leaning into a head wind in terms of VET and
broader public policy.
For example, the absence of many large firm employers, and the large number of small
firms and freelancers in particular424, makes it a difficult sector to influence through
public policy. Employers with larger number of employees generally have greater
requirements placed on them than smaller ones, and equal opportunities and other
legislation apply more comprehensively. More specifically, when recruitment and
promotion criteria are as informal as they are in the cultural sectors, it‟s sometimes
difficult for public policy to gain any firm purchase on labour force development
issues.425
Future progress will require a wider acceptance that a sector dominated in large part by
external labour markets needs a far more flexible skills system. The current VET
system is therefore not serving this sector well.
4.1 A Necessary Broadening and Deepening of the Skills
Base
Across all Creative Industries, there is recognition of the dramatic changes brought
about by the digital environment and the need to up skill to make the most of it. The
change to the public spending environment is also putting a premium on fundraising
424
Skillset (2009) Employment Census, Skillset/UK Film Council (2008) Feature Film Production Workforce Survey 2008, LFS July 2009 – June 2010. 425
See K. Oakley (2009) „Art Works’ – cultural labour markets: a literature review’ Creativity, Culture and Education Series

133
skills in some sub sectors of Creative Industries. The following are of particular
importance:426
Multi-skilling: an understanding of different technology platforms and their
impact on content development and digital work flow, and new approaches to
working in cross-functional creative / technical teams within and across
companies.
Multiplatform skills (relevant to some digital sectors of the Creative Industries):
the creative and technical skills to produce content for distribution across all
potential platforms, and the ability to understand and exploit technological
advances. Recent research confirms that creative businesses and having to
invest heavily in in-house R&D and new software and hardware, which in turn
means that a significant and growing proportion of their staff are focused on
activities that require high levels of technology rated skills.427
Management, leadership, business and entrepreneurial skills: especially project
management for multiplatform development; the hybrid skills combining
effective leadership with innovation, creativity and understanding of technology,
and the analytical skills to understand audience interests and translate it into
business intelligence.
IP and monetisation of multiplatform content: understanding of intellectual
property legislation to protect from piracy, and exploiting intellectual property
internationally to take full advantage of emerging markets - with particular focus
on the ability to deal with the problem of illegal downloading and copyright
infringement.
Broadcast engineering: continuing to be an area of skills shortage.
Archiving: archiving of digital content being an area which is attracting
increased attention as a challenging issue for the future.
Sales and marketing: being particularly important in Commercial Radio and an
emerging need in other sectors.
426
Skillset (2010) Creative Media Employer Survey; Skillset (2008) Creative Industries Workforce Survey; Skillset/UK Film Council (2009) Feature Film Production Workforce Survey; Evidence from Focus Groups carried out with industry representatives in October 2010. 427
Chapain, C et al (2010.32) „Creative clusters and innovation: putting creativity on the map’ NESTA

134
Diagonal thinking skills: the ability to tell great stories, then know how to
monetise those stories to the best effect utilising media that cross platforms and
territories well.
Supply chain management: managing disaggregated production processes
across continents
Foreign language skills: as part of operating in a global marketplace
Other Business Skills: These include Human Resources competency, financial
management and project management
Fundraising skills: These are particularly in demand for Performing Arts, Visual
Arts and Cultural Heritage.
Creative skills: These include skills such as story-writing, music composition,
etc and are often in demand for Film, Literature, Performing Arts, Music and
Cultural Heritage sub sectors.
Appropriate “associate professional and technical roles: the sector is highly
qualified, but has skills shortages and gaps in specialist roles. Much of the
training that occurs does so to re-skill individuals entering the sector, which is
then very ad hoc and informal and resource heavy for small businesses.
The breadth and depth of these up-skilling requirements underline the scale of ongoing
transformation the sector needs to affect in its skills base.

135
5. The Geography of the Creative Industries
Sector Employment across the UK
Both Skillset and CCSkills have produced detailed SSAs for each nation and these
should be examined to understand the sub sector granularities around the geography
of the Creative Industries.
On the whole London and the South East dominate the Creative Industries. These two
regions have the greatest concentrations of Creative Industry employment and
businesses accounting for around 30% or more of the sector total.
Creative Industries, like other sectors such as Finance and some types of high tech
manufacturing, enjoy the benefits of clustering. There is a rich literature on why
clustering occurs and why it is beneficial to businesses. Suffice to say clustering is
usually endogenous and occurs due to the congruence of a number of different factors
including natural resources (the light to be found in California for example that helped
establish Hollywood as a centre of film-making); links to customer base; concentration
of talent and proximity to research establishments; good transport by air, road and rail;
ease of face-to-face contact and strong network externalities. The fact that clusters
tend to be endogenous constructs creates a problem for policy-makers wishing to
stimulate industrial growth in particular parts of the country. Indeed Creative Industries
is very much part of the new North-South divide of the knowledge economy whereby
north of the Watford Gap there really is no private sector knowledge economy to speak
of.428
There are however considerable differences between sub-sectors in geographical
distribution: for example, because of the prominence of regional and local radio within
both the BBC and the commercial sector, and the growth of Community Radio, Radio is
distributed more evenly throughout the UK than many sectors.429 Conversely, sectors
such as Independent Production for Television, Film Production, Commercials and
Corporate Production all remain very London-centric.430 Fashion and Textiles have
major concentrations of employment away from London and the South East in the East
Midlands, North West and Yorkshire and Humber for example. Indeed unlike other
428
Clayton, N (2008) Enterprise Priorities to Enterprise Powerhouses: The Public Sector in the Knowledge Economy The Work Foundation, London
429 Skillset (2009) Current and Future Skill Needs in the UK Television and Radio Industry
430 Skillset (2009) Employment Census

136
parts of the Creative Industries the London and South East bias is not in evidence for
Fashion and Textiles.
A recent study carried out by NESTA maps the UK‟s creative clusters and shows that
London is the heart of the Creative Industries in Britain, dominating in almost all
creative sectors, and particularly in the most intrinsically creative layers of the value
chain for each sector. The high level of geographical detail used in the mapping
allowed nine other creative hotspots across Britain to be pin-pointed. They are Bath,
Brighton, Bristol, Cambridge, Guildford, Edinburgh, Manchester, Oxford and Wycombe-
Slough. 431
In recent years, there have been some major endeavours and interventions to
redistribute some sectors more evenly throughout the UK. This is illustrated most
clearly in the relocation of large segments of the BBC‟s workforce, mainly from London,
to Salford Quays in the North West of England and a corresponding decrease in West
London from 16% to 13%, which is reflected in Skillset‟s 2009 Employment Census.
431
Creative clusters and innovation: Putting creativity on the map, NESTA, November 2010

137
Annex A: Methodology Section
For the variety of methodologies used in preparing this Creative Industries cluster
report please refer to the individual SSAs provided by Skillset, CCSkills and e-Skills as
appropriate.
Combined footprint analysis for Skillset and CCSkills of the Labour Force Survey
(LFS) and National Employer Skills Survey (NESS)
An analysis of data from the LFS (Jul 2009 - Jun 2010) and NESS 2009 was
undertaken for the purpose of the summary report. A variable for analysis was created
using Standard Industrial Classification (SIC) codes from the contractual footprints of
Skillset and Creative and Cultural Skills. LFS data from Jul 2009 - Jun 2010 was used
to remain consistent with other LFS data reported in the UK SSA and Wales summary.
Limited representation of the industry
The figures represent the Standard Industrial Classification (SIC) codes contracted
to Skillset and CCSkills by the UKCES but do not represent the full extent of the
industries that these sector skills councils are licensed to support.
The data exclude many of those working in Interactive Media, Content for Computer
Games, Facilities, and freelancers currently not in employment.
Other sectors poorly represented by the data are Design, Literature, Visual Arts,
Music, Performing Arts and all Craft activity.
Figures exclude Fashion and Textile Wholesalers, Repair of Footwear and Leather
Goods, and Laundry and Dry Cleaning sectors due to the limited creative activity
within these.
Figures exclude those working in the Reproduction of Video Recording and the
Manufacture of Men‟s Underwear due to insufficient sample sizes.
Table A: 2 digit SIC codes included in the analysis of data from the LFS
Creative media
18.20/2 Reproduction of video recording
58 Publishing
59 Motion picture, video and TV production activities
60 Programming and broadcasting activities
63.91 News Agency activities
63.99 Other information Service activities n.e.c.
73.1 Advertising

138
Fashion and textiles
13 Manufacture of textile
14 Manufacture of wearing apparel
15 Manufacture of leather and related products
20.6 Manufacture of man-made fibres
46.16 Agents involved in the sale of textiles, clothing, fur, footwear and leather goods*
Creative and cultural
18.20/1 Reproduction of Sound Recording
32.1 Manufacture of jewelry, etc
32.2 Manufacture of musical instruments
59.2 Sound Recording and Music Publishing Activities
74.1 Speciality Design
85.52 Cultural Education
90 Creative, arts and entertainment
91.02 Museum Activities
91.03 Operation of Historical Sites and Buildings and Similar Visitor Attractions

139
Annex B: Creative Industries and Gaps in Official
Data Sources
Official data sources that rely on Standard Industrial and Standard Occupational
Classifications are broadly effective for photo imaging and publishing for the purpose of
collecting and representing employment and some skills data but less useful for
capturing data for the rest of the industry. As noted earlier,
Key elements of the Creative Industries sit in broad classifications that
include activity outside of Creative Industries preventing any discrete and
crucial analysis e.g. Interactive Media, Content for Computer Games and
Facilities.
Official data sources to a greater or lesser extent systematically exclude
the discrete and increasing freelance labour pool required to create and
distribute the creative content upon which our digital economy is
becoming increasingly reliant.
In some cases sample sizes are too small to enable discrete analysis of
data contained within SIC that do exist, particularly to the 5-digit SIC level.
The Creative Industries and DCMS with Skillset first reviewed data available for this
part of the industry from the ONS and other sources in 1999 and concluded that
additional data are required to measure as a priority the size, shape and specific skills
demand of the Creative Industries its constituent sectors and large freelance labour
pool to a granular and commonly understood sub-sectoral level, using bespoke
methodologies to ensure adequate sample sizes. In some cases equivalent data
cannot be generated e.g. GVA and GDP and so these measures exclude contributions
from elements not served well by SIC e.g. Interactive Media, Facilities (excl. Post
Production), Content for Computer Games and freelancers.
In many cases, the SIC and SOC systems simply do not provide the level of detail
required, as noted above. In other cases within the SIC system, whilst the system itself
provides the level of detail required, the sample size of surveys that underpin the key
data sources, such as the ABI which measures productivity, are in fact too small to
offer robust detailed analysis. As well as systematically excluding sole traders, as far
as business activity goes, little data are available at 5-digit SIC level and for example
production and distribution activity cannot be disaggregated.
Both the SIC and SOC systems are hierarchical. Within the 2007 SIC system there are
21 sections, 88 divisions, 272 groups, 615 classes and 191 subclasses. While the new
system does allow for much easier identification of certain industries, such as sound

140
recording in the Music sub-sector, unfortunately it is still not sufficiently detailed to pin
point the specific activities, the only Craft activity covered is Jewellery, for example,
however, the UK‟s Craft sector clearly encompasses more activity than this.
So in some cases, the SIC and SOC systems simply do not provide the level of detail
required, in other cases, whilst the system itself provides the level of detail required,
government data is not released in such a way to allow that activity to be analysed.
Coupled to this policy of non-disclosure, the Office of National Statistics (ONS) is also
keenly aware that the size of the surveys that underpin key data sources (APS and
ABI) are in fact too small to offer robust detailed analysis of smaller sub-sectors. As far
as business activity goes, the line is drawn at 4-digit SIC. In other words, no ONS data
from the sources most organisations can call upon is available at 5-digit SIC level.
The only way to resolve this issue (in the absence of information at 5-digit level) is to
use other data sources to split the activity out into its constituent 5-digit elements, and
through primary research. The government‟s register of business activity (the Inter-
Departmental Business Register – which contains information on 2.7m businesses that
are either registered for VAT, PAYE or at Companies House) is not generally available
(especially at the level of individual firms) but would be an ideal source. Each listed
business site has a 5-digit SIC and an analysis of it would therefore derive robust
„coefficients‟ for splitting firms and employment data at 4-digit level into constituent 5-
digit SICs. The new system has fewer sub classes which means the problem of
accessing the 5-digit SIC does not occur as often, but there are still some that exist.

141
Annex C: Research strategies developed by
CCSkills and Skillset
Creative & Cultural Skills
Creative & Cultural Skills has developed a series of coefficients to denote the creative
proportion of a SIC or SOC. These coefficients are then used to identify employment
and business numbers within the creative and cultural industries. An example of the
use of such coefficients are described in table x, below. All coefficients are derived
through examining the business activity description of each business within each SIC
code using TCR data432. Employment estimates are then calculated by applying each
coefficient to the relevant SICs employment. After this step has been carried out, the
proportioned employment of each SOC in Creative & Cultural Skills‟ definition is then
removed from each SIC in order to avoid double counting.
Table 1: Example from the creative and cultural footprint
Sub-Sector
Segment Sub-Segment SIC Firm Coefficient
Emp Coefficient
Music Composition of Musical Works & Music Publishing
Publishing of Sound Recordings
5920: Sound recording and music publishing activities
33.90% 57.10%
Live Performance Venues 7990: Other reservation service and related activities
3.10% 2.10%
9001: Performing arts 0.50% 1.50%
9004: Operation of arts facilities
77.60% 73.10%
Musical Education Musical Education 8552: Cultural education 15.70% 27.30%
Production, Retail & Distribution of Musical Instruments / Audio Equipment
Musical Instrument Manufacture
3220: Manufacture of musical instruments
100.00% 100.00%
9529: Repair of other personal and household goods
86.30% 79.30%
Retail Audio Equipment
4743: Retail sale of audio and video equipment in specialised stores
83.00% 77.00%
432
Trends Central Resource

142
4759: Retail sale of furniture, lighting equipment and other household articles in specialised stores
0.00% 0.10%
Retail Musical Instruments
4759: Retail sale of furniture, lighting equipment and other household articles in specialised stores
6.90% 5.10%
TV radio HiFi etc eqt manufacture
2640: Manufacture of consumer electronics
93.00% 89.40%
Wholesale Audio Equipment
4643: Wholesale of electrical household appliances
8.90% 16.70%
Wholesale Musical Instrument
4649: Wholesale of other household goods
0.45% 1.70%
Promotion, Management & Agency Related Activities
Promotion, Management & Agency Related Activities
8299: Other business support service activities n.e.c.
0.10% 0.20%
Recording Recording Media Mfr
2680: Manufacture of magnetic and optical media
98.00% 97.30%
Recording Studios 5912: Motion picture, video and television programme post-production activities
17.50% 49.00%
5920: Sound recording and music publishing activities
43.50% 29.70%
Sound Recording 1820: Reproduction of recorded media
95.30% 88.80%
5920: Sound recording and music publishing activities
9.10% 4.40%
Retail & Distribution of Recordings
Retail of Recorded Music
4763: Retail sale of music and video recordings in specialised stores
87.30% 91.00%
Wholesale of Recorded Music
4643: Wholesale of electrical household appliances
1.70% 6.00%
By taking this approach, it is possible to analyse parts of the creative industries which
have so far been neglected, table x below shows how craft data can be collected from

143
a variety of different SIC codes (in this example crafts associated with pottery and
ceramics are highlighted).
Table 2: Example from the craft footprint
Segment SIC Firm
Coefficient
Emp
Coefficient
Pottery & Ceramics
2331: Manufacture of ceramic tiles and flags 6.90% 0.90%
2341: Manufacture of ceramic household and ornamental articles 73.70% 31.70%
9003: Artistic creation 0.50% 0.10%
Skillset
Skillset‟s current research programme433 dedicated to the Creative Media industries
originated in 1999 under the leadership of the DCMS/Skillset Audio Visual Training
Group434. The group acknowledged a gap in available labour market data for the
Creative Media industries and charged Skillset with filling that gap with the introduction
of a primary research programme. The report of this group was published in 2001 and
included the first Research Strategy for Skillset. Since then the scope of the research
programme has expanded to include the photo imaging sector (in 2004) and the
publishing sector (in 2008) and primary research has been conducted by Skillset on
these sectors since according to need. From April 2010 Skillset‟s remit has expanded
to include fashion, textiles and advertising and are accommodated in year three of this
Strategy.
The Skillset research programme was set up by the industry with relevant Government
departments to routinely and systematically generate the evidence needed to address
the Creative Media industry‟s skills issues. It is delivered by a fully proficient and
qualified in house research team and for the past eleven years has been continuously
developed and improved to provide both Skillset and industry in the four UK nations
433
2011 Skillset Research Strategy for the Creative Media Industry 2008-2011
434 The group comprised creative media industry employers, trade associations and trade unions, Skillset
staff and Government departments including the Department for Trade and Industry, the Department for
Culture Media and Sport and the Department for Education and Skills.

144
with the Labour Market Intelligence (LMI) required to target resource to where it‟s
needed
Where data are not available within official sources components are operationalised
through primary research with technically robust, fit for purpose and transparent
methodologies.
All primary research retains consistency and comparability with data generated
externally (by the ONS for example) to enable transparency, clarity and comparisons
with the wider economy in the UK and cross-nationally, but with the added value of
including all Creative sectors and presenting data and analysis for discrete Creative
sectors, occupations and employees and freelancers.
This bank of intelligence, as well as the design of methodologies, is informed wherever
possible by data and information generated externally by other organisations including
the Broadcast Training and Skills Regulator (BTSR) and trade publications including
Broadcast for example, the process of which is shown in figure 4, below.

145
Figure 2: Skillset research cycle435
435
Ibid

146
Annex D: Data Sources
Annual Population Survey, NOMIS. Residents aged 16-Retirement
Annual Report, Ofcom 2009.
Annual Review, NESTA, Feb 2009
Archives Skills Strategy, 2009
Attacking the Recession: How Innovation Can Fight the Downturn‟, NESTA
Discussion Paper, December 2008.
Balancing Children and Work in the Audio Visual Industries‟, 2006.
Berger, S et al (2005), How We Compete, Currency/Doubleday, New York, NY
Building Britain‟s Future: Jobs of the Future‟, HM Government September 2009.
Building Britain‟s Future: New Industry, New Jobs‟, Department of Business,
Enterprise and Regulatory Reform, April 2009.
Business Innovation Survey‟, DBIS, August 2009.
Clayton,N (2008) Enterprise Priorities to Enterprise Powerhouses: The Public
Sector in the Knowledge Economy The Work Foundation, London
Creative & Cultural Skills and TBR. (2007). NSA Projections. Creative &
Cultural Skills.
Creative & Cultural Skills. (2006). The Creative and Cultural Industries: Impact
and Footprint 2006/07. Creative & Cultural Skills.
Creative & Cultural Skills. (2007). The Creative Blueprint (Stage 2): The Sector
Skills Agreement for the Creative and Cultural Industries – Understanding
Supply. Creative & Cultural Skills.
Creative & Cultural Skills. (2007). The Creative Blueprint: The Sector Skills
Agreement for the Creative and Cultural Industries – Skills Needs Assessment.
Creative & Cultural Skills.
Creative & Cultural Skills. (2008). Creative Blueprint England. The Sector Skills
Agreement for the Creative and Cultural Industries. Creative & Cultural Skills.
Creative & Cultural Skills. (2008). Creative Blueprint Northern Ireland. The
Sector Skills Agreement for the Creative and Cultural Industries. Creative &
Cultural Skills.
Creative & Cultural Skills. (2008). Creative Blueprint Scotland. The Sector Skills
Agreement for the Creative and Cultural Industries. Creative & Cultural Skills.
Creative & Cultural Skills. (2008). Creative Blueprint Wales. The Sector Skills
Agreement for the Creative and Cultural Industries. Creative & Cultural Skills.
Creative & Cultural Skills. (2008). Sector Qualifications Strategy. Creative &
Cultural Skills.

147
Creative & Cultural Skills. (2008). The Creative and Cultural Industries: Impact
and Footprint 2008/09. Creative & Cultural Skills.
Creative & Cultural Skills. (2009). After the Crunch. Creative & Cultural Skills
Creative & Cultural Skills. (2009). Creative and Cultural Industries Workforce
Survey. Creative & Cultural Skills.
Creative & Cultural Skills. (2010). Sector Skills Assessment for the Creative and
Cultural Industries 2010. Creative & Cultural Skills.
Creative & Cultural Skills. (2011). Creative and Cultural Industry: Occupational,
Skills and Productivity Forecasting. Creative & Cultural Skills.
Creative & Cultural Skills. (2011). The Creative and Cultural Industries: Impact
and Footprint 2010/11. Creative & Cultural Skills.
Creative Britain – New Talents for the New Economy‟, DCMS February 2008.
Creative Industries Economic Estimates Statistical Bulletin‟, DCMS January
2009
Creative Industries Employer Survey‟, 2010 (to be published early 2011)
Creative Industries LMI Digests‟, 2009.
Creative Industries Technology Strategy 2009-2012‟, Technology Strategy
Board 2009.
Creative Industries Workforce Survey‟, 2008, 2005, 2003.
Cultural Leadership Programme/TBR. (2009). Women in Leadership. CLP.
Deloitte 200
Demanding Growth‟, NESTA, 2009.
Department for Business Innovation and Skills. (2010). Skills for Sustainable
Growth. BIS.
Department for Business Innovation and Skills. (2010). The path to strong,
sustainable and balanced growth. BIS
Department for Business, Enterprise and Regulatory Reform. (2006). Non-
certified learning and skills: incidence in the UK, variation across countries and
links to productivity. BERR.
Department for Business, Innovation and Skills. (2009). Jobs of the Future. The
Stationary Office
Department for Business, Innovation and Skills. (2009). New Industry, New
Jobs. The Stationary Office

148
Department for Business, Innovation and Skills. (2009). Skills for Growth: The
National Skills Strategy. The Stationary Office
Department for Business, Innovation and Skills. (2010). Skills for Growth. The
Stationary Office
Department for Culture, Media and Sport. (2008). Creative Britain: New Talents
for the New Economy. Department for Culture, Media and Sport.
Department for Culture, Media and Sport. (2010). Creative Industries
Economics Estimates 2010. DCMS
Department for Innovation, Universities and Skills. (2007). World Class Skills:
Implementing the Leitch Report. Department for Innovation, Universities and
Skills.
Department for Innovation, Universities and Skills. (2008). Innovation Nation.
Department for Innovation, Universities and Skills.
Department for Innovation, Universities and Skills. (2008). World Class
Apprenticeships: Unlocking Talent, Building Skills for All. Department for
Innovation, Universities and Skills, Department for Children, Schools and
Families.
Department for Innovation, Universities and Skills. (2009). Digital Britain: Final
Report. The Stationary Office.
Department of Innovation, Universities and Skills. (2008). Higher education at
work: High skills: high value. The Stationary Office
Digital Britain Final Report‟, DCMS June 2009.
DTI Occasional Paper No. 6. Innovation in the UK: Indicators and Insights, July 2006.
Employment Census‟, 2009, 2006, 2004, 2003, 2002, 2001, 2000.
E-Skills, Skillset and Creative & Cultural Skills. (2010). Strategic Skills
Assessment for the Digital Economy. E-Skills, Skillset and Creative & Cultural
Skills.
Feature Film Production Workforce Survey‟, Skillset/UK Film Council, 2008.
Film Sector Employers: Skills and Training Needs in Production, Distribution &
Exhibition, Skillset 2009.
From Recession to Recovery‟, 2009.
Global Media & Entertainment Outlook 2008-2012‟, PWC UK 2008.
Guile,D (2009) Learning to work in the Creative and Cultural sector: new
spaces, pedagogies and expertise
Higgs,P, Cunningham, S and Bakshi, H (2008) Beyond the Creative Industries:
Mapping the Creative Economy, NESTA, London

149
HM Government. (2009). New Opportunities: Fair Chances for the Future. HM
Government.
HM Treasury. (2005). Cox Review of Creativity in Business. HM Treasury.
HM Treasury. (2007). Review of Sub-National Economic Development and
Regeneration. HM Treasury.
Holden, J. (2004). Capturing Cultural Value: How Culture Has Become a Tool of
Government Policy. Demos.
IDEA. (2009). Investing in the Creative Industries, A guide for Local Authorities.
IDEA
Interview in the September 2009 issue of Prospect magazine
Investing in the Creative Industries; A Guide for Local Authorities‟, Work
Foundation, June 2009.
Jones, S. (2006). Expressive Lives. DEMOS
K. Oakley (2009) „Art Works’ – cultural labour markets: a literature review’
Creativity, Culture and Education Series
LFS (July 2009 – June 2010); Labour Force Survey, ONS
Leadbeater, C (2008) We Think Profile Books, London
Leitch, S. (2006). Prosperity for All in the Global Economy: World Class Skills –
Final Report. London: Stationery Office.
Lord Browne. (2010). Securing a Sustainable Future for Higher Education in
England. www.independent.gov.uk
Mapping Creative Industries and Fashion & Textiles Relevant Education and
Learning and development Provision in FE, HE, and the Private Sector in the
UK, 2010 (to be published 2011)
McMaster, B. (2008). Supporting Excellence in the Arts. Department for Culture,
Media and Sport.
Media Predictions', TMT Trends 2009, Deloitte, 2009.
NESS (2009); National Employer Skills Survey, UKCES
Miles,I and Green,L (2008) Hidden Innovation in the Creative Industries,
NESTA, London
NESTA. (2008). The New Inventors: How Users are changing the Rules of
Innovation. NESTA
NESTA. (2009). Demanding Growth. NESTA

150
New Deal of the Mind. (2010). Creative Survival in Hard Times. Arts Council
England.
OFCOM 2008 The Communications Market: Radio
OFCOM Annual Report, 2009.
Parker, S. Tims, C. and Wright, S. (2006). Inclusion, Innovation and
Democracy: Growing Talent for the Creative and Cultural Industries. Demos.
Photo Imaging Workforce Survey‟, 2007 reported in reported in Skillset (2009)
Photo Imaging Labour Market Intelligence Digest
Raise the Game‟, NESTA, 2008.
Sector Qualifications Strategy‟‟, 2008.
Skillset and Creative & Cultural Skills. (2010). Strategic Skills Assessment for
the Creative Industries. Skillset and Creative & Cultural Skills.
Skillset sources:
State of the UK Video Game Development Sector', Tiga January 2009.
Statistical Yearbook‟, UK Film Council, 2008.
Strategic Plan, 2008-2011‟.
Submission to the Development of MAC Shortage Occupation Lists‟, 2009.
Survey of the Audio Visual Industries‟ Workforce‟, 2005.
Technology Strategy Board (2009), Creative Industries – Technology Strategy,
2009 – 2012.
The Advertising Forecast, Advertising Association statistics published by
www.WARC.com. Nielsen Media Research, World Advertising Research
Centre.
The New Inventors: how users are changing the rules of innovation, NESTA,
2008.
The Panel on Fair Access to the Professions. (2009). Unleashing Aspiration.
The Panel on Fair Access to the Professions
The UK‟s Digital Road to Recovery, London School for Economics and Political
Science (LSE) and the Information Technology and Innovation Foundation
(ITIF) April 2009.
The Work Foundation. (2007). Staying Ahead: the Economic Performance of
the UK‟s Creative Industries. The Work Foundation.

151
Tims, C. and Wright, S. (2007). So, What Do You Do? A New Question for
Policy in the Creative Age. Demos.
Training and Skills Report‟, BTSR 2008.
UK creative industry to drive significant growth to UK economy‟, Press release,
NESTA 19/02/2009.
UK Music. (2009). Music Experience and Behaviour in Young People. UK
Music.
Understanding the Impact of Online Trading on the Occupations and Skills
within the UK‟s consumer facing business sectors‟, IFF Research on behalf of
Skillset, e-skills UK, Skillsmart Retail, People 1st, GoSkills and Financial
Services, 2008.
UNESCO. (2009). Key Role of Creative and Cultural Industries in the Economy.
UNESCO
United Kingdom Commission for Employment and Skills. (2008). Working
Futures 3. UKCES.
United Kingdom Commission for Employment and Skills. (2009). Skills for Jobs:
Today and Tomorrow – The National Skills Audit for England 2010. UKCES.
United Kingdom Commission for Employment and Skills. (2010). Ambition 2020
World Class Skills and Jobs for the UK: 2010 update. UKCES
United Kingdom Commission for Employment and Skills. (2010). Employment
and Skills Almanac. UKCES.
United Nations Conference on Trade and Development. (2008). Creative
Economy Report. UNCTAD.
User Generated Content, Social Media and Advertising‟, IPA, April 2008.
William J Baumol, The Free Market Innovation Machine: Analyzing the Growth
Miracle of Capitalism, Princeton University Press 2002
Working Futures 2007-2017‟, Warwick Institute for Employment Research (IER)
and Cambridge Econometrics, December 2008.
Web only sources:
BIS, 2009 www.berr.gov.uk/whatwedo/sectors/publishing/index.html.
www.nesta.org.uk/areas_of_work/creative_industries.
www.culture.gov.uk/images/publications/CEPFeb2008.pdf
www.ukces.org.uk/upload/pdf/skills_jobs_growth_finalpdf_231009.pdf

152
www.policyexchange.org.uk/assets/Simply_Learning_-_Jan__10.pdf
http://news.bbc.co.uk/1/hi/entertainment/8225954.stm
www.skillset.org/careers.
www.universitiesuk.ac.uk/Publications/Documents/Facts_creative%20sector09.
www.emeraldinsight.com/Insight/viewContentItem.do?contentType=Article&hdA
ction=lnkhtml&contentId=872020
http://innovationzen.com/blog/2007/05/07/the-benefits-of-a-diverse-workforce/
www.skillset.org/uploads/pdf/asset_14113.pdf?1
www.innovateuk.org/_assets/pdf/creative%20industries%20strategy.pdf
www.cipd.co.uk/subjects/lrnanddev/general/_learning_and_development_summ
ary?vanity=http://www.cipd.co.uk/subjects/lrnanddev/general/_lrngdevsvy.htm
www.hm-treasury.gov.uk/prebud_pbr09_repindex.htm
Knowledge Workers and Knowledge Work, The Work Foundation, March 2009
(www.theworkfoundation.com/assets/docs/publications/213_know_work_survey
170309.pdf)
www.berr.gov.uk/files/file44332.pdf#26
www.theworkfoundation.com/research/keconomy.aspx
www.cabinetoffice.gov.uk/media/227102/fair-access.pdf
www.ikt.org.uk/resource/files/2009/11/02/creative%20industries%20strategy.pdf
www.contracteye.co.uk/contractor_numbers_uk.shtml
www.ccskills.org.uk/Qualifications/CreativeApprenticeships/tabid/82/Default.aspx
www.statistics.gov.uk/cci/nugget.asp?id=1238
www.indiabroadband.net/india-broadband-telecom-news/11682-india-register-
500-growth-broadband-services-within-5-years.html
www.pcworld.com/businesscenter/article/148851/china_mobile_phone_subscri
bers_pass_600_million_mark.tml
www.statistics.gov.uk/statbase/TSDdownload2.asp
news.thomasnet.com/IMT/archives/2009/02/united-states-buy-american-clause-
economic-stimulus-package-sparks-protest-from-trade-partners.html
http://blogs.reuters.com/columns/2009/10/07/a-green-industrial-policy-for-
europe/
http://ipsnews.net/news.asp?idnews=34128

153
www.unctad.org/Templates/webflyer.asp?docid=9467&intItemID=1634&lang=1
www.incgamers.com/News/18919/tiga-on-irish-tax-break-proposals
www.incgamers.com/News/20017/
www.statistics.gov.uk/cci/nugget.asp?id=1163
www.faqs.org/abstracts/Retail-industry/UK-COST-OF-REPLACING-STAFF-
INCREASES-UK-WORKERS-LOSING-OUT-ON-HOLIDAY-ENTITLEMENT.htm
www.ldpcreative.co.uk/2010/01/gaming-industry-repeats-tax-re.html
www.otakunews.com/article.php?story=1548