Embed Size (px)
Citation preview
Chapter - 5
SECTOR-WISE AND BANK-WISE CREDIT DELIVERY
AND RECOVERY IN KOLLAM DISTRICT –
AN ANALYSIS
Location of Kollam District:-
Kollam is one of the 14 districts in Kerala State. It is located
between 9 o 28’ to8 o 45’ latitude and 76 o 28’ to 77 o 17’ north longitude. It
has a long history in trading with Chinese, Portuguese and the Dutch.
Portuguese and the Dutch established their trade centres in Kollam during
the beginning of 16th century and the British in 1795. Quilon was
recognized as an administrative unit by 1835 under Travancore state. In
1957, under the Kerala State Reorganisation Act of 1957 and further during
the formation of Alappuzha and later Pathanamthitta districts, it has to part
with Schenkotta to Tamil Nadu, six taluks to Alappuzha and Pathanamthitta
taluk to the newly formed district,viz, Pathanamthitta. Presently, the district
has only 2518 sq.km. It is bounded on the west by Arabian Sea, east by
Western Ghats bordering Tamil Nadu, south by Thiruvananthapuram; and,
shares border with Alappuzha and Pathanamthitta districts in north and
north east.
Topography and Physical Features:-
The district has low land, mid-land, mid upland and highland. Both
Karunagapally and Kollam taluks are in mid-land and low-land regions
respectively. About 10 per cent of the district”s geographical area is in
low-lands, 39 per cent is in mid-land and 28 per cent is in mid-upland; 18 per
cent of the area is in up-land and the remaining 5 per cent of the land is
highland category. Anchal taluk is largely under highland and up-land
96
category. The typical topography enriches its large backwater resources,
viz Ashtamudikayal, dense forest, reserve forest and the three lush rivers,
viz Kallada, Ithikkara and Achankovil rivers. Kulathupuzha Hills,
Achankovil Hills, Aryankavu Hills and Sabari Hills are the taller mountains
ranging from 1,500 m to 1,900 m separating the district from Tamil Nadu, on
the Western Ghats.
Climate:-
Climate of Kollam district is hot and humid. Summer season starts
from March and continues up to May. It is followed by South-West
Monsoon and stretched from June to September. October-November form
the retreating of monsoon and from December to February it is again
North-West Monsoon. The normal rainfall averages 2,742 mm and the
temperature ranges from 230 C to 360 C
Soil Structure
Sandy loam, laterite and forest soil dominate the district. The sandy
beaches at Chavara, Neendakara and Kovilthottam are rich in Monozite,
Ilmenite and Rutile. China clay is available at Kundara, Mulavana,
Chathannur and lime shells in Ashtamudy Lake. Bauxite is available in
Adichanallur and disseminated graphite in Punalur. The top soil is rich for
the cultivation of a variety of crops including plantation crops. This has
helped the farmers in developing homestead farming under rain-fed
conditions and based on family requirements using family labour.
Administrative Set up
The district for administrative convenience is divided into fiv taluks,
13 blocks, 104 villages, 71 grama panchayaths and one corporation and
two municipalities. Anchal, Anchalumoodu, Chadayamangalam,
Chittumala, Chavara, Ithikara, Karunagappally, Kottarakara, Mukhathala,
Ochira, Pathanapuram, Sasthmakotta and Vettikkavala are the 13 blocks.
97
Cultivators dominate Anchal, Chadayamangalam, Sasthamkotta,
Vettikavala and Kottarakara blocks.
Population:
As per Census 2001, the district is having a population of 25.84 lakh,
constituting 8 per cent of the state’s population. It has 5.9 lakh households;
of which 5 lakhs, 84 per cent, are in rural area. Literacy is worked out at 91
per cent and SC & ST population at approximately 12 per cent and 0.2 per
cent respectively. The household under Below Poverty Line (BPL) works
out to 8 per cent of the total household. Among the 25.84-lakh population,
cultivators total 57,000, Agricultural Labour 1,22,000, people engaged in
Allied sectors 92,000 and artisans 25,000. Similar to the state1 Kollam
district also has a sizable number of ageing population which adversely
affects its socio-economic development. The per capita income averages `
2,885 and share of Primary, Secondary and Tertiary Sectors in the state's
domestic product works out at 27 per cent, 24 per cent and 49 per cent
respectively.
Land Utilisation:-
Out of the total geographical area of 2.5 lakh hectares, area under
forest is 32 per cent and net sown area is 52 per cent and the cropping
intensity averages at 137 per cent during last few years.
Pattern of Land Holdings:-
The district has 5.5 lakh landholdings as per 1995-96 census.
Among them, 98 per cent of the holdings are below one hectare and they
share 79 per cent of the total area held under personal holdings. About
9,881 holdings are between one to two hectares, having 14 per cent of the
area and holdings above two hectares are 2,163 and they share about
98
seven per cent of the area. The pattern of holdings thus reflects the limited
scope for developing crop cultivation as the major economic activity for the
farm family to optimise their family income. This limitation resulted in
searching for alternate income sources and large level shift of the rural
youth to wage earners and migration.
Cropping Pattern:-
Coconut, rubber, tapioca, paddy, banana, pepper and cashew are
the important crops cultivated in the district. Homestead farming,
cultivation of paddy in wetland and cultivation of plantation crops, especially
rubber, are the systems followed.
The area under coconut and paddy, the major crops cultivated in
Kollam district, has a declining trend. Decreasing trend of coconut yield,
shortage of manpower for the regular maintenance of the coconut gardens
are serious threats the farmers face. Whereas, the area under rubber in
Kollam district recorded increasing trend. Regular returns and support
services from Rubber Board give hopes for farmers. Availability of subsidy
at ` 20,000 per hectare for new planting and ` 12,000 per hectare. for
replanting worked as incentives for faster switchover.
Irrigation
Majority of the cultivation in Kollam district is under rain-fed
conditions. Only 11 per cent of net area sown is under irrigation. Canals,
tanks, wells and others are the major sources of irrigation. The culture to
invest in irrigation is yet to pick up in the district. The groundwater
development in Kollam district as per the data available in 2004 is at 46 per
cent. Out of the 13 blocks in the district, in four blocks the groundwater
availability is at critical stage. The district has good scope for developing
lift irrigation projects2. The State Government also gives more importance
99
in development of minor irrigation in Kollam district.
Animal Wealth
The district has considerable good strength under livestock. It has
1.43 lakh milch-cows, 0.02 lakh milch buffaloes, 1.08 lakh goats, 0.11
plough animals and about 8.1 lakh poultry birds. The milch animals are of
improved genetic quality. However, development of commercial dairy units
are yet to pick up. Similarly, large commercial poultry units and stall-fed
goatery units are yet to emerge. The district has a good infrastructure
under Dairy3.
Fisheries
The district has 37 k.m. of coastline and 3,500 sq.k.m. continental
shelf. In addition to the above, it has three rivers, viz. Kallada, Ithikara and
Pallickkal and three large backwaters, viz. Kayamkulam, Ashtamudi and
Paravoor. About 53 fishing villages (27 under marine and 26 under inland)
are directly linked with fish capture and culture. Though Indo-Norwegian
project has introduced mechanised fishing, processing and marketing in
Neendakara as early as 1952-53, the fishery sector in the district under
capture, culture, processing and trading is yet to address its optimum
efficiency. The immense potential available under fish culture remains yet
to be exploited. Similarly, the value addition process under entire fish
produce is yet to be addressed.
Important Non-Farm Sector Activities
Handloom, coir, cashew processing, micro and small industries,
tourism etc. are the important sectors absorbing sizable number of
population. Under handloom sector, there are about 8,000 looms and
most of them are located at Chathannur, Veliyam Panchayath and outskirts
100
of Kollam Corporation. The activity provide employment opportunities for
more than 7,000 persons. Coir production has a concentration in Chavara,
Munroe Island and Karunagapally Panchayaths. The sector faces tough
competition from synthetic fibres and the coir co-operatives are relatively
weak to address timely required technology changes and product
diversification. Cashew processing has a concentration in Kottarakara,
Mukhathala, Sasthamkotta, Vettikkavala, Kundara and Kollam Corporation.
The sector employs nearly a lakh people and it has promising scope for
further value addition and brining out a variety of innovative and
market-friendly products.
Kollam district is having a good number of micro and small industries
based on wood, rubber, plastic, chemical, electrical, electronic, readymade
garments, leather, maintenance, fabrication, building construction, DTP
centres etc. The district is also having 276 industrial co-operatives. District
Industries Centre (DIC) provides hand-holding support to entrepreneurs
and also extends infrastructure facilities under mini industrial states located
at Perinad, Kareepra, Thevalakkara, Chavara and Sasthamkotta.
In addition to the mini industrial estates, larger industrial estates are
available at Umayanallur and Karunagapally. The estate located in
Mundakkal has 53 units. Small Industries Development Corporation
(SIDCO) is also planning to establish mini industrial estates in Thalavoor,
Pooyappally, Karavalur, Piravanthoor and Nilamel.
In order to strengthen the traditional sector, of late, Govt. of India is
extending support for cluster development programmes. Coir, bamboo,
khadi, straw-based picture making, wood lace work and dairy products are
the chosen sectors. Craftsmen/Farmers working in these sectors will get
hand-holding support to optimise their production and marketing efficiency.
These sectors also will receive need-based infrastructure and training
support. The identified sectors also will receive support system, especially
101
under Infrastructure Growth Pole Concepts, approximating ` 20 crore.
Mango, jackfruit, papaya and pineapple are cultivated in the district
and therefore, good scope is available for the production of canned fruits
and juice, making pickle, jam, candy, chips, etc.
Infrastructure Availability
Kollam district is having a fairly well developed infrastructure under
Railway (135 km), Surface Road (15,000 k.m.), Water Transport, services
of the Post Offices, telephone connections, availability of Educational (927
including 14 Prof: Colleges), and health providing agencies (9 Govt.
Hospitals & 64 PHCs), dispensaries ensuring animal health, agencies
engaged in extension services under Agriculture, Animal Husbandry, Dairy
Development, Fisheries Development, Poultry etc. There are also
satisfactory service providing agencies under skill up-gradation programme
and agencies extending hand hold services for marketing produce, products
and services.
Increasing involvement of the Banks in Agriculture and Rural
Development necessitated credit planning at various levels. Based on the
felt need, a study group led by Prof: Gadgil4 has recommended a
methodology in 1969 for the development of credit and banking plans in the
country. The study group felt district as the most viable unit of area to
begin with the credit planning as data/information required for the same are
readily available at the district level. Based on the suggestions and
subsequent recommendations made by Nariman Committee5, Reserve
Bank of India (RBI) had given the shape for Lead Bank Scheme (LBS) in
1969.
The LBS envisaged identifying a commercial bank having large
number of branch network in the district to shoulder lead bank
102
responsibilities. The lead bank was required to act as a group leader for
coordinating the efforts of all the credit agencies operating within the district
for branch expansion and meeting the credit needs of the rural economy6.
For firming up a user-friendly District Credit Plan (DCP), the lead bank was
required to carry out detailed studies within the district. In order to achieve
viable integration of the District Credit Plans with District Development
Plans, District Consultative Committee (DCC) was also set up in the district
to serve as a forum for consultation and coordination among the banks and
district development functionaries. Based on the experience gained, RBI
finalized the guidelines for preparation of DCP. Based on the matured
guidelines, the second round of DCPs were prepared during 1980-82. This
was followed by yearly allocation of the credit targets among various banks
within a district. This instrument was known as Annual Action Plans
(AAPs).
CRAFICARD7 had assessed the LBS and the preparation of DCP
and AAP in 1981 and recommended certain changes. Based on the
Committee’s recommendation, RBI issued new guidelines and 3rd round of
DCP for the period 1983-85 was prepared in accordance with revised
guidelines. In 1987, RBI issued fresh guidelines and the fourth round of
DCPs were prepared for a period of 3 years, 1988-90, beginning from
January 1988. From 1991 onwards Service Area Plans (SAPs) were also
introduced and this further helped in formulation of more meaningful DCPs
in the fifth round, 1991-92. As at the end of 1993, LBS covered almost all
the 453 districts prevailing in India at that time.
For implementing the LBS, duties were assigned to i) Lead Bank ii)
Lead Bank Officer (LBO) appointed by the Lead Bank iii) District
Coordinators of the Non-Lead Bank iv) Lead District Officer (LDO) of RBI v)
Officers of NABARD entrusted with special duties of the District
Development Managers (DDMs) and posted at the respective district or
representatives of NABARD Regional Offices vi) District Consultative
103
Committee and its Standing Committee which supervise the scheme at the
district level vii) The District Level Review Committee which ensures
participation of non-officials in Credit Planning, viii) State Level Bankers’
Committee (SLBC) which coordinates the activities of financial institutions
at the state-level, and lastly, ix) State Level Coordination Committee which
coordinates the activities of financial institutions with those of the
Government Departments.
There are differences of opinion about the effects of LBS in achieving
its objectives of a well-balanced credit disbursements based on the credit
needs of the district. Agriculture Credit Review Committee (ACRC)8 had
viewed that though this scheme could create better awareness on the need
of credit planning, its implementing functionaries could not achieve much of
the scheme objectives. Absence of reliable data at the district and block
level, coupled with the poor coordination among the various development
agencies led to the poor implementation of the plans. To improve the
quality of the micro level credit programme, RBI has introduced Service
Area Approach based on the observations made by a team of the Chief
Executives of the Commercial Banks in 1987.
The Service Area Scheme introduced from April 1988 involved i)
Identification of the Service Area of each branch ii) Survey of the Service
Area to identify potential activities and the beneficiaries iii) Preparation of
credit plan on an annual basis iv) Coordination of the various development
agencies within the area and implementation of the plan; and, v) regular
monitoring of credit utilisation and timely recovery of the loan instalments.
This scheme also suffered from a number of operational problems
especially in regions with poor branch coverage. In such areas the
branches could not successfully cater to the credit requirements with the
available staff and poor transport facilities. Opening of new branches in
these areas was also felt difficult due to the non-availability of the required
104
support system. Thus, credit planning process in the country has
undergone considerable changes during the last decades. Highlighting
these limitations ACRC9 indicated that despite several blueprints evolved in
this regard, it has not made any serious effort at the level of implementation.
The committee viewed that for effective credit planning, it should be
backward-linked with developmental plans and forward-linked via credit
disbursement agencies with the borrowers.
The review committee felt that the District Development Plan should
be concerned with the targeting of output and investment both for private
and public functionaries unlike the national or state plans which have
concerned themselves only with planning of output and investment by
Central and State Government and Public Enterprises, leaving private
sector planning only to broad guidelines and indications.
After the formation of National Bank for Agriculture and Rural
Development (NABARD), the apex bank responsible for the development of
agriculture and rural areas felt the need for an in-depth planning process at
the micro-level. The bank introduced Potential Linked Credit Plan (PLP) in
1988. A new method of identifying the potential available in rural areas
with the help of Banks, Govt. Departments, Universities, Research Stations,
Commodity Development Boards, Service Providing Agencies,
Non-Government Agencies etc. was tried. Based on the existing potential,
exploitable potential during the plan period was identified and the cost and
the bank credit for the same were estimated along with the gap in
infrastructure and service sector support. For achieving the planned
programmes, banks were persuaded to meet the credit gap. Similarly, the
infrastructure and service providing agencies were also encouraged to meet
the needs during the planned period. The system is currently in operation
in all the 622 districts in Indian Union. RBI and the banking system
accepted PLP as the parent document for further credit planning process.
105
A well-integrated PLP with DCP and branch -wise allocation of the
credit targets enabled the branches to implement the programmes much
faster and more focussed. The system also helps the banking sector to
implement various priority sector-initiated development programmes of both
Central and State Governments. The availability of PLP during the
beginning of the year makes it convenient for banks and other sister
departments to make operational for the next financial year starting from 1st
April onwards. The regular review of DCP involving various banks and
representatives of development departments enabled smooth
implementation of the credit plans.
LBS Scheme in Kollam District
The Lead Bank Scheme (LBS) had its base on the need for ensuring
the smooth co-ordination of various institutional and development agencies
operating in the district. For this purpose, a coordinating agency consisting
of the Lead Bank, other Commercial Banks and Co-operative Banks,
representatives of various Development Departments at the district level,
representatives of apex level financial agencies such as RBI, NABARD and
SIDBI was formed. This was generally known as District Consultative
Committee (DCC). District Collector was designated as the Chairperson of
the forum in order to ensure the smooth functioning and to draw the required
inter- agency co-ordination for implementation of the various development
programmes of the district.
Constitution of the District Consultative Committee (DCC) was done
in all districts of Kerala right from the beginning of 1970. Along with the
function of Lead Bank Scheme and institution of DCCs, the Lead Bank was
also entrusted with the responsibility of preparation and implementation of
the Area Development Schemes within the district with special thrust on
priority sector and specific coverage programmes for socially and
106
economically weaker strata of the society.
Efforts of Lead Bank in their local area development through credit
business, met with different levels of success in the various districts during
the eighties. Implementation of DCPs was reviewed at the state-level
forums known as State Level Banker’s Committee (SLBCs). The SLBC
played an important role as inter-institutional forum for co-ordination and
joint implementation of various development programmes with the support
of bank credit. Though SLBC is basically a banker’s forum, State
Government representatives at higher level also participated with a view to
drawing inter- agency co-ordination for successful implementation of
development schemes/programmes. The SLBC meetings are generally
convened by the Lead Bank designated as Convener Bank.
In order to strengthen the Lead Bank Scheme, a State Level
Co-ordination Committee was also constituted during the mid-seventies in
Kerala. This forum co-ordinated the developmental programmes of banks
and drew support from State Government Departments. The forum also
reviewed the progress in implementation of special programmes. It also
sought legislative and administrative support from the State Government
based on specific requirements. The infrastructure and linkage facilities
required for increasing credit absorption is also highlighted and necessary
support ensured. The system during the last two decades got well
established in Kerala and the preparation of PLP, DCP and branch-wise
allocation, implementation and their reviews have become a regular
practice in Kerala and among her 14 districts.
Review of DCP in Kollam District
Kollam is a representative district of Kerala state. It has large
backwaters, dense forest, reserve forest, three rivers and large costalline.
It has border with state capital Thiruvananthapuram district, Alappuzha and
Pathanamthitta on the North and North-East. Arabian Sea is bounded on
107
the West and Western Ghats at the East bordering with Tamil Nadu. The
district has 26 lakh population, of which, nearly 18 per cent are urban and
remaining 72 per cent are rural. The SC and ST population comprises about
10 per cent and 1.5 per cent respectively. For administrative convenience,
the district is divided into fve Taluks, 13 Development Blocks and 71 Grama
Panchayaths. The headquarter Kollam is a Corporation and it has two
Municipalities. The district is having a fairly high rate of literacy rate at 92 per
cent. Primary sector contributes 27 per cent to the state economy and
secondary sector 24 per cent. The tertiary sector contributes the highest of
49 per cent. During the last three decades, contribution of agriculture
recorded a declining trend compared to the other two sectors. Smaller
size of land holdings (98 % below one hectare.) appeared to be the major
constraint.
The district has a fairly wellspread coverage of banks. It has 207
branches of Commercial Banks, 55 branches of District Central
Co-operative Bank (DCCB), 121 Primary Agriculture Co-operative Societies
(PACS) and four Primary Co-operative Agriculture and Rural Development
Banks (PCARDB). For credit planning purposes, NABARD prepares
Potential Linked Credit Plans (PLP) for each financial year. Through this
exercise the District Development Manager (DDM) posted at the district
prepares a list of tapable investments in the district with the assistance of
bank credit. This information is communicated to all the bank branches in
each block. Based on the available potential, the branches prepare their
Annual Credit Plans and these are further aggregated at the block level.
Subsequently, the block credit plans are aggregated at the district level and
state level. The process enable mapping of the potentials in a local area,
ensures bank credit facilities for their exploitation and also ensures
infrastructure and service support at local area, block and district levels.
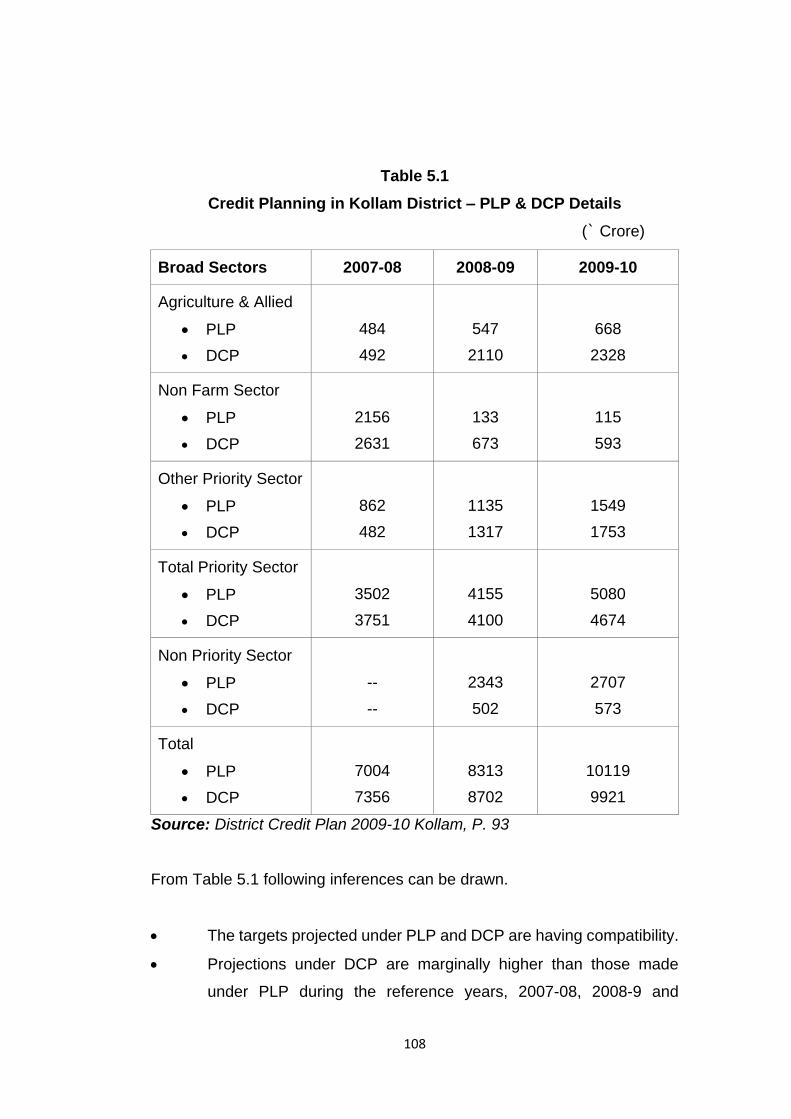
In order to have an idea on PLP projection viz-a-viz projections made
under DCP, the data regarding the latest 3 years is presented in Table 5.1
108
Table 5.1
Credit Planning in Kollam District – PLP & DCP Details
(` Crore)
Broad Sectors 2007-08 2008-09 2009-10
Agriculture & Allied
PLP
DCP
484
492
547
2110
668
2328
Non Farm Sector
PLP
DCP
2156
2631
133
673
115
593
Other Priority Sector
PLP
DCP
862
482
1135
1317
1549
1753
Total Priority Sector
PLP
DCP
3502
3751
4155
4100
5080
4674
Non Priority Sector
PLP
DCP
--
--
2343
502
2707
573
Total
PLP
DCP
7004
7356
8313
8702
10119
9921
Source: District Credit Plan 2009-10 Kollam, P. 93
From Table 5.1 following inferences can be drawn.
The targets projected under PLP and DCP are having compatibility.
Projections under DCP are marginally higher than those made
under PLP during the reference years, 2007-08, 2008-9 and
109
2009-10.
Among the broad sectors, viz. Agriculture & Allied, NFS and Other
Priority Sector, the variation in projection is observed larger in the
case of Agriculture & Allied Sector, followed by Non-Farm Sector.
Limitations caused in data compilation in both the agencies can be
one of the reasons for wide variation. This is relatively more
reflected in the data available during the year 2007-08 in the case of
NFS and Other Priority Sector.
More careful treatment of the data by the Lead Bank and NABARD
is required for better compatibility.
Credit Flow in Kollam District
On successful preparation of the Credit Plans at branch level, block
level and at the district level, the banking sector implements the credit
programmes on a regular basis. The same is also reviewed regularly by
the controlling banks and various review forums at block level and district
level. The banks also are required to implement various development
programmes such as Swarna Jayanthi Gram Swarozgar Yojana (SGSY),
Swarna Jayanthi Shahari Rozgar Yojana (SJSRY), Prime Minister’s
Employment Generation Programme (PMEGP) etc. In addition to the
above, various development departments of both State and Central
Governments also seek active co-operation of the banking sector for
implementation of specific programmes initiated under both Farm and Non-
Farm Sector. Project initiated by Department of Agriculture, Horticulture
Mission, NFS Activities supported by KVIC and KVIB etc. are examples.
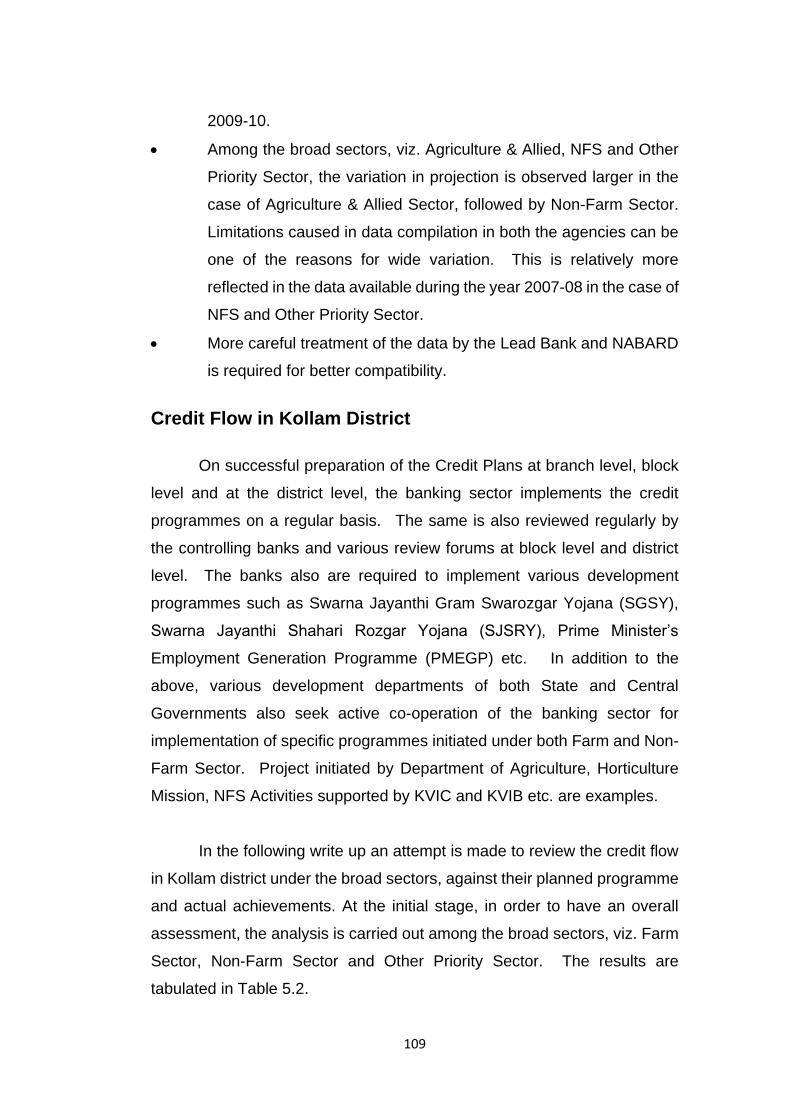
In the following write up an attempt is made to review the credit flow
in Kollam district under the broad sectors, against their planned programme
and actual achievements. At the initial stage, in order to have an overall
assessment, the analysis is carried out among the broad sectors, viz. Farm
Sector, Non-Farm Sector and Other Priority Sector. The results are
tabulated in Table 5.2.
110
Table 5.2
Credit Flow in Kollam district – Target and Achievements.
(` Crore)
Sector
2004-05 2005-06 2006-07 2007-08 2008-09
T A % T A % T A % T A % T A %
Farm Sector (FS)
309
(15)
305
(14)
99 429
(17)
421
(16)
98 440
(14)
551
(17)
125 492
(14)
1730
(46)
352 2110
(52)
2418
(54)
115
Non- Farm Sector (NFS)
1135
(54)
1517
(67)
134 1199
(48)
1364
(53)
114 1675
(54)
1684
(51)
101 2631
(73)
842
(22)
32 673
(17)
737
(16)
110
Other Priority Sector
(OPS)
639
(31)
428
(19)
67 856
(35)
769
(30)
90 1002
(32)
1059
(32)
106 4812
(13)
1179
(32)
25 1217
(30)
1318
(30)
100
Total Priority Sector
(Total PS)
2083 2250 108 2484 2554 103 3117 3294 106 3604 3751 104 4000 4473 112
(Figures in brackets indicate the per-centages to the column total)
T.-(Target), A.-(Achievement)
Source : District Credit Plans
Farm – Sector means those economic activities which are land based.
Non – Farm Sector includes those economic activities which are not
land based. Other Priority Sector covers all lending activities to those
categories belonging to Below Poverty Line (BPL).
A study of the above data brings out following inferences
Credit programme in Kollam district aggregated ` 2083 crore during
2004-05. It steadily increased to ` 2,484 crore during 2005-06 and
further increased to ` 3,117 crore during 2006- The targeted 07, `
3,604 crore during 2007-08 and further increased to ` 4,000 crore
during 2008-09. Thus, during the 5-year period, 2004-05 to
2008-09 the targeted credit has almost doubled.
The credit disbursements also increased at the matching pace. The
achievement increased from ` 2,250 crore during 2004-05 to ` 4,473
crore during 2008-09; with an annual growth at 20 per cent.
111
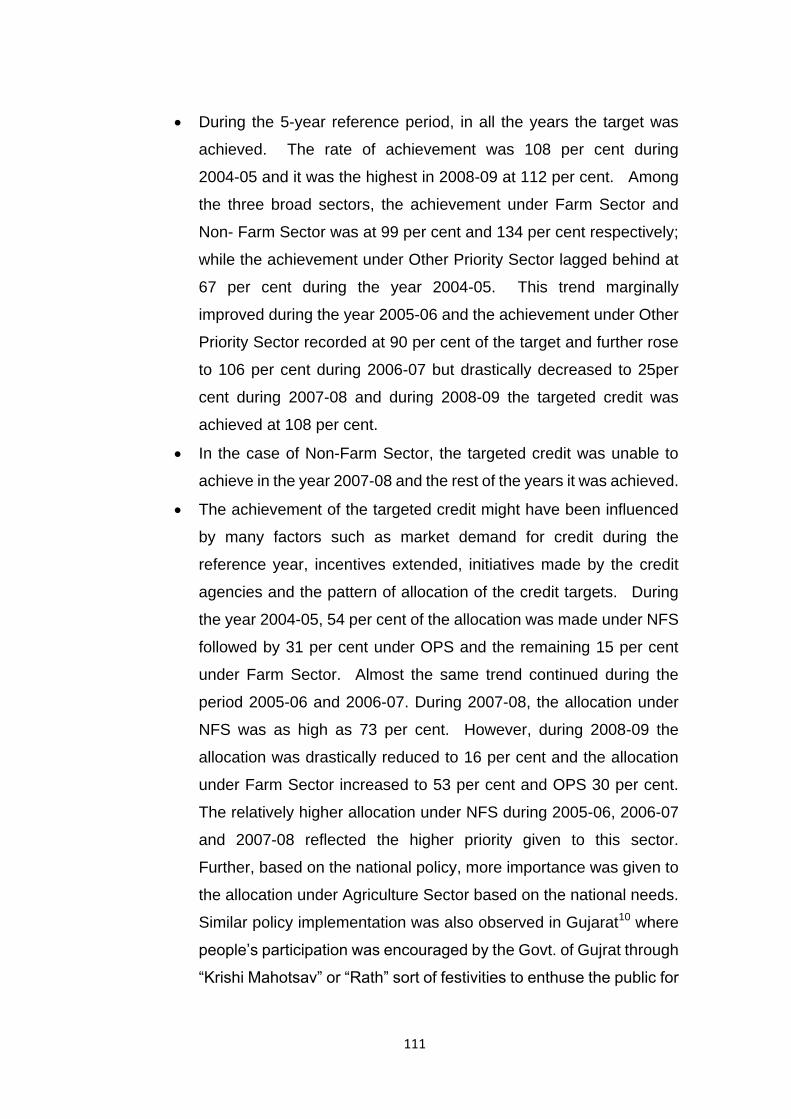
During the 5-year reference period, in all the years the target was
achieved. The rate of achievement was 108 per cent during
2004-05 and it was the highest in 2008-09 at 112 per cent. Among
the three broad sectors, the achievement under Farm Sector and
Non- Farm Sector was at 99 per cent and 134 per cent respectively;
while the achievement under Other Priority Sector lagged behind at
67 per cent during the year 2004-05. This trend marginally
improved during the year 2005-06 and the achievement under Other
Priority Sector recorded at 90 per cent of the target and further rose
to 106 per cent during 2006-07 but drastically decreased to 25per
cent during 2007-08 and during 2008-09 the targeted credit was
achieved at 108 per cent.
In the case of Non-Farm Sector, the targeted credit was unable to
achieve in the year 2007-08 and the rest of the years it was achieved.
The achievement of the targeted credit might have been influenced
by many factors such as market demand for credit during the
reference year, incentives extended, initiatives made by the credit
agencies and the pattern of allocation of the credit targets. During
the year 2004-05, 54 per cent of the allocation was made under NFS
followed by 31 per cent under OPS and the remaining 15 per cent
under Farm Sector. Almost the same trend continued during the
period 2005-06 and 2006-07. During 2007-08, the allocation under
NFS was as high as 73 per cent. However, during 2008-09 the
allocation was drastically reduced to 16 per cent and the allocation
under Farm Sector increased to 53 per cent and OPS 30 per cent.
The relatively higher allocation under NFS during 2005-06, 2006-07
and 2007-08 reflected the higher priority given to this sector.
Further, based on the national policy, more importance was given to
the allocation under Agriculture Sector based on the national needs.
Similar policy implementation was also observed in Gujarat10 where
people’s participation was encouraged by the Govt. of Gujrat through
“Krishi Mahotsav” or “Rath” sort of festivities to enthuse the public for
112
productive utilization of the institutional credit.
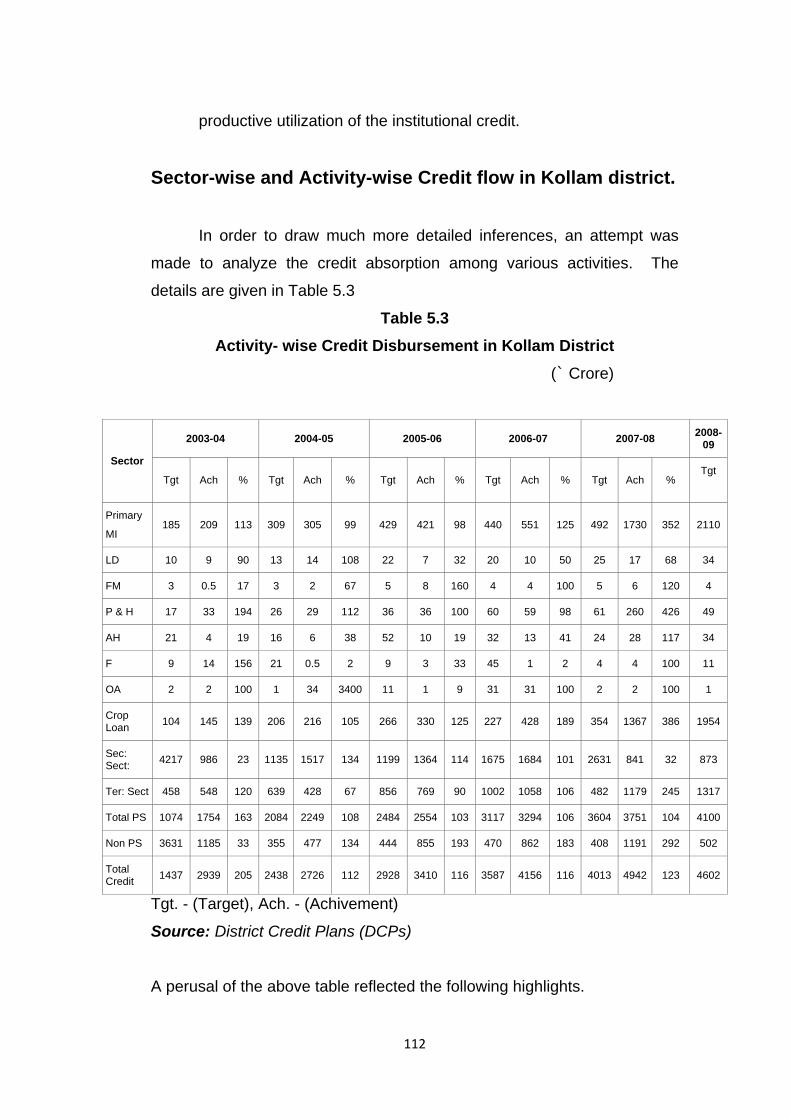
Sector-wise and Activity-wise Credit flow in Kollam district.
In order to draw much more detailed inferences, an attempt was
made to analyze the credit absorption among various activities. The
details are given in Table 5.3
Table 5.3
Activity- wise Credit Disbursement in Kollam District
(` Crore)
Sector
2003-04 2004-05 2005-06 2006-07 2007-08 2008-
09
Tgt Ach % Tgt Ach % Tgt Ach % Tgt Ach % Tgt Ach % Tgt
Primary
MI 185 209 113 309 305 99 429 421 98 440 551 125 492 1730 352 2110
LD 10 9 90 13 14 108 22 7 32 20 10 50 25 17 68 34
FM 3 0.5 17 3 2 67 5 8 160 4 4 100 5 6 120 4
P & H 17 33 194 26 29 112 36 36 100 60 59 98 61 260 426 49
AH 21 4 19 16 6 38 52 10 19 32 13 41 24 28 117 34
F 9 14 156 21 0.5 2 9 3 33 45 1 2 4 4 100 11
OA 2 2 100 1 34 3400 11 1 9 31 31 100 2 2 100 1
Crop Loan
104 145 139 206 216 105 266 330 125 227 428 189 354 1367 386 1954
Sec: Sect:
4217 986 23 1135 1517 134 1199 1364 114 1675 1684 101 2631 841 32 873
Ter: Sect 458 548 120 639 428 67 856 769 90 1002 1058 106 482 1179 245 1317
Total PS 1074 1754 163 2084 2249 108 2484 2554 103 3117 3294 106 3604 3751 104 4100
Non PS 3631 1185 33 355 477 134 444 855 193 470 862 183 408 1191 292 502
Total Credit
1437 2939 205 2438 2726 112 2928 3410 116 3587 4156 116 4013 4942 123 4602
Tgt. - (Target), Ach. - (Achivement)
Source: District Credit Plans (DCPs)
A perusal of the above table reflected the following highlights.
113
Minor Irrigation (MI), Land Development (LD), Farm Mechanization
(FM), Plantation and Horticulture (P&H), Fisheries (F) and Other
Activities (OA) were the important sub sectors which absorbed
sizable quantum of credit during the reference period under the
study.
Minor Irrigation
Under Primary Sector, MI allocation was increased from ` 185 crore
during 2003-04 to ` 309 crore during 2004-05 and further increased
to ` 429 crore and 440 crore during 2005-06 and 2006-07
respectively. In the year 2007-08 the allocation was at ` 492 crore
and the achievement was at ` 1,730 crore, 352 per cent of the target.
Considering this fact the allocation during 2008-09 was kept at a high
level of ` 2,110 crore. The credit disbursement under MI was also
satisfactory during the reference period and it recorded large
achievement potential from the year 2006-07 onwards.
Land Development
Owing to the limited potential under LD the credit allocation under
this activity ranged from ` 10 crore during 2003-04 to ` 25 crore
during 2007-08 and further the target was kept at ` 34 crore during
2008-09. The achievement under this sector fell short of the targets
during the year 2003-04 at 90 per cent, 34 per cent during 2005-06,
50 percent during 2006-07 and 68 per cent during 2007-08. Thus
except during the year 2004-05 when the achievement was at 108
per cent, during all the years the target could not be achieved.
Farm Mechanisation
The small size of landholding was one of the limiting factors for credit
114
absorption under Farm Mechanisation (FM). The targets envisaged
under this sector ranged from ` 3 crore during 2003-04 and ` 5 crore
during 2007-08. The achievement under the sector also was less
attractive in most of the years except during 2005-06 and 2007-08,
both the years the target was achieved. During 2003-04 and
2004-05 the achievement was only at 17 per cent and 67 per cent of
the targets.
Plantation and Horticulture
The credit allocation under Plantation and Horticulture (P & H)
ranged from ` 17 crore during 2003-04 to ` 61 crore during 2007-08.
During the earlier reference of the period the targets were achieved
at 194 per cent during 2003-04 and at 116 per cent during 2004-05.
However, during 2006-07 the target marginally fell short at 98 per
cent. However, it picked up during 2007-08 at 426 per cent.
Animal Husbandry
Under Animal Husbandry (AH) the achievement was much lower
compared to the credit allocation. In spite of a larger size of rural
area in Kollam district and availability of the required infrastructure for
dairy development the credit allocation ranged from ` 21 crore during
2003-04 to ` 52 crore during 2005-06. Subsequently during
2006-07 and 2007-08 the credit allocations were at ` 32 crore
and ` 24 crore respectively. In most of the years the targets were
not achieved. The achievements were as low as 19 per cent during
2003-04 and 2005-06. The highest achievement was recorded at
117 per cent during 2007-08. During this year, as against the
targeted ` 24 crore the achievement recorded ` 28 crore.
115
Fisheries
Under fisheries sector, the targeted credit ranged from ` 9 crore
during 2003-04 to ` 45 crore during 2006-07. The pattern of
allocation records inconsistencies. During 2004-05 the allocation
was ` 21 crore whereas during 2005-06 it was kept at ` 9 crore and
further increased to ` 45 crore during 2006-07; and, the target was
kept at very low at ̀ 4 crore during 2007-08. The achievements also
recorded erratic trends. It was at 156 per cent during 2003-04 and as
low as two per cent during 2004-05 and 2006-07. Inspite of a long
coastline and a developed fishing harbour at Sakthikulangara and a
large area of backwater and different fish varieties having potential
for their culture, value addition and trade, the credit absorption under
this sector remained poor in Kollam district.
Other Activities
Under Other Activities the credit targets increased from ` 2 crore
to ` 11 crore during 2003-04 and 2005-06; and ` 31 crore during
2006-07 and further a very low allocation at ` 2 crore was made
during 2007-08. The credit disbursement during the year 2003-04
under this sector was ` 2 crore only. It increased to ` 34 crore
during 2004-05, and subsequentlyfel down to ` 31 crore during
2006-07. During 2004-05 and 2007-08 the achievements were
reported at a very low level of ` 1 crore and ` 2 crore respectively.
Crop Loan
The targeted credit programme under Crop Loan during the
reference period, 2003-04 to 2007-08, reflected unusual
inconsistency. During 2003-04 the target was kept at ` 104 crore;
during 2004-05 it was ` 206 crore and during 2005-06 the target was
116
further increased to ` 266 crore. Thus, a steady increasing trend
reflected during the 3 years. However, during 2006-07 the target
was kept at ` 227 crore and then further increased to ` 354 crore
during 2007-08. However, the achievement during these 2 years
exceeded the target and registered 186 per cent and 386 per cent
respectively. Further, the target during 2008-09 was kept at ` 1,954
crore. The reason for keeping a lower target compared to the
previous year especially when the achievements were made need
further probing. It appears that there are missing links in
professionalism in fixing credit target, especially under Crop Loan.
All the 5-year period the credit disbursement under Crop Loan in
Kollam district was more than the targeted allocations. The
achievement ranged from 105 per cent during 2004-05 to as high as
386 per cent during 2007-08. During this year as against the target
of ` 354 crore the achievement stood at ` 1,367 crore. The pattern
of disbursement warrants indepth studies on credit allocation and
end utilisation.
Secondary Sector
Under Secondary Sector, the credit allocation reflected larger
inconsistencies inspite of the existence of PLP, block level and
district level monitoring committees and District Industries Centre
(DIC), a department exclusively to take care of the development
activities under the Secondary Sector. The targeted credit under
this sector during 2003-04 was as high as ̀ 4,217 crore of which only
` 986 crore was disbursed and the disbursement worked out only at
23 per cent. Considering the low level of achievement the target
during 2004-05 was kept at ` 1,135 crore and the achievement was
at ` 1,517 crore, at 134 per cent. The target during 2005-06 and
2006-07 was further kept at ` 1,199 crore and ` 1,675 crore
respectively. The achievement during this two years worked out to
117
114 per cent and 101 per cent respectively. During the year
2007-08, as against the allocated target of ` 2,631 crore. The
achievement was only at ` 841 crore, at 32 per cent. This might
have compelled for a smaller allocation of the target under this sector
during 2008-09 at ` 873 crore. Thus the analysis clearly brings out
the fact that the credit allocation under Secondary Sector in Kollam
district need much more scientific analysis for assessing the effective
demand of credit.
Tertiary Sector
Both credit allocation and utilisation trends under Tertiary Sector
reflected less attractive trends in Kollam district during the reference
period. In spite of the increasing contribution of Tertiary Sector in
the district’s economy, the credit allocation under this sector ranged
from ` 458 crore during 2003-04 to ` 1,317 crore during 2008-09.
The trends in allocation reflected a steady increase during the first 4
years. However, during 2007-08 the allocation was only 46 per cent
of the earlier achievement during 2006-07. However, the
achievement during the year was at ̀ 1,179 crore, 245 per cent of the
targeted programme at ` 482 crore.
Priority Sector - Total
The Priority Sector achievement totalled ` 1,754 crore during
2003-04 and gone up to ` 3,751 crore during 2007-08. The annual
increase worked out to 23 per cent. The achievement under Priority
Sector was highest at 163 per cent during the year 2003-04 and it
was at the lowest at 103 per cent during 2005-06.
Non-Priority Sector - Total
The credit allocation under Non-Priority Sector also reflected
118
inconsistencies, perhaps due to the changes happened in data
aggregation. The target under the sector during 2003-04 was kept
at ` 3,631 crore. The same was kept at ` 355 crore during 2004-05
and marginally increased to ` 444 crore , ` 470 crore and ` 408 crore
during the subsequent years 2005-06, 2006-07, 2007-08
respectively. The target during 2008-09 is kept at `502 crore.
Except during the year 2003-04 the achievement during the
subsequent years were at 134 per cent, 193 per cent, 183 per cent
and 292 per cent respectively.
Total Credit
The total credit disbursement in Kollam district recorded at ` 2,939
crore during 2003-04. During the subsequent year, 2004-05 the
total credit disbursement marginally declined to ` 2,726 crore.
During the year 2005-06 the credit disbursement totalled ` 3,410
crore and increased to ̀ 4,156 crore during 2006-07 and further to ̀
4,942 crore during 2007-08. Thus, the credit absorption in Kollam
district during the reference period, 2003-04 to 2007-08, has
increased only at 17 per cent per annum. The achievement fell
short of the general ambition to double the institutional credit at 5
year interval.
The above highlights enable to draw the following inferences.
The credit planning process at the branch level, the block level and
the district level need much more careful and scientific approach to
contain the exploitable potential under each sector. Though a
regular exercise is being attempted to contain the aspirations
envisaged under the PLP, a perusal of the time series data even for a
short interval of 5- year period reflected avoidable limitations.
The allocations under subsectors such as MI, LD, FM, PH, AH and
fisheries deserve much more realistic approach to contain the
119
potential which can be addressed in each of these sectors. For this
purpose a deliberate attempt to increase the effective demand for
credit by the true entrepreneurs is needed. This is a larger subject
and can be addressed only through collective efforts of all the
development departments, local forums of farmers, investors under
Dairy, Fishery, PH, AH, MI and LD.
Along with credit planning and implementation, empowerment of the
prospective entrepreneurs is a subject which is lagging in the district.
Proper awareness among the leadership in local-self governments,
local forums, local functionaries of the Government and bankers
along with the handholding of the market operators can change the
scenario and change the present negligible status of bank credit on
National Domestic Product (NDP) as observed by Kuldip and
Seema11.
Review of Govt. Sponsored Schemes in Kollam District
Under poverty alleviation for employment generation and
empowerment of specific target groups both the Government of India and
State Government implemented a series of development
schemes/programmes with the help of banks. Swarnajayanthi Gram
Swarozgar Yojana (SGSY), Swarna Jayanthi Shahari Rozgar Yojana
(SJSRY), Prime Minister’s Rozgar Yojana (PMRY), USEP, DWCRA etc. are
the major programmes. An attempt is made below to study the extent of
achievement under these programmes with the support of institutional
credit.
Performance of the Bank under PMRY
The Target vis-a-vis achievement made under this programme
during the last 5 year period, 2003-04 to 2007-08 is given in Table 5.4
120
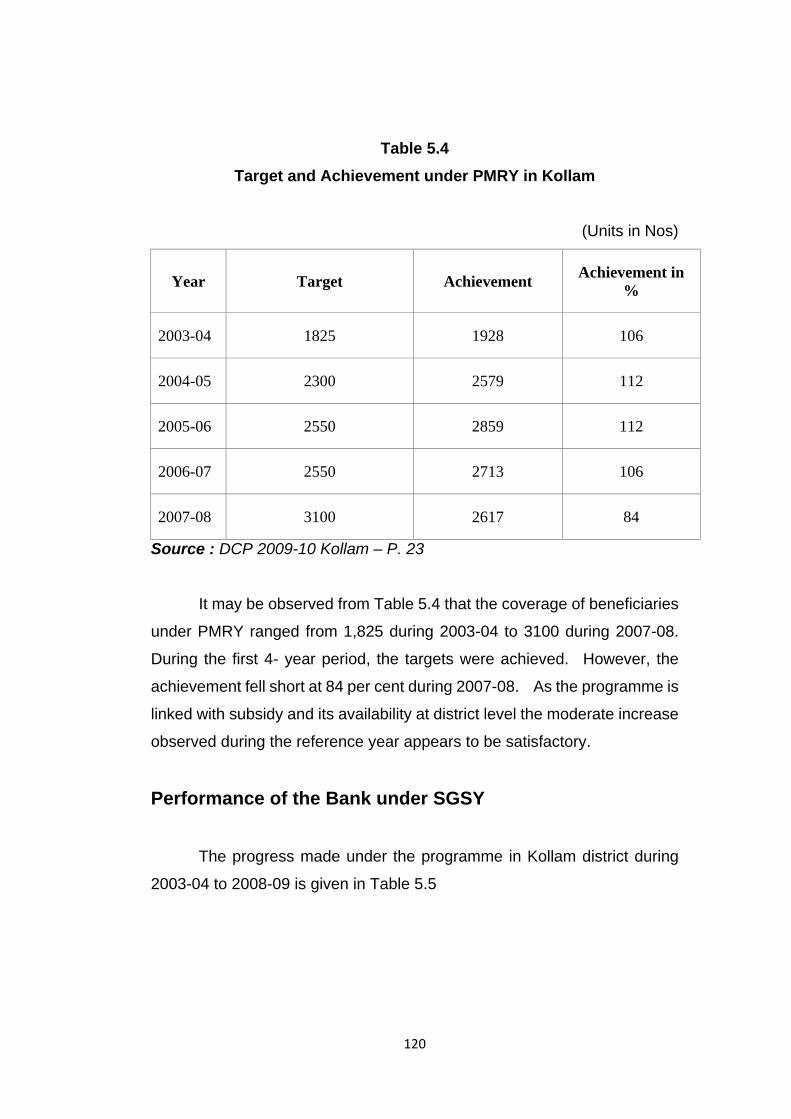
Table 5.4
Target and Achievement under PMRY in Kollam
(Units in Nos)
Year Target Achievement Achievement in
%
2003-04 1825 1928 106
2004-05 2300 2579 112
2005-06 2550 2859 112
2006-07 2550 2713 106
2007-08 3100 2617 84
Source : DCP 2009-10 Kollam – P. 23
It may be observed from Table 5.4 that the coverage of beneficiaries
under PMRY ranged from 1,825 during 2003-04 to 3100 during 2007-08.
During the first 4- year period, the targets were achieved. However, the
achievement fell short at 84 per cent during 2007-08. As the programme is
linked with subsidy and its availability at district level the moderate increase
observed during the reference year appears to be satisfactory.
Performance of the Bank under SGSY
The progress made under the programme in Kollam district during
2003-04 to 2008-09 is given in Table 5.5
121
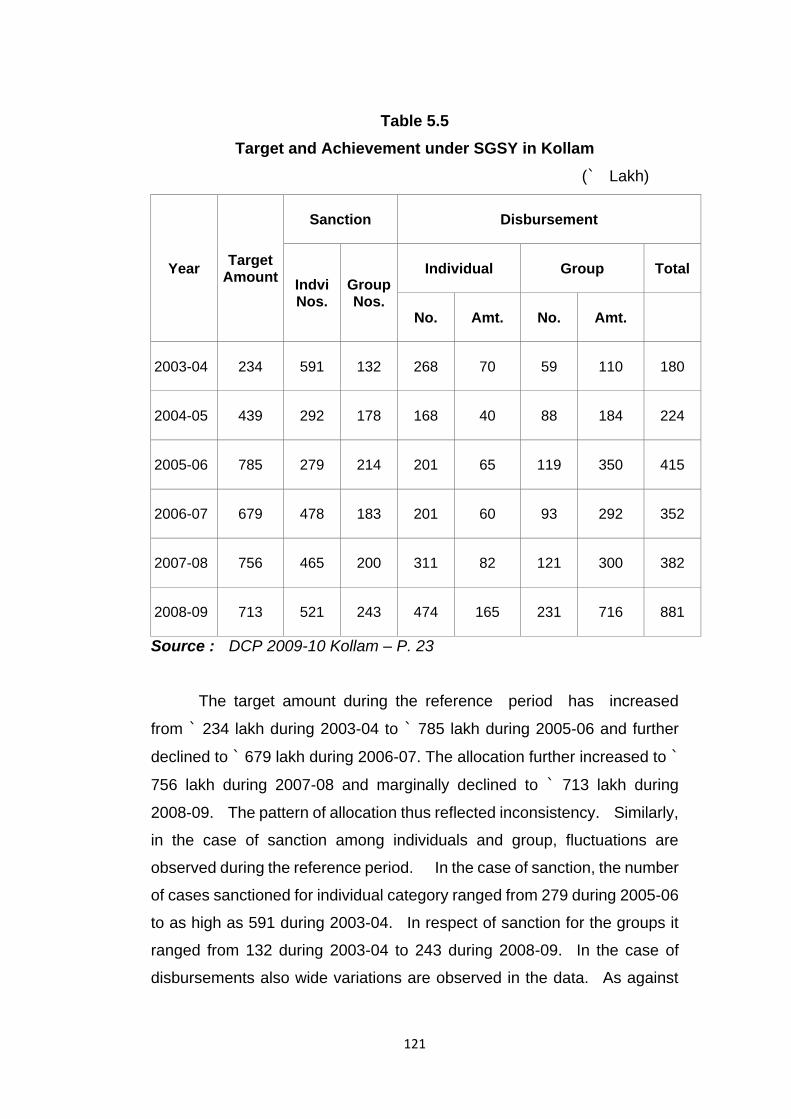
Table 5.5
Target and Achievement under SGSY in Kollam
(` Lakh)
Year Target
Amount
Sanction Disbursement
Indvi Nos.
Group Nos.
Individual Group Total
No. Amt. No. Amt.
2003-04 234 591 132 268 70 59 110 180
2004-05 439 292 178 168 40 88 184 224
2005-06 785 279 214 201 65 119 350 415
2006-07 679 478 183 201 60 93 292 352
2007-08 756 465 200 311 82 121 300 382
2008-09 713 521 243 474 165 231 716 881
Source : DCP 2009-10 Kollam – P. 23
The target amount during the reference period has increased
from ` 234 lakh during 2003-04 to ` 785 lakh during 2005-06 and further
declined to ` 679 lakh during 2006-07. The allocation further increased to `
756 lakh during 2007-08 and marginally declined to ` 713 lakh during
2008-09. The pattern of allocation thus reflected inconsistency. Similarly,
in the case of sanction among individuals and group, fluctuations are
observed during the reference period. In the case of sanction, the number
of cases sanctioned for individual category ranged from 279 during 2005-06
to as high as 591 during 2003-04. In respect of sanction for the groups it
ranged from 132 during 2003-04 to 243 during 2008-09. In the case of
disbursements also wide variations are observed in the data. As against
122
the sanction of 591 under individual during 2003-04 only 268 cases of
disbursements were made. Similarly, during the same year out of the 132
cases sanctioned under groups, in 59 cases only the loan amount was
disbursed. Similar trends are observed during all the years covered under
the study. In the case of overall disbursement and increase is recorded
during the year 2003-04. The disbursement under SGSY totalled ` 180
lakh during 2003-04. It has gone up to ` 881 lakh during the year 2008-09.
However, yearly fluctuations were also observed especially during 2006-07.
The pattern of loan sanction and disbursement under SGSY in
Kollam district do not reflect a steady increasing trend. It depends more on
the initiatives of the programme implementing functionaries during the
respective years. The wide variations in sanction and disbursement
reflected the limited skill and professionalism of the programme
implementing agencies and the inadequate zeal of the identified
beneficiaries. There is large scope for the programme implementing
functionaries for the right identification of promising entrepreneurs under
SGSY. Wider awareness programmes coupled with need-based training
and handholding may result in minimizing the existing gap between
sanction and disbursement.
Performance of the Bank under SJSRY
Under Swarna Jayanthi Shahari Rozgar Yojana (SJSRY), Urban Self
Employment Programme (USEP) and Development of Women and
Children in Rural Area (DWCRA) were the two major development
programmes in which banks have participated in Kollam district.
Involvement of the banks in implementing these two programmes during
2003-04 and 2007-08 is given in Table 5.5
123
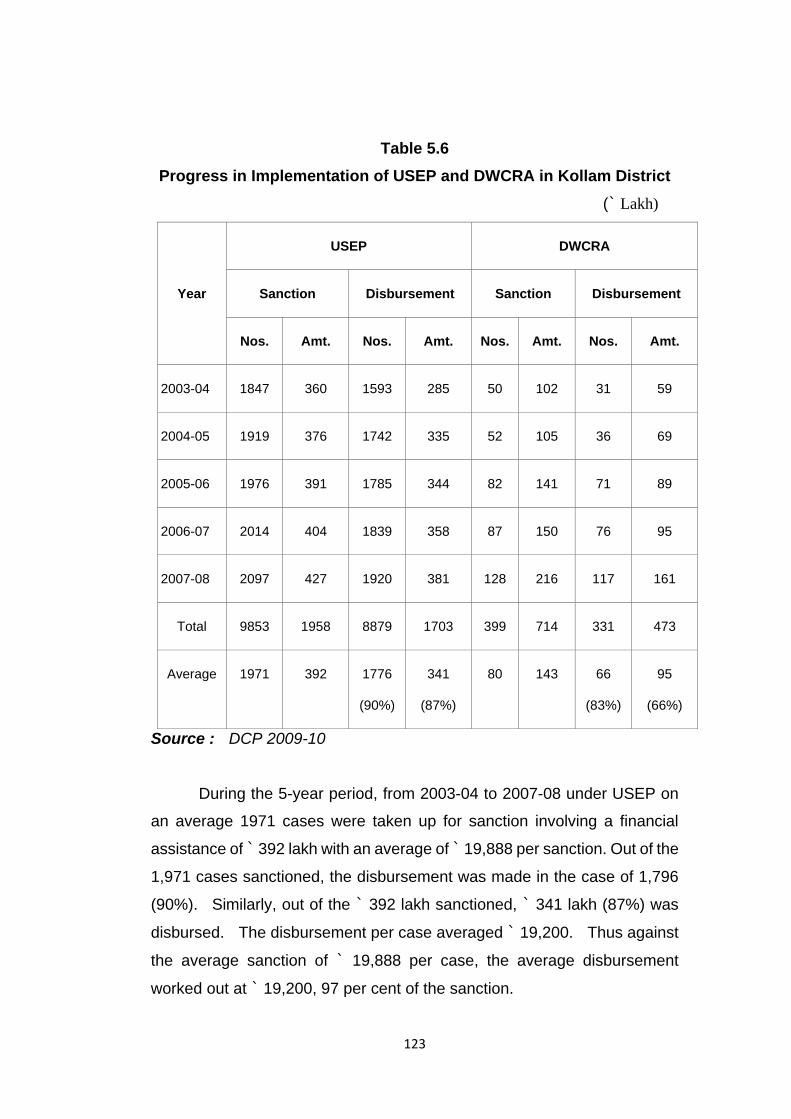
Table 5.6
Progress in Implementation of USEP and DWCRA in Kollam District
(` Lakh)
Year
USEP DWCRA
Sanction Disbursement Sanction Disbursement
Nos. Amt. Nos. Amt. Nos. Amt. Nos. Amt.
2003-04 1847 360 1593 285 50 102 31 59
2004-05 1919 376 1742 335 52 105 36 69
2005-06 1976 391 1785 344 82 141 71 89
2006-07 2014 404 1839 358 87 150 76 95
2007-08 2097 427 1920 381 128 216 117 161
Total 9853 1958 8879 1703 399 714 331 473
Average 1971 392 1776
(90%)
341
(87%)
80 143 66
(83%)
95
(66%)
Source : DCP 2009-10
During the 5-year period, from 2003-04 to 2007-08 under USEP on
an average 1971 cases were taken up for sanction involving a financial
assistance of ̀ 392 lakh with an average of ̀ 19,888 per sanction. Out of the
1,971 cases sanctioned, the disbursement was made in the case of 1,796
(90%). Similarly, out of the ` 392 lakh sanctioned, ` 341 lakh (87%) was
disbursed. The disbursement per case averaged ` 19,200. Thus against
the average sanction of ` 19,888 per case, the average disbursement
worked out at ` 19,200, 97 per cent of the sanction.
124
The per year sanction and disbursement under USEP over the years
2003-04 to 2007-08 recorded steady increasing trend. The number of
cases sanctioned increased from 1,847 during 2003-04 to 2097 during
2007-08. During the same period, the sanction amount also recorded
steady increase from ` 360 lakh to ` 427 lakh . In accordance with the
sanction the disbursement under USEP also steadily increased from 1,593
during 2003-04 to 1,920 during 2007-08. In the case of disbursement also
steady increase was recorded during the period. The disbursement under
USEP rose from ` 285 lakh during 2003-04 to ` 381 lakh during 2007-08.
The above analysis indicates that the banks in Kollam district have
actively participated in implementing Urban Self Employment Programme
during the reference period 2003-04 to 2007-08. The participation
recorded steady increasing trends in both sanction and disbursement. In
the case of sanction, the partner agencies could achieve a steady
increasing trend in extending the programme to an increasing number of the
needy.
Performance of the Bank under DWCRA
Banks participation in implementing the programme, Development of
Women and Children in Rural Area, in Kollam district during the period
2003-04 and 2007-08 is given in Table 5.6 As under USEP, the
performance under DWCRA also recorded increasing trends under both
sanction and disbursements. During the reference period, on an average
as against the targeted 80 cases per annum, the banks could assist 66
cases and the achievement worked out at 83 per cent. Similarly, as
against the targeted sanction of ` 143 lakh per annum the actual
disbursement work out ` 95 lakh, at 66 per cent. The per account sanction
and disbursement worked out to ` 55,882 and ` 1,42,900 respectively.
Thus, as against the sanction, the per account disbursement worked out to
125
039 per cent only. The analysis thus indicate that there is a large scope for
increasing the quantum of financial assistance extended to the beneficiaries
under DWCRA. A more careful and scientific approach is warranted from
all the programme implementing functionaries.
Broad Sector-wise and Agency-wise Ground Level Credit
Flow
Sector-wise Credit Flow
In order to study the Ground Level Credit flow (GLC) in Kollam
district, an attempt has been made to analyze credit flow from 2004-05 to
2008-09. The analysis is carried out for the broad sectors like Crop Loan
(ST), Term Loan, both Medium Term (MT) and Long Term (LT), Non -Farm
Sector (NFS) and Other Priority Sector (OPS). The agencies are classified
as Commercial Banks (CBs), State Co-operative Bank (SCB), State
Co-operative Agriculture and Rural Development Bank (SCARDB) and
Regional Rural Bank (RRB). To appreciate the credit delivery system, a
simple average of 5- year period is worked out and the results are presented
in table 5.7
127
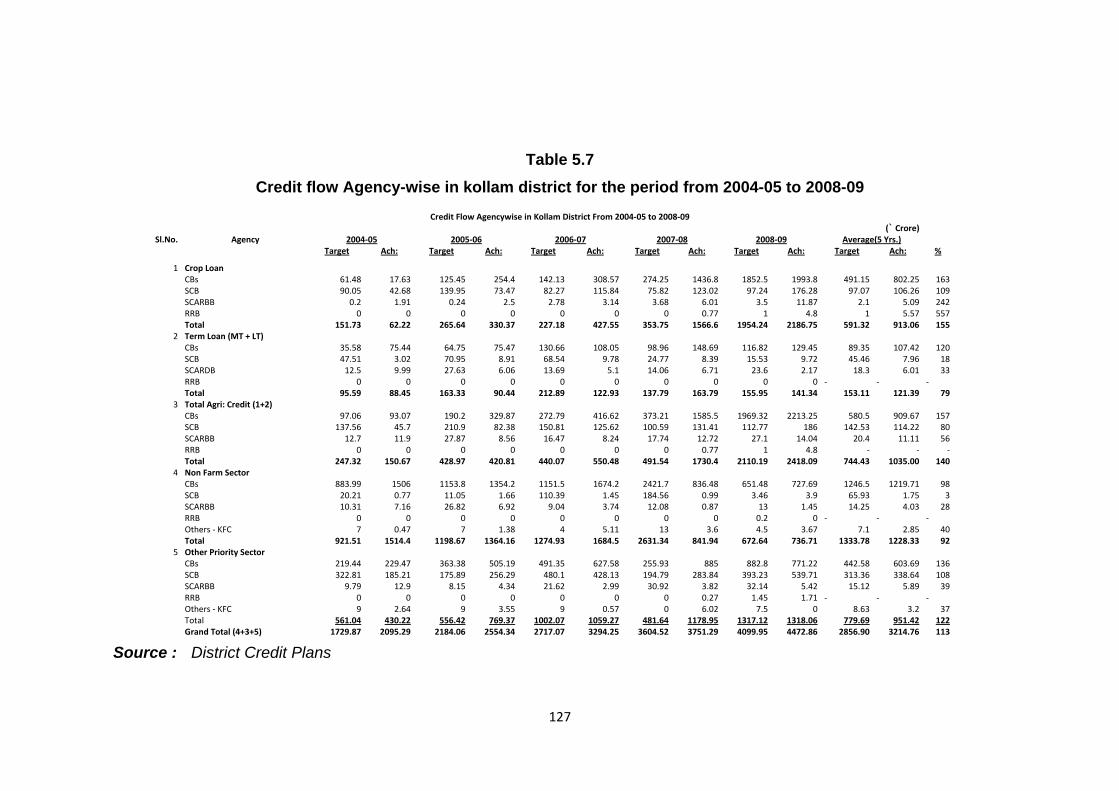
Table 5.7
Credit flow Agency-wise in kollam district for the period from 2004-05 to 2008-09
Credit Flow Agencywise in Kollam District From 2004-05 to 2008-09
(` Crore)
Sl.No. Agency 2004-05 2005-06 2006-07 2007-08 2008-09 Average(5 Yrs.)
Target Ach: Target Ach: Target Ach: Target Ach: Target Ach: Target Ach: %
1 Crop Loan
CBs 61.48 17.63 125.45 254.4 142.13 308.57 274.25 1436.8 1852.5 1993.8 491.15 802.25 163
SCB 90.05 42.68 139.95 73.47 82.27 115.84 75.82 123.02 97.24 176.28 97.07 106.26 109
SCARBB 0.2 1.91 0.24 2.5 2.78 3.14 3.68 6.01 3.5 11.87 2.1 5.09 242
RRB 0 0 0 0 0 0 0 0.77 1 4.8 1 5.57 557
Total 151.73 62.22 265.64 330.37 227.18 427.55 353.75 1566.6 1954.24 2186.75 591.32 913.06 155 2 Term Loan (MT + LT)
CBs 35.58 75.44 64.75 75.47 130.66 108.05 98.96 148.69 116.82 129.45 89.35 107.42 120
SCB 47.51 3.02 70.95 8.91 68.54 9.78 24.77 8.39 15.53 9.72 45.46 7.96 18
SCARDB 12.5 9.99 27.63 6.06 13.69 5.1 14.06 6.71 23.6 2.17 18.3 6.01 33
RRB 0 0 0 0 0 0 0 0 0 0 - - -
Total 95.59 88.45 163.33 90.44 212.89 122.93 137.79 163.79 155.95 141.34 153.11 121.39 79 3 Total Agri: Credit (1+2)
CBs 97.06 93.07 190.2 329.87 272.79 416.62 373.21 1585.5 1969.32 2213.25 580.5 909.67 157
SCB 137.56 45.7 210.9 82.38 150.81 125.62 100.59 131.41 112.77 186 142.53 114.22 80
SCARBB 12.7 11.9 27.87 8.56 16.47 8.24 17.74 12.72 27.1 14.04 20.4 11.11 56
RRB 0 0 0 0 0 0 0 0.77 1 4.8 - - -
Total 247.32 150.67 428.97 420.81 440.07 550.48 491.54 1730.4 2110.19 2418.09 744.43 1035.00 140 4 Non Farm Sector
CBs 883.99 1506 1153.8 1354.2 1151.5 1674.2 2421.7 836.48 651.48 727.69 1246.5 1219.71 98
SCB 20.21 0.77 11.05 1.66 110.39 1.45 184.56 0.99 3.46 3.9 65.93 1.75 3
SCARBB 10.31 7.16 26.82 6.92 9.04 3.74 12.08 0.87 13 1.45 14.25 4.03 28
RRB 0 0 0 0 0 0 0 0 0.2 0 - - -
Others - KFC 7 0.47 7 1.38 4 5.11 13 3.6 4.5 3.67 7.1 2.85 40
Total 921.51 1514.4 1198.67 1364.16 1274.93 1684.5 2631.34 841.94 672.64 736.71 1333.78 1228.33 92
5 Other Priority Sector
CBs 219.44 229.47 363.38 505.19 491.35 627.58 255.93 885 882.8 771.22 442.58 603.69 136
SCB 322.81 185.21 175.89 256.29 480.1 428.13 194.79 283.84 393.23 539.71 313.36 338.64 108
SCARBB 9.79 12.9 8.15 4.34 21.62 2.99 30.92 3.82 32.14 5.42 15.12 5.89 39
RRB 0 0 0 0 0 0 0 0.27 1.45 1.71 - - -
Others - KFC 9 2.64 9 3.55 9 0.57 0 6.02 7.5 0 8.63 3.2 37
Total 561.04 430.22 556.42 769.37 1002.07 1059.27 481.64 1178.95 1317.12 1318.06 779.69 951.42 122
Grand Total (4+3+5) 1729.87 2095.29 2184.06 2554.34 2717.07 3294.25 3604.52 3751.29 4099.95 4472.86 2856.90 3214.76 113
Source : District Credit Plans
128
It may be seen from table 5.7 that the average GLC during 2004-05
and 2008-09 was targeted at ` 2,856.9 crore. As against the target, the
actual credit flow averaged ` 3,214.74 crore and the achievement worked
out at 113 per cent. Under Crop Loan, as against the targeted ` 590.32
crore, the achievement averaged at ` 913.60 crore and it worked out at 155
per cent. When compared to the GLC under Crop Loan, the credit flow
under medium term and long term investment purposes was targeted at a
low amount of ` 153.11 crore per annum during the last 5-year reference
period. As against this target, the achievement averaged ` 121.39 crore,
79 per cent of the target. Thus, compared to the flow of credit under Crop
Loan, both credit target and achievements for capital formation process
under agriculture was at a low pace in Kollam district during the reference
period. This subject draws serious concern from the policy-makers to
further strengthen agriculture sector in the district.
The credit target planned under Total Agri-Credit including Crop
Loan and loans under Medium- Term (MT) and Long- Term (LT) averaged
` 743.43 crore during the reference period. As against this target the
achievement averaged ` 1,035 crore per annum during the reference
period. The percentage of achievement worked out at 140. Thus, it may
be observed that the targets under Crop Loan, Term Loan and Total Agri
Credit were achieved during the reference period from 2004-05 to 2008-09.
During the same period the credit flow per annum under Non- Farm
Sector (NFS) averaged ` 1,333.78 crore and the achievement averaged `
1,228.33 crore, at 92 per cent. During the reference period the targeted
credit under NFS ranged from ` 921.51 crore during 2004-05 and it was
kept at a low level of ` 672.64 crore during 2008-09. The data reflects a
lowering of the credit target under NFS from the year 2008-09. The
achievement which stood at ` 1,514.40 crore during 2004-05
marginally fell to ` 1,364.16 crore during 2005-06 and subsequently
129
increased to ` 1,684.50 crore during 2006-07 and further decreased to
` 841.94 crore during 2007-08 and thereafter decreased to ` 736.71 crore
during the year 2008-09. The reason for lower allocation of target under
NFS and the corresponding declining trend in achievement of the loan
disbursement under the sector is worth probing. Looking at the increasing
share of Secondary and Tertiary Sectors in the district economy, the lower
level of credit disbursements under NFS appears to be a mismatch.
As against the average targeted credit of ` 779.69 crore per annum
during the reference period, the achievement averaged ` 951.42 crore, at
122 per cent. A perusal of the credit target and achievement under OPS
reflects an increasing trend till 2006-07 and further a declining trend in the
target during 2007-08. The credit target under OPS was kept at ` 561.04
crore during 2004-05 and it was marginally decreased to ` 556.42 crore
during 2005-06 and further increased to ` 1,002.07 crore and subsequently
the target was kept at Rs 481.64 crore during 2007-08 and further kept at a
higher level of ` 1,317.12 crore during the year 2008-09. However, the
disbursement under OPS records an increasing trend from ` 430.22 crore
from 2004-05 to ` 769.37 crore, ` 1,059.27 crore, ` 1,178.95 crore
and ` 1,318.06 crore during the year 2005-06, 2006-07, 2007-08 and
2008-09 respectively.
Out of the average annual credit disbursement of ` 3,214.76 crore
the credit flow under Crop Loans averaged ` 913.60 crore per annum, 28
per cent of the credit disbursement. In the case of the average
disbursement under Term Loan at ` 121.39 crore constituting only 4 per
cent of the GLC, the pattern of credit flow for capital formation appears to be
at a very low level. In the case of the total credit flow under agriculture, the
actual disbursement for capital formation in agriculture constituted only 12
per cent of the credit. The pattern of the credit disbursement under capital
formation also reflected a marginal increasing trend. It was at ` 88.45
crore during 2004-05 and recorded a marginal increase of ` 90.44 crore
130
during 2005-06 and further rose to ` 122.93 crore during 2006-07, ` 163.79
crore during 2007-08 and further declined to ` 141.34 crore during 2008-09.
From the data it appears that there was a relatively poor demand and
disbursement of credit for capital formation process under agriculture during
the reference period in Kollam district.
The allocated credit under NFS during the reference period averaged
` 1,333.78 crore, constituting 41 per cent of the annual credit target. The
achievement during the period averaged ̀ 1,228.33 crore, 38 per cent of the
average credit disbursements. Thus, there was a fall in achievement of the
target under NFS. The pattern of disbursement under NFS during the
period reflects inconsistent trends. The credit disbursement which was `
1,514.40 crore during 2004-05 declined to ` 1,364.16 crore during 2005-06
and marginally increased to ` 1,684.50 crore during 2006-07 and further
declined to ` 841.94 crore during 2007-08 and the disbursement further
decreased to ` 736.71 crore during 2008-09. During the same reference
period fixation of the targets also reflected illogical trends from the year
2007-08. The target which was kept at ` 1,274.93 crore during 2006-07
was increased to 2,631.34 crore during 2007-08 and drastically reduced to ̀
672.64 crore during 2008-09. The logic of such a sizable reduction in the
allocation of the credit target under NFS in a developing district economy
warrants careful planning process.
Both credit planning and credit disbursements under Other Priority
Sector (OPS) reflected increasing trends. The average disbursements per
annum consisting of ̀ 951.42 crore constituted 30 per cent of the total credit
disbursement. The actual disbursement under OPS increased from `
430.22 crore during 2004-05 to ` 769.37 crore during 2005-06 and further
increased to ` 1,059.27 crore in 2006-07, ` 1,178.95 crore during 2007-08
and further rose to ` 1,318.06 crore during 2008-09. Thus, the
disbursement under OPS recorded a steady increasing trend. The liberal
credit facilities followed by the banks under this sector appear to be the
131
reason for the steady increase.
Agency-wise Credit Flow
Out of the average annual credit disbursement at ` 3,214.76 crore
during the period from 2004-05 to 2008-09, the credit disbursed by
Commercial Banks (CBs) totalled ` 2,733.06 crore, 85 per cent. Thus
Commercial Banks played a major role in the disbursement of GLC in
Kollam district during the reference year 2004-05 and 2008-09. Out of the
per annum average Crop Loan disbursement at ` 913.60 crore, ` 802.25
crore, 87 per cent was disbursed by CBs. Similarly, out of the average
credit disbursement of ` 121.39 crore under Term Loan, ` 107.42 crore, 88
per cent was disbursed by CBs. In the case of NFS out of the total
disbursement of ` 1,228.33 crore, ` 1,219.71 crore, 99 per cent was
disbursed by CBs. Under Other Priority Sector (OPS) out of the total
disbursement of ` 951.42 crore, ` 603.69 crore, 63 per cent was disbursed
by Commercial Banks. Thus it is revealed that in all the four major sectors,
viz Crop Loan, Term Loan, NFS and OPS, Commercial Banks played an
important role in the credit delivery system in Kollam district. Thus the
hyposis that the flow of credit under agriculture sector was ensured by
banks under co-operative sectors compared to Commercial Banks is
rejected as the Commercial Banks played a major role in credit delivery.
In the case of loan disbursements under Crop Loan, Commercial
Banks played an increasing role in Kollam district. The credit
disbursement by CBs rose from ` 17.63 crore during 2004-05 in Kollam
district to ` 1,993.80 crore during 2008-09. Thus there is a significant
increase in the credit delivery system under Crop Loan by CBs. Whereas,
in the case of the loan disbursements under Term Loan, i.e. the loans
stipulated for capital formation process recorded an increase from ` 75.44
crore during 2004-05 to ` 129.45 crore during 2008-09, a marginal increase
under an important sector. The disbursements under NFS by Commercial
132
Banks in Kollam district also reflected a mixed trend. The disbursement
which were ranging from ` 1,506 crore in 2004-05 and ` 1,674.20 crore
during 2006-07 recorded declining trend in 2007-08 and during 2008-09.
The disbursement under NFS during these years was as less as ` 836.48
crore and ` 727.69 crore respectively.
Followed by Commercial Banks, State Co-operative Bank (SCB)
played a major role in disbursement of Crop Loan in Kollam district during
the year. Out of the total Crop Loan disbursement of ` 913.60 crore per
annum `106.26 crore, 12 per cent, was disbursed by SCB. In the case of
loan disbursement under Term Loan for capital formation under agriculture,
SCB played an insignificant role by disbursing on an average only ` 7.96
crore (7%) out of the total credit disbursement of ` 121.39 crore per annum
during the reference period in Kollam district. In spite of the co-operative
nature of the bank it could play only a minor role in credit disbursements
under Term Loan as well as under Non-Farm Sector. However, under
Other Priority Sector the bank could disburse on an average ` 338.64 crore
per annum during the reference period. This constituted 36 per cent of the
total credit disbursement per annum under OPS in Kollam district.
The role played by State Co-operative Agriculture and Rural
Development Bank (SCARDB) was minimal at ` 5.09 crore per annum
constituting only 0.6 per cent of the credit disbursement under Crop Loan.
In the case of the loan disbursement under Term Loan, the banks
disbursement averaged ` 6.01 crore per annum constituting only 5 per cent
of the total credit disbursement under the sector for capital formation
process. The bank which is supposed to play a major role in strengthening
the agriculture sector through capital formation process could play only an
insignificant role. The policy planners of the State Government who control
the bank should empower it to deliver its responsibilities. Such credit
institutions professional capacity to address the local requirement and
compete with other credit institutions generally reflects the capability of the
133
management system. The bank also could play only minor roles in the
case of credit delivery under NFS and OPS. The average disbursement
made by the bank per annum under NFS and OPS worked out at ` 4.03
crore and ` 5.89 crore respectively.
In Kollam district, RRB has also played only a small role in the case
of credit delivery under Crop Loan. The bank could not make any impact
on credit delivery under Term Loan, NFS and OPS. RRBs credit delivery
under Crop Loan also was insignificant to highlight.
Bank/Agency-wise Credit Flow
In order to study the bank-wise credit flow during the period 2004-05
and 2008-09 an attempt has been made to work out the average targeted
credits and corresponding achievements during the period under the broad
head, Farm Sector, Non- Farm Sector and Other Priority Sector. For this
purpose the data is collected from various District Credit Plans. The
results are given in table 5.8
134
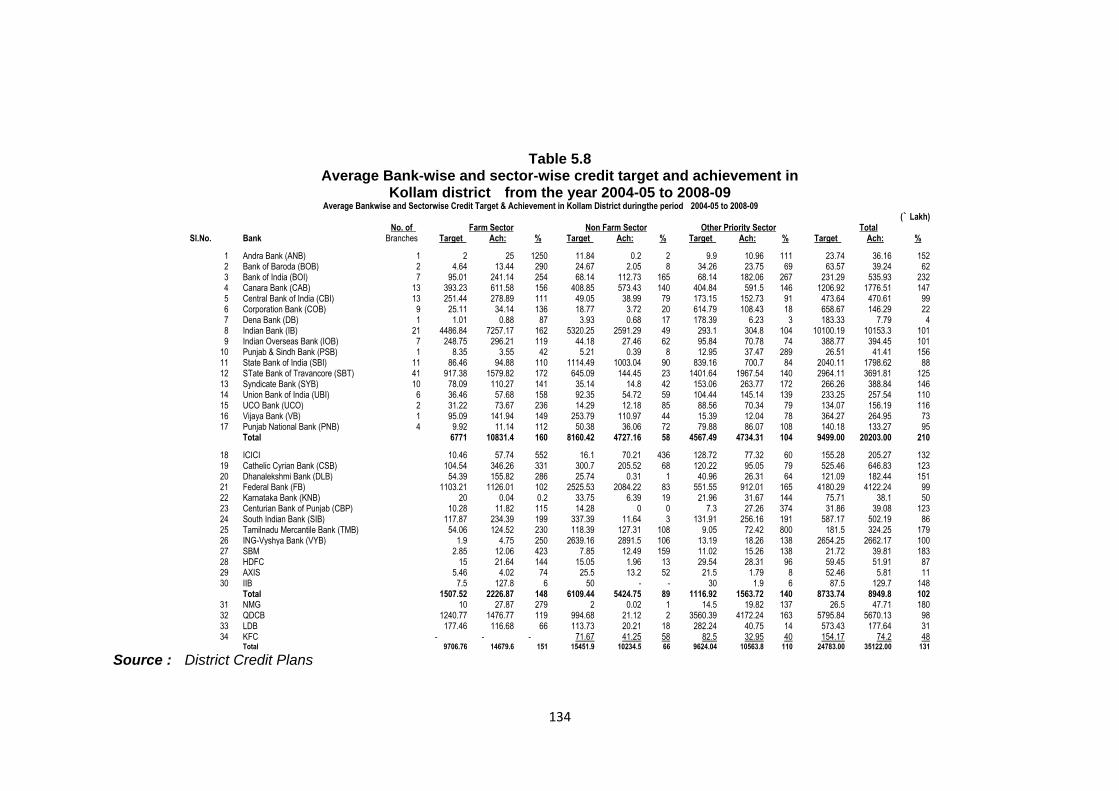
Table 5.8 Average Bank-wise and sector-wise credit target and achievement in
Kollam district from the year 2004-05 to 2008-09 Average Bankwise and Sectorwise Credit Target & Achievement in Kollam District duringthe period 2004-05 to 2008-09
(` Lakh)
No. of Farm Sector Non Farm Sector Other Priority Sector Total
Sl.No. Bank Branches Target Ach: % Target Ach: % Target Ach: % Target Ach: %
1 Andra Bank (ANB) 1 2 25 1250 11.84 0.2 2 9.9 10.96 111 23.74 36.16 152 2 Bank of Baroda (BOB) 2 4.64 13.44 290 24.67 2.05 8 34.26 23.75 69 63.57 39.24 62 3 Bank of India (BOI) 7 95.01 241.14 254 68.14 112.73 165 68.14 182.06 267 231.29 535.93 232 4 Canara Bank (CAB) 13 393.23 611.58 156 408.85 573.43 140 404.84 591.5 146 1206.92 1776.51 147 5 Central Bank of India (CBI) 13 251.44 278.89 111 49.05 38.99 79 173.15 152.73 91 473.64 470.61 99 6 Corporation Bank (COB) 9 25.11 34.14 136 18.77 3.72 20 614.79 108.43 18 658.67 146.29 22 7 Dena Bank (DB) 1 1.01 0.88 87 3.93 0.68 17 178.39 6.23 3 183.33 7.79 4 8 Indian Bank (IB) 21 4486.84 7257.17 162 5320.25 2591.29 49 293.1 304.8 104 10100.19 10153.3 101 9 Indian Overseas Bank (IOB) 7 248.75 296.21 119 44.18 27.46 62 95.84 70.78 74 388.77 394.45 101
10 Punjab & Sindh Bank (PSB) 1 8.35 3.55 42 5.21 0.39 8 12.95 37.47 289 26.51 41.41 156 11 State Bank of India (SBI) 11 86.46 94.88 110 1114.49 1003.04 90 839.16 700.7 84 2040.11 1798.62 88 12 STate Bank of Travancore (SBT) 41 917.38 1579.82 172 645.09 144.45 23 1401.64 1967.54 140 2964.11 3691.81 125 13 Syndicate Bank (SYB) 10 78.09 110.27 141 35.14 14.8 42 153.06 263.77 172 266.26 388.84 146 14 Union Bank of India (UBI) 6 36.46 57.68 158 92.35 54.72 59 104.44 145.14 139 233.25 257.54 110 15 UCO Bank (UCO) 2 31.22 73.67 236 14.29 12.18 85 88.56 70.34 79 134.07 156.19 116 16 Vijaya Bank (VB) 1 95.09 141.94 149 253.79 110.97 44 15.39 12.04 78 364.27 264.95 73 17 Punjab National Bank (PNB) 4 9.92 11.14 112 50.38 36.06 72 79.88 86.07 108 140.18 133.27 95
Total
6771 10831.4 160 8160.42 4727.16 58 4567.49 4734.31 104 9499.00 20203.00 210
18 ICICI
10.46 57.74 552 16.1 70.21 436 128.72 77.32 60 155.28 205.27 132 19 Cathelic Cyrian Bank (CSB) 104.54 346.26 331 300.7 205.52 68 120.22 95.05 79 525.46 646.83 123 20 Dhanalekshmi Bank (DLB) 54.39 155.82 286 25.74 0.31 1 40.96 26.31 64 121.09 182.44 151 21 Federal Bank (FB) 1103.21 1126.01 102 2525.53 2084.22 83 551.55 912.01 165 4180.29 4122.24 99 22 Karnataka Bank (KNB) 20 0.04 0.2 33.75 6.39 19 21.96 31.67 144 75.71 38.1 50 23 Centurian Bank of Punjab (CBP) 10.28 11.82 115 14.28 0 0 7.3 27.26 374 31.86 39.08 123 24 South Indian Bank (SIB) 117.87 234.39 199 337.39 11.64 3 131.91 256.16 191 587.17 502.19 86 25 Tamilnadu Mercantile Bank (TMB) 54.06 124.52 230 118.39 127.31 108 9.05 72.42 800 181.5 324.25 179 26 ING-Vyshya Bank (VYB) 1.9 4.75 250 2639.16 2891.5 106 13.19 18.26 138 2654.25 2662.17 100 27 SBM
2.85 12.06 423 7.85 12.49 159 11.02 15.26 138 21.72 39.81 183
28 HDFC
15 21.64 144 15.05 1.96 13 29.54 28.31 96 59.45 51.91 87 29 AXIS
5.46 4.02 74 25.5 13.2 52 21.5 1.79 8 52.46 5.81 11
30 IIB
7.5 127.8 6 50 - - 30 1.9 6 87.5 129.7 148
Total
1507.52 2226.87 148 6109.44 5424.75 89 1116.92 1563.72 140 8733.74 8949.8 102
31 NMG
10 27.87 279 2 0.02 1 14.5 19.82 137 26.5 47.71 180 32 QDCB
1240.77 1476.77 119 994.68 21.12 2 3560.39 4172.24 163 5795.84 5670.13 98
33 LDB
177.46 116.68 66 113.73 20.21 18 282.24 40.75 14 573.43 177.64 31 34 KFC
- - - 71.67 41.25 58 82.5 32.95 40 154.17 74.2 48
Total
9706.76 14679.6 151 15451.9 10234.5 66 9624.04 10563.8 110 24783.00 35122.00 131
Source : District Credit Plans
135
Out of the major Commercial Banks, around 30 agencies
participated in the credit delivery in Kollam district along with the RRB, North
Malabar Grameen Bank (NMG), Quilon District Co-operative Bank (QDCB),
the SCARDB and Kerala Financial Corporation (KFC). As may be seen
from the table 5.8 that among the major Commercial Banks, State Bank of
Travancore (SBT) was having 41 branches in the district followed by Indian
Bank (IB) 21 branches, Canara Bank (CAB) and Central Bank of India (CBI)
13 branches each, State Bank of India (SBI) 11 branches, Syndicate Bank
(SYB) 10 branches and Corporation Bank (COB) nine branches. The
remaining banks had branches ranging from one to seven as indicated in
the table 5.8.
The data in table 5.8 reflected regular target allocation among all the
financial institutions in Kollam district. The allocation of the target had a
direct relation with the number of branches that bank is having in the district.
Among the nationalised banks State Bank of Travancore (SBT) having 41
branches in Kollam district had the maximum credit allocation followed by
State Bank of India, Canara Bank and Corporation Bank. Other
nationalised banks were having relatively lesser target allocation.
Among the private sector banks, Federal Bank (FB) had relatively
larger credit allocation followed by ING Vysya Bank, Catholic Syrian Bank
and ICICI Bank. New banks like HDFC, AXIS, IIB, Karnataka Bank etc.
had a nominal credit allocation only. Most of these banks are having one
or two branches located at the commercial centre in Kollam Corporation.
These banks’ involvement in rural credit disbursements are yet to pick up.
Quilon District Co-operative Bank and SCARDB actively participated
in the credit delivery system in Kollam district. However, SCARDBs credit
disbursement was at a low level of 31 per cent of the credit target only. The
role played by Financial Corporation was also much below the expected
136
level. Their credit disbursements were around 48 per cent of the targeted
credit during the reference period. The North Malabar Grameen Bank
functioning in the district also played insignificant role in the rural credit
delivery. Though they had achieved the targeted credit, the quantum of
achievement was insignificant at ` 48 lakh per annum during the reference
period 2004-05 and 2008-09.
Among the broad sectors viz. Farm Sector, Non- Farm Sector and
other Priority Sector, the average targeted credit under Non- Farm Sector
was the highest at 47 per cent followed by the credit targets under Other
Priority Sector at 27 per cent and remaining 26 per cent was targeted under
Farm Sector. Though the credit targets were achieved at 101 per cent of
the target during the reference period, the achievement of the targets under
Non- Farm Sector often fell below the targets and it averaged at 66 per cent
during the 5-year period under the study. The achievement under Farm
Sector was relatively higher at 151 per cent compared to the other two
sectors. Govt. of India’s consistent thrust on increasing the rural credit flow
under agriculture appears to be the reason for the higher achievements.
The above analysis thus highlights the fact that there is larger scope
for financial institutions in Kollam district to further augment the rural credit
delivery. Though 34 agencies are participating in the delivery system,
except four major Commercial Banks, a couple of private banks and the
branches of Quilon District Central Co-operative Banks, a larger number of
the banks participation is on a nominal basis. Often these banks are also
given a smaller credit target for achievement based on their own earlier
trends in credit disbursements. This results in a continuous lower level of
credit allocation and disbursements. Thus there is a need to review the
whole exercise of credit allocation based on realistic potential and keeping
an accelerated regional and sector-wise growth performance.
In order to have an overview of the credit recovery an attempt was
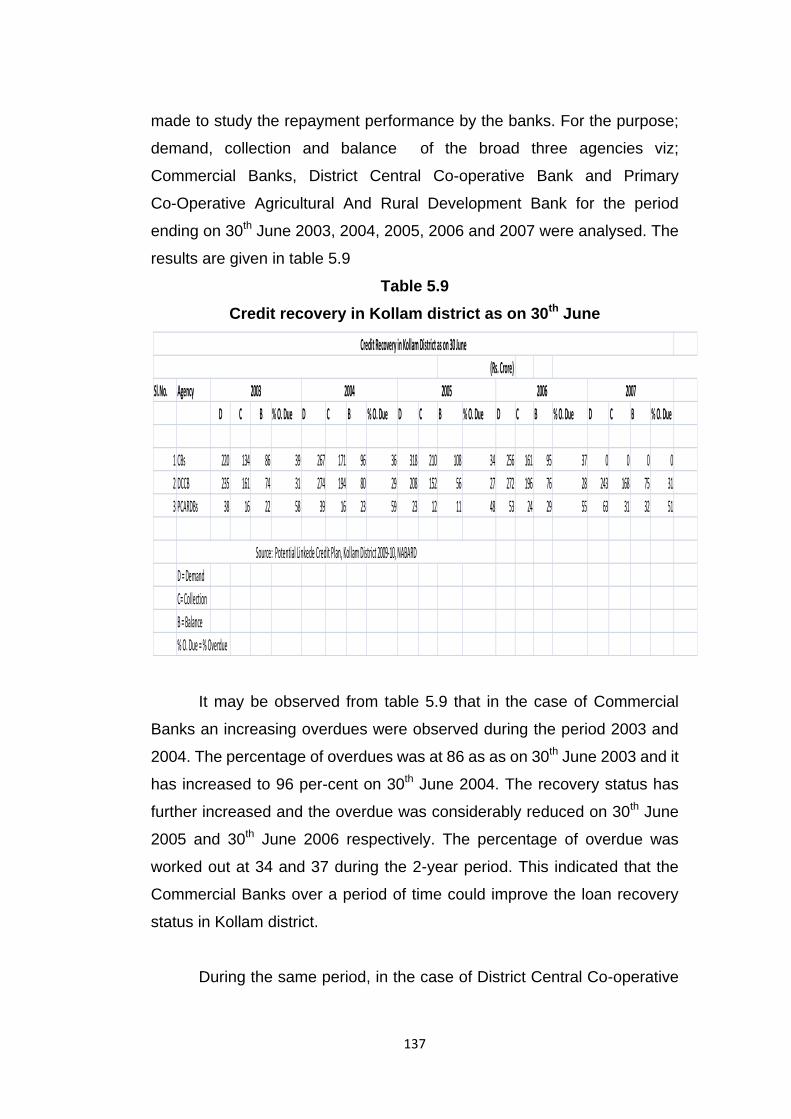
137
made to study the repayment performance by the banks. For the purpose;
demand, collection and balance of the broad three agencies viz;
Commercial Banks, District Central Co-operative Bank and Primary
Co-Operative Agricultural And Rural Development Bank for the period
ending on 30th June 2003, 2004, 2005, 2006 and 2007 were analysed. The
results are given in table 5.9
Table 5.9
Credit recovery in Kollam district as on 30th June
It may be observed from table 5.9 that in the case of Commercial
Banks an increasing overdues were observed during the period 2003 and
2004. The percentage of overdues was at 86 as as on 30th June 2003 and it
has increased to 96 per-cent on 30th June 2004. The recovery status has
further increased and the overdue was considerably reduced on 30th June
2005 and 30th June 2006 respectively. The percentage of overdue was
worked out at 34 and 37 during the 2-year period. This indicated that the
Commercial Banks over a period of time could improve the loan recovery
status in Kollam district.
During the same period, in the case of District Central Co-operative
(Rs. Crore)
Sl.No. Agency
D C B % O. Due D C B % O. Due D C B % O. Due D C B % O. Due D C B % O. Due
1 CBs 220 134 86 39 267 171 96 36 318 210 108 34 256 161 95 37 0 0 0 0
2 DCCB 235 161 74 31 274 194 80 29 208 152 56 27 272 196 76 28 243 168 75 31
3 PCARDBs 38 16 22 58 39 16 23 59 23 12 11 48 53 24 29 55 63 31 32 51
D = Demand
C= Collection
B = Balance
% O. Due = % Overdue
Credit Recovery in Kollam District as on 30 June
2007
Source: Potential Linkede Credit Plan, Kollam District 2009-10, NABARD
2003 2004 2005 2006
138
Bank also, there observed an increasing trend in the loan recovery. The
percentage of overdue which was at 74 percentage as on 30th June 2003
and it has reduced to 29 and 27 per cent during the subsequent years
2004 and 2005. The bank also recorded stability in collection of their dues
during the subsequent 2-years 2006 and 2007. The percentage of overdue
during the 2-year period worked out at 28 and 31 percentage respectively.
In the case of Primary Co-operative Agricultural And Rural
Development Bank, the overdues moved around 22 percentage during the
first 2-years of the reference period viz; 2003 and 2004. However during the
subsequent 3 years, the overdue status has worsened and it averaged 48
per cent, 55 per cent and 51 per cent during the 3-year period 2005, 2006
and 2007 respectively.
The analysis thus indicates that among the three broad agencies, the
loan recovery status in the case of district central co-operative bank was
relatively better in Kollam district during the period 2003-2007 compared to
Commercial Banks and Primary Co-operative Agricultural and Rural
Development Bank. Among the three agencies the loan recovery status
worsened over time in the case of Primary Co-operative Agricultural and
Rural Development Bank, while in the case of other two agencies, it could
improve the situation.
139
References
1. UNDP (2009) “Vital Statistics Report” Planning Commission Project on
Strengthening State Plans for Human Development, HDRC Unit, State
Planning Board, Dec.
2. Govt. of Kerala, (1999) Economic Review, State Planning Board,
Thiruvananthapuram.
3. Govt. Kerala, (2009) Economic Review, State Planning Board,
Thiruvananthapuram March 2010 p. 63
4. Gadgil, M.V, (1986) “Agricultural Credit in India: A Review of
Performance and Policies”, Indian Journal of Agricultural Economics, 41
(3),
5. Reserve Bank of India, (1969) All India Rural Credit Review Committee
Report, Mumbai.
6. Reserve Bank of India, (1974) All India Debt and Investment Survey
1971-72, Bombay.
7. Reserve Bank of India (1979), Committee to Review Arrangements for
Institutional Credit for Agriculture and Rural Development (B.
Shivaraman), Bombay
8. Reserve Bank of India, (1990) Report of the Agricultural Credit Review
Committee (A.M. Khusro) Mumbai.
9. Reserve Bank of India, (1990) Report of the Agricultural Credit Review
Committee (A.M. Khusro) ibid, Mumbai.
10. Niti Metha and Anitha Arya (2007) “Institutionalizing an Innovative
Approach Towards Agricultural Development” anvesak Vol. 37 No. 1,
Jan. – June.
11. Kulip Kour and Seema Saini, (2007) “Rural Credit and Micro Finance in
India – An Analysis”, anvesak Vol. 37, No. 2, July-Dec.