Embed Size (px)
Citation preview

SEAFOOD INDUSTRY


INDUSTRY DEFINITION
Aquaculture is the controlled production by man of vegetable and animal organisms which spend at least some of their life cycle in a water environment. These organisms, which include �sh, mollusks and crustaceans, provide a range of business opportunities and are a nutritional alternative. The activity helps the recovery of diminishing natural populations.Wild-capture �shing is the extraction of aquatic organisms from continental waters in their natural state or subjected to development activities.
THE SEAFOOD INDUSTRY IN MEXICO
* Source: Secretariat of Agriculture, Livestock, Rural Development, Fisheries and Food (SAGARPA), National Commission of Aquaculture and Fishing (CONAPESCA).** Source: INEGI. Mexican System of National Accounts.
Mexico's enormous potential in the �sheries sector lies in its 11,592 kilometers of coastline, of which 76% are on the Paci�c coast and 24% on the Gulf of Mexico, the Caribbean coast and islands. Its continental shelf is approximately 394,000 km², being larger in the Gulf of Mexico. It also has 12,500 km² of coastal lagoons and estuaries and 6,500 km² of inland waters such as lakes, lagoons, reservoirs, and rivers.
Fishing, hunting and capture accounted for 1.7% of Mexico's agricultural GDP in 2013**. In 2014, the volume of �shery production in live weight was 1,751 thousand tons, a growth of 0.3% compared to the previous year. Of the total production volume, 81.4% was capture �shing and the remaining 18.6% aquaculture. The total production value was US$1,812 million.
Aquaculture �sh production in 2014 reached a value of US$776.1 million, the main species produced through this activity according to volume were: mojarra with a share of 37%, shrimp 27%, and oyster 14%.
Aquaculture Capture
284
285
271
263
254
246
325
1,462
1,483
1,349
1,398
1,433
1,501
1,426
2008 2009 2010 2011 2012 2013 2014
Graph 1. Volume of Fishery Production in Mexico(thousands of tonnes.) 2008-2014*

The value of aquaculture production in 2014 was US$776.1 million, where the main species according to volume obtained were: mojarra with a 37% share, shrimp 27%, and oysters 14%.
Source: INEGI. Mexican System of National Accounts.
Product Millions ofUS dollars
Table 1. Fishery Production, 2014
Shrimp
Mojarra
Tuna
Octopus
Trout
Lobster
Guachinango
Sardine
Carp
Crab
Robalo
Others
Total
700.4
158.4
157.2
80.7
65.9
48.1
41.4
37.1
35.7
32.3
30.3
424.5
1,812.0
Sinaloa (43%), Sonora (26%) and Tamaulipas (7%)
Jalisco (21%), Chiapas (18%) and Michoacán (12%)
Sinaloa (38%), BC (38%), Colima (11%) and Chiapas (10%)
Yucatán (71%) and Campeche (22%)
Michoacán (39%), Edo México (28%) and Puebla (17%)
BCS (47%), BC (23%) and Yucatán(11%)
Jalisco (14%), BCS (11%), Michoacán (10%), Tabasco (9%)
and Oaxaca (9%)
Sonora (45%), Sinaloa (19%), BCS (18%) and BC (18%)
Jalisco (23%), Edo México (22%), and Hidalgo (15%)
Sinaloa (41%), Sonora (20%), Veracruz (13%), Campeche
(11%) and Tamaulipas (9%)
Campeche (22%), Veracruz (21%), Tabasco (16%) and
Nayarit (14%)
Main producers
THE SEAFOOD INDUSTRY IN MEXICO
Source: CONAPESCA, SAGARPA.
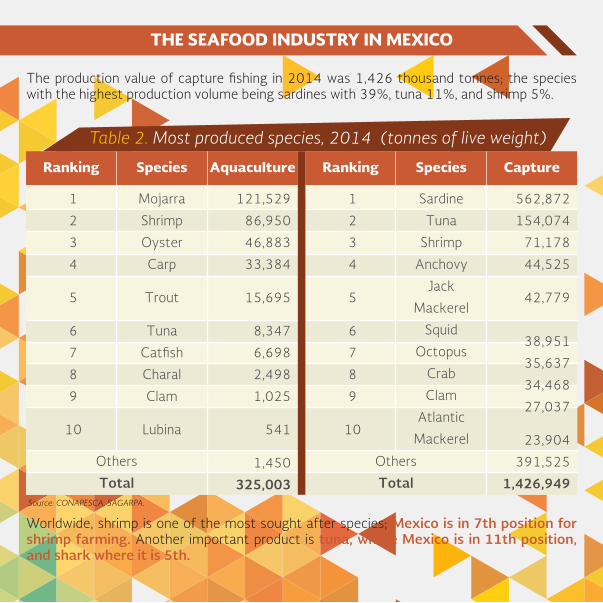
The production value of capture �shing in 2014 was 1,426 thousand tonnes; the species with the highest production volume being sardines with 39%, tuna 11%, and shrimp 5%.
Worldwide, shrimp is one of the most sought after species; Mexico is in 7th position for shrimp farming. Another important product is tuna, where Mexico is in 11th position, and shark where it is 5th.
THE SEAFOOD INDUSTRY IN MEXICO
CaptureSpeciesRanking
Table 2. Most produced species, 2014 (tonnes of live weight)
562,872
154,074
71,178
44,525
42,779
38,951
35,637
34,468
27,037
23,904
391,525
1,426,949
Sardine
Tuna
Shrimp
Anchovy
Jack
Mackerel
Squid
Octopus
Crab
Clam
Atlantic
Mackerel
1
2
3
4
5
6
7
8
9
10
Others
Total
AquacultureSpeciesRanking
121,529
86,950
46,883
33,384
15,695
8,347
6,698
2,498
1,025
541
1,450
325,003
Mojarra
Shrimp
Oyster
Carp
Trout
Tuna
Cat�sh
Charal
Clam
Lubina
1
2
3
4
5
6
7
8
9
10
Others
Total

There are more than 2,400 commercial �sh farms in Mexico and around 800 self-consumption units. Among the states with the highest number of production centers are Veracruz with more than 600, which produce mainly tilapia. Shrimp farms are more common in Sinaloa, with more than 300 and Sonora with more than 130, which make a signi�cant contribution to the supply of aquaculture foods.While there is certainly huge development potential for farmed shrimp production, in Mexico the greatest potential lies in the production of marine �n�sh and bivalve mollusks (oysters, clams and mussels).
EMPLOYMENT
In 2013, the �shing sector in Mexico employed 272,533 people, Sinaloa being the state with the highest number with a 17% share, followed by Veracruz with 15%, Tabasco 6.7%, Jalisco 5.4%, Sonora 5.3% and Michoacán 5.1%.
PROCESSING AND INDUSTRIALIZATION
20.4%
SHRIMP
22.8%
TUNA FISHMEAL
14.9%
The products with the highest percentage share of the fishing industry were:
AQUACULTURE PRODUCTION
12.6%
SARDINES & MACKEREL
Graph 2. Products with the highest percentage share

PROCESSING AND INDUSTRIALIZATION
Species %Share per species, 2011
Table 3. Fishing industry production in net weight by species, 2013
Tuna
Shrimp
Fishmeal
Sardines and mackerel
Squid
Full scale
Octopus
Fish oil
Shark
Crab
Lobster
Other
22.8%
20.4%
14.9%
12.6%
6.0%
5.0%
4.1%
3.7%
2.4%
2.2%
0.6%
5.1%
116,280
104,096
75,749
64,365
30,729
25,548
21,062
18,937
12,122
11,134
3,035
26,046
Production in net weight, (tons)
Note: Statistical Yearbook of Aquaculture and Fisheries 2013, CONAPESCA.
In 2013, the production volume in net weight of the main industrialization processes was 509,103 tons. The growth of production obtained through canned processes between 2007 and 2013 is particularly noteworthy with an average annual growth rate of 9.8%.

Mexico has almost 300 plants that process different �sh and shell�sh, including lobster, oysters, tuna, clams, squid, sardines, shrimp, and octopus.
Source: CONAPESCA Latest update: 21-10-2013.
BajaCalifornia 40
B.C.S. 14Yucatán 30
Jalisco 16
Colima 2
State of Mexico 1
Puebla 1
Oaxaca 2
Chiapas 9Campeche 24
Quintana Roo 4
Tlaxcala 1Queretaro 1
Veracruz 4Tabasco 4
Sonora 62
Tamaulipas 8San Luis Potosí 1
Guanajuato 5
Sonora 32

CONSUMPTION
Source: Statistical Yearbook of Aquaculture and Fisheries, 2013.
In 2013, of total �shing production, 37.4% was for indirect human consumption: national reduction plants transformed mainly sardines into �shmeal and �sh oil; 0.6% of production is classed as industrial use, algae, kelp, and some shells being its main exponents; the remaining 61.9% of production goes directly for human consumption.
2013
Indirecthuman consumption
Directhuman consumption
Industrial use 0.6%
61.9%37.4%
Graph 3. Fishery production, 2013

Categories % Share2014
Growth 2013-2014
Table 4. Market volume of fresh products in Mexico, 2014
Crustaceans
Fish
Mollusks and cephalopods
Fish and seafood
14%
69%
17%
100%
1.8%
2.3%
1.2%
2.0%
1.9%
2.1%
1.2%
1.9%
CAGR2014-2019
89.4
449
109.5
647.9
Volume 2014(Thousands of tons)
Categories % Share 2014 CAGR (2014-2019)
Table 5. Market value of processed products in Mexico, 2014
Crustaceans
Fish
Mollusks and cephalopods
Fish and seafood
81%
4%
15%
100%
0.9%
1.6%
1.5%
1.0%
1,068
57
193
1,318
Value 2014(millions of US dollars)
Mexico is the second largest market for fresh �sh and sea products in Latin America, recording a volume of 648,000 tons in 2014 and is expected to grow at a CAGR of 2% between 2014 and 2019 to reach 713,000 tons.
MARKET SIZE
Source: Euromonitor.
The HIGHEST SELLINGFRESH PRODUCE SEGMENT in MEXICO is FISH,
with a 69% MARKET SHARE.

MARKET SIZE
The market value of processed �sh and �shery products in Mexico in 2014 was US$1,318 million, canned and preserved products being the highest selling. Refrigerated and frozen products are expected to grow at an annual rate of 1.5% between 2014 and 2019.
Companies in Mexico with biggest market share in the canned and preserved seafood market are Grupo Herdez, Pescados Industrializados and Marindustrias with a combined share of 46%.
Source: ProMéxico based on Euromonitor.
Brand Company % Share
Herdez
Dolores
Tuny
Nair
Calmex
Calvo
El Vigilante
Mazatún
Guaymex
Yavaros
Herdez SA de CV, Grupo
Pescados Industrializados SA de CV
Marindustrias SA de CV
Herdez SA de CV, Grupo
Pando, Grupo SA de CV
Grupo Calvo SA
Justo López Valcárcel SA
Pescados Industrializados SA de CV
Productos Pesqueros de Guaymas SA de CV
Pando, Grupo SA de CV
Others
Total
17.1
16.2
13.1
5.3
4.2
3.6
2.6
2.5
2.3
1.5
31.6
100
Table 6. Main companies and brands in the canned and preserved seafood market of México, 2014
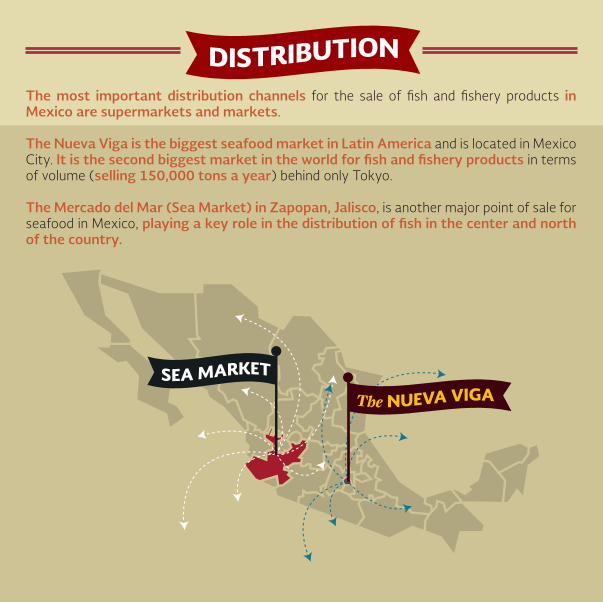
The most important distribution channels for the sale of �sh and �shery products in Mexico are supermarkets and markets.
The Nueva Viga is the biggest seafood market in Latin America and is located in Mexico City. It is the second biggest market in the world for �sh and �shery products in terms of volume (selling 150,000 tons a year) behind only Tokyo.
The Mercado del Mar (Sea Market) in Zapopan, Jalisco, is another major point of sale for seafood in Mexico, playing a key role in the distribution of �sh in the center and north of the country.
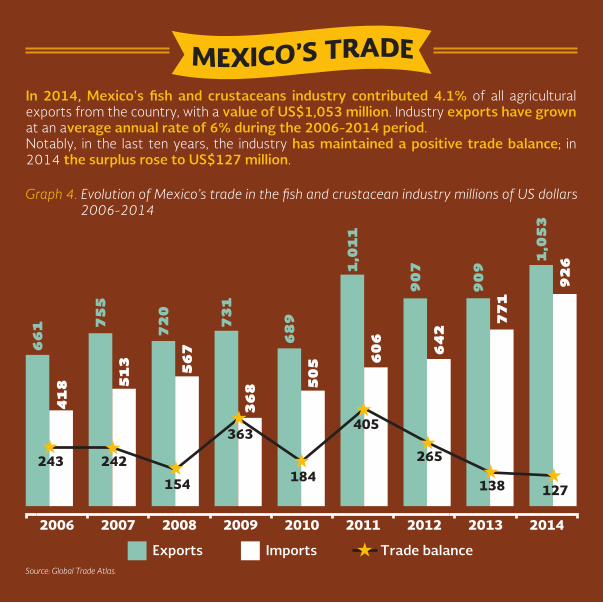
In 2014, Mexico's �sh and crustaceans industry contributed 4.1% of all agricultural exports from the country, with a value of US$1,053 million. Industry exports have grown at an average annual rate of 6% during the 2006-2014 period.Notably, in the last ten years, the industry has maintained a positive trade balance; in 2014 the surplus rose to US$127 million.
Source: Global Trade Atlas.
66
1 75
5
72
0
73
1
68
9
1,0
11
90
7
90
9
1,0
53
41
8 51
3 56
7
36
8 50
5 60
6
64
2
77
1
92
6
243 242
154
363
184
405
265
138 127
2006 2007 2008 2009 2010 2011 2012 2013 2014
Exports Imports Trade balance
Graph 4. Evolution of Mexico’s trade in the �sh and crustacean industry millions of US dollars 2006-2014

In 2014, 63.4% of Mexican �sh and crustacean exports went to the United States, followed by Hong Kong with a share of 8.3%, Japan 8.3%, Spain 6.9%, and Vietnam with 3.9%. Exports to South Korea have grown considerably at a rate of 132% compared with 2013.
MEXICO’S TRADE
Source: Global Trade Atlas.
Table 7. Destination of �sh and crustacean exports from Mexico, 2014
Country % Share 2014 Growth 2013-2014
United States
Hong Kong
Japan
Spain
Vietnam
Italy
South Korea
Malaysia
China
Canada
Others
Total
63.4%
8.3%
8.3%
6.9%
3.9%
2.9%
0.8%
0.8%
0.7%
0.6%
3.3%
100.0%
16.0%
-3.5%
15.3%
48.8%
54.7%
85.2%
132.5%
-9.9%
-69.0%
10.3%
11.3%
15.9%
668
88
88
73
41
30
9
8
7
7
34
1,053
Value 2014(millions of US dollars)

VOLUME of FISH PRODUCTION in MEXICO(thousands of tons)
2008-2014
1,462 1,4831,349
1,398 1,4331,501 1,426
284 285 271 263 254 246 325
Aquaculture Capture �sheries
Source: Secretariat of Agriculture, Livestock, Rural Development, Fisheries and Food (SAGARPA),
National Commission of Aquaculture and Fisheries (CONAPESCA).
2008 2009 2010 2011 2012 2013 2014

EXPORT SUPPLY
Table 8.1 Export supply of the �sh and crustacean industry in Mexico, 2014
HS Code
% Share
% Growth 2013-2014
Main export destinations and % share
DescriptionExports(millions ofUS dollars)
0306
0303
0302
0307
0304
Crustaceans
(except preserved)
Frozen �sh (excluding �llets)
Fresh or chilled �sh
(except �llets)
Mollusks
(except preserved)
Fresh, refrigerated or frozen
�llets and other �sh meat
461
132
131
114
79
43.8%
12.5%
12.4%
10.8%
7.5%
17%
23%
6%
-3%
32%
U.S.A. 84.2%, Hong Kong
9.1%, Vietnam 3.8%, Japan
0.9% and France 0.8%.
Spain 33.5%, Japan 28.1%,
U.S.A. 10.6%, Malaysia
5.5% and Vietnam 4.9%
U.S.A. 64.3%, Japan
31.7%, Canada 3.3%,
United Kingdom 0.3% and
South Korea 0.3%
U.S.A. 25.3%, Italia 23.9%,
Hong Kong 15.6%, Spain
14.6%, and Vietnam 7.9%
U.S.A. 82.1%, Spain 13.2%,
Hong Kong 1.7%, Japan
1.4% and China 0.7%Source: Global Trade Atlas.

EXPORT SUPPLY
Table 8.2 Export supply of the �sh and crustacean industry in Mexico, 2014
HS Code
% Share
% Growth 2013-2014
Main export destinations and % share
DescriptionExports(millions ofUS dollars)
1605
0308
1604
0305
Prepared or preserved
crustaceans, mollusks and
other aquatic invertebrates
Aquatic invertebrates
(except preserved)
Prepared or preserved �sh,
caviar and caviar substitutes
Fish, dried, salted or in brine;
smoked �sh, �ours, meals
and pellets of �sh
65
35
28
8
6.2%
3.3%
2.7%
0.7%
4%
223%
45%
-29%
U.S.A. 66.7%, Hong Kong
21%, Singapore 5.2%,
South Korea 3.5% and
Japan 1%
U.S.A. 59.8%, Vietnam
22.3%, Hong Kong 16.3%,
Thailand 0.9% and
Singapore 0.5%
U.S.A. 83.9%, Costa Rica
10.9%, Puerto Rico 2.4%,
Spain 1.1% and Panama
0.7%
Hong Kong 87.4%, China
6.3%, U.S.A. 4.4%, Cuba
1.9% and Vietnam 0.01%
Source: Global Trade Atlas.

EXPORT SUPPLY
Table 8.3 Export supply of the �sh and crustacean industry in Mexico, 2014
HS Code
% Share
% Growth 2013-2014
Main export destinations and % share
DescriptionExports(millions ofUS dollars)
0301 Live �sh
Total
1
1,053
0.1%
100%
-48%
16%
U.S.A. 51.1%, South Korea
44.3%, Japan 3.2%,
Honduras 1% and Panama
0.2%
The most exported products are crustaceans like shrimp, lobster and crab, with a 44% share of total industry exports, followed by frozen �sh 13%, fresh �sh with 12%, mollusks 11%, and �llets and other �sh meat with an 8% share. The export of aquatic invertebrates showed considerable annual growth of 223%.
The number of export companies in Mexico in 2014 was around of 500. About 63% of export companies are located in the states of Sinaloa, Sonora, Baja California y Yucatán.
Source: Global Trade Atlas.

In 2014, 63.4% of Mexican �sh and crustacean exports went to the United States, followed by Hong Kong with a share of 8.3%, Japan 8.3%, Spain 6.9%, and Vietnam with 3.9%. Exports to South Korea have grown considerably at a rate of 132% compared with 2013.
In July 2013, Chiapas governor announced Malpaso Aquaculture Park project expansion, which aims to attract FDI in�ows over US$30mn in order to produce 70 thousand tonnes of tilapia annually for the next 5 years.
FOREIGN DIRECT INVESTMENT
Source: Ministry of Economy.
In the PERIOD from 1999 to 2014,THE INDUSTRY REGISTERED
US$2.8 MILLION of FDI.
NAICS Code Description
Table 9. FDI in�ows in the seafood products industry
11251
11411
31171
Aquaculture
Fisheries
Seafood Product Preparation and Packaging
Total
0.03
1.0
1.7
2.8
Value 2014(millions of US dollars)

On April 22, 2014, the WTO announced its �nal ruling in favor of Mexico in the dispute over the restrictive effects caused by "dolphin-safe" labeling on Mexican tuna exports to the United States market. The Mexican government recognized the WTO's decision which con�rms that the �shing methods used by the Mexican �eet comply with the highest international standards for the protection of species like dolphins.
The method employed by the Mexican tuna �eet is regulated by the Agreement on the International Dolphin Conservation Program recognized by the United Nations Food and Agriculture Organization (FAO) as having the highest sustainability, and which protects dolphins and tuna resources by avoiding the capture of juvenile tuna to ensure future supply.
FAO �gures for 2012 ranked Mexico 16th for world capture �shery production, representing 1.8% of the total. Despite Mexico's world ranking, its position is less favorable when the focus is on industrialization, a sign that with the raw material produced in the country, there is ample opportunity to invest in seafood processing and thereby increase value-added production.
Furthermore, the aquaculture industry in Mexico is in a stage of development and growth and therefore affords important investment opportunities: the cultivation of mollusks like oysters, shrimp, white �sh, tilapia, and others, for example. In particular there are species with potential for expansion such as abalone, clams, lobster, and shrimp.Exports can be increased through the introduction of Mexican products to the fast growing markets of Europe, Asia, and Russia, through key distribution channels like supermarkets.
MEXICO MEETS INTERNATIONAL STANDARDS