Embed Size (px)
Citation preview

covestro.com
Securing profitable growth
in challenging times Roadshow presentation
IR Roadshow Presentation Q3 2019 │
covestro.com 2
Covestro investment highlights
Group Financials Q3 2019
Segments overview
Background information
Q3 2019 │ IR Roadshow Presentation
Others 25%
29% Others
50%
12%
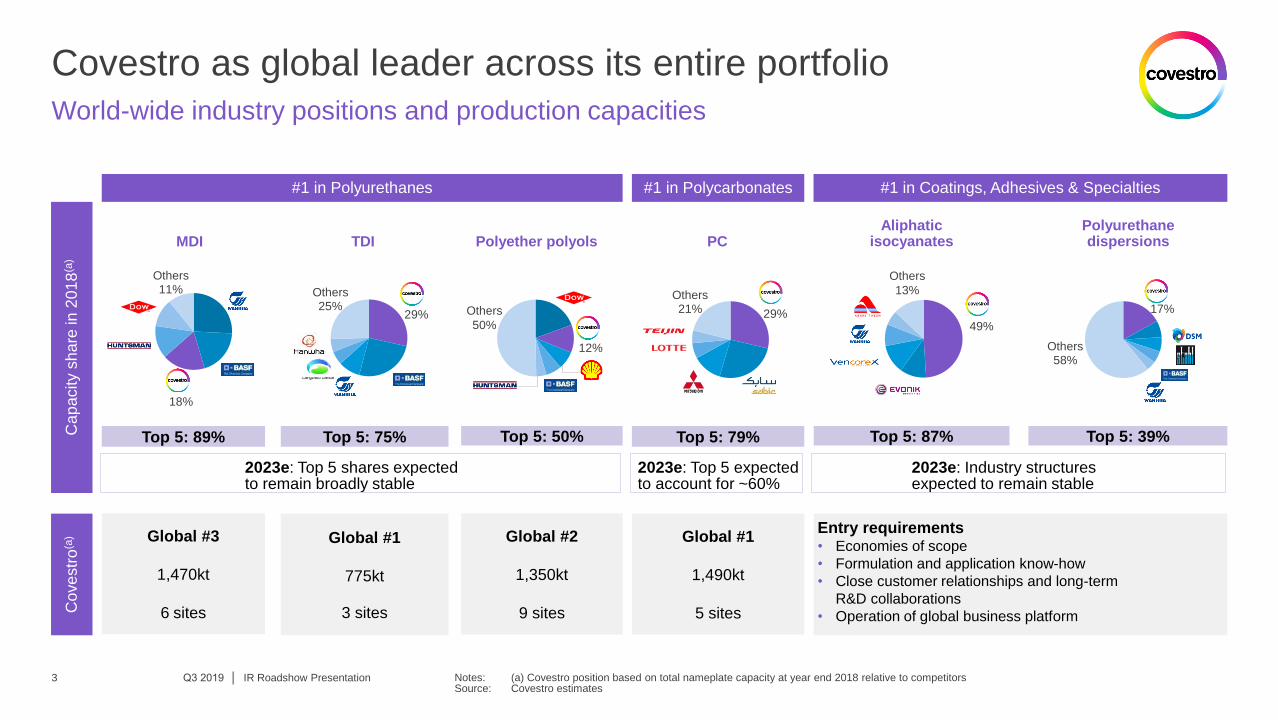
Covestro as global leader across its entire portfolio
World-wide industry positions and production capacities
Notes: (a) Covestro position based on total nameplate capacity at year end 2018 relative to competitors Source: Covestro estimates
29%
Others 21%
Others 11%
18%
17%
Others 58%
Cap
acity s
ha
re in 2
01
8(a
)
2023e: Industry structures expected to remain stable
2023e: Top 5 shares expected to remain broadly stable
Top 5: 89% Top 5: 75% Top 5: 50%
2023e: Top 5 expected to account for ~60%
Top 5: 79%
Aliphatic isocyanates
Polyurethane dispersions PC Polyether polyols TDI MDI
Top 5: 39% Top 5: 87%
49%
Others
13%
Cove
str
o(a
) Global #3
1,470kt
6 sites
Global #1
775kt
3 sites
Global #2
1,350kt
9 sites
Global #1
1,490kt
5 sites
Entry requirements • Economies of scope
• Formulation and application know-how
• Close customer relationships and long-term
R&D collaborations
• Operation of global business platform
IR Roadshow Presentation
#1 in Coatings, Adhesives & Specialties #1 in Polyurethanes #1 in Polycarbonates
Q3 2019 │ 3
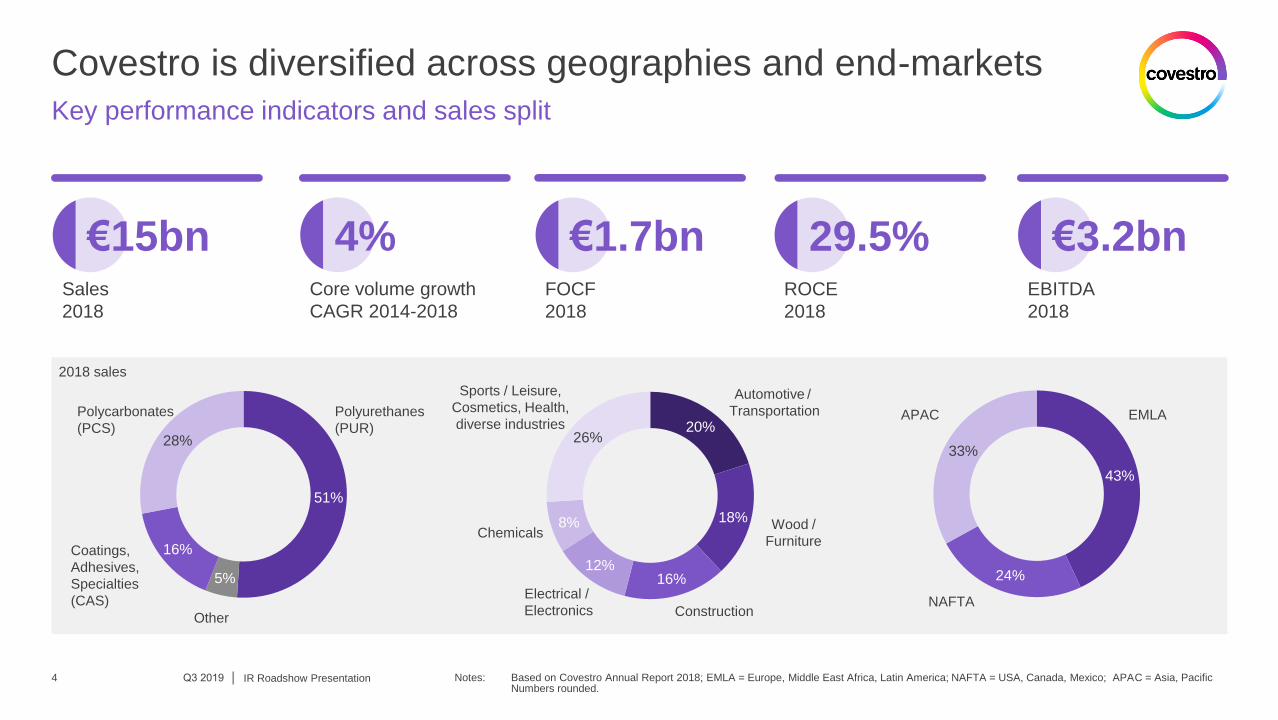
Covestro is diversified across geographies and end-markets
Key performance indicators and sales split
€1.7bn FOCF
2018
IR Roadshow Presentation
€3.2bn EBITDA
2018
4% Core volume growth
CAGR 2014-2018
€15bn Sales
2018
Q3 2019 │ 4
51%
5%
16%
28% 20%
18%
16% 12%
8%
26%
Polyurethanes
(PUR)
Polycarbonates
(PCS)
Coatings,
Adhesives,
Specialties
(CAS)
Other
Sports / Leisure,
Cosmetics, Health,
diverse industries
Chemicals
Electrical /
Electronics Construction
Wood /
Furniture
Automotive /
Transportation
Notes: Based on Covestro Annual Report 2018; EMLA = Europe, Middle East Africa, Latin America; NAFTA = USA, Canada, Mexico; APAC = Asia, Pacific Numbers rounded.
2018 sales
29.5% ROCE
2018
43%
24%
33%
EMLA APAC
NAFTA
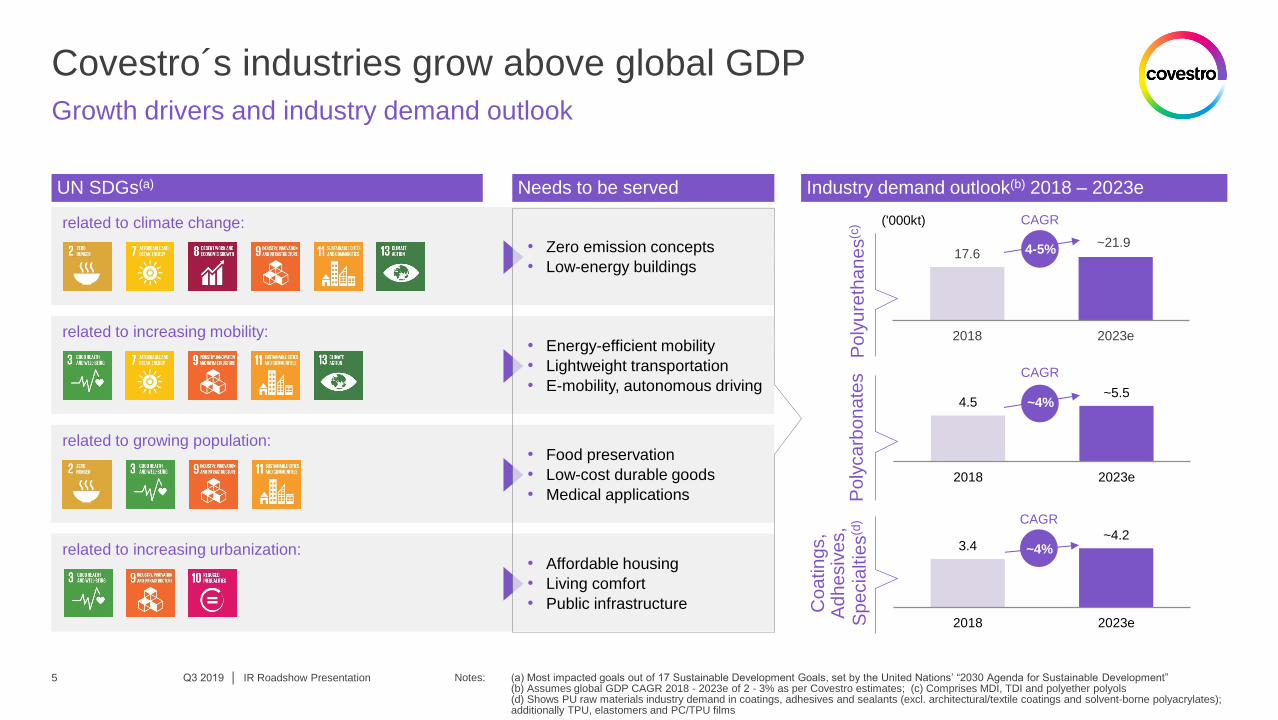
Covestro´s industries grow above global GDP
Growth drivers and industry demand outlook
Notes: (a) Most impacted goals out of 17 Sustainable Development Goals, set by the United Nations’ “2030 Agenda for Sustainable Development” (b) Assumes global GDP CAGR 2018 - 2023e of 2 - 3% as per Covestro estimates; (c) Comprises MDI, TDI and polyether polyols (d) Shows PU raw materials industry demand in coatings, adhesives and sealants (excl. architectural/textile coatings and solvent-borne polyacrylates); additionally TPU, elastomers and PC/TPU films
IR Roadshow Presentation
• Zero emission concepts
• Low-energy buildings
• Energy-efficient mobility
• Lightweight transportation
• E-mobility, autonomous driving
related to increasing mobility:
• Food preservation
• Low-cost durable goods
• Medical applications
related to growing population:
• Affordable housing
• Living comfort
• Public infrastructure
related to increasing urbanization: 3.4 ~4.2
2018 2023e
17.6
2018 2023e
4.5 ~5.5
2018 2023e
Po
lyca
rbo
na
tes
Po
lyu
reth
an
es
(c)
Co
atin
gs,
Ad
he
siv
es,
Sp
ecia
ltie
s(d
)
CAGR
4-5%
CAGR
~4%
CAGR
~4%
('000kt) related to climate change:
~21.9
Industry demand outlook(b) 2018 – 2023e UN SDGs(a) Needs to be served
Q3 2019 │ 5
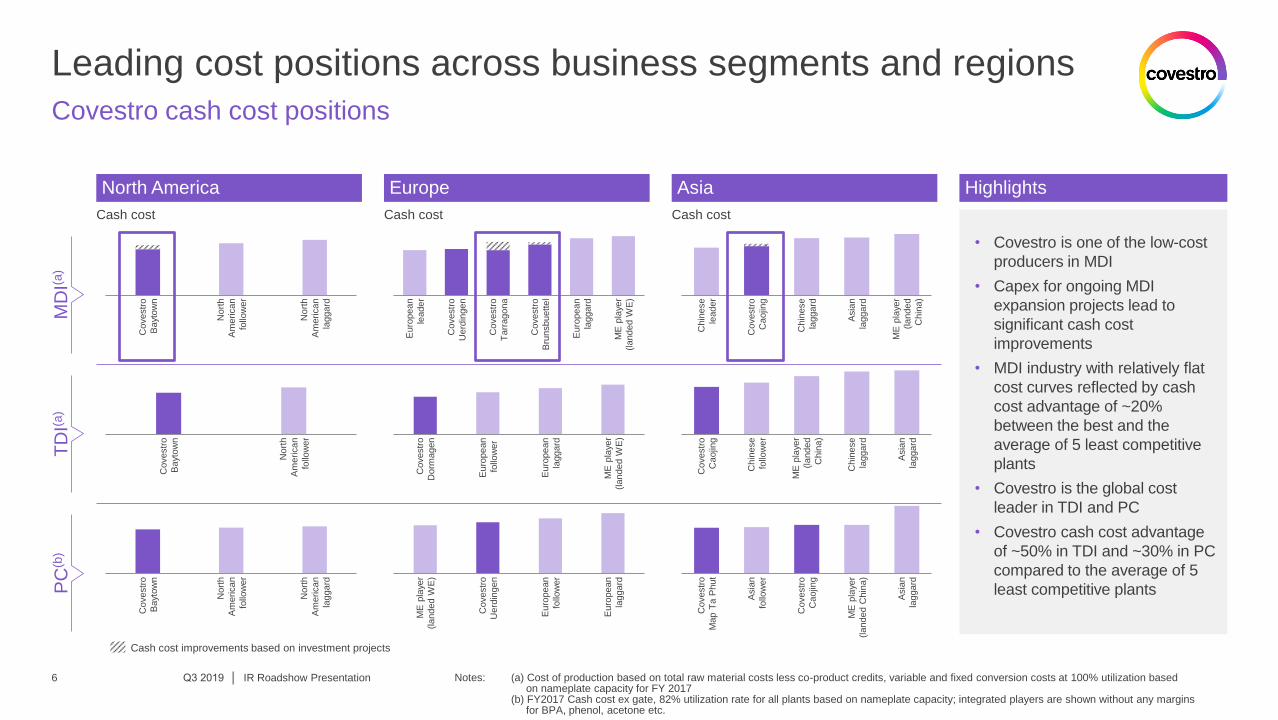
Leading cost positions across business segments and regions
IR Roadshow Presentation
Covestro cash cost positions
Notes: (a) Cost of production based on total raw material costs less co-product credits, variable and fixed conversion costs at 100% utilization based on nameplate capacity for FY 2017 (b) FY2017 Cash cost ex gate, 82% utilization rate for all plants based on nameplate capacity; integrated players are shown without any margins for BPA, phenol, acetone etc.
• Covestro is one of the low-cost
producers in MDI
• Capex for ongoing MDI
expansion projects lead to
significant cash cost
improvements
• MDI industry with relatively flat
cost curves reflected by cash
cost advantage of ~20%
between the best and the
average of 5 least competitive
plants
• Covestro is the global cost
leader in TDI and PC
• Covestro cash cost advantage
of ~50% in TDI and ~30% in PC
compared to the average of 5
least competitive plants
MD
I(a)
TD
I(a)
PC
(b)
Cash cost Cash cost Cash cost
Nort
h
Am
erican
laggard
Covestr
o
Bayt
ow
n
Nort
h
Am
erican
follo
wer
Covestr
o
Bru
nsbuettel
Euro
pean
laggard
Covestr
o
Tarr
agona
Euro
pean
leader
ME
pla
yer
(landed W
E)
Covestr
o
Uerd
ingen
Chin
ese
leader
ME
pla
yer
(landed
Chin
a)
Asia
n
laggard
Covestr
o
Caojin
g
Chin
ese
laggard
Covestr
o
Bayt
ow
n
Nort
h
Am
erican
follo
wer
Asia
n
laggard
Covestr
o
Caojin
g
Chin
ese
follo
wer
ME
pla
yer
(landed
Chin
a)
Chin
ese
laggard
Euro
pean
laggard
Covestr
o
Dorm
agen
Euro
pean
follo
wer
ME
pla
yer
(landed W
E)
Covestr
o
Bayt
ow
n
Nort
h
Am
erican
follo
wer
Nort
h
Am
erican
laggard
Cash cost improvements based on investment projects
ME
pla
yer
(landed W
E)
Covestr
o
Uerd
ingen
Euro
pean
laggard
Euro
pean
follo
wer
Covestr
o
Caojin
g
Covestr
o
Map T
a P
hut
Asia
n
follo
wer
ME
pla
yer
(landed C
hin
a)
Asia
n
laggard
Highlights North America Europe Asia
Q3 2019 │ 6
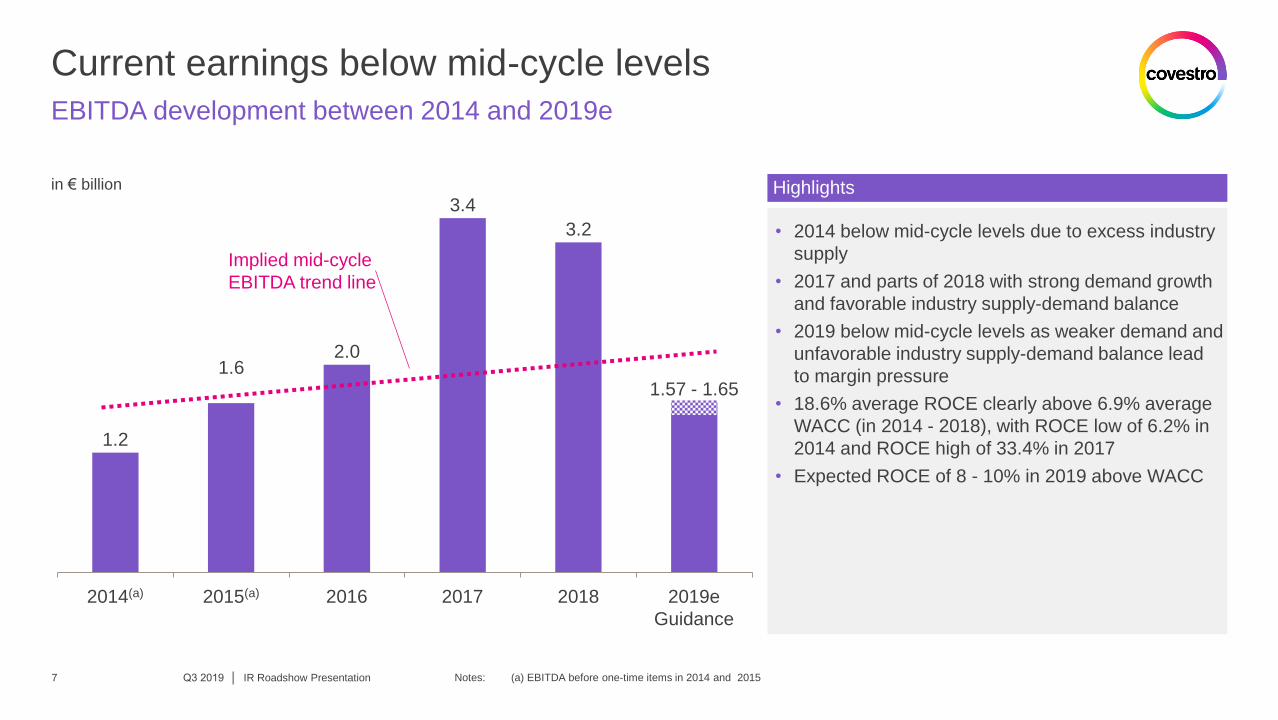
Current earnings below mid-cycle levels
IR Roadshow Presentation
EBITDA development between 2014 and 2019e
2014(a)
1.6
2015(a) 2019e
Guidance
2017 2016 2018
1.2
2.0
3.4
3.2
1.57 - 1.65
in € billion
Q3 2019 │ 7 Notes: (a) EBITDA before one-time items in 2014 and 2015
Implied mid-cycle
EBITDA trend line
• 2014 below mid-cycle levels due to excess industry
supply
• 2017 and parts of 2018 with strong demand growth
and favorable industry supply-demand balance
• 2019 below mid-cycle levels as weaker demand and
unfavorable industry supply-demand balance lead
to margin pressure
• 18.6% average ROCE clearly above 6.9% average
WACC (in 2014 - 2018), with ROCE low of 6.2% in
2014 and ROCE high of 33.4% in 2017
• Expected ROCE of 8 - 10% in 2019 above WACC
Highlights
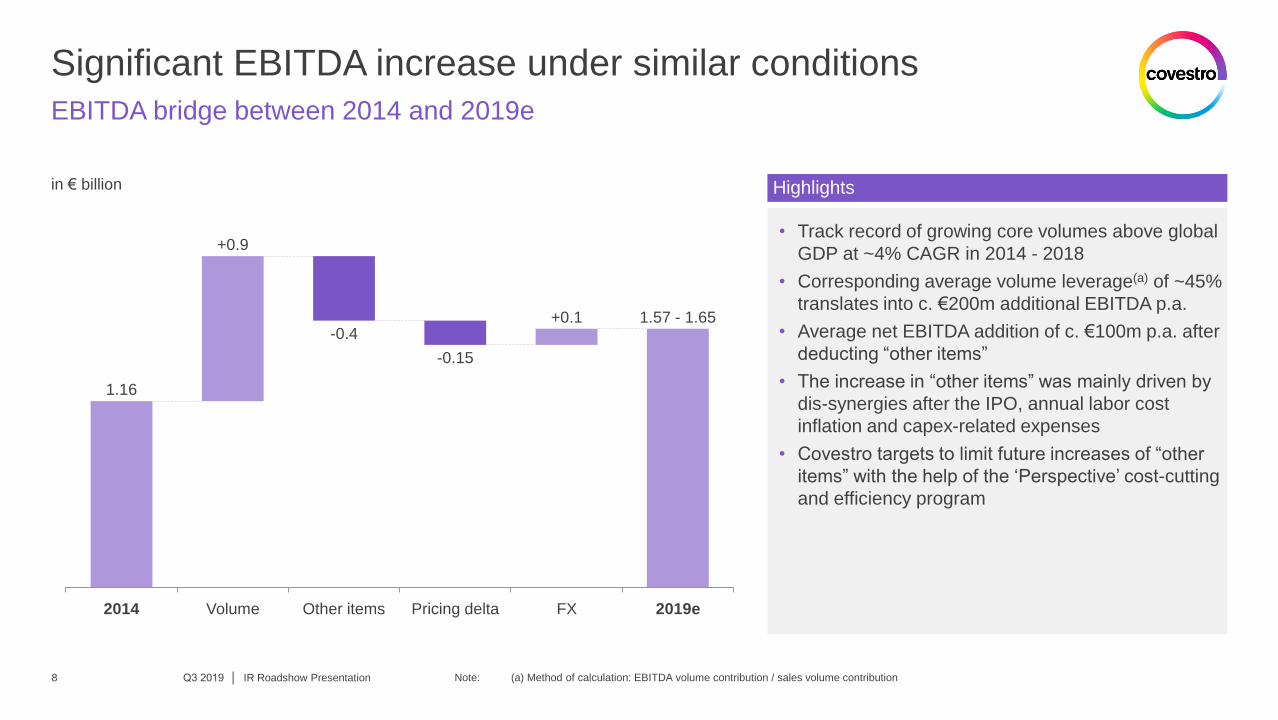
Significant EBITDA increase under similar conditions
Q3 2019 │ IR Roadshow Presentation
EBITDA bridge between 2014 and 2019e
Note: (a) Method of calculation: EBITDA volume contribution / sales volume contribution
2019e 2014 Volume Other items FX Pricing delta
1.16
+0.9
-0.4
-0.15
+0.1 1.57 - 1.65
in € billion
• Track record of growing core volumes above global
GDP at ~4% CAGR in 2014 - 2018
• Corresponding average volume leverage(a) of ~45%
translates into c. €200m additional EBITDA p.a.
• Average net EBITDA addition of c. €100m p.a. after
deducting “other items”
• The increase in “other items” was mainly driven by
dis-synergies after the IPO, annual labor cost
inflation and capex-related expenses
• Covestro targets to limit future increases of “other
items” with the help of the ‘Perspective’ cost-cutting
and efficiency program
Highlights
8
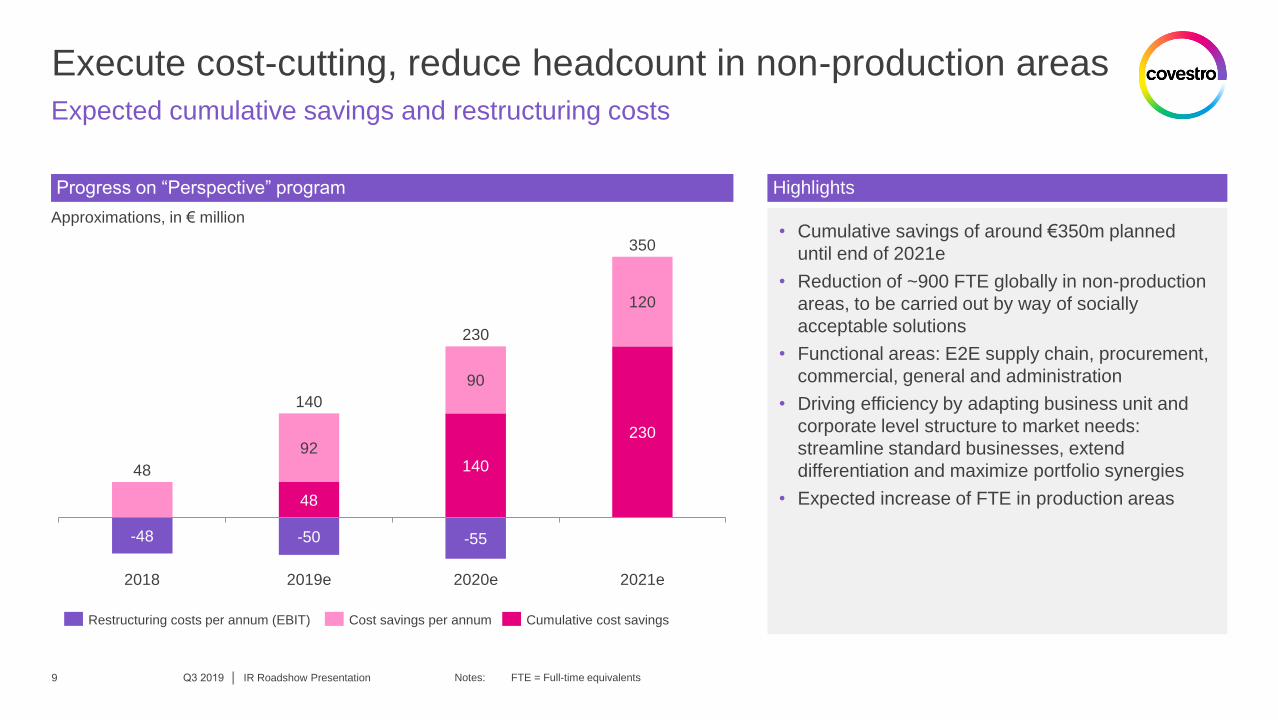
Execute cost-cutting, reduce headcount in non-production areas
IR Roadshow Presentation
Expected cumulative savings and restructuring costs
48
140
230
-48
92
90
120
-50 -55
350
2018 2019e
48
2021e 2020e
140
230
Restructuring costs per annum (EBIT) Cost savings per annum Cumulative cost savings
Notes: FTE = Full-time equivalents
Approximations, in € million
Progress on “Perspective” program Highlights
• Cumulative savings of around €350m planned
until end of 2021e
• Reduction of ~900 FTE globally in non-production
areas, to be carried out by way of socially
acceptable solutions
• Functional areas: E2E supply chain, procurement,
commercial, general and administration
• Driving efficiency by adapting business unit and
corporate level structure to market needs:
streamline standard businesses, extend
differentiation and maximize portfolio synergies
• Expected increase of FTE in production areas
Q3 2019 │ 9
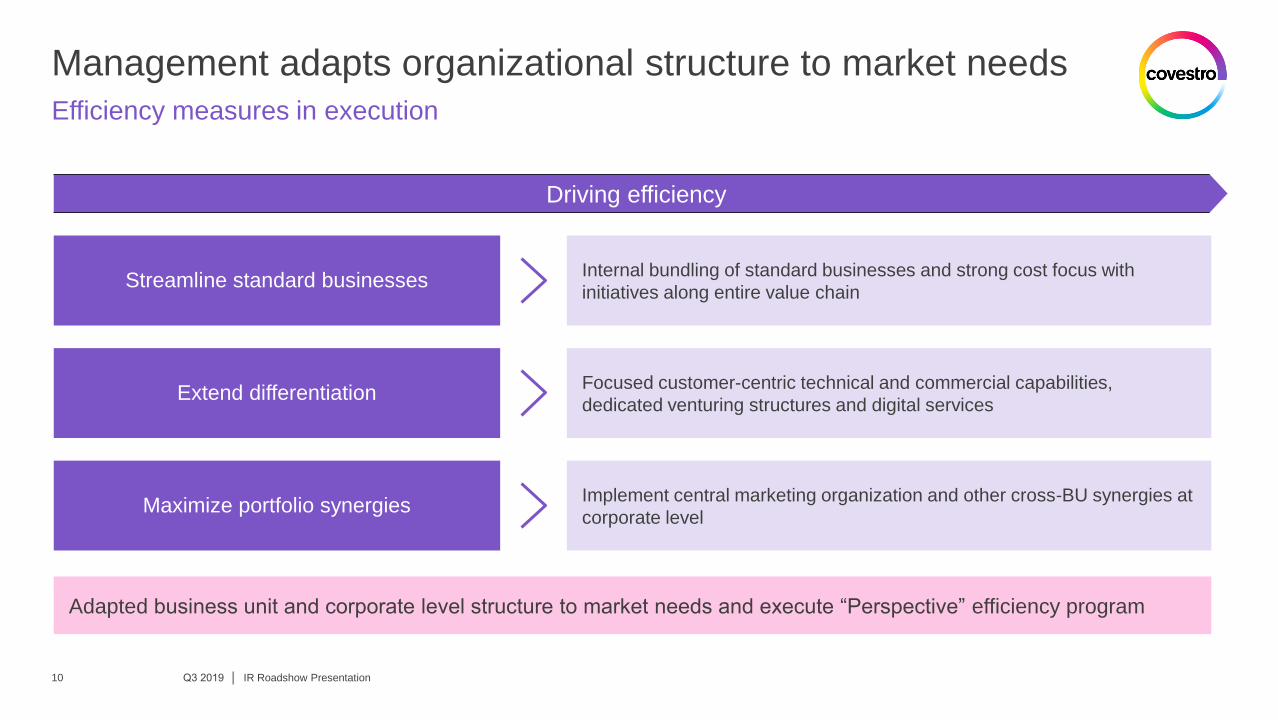
Management adapts organizational structure to market needs
Q3 2019 │ IR Roadshow Presentation
Efficiency measures in execution
10
Extend differentiation
Maximize portfolio synergies
Streamline standard businesses Internal bundling of standard businesses and strong cost focus with
initiatives along entire value chain
Focused customer-centric technical and commercial capabilities,
dedicated venturing structures and digital services
Implement central marketing organization and other cross-BU synergies at
corporate level
Adapted business unit and corporate level structure to market needs and execute “Perspective” efficiency program
Driving efficiency
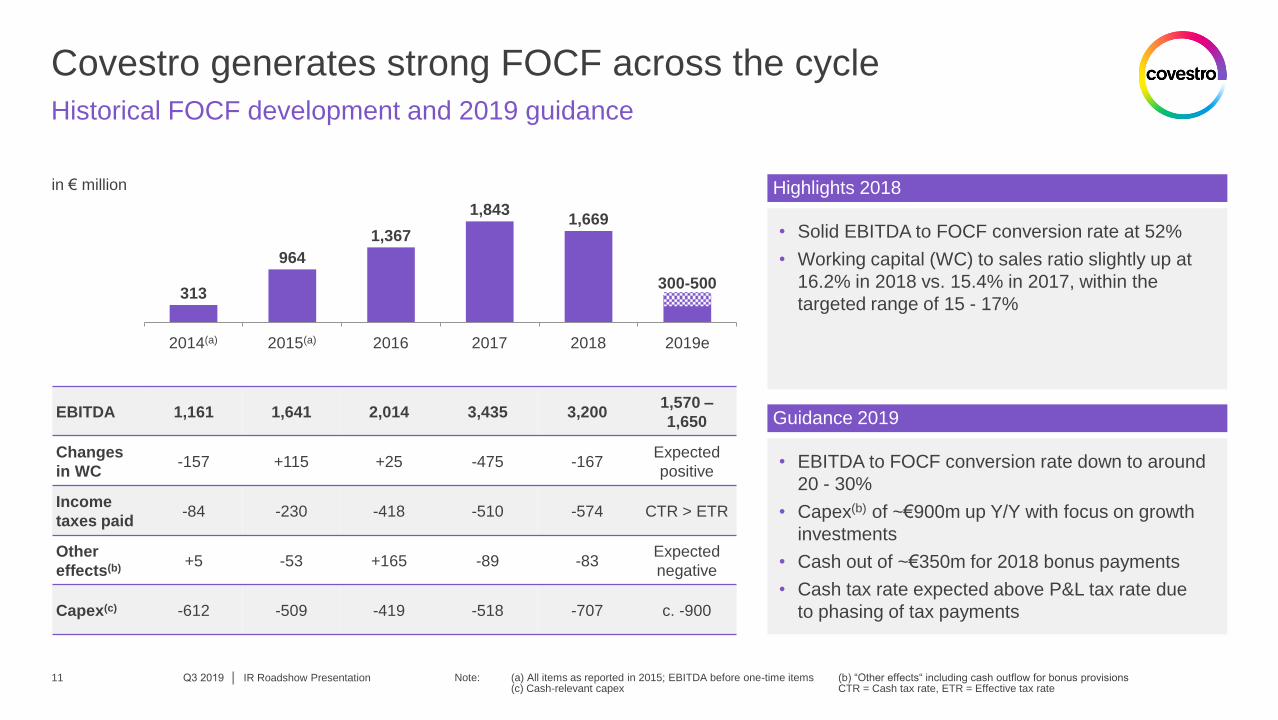
Covestro generates strong FOCF across the cycle
IR Roadshow Presentation
Historical FOCF development and 2019 guidance
Note: (a) All items as reported in 2015; EBITDA before one-time items (b) “Other effects“ including cash outflow for bonus provisions (c) Cash-relevant capex CTR = Cash tax rate, ETR = Effective tax rate
Highlights 2018
• Solid EBITDA to FOCF conversion rate at 52%
• Working capital (WC) to sales ratio slightly up at
16.2% in 2018 vs. 15.4% in 2017, within the
targeted range of 15 - 17%
Guidance 2019
• EBITDA to FOCF conversion rate down to around
20 - 30%
• Capex(b) of ~€900m up Y/Y with focus on growth
investments
• Cash out of ~€350m for 2018 bonus payments
• Cash tax rate expected above P&L tax rate due
to phasing of tax payments
Q3 2019 │ 11
≥900(b)
313
964
1,367
1,843 1,669
2018 2014(a) 2015(a) 2016 2017
300-500
2019e
in € million
EBITDA 1,161 1,641 2,014 3,435 3,200 1,570 –
1,650
Changes
in WC -157 +115 +25 -475 -167
Expected
positive
Income
taxes paid -84 -230 -418 -510 -574 CTR > ETR
Other
effects(b) +5 -53 +165 -89 -83
Expected
negative
Capex(c) -612 -509 -419 -518 -707 c. -900
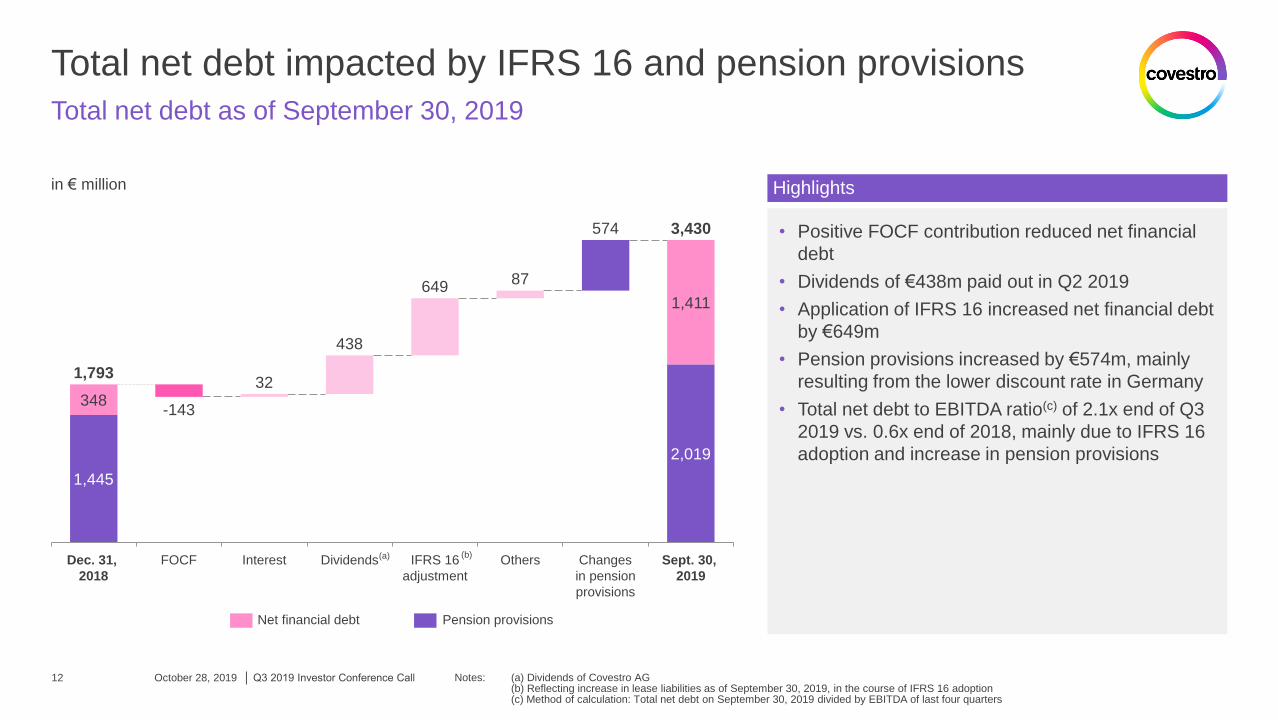
Total net debt impacted by IFRS 16 and pension provisions
October 28, 2019 │ Q3 2019 Investor Conference Call
Total net debt as of September 30, 2019
Notes: (a) Dividends of Covestro AG (b) Reflecting increase in lease liabilities as of September 30, 2019, in the course of IFRS 16 adoption (c) Method of calculation: Total net debt on September 30, 2019 divided by EBITDA of last four quarters
1,445
2,019
348 32
438
649 87
574
1,411
Dividends Dec. 31,
2018
FOCF Changes
in pension
provisions
-143
IFRS 16
adjustment
Interest Others Sept. 30,
2019
1,793
3,430
in € million
Net financial debt Pension provisions
(b)
Highlights
• Positive FOCF contribution reduced net financial
debt
• Dividends of €438m paid out in Q2 2019
• Application of IFRS 16 increased net financial debt
by €649m
• Pension provisions increased by €574m, mainly
resulting from the lower discount rate in Germany
• Total net debt to EBITDA ratio(c) of 2.1x end of Q3
2019 vs. 0.6x end of 2018, mainly due to IFRS 16
adoption and increase in pension provisions
12
(a)
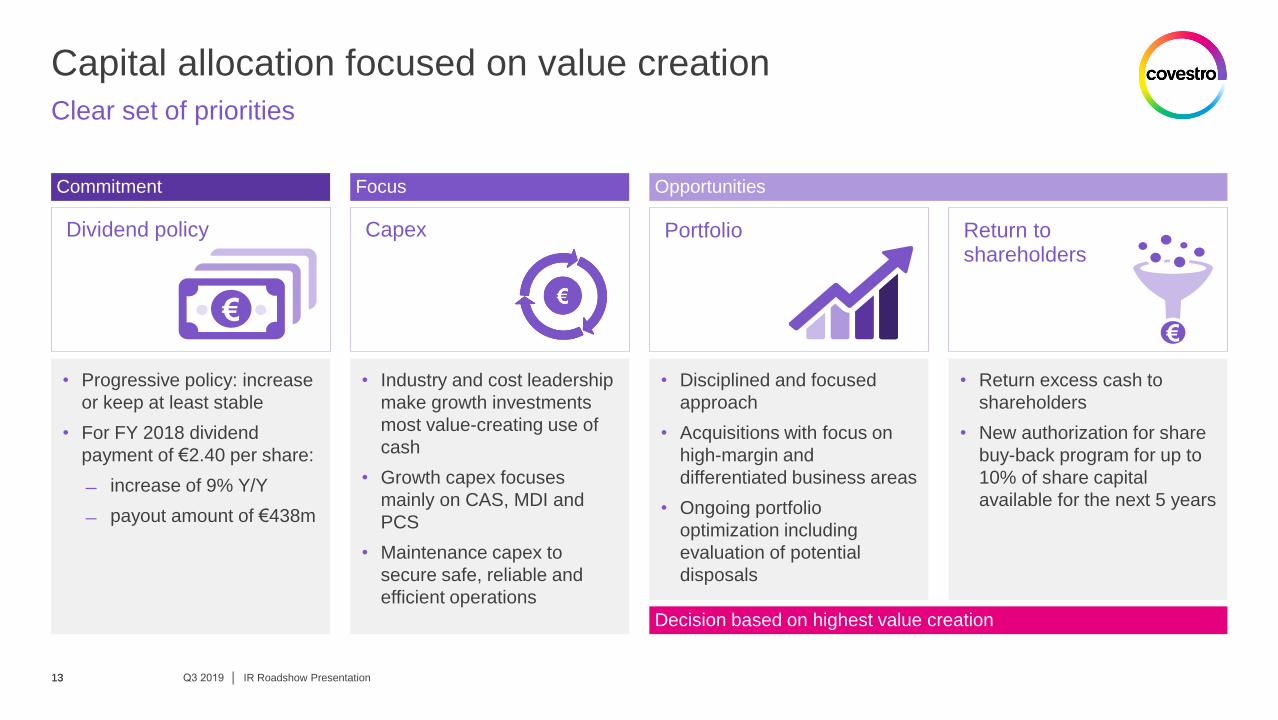
Dividend policy
€
• Progressive policy: increase
or keep at least stable
• For FY 2018 dividend
payment of €2.40 per share:
increase of 9% Y/Y
payout amount of €438m
• Return excess cash to
shareholders
• New authorization for share
buy-back program for up to
10% of share capital
available for the next 5 years
Return to shareholders
€
Portfolio
• Disciplined and focused
approach
• Acquisitions with focus on
high-margin and
differentiated business areas
• Ongoing portfolio
optimization including
evaluation of potential
disposals
Capex
• Industry and cost leadership
make growth investments
most value-creating use of
cash
• Growth capex focuses
mainly on CAS, MDI and
PCS
• Maintenance capex to
secure safe, reliable and
efficient operations
Capital allocation focused on value creation
IR Roadshow Presentation
Clear set of priorities
13
Commitment Focus Opportunities
Decision based on highest value creation
Q3 2019 │ 13
Dividend per share to increase or keep at least stable
Q3 2019 │ IR Roadshow Presentation 14
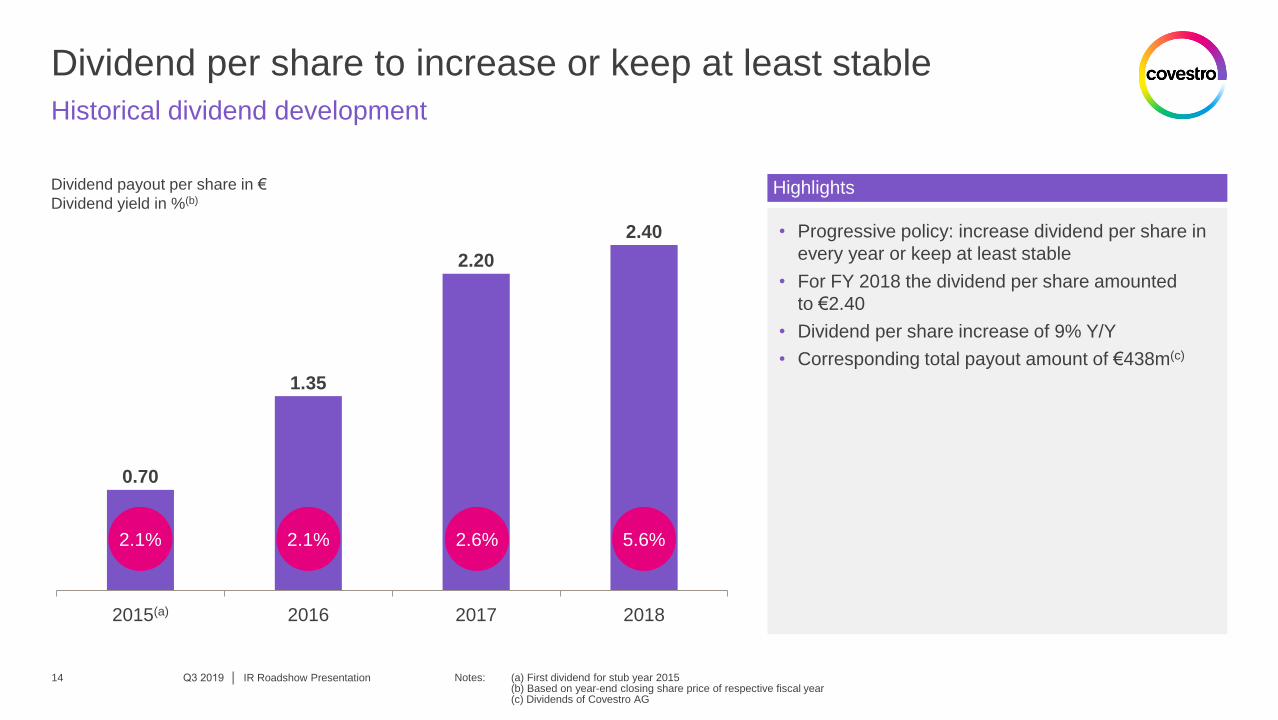
Historical dividend development
Notes: (a) First dividend for stub year 2015 (b) Based on year-end closing share price of respective fiscal year (c) Dividends of Covestro AG
0.70
1.35
2.20
2.40
2018 2016 2015(a) 2017
Dividend payout per share in €
Dividend yield in %(b) Highlights
• Progressive policy: increase dividend per share in
every year or keep at least stable
• For FY 2018 the dividend per share amounted
to €2.40
• Dividend per share increase of 9% Y/Y
• Corresponding total payout amount of €438m(c)
2.1% 2.1% 2.6% 5.6%
Q3 2019 │ IR Roadshow Presentation 15
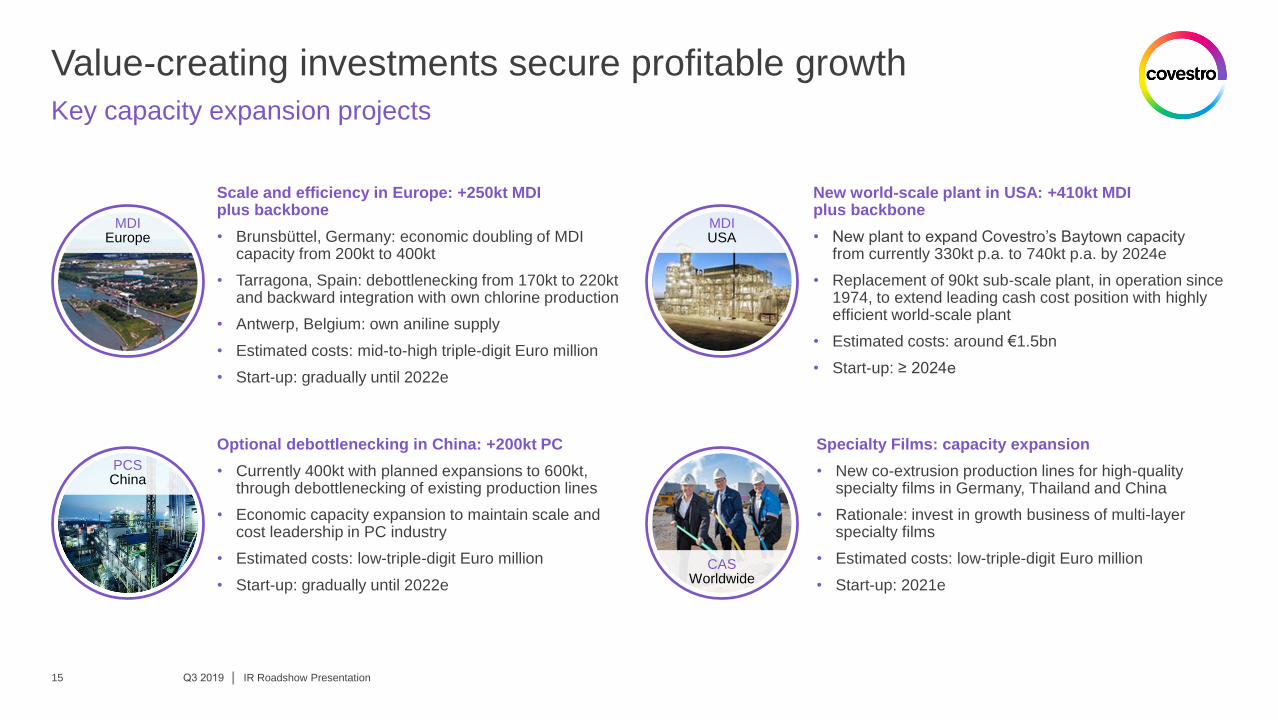
Scale and efficiency in Europe: +250kt MDI plus backbone
• Brunsbüttel, Germany: economic doubling of MDI capacity from 200kt to 400kt
• Tarragona, Spain: debottlenecking from 170kt to 220kt and backward integration with own chlorine production
• Antwerp, Belgium: own aniline supply
• Estimated costs: mid-to-high triple-digit Euro million
• Start-up: gradually until 2022e
Specialty Films: capacity expansion
• New co-extrusion production lines for high-quality specialty films in Germany, Thailand and China
• Rationale: invest in growth business of multi-layer specialty films
• Estimated costs: low-triple-digit Euro million
• Start-up: 2021e
Value-creating investments secure profitable growth
Key capacity expansion projects
New world-scale plant in USA: +410kt MDI plus backbone
• New plant to expand Covestro’s Baytown capacity from currently 330kt p.a. to 740kt p.a. by 2024e
• Replacement of 90kt sub-scale plant, in operation since 1974, to extend leading cash cost position with highly efficient world-scale plant
• Estimated costs: around €1.5bn
• Start-up: ≥ 2024e
Optional debottlenecking in China: +200kt PC
• Currently 400kt with planned expansions to 600kt, through debottlenecking of existing production lines
• Economic capacity expansion to maintain scale and cost leadership in PC industry
• Estimated costs: low-triple-digit Euro million
• Start-up: gradually until 2022e
PCS China
MDI Europe
CAS Worldwide
MDI USA
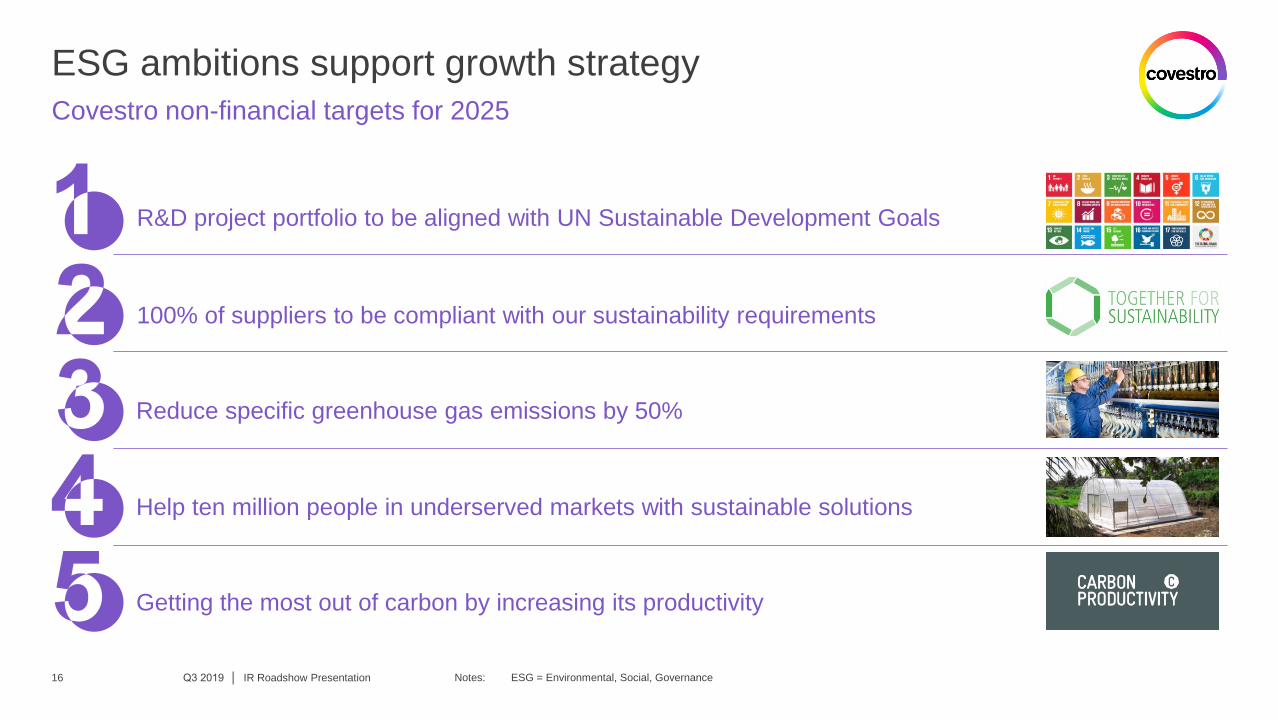
ESG ambitions support growth strategy
Covestro non-financial targets for 2025
Notes: ESG = Environmental, Social, Governance
R&D project portfolio to be aligned with UN Sustainable Development Goals
Reduce specific greenhouse gas emissions by 50%
100% of suppliers to be compliant with our sustainability requirements
Help ten million people in underserved markets with sustainable solutions
Getting the most out of carbon by increasing its productivity
IR Roadshow Presentation Q3 2019 │ 16
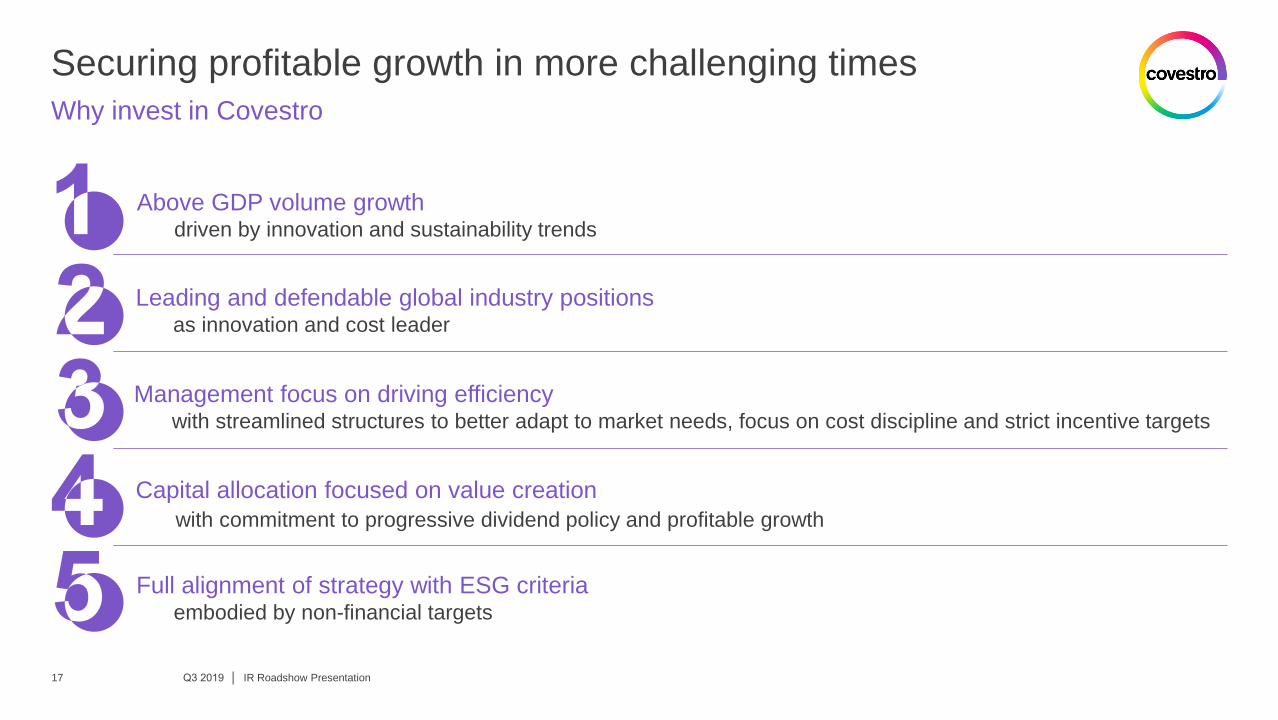
Securing profitable growth in more challenging times
Why invest in Covestro
Leading and defendable global industry positions as innovation and cost leader
Management focus on driving efficiency with streamlined structures to better adapt to market needs, focus on cost discipline and strict incentive targets
Capital allocation focused on value creation
with commitment to progressive dividend policy and profitable growth
Above GDP volume growth driven by innovation and sustainability trends
IR Roadshow Presentation Q3 2019 │ 17
Full alignment of strategy with ESG criteria embodied by non-financial targets
covestro.com 18
Covestro investment highlights
Group Financials Q3 2019
Segments overview
Background information
Q3 2019 │ IR Roadshow Presentation
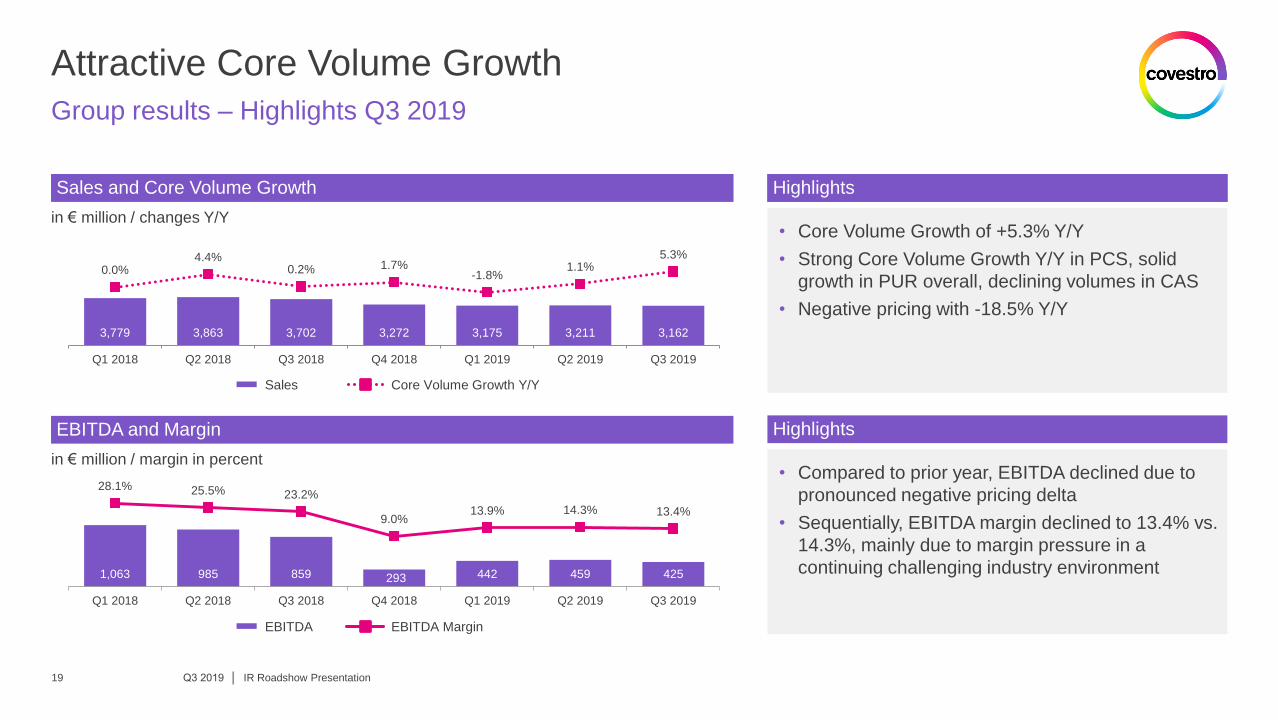
Attractive Core Volume Growth
Q3 2019 │ IR Roadshow Presentation
Group results – Highlights Q3 2019
1,063 985 859 293 442 459 425
28.1% 25.5% 23.2%
9.0% 13.9% 14.3% 13.4%
Q1 2018 Q2 2018 Q3 2018 Q4 2018 Q1 2019 Q2 2019 Q3 2019
3,779 3,863 3,702 3,272 3,175 3,211 3,162
0.0% 4.4%
0.2% 1.7% -1.8%
1.1% 5.3%
Q1 2018 Q2 2018 Q3 2018 Q4 2018 Q1 2019 Q2 2019 Q3 2019
in € million / changes Y/Y • Core Volume Growth of +5.3% Y/Y
• Strong Core Volume Growth Y/Y in PCS, solid
growth in PUR overall, declining volumes in CAS
• Negative pricing with -18.5% Y/Y
• Compared to prior year, EBITDA declined due to
pronounced negative pricing delta
• Sequentially, EBITDA margin declined to 13.4% vs.
14.3%, mainly due to margin pressure in a
continuing challenging industry environment
Sales and Core Volume Growth
in € million / margin in percent
EBITDA and Margin
Sales Core Volume Growth Y/Y
EBITDA EBITDA Margin
Highlights
Highlights
19
Q3 2019 │ IR Roadshow Presentation
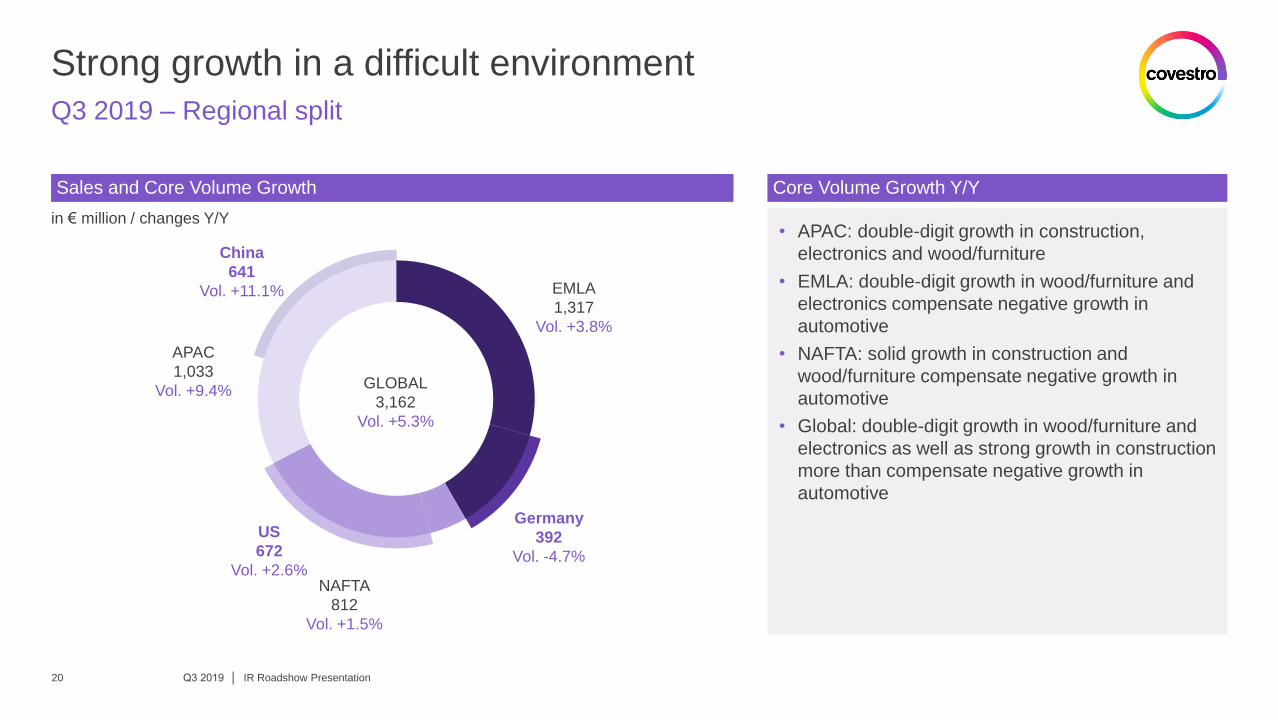
Q3 2019 – Regional split
China
641
Vol. +11.1%
US
672
Vol. +2.6%
Germany
392
Vol. -4.7%
NAFTA
812
Vol. +1.5%
EMLA
1,317
Vol. +3.8%
APAC
1,033
Vol. +9.4% GLOBAL
3,162
Vol. +5.3%
• APAC: double-digit growth in construction,
electronics and wood/furniture
• EMLA: double-digit growth in wood/furniture and
electronics compensate negative growth in
automotive
• NAFTA: solid growth in construction and
wood/furniture compensate negative growth in
automotive
• Global: double-digit growth in wood/furniture and
electronics as well as strong growth in construction
more than compensate negative growth in
automotive
Core Volume Growth Y/Y Sales and Core Volume Growth
in € million / changes Y/Y
Strong growth in a difficult environment
20
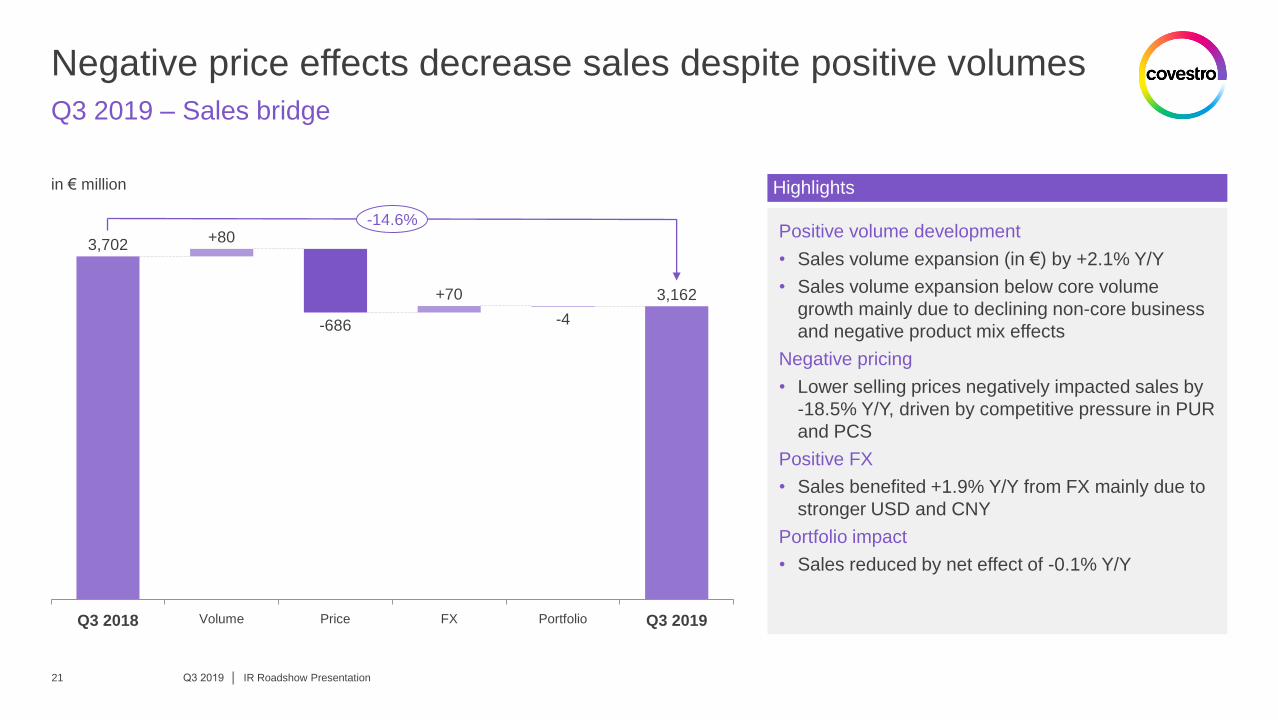
Negative price effects decrease sales despite positive volumes
Q3 2019 │ IR Roadshow Presentation
Q3 2019 – Sales bridge
+80
+70
Q3 2018 Q3 2019 Volume Price Portfolio FX
3,702
-686 -4
3,162
-14.6%
in € million
Positive volume development
• Sales volume expansion (in €) by +2.1% Y/Y
• Sales volume expansion below core volume
growth mainly due to declining non-core business
and negative product mix effects
Negative pricing
• Lower selling prices negatively impacted sales by
-18.5% Y/Y, driven by competitive pressure in PUR
and PCS
Positive FX
• Sales benefited +1.9% Y/Y from FX mainly due to
stronger USD and CNY
Portfolio impact
• Sales reduced by net effect of -0.1% Y/Y
Highlights
21
Pricing delta
-€537m
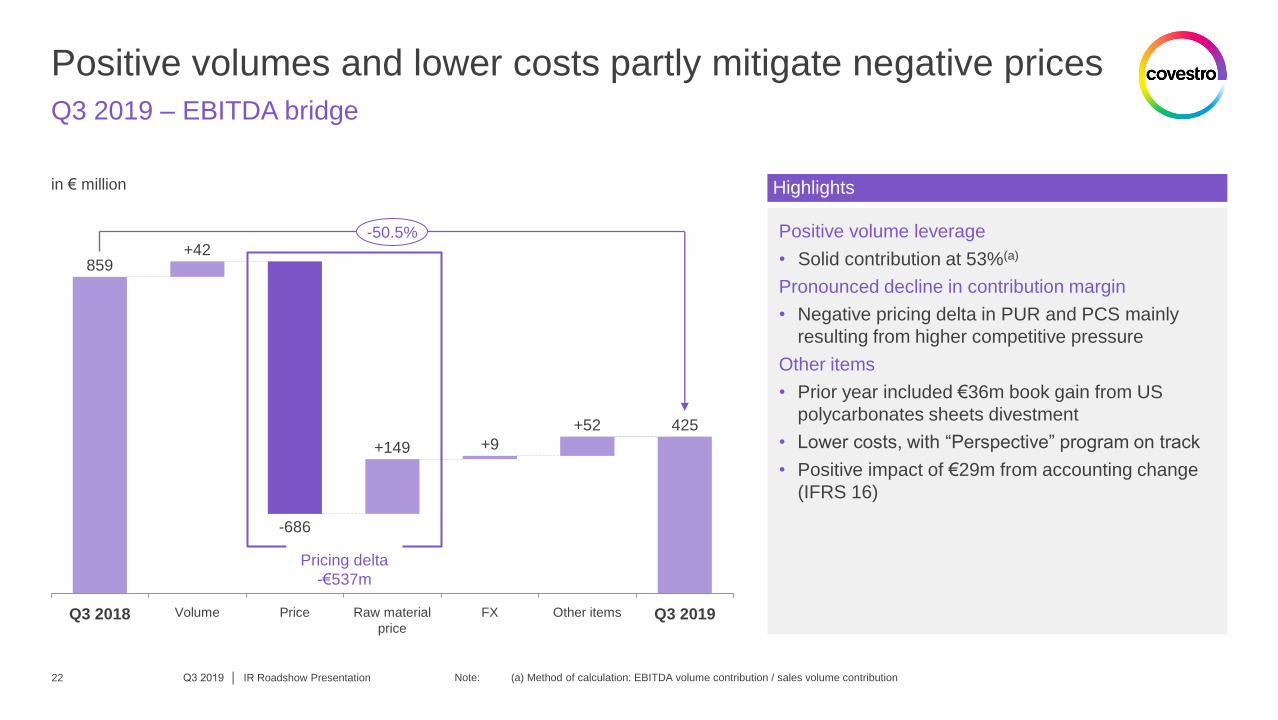
Positive volumes and lower costs partly mitigate negative prices
Q3 2019 │ IR Roadshow Presentation
Q3 2019 – EBITDA bridge
Q3 2019
+9 +149
Other items Q3 2018 Volume Price Raw material
price
FX
425
+42
-686
+52
859
-50.5%
in € million
Positive volume leverage
• Solid contribution at 53%(a)
Pronounced decline in contribution margin
• Negative pricing delta in PUR and PCS mainly
resulting from higher competitive pressure
Other items
• Prior year included €36m book gain from US
polycarbonates sheets divestment
• Lower costs, with “Perspective” program on track
• Positive impact of €29m from accounting change
(IFRS 16)
Highlights
22 Note: (a) Method of calculation: EBITDA volume contribution / sales volume contribution

Full year guidance narrowed
Q3 2019 │ IR Roadshow Presentation
FY 2019 guidance
Note: (a) Cash-relevant capex Basic assumptions FY 2019: Exchange rate of EUR/USD ~1.15, EUR/RMB ~7.8 and a global GDP growth of ~2.5% Y/Y
FY 2018 Previous guidance FY 2019 Guidance FY 2019
Core Volume Growth +1.6% Low- to mid-single-digit percentage
increase Y/Y
Low-single-digit percentage
increase Y/Y
FOCF €1,669m €300 – 700m €300 – 500m
ROCE 29.5% 8% – 13% 8% – 10%
Additional financial expectations FY 2018 Previous guidance FY 2019 Guidance FY 2019
EBITDA FY €3,200m €1,500 – 2,000m €1,570 – 1,650m
D&A €620m ~€750m ~€770m
Financial result €-104m €-100 to -120m €-80 to -100m
P&L (effective) tax rate 26.1% 24 - 26% 26 - 28%
Capex(a) €707m ≥€900m ~€900m
23
covestro.com 24
Covestro investment highlights
Group Financials Q3 2019
Segments overview
Background information
Q3 2019 │ IR Roadshow Presentation
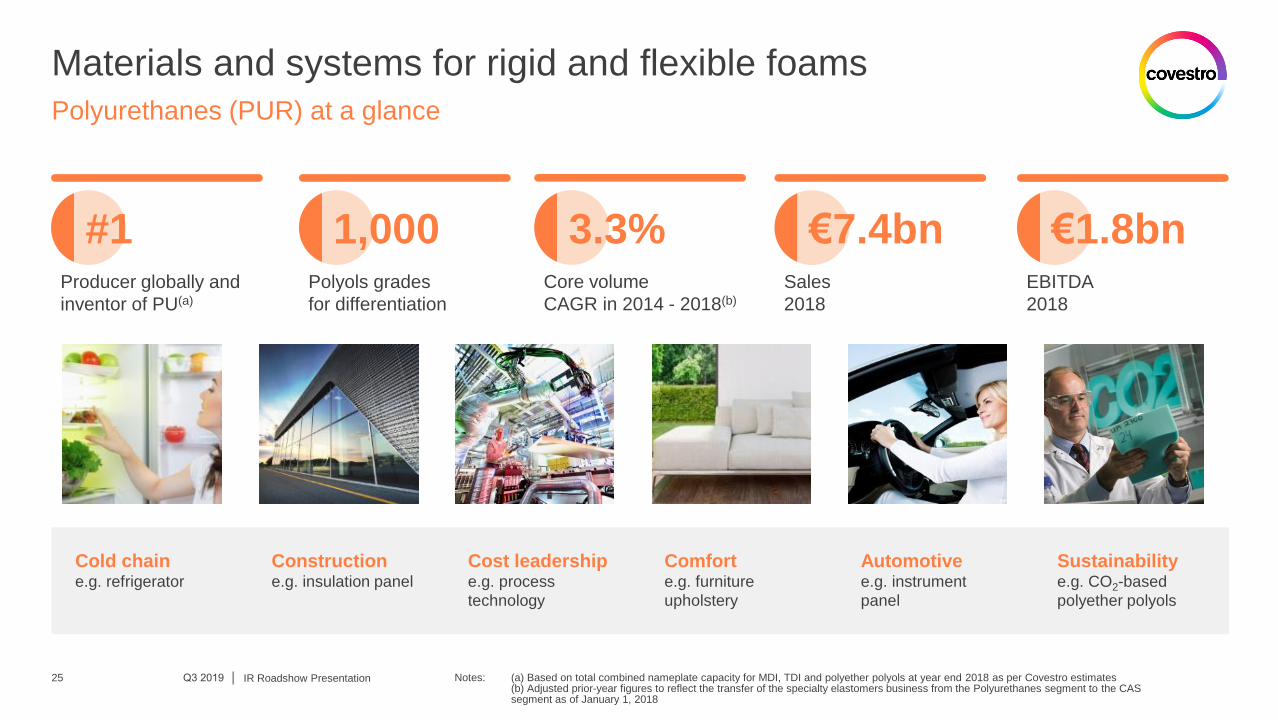
Materials and systems for rigid and flexible foams
Polyurethanes (PUR) at a glance
Notes: (a) Based on total combined nameplate capacity for MDI, TDI and polyether polyols at year end 2018 as per Covestro estimates (b) Adjusted prior-year figures to reflect the transfer of the specialty elastomers business from the Polyurethanes segment to the CAS segment as of January 1, 2018
1,000 Polyols grades
for differentiation
€7.4bn Sales
2018
IR Roadshow Presentation
Construction e.g. insulation panel
Cold chain e.g. refrigerator
Cost leadership e.g. process
technology
Comfort e.g. furniture
upholstery
Automotive e.g. instrument
panel
Sustainability e.g. CO2-based
polyether polyols
€1.8bn EBITDA
2018
3.3% Core volume
CAGR in 2014 - 2018(b)
#1 Producer globally and
inventor of PU(a)
Q3 2019 │ 25
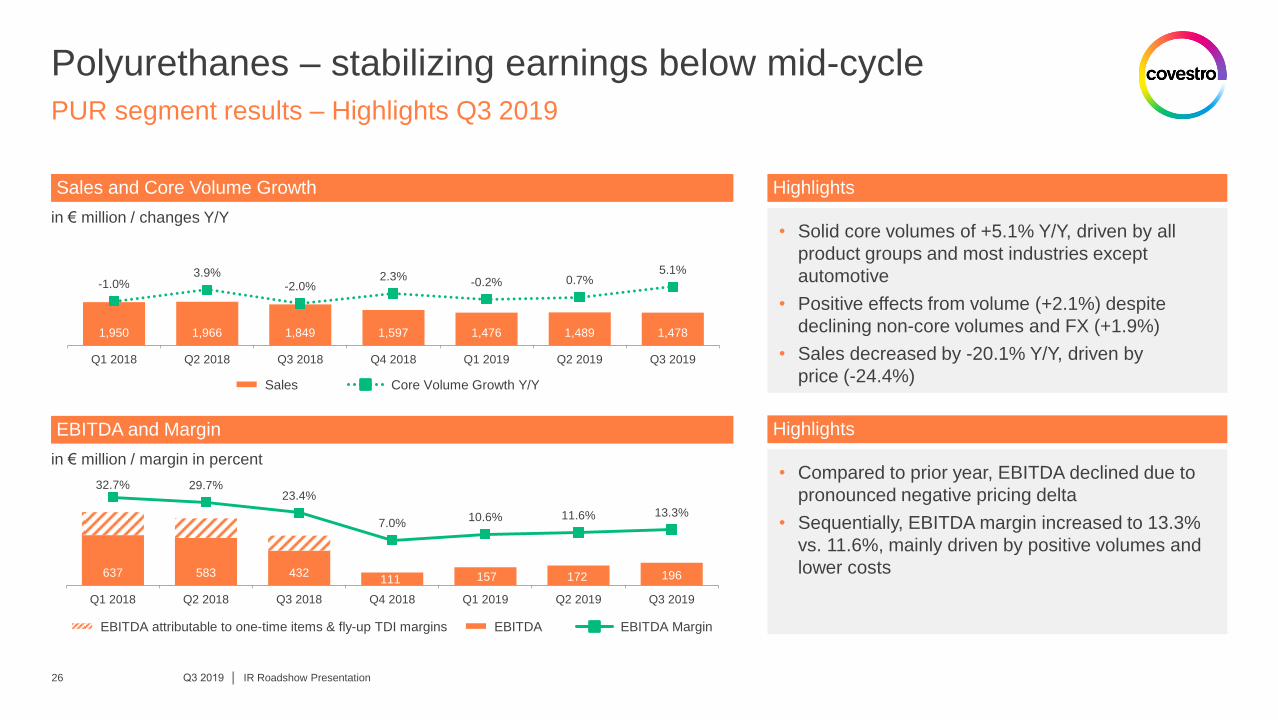
Polyurethanes – stabilizing earnings below mid-cycle
Q3 2019 │ IR Roadshow Presentation
PUR segment results – Highlights Q3 2019
1,950 1,966 1,849 1,597 1,476 1,489 1,478
-1.0% 3.9%
-2.0% 2.3%
-0.2% 0.7% 5.1%
Q1 2018 Q2 2018 Q3 2018 Q4 2018 Q1 2019 Q2 2019 Q3 2019
637 583 432 111 157 172 196
32.7% 29.7% 23.4%
7.0% 10.6% 11.6% 13.3%
Q1 2018 Q2 2018 Q3 2018 Q4 2018 Q1 2019 Q2 2019 Q3 2019
EBITDA attributable to one-time items & fly-up TDI margins
in € million / changes Y/Y • Solid core volumes of +5.1% Y/Y, driven by all
product groups and most industries except
automotive
• Positive effects from volume (+2.1%) despite
declining non-core volumes and FX (+1.9%)
• Sales decreased by -20.1% Y/Y, driven by
price (-24.4%)
• Compared to prior year, EBITDA declined due to
pronounced negative pricing delta
• Sequentially, EBITDA margin increased to 13.3%
vs. 11.6%, mainly driven by positive volumes and
lower costs
Sales and Core Volume Growth
in € million / margin in percent
EBITDA and Margin
Highlights
Highlights
Sales Core Volume Growth Y/Y
EBITDA EBITDA Margin
26
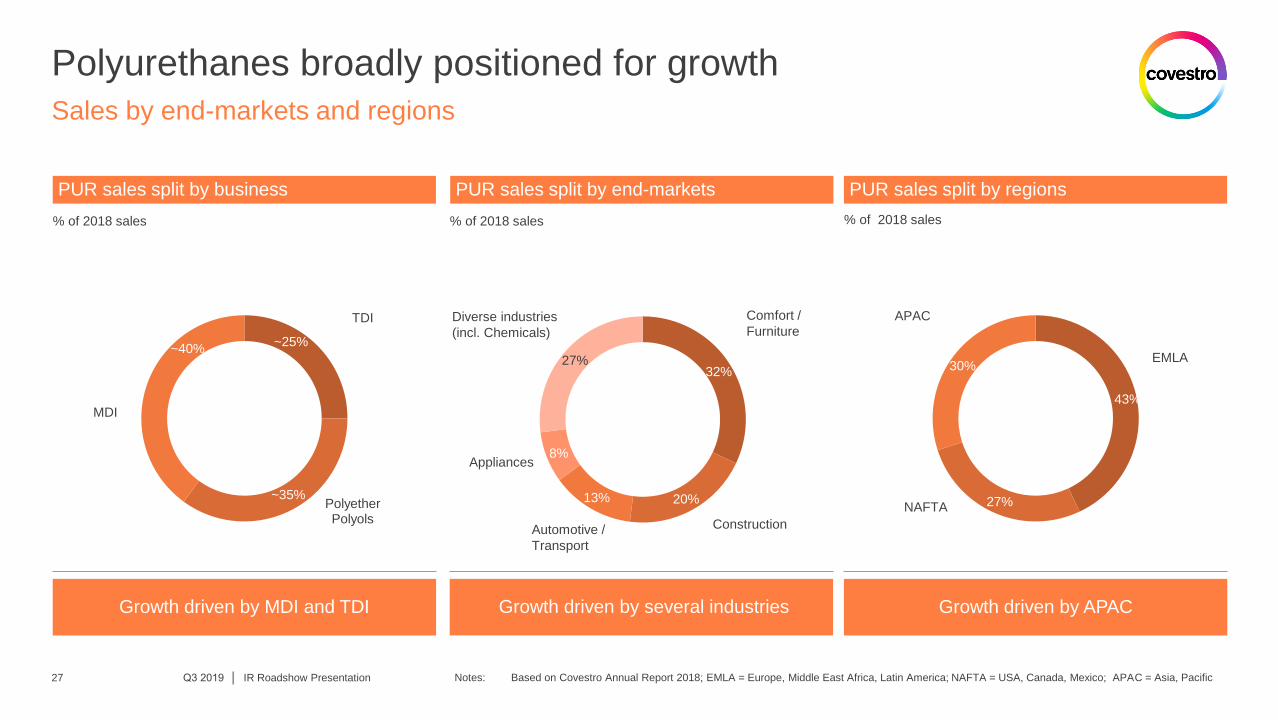
Polyurethanes broadly positioned for growth
Q3 2019 │ IR Roadshow Presentation 27
Sales by end-markets and regions
Notes: Based on Covestro Annual Report 2018; EMLA = Europe, Middle East Africa, Latin America; NAFTA = USA, Canada, Mexico; APAC = Asia, Pacific
PUR sales split by end-markets PUR sales split by regions
Growth driven by APAC Growth driven by several industries
32%
20% 13%
8%
27%
43%
27%
30%
Comfort /
Furniture
Construction Automotive /
Transport
Appliances
EMLA
NAFTA
APAC
% of 2018 sales % of 2018 sales
Diverse industries
(incl. Chemicals)
Growth driven by MDI and TDI
TDI
Polyether Polyols
MDI
PUR sales split by business
~40% ~25%
~35%
% of 2018 sales
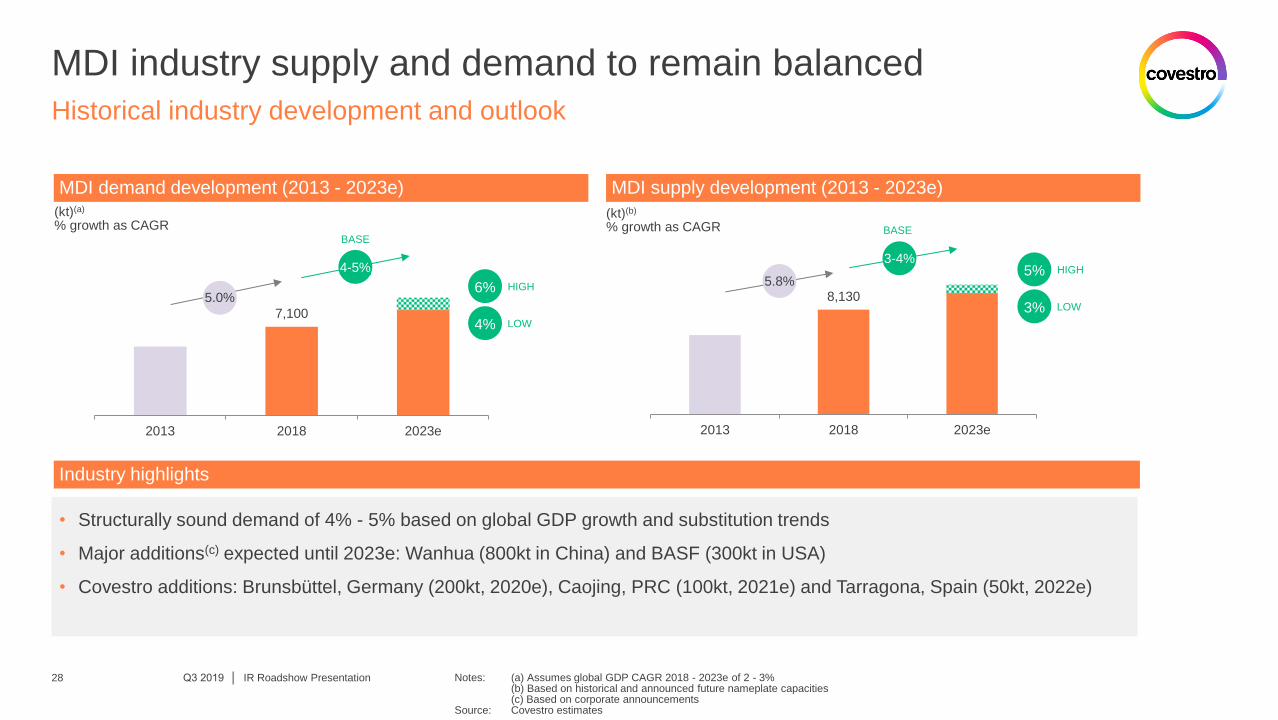
MDI industry supply and demand to remain balanced
Q3 2019 │ IR Roadshow Presentation 28
Historical industry development and outlook
Notes: (a) Assumes global GDP CAGR 2018 - 2023e of 2 - 3% (b) Based on historical and announced future nameplate capacities (c) Based on corporate announcements Source: Covestro estimates
8,130
2013 2018 2023e
• Structurally sound demand of 4% - 5% based on global GDP growth and substitution trends
• Major additions(c) expected until 2023e: Wanhua (800kt in China) and BASF (300kt in USA)
• Covestro additions: Brunsbüttel, Germany (200kt, 2020e), Caojing, PRC (100kt, 2021e) and Tarragona, Spain (50kt, 2022e)
7,100
2013 2018 2023e
MDI demand development (2013 - 2023e) MDI supply development (2013 - 2023e)
Industry highlights
(kt)(a)
% growth as CAGR (kt)(b)
% growth as CAGR BASE
5.0%
4-5% 5.8%
3-4%
BASE
HIGH 5%
3% LOW
6% HIGH
4% LOW
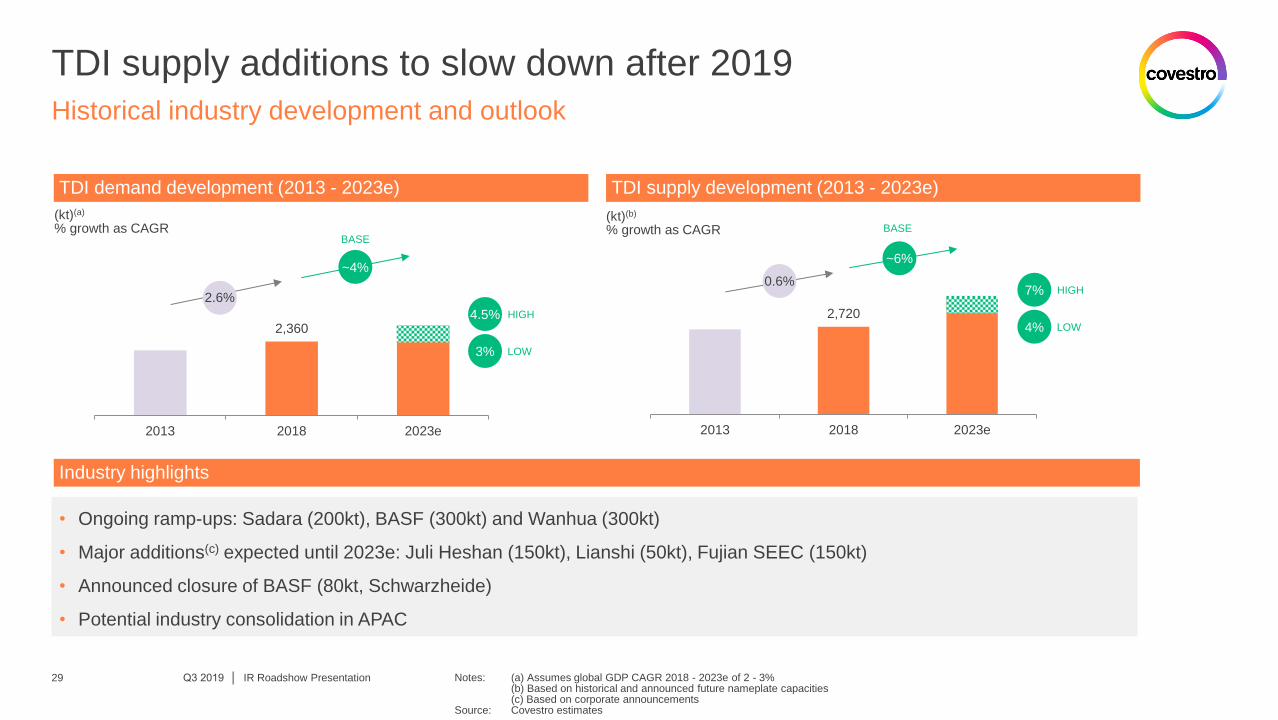
TDI supply additions to slow down after 2019
Q3 2019 │ IR Roadshow Presentation 29
Historical industry development and outlook
Notes: (a) Assumes global GDP CAGR 2018 - 2023e of 2 - 3% (b) Based on historical and announced future nameplate capacities (c) Based on corporate announcements Source: Covestro estimates
2,720
2013 2018 2023e
• Ongoing ramp-ups: Sadara (200kt), BASF (300kt) and Wanhua (300kt)
• Major additions(c) expected until 2023e: Juli Heshan (150kt), Lianshi (50kt), Fujian SEEC (150kt)
• Announced closure of BASF (80kt, Schwarzheide)
• Potential industry consolidation in APAC
(kt)(a)
% growth as CAGR (kt)(b)
% growth as CAGR
TDI demand development (2013 - 2023e) TDI supply development (2013 - 2023e)
2,360
2013 2018 2023e
BASE
2.6%
~4% 0.6%
~6%
BASE
4.5% HIGH
3% LOW
HIGH 7%
4% LOW
Industry highlights
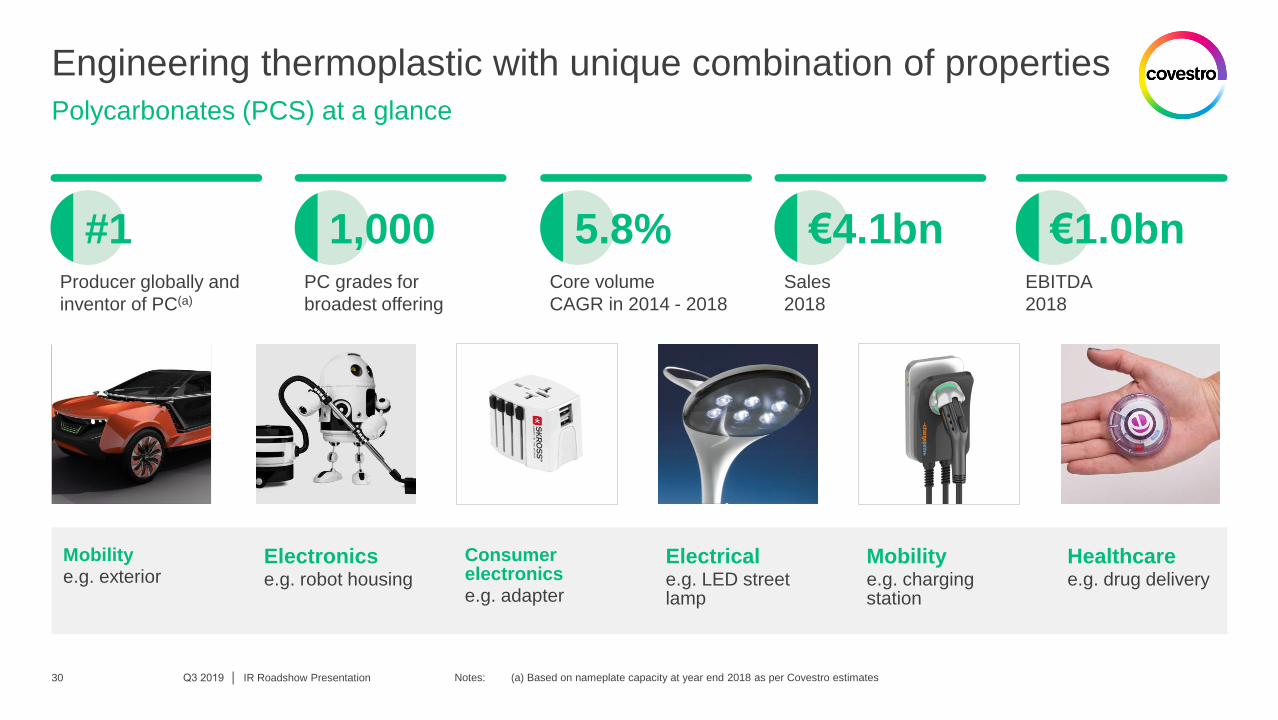
Engineering thermoplastic with unique combination of properties
Polycarbonates (PCS) at a glance
Notes: (a) Based on nameplate capacity at year end 2018 as per Covestro estimates
€4.1bn Sales
2018
€1.0bn EBITDA
2018
5.8% Core volume
CAGR in 2014 - 2018
#1 Producer globally and
inventor of PC(a)
IR Roadshow Presentation
Electronics e.g. robot housing
Mobility e.g. exterior
Consumer electronics e.g. adapter
Mobility e.g. charging station
Healthcare e.g. drug delivery
Electrical e.g. LED street lamp
1,000 PC grades for
broadest offering
Q3 2019 │ 30
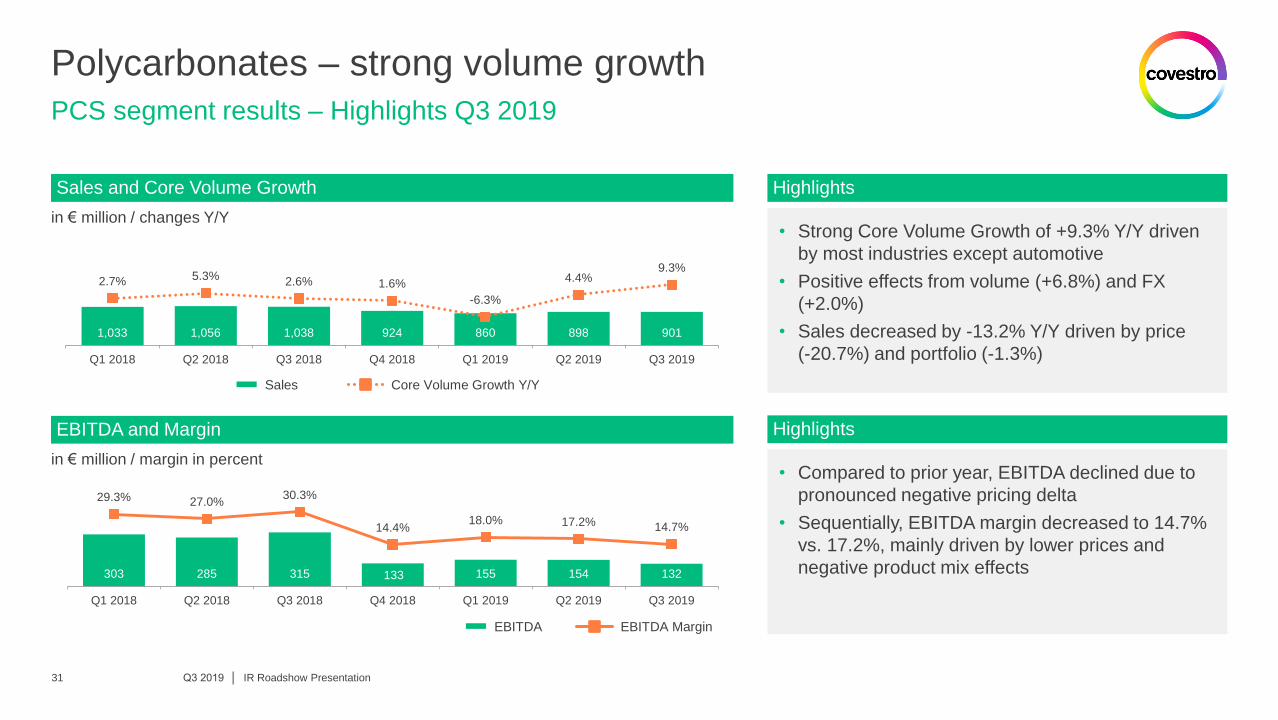
303 285 315 133 155 154 132
29.3% 27.0% 30.3%
14.4% 18.0% 17.2% 14.7%
Q1 2018 Q2 2018 Q3 2018 Q4 2018 Q1 2019 Q2 2019 Q3 2019
Polycarbonates – strong volume growth
Q3 2019 │ IR Roadshow Presentation
PCS segment results – Highlights Q3 2019
in € million / changes Y/Y • Strong Core Volume Growth of +9.3% Y/Y driven
by most industries except automotive
• Positive effects from volume (+6.8%) and FX
(+2.0%)
• Sales decreased by -13.2% Y/Y driven by price
(-20.7%) and portfolio (-1.3%)
• Compared to prior year, EBITDA declined due to
pronounced negative pricing delta
• Sequentially, EBITDA margin decreased to 14.7%
vs. 17.2%, mainly driven by lower prices and
negative product mix effects
Sales and Core Volume Growth
in € million / margin in percent
EBITDA and Margin
Highlights
Highlights
Sales Core Volume Growth Y/Y
EBITDA EBITDA Margin
1,033 1,056 1,038 924 860 898 901
2.7% 5.3% 2.6% 1.6%
-6.3%
4.4% 9.3%
Q1 2018 Q2 2018 Q3 2018 Q4 2018 Q1 2019 Q2 2019 Q3 2019
31
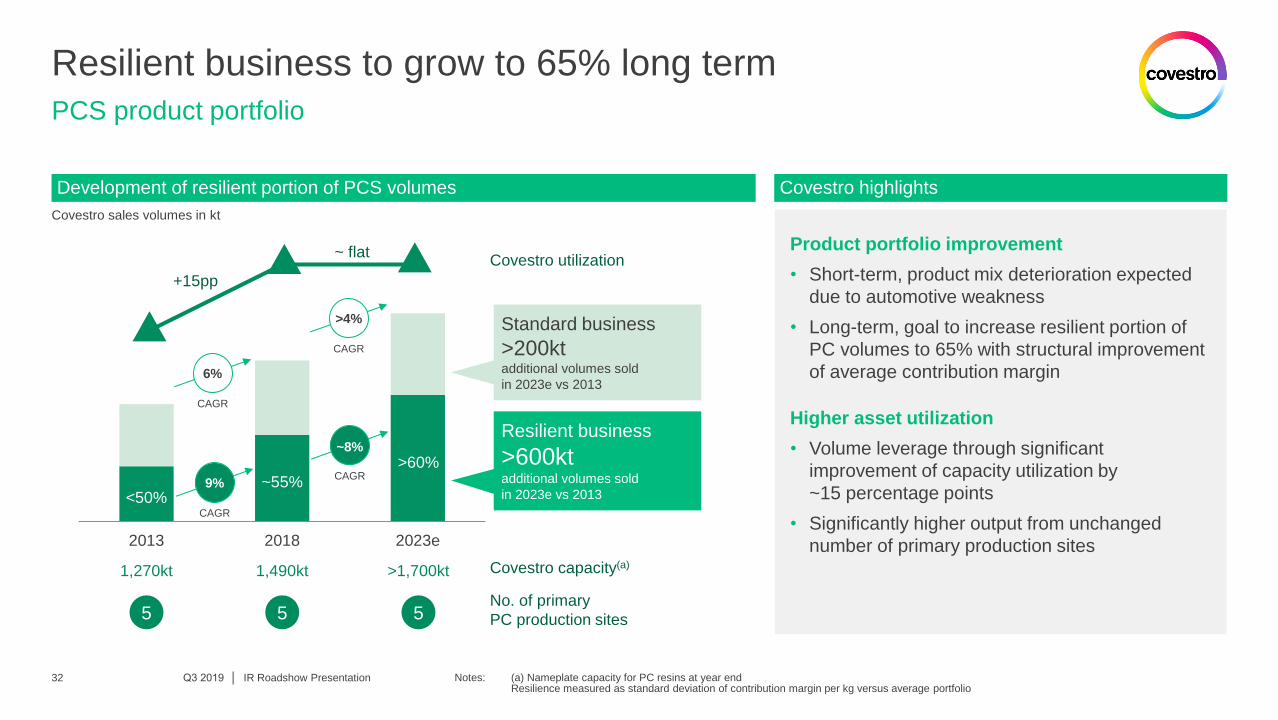
Resilient business to grow to 65% long term
IR Roadshow Presentation
PCS product portfolio
Notes: (a) Nameplate capacity for PC resins at year end Resilience measured as standard deviation of contribution margin per kg versus average portfolio
2013 2018 2023e
<50% ~55%
>60%
6%
CAGR
>4%
CAGR
Resilient business
>600kt additional volumes sold
in 2023e vs 2013
Standard business
>200kt additional volumes sold
in 2023e vs 2013
1,270kt 1,490kt >1,700kt
5 5 5 No. of primary
PC production sites
9%
CAGR
~8%
CAGR
Covestro utilization
+15pp
~ flat
Covestro capacity(a)
Covestro highlights Development of resilient portion of PCS volumes
Covestro sales volumes in kt
Product portfolio improvement
• Short-term, product mix deterioration expected
due to automotive weakness
• Long-term, goal to increase resilient portion of
PC volumes to 65% with structural improvement
of average contribution margin
Higher asset utilization
• Volume leverage through significant
improvement of capacity utilization by
~15 percentage points
• Significantly higher output from unchanged
number of primary production sites
Q3 2019 │ 32
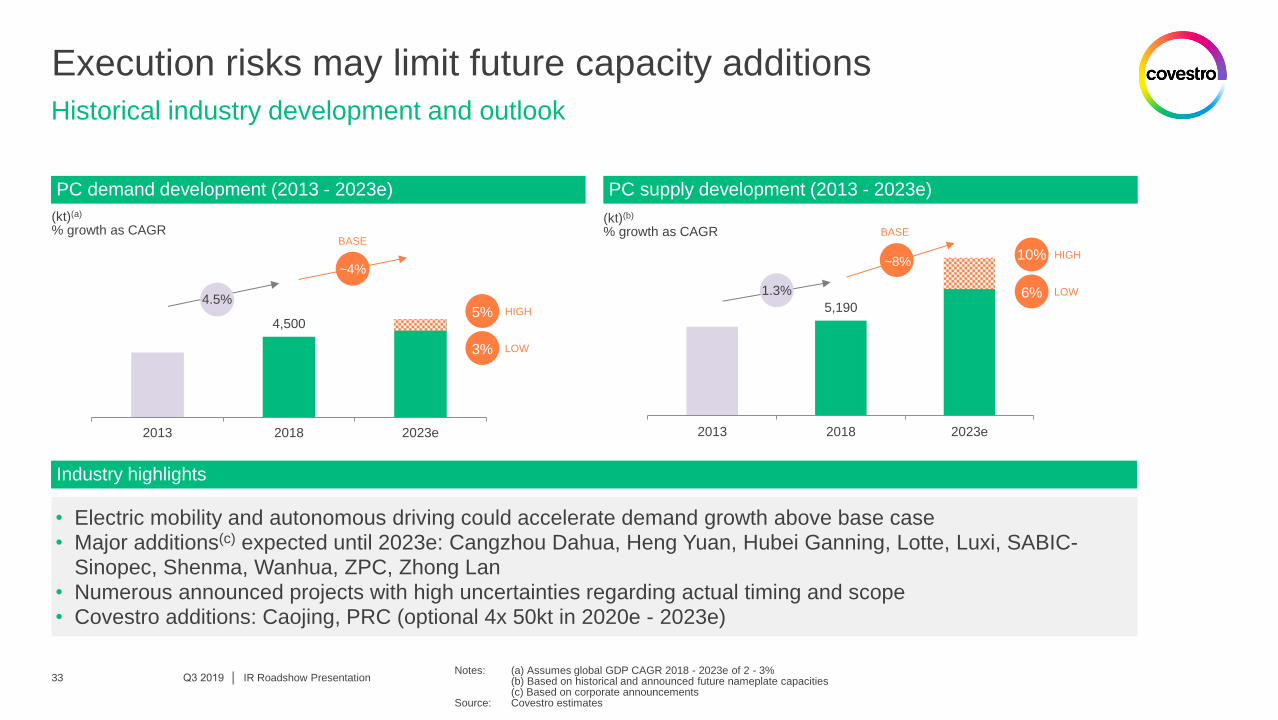
5,190
2013 2018 2023e
Execution risks may limit future capacity additions
Q3 2019 │ 33
• Electric mobility and autonomous driving could accelerate demand growth above base case • Major additions(c) expected until 2023e: Cangzhou Dahua, Heng Yuan, Hubei Ganning, Lotte, Luxi, SABIC-
Sinopec, Shenma, Wanhua, ZPC, Zhong Lan
• Numerous announced projects with high uncertainties regarding actual timing and scope • Covestro additions: Caojing, PRC (optional 4x 50kt in 2020e - 2023e)
4,500
2013 2018 2023e
(kt)(a)
% growth as CAGR (kt)(b)
% growth as CAGR
PC demand development (2013 - 2023e) PC supply development (2013 - 2023e)
Industry highlights
5%
BASE
4.5%
~4%
1.3%
~8%
HIGH
3% LOW
BASE
HIGH 10%
6% LOW
Historical industry development and outlook
Notes: (a) Assumes global GDP CAGR 2018 - 2023e of 2 - 3% (b) Based on historical and announced future nameplate capacities (c) Based on corporate announcements Source: Covestro estimates
IR Roadshow Presentation
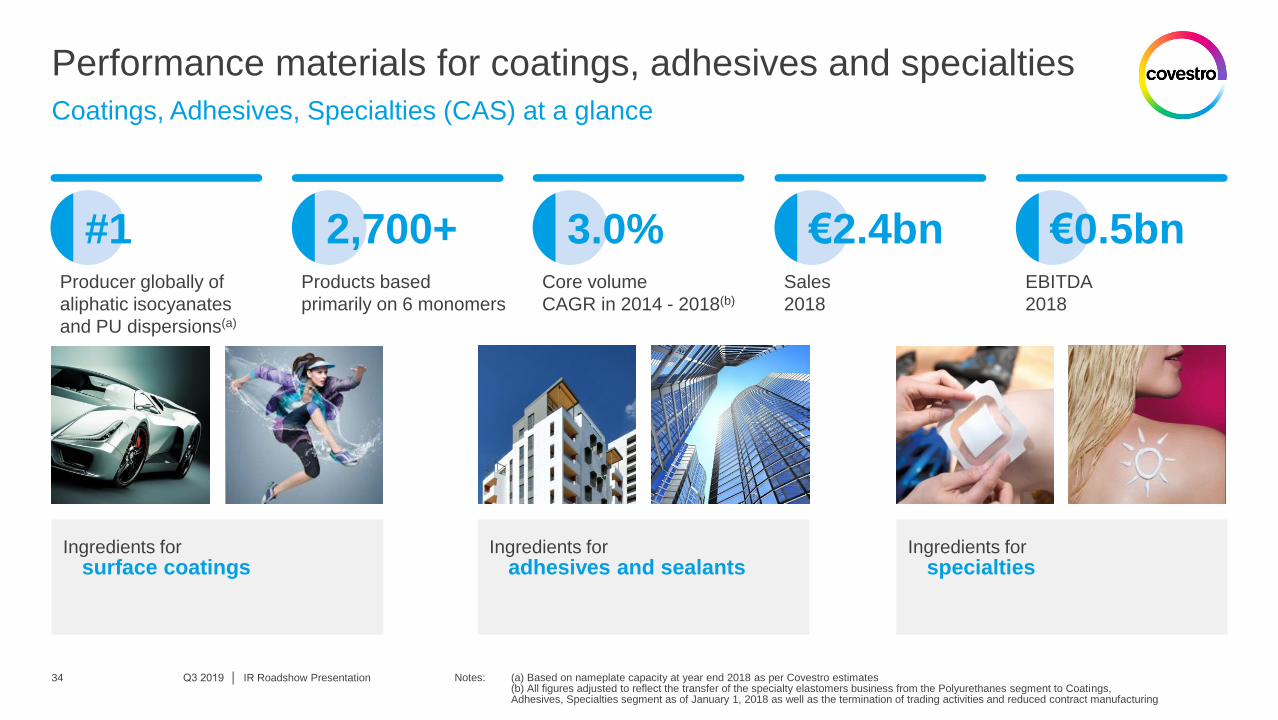
Performance materials for coatings, adhesives and specialties
IR Roadshow Presentation
Coatings, Adhesives, Specialties (CAS) at a glance
Notes: (a) Based on nameplate capacity at year end 2018 as per Covestro estimates (b) All figures adjusted to reflect the transfer of the specialty elastomers business from the Polyurethanes segment to Coatings, Adhesives, Specialties segment as of January 1, 2018 as well as the termination of trading activities and reduced contract manufacturing
€0.5bn EBITDA
2018
€2.4bn Sales
2018
#1 Producer globally of
aliphatic isocyanates
and PU dispersions(a)
2,700+ Products based
primarily on 6 monomers
Ingredients for surface coatings
Ingredients for specialties
Ingredients for adhesives and sealants
3.0% Core volume
CAGR in 2014 - 2018(b)
Q3 2019 │ 34
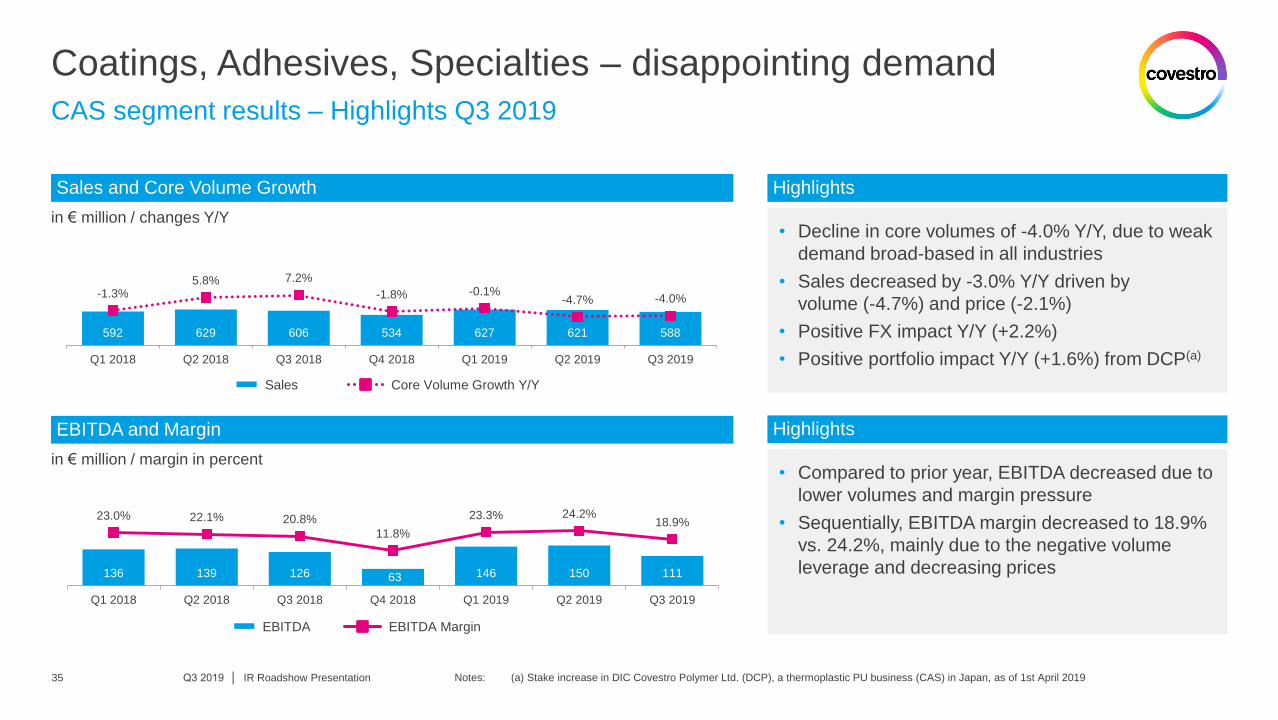
in € million / changes Y/Y • Decline in core volumes of -4.0% Y/Y, due to weak
demand broad-based in all industries
• Sales decreased by -3.0% Y/Y driven by
volume (-4.7%) and price (-2.1%)
• Positive FX impact Y/Y (+2.2%)
• Positive portfolio impact Y/Y (+1.6%) from DCP(a)
• Compared to prior year, EBITDA decreased due to
lower volumes and margin pressure
• Sequentially, EBITDA margin decreased to 18.9%
vs. 24.2%, mainly due to the negative volume
leverage and decreasing prices
Sales and Core Volume Growth
in € million / margin in percent
EBITDA and Margin
Highlights
Highlights
Sales Core Volume Growth Y/Y
EBITDA EBITDA Margin
Coatings, Adhesives, Specialties – disappointing demand
Q3 2019 │ IR Roadshow Presentation
CAS segment results – Highlights Q3 2019
592 629 606 534 627 621 588
-1.3% 5.8% 7.2%
-1.8% -0.1% -4.7% -4.0%
-0.2
-0.15
-0.1
-0.05
0
0.05
0.1
0.15
0.2
Q1 2018 Q2 2018 Q3 2018 Q4 2018 Q1 2019 Q2 2019 Q3 2019
136 139 126 63 146 150 111
23.0% 22.1% 20.8%
11.8%
23.3% 24.2% 18.9%
Q1 2018 Q2 2018 Q3 2018 Q4 2018 Q1 2019 Q2 2019 Q3 2019
35 Notes: (a) Stake increase in DIC Covestro Polymer Ltd. (DCP), a thermoplastic PU business (CAS) in Japan, as of 1st April 2019
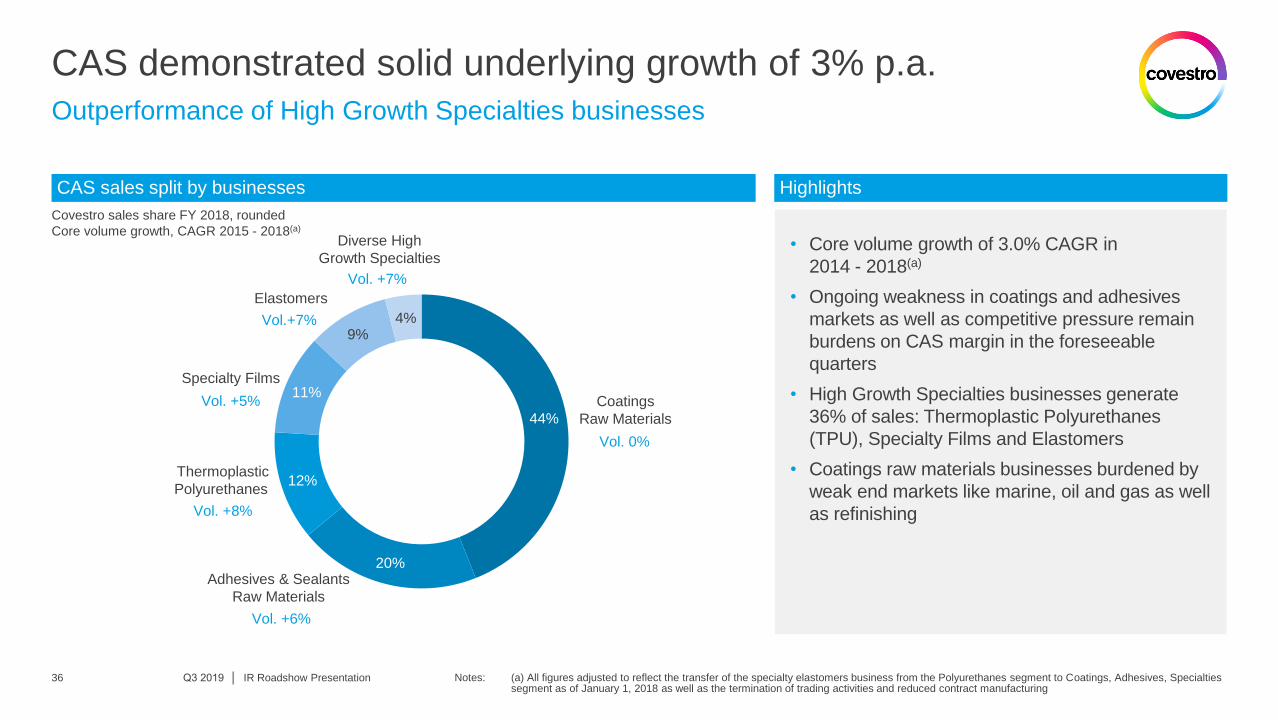
CAS demonstrated solid underlying growth of 3% p.a.
IR Roadshow Presentation
Outperformance of High Growth Specialties businesses
Notes: (a) All figures adjusted to reflect the transfer of the specialty elastomers business from the Polyurethanes segment to Coatings, Adhesives, Specialties segment as of January 1, 2018 as well as the termination of trading activities and reduced contract manufacturing
• Core volume growth of 3.0% CAGR in
2014 - 2018(a)
• Ongoing weakness in coatings and adhesives
markets as well as competitive pressure remain
burdens on CAS margin in the foreseeable
quarters
• High Growth Specialties businesses generate
36% of sales: Thermoplastic Polyurethanes
(TPU), Specialty Films and Elastomers
• Coatings raw materials businesses burdened by
weak end markets like marine, oil and gas as well
as refinishing
Highlights
Q3 2019 │
44%
20%
12%
11%
9% 4%
Vol. 0%
Vol. +6%
Vol. +8%
Vol.+7%
Vol. +5%
Vol. +7%
Coatings
Raw Materials
Adhesives & Sealants
Raw Materials
Thermoplastic
Polyurethanes
Elastomers
Specialty Films
Diverse High
Growth Specialties
CAS sales split by businesses
Covestro sales share FY 2018, rounded
Core volume growth, CAGR 2015 - 2018(a)
36
covestro.com 37
Covestro investment highlights
Group Financials Q3 2019
Segments overview
Background information
Q3 2019 │ IR Roadshow Presentation
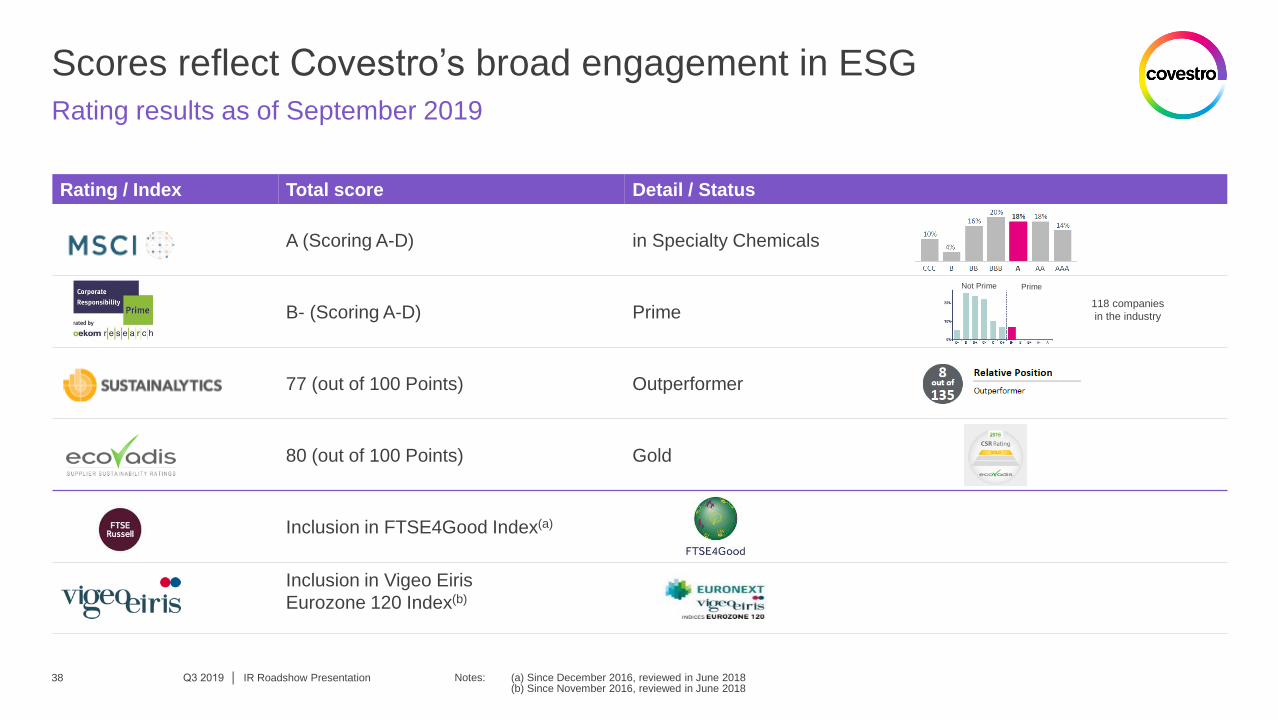
Scores reflect Covestro’s broad engagement in ESG
Rating results as of September 2019
Notes: (a) Since December 2016, reviewed in June 2018 (b) Since November 2016, reviewed in June 2018
IR Roadshow Presentation Q3 2019 │ 38
Rating / Index Total score Detail / Status
A (Scoring A-D) in Specialty Chemicals
B- (Scoring A-D) Prime
77 (out of 100 Points) Outperformer
80 (out of 100 Points) Gold
Inclusion in FTSE4Good Index(a)
Inclusion in Vigeo Eiris
Eurozone 120 Index(b)
118 companies
in the industry
Not Prime Prime
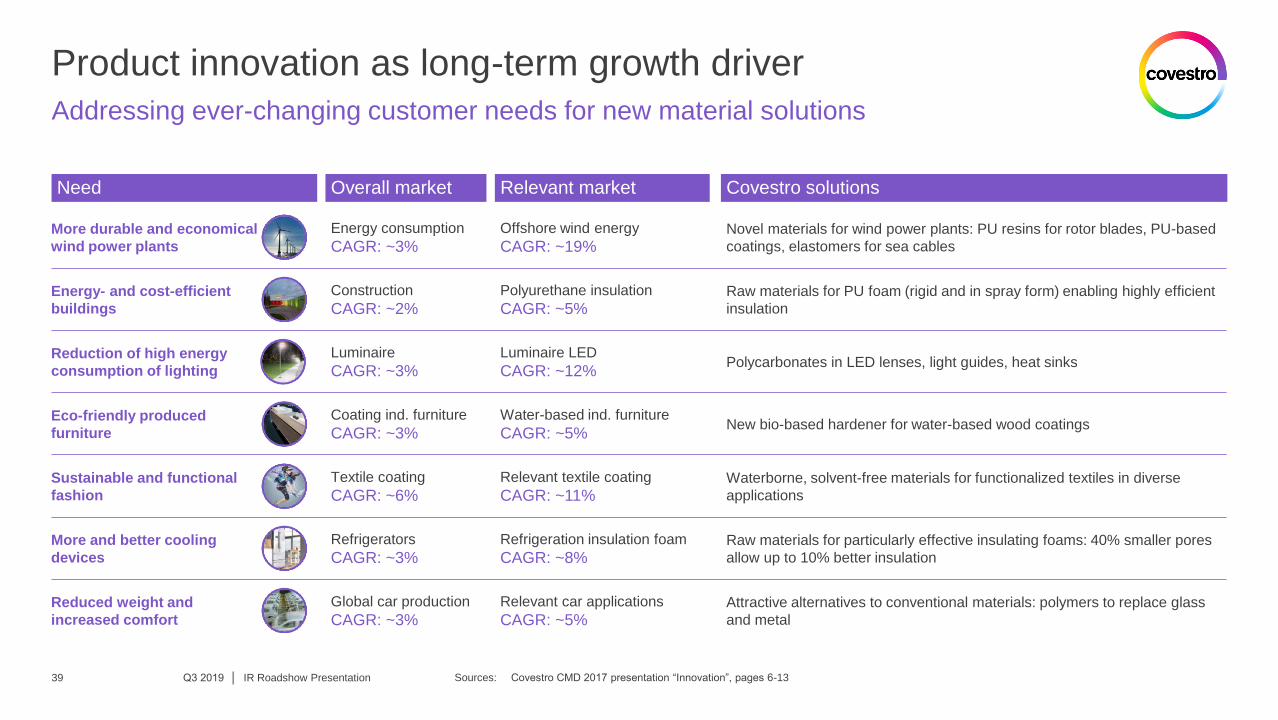
Product innovation as long-term growth driver
Addressing ever-changing customer needs for new material solutions
Sources: Covestro CMD 2017 presentation “Innovation”, pages 6-13
IR Roadshow Presentation
More durable and economical
wind power plants
Energy- and cost-efficient
buildings
Reduction of high energy
consumption of lighting
Eco-friendly produced
furniture
Sustainable and functional
fashion
More and better cooling
devices
Reduced weight and
increased comfort
Energy consumption
CAGR: ~3%
Offshore wind energy
CAGR: ~19% Novel materials for wind power plants: PU resins for rotor blades, PU-based
coatings, elastomers for sea cables
Construction
CAGR: ~2%
Polyurethane insulation
CAGR: ~5% Raw materials for PU foam (rigid and in spray form) enabling highly efficient
insulation
Luminaire
CAGR: ~3%
Luminaire LED
CAGR: ~12% Polycarbonates in LED lenses, light guides, heat sinks
Coating ind. furniture
CAGR: ~3%
Water-based ind. furniture
CAGR: ~5% New bio-based hardener for water-based wood coatings
Textile coating
CAGR: ~6%
Relevant textile coating
CAGR: ~11% Waterborne, solvent-free materials for functionalized textiles in diverse
applications
Refrigerators
CAGR: ~3%
Refrigeration insulation foam
CAGR: ~8% Raw materials for particularly effective insulating foams: 40% smaller pores
allow up to 10% better insulation
Global car production
CAGR: ~3%
Relevant car applications
CAGR: ~5% Attractive alternatives to conventional materials: polymers to replace glass
and metal
Covestro solutions Need Overall market Relevant market
Q3 2019 │ 39
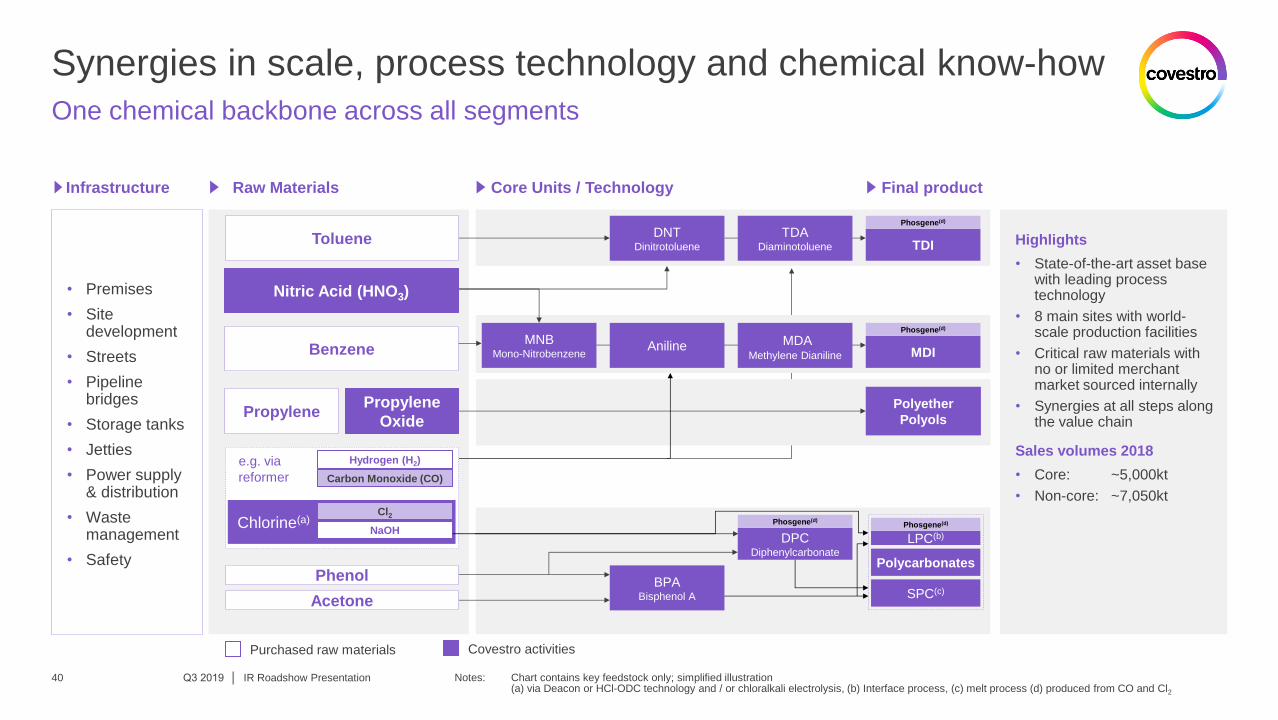
Synergies in scale, process technology and chemical know-how
One chemical backbone across all segments
Notes: Chart contains key feedstock only; simplified illustration (a) via Deacon or HCl-ODC technology and / or chloralkali electrolysis, (b) Interface process, (c) melt process (d) produced from CO and Cl2
IR Roadshow Presentation
Covestro activities Purchased raw materials
Infrastructure Raw Materials Core Units / Technology
• Premises
• Site development
• Streets
• Pipeline bridges
• Storage tanks
• Jetties
• Power supply & distribution
• Waste management
• Safety
e.g. via
reformer
Toluene
Benzene
Phenol
Acetone
Chlorine(a) Cl2
NaOH
MNB Mono-Nitrobenzene MDI
DNT Dinitrotoluene TDI
DPC Diphenylcarbonate
LPC(b)
Polycarbonates
SPC(c)
Phosgene(d)
Phosgene(d)
Phosgene(d) Phosgene(d)
TDA Diaminotoluene
Aniline MDA Methylene Dianiline
BPA Bisphenol A
Hydrogen (H2)
Carbon Monoxide (CO)
Propylene Propylene
Oxide Polyether
Polyols
Nitric Acid (HNO3)
Highlights
• State-of-the-art asset base with leading process technology
• 8 main sites with world-scale production facilities
• Critical raw materials with no or limited merchant market sourced internally
• Synergies at all steps along the value chain
Sales volumes 2018
• Core: ~5,000kt
• Non-core: ~7,050kt
Final product
Q3 2019 │ 40
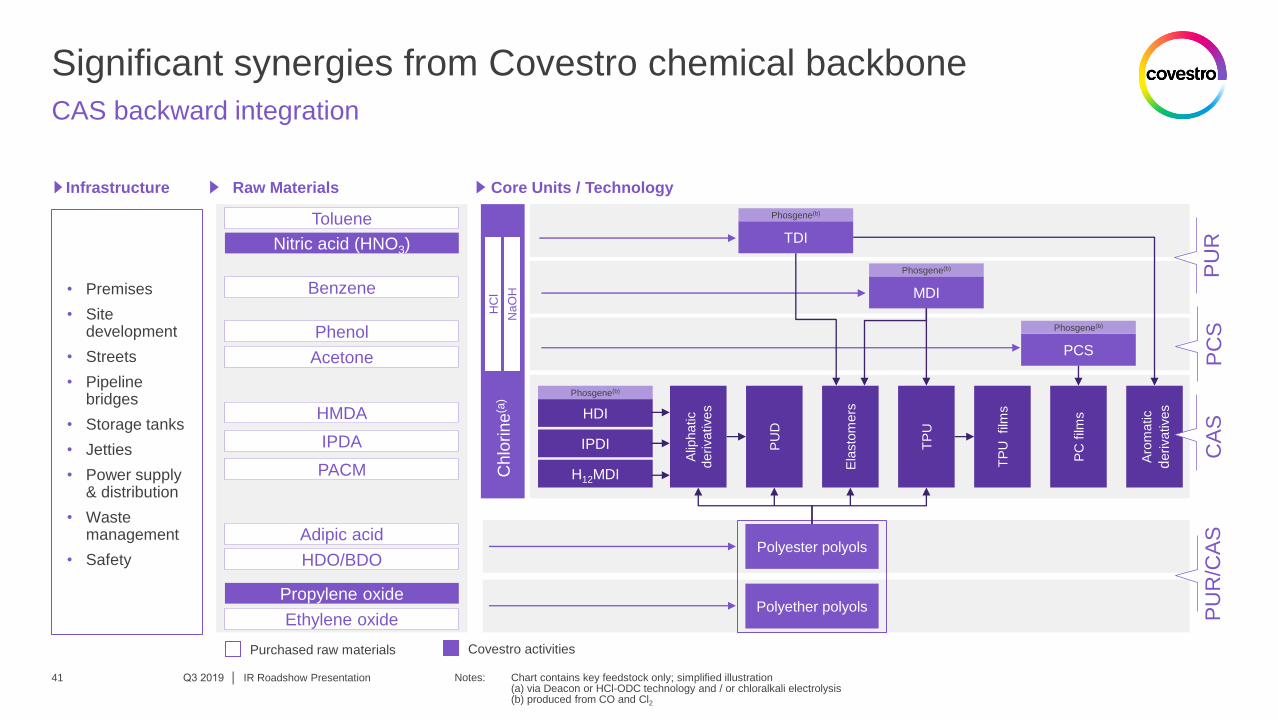
Significant synergies from Covestro chemical backbone
CAS backward integration
Notes: Chart contains key feedstock only; simplified illustration (a) via Deacon or HCl-ODC technology and / or chloralkali electrolysis (b) produced from CO and Cl2
IR Roadshow Presentation Q3 2019 │ 41
Toluene
Nitric acid (HNO3)
Benzene
Phenol
Acetone
C
hlo
rin
e(a
) H
Cl
Na
OH
TDI
Phosgene(b)
MDI
Phosgene(b)
PU
R/C
AS
P
UR
P
CS
HMDA
IPDA
PACM
PCS
Phosgene(b)
CA
S
Alip
hatic
derivatives
Aro
matic
derivatives
TP
U
TP
U film
s
PC
film
s
Adipic acid
HDO/BDO Polyester polyols
Propylene oxide
Ethylene oxide Polyether polyols
PU
D HDI
Phosgene(b)
IPDI
H12MDI
Ela
sto
mers
Infrastructure Raw Materials Core Units / Technology
• Premises
• Site development
• Streets
• Pipeline bridges
• Storage tanks
• Jetties
• Power supply & distribution
• Waste management
• Safety
Covestro activities Purchased raw materials
Q3 2019 │ IR Roadshow Presentation 42
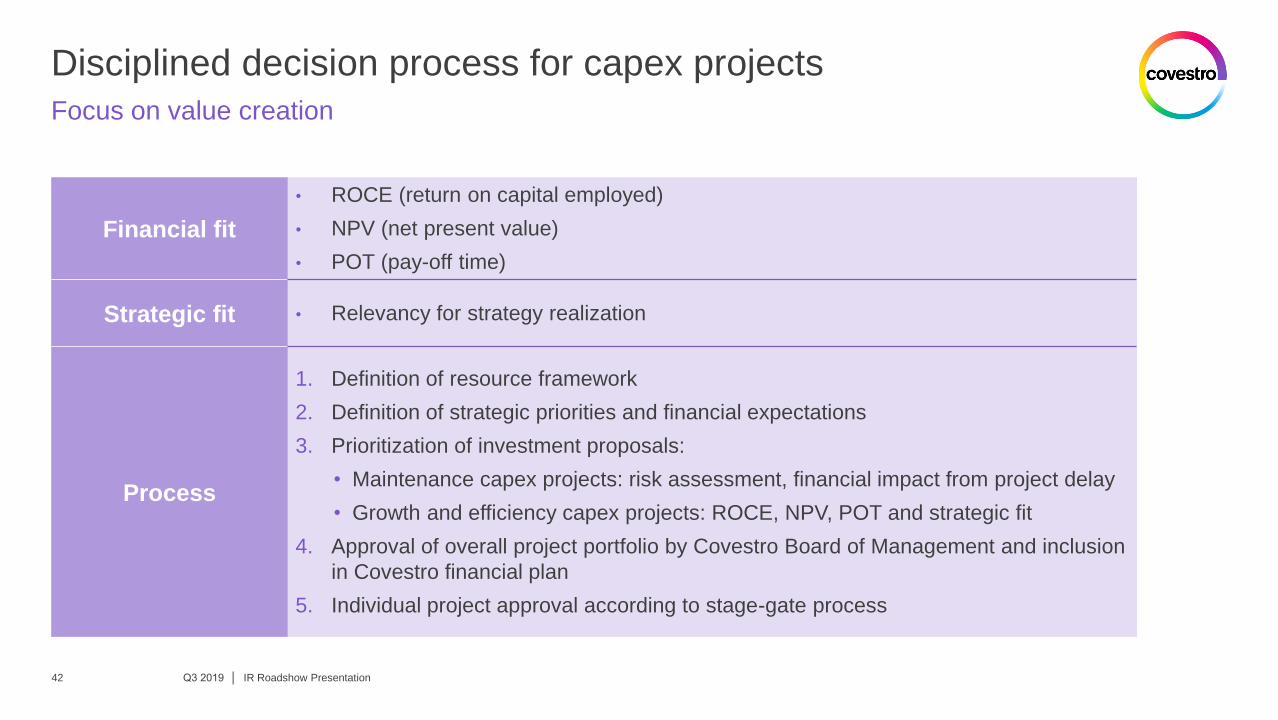
Disciplined decision process for capex projects
Focus on value creation
Financial fit
• ROCE (return on capital employed)
• NPV (net present value)
• POT (pay-off time)
Strategic fit • Relevancy for strategy realization
Process
1. Definition of resource framework
2. Definition of strategic priorities and financial expectations
3. Prioritization of investment proposals:
• Maintenance capex projects: risk assessment, financial impact from project delay
• Growth and efficiency capex projects: ROCE, NPV, POT and strategic fit
4. Approval of overall project portfolio by Covestro Board of Management and inclusion
in Covestro financial plan
5. Individual project approval according to stage-gate process
• Targets for 100% achievement:
• For each metric, payout can range from
0% to 300%
• Max. payout capped at 250%
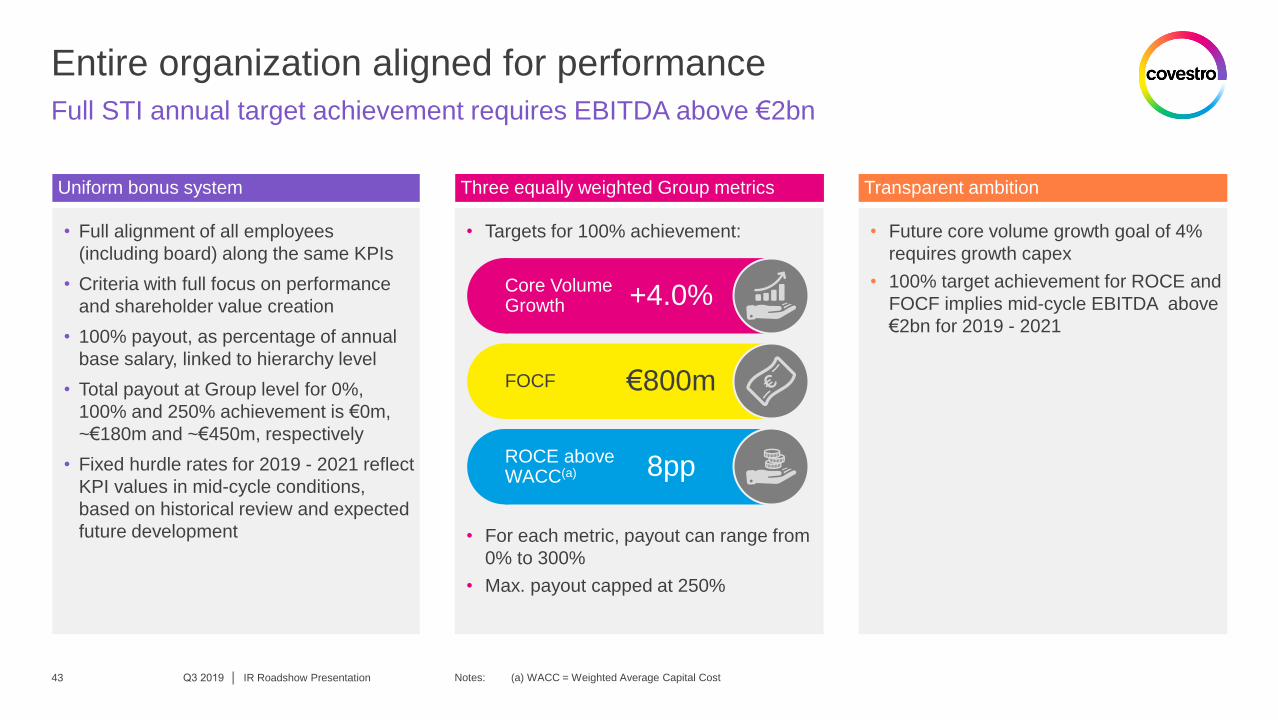
Entire organization aligned for performance
IR Roadshow Presentation
Full STI annual target achievement requires EBITDA above €2bn
Notes: (a) WACC = Weighted Average Capital Cost
Uniform bonus system Three equally weighted Group metrics Transparent ambition
• Future core volume growth goal of 4%
requires growth capex
• 100% target achievement for ROCE and
FOCF implies mid-cycle EBITDA above
€2bn for 2019 - 2021
• Full alignment of all employees
(including board) along the same KPIs
• Criteria with full focus on performance
and shareholder value creation
• 100% payout, as percentage of annual
base salary, linked to hierarchy level
• Total payout at Group level for 0%,
100% and 250% achievement is €0m,
~€180m and ~€450m, respectively
• Fixed hurdle rates for 2019 - 2021 reflect
KPI values in mid-cycle conditions,
based on historical review and expected
future development
Core Volume Growth
FOCF
ROCE above WACC(a)
+4.0%
€800m
8pp
Q3 2019 │ 43
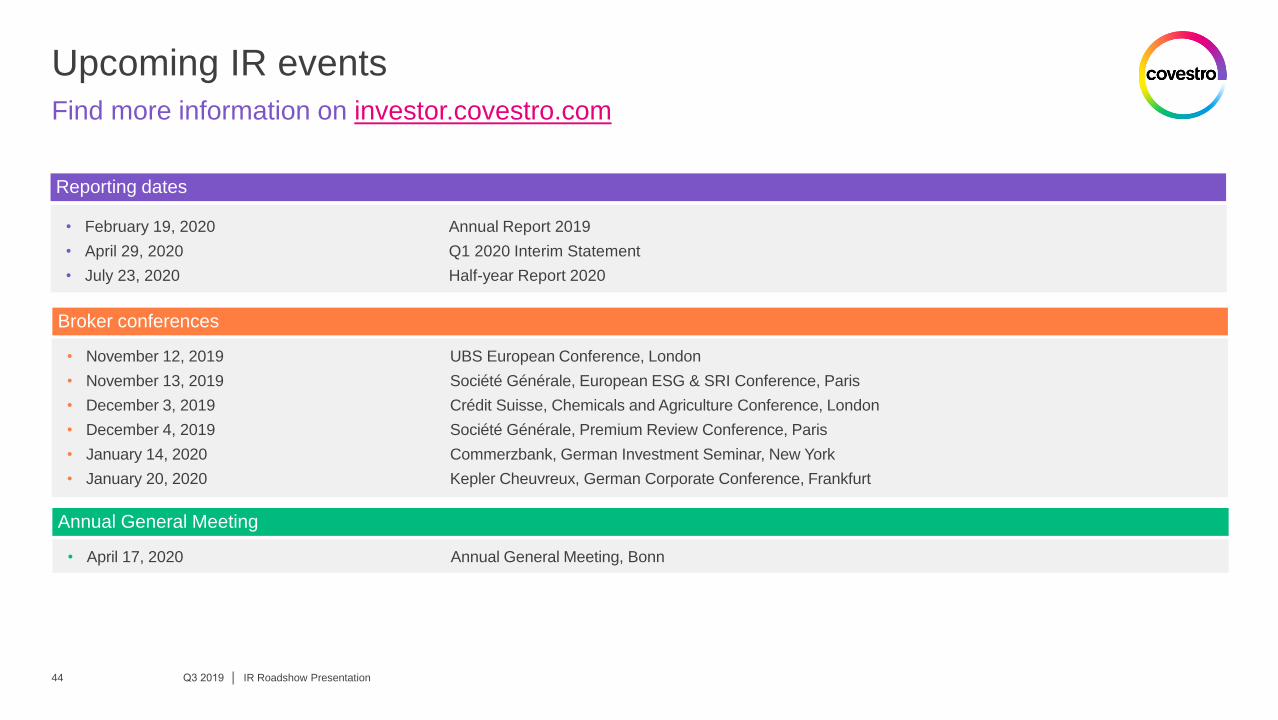
Upcoming IR events
Q3 2019 │ IR Roadshow Presentation
Find more information on investor.covestro.com
Reporting dates
• February 19, 2020 Annual Report 2019
• April 29, 2020 Q1 2020 Interim Statement
• July 23, 2020 Half-year Report 2020
Broker conferences
• November 12, 2019 UBS European Conference, London
• November 13, 2019 Société Générale, European ESG & SRI Conference, Paris
• December 3, 2019 Crédit Suisse, Chemicals and Agriculture Conference, London
• December 4, 2019 Société Générale, Premium Review Conference, Paris
• January 14, 2020 Commerzbank, German Investment Seminar, New York
• January 20, 2020 Kepler Cheuvreux, German Corporate Conference, Frankfurt
• April 17, 2020 Annual General Meeting, Bonn
Annual General Meeting
44
Disclaimer
This presentation may contain forward-looking statements based on current assumptions and forecasts made
by Covestro AG.
Various known and unknown risks, uncertainties and other factors could lead to material differences between
the actual future results, financial situation, development or performance of the company and the estimates
given here. These factors include those discussed in Covestro’s public reports, which are available on the
Covestro website at www.covestro.com.
The company assumes no liability whatsoever to update these forward-looking statements or to adjust them to
future events or developments.
IR Roadshow Presentation Q3 2019 │ 45