Embed Size (px)
Citation preview

SEC Form 17-IS December 2003
1
SECURITIES AND EXCHANGE COMMISSION SEC FORM 20-IS
INFORMATION STATEMENT PURSUANT TO SECTION 20 OF THE SECURITIES REGULATION CODE
1. Check the appropriate box:
[ √ ] Preliminary Information Statement
[ ] Definitive Information Statement 2. Name of Registrant as specified in its charter CITYSTATE SAVINGS BANK, INC. . 3. Makati City, Metro Manila, Philippines . Province, country or other jurisdiction of incorporation or organization 4. SEC Identification Number A1997-9587 . 5. BIR Tax Identification Code 005-338-421-000 . 6. Citystate Centre Building, 709 Shaw Boulevard, Pasig City 1600 .
Address of principal office Postal Code
7. Registrant’s telephone number, including area code (632) 470-3333 . 8. April 30, 2013 at 9:00 AM; 20th Floor, Citystate Centre Building, 709 Shaw Boulevard, Pasig City. Date, time and place of the meeting of security holders 9. Approximate date on which the Information Statement is first to be sent or given to security holders
April 8, 2013. 10. In case of Proxy Solicitations: Name of Person Filing the
Statement/Solicitor:_______________________________________________ Address and Telephone
No.:____________________________________________________________ 11. Securities registered pursuant to Sections 8 and 12 of the Code or Sections 4 and 8 of the RSA
(information on number of shares and amount of debt is applicable only to corporate registrants): Title of Each Class Number of Shares of Common Stock Outstanding or Amount of Debt Outstanding . Common Shares 72,764,998 shares . 12. Are any or all of registrant's securities listed in a Stock Exchange? Yes √ No _______ If yes, disclose the name of such Stock Exchange and the class of securities listed therein: Philippine Stock Exchange/Common Stock .
SEC Form 17-IS December 2003
2
INFORMATION STATEMENT A. GENERAL INFORMATION Date, time and place of meeting of security holders.
Date : April 30, 2013 Time : 9:00 A.M Place : 20th Floor, Citystate Centre Building 709 Shaw Boulevard, Pasig City Principal Office : 2nd Floor, Citystate Centre Building 709 Shaw Boulevard, Pasig City This Information Statement is to be first sent to the security holders of Citystate Savings Bank, Inc. on April 8, 2013 in connection with the Annual Stockholders’ Meeting.
WE ARE NOT ASKING YOU FOR A PROXY BUT YOU MAY SEND YOUR PROXY IF YOU CANNOT ATTEND
PERSONALLY Dissenters' Right of Appraisal There are no matters or proposed actions included in the Agenda of the Meeting that may give rise to a possible exercise by stockholders of their appraisal rights. With respect to that any matter to be acted upon at the Meeting which may give rise to the right of appraisal in order that a dissenting stockholder may exercise his appraisal right, such dissenting stockholder shall be reported within thirty (30) days after the date of the meeting at which such stockholder voted against the Corporate action, make a written demand on the Corporation for the value of his shares. The procedure to be followed in exercising the appraisal right shall be in accordance with Sections 81 to 86 of the Corporation Code. The appraisal right may be exercised by any stockholder who shall have voted against the proposed corporate action, by making a written demand on the corporation within thirty (30) days after the date on which vote was taken for payment of the fair value of his shares: Provided, that failure to make the demand within such period shall be deemed a waiver of the appraisal right. If the proposed corporate action is implemented or effected, the corporation shall pay to such stockholder, upon surrender of the certificate(s) of stock representing his shares, the fair value thereof as of the day prior to the date which the vote was taken, excluding any appreciation or depreciation in anticipation of such corporate action. If within a period of sixty (60) days after the date the corporate action was approved by the stockholders, the withdrawing stockholder and the corporation cannot agree on the fair value of the shares, it shall be determined and appraised by three (3) disinterested persons, one of whom shall be named by the stockholder, another by the corporation and the third by the two thus chosen. The findings of the majority of the appraisers shall be final, and their award shall be paid by the corporation within thirty (30) days after such award is made: Provided, that no payment shall be made to any dissenting stockholder unless the corporation has unrestricted retained earnings in its books to cover such payment: and Provided, further, that upon payment by the corporation of the agreed awarded price, the stockholder shall forthwith transfer his shares to the corporation. Interest of Certain Persons in or Opposition to Matters to be Acted Upon
SEC Form 17-IS December 2003
3
The Board of the Directors of the Company is not aware of any party who has indicated an intention to oppose the motions set forth in the Agenda. No person who has been a Director or Officer of neither the Corporation nor any of his/her associates has a substantial interest in any matter to be acted upon at the Stockholders’ Meeting. B. CONTROL AND COMPENSATION INFORMATION
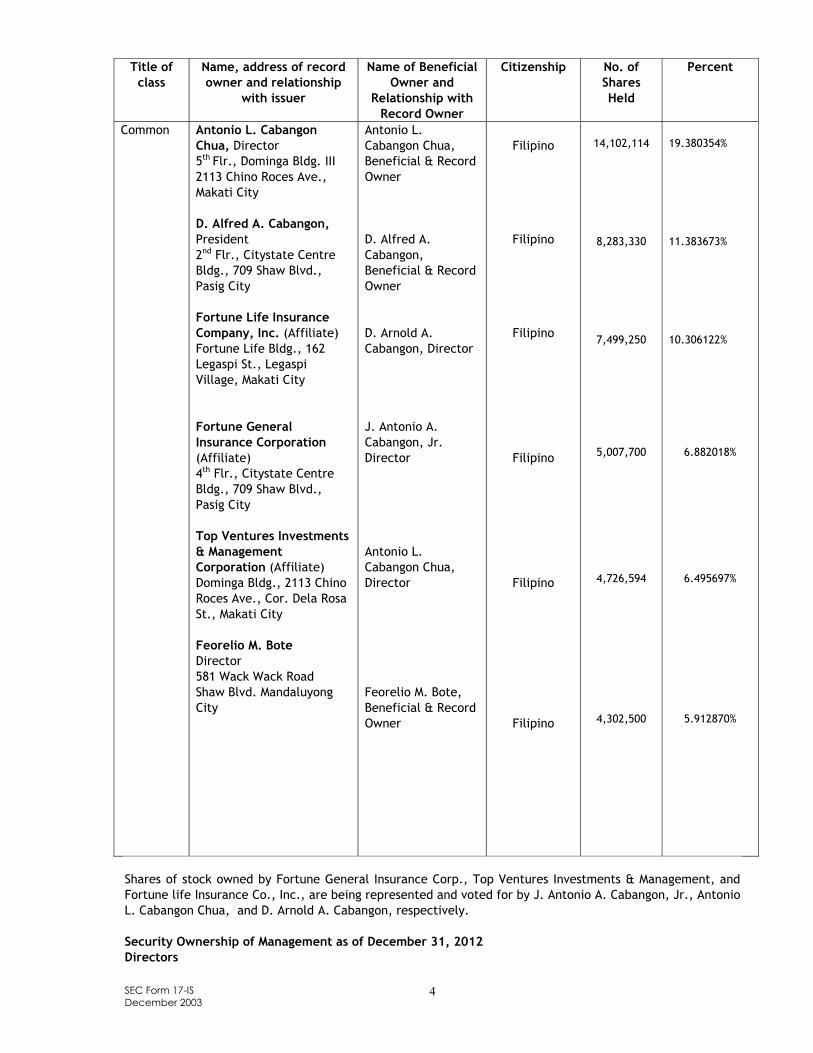
Voting Securities and Principal Holders Thereof As of December 31, 2012, there are 72,764,998 shares of the Company common stock outstanding and entitled to vote at the Annual Meeting. Only holders of the Company’s stock of record at the close of business on March 22, 2013, acting in person or by proxy on the day of the meeting are entitled to vote at the Annual Meeting to be held on April 30, 2013. Every stockholder shall be entitled to one vote for each share of common stock held as of the established record date. Each stockholder may vote the number of shares of stock standing in his own name as of the record date of the meeting for as many persons as there are directors to be elected or he may cumulate said shares and give one candidate as many votes as the number of directors to be elected multiplied by the number his shares shall equal, or he may distribute them on the same principle among as many candidates as he shall see fit: Provided, that the total number of votes cast by him shall not exceed the number of shares owned by him as shown in the books of the corporation multiplied by the whole number of directors to be elected: Provided, however, that no delinquent stock shall be voted. Cumulative voting is allowed for election of members of the Board of Directors. Security Ownership of Certain Record and Beneficial Owners The person known to the registrant to be directly or indirectly the record or beneficial owner of more than five (5%) of the registrant’s voting securities as of December 31, 2012 are as follows: Beneficial Owners of Voting Securities
SEC Form 17-IS December 2003
4
Title of class
Name, address of record owner and relationship
with issuer
Name of Beneficial Owner and
Relationship with Record Owner
Citizenship No. of Shares Held
Percent
Common Antonio L. Cabangon Chua, Director 5th Flr., Dominga Bldg. III 2113 Chino Roces Ave., Makati City D. Alfred A. Cabangon, President 2nd Flr., Citystate Centre Bldg., 709 Shaw Blvd., Pasig City Fortune Life Insurance Company, Inc. (Affiliate) Fortune Life Bldg., 162 Legaspi St., Legaspi Village, Makati City Fortune General Insurance Corporation (Affiliate) 4th Flr., Citystate Centre Bldg., 709 Shaw Blvd., Pasig City Top Ventures Investments & Management Corporation (Affiliate) Dominga Bldg., 2113 Chino Roces Ave., Cor. Dela Rosa St., Makati City Feorelio M. Bote Director 581 Wack Wack Road Shaw Blvd. Mandaluyong City
Antonio L. Cabangon Chua, Beneficial & Record Owner D. Alfred A. Cabangon, Beneficial & Record Owner D. Arnold A. Cabangon, Director J. Antonio A. Cabangon, Jr. Director Antonio L. Cabangon Chua, Director Feorelio M. Bote, Beneficial & Record Owner
Filipino
Filipino
Filipino
Filipino
Filipino
Filipino
14,102,114
8,283,330
7,499,250
5,007,700
4,726,594
4,302,500
19.380354% 11.383673% 10.306122%
6.882018%
6.495697%
5.912870%
Shares of stock owned by Fortune General Insurance Corp., Top Ventures Investments & Management, and Fortune life Insurance Co., Inc., are being represented and voted for by J. Antonio A. Cabangon, Jr., Antonio L. Cabangon Chua, and D. Arnold A. Cabangon, respectively. Security Ownership of Management as of December 31, 2012 Directors
SEC Form 17-IS December 2003
5
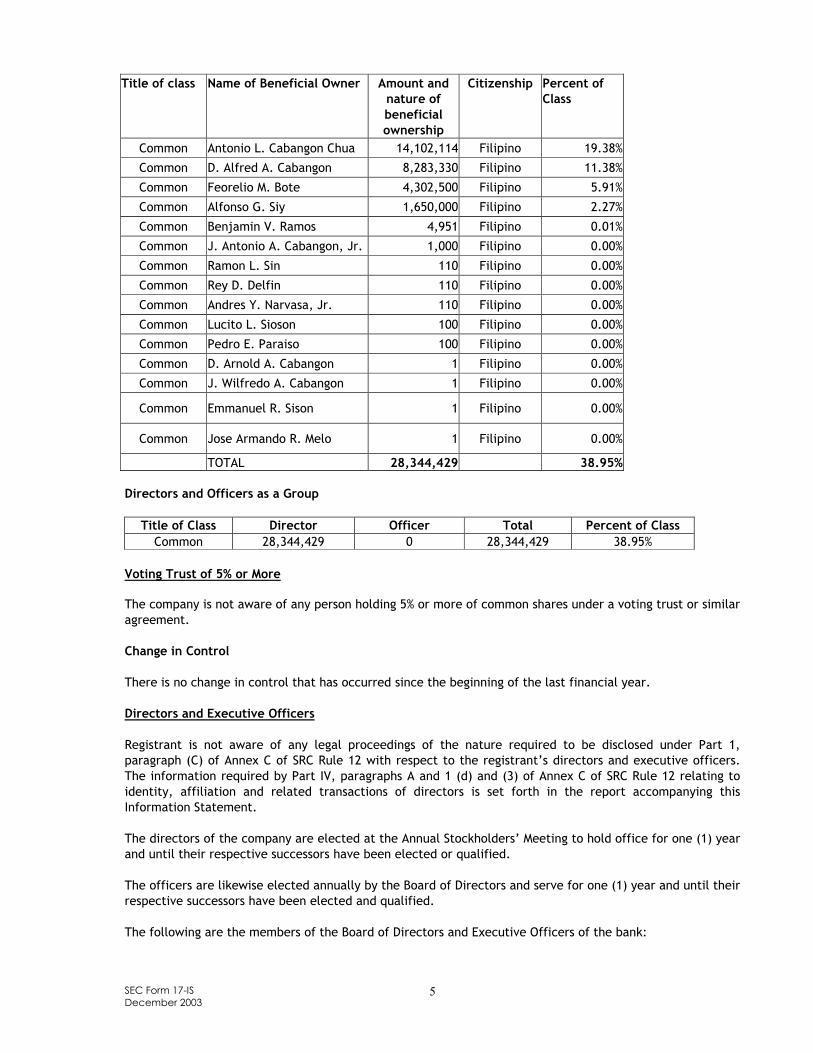
Title of class Name of Beneficial Owner Amount and
nature of beneficial ownership
Citizenship Percent of Class
Common Antonio L. Cabangon Chua 14,102,114 Filipino 19.38%
Common D. Alfred A. Cabangon 8,283,330 Filipino 11.38%
Common Feorelio M. Bote 4,302,500 Filipino 5.91%
Common Alfonso G. Siy 1,650,000 Filipino 2.27%
Common Benjamin V. Ramos 4,951 Filipino 0.01%
Common J. Antonio A. Cabangon, Jr. 1,000 Filipino 0.00%
Common Ramon L. Sin 110 Filipino 0.00%
Common Rey D. Delfin 110 Filipino 0.00%
Common Andres Y. Narvasa, Jr. 110 Filipino 0.00%
Common Lucito L. Sioson 100 Filipino 0.00%
Common Pedro E. Paraiso 100 Filipino 0.00%
Common D. Arnold A. Cabangon 1 Filipino 0.00%
Common J. Wilfredo A. Cabangon 1 Filipino 0.00%
Common Emmanuel R. Sison 1 Filipino 0.00%
Common Jose Armando R. Melo 1 Filipino 0.00%
TOTAL 28,344,429 38.95% Directors and Officers as a Group
Title of Class Director Officer Total Percent of Class Common 28,344,429 0 28,344,429 38.95%
Voting Trust of 5% or More The company is not aware of any person holding 5% or more of common shares under a voting trust or similar agreement. Change in Control There is no change in control that has occurred since the beginning of the last financial year.
Directors and Executive Officers Registrant is not aware of any legal proceedings of the nature required to be disclosed under Part 1, paragraph (C) of Annex C of SRC Rule 12 with respect to the registrant’s directors and executive officers. The information required by Part IV, paragraphs A and 1 (d) and (3) of Annex C of SRC Rule 12 relating to identity, affiliation and related transactions of directors is set forth in the report accompanying this Information Statement. The directors of the company are elected at the Annual Stockholders’ Meeting to hold office for one (1) year and until their respective successors have been elected or qualified. The officers are likewise elected annually by the Board of Directors and serve for one (1) year and until their respective successors have been elected and qualified. The following are the members of the Board of Directors and Executive Officers of the bank:

SEC Form 17-IS December 2003
6
Board of Directors
Amb. Antonio L. Cabangon Chua -Chairman Atty. Rey D. Delfin -President Alfonso G. Siy -Vice Chairman
D. Arnold A. Cabangon -Corporate Treasurer J. Antonio A. Cabangon, Jr. -Director/Managing
D. Alfred A. Cabangon -Director J. Wilfredo A. Cabangon -Director
Engr. Feorelio M. Bote -Director Benjamin V. Ramos -Director Ramon L. Sin -Director Pedro E. Paraiso -Director
Atty. Emmanuel R. Sison -Director Andres Y. Narvasa, Jr. -Independent Director
Lucito L. Sioson -Independent Director Justice Jose Armando R. Melo -Independent Director Amb. Antonio L. Cabangon Chua, 78, Chairman. Ambassador Cabangon Chua is a Filipino citizen. He is a full colonel in the reserve force of the Armed Forces of the Philippines and an honorary member of the PMA Class ‘56. He is a graduate of the University of the East in 1956, with a Bachelor of Science in Business Administration and a Certified Public Accountant. He holds a Doctorate in Humanities, Honoris Causa from Adamson University. He was Chairman of the bank from 1997 to 2000 and was re-elected in 2011.He is the founder of Fortune Insurance Group, Eternal Group of Companies, and Aliw Broadcasting Corporation. He is also involved in the publications as Chairman Emeritus – Owner of Philippine Business Daily Mirror Publishing, Inc, and Philippine Graphic Publications, Inc. He has been a director of Citystate Savings Bank, Inc. since the start of the bank in 1997. Atty. Rey D. Delfin, 48, President. Mr. Delfin is a Filipino citizen. He has been with Citystate Bank since July of 1997. Prior to this, he had worked for Far East Bank & Trust Company; Banco De Oro Universal Bank; Keppel Monte Bank; Jimeno, Jalandoni and Cope Law Office; and Joaquin Cunanan & Co. (Price Waterhouse Coopers). Mr. Delfin is a graduate of University of the Philippines with a Bachelor of Science in Business Administration in 1985; and San Beda College with a Bachelor of Laws in 1994. He is a Certified Public Accountant (CPA) and a Lawyer. He has been a director of Citystate Savings Bank, Inc. since January 2007. Alfonso G. Siy, 65, Vice Chairman. Mr. Siy is a Filipino citizen. He is a graduate of the University of the East with a Bachelor of Science in Business Administration in 1969. Aside from being a director of the bank, Mr. Siy is also a director of the Ever Fortune Thermoplas Corp., Fortune Net and Twine Mfg. Corp., Fortune Int’l Trading Corp., Phil. Fishing Gears Industries, Neltex Manufacturing & Export Corp., and Altamar Industries, Inc. He has been a director of Citystate Savings Bank, Inc. since the start of the bank in 1997. D. Alfred A. Cabangon, 46, Director. Mr. Cabangon is a Filipino citizen. He graduated from the De La Salle University with a Bachelor of Science in Commerce degree, major in Accounting in 1987. Mr. Cabangon is a Certified Public Accountant. He is the Chief Investment Officer of Fortune Life Insurance Co., Inc. He is presently a director of Fortune Guarantee and Insurance Corporation, Fortune Medicare, Eternal Plans, Inc., ALC Industrial & Commercial Development Corporation, and ALC Realty & Development Corporation. He has been a director of Citystate Savings Bank, Inc. since the start of the bank in 1997. J. Antonio A. Cabangon, Jr., 44, Director/Managing. Mr. Cabangon is a Filipino citizen. He graduated from California State University in 1990 with a degree in Bachelor of Science in Finance. He is the Chairman and CEO of Fortune General Insurance Corp., Chairman of Fortune Medicare, Inc., President of Aliw Broadcasting Corporation, and Citystate Condominium Corporation. He is also the Vice Chairman of Fortune

SEC Form 17-IS December 2003
7
Life Insurance, Co., and an Investment Officer of AAA Southeast Equities. He also seats as the Treasurer of CTD Filipinas Pawnshop. He has been a director of Citystate Savings Bank, Inc. since August 2007. D. Arnold A. Cabangon, 42, Director & Corporate Treasurer. Mr. Cabangon is a Filipino citizen. He graduated from Ateneo De Manila University in 1992 with a Bachelor of Arts degree in Management Economics. He is the President of Fortune Life Insurance Company and a director of AAA Southeast Equities, Inc., FIG Lending Investors Corporation, Fortune General Insurance Corporation, and Fortune Medicare, Inc. He has been a director of Citystate Savings Bank, Inc. since April 2000. J. Wilfredo A. Cabangon, 52, Director. Mr. Cabangon is a Filipino Citizen. He is a graduate of De La Salle University – College of St. Benilde with a Bachelor of Science in Commerce, major in Business Management in 1997. He is the President of Mandaluyong Pawnshop and is a director of ALC Realty Development Corp., Fortune Life Insurance Company, Inc., Fortune General Insurance Corp., Eternal Plans, Inc., Eternal Gardens Memorial Park Corp., Gencars, Inc., and Libertad Filipinas Pawnshop, Inc. He has been a director of Citystate Savings Bank, Inc. since the start of the bank in 1997. Engr. Feorelio M. Bote, 70, Director, is a citizen of the Philippines. Mr. Bote graduated from the Mapua Institute of Technology with a degree in Civil Engineering in 1964. Besides being a director of the bank, Mr. Bote is also a director of KVL Enterprises, Key Construction & Development Corp., Divine Manna Construction & Development Corp., and Key Lending Investor. Corp. He has been a director of Citystate Savings Bank, Inc. since the start of the bank in 1997. Benjamin V. Ramos, 49, Director. Mr. Ramos is a Filipino citizen. He graduated from the University of Santo Tomas with a Bachelor of Science in Commerce in 1983. Mr. Ramos is a Certified Public Accountant. He is currently the President of Philippine Graphic Publication and Philippine Business Daily Mirror Publishing, Inc. He is also the President and COO of Eternal Gardens Memorial Park Corp. Aside from Citystate Savings Bank, he is also a director of numerous companies including the Eternal Plans, Inc., the Eternal Crematory Corp., Fortune Medicare, Inc., Fortune General & Insurance Corp., and the Citystate Centre Condominium Corp. He has been a director of Citystate Savings Bank, Inc. since 1999. Ramon L. Sin, 79, Director. Mr. Sin is a Filipino citizen. He is a graduate of the University of Santo Tomas where he received an Associate in Arts degree in 1950. He finished his Doctor of Medicine from the same university in 1955. Dr. Sin is the Assistant to the Rector for Grants and Endowment of the University of Santo Tomas. He is also a director of Fortune Medicare, Inc., Fortune Life Insurance Co., Inc., and Eternal Plans, Inc., and the Medical Director of Philippine Airlines. He also chairs the KAAD (Scholarship Foundation of the German Catholic Bishop’s Conference) at the University of Santo Tomas. He has been a director of Citystate Savings Bank, Inc. since 2002. Pedro E. Paraiso, 79, Director. Mr. Paraiso is a Filipino citizen. He is a graduate of the University of the East in 1955 with a Bachelor of Science degree in Business Administration. He took up postgraduate studies at the University of the East and Ateneo de Manila University. He is presently a director of various companies. Mr. Paraiso is a Certified Public Accountant. He has been a director of Citystate Savings Bank, Inc. since December 2008. Atty. Emmanuel R. Sison, 62, Director. Mr. Sison is a Filipino citizen. He is a graduate of Ateneo de Manila University with a Bachelor of Arts degree in Economics in 1970; and Adamson University with a Bachelor of Laws in 1975. He finished his masteral degree in Government Management at the Pamantasan ng Lungsod ng Maynila in 2007. Mr Sison is a lawyer and a Senior Partner of Quiason, Makalintal, Barot, Torres, Ibarra & Sison Law Firm. He is presently a director of Quialex Realty corp. Prior to this, he was the corporate secretary and a consultant of Meralco from 2008 to 2010. He was the Secretary to the Mayor of the City of
SEC Form 17-IS December 2003
8
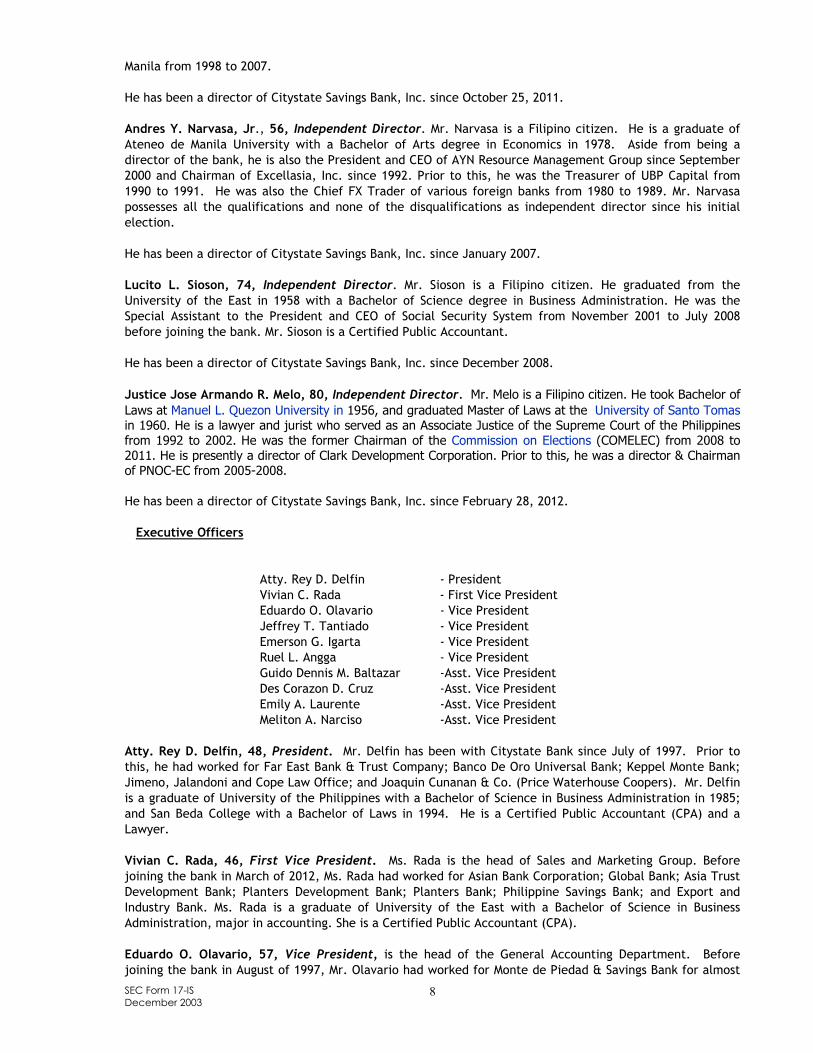
Manila from 1998 to 2007. He has been a director of Citystate Savings Bank, Inc. since October 25, 2011. Andres Y. Narvasa, Jr., 56, Independent Director. Mr. Narvasa is a Filipino citizen. He is a graduate of Ateneo de Manila University with a Bachelor of Arts degree in Economics in 1978. Aside from being a director of the bank, he is also the President and CEO of AYN Resource Management Group since September 2000 and Chairman of Excellasia, Inc. since 1992. Prior to this, he was the Treasurer of UBP Capital from 1990 to 1991. He was also the Chief FX Trader of various foreign banks from 1980 to 1989. Mr. Narvasa possesses all the qualifications and none of the disqualifications as independent director since his initial election. He has been a director of Citystate Savings Bank, Inc. since January 2007. Lucito L. Sioson, 74, Independent Director. Mr. Sioson is a Filipino citizen. He graduated from the University of the East in 1958 with a Bachelor of Science degree in Business Administration. He was the Special Assistant to the President and CEO of Social Security System from November 2001 to July 2008 before joining the bank. Mr. Sioson is a Certified Public Accountant. He has been a director of Citystate Savings Bank, Inc. since December 2008. Justice Jose Armando R. Melo, 80, Independent Director. Mr. Melo is a Filipino citizen. He took Bachelor of Laws at Manuel L. Quezon University in 1956, and graduated Master of Laws at the University of Santo Tomas in 1960. He is a lawyer and jurist who served as an Associate Justice of the Supreme Court of the Philippines from 1992 to 2002. He was the former Chairman of the Commission on Elections (COMELEC) from 2008 to 2011. He is presently a director of Clark Development Corporation. Prior to this, he was a director & Chairman of PNOC-EC from 2005-2008. He has been a director of Citystate Savings Bank, Inc. since February 28, 2012. Executive Officers
Atty. Rey D. Delfin - President Vivian C. Rada - First Vice President Eduardo O. Olavario - Vice President Jeffrey T. Tantiado - Vice President Emerson G. Igarta - Vice President Ruel L. Angga - Vice President Guido Dennis M. Baltazar -Asst. Vice President Des Corazon D. Cruz -Asst. Vice President Emily A. Laurente -Asst. Vice President Meliton A. Narciso -Asst. Vice President
Atty. Rey D. Delfin, 48, President. Mr. Delfin has been with Citystate Bank since July of 1997. Prior to this, he had worked for Far East Bank & Trust Company; Banco De Oro Universal Bank; Keppel Monte Bank; Jimeno, Jalandoni and Cope Law Office; and Joaquin Cunanan & Co. (Price Waterhouse Coopers). Mr. Delfin is a graduate of University of the Philippines with a Bachelor of Science in Business Administration in 1985; and San Beda College with a Bachelor of Laws in 1994. He is a Certified Public Accountant (CPA) and a Lawyer. Vivian C. Rada, 46, First Vice President. Ms. Rada is the head of Sales and Marketing Group. Before joining the bank in March of 2012, Ms. Rada had worked for Asian Bank Corporation; Global Bank; Asia Trust Development Bank; Planters Development Bank; Planters Bank; Philippine Savings Bank; and Export and Industry Bank. Ms. Rada is a graduate of University of the East with a Bachelor of Science in Business Administration, major in accounting. She is a Certified Public Accountant (CPA). Eduardo O. Olavario, 57, Vice President, is the head of the General Accounting Department. Before joining the bank in August of 1997, Mr. Olavario had worked for Monte de Piedad & Savings Bank for almost
SEC Form 17-IS December 2003
9
20 years. He is a graduate of Philippine College of Commerce with a Bachelor of Science in Commerce, major in Accounting in 1971. Mr. Olavario is a Certified Public Accountant (CPA). Jeffrey T. Tantiado, 40, Vice President, is the head of the bank’s Information Technology Department. Mr. Tantiado has handled the bank’s Information Technology Department since he joined the bank in August of 1997. He graduated from the Computer College of the Visayas with a Bachelor of Science in Computer Science in 1994. Emerson G. Igarta, 48, Vice President, is the head of the Internal Audit Department. Prior to his stint with the bank in 1998, he worked with Monte de Piedad and Orient Bank. He graduated from the Philippine School of Business Administration with a degree in Bachelor of Science in Business Administration major in Accounting in 1986. Mr. Igarta is a Certified Public Accountant (CPA). Ruel L. Angga, 49, Vice President, is the bank’s Compliance Officer and head of the Compliance Department. Mr. Angga joined the bank in June 1999. Prior to this, he had worked for the International Corporate Bank and Union Bank of the Philippines. He is a graduate of the Philippine School of Business Administration with a Bachelor of Science in Business Administration major in Management in 1990. He is also a graduate of Electronics Technology from Don Bosco Technical College in 1983. Guido Dennis M. Baltazar, 48, Assistant Vice President, is the head of the Account Management Department. Mr. Baltazar first joined the bank in September 1998 as an examiner for the Internal Audit Department and was then promoted to handle the Loans and Discount Department in December 2001. He is a graduate of Far Eastern University with a degree in Bachelor of Science in Commerce major in Accounting in 1990. He completed his Masters in Business Administration at the Adamson University in 2004. Des Corazon D. Cruz, 53, Assistant Vice President, is the head of Institutional Marketing & Communications Department. She joined the bank on March 2004. She also worked with Philippine Investment Management Consultants, Inc. (PHINMA) before she started her banking career at Far East Bank and Trust Co. and Banco De Oro Universal Bank. She is a graduate of St. Paul College of Quezon City with a degree of Bachelor of Arts major in Economics. Emily C. Laurente, 51, Assistant Vice President, is the head of Trust Department. She joined the bank last April 1, 2012. She started her banking career in 2006 at AsiaTrust Bank and in 2011 at Bank of Commerce. She is a graduate of Polytechnic University of the Philippines with a Bachelor of Science in Business Administration, major in Accounting. Meliton A. Narciso, 40, Assistant Vice President, is the bank’s Chief Risk Officer and head of the Risk Management Department. He joined the bank on January 30, 2013. He started his banking career in 2008 at AsiaTrust Bank. He also worked for Maybank’s Trust Department in 2009. He is a graduate of University of Sto. Tomas with a degree in A.B. Economics in 1993. He completed his Masters in Business Administration at the Ateneo de Manila University in 2002. Compliance with SRC Rule 38 The registrant has constituted its Nomination Committee in line with the Code of Corporate Governance and it is composed of:
1. Ambassador Antonio L. Cabangon Chua - Chairman 2. Atty. Rey D. Delfin – Member 3. Andres Y. Narvasa, Jr. - Member 4. Jocelyn J. Taccad – Non-voting Member
During its last stockholders' meeting, the registrant elected three (3) independent directors in the persons of:
1. Andres Y. Narvasa, Jr.

SEC Form 17-IS December 2003
10
2. Lucito L. Sioson 3. Justice Jose Armando R. Melo
They possess the qualifications enumerated under SRC Rule 38. In the forthcoming stockholders' meeting the nomination and election of directors and independent directors shall be conducted in line with the Corporation Code and with SRC Rule 38. The final list of the nominees is as follows: As Directors
1. Amb. Antonio L. Cabangon Chua, 78, Filipino 2. D. Alfred A. Cabangon, 46, Filipino 3. Alfonso G. Siy, 65, Filipino 4. D. Arnold A. Cabangon, 42, Filipino 5. Engr. Feorelio M. Bote, 70, Filipino 6. J. Antonio A. Cabangon, Jr., 44, Filipino 7. J. Wilfredo A. Cabangon, 52, Filipino 8. Benjamin V. Ramos, 49, Filipino 9. Ramon L. Sin, 79, Filipino 10. Atty. Rey D. Delfin, 48, Filipino 11. Atty. Emmanuel R. Sison, 62, Filipino 12. Pedro E. Paraiso, 79, Filipino
As Independent Directors
1. Andres Y. Narvasa, Jr., 56, Filipino 2. Lucito L. Sioson, 74, Filipino 3. Justice Jose Armando R. Melo, 80, Filipino
The above-mentioned candidates have been pre-screened and qualified in accordance with the bank's Manual of Corporate Governance. Information About the Nominees for Independent Directors Andres Y. Narvasa, Jr., 56, Independent Director. Mr. Narvasa is a Filipino citizen. He is a graduate of Ateneo de Manila University with a Bachelor of Arts degree in Economics in 1978. Aside from being a director of the bank, he is also the President and CEO of AYN Resource Management Group since September 2000 and Chairman of Excellasia, Inc. since 1992. Mr. Narvasa possesses all the qualifications and none of the disqualifications as independent director since his initial election. He was appointed director of Citystate Savings Bank, Inc. on January 9, 2007. He was nominated as independent director by Ms. Baby Zafra, a minority stockholder not in any manner related to the nominee. Lucito L. Sioson, 74, Independent Director. Mr. Sioson is a Filipino citizen. He graduated from the University of the East in 1958 with a Bachelor of Science degree in Business Administration. He was the Special Assistant to the President and CEO of Social Security System from November 2001 to July 2008 before joining the bank. Mr. Sioson is a Certified Public Accountant. He was appointed director of Citystate Savings Bank, Inc. on December 23, 2008. He was nominated as independent director by Ms. Mercedita Gapaz, minority stockholder not in any manner related to the nominee. Justice Jose Armando R. Melo,80, Independent Director. Mr. Melo is a Filipino citizen. He took Bachelor of Laws at Manuel L. Quezon University in 1956, and graduated Master of Laws at the University of Santo Tomas in 1960. He is a lawyer and jurist who served as an Associate Justice of the Supreme Court of the Philippines from 1992 to 2002. He was the former Chairman of the Commission on Elections (COMELEC) from 2008 to 2011.. He is presently the Director of Clark Development Corporation. Prior to this, he was the Director & Chairman of PNOC-EC from 2005-2008. He was appointed director of Citystate Savings Bank, Inc. on February 28, 2012.

SEC Form 17-IS December 2003
11
He was nominated as independent director by Amb. Antonio L. Cabangon Chua, Chairman of the Nomination Committee not in any manner related to the nominee. Significant Employees Other than the officers and employees reported, there are no significant employees expected by the registrant to make significant contribution to the business. Family Relationships Antonio L. Cabangon Chua is the father of siblings D. Alfred A. Cabangon, D. Arnold A. Cabangon, J. Wilfredo A. Cabangon and J. Antonio A. Cabangon, Jr. Involvement in Certain Legal Proceedings No directors of the registrant are currently involved in legal proceedings during the past 5 years in any of the following cases.
a. Bankruptcy Petition b. Conviction by Final Judgment c. Being Subject to any Order, Judgment or Decree d. Violation of Securities Law
No director has resigned nor declined to stand for re-election due to disagreement with the registrant. Recent Sales of Unregistered Securities The Bank has not sold any unregistered securities for the past 3 years and therefore it has nothing to disclose under this Section of this report. Certain Relationships and Related Transactions In the ordinary course of business, the Bank has loan transactions with its affiliates and with certain directors, officers, stockholders and other related interests (DOSRI). Under the existing policies of the Bank, these loans are made substantially the same terms as loans to other individuals and business comparable risks. The General Banking Act of the BSP regulations limit the amount of the loans granted by a Bank to each affiliate 25% of capital funds. The amount of individual loans to DOSRI, of which 70% must be secured, should not exceed the amount of their deposits and the book value of their investments in the Bank. In the aggregate, loans to DOSRI generally should not exceed the total capital funds or 15% of the total loan portfolio of the Bank, whichever is lower.
Transactions with Related Parties 1. GENCARS, INC. This company has existing credit line with the Bank secured by Trust Receipts, Deed of Assignments over
existing and future inventory/ies of all vehicles allocated/delivered by Isuzu Philippines, Continuing Suretyship of Antonio L. Cabangon Chua for the full amount of the line.
Gencars, Inc. is chaired by Antonio L. Cabangon Chua who controls 19% of the company’s shares, while his son J. Wilfredo A. Cabangon owns 10%. The President of Gencars, Inc., D. Edgard A. Cabangon, is the son of Antonio L. Cabangon Chua and the brother of Wilfredo A. Cabangon and D. Alfred A. Cabangon.
2. BROWN MADONNA PRESS, INC.
This company has an existing loan secured by Real Estate Mortgage with a term of one (1) year, which will mature on April 29, 2013
Brown Madonna Press, Inc. is chaired by Antonio L. Cabangon who owns 20% of total shares. The other
SEC Form 17-IS December 2003
12
shares owned by T. Anthony C. Cabangon, D. Antoinette C. Cabangon, D. Adrian C. Cabangon, and D. Analyn C. Cabangon who represents 20% of the shares each, are related to Antonio L. Cabangon Chua by second degree consanguinity.
3. ETERNAL GARDENS MEMORIAL PARK CORPORATION
This company has an existing loan secured by Real Estate Mortgage which will mature on December 30, 2030. Antonio L. Cabangon Chua owns 10% of the shares of Eternal Garden Memorial Park Corporation. The following are related to him by second degree of consanguinity, J. Wilfredo A. Cabangon, D. Alfred A Cabangon, D. Edward A. Cabangon, D. Edgard A. Cabangon, and D. Antoinette C. Cabangon, owns 10% of the total shares each. Antonio L. Cabangon Chua, J. Wilfredo A. Cabangon, and D. Alfred A Cabangon are also Directors of the Bank.
4. FILIPINAS PAWNSHOP, INC.
The Bank leases its Paco and Guadalupe branch from Filipinas Pawnshop, Inc. Antonio L. Cabangon Chua owns 30% of the company’s total shares.
5. ALC BALIWAG CINEMA & SHOPPING COMPLEX, INC.
The Bank leases its Baliuag branch from ALC Baliwag Cinema & Shopping Complex, Inc. Antonio L. Cabangon Chua owns 60% of this company, D. Edward A. Cabangon owns 25% of the shares, while J. Wilfredo A. Cabangon, D. Alfred A. Cabangon and D. Arnold A. Cabangon own 5% of the total shares each.
6. ALC REALTY DEVELOPMENT CORPORATION The Bank leases its Chino Roces, New Panaderos and Pasay/Libertad branches from ALC Realty Development Corporation. Antonio L. Cabangon Chua owns 44% of the company’s total shares; J. Wilfredo A. Cabangon owns 28% and T. Anthony C. Cabangon who is related by second degree of consanguinity to the former owns 28% of the total shares.
7. ALIW CINEMA COMPLEX, INC.
The bank leases its Meycauayan branch from Aliw Cinema Complex, Inc. Antonio L. Cabangon Chua owns 10% of the company’s total shares, while his sons, J. Wilfredo A. Cabangon, D. Edward A. Cabangon, D. Edgard A. Cabangon, D. Alfred A. Cabangon, J. Antonio A. Cabangon, and D. Arnold A. Cabangon own 15% of the total shares each.
8. CITYSTATE TOWER HOTEL, INC.
The Bank leases its A. Mabini branch from Citystate Tower Hotel, Inc. Antonio L. Cabangon Chua owns 60% of the company’s total shares, while his sons, J. Wilfredo A. Cabangon, D. Edward A. Cabangon, D. Edgard A. Cabangon, D. Alfred A. Cabangon, J. Antonio A. Cabangon, and D. Arnold A. Cabangon own 8% of the total shares each.
9. FORTUNE LIFE INSURANCE COMPANY Fortune Life Insurance Corporation is a stockholder of the Bank, with an aggregate share of 10.3%. D. Arnold A. Cabangon is the President of the company.
Subsidiaries and Affiliates The Bank has a number of affiliated or sister companies, most of which belong to ALC Group of Companies.
For some of its products and services, the Bank has tie-ups and has established working relationships with its affiliated and sister companies that provide its customers with discounts and free services from these companies.
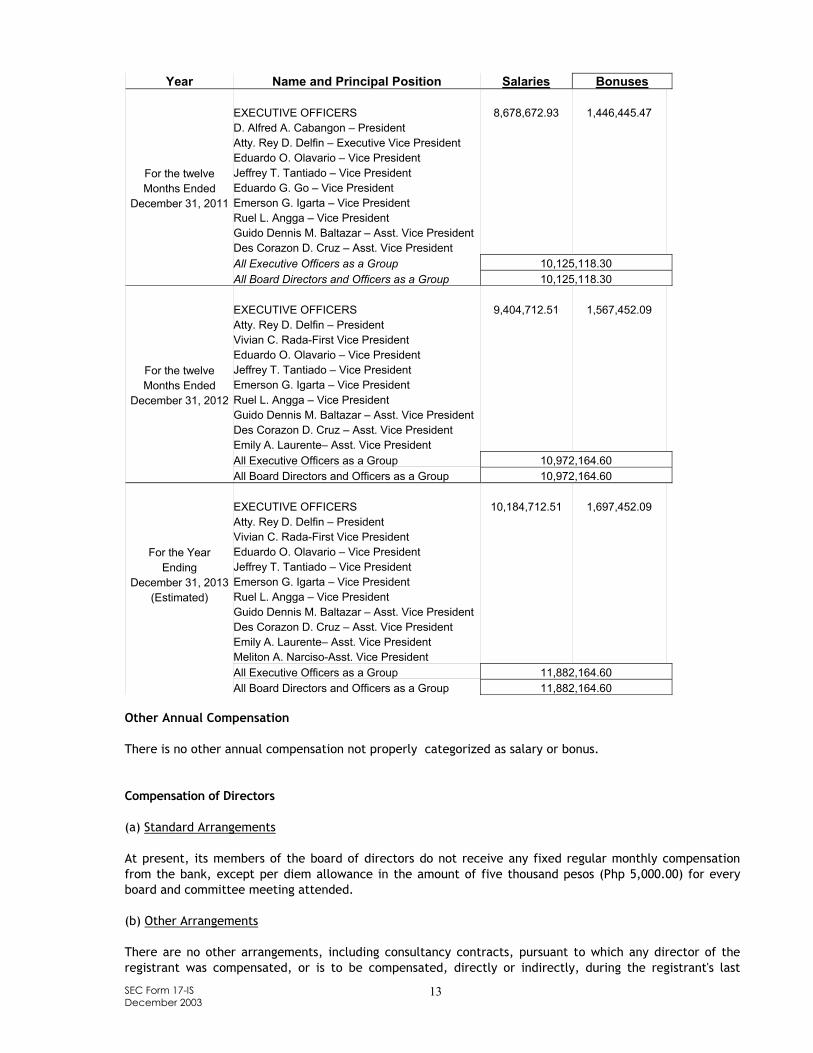
Compensation of Directors and Executive Officers The following table summarizes the aggregate compensation of the executive officers of the Bank for the period ended December 31, 2011 to December 31, 2012 (with estimate for year 2013).
SEC Form 17-IS December 2003
13
Year Name and Principal Position Salaries Bonuses
For the twelve Months Ended
December 31, 2011
EXECUTIVE OFFICERS D. Alfred A. Cabangon – President Atty. Rey D. Delfin – Executive Vice President Eduardo O. Olavario – Vice President Jeffrey T. Tantiado – Vice President Eduardo G. Go – Vice President Emerson G. Igarta – Vice President Ruel L. Angga – Vice President Guido Dennis M. Baltazar – Asst. Vice President Des Corazon D. Cruz – Asst. Vice President
8,678,672.93
1,446,445.47
All Executive Officers as a Group 10,125,118.30 All Board Directors and Officers as a Group 10,125,118.30
For the twelve Months Ended
December 31, 2012
EXECUTIVE OFFICERS Atty. Rey D. Delfin – President Vivian C. Rada-First Vice President Eduardo O. Olavario – Vice President Jeffrey T. Tantiado – Vice President Emerson G. Igarta – Vice President Ruel L. Angga – Vice President Guido Dennis M. Baltazar – Asst. Vice President Des Corazon D. Cruz – Asst. Vice President Emily A. Laurente– Asst. Vice President
9,404,712.51
1,567,452.09
All Executive Officers as a Group 10,972,164.60 All Board Directors and Officers as a Group 10,972,164.60
For the Year Ending
December 31, 2013 (Estimated)
EXECUTIVE OFFICERS Atty. Rey D. Delfin – President Vivian C. Rada-First Vice President Eduardo O. Olavario – Vice President Jeffrey T. Tantiado – Vice President Emerson G. Igarta – Vice President Ruel L. Angga – Vice President Guido Dennis M. Baltazar – Asst. Vice President Des Corazon D. Cruz – Asst. Vice President Emily A. Laurente– Asst. Vice President Meliton A. Narciso-Asst. Vice President
10,184,712.51
1,697,452.09
All Executive Officers as a Group 11,882,164.60 All Board Directors and Officers as a Group 11,882,164.60
Other Annual Compensation There is no other annual compensation not properly categorized as salary or bonus. Compensation of Directors (a) Standard Arrangements At present, its members of the board of directors do not receive any fixed regular monthly compensation from the bank, except per diem allowance in the amount of five thousand pesos (Php 5,000.00) for every board and committee meeting attended. (b) Other Arrangements There are no other arrangements, including consultancy contracts, pursuant to which any director of the registrant was compensated, or is to be compensated, directly or indirectly, during the registrant's last
SEC Form 17-IS December 2003
14
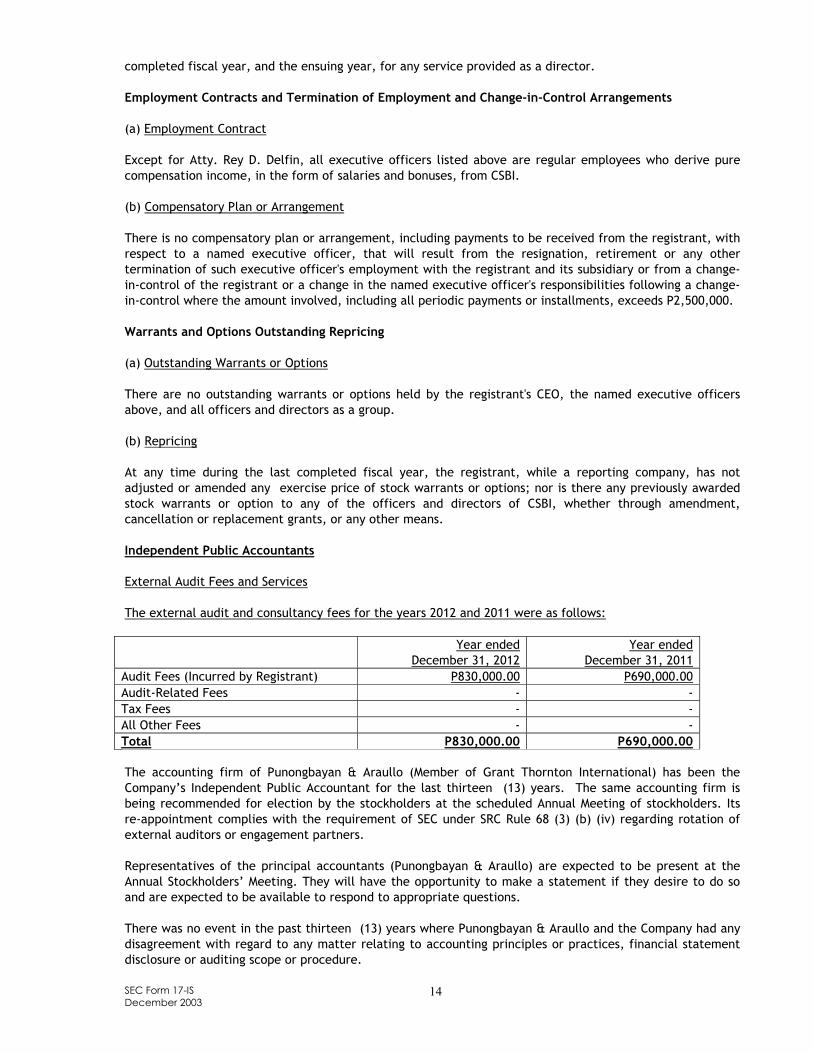
completed fiscal year, and the ensuing year, for any service provided as a director. Employment Contracts and Termination of Employment and Change-in-Control Arrangements (a) Employment Contract Except for Atty. Rey D. Delfin, all executive officers listed above are regular employees who derive pure compensation income, in the form of salaries and bonuses, from CSBI. (b) Compensatory Plan or Arrangement There is no compensatory plan or arrangement, including payments to be received from the registrant, with respect to a named executive officer, that will result from the resignation, retirement or any other termination of such executive officer's employment with the registrant and its subsidiary or from a change-in-control of the registrant or a change in the named executive officer's responsibilities following a change-in-control where the amount involved, including all periodic payments or installments, exceeds P2,500,000. Warrants and Options Outstanding Repricing (a) Outstanding Warrants or Options There are no outstanding warrants or options held by the registrant's CEO, the named executive officers above, and all officers and directors as a group. (b) Repricing At any time during the last completed fiscal year, the registrant, while a reporting company, has not adjusted or amended any exercise price of stock warrants or options; nor is there any previously awarded stock warrants or option to any of the officers and directors of CSBI, whether through amendment, cancellation or replacement grants, or any other means. Independent Public Accountants External Audit Fees and Services The external audit and consultancy fees for the years 2012 and 2011 were as follows: Year ended
December 31, 2012 Year ended
December 31, 2011 Audit Fees (Incurred by Registrant) P830,000.00 P690,000.00 Audit-Related Fees - - Tax Fees - - All Other Fees - - Total P830,000.00 P690,000.00 The accounting firm of Punongbayan & Araullo (Member of Grant Thornton International) has been the Company’s Independent Public Accountant for the last thirteen (13) years. The same accounting firm is being recommended for election by the stockholders at the scheduled Annual Meeting of stockholders. Its re-appointment complies with the requirement of SEC under SRC Rule 68 (3) (b) (iv) regarding rotation of external auditors or engagement partners. Representatives of the principal accountants (Punongbayan & Araullo) are expected to be present at the Annual Stockholders’ Meeting. They will have the opportunity to make a statement if they desire to do so and are expected to be available to respond to appropriate questions. There was no event in the past thirteen (13) years where Punongbayan & Araullo and the Company had any disagreement with regard to any matter relating to accounting principles or practices, financial statement disclosure or auditing scope or procedure.
SEC Form 17-IS December 2003
15
As a policy, the Audit Committee makes recommendations to the Board of Directors concerning the choice of external auditor and pre-approves audit plans, scope and frequency before the audit is conducted. Audit services of external auditors for the years 2012 and 2011 were pre-approved by the Audit Committee. The Committee also reviewed the extent and nature of these services to ensure that the independence of the external auditors is preserved. The Bank’s Audit Committee are as follows: Chairman: Lucito L. Sioson (Independent Director) Andres Y. Narvasa, Jr. (Independent Director) J. Wilfredo A. Cabangon Engr. Feorelio M. Bote Pedro E. Paraiso C. ISSUANCE AND EXCHANGE OF SECURITIES Authorization or Issuance of Securities Other than for Exchange Not Applicable. Financial and Other Information Management’s Discussion and Analysis or Plan/Result of Operation Management’s Discussion and Analysis or Plan of Operation of the Company is attached hereto as “Annex A”. Financial Statements The Financial Statements and the Auditors’ PTR, name of certifying partner and address are attached to this Information Statement as “Annex B”. D. OTHER MATTERS Action with Respect to Reports Action to be taken will constitute reading and approval of the minutes of the previous stockholders’ meeting, approval of the report for the year ended December 31, 2012 and ratification of all acts, proceedings and resolutions of the Board of Directors, the Management Committee and the acts of the officers and management for the year 2012, details of which are hereto attached as Annex “C”. Summary of the Minutes of the 2012 Stockholders’ Meeting The Chairman, Amb. Antonio L. Cabangon-Chua, called the meeting to order at 9:00A.M. The Corporate Secretary, J. Antonio A. Cabangon, Jr., certified that the Notice of the Annual Stockholders’ Meeting was sent to all stockholders in good standing fifteen (15) business days prior to the date of the meeting as required under paragraph (3) (C) of SRC Rule 20. The Corporate Secretary, J. Antonio A. Cabangon, Jr., announced that the total stockholders physically present and/or represented by proxies sufficiently met the required quorum for the conduct of the meeting. Mr. Andres Y. Narvasa, Jr., Stockholder/Director, took notice of the fact that the copies of the Minutes of the Stockholders’ Meeting held on April 26, 2011 have been previously distributed to the stockholders, and thus, he moved that the reading of the minutes be dispensed with and that the same be approved as circulated.

1
ANNEX “A”
REPORT ACCOMPANYING INFORMATION SHEET REQUIRED UNDER SRC RULE 20
( A ) AUDITED FINANCIAL STATEMENTS
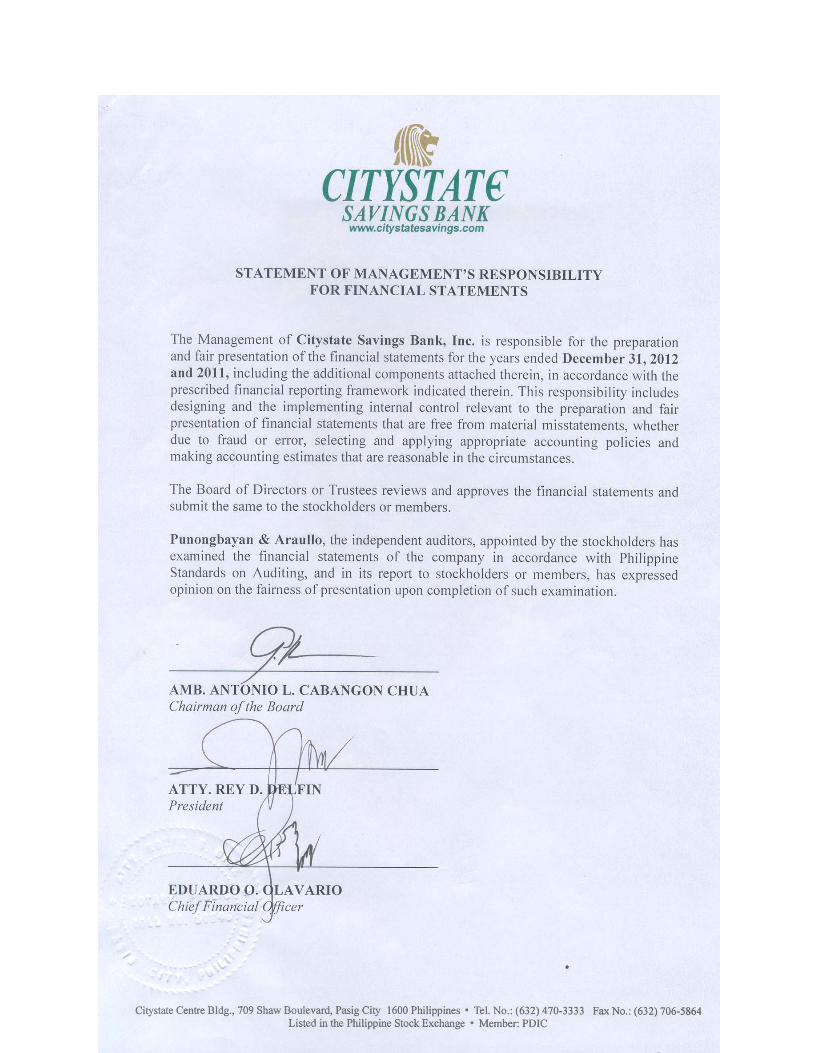
The audited financial statements of the registrant as of December 31, 2012 and the Statement of Management Responsibility for Financial Statements are attached hereto.
( B ) MANAGEMENT DISCUSSION AND ANALYSIS OF FINANCIAL CONDITION AND RESULTS OF
OPERATIONS
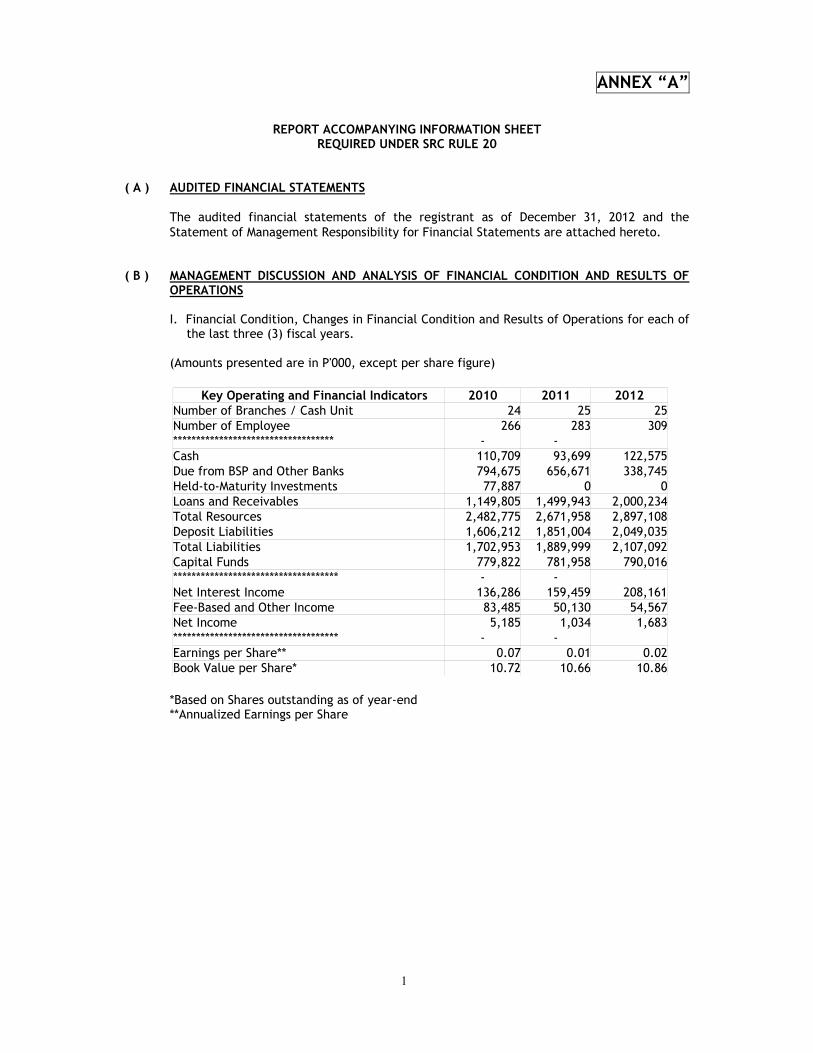
I. Financial Condition, Changes in Financial Condition and Results of Operations for each of the last three (3) fiscal years.
(Amounts presented are in P'000, except per share figure)
Key Operating and Financial Indicators 2010 2011 2012 Number of Branches / Cash Unit 24 25 25Number of Employee 266 283 309*********************************** - - Cash 110,709 93,699 122,575Due from BSP and Other Banks 794,675 656,671 338,745Held-to-Maturity Investments 77,887 0 0Loans and Receivables 1,149,805 1,499,943 2,000,234Total Resources 2,482,775 2,671,958 2,897,108Deposit Liabilities 1,606,212 1,851,004 2,049,035Total Liabilities 1,702,953 1,889,999 2,107,092Capital Funds 779,822 781,958 790,016************************************ - - Net Interest Income 136,286 159,459 208,161Fee-Based and Other Income 83,485 50,130 54,567Net Income 5,185 1,034 1,683************************************ - - Earnings per Share** 0.07 0.01 0.02Book Value per Share* 10.72 10.66 10.86 *Based on Shares outstanding as of year-end **Annualized Earnings per Share
2
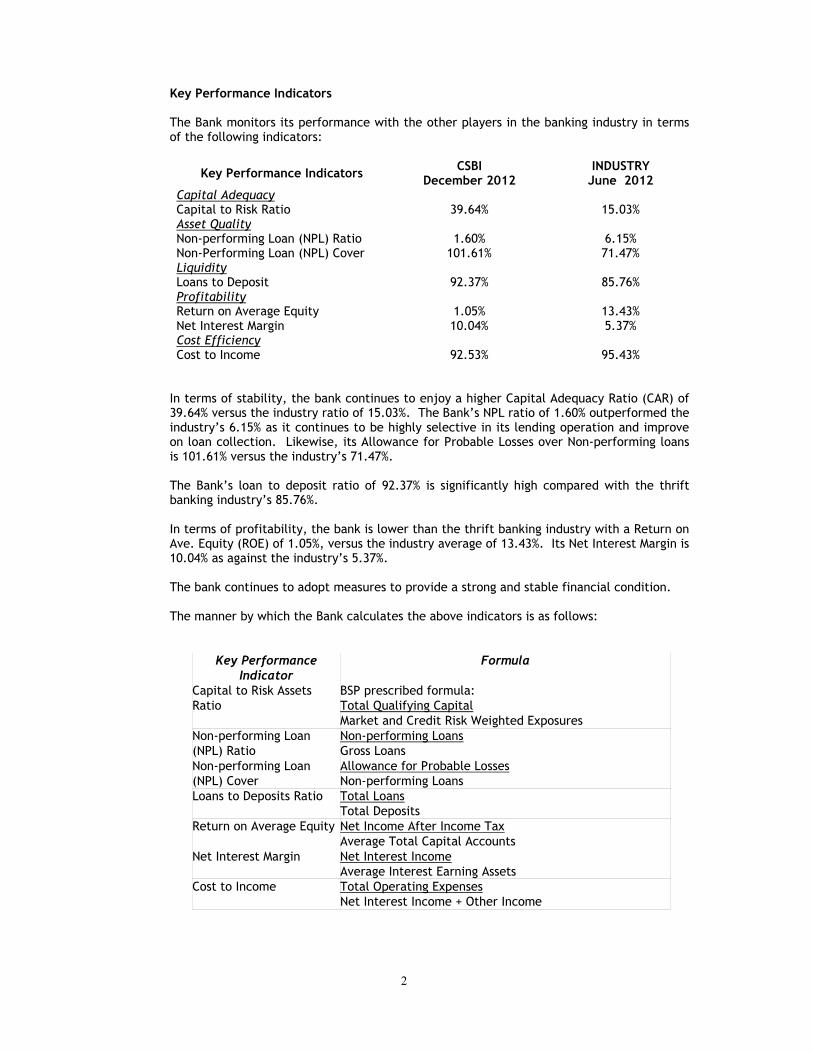
Key Performance Indicators The Bank monitors its performance with the other players in the banking industry in terms of the following indicators:
Key Performance Indicators CSBI December 2012
INDUSTRY June 2012
Capital Adequacy Capital to Risk Ratio
39.64%
15.03%
Asset Quality Non-performing Loan (NPL) Ratio
1.60%
6.15%
Non-Performing Loan (NPL) Cover 101.61% 71.47% Liquidity Loans to Deposit
92.37%
85.76%
Profitability Return on Average Equity
1.05%
13.43%
Net Interest Margin 10.04% 5.37% Cost Efficiency Cost to Income
92.53%
95.43%
In terms of stability, the bank continues to enjoy a higher Capital Adequacy Ratio (CAR) of 39.64% versus the industry ratio of 15.03%. The Bank’s NPL ratio of 1.60% outperformed the industry’s 6.15% as it continues to be highly selective in its lending operation and improve on loan collection. Likewise, its Allowance for Probable Losses over Non-performing loans is 101.61% versus the industry’s 71.47%. The Bank’s loan to deposit ratio of 92.37% is significantly high compared with the thrift banking industry’s 85.76%. In terms of profitability, the bank is lower than the thrift banking industry with a Return on Ave. Equity (ROE) of 1.05%, versus the industry average of 13.43%. Its Net Interest Margin is 10.04% as against the industry’s 5.37%. The bank continues to adopt measures to provide a strong and stable financial condition. The manner by which the Bank calculates the above indicators is as follows:
Key Performance Indicator
Formula
Capital to Risk Assets Ratio
BSP prescribed formula: Total Qualifying Capital Market and Credit Risk Weighted Exposures
Non-performing Loan (NPL) Ratio
Non-performing Loans Gross Loans
Non-performing Loan (NPL) Cover
Allowance for Probable Losses Non-performing Loans
Loans to Deposits Ratio Total Loans Total Deposits
Return on Average Equity Net Income After Income Tax Average Total Capital Accounts
Net Interest Margin Net Interest Income Average Interest Earning Assets
Cost to Income Total Operating Expenses Net Interest Income + Other Income
3
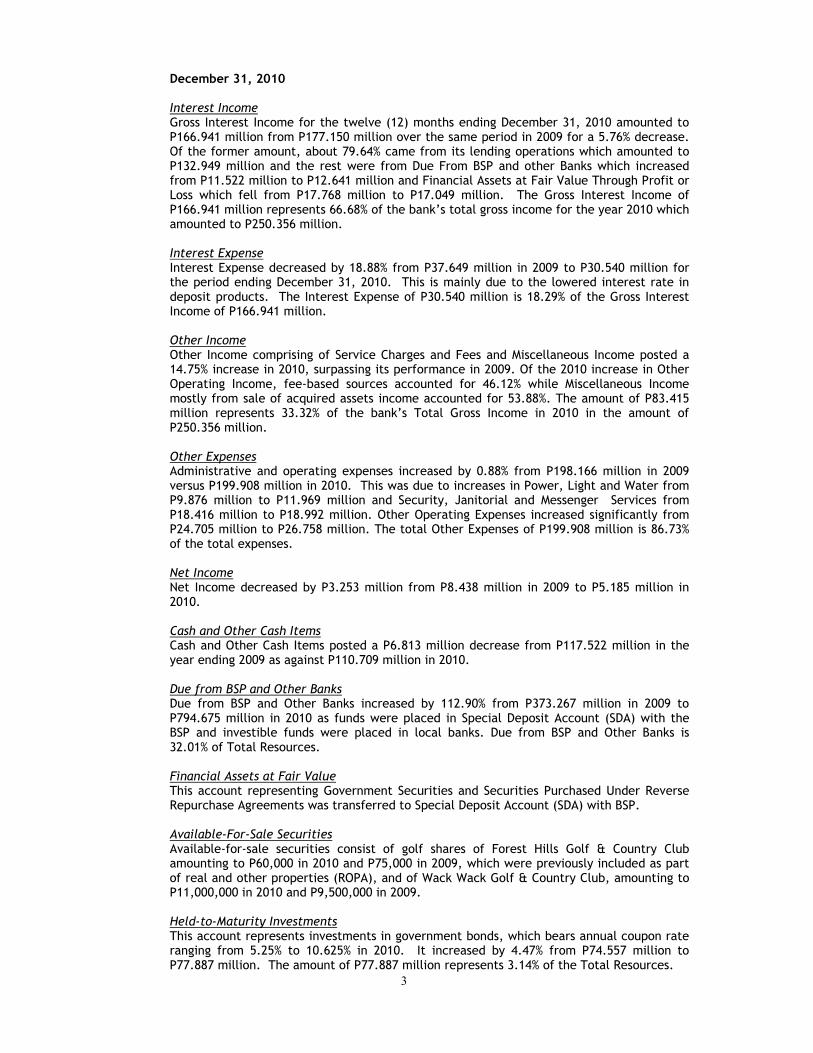
December 31, 2010 Interest Income Gross Interest Income for the twelve (12) months ending December 31, 2010 amounted to P166.941 million from P177.150 million over the same period in 2009 for a 5.76% decrease. Of the former amount, about 79.64% came from its lending operations which amounted to P132.949 million and the rest were from Due From BSP and other Banks which increased from P11.522 million to P12.641 million and Financial Assets at Fair Value Through Profit or Loss which fell from P17.768 million to P17.049 million. The Gross Interest Income of P166.941 million represents 66.68% of the bank’s total gross income for the year 2010 which amounted to P250.356 million. Interest Expense Interest Expense decreased by 18.88% from P37.649 million in 2009 to P30.540 million for the period ending December 31, 2010. This is mainly due to the lowered interest rate in deposit products. The Interest Expense of P30.540 million is 18.29% of the Gross Interest Income of P166.941 million. Other Income Other Income comprising of Service Charges and Fees and Miscellaneous Income posted a 14.75% increase in 2010, surpassing its performance in 2009. Of the 2010 increase in Other Operating Income, fee-based sources accounted for 46.12% while Miscellaneous Income mostly from sale of acquired assets income accounted for 53.88%. The amount of P83.415 million represents 33.32% of the bank’s Total Gross Income in 2010 in the amount of P250.356 million. Other Expenses Administrative and operating expenses increased by 0.88% from P198.166 million in 2009 versus P199.908 million in 2010. This was due to increases in Power, Light and Water from P9.876 million to P11.969 million and Security, Janitorial and Messenger Services from P18.416 million to P18.992 million. Other Operating Expenses increased significantly from P24.705 million to P26.758 million. The total Other Expenses of P199.908 million is 86.73% of the total expenses. Net Income Net Income decreased by P3.253 million from P8.438 million in 2009 to P5.185 million in 2010. Cash and Other Cash Items Cash and Other Cash Items posted a P6.813 million decrease from P117.522 million in the year ending 2009 as against P110.709 million in 2010. Due from BSP and Other Banks Due from BSP and Other Banks increased by 112.90% from P373.267 million in 2009 to P794.675 million in 2010 as funds were placed in Special Deposit Account (SDA) with the BSP and investible funds were placed in local banks. Due from BSP and Other Banks is 32.01% of Total Resources. Financial Assets at Fair Value This account representing Government Securities and Securities Purchased Under Reverse Repurchase Agreements was transferred to Special Deposit Account (SDA) with BSP. Available-For-Sale Securities Available-for-sale securities consist of golf shares of Forest Hills Golf & Country Club amounting to P60,000 in 2010 and P75,000 in 2009, which were previously included as part of real and other properties (ROPA), and of Wack Wack Golf & Country Club, amounting to P11,000,000 in 2010 and P9,500,000 in 2009.
Held-to-Maturity Investments This account represents investments in government bonds, which bears annual coupon rate ranging from 5.25% to 10.625% in 2010. It increased by 4.47% from P74.557 million to P77.887 million. The amount of P77.887 million represents 3.14% of the Total Resources.
4
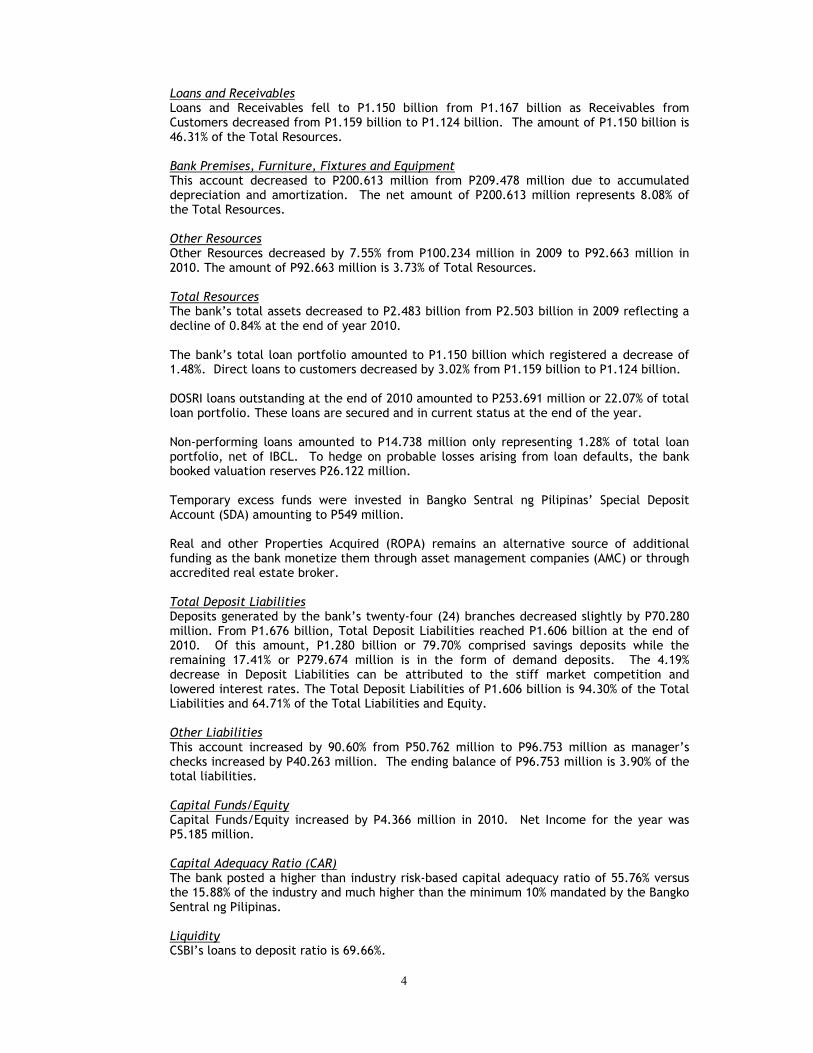
Loans and Receivables Loans and Receivables fell to P1.150 billion from P1.167 billion as Receivables from Customers decreased from P1.159 billion to P1.124 billion. The amount of P1.150 billion is 46.31% of the Total Resources. Bank Premises, Furniture, Fixtures and Equipment This account decreased to P200.613 million from P209.478 million due to accumulated depreciation and amortization. The net amount of P200.613 million represents 8.08% of the Total Resources. Other Resources Other Resources decreased by 7.55% from P100.234 million in 2009 to P92.663 million in 2010. The amount of P92.663 million is 3.73% of Total Resources. Total Resources The bank’s total assets decreased to P2.483 billion from P2.503 billion in 2009 reflecting a decline of 0.84% at the end of year 2010. The bank’s total loan portfolio amounted to P1.150 billion which registered a decrease of 1.48%. Direct loans to customers decreased by 3.02% from P1.159 billion to P1.124 billion. DOSRI loans outstanding at the end of 2010 amounted to P253.691 million or 22.07% of total loan portfolio. These loans are secured and in current status at the end of the year. Non-performing loans amounted to P14.738 million only representing 1.28% of total loan portfolio, net of IBCL. To hedge on probable losses arising from loan defaults, the bank booked valuation reserves P26.122 million. Temporary excess funds were invested in Bangko Sentral ng Pilipinas’ Special Deposit Account (SDA) amounting to P549 million. Real and other Properties Acquired (ROPA) remains an alternative source of additional funding as the bank monetize them through asset management companies (AMC) or through accredited real estate broker. Total Deposit Liabilities Deposits generated by the bank’s twenty-four (24) branches decreased slightly by P70.280 million. From P1.676 billion, Total Deposit Liabilities reached P1.606 billion at the end of 2010. Of this amount, P1.280 billion or 79.70% comprised savings deposits while the remaining 17.41% or P279.674 million is in the form of demand deposits. The 4.19% decrease in Deposit Liabilities can be attributed to the stiff market competition and lowered interest rates. The Total Deposit Liabilities of P1.606 billion is 94.30% of the Total Liabilities and 64.71% of the Total Liabilities and Equity. Other Liabilities This account increased by 90.60% from P50.762 million to P96.753 million as manager’s checks increased by P40.263 million. The ending balance of P96.753 million is 3.90% of the total liabilities. Capital Funds/Equity Capital Funds/Equity increased by P4.366 million in 2010. Net Income for the year was P5.185 million. Capital Adequacy Ratio (CAR) The bank posted a higher than industry risk-based capital adequacy ratio of 55.76% versus the 15.88% of the industry and much higher than the minimum 10% mandated by the Bangko Sentral ng Pilipinas. Liquidity CSBI’s loans to deposit ratio is 69.66%.
5
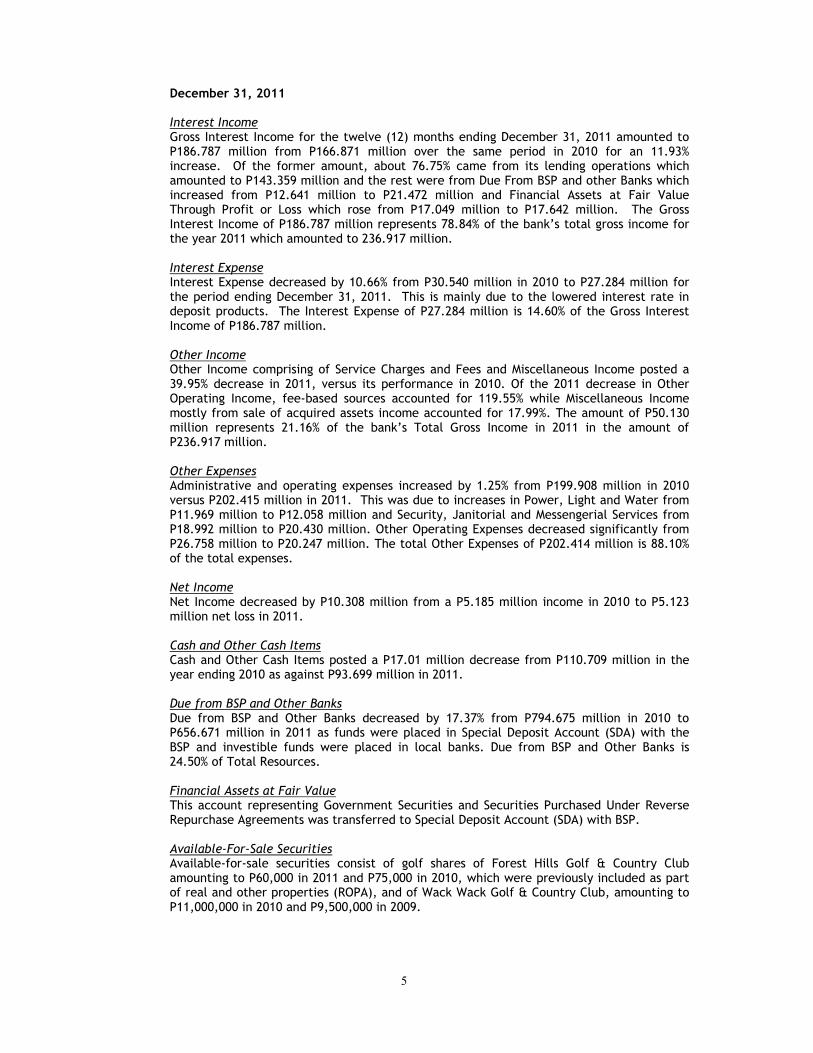
December 31, 2011 Interest Income Gross Interest Income for the twelve (12) months ending December 31, 2011 amounted to P186.787 million from P166.871 million over the same period in 2010 for an 11.93% increase. Of the former amount, about 76.75% came from its lending operations which amounted to P143.359 million and the rest were from Due From BSP and other Banks which increased from P12.641 million to P21.472 million and Financial Assets at Fair Value Through Profit or Loss which rose from P17.049 million to P17.642 million. The Gross Interest Income of P186.787 million represents 78.84% of the bank’s total gross income for the year 2011 which amounted to 236.917 million. Interest Expense Interest Expense decreased by 10.66% from P30.540 million in 2010 to P27.284 million for the period ending December 31, 2011. This is mainly due to the lowered interest rate in deposit products. The Interest Expense of P27.284 million is 14.60% of the Gross Interest Income of P186.787 million. Other Income Other Income comprising of Service Charges and Fees and Miscellaneous Income posted a 39.95% decrease in 2011, versus its performance in 2010. Of the 2011 decrease in Other Operating Income, fee-based sources accounted for 119.55% while Miscellaneous Income mostly from sale of acquired assets income accounted for 17.99%. The amount of P50.130 million represents 21.16% of the bank’s Total Gross Income in 2011 in the amount of P236.917 million. Other Expenses Administrative and operating expenses increased by 1.25% from P199.908 million in 2010 versus P202.415 million in 2011. This was due to increases in Power, Light and Water from P11.969 million to P12.058 million and Security, Janitorial and Messengerial Services from P18.992 million to P20.430 million. Other Operating Expenses decreased significantly from P26.758 million to P20.247 million. The total Other Expenses of P202.414 million is 88.10% of the total expenses. Net Income Net Income decreased by P10.308 million from a P5.185 million income in 2010 to P5.123 million net loss in 2011. Cash and Other Cash Items Cash and Other Cash Items posted a P17.01 million decrease from P110.709 million in the year ending 2010 as against P93.699 million in 2011. Due from BSP and Other Banks Due from BSP and Other Banks decreased by 17.37% from P794.675 million in 2010 to P656.671 million in 2011 as funds were placed in Special Deposit Account (SDA) with the BSP and investible funds were placed in local banks. Due from BSP and Other Banks is 24.50% of Total Resources. Financial Assets at Fair Value This account representing Government Securities and Securities Purchased Under Reverse Repurchase Agreements was transferred to Special Deposit Account (SDA) with BSP. Available-For-Sale Securities Available-for-sale securities consist of golf shares of Forest Hills Golf & Country Club amounting to P60,000 in 2011 and P75,000 in 2010, which were previously included as part of real and other properties (ROPA), and of Wack Wack Golf & Country Club, amounting to P11,000,000 in 2010 and P9,500,000 in 2009.
6
Held-to-Maturity Investments This account represents investments in government bonds, which bears annual coupon rate ranging from 5.25% to 10.625% in 2010. It increased by 4.47% from P74.557 million to P77.887 million. The amount of P77.887 million represents 3.14% of the Total Resources. Loans and Receivables Loans and Receivables increased to P1.512 billion from P1.149 billion as Receivables from Customers decreased from P1.159 billion to P1.124 billion. The amount of P1.150 billion is 56.44% of the Total Resources. Bank Premises, Furniture, Fixtures and Equipment This account decreased to P186.980 million from P200.613 million due to accumulated depreciation and amortization. The net amount of P186.980 million represents 6.98% of the Total Resources. Other Resources Other Resources decreased by 7.55% from P92.682 million in 2010 to P87.622 million in 2011. The amount of P87.622 million is 3.27% of Total Resources. Total Deposit Liabilities Deposits generated by the bank’s twenty-five (25) branches increased by P244.792 million. From P1.606 billion, Total Deposit Liabilities reached P1.851 billion at the end of 2011. Of this amount, P1.580 billion or 85.37% comprised savings deposits while the remaining 12.26% or P227.017 million is in the form of demand deposits. The 18.83% decrease in Deposit Liabilities can be attributed to the stiff market competition and lowered interest rates. The Total Deposit Liabilities of P1.851 billion is 97.21% of the Total Liabilities and 69.07% of the Total Liabilities and Equity. Other Liabilities This account decreased by 44.99% from P96.741 million to P53.213 million as manager’s checks increased by P43.527 million. The ending balance of P53.213 million is 2.79% of the total liabilities. Capital Funds/Equity Capital Funds/Equity decresed by P4.021 million in 2011. Net Loss for the year was P5.123 million. Capital Adequacy Ratio (CAR) The bank posted a higher than industry risk-based capital adequacy ratio of 54.62% versus the 14.83% of the industry and much higher than the minimum 10% mandated by the Bangko Sentral ng Pilipinas. Liquidity CSBI’s loans to deposit ratio is 79.38%.
December 31, 2012 Interest Income Gross Interest Income ended higher than prior year by 26.48% or P49.462 million on account of significant improvement and income on jewelry loan related and other Bank's lending related activities during the period. Interest Income on Loans Receivable climbed to P217.338 million, 34.99% much better than the P161.001 million recorded last year as a result of the steady growth in the Bank's loan portfolio. Likewise, Available for Sale Securities rose from P1.278 million to P5.217 million. On the other hand, interest income on Due from BSP and Other Banks was lower at P13.694 million versus P21.472 million a year ago. Interest income on Held to Maturity declined to P0.00 due to maturities of various placements.The Gross Interest Income of P236.249 million represents 81.24% of the Bank’s total gross income for the year 2012 which amounted to 290.816 million.
7
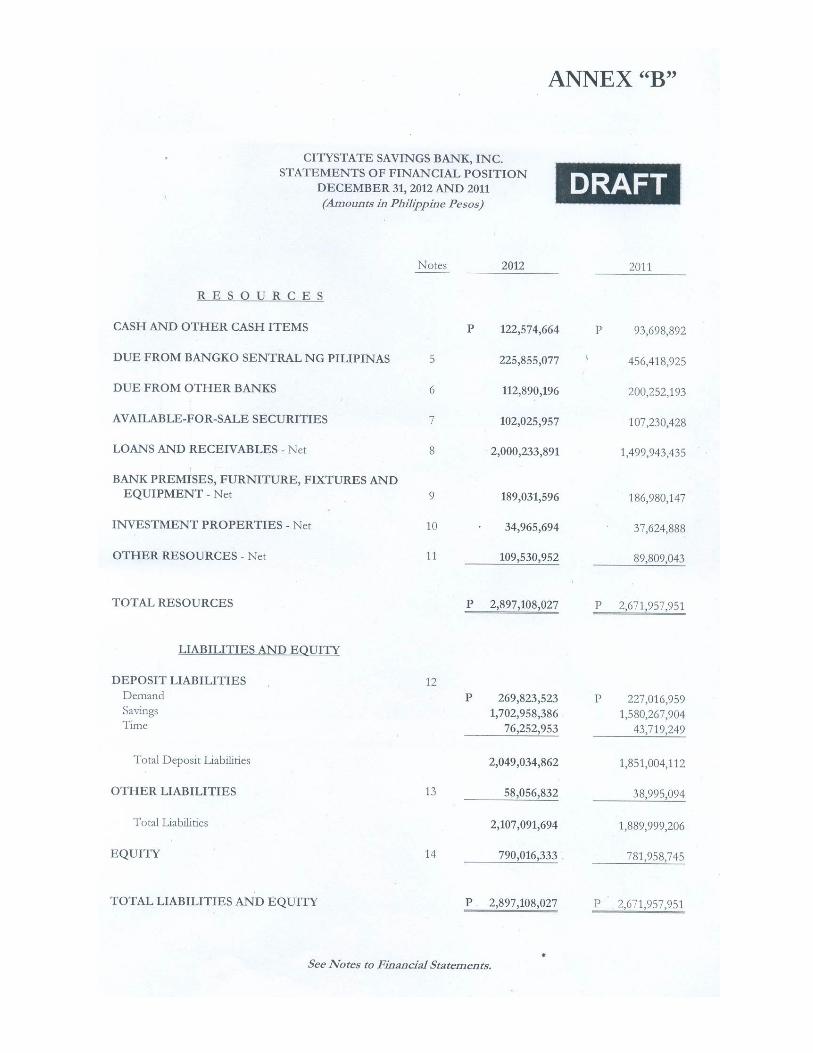
Interest Expense Interest Expense on the Bank's deposit liabilities was higher by 2.27% at P27.904 million versus last year’s P27.284 million on account of higher deposit level. The Interest Expense of P27.904 million is 11.81% of the Gross Interest Income of P236.249 million. Other Income Other Income comprising of Service Charges and Fees,Trading Gains and Miscellaneous Income posted a 7.77% increase in 2012 versus its performance in 2011. Of the 2012 increase in Other Operating Income, fee-based sources accounted for 9.38%, Trading Gains moderately increased by 0.28% from P2.040 million in 2011 versus P2.045 million in 2012 while Miscellaneous Income posted an increase of 17.95%. The amount of P54.567 million represents 18.76% of the bank’s Total Gross Income in 2012 in the amount of P290.816 million. Other Expenses As of December 31, 2012, the Total Other Expenses increased by P41.339 million from P201.769 million versus last year’s figure of P243.108 million. This was mainly due to increases in Repairs and Maintenance which increased by 35.47% from P3.323 million last year versus P4.502 million this year. Employee Benefits from P68.208 million to P88.124 million or an increase of 29.20%. Fuel and Oil increased by P26.71% from P5.781 million to P7.325 million while Security, Janitorial and Messenger Services from P20.430 million to P25.525 million. Likewise, Taxes and Licenses increased from P12.183 million to P13.984 million, while Communication, Light and Water increased by 14.44% from P19.512 million to P22.330 million, Occupancy from P24.582 million to P26.073 million. Other operating expenses amounted to P24.039 from P16.278 million last year and Repairs and Maintenance increased by 35.47% from P3.323 million last year versus P4.502 million this year. However, Litigation / Assets Acquired decreased by 26.18% and Depreciation and Amortization lowered by 12.75% from P17.0330 million to P15.120 million. Net Income The Bank’s Net Income for the year increased to P1.683 million compared to last year’s bottom line of P1.034 million. Cash and Other Cash Items Cash and Other Cash items up by 30.82% from P93.699 million in the year ending 2011 as against P122.575 million in 2012. Due from BSP and Other Banks Due from BSP and Other Banks decreased by 93.85% from P656.671 million in 2011 to P338.745 million in 2012 as funds were placed in Special Deposit Account (SDA) with the BSP and investible funds were placed in local banks. Due from BSP and Other Banks is 11.69% of Total Resources Available-For-Sale Securities Available-for-Sale Investments representing 3.52% of total assets decreased by 4.85% from P107.230 million to P102.026 million in 2012. Loans and Receivables Loans and Receivables grew by 32.24% to P2.000 billion from P1.513 billion in 2011. The amount of P2.000 billion is 69.04% of Total Resources. Bank Premises, Furniture, Fixtures and Equipment This account increased to P189.032 million from P186.980 million due to accumulated depreciation and amortization. The net amount of P189.032 million represents 6.52% of the Total Resources. Other Resources Other Resources increased by 25.00% from P87.622 million in 2011 to P109.531 million in 2012. The amount of P109.531 million is 3.78% of Total Resources.
8
Total Deposit Liabilities Deposits generated by the Bank’s twenty-five (25) branches increased by P198.031 million. From P1.851 billion, Total Deposit Liabilities reached P2.049 billion at the end of 2012. Of this amount, P1.703 billion or 83.11% comprised savings deposits while the remaining 13.17% or P269.824 million is in the form of demand deposits. The 18.86% increase in Deposit Liabilities can be attributed to the Bank’s aggressive marketing strategy. The Total Deposit Liabilities of P2.049 billion is 97.24% of the Total Liabilities and 70.73% of the Total Liabilities and Equity. Other Liabilities This account increased by 9.10% from P53.213 million to P58.057 million as manager’s checks increased by P4.844 million. The ending balance of P58.057 million is 2.76% of the total liabilities. Capital Funds/Equity Capital Funds/Equity increased by P14.215 million in 2012. Net Income for the year was P1.683 million. Capital Adequacy Ratio (CAR) The bank posted a higher than industry risk-based capital adequacy ratio of 39.64% versus the 15.03% of the industry and much higher than the minimum 10% mandated by the Bangko Sentral ng Pilipinas. Liquidity CSBI’s loans to deposit ratio is 92.37%. Other known Trends, Demands, Commitments, Events or Uncertainties There are no other known trends or any other known demands, commitments, events or uncertainties that will result in or that are reasonably likely to result in the registrant's liquidity increasing or decreasing in any material way. The registrant is not having or does not anticipate having within the next twelve (12) months any cash flow or liquidity problems. The registrant is not in default nor in breach of any note, loan, lease or other indebtedness or financing arrangement requiring it to make payments. There is no significant amount of trade payables that have not been paid within the stated trade terms. There is likewise no material deficiency that can be identified. There are no known trends, events or uncertainties that have had or that are reasonably expected to have a material, favorable or unfavorable, impact on revenues or income from continuing operations. Material Commitments for Capital Expenditures There are no material commitments for capital expenditures. Significant Elements of Income or Loss There are no significant elements of income or loss that did not arise from the registrant's continuing operations. Other Key Variable and Qualitative/Quantitative Factors As to any seasonal aspects that may have material effect on the financial condition or result of operations, the registrant is not affected by the current worries on peso-dollar exchange, as the bank has no exposure on any foreign currency related transactions. There are no events that would trigger direct or contingent financial obligation that is material to the company, including any default or acceleration of an obligation. No material off-balance sheet transaction, arrangement, obligations (including contingent obligations), and other relationships of the company with unconsolidated entities or other persons are created during the reporting period.

9
Past and Future Financial Condition and Results of Operation with particular emphasis on the prospects for the future. The Philippines has remained resilient to the effects of uncertainties in the global economy than most other countries in the ASEAN region on the back of strong domestic demand and diversified exports. With a gross domestic product (GDP) of 7.1 percent in the third quarter of 2012, the Philippines outperformed most its neighboring countries. The 6.5-percent figure was also much closer to the country’s aspirational target of 7 to 8-percent annual real GDP growth. For 2013, Citystate Savings Bank will open additional provincial branches. The Bank's clients could look forward to more innovative, competitive and customized products and services. The bank’s deposit base anchored on retail banking is consistently increasing thereby maintaining an above average level of liquidity while it selectively appropriates its excess loanable funds. The Initial Public Offering of the Bank, which had an initial price of P11.55 per share, rose to its present value of P27.00. This remarkable feat is a proof of the public’s trust and confidence with Citystate Savings Bank.
Prospects for the Future
For the year 2013, CSBI will focus on further enhancing its service delivery system through the following action plans:
• Establishment and/or acquisition of additional branch network;
• Upgrading of the bank's core banking system and ATM switch
• Development of more bank products and services in connection with its quasi-banking license;
• Intensify SME lending and jewelry loan operations;
• Pursue a more aggressive marketing strategy and focus on the target market;
• Highly efficient and productive personnel coupled with cost-effective
technology;
• A strong advertising and promotional campaign;
• Reputation of a good service and expertise;
• Effective cost-control. In terms of financial performance and results of operation, the bank is very optimistic to surpass its 2012 performance as it pursues aggressively its marketing strategies to deepen its reach to its target market.
( C ) BRIEF DESCRIPTION OF THE GENERAL NATURE AND SCOPE OF BUSINESS OF THE
REGISTRANT Citystate Savings Bank, Inc. was registered with the Securities and Exchange Commission on
May 2, 1997. The Monetary Board of the Bangko Sentral ng Pilipinas on the other hand, granted the bank a license to operate as Thrift Bank on August 07, 1997. The bank’s Authorized Capital is P1,000,000,000.00 consisting of 100,000,000 common shares, with a par value of P 10.00 per share.
The bank began its commercial operations on August 08, 1997 when it opened its first
branch located in the Dominga Building III, 2113 Chino Roces Avenue corner Dela Rosa
10
Street, Makati City. At present, the bank’s principal office is located at Citystate Centre Building, 709 Shaw Boulevard, Pasig City.
The bank itself provides a wide range of banking and other financial services such as but
not limited to traditional and innovative deposit products and services, cash management, corporate and retail banking, treasury services. The bank caters to the needs of corporate, middle market and retail clients.
On March 4, 2004, the Bangko Sentral ng Pilipinas approved the application of Citystate Savings Bank, Inc. to engage in quasi-banking functions. Pursuant to further enhancing the bank’s delivery system, the Bangko Sentral ng Pilipinas (BSP) authorized CSBI to operate an FCDU and to perform Trust and other fiduciary business on November 08, 2006.
( D ) MARKET INFORMATION
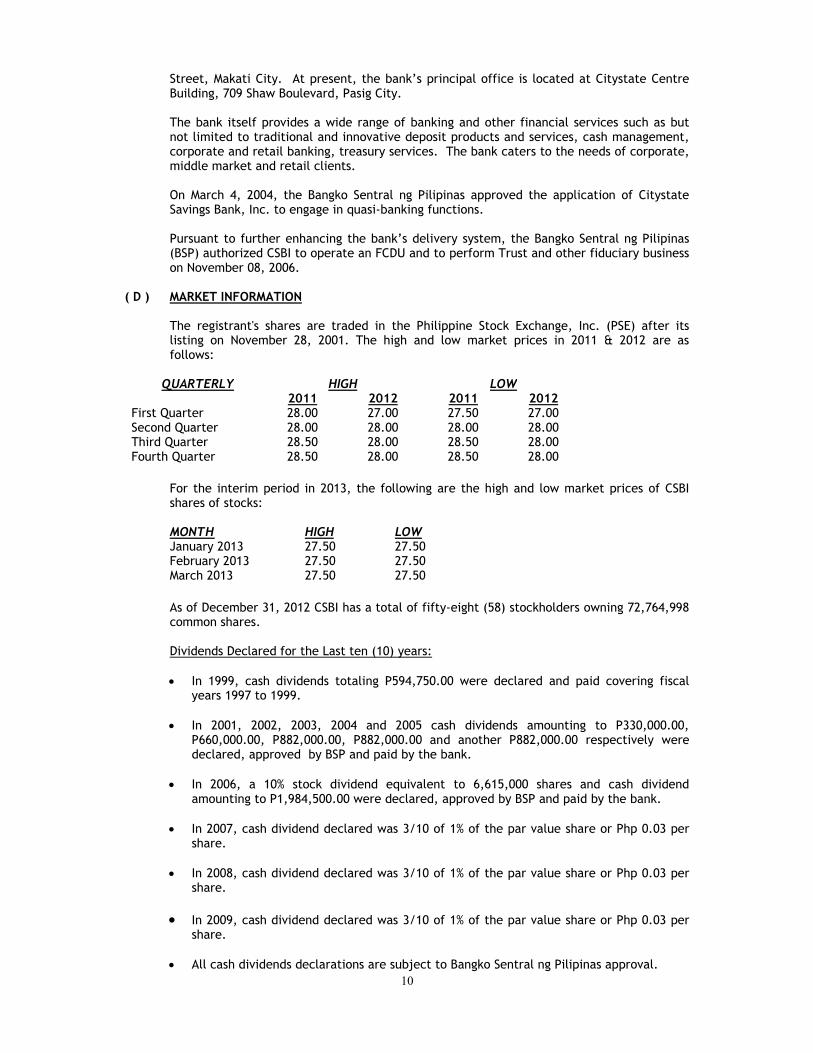
The registrant's shares are traded in the Philippine Stock Exchange, Inc. (PSE) after its listing on November 28, 2001. The high and low market prices in 2011 & 2012 are as follows:
QUARTERLY HIGH LOW 2011 2012 2011 2012 First Quarter 28.00 27.00 27.50 27.00 Second Quarter 28.00 28.00 28.00 28.00 Third Quarter 28.50 28.00 28.50 28.00 Fourth Quarter 28.50 28.00 28.50 28.00
For the interim period in 2013, the following are the high and low market prices of CSBI shares of stocks: MONTH HIGH LOW January 2013 27.50 27.50 February 2013 27.50 27.50 March 2013 27.50 27.50 As of December 31, 2012 CSBI has a total of fifty-eight (58) stockholders owning 72,764,998 common shares. Dividends Declared for the Last ten (10) years:
• In 1999, cash dividends totaling P594,750.00 were declared and paid covering fiscal
years 1997 to 1999.
• In 2001, 2002, 2003, 2004 and 2005 cash dividends amounting to P330,000.00, P660,000.00, P882,000.00, P882,000.00 and another P882,000.00 respectively were declared, approved by BSP and paid by the bank.
• In 2006, a 10% stock dividend equivalent to 6,615,000 shares and cash dividend
amounting to P1,984,500.00 were declared, approved by BSP and paid by the bank.
• In 2007, cash dividend declared was 3/10 of 1% of the par value share or Php 0.03 per share.
• In 2008, cash dividend declared was 3/10 of 1% of the par value share or Php 0.03 per
share.
• In 2009, cash dividend declared was 3/10 of 1% of the par value share or Php 0.03 per share.
• All cash dividends declarations are subject to Bangko Sentral ng Pilipinas approval.
11
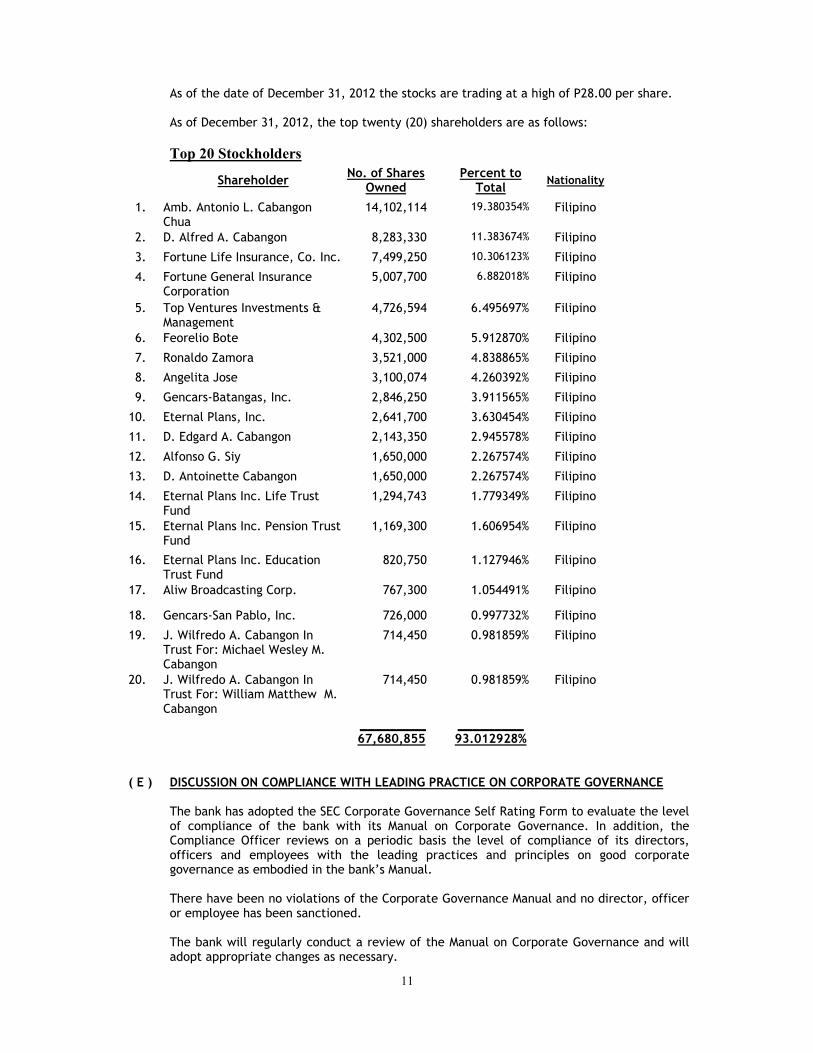
As of the date of December 31, 2012 the stocks are trading at a high of P28.00 per share. As of December 31, 2012, the top twenty (20) shareholders are as follows: Top 20 Stockholders
Shareholder No. of Shares Owned Percent to
Total Nationality
1. Amb. Antonio L. Cabangon Chua
14,102,114 19.380354% Filipino
2. D. Alfred A. Cabangon 8,283,330 11.383674% Filipino
3. Fortune Life Insurance, Co. Inc. 7,499,250 10.306123% Filipino
4. Fortune General Insurance Corporation
5,007,700 6.882018% Filipino
5. Top Ventures Investments & Management
4,726,594 6.495697% Filipino
6. Feorelio Bote 4,302,500 5.912870% Filipino
7. Ronaldo Zamora 3,521,000 4.838865% Filipino
8. Angelita Jose 3,100,074 4.260392% Filipino
9. Gencars-Batangas, Inc. 2,846,250 3.911565% Filipino
10. Eternal Plans, Inc. 2,641,700 3.630454% Filipino
11. D. Edgard A. Cabangon 2,143,350 2.945578% Filipino
12. Alfonso G. Siy 1,650,000 2.267574% Filipino
13. D. Antoinette Cabangon 1,650,000 2.267574% Filipino
14. Eternal Plans Inc. Life Trust Fund
1,294,743 1.779349% Filipino
15. Eternal Plans Inc. Pension Trust Fund
1,169,300 1.606954% Filipino
16. Eternal Plans Inc. Education Trust Fund
820,750 1.127946% Filipino
17. Aliw Broadcasting Corp. 767,300 1.054491% Filipino
18. Gencars-San Pablo, Inc. 726,000 0.997732% Filipino
19. J. Wilfredo A. Cabangon In Trust For: Michael Wesley M. Cabangon
714,450 0.981859% Filipino
20. J. Wilfredo A. Cabangon In Trust For: William Matthew M. Cabangon
714,450 0.981859% Filipino
_________ 67,680,855 _________
93.012928%
( E ) DISCUSSION ON COMPLIANCE WITH LEADING PRACTICE ON CORPORATE GOVERNANCE
The bank has adopted the SEC Corporate Governance Self Rating Form to evaluate the level of compliance of the bank with its Manual on Corporate Governance. In addition, the Compliance Officer reviews on a periodic basis the level of compliance of its directors, officers and employees with the leading practices and principles on good corporate governance as embodied in the bank’s Manual.
There have been no violations of the Corporate Governance Manual and no director, officer or employee has been sanctioned.
The bank will regularly conduct a review of the Manual on Corporate Governance and will adopt appropriate changes as necessary.

12
UNDERTAKING TO PROVIDE ANNUAL REPORT
The registrant undertakes to provide without charge any person a copy of the Bank’s Annual Report on SEC Form 17-A upon written request to the registrant addressed to:
MR. EDUARDO O. OLAVARIO Vice President, Comptrollership/Accounting Citystate Centre Building 709 Shaw Boulevard, Pasig City

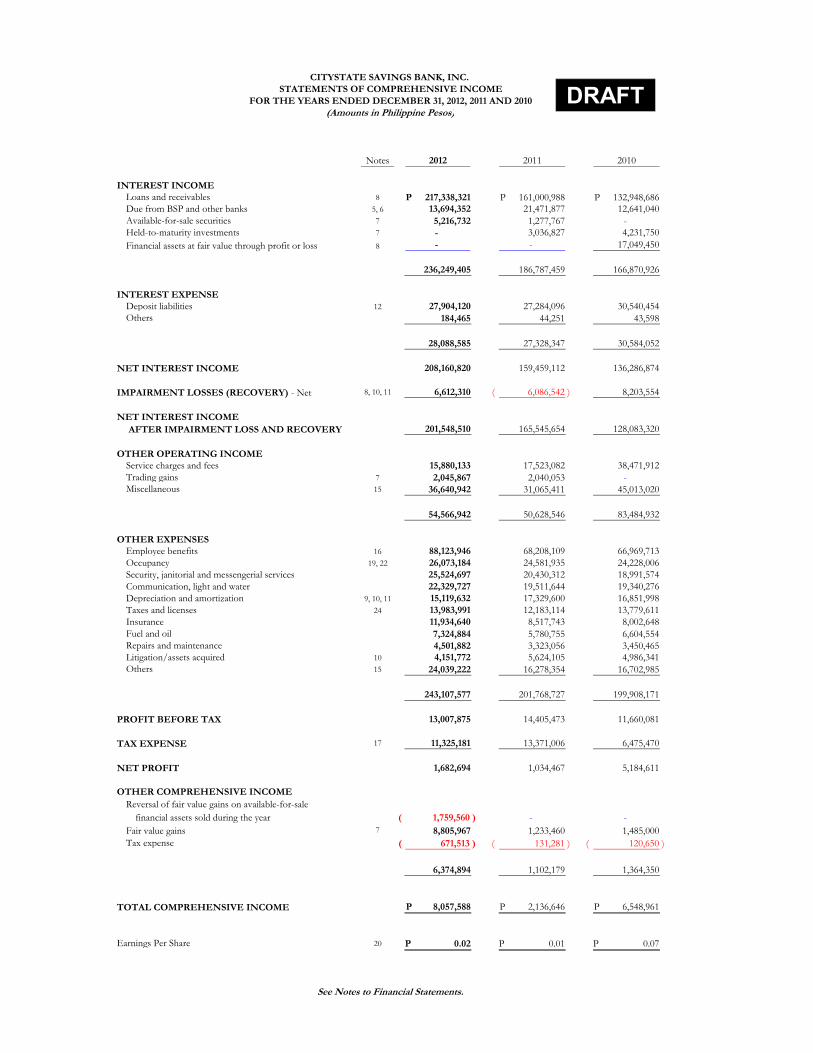
Notes 2012 2011 2010
INTEREST INCOME
Loans and receivables 8 217,338,321 P 161,000,988 P 132,948,686 P Due from BSP and other banks 5, 6 13,694,352 21,471,877 12,641,040 Available-for-sale securities 7 5,216,732 1,277,767 - Held-to-maturity investments 7 - 3,036,827 4,231,750
Financial assets at fair value through profit or loss 8 - - 17,049,450
236,249,405 186,787,459 166,870,926
INTEREST EXPENSE
Deposit liabilities 12 27,904,120 27,284,096 30,540,454 Others 184,465 44,251 43,598
28,088,585 27,328,347 30,584,052
NET INTEREST INCOME 208,160,820 159,459,112 136,286,874
IMPAIRMENT LOSSES (RECOVERY) - Net 8, 10, 11 6,612,310 6,086,542 )( 8,203,554
NET INTEREST INCOME
AFTER IMPAIRMENT LOSS AND RECOVERY 201,548,510 165,545,654 128,083,320
OTHER OPERATING INCOME
Service charges and fees 15,880,133 17,523,082 38,471,912 Trading gains 7 2,045,867 2,040,053 - Miscellaneous 15 36,640,942 31,065,411 45,013,020
54,566,942 50,628,546 83,484,932
OTHER EXPENSES
Employee benefits 16 88,123,946 68,208,109 66,969,713 Occupancy 19, 22 26,073,184 24,581,935 24,228,006 Security, janitorial and messengerial services 25,524,697 20,430,312 18,991,574 Communication, light and water 22,329,727 19,511,644 19,340,276 Depreciation and amortization 9, 10, 11 15,119,632 17,329,600 16,851,998 Taxes and licenses 24 13,983,991 12,183,114 13,779,611 Insurance 11,934,640 8,517,743 8,002,648 Fuel and oil 7,324,884 5,780,755 6,604,554 Repairs and maintenance 4,501,882 3,323,056 3,450,465 Litigation/assets acquired 10 4,151,772 5,624,105 4,986,341 Others 15 24,039,222 16,278,354 16,702,985
243,107,577 201,768,727 199,908,171
PROFIT BEFORE TAX 13,007,875 14,405,473 11,660,081
TAX EXPENSE 17 11,325,181 13,371,006 6,475,470
NET PROFIT 1,682,694 1,034,467 5,184,611
OTHER COMPREHENSIVE INCOME
Reversal of fair value gains on available-for-sale
financial assets sold during the year 1,759,560 )( - -
Fair value gains 7 8,805,967 1,233,460 1,485,000
Tax expense 671,513 )( 131,281 )( 120,650 )(
6,374,894 1,102,179 1,364,350
TOTAL COMPREHENSIVE INCOME 8,057,588 P 2,136,646 P 6,548,961 P
Earnings Per Share 20 0.02 P 0.01 P 0.07 P
See Notes to Financial Statements.
CITYSTATE SAVINGS BANK, INC.
STATEMENTS OF COMPREHENSIVE INCOME
FOR THE YEARS ENDED DECEMBER 31, 2012, 2011 AND 2010
(Amounts in Philippine Pesos)
DRAFT
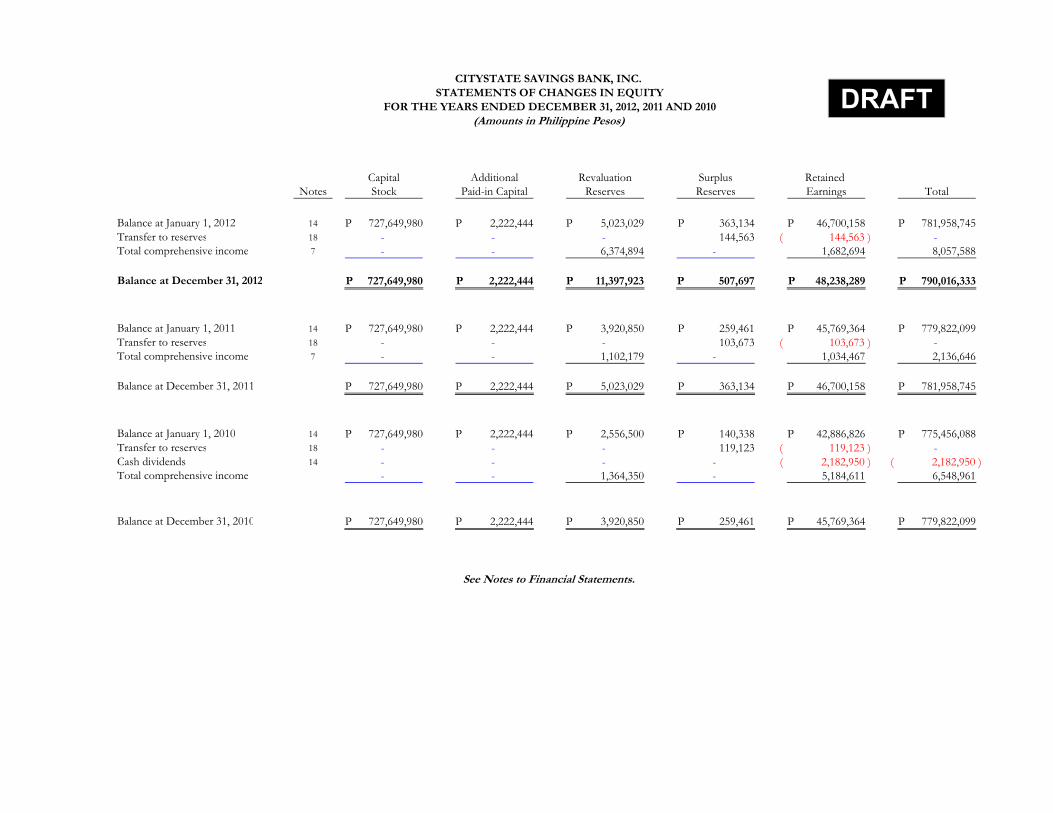
Capital Additional Revaluation Surplus Retained
Notes Stock Paid-in Capital Reserves Reserves Earnings Total
Balance at January 1, 2012 14 727,649,980 P 2,222,444 P 5,023,029 P 363,134 P 46,700,158 P 781,958,745 P
Transfer to reserves 18 - - - 144,563 144,563 )( -
Total comprehensive income 7 - - 6,374,894 - 1,682,694 8,057,588
Balance at December 31, 2012 727,649,980 P 2,222,444 P 11,397,923 P 507,697 P 48,238,289 P 790,016,333 P
Balance at January 1, 2011 14 727,649,980 P 2,222,444 P 3,920,850 P 259,461 P 45,769,364 P 779,822,099 P
Transfer to reserves 18 - - - 103,673 103,673 )( -
Total comprehensive income 7 - - 1,102,179 - 1,034,467 2,136,646
Balance at December 31, 2011 727,649,980 P 2,222,444 P 5,023,029 P 363,134 P 46,700,158 P 781,958,745 P
Balance at January 1, 2010 14 727,649,980 P 2,222,444 P 2,556,500 P 140,338 P 42,886,826 P 775,456,088 P
Transfer to reserves 18 - - - 119,123 119,123 )( -
Cash dividends 14 - - - - 2,182,950 )( 2,182,950 )(
Total comprehensive income - - 1,364,350 - 5,184,611 6,548,961
Balance at December 31, 2010 727,649,980 P 2,222,444 P 3,920,850 P 259,461 P 45,769,364 P 779,822,099 P
See Notes to Financial Statements.
CITYSTATE SAVINGS BANK, INC.
STATEMENTS OF CHANGES IN EQUITY
FOR THE YEARS ENDED DECEMBER 31, 2012, 2011 AND 2010
(Amounts in Philippine Pesos)
DRAFT
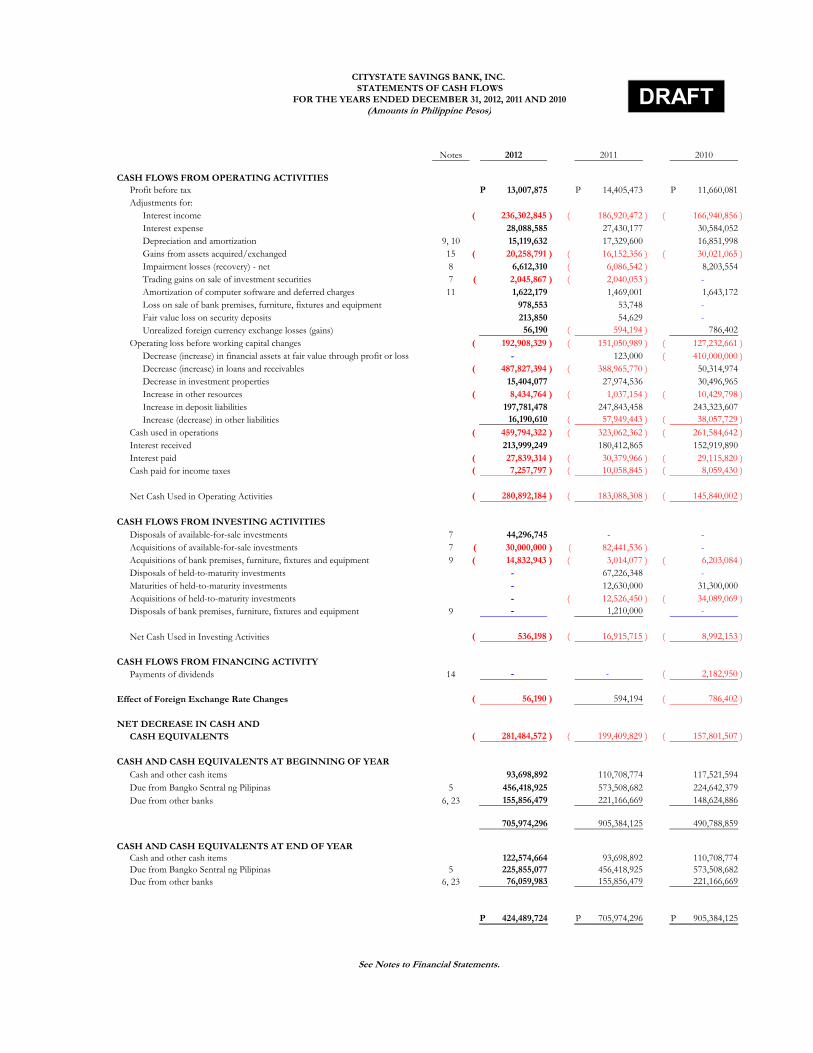
Notes 2012 2011 2010
CASH FLOWS FROM OPERATING ACTIVITIES
Profit before tax 13,007,875 P 14,405,473 P 11,660,081 P
Adjustments for:
Interest income 236,302,845 )( 186,920,472 )( 166,940,856 )(
Interest expense 28,088,585 27,430,177 30,584,052
Depreciation and amortization 9, 10 15,119,632 17,329,600 16,851,998
Gains from assets acquired/exchanged 15 20,258,791 )( 16,152,356 )( 30,021,065 )(
Impairment losses (recovery) - net 8 6,612,310 6,086,542 )( 8,203,554
Trading gains on sale of investment securities 7 2,045,867 )( 2,040,053 )( -
Amortization of computer software and deferred charges 11 1,622,179 1,469,001 1,643,172
Loss on sale of bank premises, furniture, fixtures and equipment 978,553 53,748 -
Fair value loss on security deposits 213,850 54,629 -
Unrealized foreign currency exchange losses (gains) 56,190 594,194 )( 786,402
Operating loss before working capital changes 192,908,329 )( 151,050,989 )( 127,232,661 )(
Decrease (increase) in financial assets at fair value through profit or loss - 123,000 410,000,000 )(
Decrease (increase) in loans and receivables 487,827,394 )( 388,965,770 )( 50,314,974
Decrease in investment properties 15,404,077 27,974,536 30,496,965
Increase in other resources 8,434,764 )( 1,037,154 )( 10,429,798 )(
Increase in deposit liabilities 197,781,478 247,843,458 243,323,607
Increase (decrease) in other liabilities 16,190,610 57,949,443 )( 38,057,729 )(
Cash used in operations 459,794,322 )( 323,062,362 )( 261,584,642 )(
Interest received 213,999,249 180,412,865 152,919,890
Interest paid 27,839,314 )( 30,379,966 )( 29,115,820 )(
Cash paid for income taxes 7,257,797 )( 10,058,845 )( 8,059,430 )(
Net Cash Used in Operating Activities 280,892,184 )( 183,088,308 )( 145,840,002 )(
CASH FLOWS FROM INVESTING ACTIVITIES
Disposals of available-for-sale investments 7 44,296,745 - -
Acquisitions of available-for-sale investments 7 30,000,000 )( 82,441,536 )( -
Acquisitions of bank premises, furniture, fixtures and equipment 9 14,832,943 )( 3,014,077 )( 6,203,084 )(
Disposals of held-to-maturity investments - 67,226,348 -
Maturities of held-to-maturity investments - 12,630,000 31,300,000
Acquisitions of held-to-maturity investments - 12,526,450 )( 34,089,069 )(
Disposals of bank premises, furniture, fixtures and equipment 9 - 1,210,000 -
Net Cash Used in Investing Activities 536,198 )( 16,915,715 )( 8,992,153 )(
CASH FLOWS FROM FINANCING ACTIVITY
Payments of dividends 14 - - 2,182,950 )(
Effect of Foreign Exchange Rate Changes 56,190 )( 594,194 786,402 )(
NET DECREASE IN CASH AND
CASH EQUIVALENTS 281,484,572 )( 199,409,829 )( 157,801,507 )(
CASH AND CASH EQUIVALENTS AT BEGINNING OF YEAR
Cash and other cash items 93,698,892 110,708,774 117,521,594
Due from Bangko Sentral ng Pilipinas 5 456,418,925 573,508,682 224,642,379
Due from other banks 6, 23 155,856,479 221,166,669 148,624,886
705,974,296 905,384,125 490,788,859
CASH AND CASH EQUIVALENTS AT END OF YEAR
Cash and other cash items 122,574,664 93,698,892 110,708,774
Due from Bangko Sentral ng Pilipinas 5 225,855,077 456,418,925 573,508,682
Due from other banks 6, 23 76,059,983 155,856,479 221,166,669
424,489,724 P 705,974,296 P 905,384,125 P
CITYSTATE SAVINGS BANK, INC.
STATEMENTS OF CASH FLOWS
FOR THE YEARS ENDED DECEMBER 31, 2012, 2011 AND 2010
(Amounts in Philippine Pesos)
See Notes to Financial Statements.
DRAFT
DRAFT
CITYSTATE SAVINGS BANK, INC. NOTES TO FINANCIAL STATEMENTS
DECEMBER 31, 2012, 2011 AND 2010 (Amounts in Philippine Pesos)
1. CORPORATE INFORMATION
Citystate Savings Bank, Inc. (the Bank) was incorporated in the Philippines on May 20, 1997. The Bank obtained a thrift bank license from the Bangko Sentral ng Pilipinas (BSP) on August 7, 1997 and started operations on August 8, 1997. The Bank’s common shares were listed in the Philippine Stock Exchange (PSE) on November 14, 2001. On March 4, 2004, the Bank was authorized by the BSP to engage in quasi-banking functions. On July 13, 2006, the Bank was granted license to operate foreign currency deposit unit (FCDU) and trust function. The Bank’s FCDU started operations in November 2006, while its trust operations started in February 2007. At the end of 2012, the Bank has 25 branches and 27 on-site and 8 off-site automated teller machines strategically located in key cities and municipalities within Metro Manila and provincial areas. The Bank’s registered address, which is also its principal place of business, is located at 2nd Floor, Citystate Centre, 709 Shaw Boulevard, Pasig City. The financial statements of the Bank for the year ended December 31, 2012 (including the comparatives as of December 31, 2011 and for the years ended December 31, 2011 and 2010) were authorized for issue by the Bank’s Board of Directors (BOD) on March 26, 2013.
2. SUMMARY OF SIGNIFICANT ACCOUNTING POLICIES
The significant accounting policies that have been used in the preparation of these financial statements are summarized below. The policies have been consistently applied to all the years presented, unless otherwise stated. 2.1 Basis of Preparation of Financial Statements
(a) Statement of Compliance with Philippine Financial Reporting Standards
The financial statements of the Bank have been prepared in accordance with Philippine Financial Reporting Standards (PFRS). PFRSs are adopted by the Financial Reporting Standards Council from the pronouncements issued by the International Accounting Standards Board (IASB).
The financial statements have been prepared using the measurement bases specified by PFRS for each type of resource and liability, and income and expense. The measurement bases are more fully described in the accounting policies in the succeeding pages.
- 2 -
DRAFT
(b) Presentation of Financial Statements The financial statements are presented in accordance with Philippine Accounting Standard (PAS) 1, Presentation of Financial Statements. The Bank presents all items of income and expenses in a single statement of comprehensive income. Two comparative periods are presented for the statement of financial position when the Bank applies an accounting policy retrospectively, makes a retrospective restatement of items in its financial statements, or reclassifies items in the financial statements.
(c) Functional and Presentation Currency These financial statements are presented in Philippine pesos, the Bank’s functional and presentation currency, and all values represent absolute amounts except when otherwise indicated. Items included in the financial statements of the Bank are measured using its functional currency. Functional currency is the currency of the primary economic environment in which the Bank operates. The financial statements of the FCDU of the Bank, which are expressed in United States (US) dollars as its functional currency, are translated using the closing rates for statement of financial position accounts and weighted average rates for statement of comprehensive income accounts.
2.2 Adoption of New and Amended PFRS
(a) Effective in 2012 that are Relevant to the Bank
In 2012, the Bank adopted the following amendments to PFRS that are relevant to the Bank and effective for financial statements for the annual period beginning on or after July 1, 2011 or January 1, 2012:
PFRS 7 (Amendment) : Financial Instruments: Disclosures – Transfers of Financial Assets PAS 12 (Amendment) : Income Taxes – Deferred Taxes: Recovery of Underlying Assets
Discussed below are the relevant information about these amended standards.
(i) PFRS 7 (Amendment), Financial Instruments: Disclosures – Transfers of Financial
Assets. The amendment requires additional disclosures that will allow users of financial statements to understand the relationship between transferred financial assets that are not derecognized in their entirety and the associated liabilities; and, to evaluate the nature of, and risk associated with any continuing involvement of the reporting entity in financial assets that are derecognized in their entirety. The Bank did not transfer any financial asset involving this type of arrangement; hence, the amendment did not result in any significant change in the Bank’s disclosures in its financial statements.
- 3 -
DRAFT
(ii) PAS 12 (Amendment), Income Taxes – Deferred Tax: Recovery of Underlying Assets. The amendment introduces a rebuttable presumption that the measurement of a deferred tax liability or asset that arises from investment property measured at fair value under PAS 40, Investment Property should reflect the tax consequence of recovering the carrying amount of the asset entirely through sale. The presumption is rebutted for depreciable investment property (e.g., building) that is held within a business model whose objective is to consume substantially all of the economic benefits embodied in the asset over time, rather than through sale. Moreover, Standing Interpretation Committee (SIC) 21, Income Taxes – Recovery of Revalued Non-Depreciable Assets, is accordingly withdrawn and is incorporated under PAS 12 requiring that deferred tax on non-depreciable assets that are measured using the revaluation model in PAS 16, Property, Plant and Equipment should always be measured on a sale basis of the asset. The amendment has no significant impact on the Bank’s financial statements as the Bank’s investment properties and land classified as bank premises, furniture, fixtures and equipment are carried at cost less any impairment losses, which are not covered under this amendment.
(b) Effective in 2012 that is not Relevant to the Bank
PFRS 1, First-time Adoption of PFRS, was amended to provide relief for first-time adopters of PFRS from having to reconstruct transactions that occurred before the date of transition to PFRS and to provide guidance for entities emerging from severe hyperinflation either to resume presenting PFRS financial statements or to present PFRS financial statements for the first time. The amendment became effective for annual periods beginning on or after July 1, 2011 but is not relevant to the Bank’s financial statements.
(c) Effective Subsequent to 2012 but not Adopted Early
There are new PFRS, amendments, annual improvements and interpretation to existing standards that are effective for periods subsequent to 2012. Management has initially determined the following pronouncements, which the Bank will apply in accordance with their transitional provisions, to be relevant to its financial statements:
(i) PAS 1 (Amendment), Financial Statements Presentation – Presentation of Items of
Other Comprehensive Income (effective from July 1, 2011). The amendment requires an entity to group items presented in other comprehensive income into those that, in accordance with other PFRSs: (a) will not be reclassified subsequently to profit or loss and (b) will be reclassified subsequently to profit or loss when specific conditions are met. The Bank’s management expects that this will not affect the presentation of items in other comprehensive income since the Bank’s other comprehensive income only includes unrealized fair value gains on available-for-sale (AFS) financial assets which can be reclassified to profit or loss when specified conditions are met.
- 4 -
DRAFT
(ii) PAS 19 (Revised), Employee Benefits (effective from January 1, 2013). The revision made a number of changes as part of the improvements throughout the standard. The main changes relate to defined benefit plans as follows:
• eliminates the corridor approach under the existing guidance of PAS 19 and requires an entity to recognize all actuarial gains and losses arising in the reporting period;
• streamlines the presentation of changes in plan assets and liabilities resulting in the disaggregation of changes into three main components of service costs, net interest on net defined benefit obligation or asset, and remeasurement; and,
• enhances disclosure requirements, including information about the characteristics of defined benefit plans and the risks that entities are exposed to through participation in those plans.
Currently, the Bank is using the corridor approach and its unrecognized actuarial gain as of December 31, 2012 amounts to P6.5 million (see Note 16.2) which will be retrospectively recognized as gain in other comprehensive income in 2013.
(iii) PFRS 7 (Amendment), Financial Instruments: Disclosures – Offsetting Financial
Assets and Financial Liabilities (effective from January 1, 2013). The amendment requires qualitative and quantitative disclosures relating to gross and net amounts of recognized financial instruments that are set-off in accordance with PAS 32, Financial Instruments: Presentation. The amendment also requires disclosure of information about recognized financial instruments which are subject to enforceable master netting arrangements or similar agreements, even if they are not set-off in the statement of financial position, including those which do not meet some or all of the offsetting criteria under PAS 32 and amounts related to a financial collateral. These disclosures will allow financial statement users to evaluate the effect or potential effect of netting arrangements, including rights of set-off associated with recognized financial assets and financial liabilities on the entity’s financial position. The Bank has initially assessed that the adoption of the amendment will not have a significant impact on its financial statements.
(iv) PFRS 13, Fair Value Measurement (effective from January 1, 2013). This
standard aims to improve consistency and reduce complexity by providing a precise definition of fair value and a single source of fair value measurement and disclosure requirements for use across PFRS. The requirements do not extend the use of fair value accounting but provide guidance on how it should be applied where its use is already required or permitted by other standards. Management is in the process of reviewing its valuation methodologies for conformity with the new requirements and has yet to assess the impact of the new standard on the Bank’s financial statements.
- 5 -
DRAFT
(v) PAS 32 (Amendment), Financial Instruments: Presentation – Offsetting Financial Assets and Financial Liabilities (effective from January 1, 2014). The amendment provides guidance to address inconsistencies in applying the criteria for offsetting financial assets and financial liabilities. It clarifies that a right of set-off is required to be legally enforceable, in the normal course of business; in the event of default; and in the event of insolvency or bankruptcy of the entity and all of the counterparties. The amendment also clarifies the principle behind net settlement and provided characteristics of a gross settlement system that would satisfy the criterion for net settlement. The Bank does not expect this amendment to have a significant impact on its financial statements.
(vi) PFRS 9, Financial Instruments: Classification and Measurement (effective from January 1, 2015). This is the first part of a new standard on financial instruments that will replace PAS 39, Financial Instruments: Recognition and Measurement, in its entirety. This chapter covers the classification and measurement of financial assets and financial liabilities and it deals with two measurement categories for financial assets: amortized cost and fair value. All equity instruments will be measured at fair value while debt instruments will be measured at amortized cost only if the entity is holding it to collect contractual cash flows which represent payment of principal and interest. The accounting for embedded derivatives in host contracts that are financial assets is simplified by removing the requirement to consider whether or not they are closely related, and, in most arrangement, does not require separation from the host contract. For liabilities, the standard retains most of the PAS 39 requirements which include amortized cost accounting for most financial liabilities, with bifurcation of embedded derivatives. The main change is that, in case where the fair value option is taken for financial liabilities, the part of a fair value change due to an entity’s own credit risk is recorded in other comprehensive income rather than in profit or loss, unless this creates an accounting mismatch. To date, other chapters of PFRS 9 dealing with impairment methodology and hedge accounting are still being completed. Further, in November 2011, the IASB tentatively decided to consider making limited modifications to International Financial Reporting Standard 9’s financial asset classification model to address certain application issues. The Bank does not expect to implement and adopt PFRS 9 until its effective date or until all chapters of this new standard have been published. In addition, management is currently assessing the impact of PFRS 9 on the financial statements of the Bank and it plans to conduct a comprehensive study of the potential impact of this standard prior to its mandatory adoption date to assess the impact of all changes.
- 6 -
DRAFT
(vii) 2009-2011 Annual Improvements to PFRS. Annual improvements to PFRS (2009-2011 Cycle) made minor amendments to a number of PFRS, which are effective for annual period beginning on or after January 1, 2013. Among those improvements, the following amendments are relevant to the Bank but management does not expect a material impact on the Bank’s financial statements: (a) PAS 1 (Amendment), Presentation of Financial Statements – Clarification of the
Requirements for Comparative Information. The amendment clarifies the requirements for presenting comparative information for the following:
• Requirements for the opening statement of financial position
If an entity applies an accounting policy retrospectively, or makes a retrospective restatement or reclassification of items that has a material effect on the information in the statement of financial position at the beginning of the preceding period (i.e., opening statement of financial position), it shall present such third statement of financial position.
Other than disclosure of certain specified information in accordance with PAS 8, Accounting Policies, Changes in Accounting Estimates and Errors, related notes to the opening statement of financial position as at the beginning of the preceding period are not required to be presented.
• Requirements for additional comparative information beyond minimum requirements
If an entity presented comparative information in the financial statements beyond the minimum comparative information requirements, the additional financial statements information should be presented in accordance with PFRS including disclosure of comparative information in the related notes for that additional information. Presenting additional comparative information voluntarily would not trigger a requirement to provide a complete set of financial statements.
(b) PAS 32 (Amendment), Financial Instruments – Presentation – Tax Effect of
Distributions to Holders of Equity Instruments. The amendment clarifies that the consequences of income tax relating to distributions to holders of an equity instrument and to transaction costs of an equity transaction shall be accounted for in accordance with PAS 12. Accordingly, income tax relating to distributions to holders of an equity instrument is recognized in profit or loss while income tax related to the transaction costs of an equity transaction is recognized in equity.
- 7 -
DRAFT
2.3 Financial Assets Financial assets are recognized when the Bank becomes a party to the contractual terms of the financial instrument. Financial assets other than those designated and effective as hedging instruments are classified into the following categories: financial assets at fair value through profit or loss (FVTPL), loans and receivables, held-to-maturity (HTM) investments and AFS financial assets. Financial assets are assigned to the different categories by management on initial recognition, depending on the purpose for which the investments were acquired. Regular purchases and sales of financial assets are recognized on their trade date. All financial assets that are not classified as at FVTPL are initially recognized at fair value plus any directly attributable transaction costs. Financial assets carried at FVTPL are initially recorded at fair value and transaction costs related to it are recognized in profit or loss. A more detailed description of the categories of financial assets that are relevant to the Bank is described below. (a) Loans and Receivables
Loans and receivables are non-derivative financial assets with fixed or determinable payments that are not quoted in an active market. They arise when the Bank provides money, goods or services directly to a debtor with no intention of trading the receivables. Loans and receivables are subsequently measured at amortized cost using the effective interest method, less impairment loss, if any. Impairment loss is provided when there is objective evidence that the Bank will not be able to collect all amounts due to it in accordance with the original terms of the receivables. The amount of the impairment loss is determined as the difference between the assets’ carrying amount and the present value of estimated future cash flows, discounted at the effective interest rate. The Bank’s financial assets categorized as loans and receivables are presented as Cash and Cash Equivalents, Loans and Receivables and Security Deposits (under Other Resources account) in the statement of financial position. Cash and cash equivalents comprise accounts with original maturities of three months or less from the date of acquisition, including cash and non-restricted balances with the BSP and amounts due from other banks. For statement of cash flows purposes, cash and cash equivalents include cash and other cash items, due from BSP and due from other banks. Loans and receivables also include Securities Purchased Under Reverse Repurchase Agreement (SPURRA) wherein the Bank enters into short-term purchases of securities under reverse repurchase agreements of substantially identical securities with the BSP.
- 8 -
DRAFT
(b) HTM Investments This category includes non-derivative financial assets with fixed or determinable payments and a fixed date of maturity that the Bank has the positive intention and ability to hold to maturity. If the Bank were to sell other than an insignificant amount of HTM investments, the whole category would be tainted and reclassified as AFS financial assets. Subsequent to initial recognition, HTM investments are measured at amortized cost using the effective interest method, less impairment losses, if any. Impairment loss, which is the difference between the carrying value and the present value of estimated future cash flows of the investment, is recognized when there is an objective evidence that the investment has been impaired.
(c) AFS Financial Assets
This category includes non-derivative financial assets that are either designated to this category or do not qualify for inclusion in any of the other categories of financial assets. The Bank’s AFS financial assets include government securities and proprietary shares. All financial assets within this category are subsequently measured at fair value. Gains and losses from changes in fair value are recognized in other comprehensive income, net of any income tax effects, and are reported as part of the Revaluation Reserves account in equity. When the financial asset is disposed of, or is determined to be impaired, the cumulative fair value gains or losses recognized in other comprehensive income are reclassified from equity to profit or loss and are presented as a reclassification adjustment within other comprehensive income. Reversal of impairment loss is recognized in other comprehensive income, except for financial assets that are debt securities which are recognized in profit or loss only if the reversal can be objectively related to an event occurring after the impairment loss was recognized.
Impairment losses or recoveries recognized on financial assets are presented under Impairment Losses (Recovery) account in the statement of comprehensive income. For investments that are actively traded in organized financial markets, fair value is determined by reference to exchange-quoted market bid prices at the close of business in the reporting period. For this purpose, a financial asset is considered as being traded in an active market if their quoted prices or market values are readily and periodically available from stock or debt markets, exchanges, dealers, brokers, industry groups, pricing service entities or regulatory agencies and those prices or values represent actual and regularly occurring market transactions on an arm’s length basis (i.e., the transactions are occurring frequent enough to provide pricing information on an ongoing basis). For investments where there is no quoted market price, fair value is determined by reference to the current market value of another instrument which is substantially the same or is calculated based on the expected cash flows of the underlying net asset base of the investment.
- 9 -
DRAFT
Non-compounding interest, dividend income, and other cash flows resulting from holding financial assets are recognized in profit or loss when earned, regardless of how the related carrying amount of financial assets is measured. The financial assets are derecognized when the contractual rights to receive cash flows from the financial instruments expire, or when the financial assets and all substantial risks and rewards of ownership have been transferred. 2.4 Bank Premises, Furniture, Fixtures and Equipment Land is stated at cost less impairment losses, if any. Bank premises, furniture, fixtures and equipment are carried at acquisition cost less subsequent depreciation, amortization and any impairment losses. The cost of an asset comprises its purchase price and directly attributable cost of bringing the asset to working condition for its intended use. Expenditures for additions, major improvements and renewals are capitalized; expenditures for repairs and maintenance are charged to expense as incurred. Depreciation is computed on a straight-line basis over the estimated useful lives of the assets as follows:
Bank premises 50 years Office furniture, fixtures and equipment 5 years
Leasehold improvements are amortized over the term of the lease or the estimated useful lives of the improvements, whichever is shorter. An asset’s carrying amount is written down immediately to its recoverable amount if the asset’s carrying amount is greater than its estimated recoverable amount (see Note 2.15). The residual values and estimated useful lives of bank premises, furniture, fixtures and equipment, are reviewed and adjusted if appropriate, at the end of each reporting period. An item of bank premises, furniture, fixtures and equipment including the related accumulated depreciation, amortization and any impairment losses, is derecognized upon disposal or when no future economic benefits are expected to arise from the continued use of the asset. Any gain or loss arising on derecognition of the asset (calculated as the difference between the net disposal proceeds and the carrying amount of the item) is included in the profit or loss in the year the item is derecognized. 2.5 Investment Properties Investment properties include land and buildings acquired by the Bank from defaulting borrowers which are held either to earn rental income or for capital appreciation or for both, but not held for sale in the next twelve months or used in the rendering of services or for administrative purposes.
- 10 -
DRAFT
Investment properties are stated at cost, less accumulated depreciation and any impairment losses (see Note 2.15). The cost of an investment property comprises its purchase price and directly attributable costs incurred. For these assets, the cost is recognized initially at the lower of the outstanding loan balance or bid price, which should not be higher than the appraised value of the property. Building and building improvements included under investment properties have estimated useful life of ten years and are depreciated using the straight-line basis. Investment properties including the related accumulated depreciation and any impairment losses, are derecognized upon disposal or when no future economic benefit is expected from its disposal. Any gain or loss on the retirement or disposal of an investment property is recognized in profit or loss under the caption Miscellaneous Income in the year of retirement or disposal. 2.6 Other Resources Prepayments and other resources pertain to other assets controlled by the Bank as a result of past events. They are recognized in the financial statements when it is probable that the future economic benefits will flow to the entity and the asset has a cost or value that can be measured reliably. 2.7 Intangible Assets Intangible assets include acquired branch licenses and software used in operations and administration which are accounted for under the cost model. The cost of the asset is the amount of cash or cash equivalents paid or the fair value of the other considerations given to acquire an asset at the time of its acquisition. The acquired branch license is classified as intangible asset with indefinite useful life, and thus, not subject to amortization but would require an annual test for impairment (see Note 2.15). Branch license is subsequently carried at cost less accumulated impairment losses, if any. Capitalized software costs are amortized on a straight-line basis over the estimated useful lives (ranging from three to ten years) as these intangible assets are considered finite. Acquired computer software licenses are capitalized on the basis of the costs incurred to acquire and install the specific software. Costs associated with maintaining computer software and those costs associated with research activities are recognized as expense in profit or loss as incurred.
The costs of any internally generated software development are recognized as intangible assets; they are subject to the same subsequent measurement method as externally acquired software licenses. Any capitalized internally developed software that is not yet complete is not amortized but is subject to impairment testing as described in Note 2.15. Amortization commences upon completion of the asset.
When an intangible asset is disposed of, the gain or loss on disposal is determined as the difference between the proceeds and the carrying amount of the asset and is recognized in profit or loss.
- 11 -
DRAFT
2.8 Financial Liabilities Financial liabilities, which include deposit liabilities and other liabilities (except for income tax payable, post-employment benefit obligation and other tax related liabilities) are recognized when the Bank becomes a party to the contractual terms of the instrument. All interest-related charges incurred on financial liability are recognized as Interest Expense in the statement comprehensive income. Deposit liabilities and other liabilities are recognized initially at their fair values and subsequently measured at amortized cost using effective interest method for maturities beyond one year, less settlement payments. Dividend distributions to shareholders are recognized as financial liabilities upon declaration by the Bank, subject to the approval of the BSP. Financial liabilities are derecognized from the statement of financial position only when the obligations are extinguished either through discharge, cancellation or expiration. 2.9 Offsetting Financial Instruments Financial assets and liabilities are set off and the resulting net amount is reported in the statement of financial position when there is a legally enforceable right to set off the recognized amounts and there is an intention to settle on a net basis, or realize the asset and settle the liability simultaneously. 2.10 Provisions and Contingencies Provisions are recognized when present obligations will probably lead to an outflow of economic resources and they can be estimated reliably even if the timing or amount of the outflow may still be uncertain. A present obligation arises from the presence of a legal or constructive obligation that has resulted from past events. Provisions are measured at the estimated expenditure required to settle the present obligation, based on the most reliable evidence available at the end of the reporting period, including the risks and uncertainties associated with the present obligation. Where there are a number of similar obligations, the likelihood that an outflow will be required in settlement is determined by considering the class of obligations as a whole. When time value of money is material, long-term provisions are discounted to their present values using a pretax rate that reflects market assessments and the risks specific to the obligation. The increase in the provision due to passage of time is recognized as interest expense. Provisions are reviewed at the end of each reporting period and adjusted to reflect the current best estimate. In those cases where the possible outflow of economic resource as a result of present obligations is considered improbable or remote, or the amount to be provided for cannot be measured reliably, no liability is recognized in the financial statements. Similarly, possible inflows of economic benefits to the Bank that do not yet meet the recognition criteria of an asset are considered contingent assets, hence, are not recognized in the financial statements.
- 12 -
DRAFT
On the other hand, any reimbursement that the Bank can be virtually certain to collect from a third party with respect to the obligation is recognized as a separate asset not exceeding the amount of the related provision. 2.11 Revenue and Expense Recognition Revenue is recognized to the extent that the revenue can be reliably measured; it is probable that the economic benefits will flow to the Bank; and the costs incurred or to be incurred can be measured reliably. In addition, the following specific recognition criteria must also be met before revenue is recognized: (a) Interest income and expense - are recognized in the profit or loss for all financial
instruments using the effective interest method. The effective interest method is a method of calculating the amortized cost of a financial asset or a financial liability and of allocating the interest income or interest expense over the relevant period. The effective interest rate is the rate that exactly discounts the estimated future cash payments or receipts over the expected life of the financial instrument or, when appropriate, a shorter period to the net carrying amount of the financial asset or financial liability. When calculating the effective interest rate, the Bank estimates cash flows considering all contractual terms of the financial instrument but does not consider future credit losses. The calculation includes, all fees and points paid or received between parties to the contract that are an integral part of the effective interest rate, transaction costs, and all other premiums or discounts. Once a financial asset or a group of similar financial assets has been written down as a result of an impairment loss, interest income is recognized using the rate of interest used to discount the future cash flows for the purpose of measuring the impairment loss.
(b) Service charges and fees - are generally recognized on an accrual basis when the
service has been provided. Fees arising from negotiating, or participating in the negotiation of, a transaction for a third party – such as the arrangement of the acquisition of debt instruments or other securities – are recognized on completion of the underlying transaction. Other service fees are recognized based on the applicable service contracts, usually on a time-appropriate basis.
(c) Gains from assets acquired/exchanged - is recognized in the profit or loss when the
title to the assets is transferred to the buyer or when the collectability of the entire sales price is reasonably assured.
(d) Trading gains - are recognized when the ownership of the security is transferred to
the buyer and is computed as the difference between the selling price and the carrying amount of the security.
(e) Rental income - is accounted for on a straight-line basis over the lease terms on ongoing leases and is recorded in profit or loss as part of Miscellaneous under the Other Operating Income account. Rental income is generally earned from lease of investment property.
- 13 -
DRAFT
Costs and expenses are recognized in profit or loss upon utilization of the goods or services or at the date these are incurred. Finance costs are reported in profit or loss on an accrual basis. 2.12 Leases (a) Bank as Lessee Leases, which transfer to the Bank substantially all risks and benefits incidental
to ownership of the leased item are classified as finance leases and are recognized as assets and liabilities in the statement of financial position at amounts equal to the fair value of the leased property at the inception of the lease or, if lower, at the present value of minimum lease payments. Lease payments are apportioned between the finance costs and reduction of the lease liability so as to achieve a constant rate of interest on the remaining balance of the liability.
Leases, which do not transfer to the Bank substantially all the risks and benefits of ownership of the asset are classified as operating leases. Operating lease payments are recognized as expense in profit or loss on a straight-line basis over the lease term. Associated costs, such as repairs and maintenance and insurance, are expensed as incurred.
(b) Bank as Lessor Leases, which do not transfer to the lessee substantially all the risks and benefits
of ownership of the asset are classified as operating leases. Lease income from operating leases is recognized in profit or loss on a straight-line basis over the lease term.
The Bank determines whether an arrangement is, or contains, a lease based on the substance of the arrangement. It makes an assessment of whether the fulfillment of the arrangement is dependent on the use of a specific asset or assets and the arrangement conveys a right to use the asset. 2.13 Foreign Currency Transactions and Translation
The accounting records of the Bank are maintained in Philippine pesos, except for the FCDU, which is maintained in US dollars. Foreign currency transactions during the year are translated into the functional currency at exchange rates which approximate those prevailing on transaction dates. Foreign currency gains and losses resulting from the settlement of such transactions and from the translation at year-end exchange rates of monetary assets and liabilities denominated in foreign currencies are recognized in the statement of comprehensive income as part of income or loss from operations.
- 14 -
DRAFT
2.14 Impairment of Financial Assets The Bank assesses at the end of each reporting period whether there is an objective evidence that a financial asset or group of financial assets is impaired. A financial asset or a group of financial assets is impaired and impairment losses are incurred if, and only if, there is an objective evidence of impairment as a result of one or more events that occurred after the initial recognition of the asset (a loss event) and that loss event has an impact of the estimated future cash flows of the financial asset or group of financial assets that can be reliably estimated. Objective evidence that a financial asset or group of assets is impaired includes observable data that comes to the attention of the Bank about the following loss events:
• Assets carried at amortized cost. The Bank first assesses whether objective evidence of impairment exists individually for financial assets that are individually significant, and individually or collectively for financial assets that are not individually significant. If the Bank determines that no objective evidence of impairment exists for an individually assessed financial asset, whether significant or not, it includes the asset in a group of financial asset with similar credit risk characteristics and collectively assesses them for impairment. Assets that are individually assessed for impairment and for which an impairment loss is or continues to be recognized are not included in the collective assessment of impairment. If there is an objective evidence that an impairment loss on loans and receivables has been incurred, the amount of the loss is measured as the difference between the asset’s carrying amount and the present value of estimated future cash flows (excluding future credit loss that have not been incurred) discounted at the financial asset’s original effective interest rate. The carrying amount of the asset is reduced through the use of an allowance account and the amount of the loss is recognized in profit or loss. If income on loans has a variable interest rate, the discount rate for measuring any impairment loss is the current effective interest rate determined under the contract. When practicable, the Bank may measure impairment on the basis of an instrument’s fair value using an observable market price.
For the purpose of a collective evaluation of impairment, financial assets are grouped on the basis of similar credit risk characteristics (i.e., on the basis of the Bank’s grading process that considers asset type, industry, geographical location, collateral type, past-due status and other relevant factors). Those characteristics are relevant to the estimation of future cash flows for groups of such assets by being indicative of the debtors’ ability to pay all amounts due according to the contractual terms of the assets being evaluated. Future cash flows in a group of financial assets that are collectively evaluated for impairment are estimated on the basis of the contractual cash flows of the assets in the Bank and historical loss experience for assets with credit risk characteristics similar to those in the Bank. Historical loss experience is adjusted on the basis of current observable data to reflect the effects of current conditions that did not affect the period on which the historical loss experience is based and to remove the effects of conditions in the historical period that do not exist currently.
- 15 -
DRAFT
Estimates of changes in future cash flows for groups of assets should reflect and be directionally consistent with changes in related observable data from period to period (for example, changes in unemployment rates, property prices, payment status, or other factors indicative of changes in the probability of losses in the group and their magnitude). The methodology and assumptions used for estimated future cash flows are reviewed regularly by the Bank to reduce any differences between loss estimates and actual loss experience.
When possible, the Bank seeks to restructure loans rather than to take possession of the collateral. This may involve extending the payment arrangement and agreement for new loan conditions. Once the terms have been renegotiated, the loan is no longer considered past due. Management continuously reviews restructured loans to ensure that all criteria evidencing the good quality of the loan are met and that future payments are likely to occur. The loans continue to be subject to an individual or collective impairment assessment, calculated using the loan’s original effective interest rate. The difference between the recorded sale of the original loan and the present value of the restructured cash flows, discounted at the original effective interest rate, is recognized as part of Impairment Losses account in profit or loss. When a loan is uncollectible, it is written off against the related provision for loan impairment. Such loans are written off after all the necessary procedures have been completed and the amount of the loss has been determined. Subsequent recoveries of amounts previously written off decrease the amount of the provision for loan impairment in the statement of comprehensive income.
If, in a subsequent period, the amount of the impairment loss decreases and the decrease can be related objectively to an event occurring after the impairment was recognized (such as an improvement in the debtor’s credit rating), the previously recognized impairment loss is reversed by adjusting the allowance account. The amount of the reversal is recognized in profit or loss.
• Assets carried at fair value. In the case of equity investments classified as AFS, a significant or prolonged decline in the fair value of security below its cost is considered in determining whether the assets are impaired. If any such evidence exists for AFS securities, the cumulative loss – measured as the difference between the acquisition cost and the current fair value, less any impairment loss on that financial asset previously recognized in profit or loss – is reclassified from revaluation reserves (part of equity) and recognized in profit or loss. Such reclassification is presented as an adjustment within other comprehensive income. Impairment losses recognized in profit or loss on equity instruments are not reversed through the profit or loss.
If, in a subsequent period, the fair value of a debt instrument classified as AFS increases and the increase can be objectively related to an event occurring after the impairment loss was recognized in profit or loss, the impairment loss is reversed through the other comprehensive income.
- 16 -
DRAFT
• Assets carried at cost. The Bank assesses at the end of each reporting period whether there is objective evidence that any of the unquoted equity securities, which are carried at cost and for which objective evidence of impairment exist. The amount of impairment loss is the difference between the carrying amount of the equity security and the present value of the estimated future cash flows discounted at the current market rate of return of a similar asset. Impairment losses on assets carried at cost cannot be reversed.
2.15 Impairment of Non-financial Assets The Bank’s premises, furniture, fixtures and equipment, investment properties, intangible assets and other non-financial assets are subject to impairment testing. Intangible assets with an indefinite useful life or those not yet available for use are tested for impairment at least annually. All other individual assets or cash-generating units are tested for impairment whenever events or changes in circumstances indicate that their carrying amount may not be recoverable. For purposes of assessing impairment, assets are grouped at the lowest levels for which there are separately identifiable cash flows (cash-generating units). As a result, some assets are tested for impairment either individually or at the cash-generating unit level. Impairment loss is recognized for the amount by which the asset’s or cash-generating unit’s carrying amount exceeds its recoverable amounts which is the higher of its fair value less costs to sell and its value in use. In determining value in use, management estimates the expected future cash flows from each cash-generating unit and determines the suitable interest rate in order to calculate the present value of those cash flows. The data used for impairment testing procedures are directly linked to the Bank’s latest approved budget, adjusted as necessary to exclude the effects of asset enhancements. Discount factors are determined individually for each cash-generating unit and reflect management’s assessment of respective risk profiles, such as market and asset-specific risk factors. All assets are subsequently reassessed for indications that an impairment loss previously recognized may no longer exist and the carrying amount of the asset is adjusted to the recoverable amount resulting in the reversal of the impairment loss. 2.16 Employee Benefits The Bank provides post-employment benefits to employees through a defined benefit plan, as well as various defined contribution plans.
(a) Defined Benefit Plan
A defined benefit plan is a post-employment plan that defines an amount of post-employment benefit that an employee will receive on retirement, usually dependent on one or more factors such as age, years of service and salary. The legal obligation for any benefits from this kind of post-employment plan remains with the Bank, even if plan assets for funding the defined benefit plan have been acquired.
- 17 -
DRAFT
Plan assets may include assets specifically designated to a long-term benefit fund, as well as qualifying insurance policies. The Bank’s defined benefit post-employment plan covers all regular full-time employees. The pension plan is tax qualified, noncontributory and administered by a trustee. The liability recognized in the statement of financial position for defined benefit plan is the present value of the defined benefit obligation (DBO) at the end of the reporting period less the fair value of plan assets, together with adjustments for unrecognized actuarial gains or losses and past service costs. The DBO is calculated annually by independent actuaries using the projected unit credit method. The present value of the DBO is determined by discounting the estimated future cash outflows using a discount rate derived from the interest rates of a zero coupon government bonds as published by Philippine Dealing Exchange Corporation, that are denominated in the currency in which the benefits will be paid and that have terms to maturity approximating to the terms of the related post-employment liability. Actuarial gains and losses are not recognized as an income or expense unless the total unrecognized gain or loss exceeds 10% of the greater of the obligation and related plan assets. The amount exceeding this 10% corridor is charged or credited to profit or loss over the employees’ expected average remaining working lives. Actuarial gains and losses within the 10% corridor are disclosed separately. Past-service costs are recognized immediately in profit or loss, unless the changes to the pension plan are conditional on the employees remaining in service for a specified period of time (the vesting period). In this case, the past service costs are amortized on a straight-line basis over the vesting period.
(b) Defined Contribution Plans A defined contribution plan is a pension plan under which the Bank pays fixed contributions into an independent entity [e.g., Social Security System (SSS)]. Under this plan, the Bank has no legal or constructive obligations to pay further contributions after payment of the fixed contribution. The contributions recognized in respect of defined contribution plans are expensed as they fall due. Liabilities and assets may be recognized if underpayment or prepayment has occurred and are normally of a short-term nature.
(c) Compensated Absences
Compensated absences are recognized for the number of paid leave days (including holiday entitlement) remaining at the end of the reporting period. They are included in Other Liabilities account in the statement of financial position at the undiscounted amount that the Bank expects to pay as a result of the unused entitlement.
2.17 Income Taxes Tax expense recognized in profit or loss comprises the sum of deferred and current taxes not recognized in other comprehensive income or directly in equity, if any.
- 18 -
DRAFT
Current tax assets or liabilities comprise those claims from, or obligations to, fiscal authorities relating to the current or prior reporting period, that are uncollected or unpaid at the end of the reporting period. They are calculated according to the tax rates and tax laws applicable to the fiscal periods to which they relate, based on the taxable profit for the year. All changes to current tax assets or liabilities are recognized as a component of tax expense in profit or loss. Deferred tax is provided using the liability method on temporary differences at the end of the reporting period between the tax base of assets and liabilities and their carrying amounts for financial reporting purposes. Under the liability method, with certain exceptions, deferred tax liabilities are recognized for all taxable temporary differences and deferred tax assets are recognized for all deductible temporary differences and the carry forward of unused tax losses and unused tax credits to the extent that it is probable that taxable profit will be available against which the deferred tax asset can be utilized. Unrecognized deferred tax assets are reassessed at the end of each reporting period and are recognized to the extent that it has become probable that future taxable profit will be available to allow such deferred tax assets to be recovered. The carrying amount of deferred tax assets is reviewed at the end of each reporting period and reduced to the extent that it is probable that sufficient taxable profit will be available to allow all or part of the deferred tax asset to be utilized. Deferred tax assets and liabilities are measured at the tax rates that are expected to apply to the period when the asset is realized or the liability is settled, based on tax rates and tax laws that have been enacted or substantively enacted at the end of the reporting period. Most changes in deferred tax assets or liabilities are recognized as a component of tax expense in the statement of comprehensive income. Only changes in deferred tax assets or liabilities that relate to items recognized in other comprehensive income or directly in equity are recognized in other comprehensive income or directly in equity. 2.18 Related Party Relationships and Transactions Related party transactions are transfers of resources, services or obligations between the Bank and its related parties, regardless whether a price is charged. Parties are considered to be related if one party has the ability to control the other party or exercise significant influence over the other party in making financial and operating decisions. These parties include: (a) individuals owning, directly or indirectly through one or more intermediaries, control or are controlled by, or under common control with the Bank; (b) associates; (c) individuals owning, directly or indirectly, an interest in the voting power of an entity that gives them significant influence over the Bank and close members of the family of any such individual; and, (d) the Bank’s funded post-employment benefit plan for its employees. In considering each possible related party relationship, attention is directed to the substance of the relationship and not merely on the legal form.
- 19 -
DRAFT
2.19 Equity Capital stock represents the nominal value of shares that have been issued. Additional paid-in capital includes any premiums received on the issuance of capital stock. Any transaction costs associated with the issuance of shares are deducted from additional paid-in capital, net of any related income tax benefits. Revaluation reserves pertain to mark-to-market valuation of AFS securities. Surplus reserve pertains to a portion of the Bank’s income from trust operations set-up on a yearly basis in compliance with BSP regulations. Retained earnings represent all current and prior period results of operations as reported in the profit or loss section of the statement of comprehensive income, reduced by the amounts of dividends declared. 2.20 Earnings Per Share
Basic earnings per share is computed by dividing net profit attributable to equity holders of the Bank by the weighted average number of shares issued and outstanding, adjusted retroactively for any stock dividend, stock split or reverse stock split declared during the current period.
The diluted earnings per share is also computed by dividing net profit by the weighted average number of common shares issued and outstanding during the period. However, net profit attributable to common shares and the weighted average number of common shares outstanding are adjusted to reflect the effects of any potentially dilutive preferred shares, convertible loan and stock option.
Currently, the Bank’s basic and diluted earnings per share are the same as the Bank does not have dilutive preferred shares, convertible loan and stock option. 2.21 Events after the End of the Reporting Period
Any post-year-end event that provides additional information about the Bank’s financial position at the end of the reporting period (adjusting event) is reflected in the financial statements. Post-year-end events that are not adjusting events, if any, are disclosed when material to the financial statements.
3. SIGNIFICANT ACCOUNTING JUDGMENTS AND ESTIMATES The Bank’s financial statements prepared in accordance with PFRS require management to make judgments and estimates that affect the amounts reported in the financial statements and related notes. Judgments and estimates are continually evaluated and are based on historical experience and other factors, including expectations of future events that are believed to be reasonable under the circumstances. Actual results may ultimately differ from these estimates.
- 20 -
DRAFT
3.1 Critical Management Judgments in Applying Accounting Policies
In the process of applying the Bank’s accounting policies, management has made the following judgments, apart from those involving estimation, which have the most significant effect on the amounts recognized in the financial statements:
(a) Classifying Financial Assets as HTM Investments
In classifying non-derivative financial assets with fixed or determinable payments and fixed maturity, such as bonds, as HTM investments, the Bank evaluates its intention and ability to hold such investments up to maturity. If the Bank fails to keep these investments to maturity (other than for specific circumstances as allowed under the standards, e.g. selling more than an insignificant amount close to maturity), it will be required to reclassify the whole class as AFS financial assets. In such a case, the investments would, therefore, be measured at fair value, not at amortized cost.
However, the tainting provision will not apply if the sales or reclassification of HTM investments: (i) are so close to maturity or the financial asset’s call date that changes in the market rate of interest would not have a significant effect on the financial asset’s fair value; (ii) occur after the Bank has collected substantially all of the financial asset’s original principal through scheduled payments or prepayments; or, (iii) are attributable to an isolated event that is beyond the control of the Bank, is nonrecurring and could not have been reasonably anticipated by the Bank.
(b) Impairment of Available-for-sale Securities
The determination when an investment is other-than-temporarily impaired requires significant judgment. In making this judgment, the Bank evaluates, among other factors, the duration and extent to which the fair value of an investment is less than its cost, and the financial health of and near-term business outlook for the investee, including factors such as industry and sector performance, changes in technology and operational and financing cash flows. Based on the recent evaluation of information and circumstances affecting the Bank’s AFS financial assets, management concluded that those assets are not impaired as of December 31, 2012 and 2011. Future changes in those information and circumstances might significantly affect the carrying amount of the assets.
(c) Distinction Between Investment Properties and Owner-occupied Properties
The Bank determines whether a property qualifies as investment property. In making its judgment, the Bank considers whether the property generates cash flows largely independent of the other assets held by the Bank. Owner-occupied properties generate cash flows that are attributable not only to the property but also to other assets used in its banking operations.
- 21 -
DRAFT
Some properties comprise a portion that is held to earn rental or for capital appreciation and another portion that is held for use in its banking operation and services or for administrative purposes. If a portion can be sold separately (or leased out separately under finance lease), the Bank accounts for the portion separately. If a portion cannot be sold separately, the property is accounted for as investment property only if an insignificant portion is held for use in its banking operation or services or for administrative purposes. Judgment is applied in determining whether ancillary services are so significant that a property does not qualify as investment property. The Bank considers each property separately in making its judgment.
(d) Distinction between Operating and Finance Leases
The Bank has entered into various lease agreements as lessee and certain lease agreements as lessor. Critical judgment was exercised by management to distinguish each lease agreement as either an operating or finance lease by looking at the transfer or retention of significant risk and rewards of ownership of the properties covered by the agreements. Failure to make the right judgment will result in either overstatement or understatement of assets and liabilities.
(e) Recognition of Provisions and Contingencies
Judgment is exercised by management to distinguish between provisions and contingencies. Policies on recognition of provisions and contingencies are discussed in Note 2.10 and relevant disclosures on those provisions and contigencies are presented in Note 22.
3.2 Key Sources of Estimation Uncertainty
The following are the key assumptions concerning the future, and other key sources of estimation uncertainty at the end of the reporting period, that have a significant risk of causing a material adjustment to the carrying amounts of assets and liabilities within the next financial year: (a) Impairment of Loans and Receivables
Adequate amount of allowance is provided for specific and groups of accounts, where objective evidence of impairment exists. The Bank evaluates the amount of allowance for impairment based on available facts and circumstances affecting the collectability of the accounts, including, but not limited to, the length of the Bank’s relationship with the borrowers, the borrowers’ current credit status, average age of accounts, value of the collaterals, collection experience and historical loss experience. The carrying value of loans and receivables and the analysis of allowance for impairment on such financial assets are shown in Note 8.
- 22 -
DRAFT
(b) Fair Value Measurement for Financial Assets Other than Loans and Receivables
The Bank carries certain financial assets at fair value, which requires the extensive use of accounting estimates and judgment. In cases when active market quotes are not available, fair value is determined by reference to the current market value of another instrument which is substantially the same or is calculated based on the expected cash flows of the underlying net base of the instrument. The amount of changes in fair value would differ if the Bank utilized different valuation methods and assumptions. Any change in fair value of these financial assets and liabilities would affect profit or loss and other comprehensive income. The carrying amount of the Bank’s AFS financial assets and the changes in the fair value recognized on those financial assets are shown in Note 7.
(c) Estimating Useful Lives of Bank Premises, Furniture, Fixtures and Equipment, Investment
Properties Except Land, and Computer Software
The Bank estimates the useful lives of bank premises, furniture, fixtures, and equipment, investment properties, and computer software based on the period over which the assets are expected to be available for use. The estimated useful lives of those assets are reviewed periodically and are updated if expectations differ from previous estimates due to physical wear and tear, technical or commercial obsolescence and legal or other limits on the use of the assets. The carrying amounts of bank premises, furniture, fixtures and equipment and investment properties are presented in Notes 9 and 10, respectively, while the carrying amount of computer software is presented in Note 11. Based on management’s assessment as at December 31, 2012, there is no change in the estimated useful lives of bank premises, furniture, fixtures and equipment, investment properties, and computer software during the year. Actual results, however, may vary due to changes in estimates brought about by changes in factors mentioned above.
(d) Fair Value Measurement for Investment Property
The Bank’s investment properties are composed of parcels of land and buildings acquired from defaulting borrowers not held for sale in the next twelve months. The estimated fair values of these assets, as disclosed in Note 10, are determined by in-house and independent appraisers. The fair value is determined by reference to market-based evidence, which is the amount for which the assets could be exchanged between a knowledgeable willing buyer and seller in an arm’s length transaction as at the valuation date. Such amount is influenced by different factors including the location and specific characteristics of the property (e.g., size, features, and capacity), quantity of comparable properties available in the market, and economic condition and behaviour of the buying parties. For investment properties with appraisal conducted prior to the end of the reporting period, management determines whether there are significant circumstances during the intervening period that may require adjustments or changes in the disclosure of the fair value of those properties.
- 23 -
DRAFT
(e) Determining Realizable Amount of Deferred Tax Assets
The Bank reviews its deferred tax assets at the end of each reporting period and reduces the carrying amount to the extent that it is no longer probable that sufficient taxable profit will be available to allow all or part of the deferred tax asset to be utilized. Management assessed that the carrying amount of deferred tax assets recognized in the statements of financial position as disclosed in Note 17.1 can be utilized in the coming years or within their prescriptive period.
(f) Impairment of Non-financial Assets
Except for intangible assets with indefinite useful lives, PFRS requires that an impairment review be performed when certain impairment indications are present. In assessing impairment, management estimates the recoverable amount of each asset or cash-generating unit based on expected future cash flows and uses an interest rate to calculate the present value of those cash flows. Estimation uncertainty relates to assumptions about future operating results and the determination of a suitable discount rate (see Note 2.15). Though management believes that the assumptions used in the estimation of fair values reflected in the financial statements are appropriate and reasonable, significant changes in these assumptions may materially affect the assessment of recoverable values and any resulting impairment loss could have a material adverse effect on the results of operations. Management has assessed that there are no indications of impairment on any of the Bank’s non-financial assets as of December 31, 2012 and 2011.
(g) Valuation of Post-employment Defined Benefit
The determination of the amounts of post-employment benefit obligation is dependent on the selection of certain assumptions used by actuaries in calculating such amounts. Those assumptions include, among others, discount rates, expected rate of return on plan assets, expected rate of salary increases, and employee turnover rate. In accordance with PFRS, actual results that differ from the assumptions are accumulated and amortized over future periods and therefore, generally affect the expense and the carrying amount of post-employment obligation in such future periods. The amounts of post-employment benefit obligation and expense and an analysis of the movements in the estimated present value of post-employment benefit obligation are presented in Note 16.2.
4. RISK MANAGEMENT OBJECTIVES AND POLICIES By their nature, the Bank’s activities are principally related to the use of financial instruments. The Bank accepts deposits from customers at fixed rate, and for various periods, and seeks to earn above-average interest margins by investing these funds in high-quality assets. The Bank seeks to increase these margins by consolidating short-term funds and lending for longer periods at higher rates, while maintaining sufficient liquidity to meet all claims that might fall due.
- 24 -
DRAFT
The Bank also trades financial instruments where it takes positions in traded and over-the-counter instruments, to take advantage of short-term market movements in equities and bonds. The Bank’s Risk Management Committee (RMC) has overall responsibility for the Bank’s risk management systems and sets risks management policies across the full range of risks to which the Bank is exposed. The Bank’s RMC places trading limits on the level of exposure that can be taken in relation to both overnight and intra-day market positions. It provides written principles for overall risk management, as well as written policies covering specific areas, such as credit risk, liquidity risk, foreign exchange risk, and investment of excess liquidity. 4.1 Credit Risk Credit risk is the risk that the counterparty in a transaction may default and arises from lending, treasury, and other activities undertaken by the Bank. The Bank manages its credit risk and loan portfolio through the Accounts Management Department (AMD), which undertakes several functions with respect to credit risk management. Impairment provisions are provided for losses that have been incurred at the end of the reporting period. Significant changes in the economy, or in the health of a particular industry segments that represents a concentration in the Bank’s portfolio, could result in losses that are different from those provided for at the end of the reporting period. Management therefore carefully manages its exposure to credit risk. The AMD undertakes credit analysis and review to ensure consistency in the Bank’s risk assessment process. The AMD performs risk ratings for corporate accounts and risk scoring for consumer accounts. It also ensures that the Bank’s credit policies and procedures are adequate to meet the demands of the business. The AMD is also responsible for developing procedures to streamline and expedite the processing of credit applications. The AMD also undertakes portfolio management by reviewing the Bank’s loan portfolio, including the portfolio risks associated with particular industry sectors, loan size and maturity, and development of a strategy for the Bank to achieve its desired portfolio mix and risk profile. The Bank structures the levels of credit risk it undertakes by placing limits on the amount of risk accepted in relation to one borrower, or groups of borrowers, and to geographical and industry segments. Such risks are monitored on a revolving basis and subject to an annual or more frequent review. Exposure to credit risk is managed through regular analysis of the ability of borrowers and potential borrowers to meet interest and capital repayment obligations and by changing these lending limits when appropriate. Exposure to credit risk is also managed in part by obtaining collateral and corporate and personal guarantees. The AMD reviews the Bank’s loan portfolio in line with the Bank’s policy of not having significant unwarranted concentrations of exposure to individual counterparties, in accordance with the BSP’s prohibitions on maintaining a financial exposure to any single person or group of connected persons in excess of 25% of its net worth.
- 25 -
DRAFT
Loan classification is an integral part of the Bank’s management of credit risk. On an annual basis, loans are reviewed, classified and rated based on internal and external factors that affect their performance. On a quarterly basis, loan classifications of impaired accounts are assessed and the results are used as basis for the review of loan loss provisions. Generally, accounts are classified by the Bank based on the loan credit quality as follows: (a) Unclassified
These are individual credits that do not have a greater-than-normal risk and do not possess the characteristics of adversely classified loans as defined below. These are credits that have the apparent ability to satisfy their obligations in full and therefore, no loss in ultimate collection is anticipated. These are adequately secured by readily marketable collateral or other forms of support security or are supported by sufficient credit and financial information of favorable nature to assure repayment as agreed.
(b) Loans Especially Mentioned (LEM) Accounts classified as LEM are individual credits that have potential weaknesses particularly on documentation or credit administration that deserve management’s close attention. These potential weaknesses, if left uncorrected, may affect the repayment prospects of the loan and thus heighten the credit risk to the Bank. A credit may also be classified as LEM if there is evidence of weakness in the borrower’s financial condition or credit worthiness, or the credit is subject to an unrealistic repayment program or inadequate source of funds.
(c) Substandard Accounts classified as “Substandard” are individual credits or portions thereof, which appear to involve a substantial and unreasonable degree of risk to the Bank because of unfavorable record or unsatisfactory characteristics. There exists in such accounts the possibility of future loss to the Bank unless given closer supervision. Those classified as “Substandard” must have a well-defined weakness or weaknesses that jeopardize their liquidation. Such well-defined weaknesses may include adverse trends or development of financial, managerial, economic or political nature, or a significant weakness in collateral.
(d) Doubtful
Accounts classified as “Doubtful” are individual credits or portions thereof which have the weaknesses inherent in those classified as “Substandard”, with the added characteristics that existing facts, conditions and values make collection or liquidation in full highly improbable and in which substantial loss is probable. Positive and vigorous action is required to avert or minimize losses.
- 26 -
DRAFT
(e) Loss
Accounts classified as “Loss” are individual credits or portions thereof which are considered uncollectible or worthless and of such little value that their continuance as bankable assets is not warranted although the loans may have some recovery or salvage value. The amount of loss is difficult to measure and it is not practical or desirable to defer writing off these basically worthless assets even though partial recovery may be obtained in the future.
4.1.1 Exposure to Credit Risk
The carrying amount of financial assets recognized in the financial statements, represents the Bank’s maximum exposure to credit risk without taking into account the value of any collateral obtained. The table below shows the credit quality by class of financial assets as of December 31, 2012. Neither Past Due nor Specifically Impaired Past Due High Standard Individually Grade Grade Impaired Total Cash and cash items P 122,574,664 P - P - P 122,574,664 Due from BSP 225,855,077 - - 225,855,077 Due from other banks 112,890,196 - - 112,890,196 AFS securities 83,945,957 - - 83,945,957 Loans and receivables 2,026,417,217 - 29,463,621 2,055,880,838 P 2,571,683,111 P - P 29,463,621 P 2,601,146,732
The credit quality by class of financial assets as of December 31, 2011 follows: Neither Past Due nor Specifically Impaired Past Due High Standard Individually Grade Grade Impaired Total Cash and cash items P 93,698,892 P - P - P 93,698,892 Due from BSP 456,418,925 - - 456,418,925 Due from other banks 200,252,193 - - 200,252,193 AFS securities 95,750,428 - - 95,750,428 Loans and receivables 1,513,541,642 - 24,142,979 1,537,684,621 P 2,359,662,080 P - P 24,142,979 P 2,383,805,059
AFS securities exposed to credit risk as of December 31, 2012 and 2011 pertain to quoted and unquoted government debt securities (see Note 7). The Due from BSP account represents the aggregate balance of interest-bearing and noninterest-bearing deposit accounts in local currency maintained by the Bank with the BSP primarily to meet reserve requirements and to serve as clearing account for interbank claims. Hence, no significant credit risk is anticipated for this account.
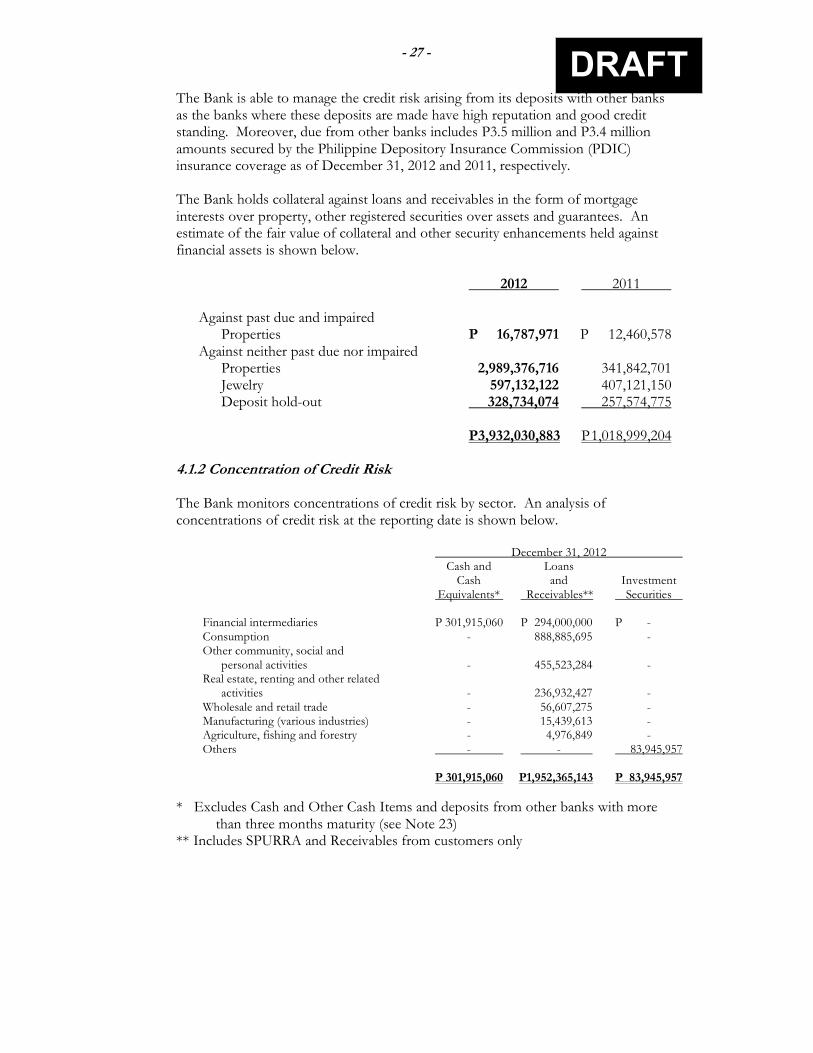
- 27 -
DRAFT
The Bank is able to manage the credit risk arising from its deposits with other banks as the banks where these deposits are made have high reputation and good credit standing. Moreover, due from other banks includes P3.5 million and P3.4 million amounts secured by the Philippine Depository Insurance Commission (PDIC) insurance coverage as of December 31, 2012 and 2011, respectively. The Bank holds collateral against loans and receivables in the form of mortgage interests over property, other registered securities over assets and guarantees. An estimate of the fair value of collateral and other security enhancements held against financial assets is shown below.
2012 2011 Against past due and impaired Properties P 16,787,971 P 12,460,578 Against neither past due nor impaired Properties 2,989,376,716 341,842,701 Jewelry 597,132,122 407,121,150 Deposit hold-out 328,734,074 257,574,775 P3,932,030,883 P 1,018,999,204 4.1.2 Concentration of Credit Risk
The Bank monitors concentrations of credit risk by sector. An analysis of concentrations of credit risk at the reporting date is shown below.
December 31, 2012 Cash and Loans Cash and Investment Equivalents* Receivables** Securities Financial intermediaries P 301,915,060 P 294,000,000 P - Consumption - 888,885,695 - Other community, social and personal activities - 455,523,284 - Real estate, renting and other related activities - 236,932,427 - Wholesale and retail trade - 56,607,275 - Manufacturing (various industries) - 15,439,613 - Agriculture, fishing and forestry - 4,976,849 - Others - - 83,945,957 P 301,915,060 P1,952,365,143 P 83,945,957
* Excludes Cash and Other Cash Items and deposits from other banks with more than three months maturity (see Note 23) ** Includes SPURRA and Receivables from customers only
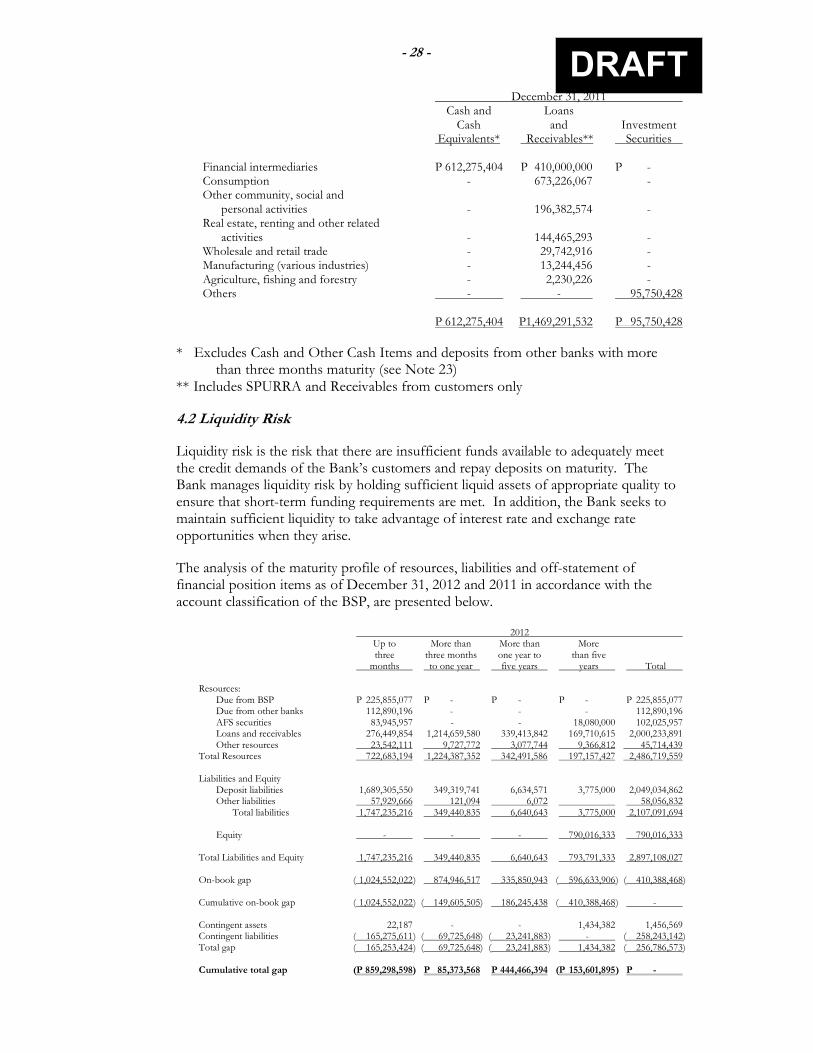
- 28 -
DRAFT
December 31, 2011 Cash and Loans Cash and Investment Equivalents* Receivables** Securities Financial intermediaries P 612,275,404 P 410,000,000 P - Consumption - 673,226,067 - Other community, social and personal activities - 196,382,574 - Real estate, renting and other related activities - 144,465,293 - Wholesale and retail trade - 29,742,916 - Manufacturing (various industries) - 13,244,456 - Agriculture, fishing and forestry - 2,230,226 - Others - - 95,750,428 P 612,275,404 P1,469,291,532 P 95,750,428
* Excludes Cash and Other Cash Items and deposits from other banks with more than three months maturity (see Note 23) ** Includes SPURRA and Receivables from customers only
4.2 Liquidity Risk Liquidity risk is the risk that there are insufficient funds available to adequately meet the credit demands of the Bank’s customers and repay deposits on maturity. The Bank manages liquidity risk by holding sufficient liquid assets of appropriate quality to ensure that short-term funding requirements are met. In addition, the Bank seeks to maintain sufficient liquidity to take advantage of interest rate and exchange rate opportunities when they arise. The analysis of the maturity profile of resources, liabilities and off-statement of financial position items as of December 31, 2012 and 2011 in accordance with the account classification of the BSP, are presented below. 2012 Up to More than More than More three three months one year to than five months to one year five years years Total Resources: Due from BSP P 225,855,077 P - P - P - P 225,855,077 Due from other banks 112,890,196 - - - 112,890,196 AFS securities 83,945,957 - - 18,080,000 102,025,957 Loans and receivables 276,449,854 1,214,659,580 339,413,842 169,710,615 2,000,233,891 Other resources 23,542,111 9,727,772 3,077,744 9,366,812 45,714,439 Total Resources 722,683,194 1,224,387,352 342,491,586 197,157,427 2,486,719,559 Liabilities and Equity Deposit liabilities 1,689,305,550 349,319,741 6,634,571 3,775,000 2,049,034,862 Other liabilities 57,929,666 121,094 6,072 58,056,832 Total liabilities 1,747,235,216 349,440,835 6,640,643 3,775,000 2,107,091,694 Equity - - - 790,016,333 790,016,333 Total Liabilities and Equity 1,747,235,216 349,440,835 6,640,643 793,791,333 2,897,108,027 On-book gap ( 1,024,552,022 ) 874,946,517 335,850,943 ( 596,633,906 ) ( 410,388,468) Cumulative on-book gap ( 1,024,552,022 ) ( 149,605,505) 186,245,438 ( 410,388,468 ) - Contingent assets 22,187 - - 1,434,382 1,456,569 Contingent liabilities ( 165,275,611 ) ( 69,725,648) ( 23,241,883 ) - ( 258,243,142) Total gap ( 165,253,424 ) ( 69,725,648) ( 23,241,883 ) 1,434,382 ( 256,786,573) Cumulative total gap (P 859,298,598) P 85,373,568 P 444,466,394 (P 153,601,895 ) P -
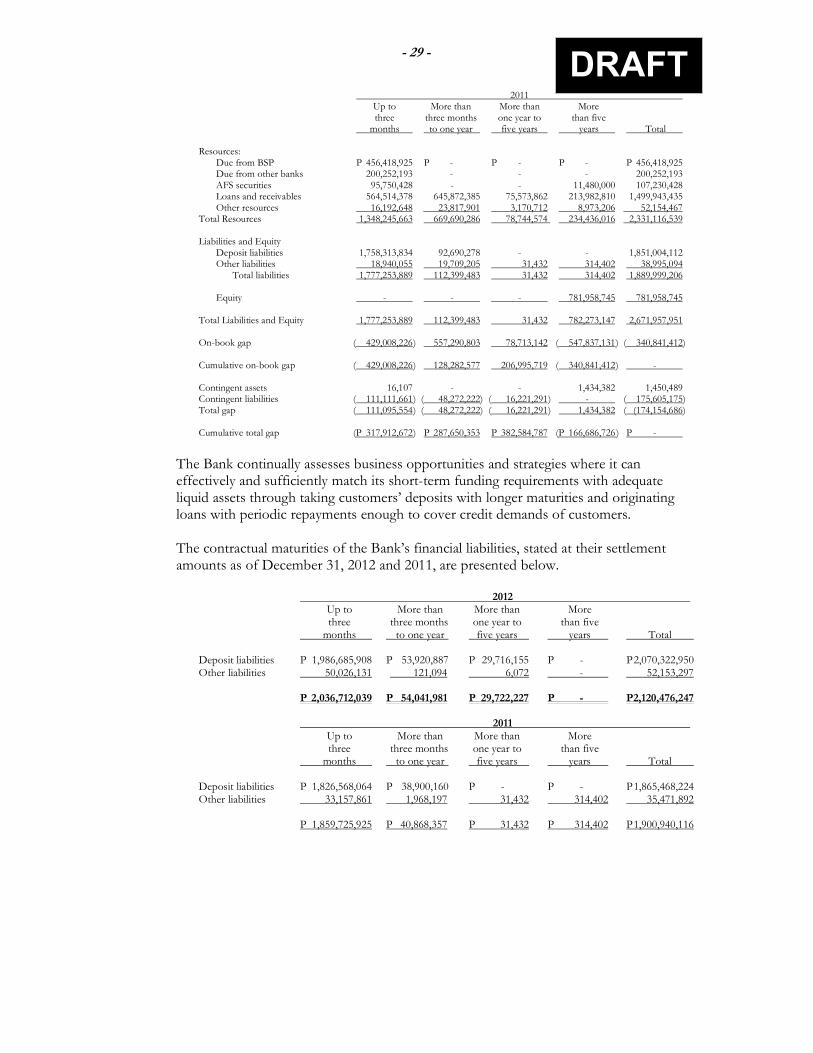
- 29 -
DRAFT
2011 Up to More than More than More three three months one year to than five months to one year five years years Total Resources: Due from BSP P 456,418,925 P - P - P - P 456,418,925 Due from other banks 200,252,193 - - - 200,252,193 AFS securities 95,750,428 - - 11,480,000 107,230,428 Loans and receivables 564,514,378 645,872,385 75,573,862 213,982,810 1,499,943,435 Other resources 16,192,648 23,817,901 3,170,712 8,973,206 52,154,467 Total Resources 1,348,245,663 669,690,286 78,744,574 234,436,016 2,331,116,539 Liabilities and Equity Deposit liabilities 1,758,313,834 92,690,278 - - 1,851,004,112 Other liabilities 18,940,055 19,709,205 31,432 314,402 38,995,094 Total liabilities 1,777,253,889 112,399,483 31,432 314,402 1,889,999,206 Equity - - - 781,958,745 781,958,745 Total Liabilities and Equity 1,777,253,889 112,399,483 31,432 782,273,147 2,671,957,951 On-book gap ( 429,008,226 ) 557,290,803 78,713,142 ( 547,837,131 ) ( 340,841,412) Cumulative on-book gap ( 429,008,226 ) 128,282,577 206,995,719 ( 340,841,412 ) - Contingent assets 16,107 - - 1,434,382 1,450,489 Contingent liabilities ( 111,111,661 ) ( 48,272,222) ( 16,221,291 ) - ( 175,605,175) Total gap ( 111,095,554 ) ( 48,272,222) ( 16,221,291 ) 1,434,382 ( (174,154,686) Cumulative total gap (P 317,912,672 ) P 287,650,353 P 382,584,787 (P 166,686,726 ) P -
The Bank continually assesses business opportunities and strategies where it can effectively and sufficiently match its short-term funding requirements with adequate liquid assets through taking customers’ deposits with longer maturities and originating loans with periodic repayments enough to cover credit demands of customers.
The contractual maturities of the Bank’s financial liabilities, stated at their settlement amounts as of December 31, 2012 and 2011, are presented below.
2012 Up to More than More than More three three months one year to than five months to one year five years years Total Deposit liabilities P 1,986,685,908 P 53,920,887 P 29,716,155 P - P 2,070,322,950 Other liabilities 50,026,131 121,094 6,072 - 52,153,297 P 2,036,712,039 P 54,041,981 P 29,722,227 P - P2,120,476,247
2011 Up to More than More than More three three months one year to than five months to one year five years years Total Deposit liabilities P 1,826,568,064 P 38,900,160 P - P - P 1,865,468,224 Other liabilities 33,157,861 1,968,197 31,432 314,402 35,471,892 P 1,859,725,925 P 40,868,357 P 31,432 P 314,402 P 1,900,940,116
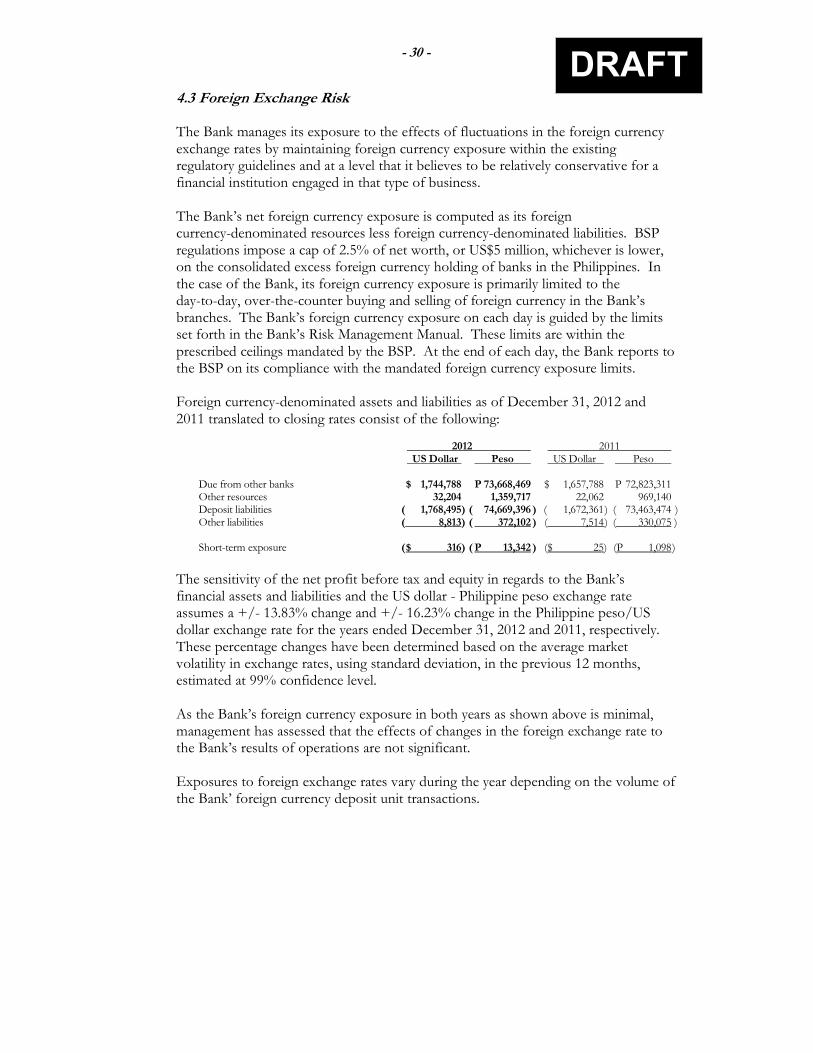
- 30 -
DRAFT
4.3 Foreign Exchange Risk The Bank manages its exposure to the effects of fluctuations in the foreign currency exchange rates by maintaining foreign currency exposure within the existing regulatory guidelines and at a level that it believes to be relatively conservative for a financial institution engaged in that type of business. The Bank’s net foreign currency exposure is computed as its foreign currency-denominated resources less foreign currency-denominated liabilities. BSP regulations impose a cap of 2.5% of net worth, or US$5 million, whichever is lower, on the consolidated excess foreign currency holding of banks in the Philippines. In the case of the Bank, its foreign currency exposure is primarily limited to the day-to-day, over-the-counter buying and selling of foreign currency in the Bank’s branches. The Bank’s foreign currency exposure on each day is guided by the limits set forth in the Bank’s Risk Management Manual. These limits are within the prescribed ceilings mandated by the BSP. At the end of each day, the Bank reports to the BSP on its compliance with the mandated foreign currency exposure limits.
Foreign currency-denominated assets and liabilities as of December 31, 2012 and 2011 translated to closing rates consist of the following:
2012 2011 US Dollar Peso US Dollar Peso Due from other banks $ 1,744,788 P 73,668,469 $ 1,657,788 P 72,823,311 Other resources 32,204 1,359,717 22,062 969,140 Deposit liabilities ( 1,768,495) ( 74,669,396 ) ( 1,672,361 ) ( 73,463,474 ) Other liabilities ( 8,813) ( 372,102 ) ( 7,514 ) ( 330,075 ) Short-term exposure ( $ 316) ( P 13,342 ) ( $ 25) (P 1,098 )
The sensitivity of the net profit before tax and equity in regards to the Bank’s financial assets and liabilities and the US dollar - Philippine peso exchange rate assumes a +/- 13.83% change and +/- 16.23% change in the Philippine peso/US dollar exchange rate for the years ended December 31, 2012 and 2011, respectively. These percentage changes have been determined based on the average market volatility in exchange rates, using standard deviation, in the previous 12 months, estimated at 99% confidence level. As the Bank’s foreign currency exposure in both years as shown above is minimal, management has assessed that the effects of changes in the foreign exchange rate to the Bank’s results of operations are not significant. Exposures to foreign exchange rates vary during the year depending on the volume of the Bank’ foreign currency deposit unit transactions.
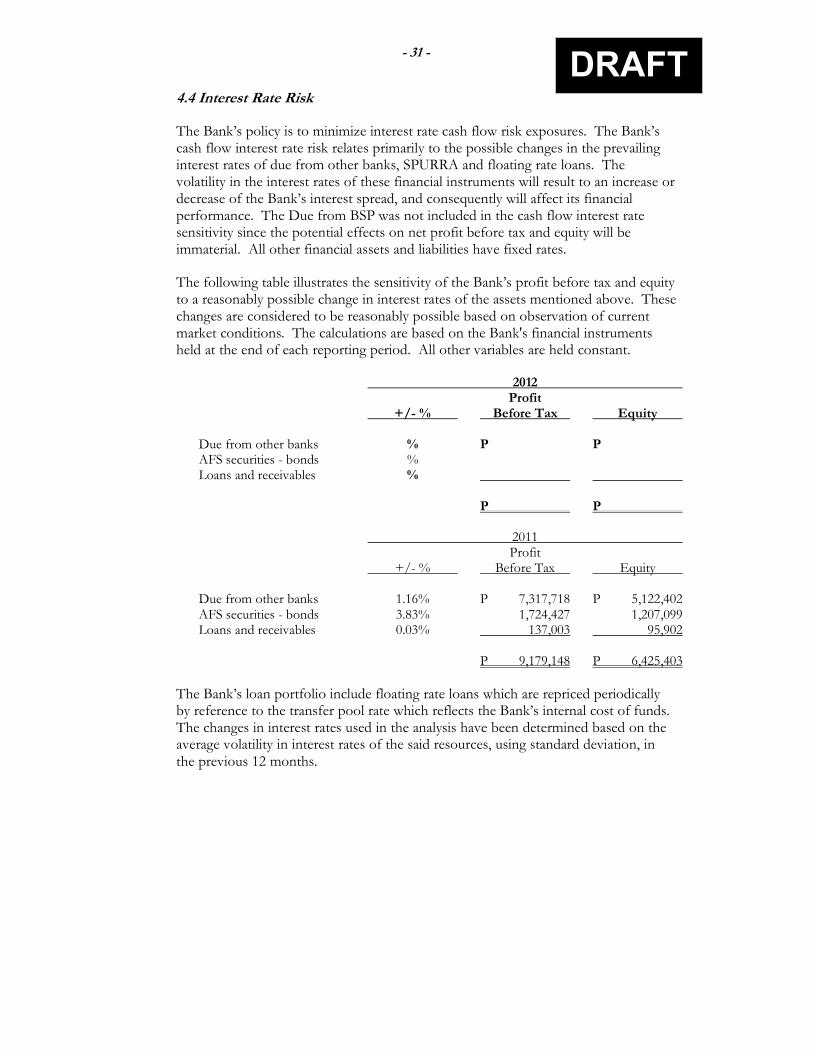
- 31 -
DRAFT
4.4 Interest Rate Risk
The Bank’s policy is to minimize interest rate cash flow risk exposures. The Bank’s cash flow interest rate risk relates primarily to the possible changes in the prevailing interest rates of due from other banks, SPURRA and floating rate loans. The volatility in the interest rates of these financial instruments will result to an increase or decrease of the Bank’s interest spread, and consequently will affect its financial performance. The Due from BSP was not included in the cash flow interest rate sensitivity since the potential effects on net profit before tax and equity will be immaterial. All other financial assets and liabilities have fixed rates.
The following table illustrates the sensitivity of the Bank’s profit before tax and equity to a reasonably possible change in interest rates of the assets mentioned above. These changes are considered to be reasonably possible based on observation of current market conditions. The calculations are based on the Bank's financial instruments held at the end of each reporting period. All other variables are held constant.
2012 Profit +/- % Before Tax Equity Due from other banks % P P AFS securities - bonds % Loans and receivables % P P 2011 Profit +/- % Before Tax Equity Due from other banks 1.16% P 7,317,718 P 5,122,402 AFS securities - bonds 3.83% 1,724,427 1,207,099 Loans and receivables 0.03% 137,003 95,902 P 9,179,148 P 6,425,403
The Bank’s loan portfolio include floating rate loans which are repriced periodically by reference to the transfer pool rate which reflects the Bank’s internal cost of funds. The changes in interest rates used in the analysis have been determined based on the average volatility in interest rates of the said resources, using standard deviation, in the previous 12 months.
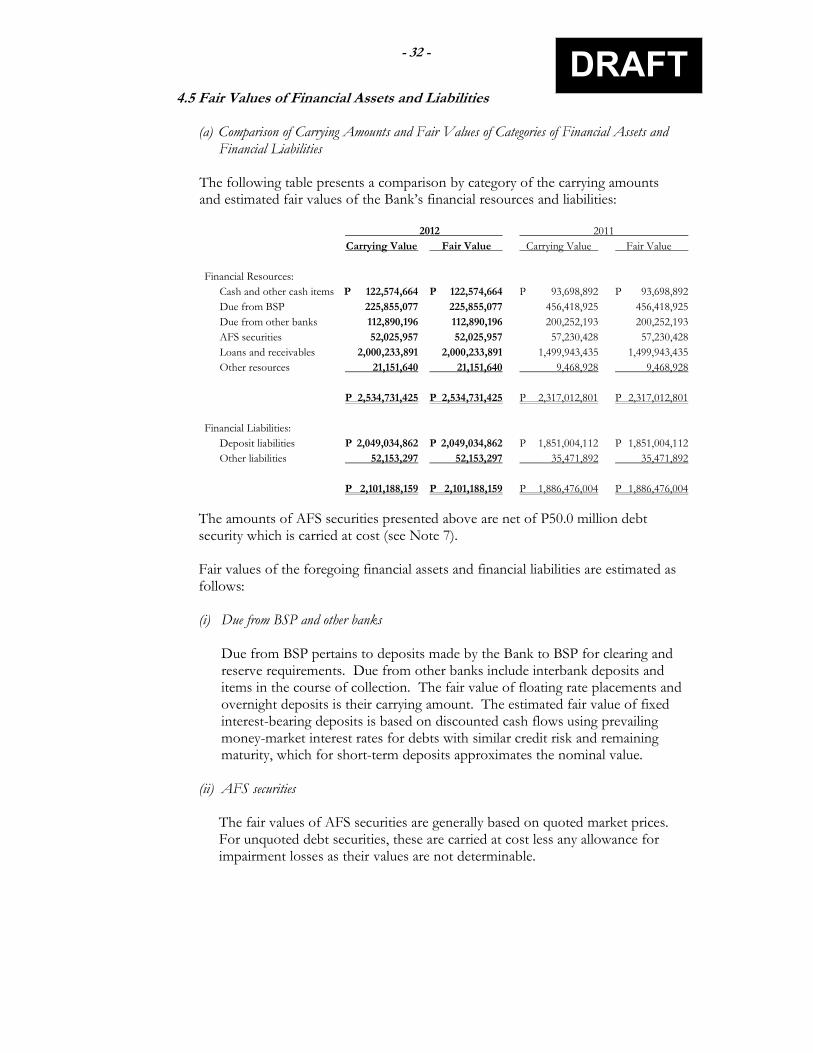
- 32 -
DRAFT
4.5 Fair Values of Financial Assets and Liabilities
(a) Comparison of Carrying Amounts and Fair Values of Categories of Financial Assets and Financial Liabilities
The following table presents a comparison by category of the carrying amounts and estimated fair values of the Bank’s financial resources and liabilities:
2012 2011
Carrying Value Fair Value Carrying Value Fair Value
Financial Resources:
Cash and other cash items P 122,574,664 P 122,574,664 P 93,698,892 P 93,698,892
Due from BSP 225,855,077 225,855,077 456,418,925 456,418,925
Due from other banks 112,890,196 112,890,196 200,252,193 200,252,193
AFS securities 52,025,957 52,025,957 57,230,428 57,230,428
Loans and receivables 2,000,233,891 2,000,233,891 1,499,943,435 1,499,943,435
Other resources 21,151,640 21,151,640 9,468,928 9,468,928
P 2,534,731,425 P 2,534,731,425 P 2,317,012,801 P 2,317,012,801
Financial Liabilities:
Deposit liabilities P 2,049,034,862 P 2,049,034,862 P 1,851,004,112 P 1,851,004,112
Other liabilities 52,153,297 52,153,297 35,471,892 35,471,892
P 2,101,188,159 P 2,101,188,159 P 1,886,476,004 P 1,886,476,004
The amounts of AFS securities presented above are net of P50.0 million debt security which is carried at cost (see Note 7).
Fair values of the foregoing financial assets and financial liabilities are estimated as follows: (i) Due from BSP and other banks
Due from BSP pertains to deposits made by the Bank to BSP for clearing and reserve requirements. Due from other banks include interbank deposits and items in the course of collection. The fair value of floating rate placements and overnight deposits is their carrying amount. The estimated fair value of fixed interest-bearing deposits is based on discounted cash flows using prevailing money-market interest rates for debts with similar credit risk and remaining maturity, which for short-term deposits approximates the nominal value.
(ii) AFS securities
The fair values of AFS securities are generally based on quoted market prices. For unquoted debt securities, these are carried at cost less any allowance for impairment losses as their values are not determinable.

- 33 -
DRAFT
(iii) Loans and receivables and other resources
Loans and receivables and other resources are net of any impairment losses. The estimated fair value of loans and receivables and other resources represents the discounted amount of estimated future cash flows expected to be received for instruments with maturities of beyond one year. Expected cash flows are discounted at current market rates to determine fair value.
(iv) Deposits The estimated fair value of demand deposits with no stated maturity, which includes noninterest-bearing deposits, is the amount repayable on demand. The estimated fair value of interest-bearing deposits without quoted market price is based on discounted cash flows using interest rates for new debts with similar remaining maturity. The carrying amounts of deposits which are generally short-term in nature approximate their fair values.
(v) Other liabilities
Other liabilities are recognized initially at their fair value and subsequently measured at amounts to which they are to be paid. Fair value of these short-term liabilities approximates their carrying values.
(b) Fair Value Hierarchy The Bank’s, financial assets and liabilities measured at fair value in the statement of financial position are categorized in accordance with the fair value hierarchy. This hierarchy groups financial assets and liabilities into three levels based on the significance of inputs used in measuring the fair value of the financial assets and liabilities. The fair value hierarchy has the following levels:
• Level 1: quoted prices (unadjusted) in active markets for identical assets or liabilities;
• Level 2: inputs other than quoted prices included within Level 1 that are observable for the resource or liability, either directly (i.e., as prices) or indirectly (i.e., derived from prices); and,
• Level 3: inputs for the asset or liability that are not based on observable market data (unobservable inputs).
The level within which the financial asset or liability is classified is determined based on the lowest level of significant input to the fair value measurement.
As of December 31, 2012 and 2011, the Bank’s financial assets measured at fair value in the statement of financial position pertain to AFS financial assets which include quoted government debt securities whose fair values are determined under Level 1 hierarchy and are measured directly by reference to published prices in an active market. The fair values of proprietary club shares classified as AFS financial assets are determined under level 2 hierarchy and are measured directly by reference to quoted prices that are readily available from an SEC-registered club share broker (see Note 7).
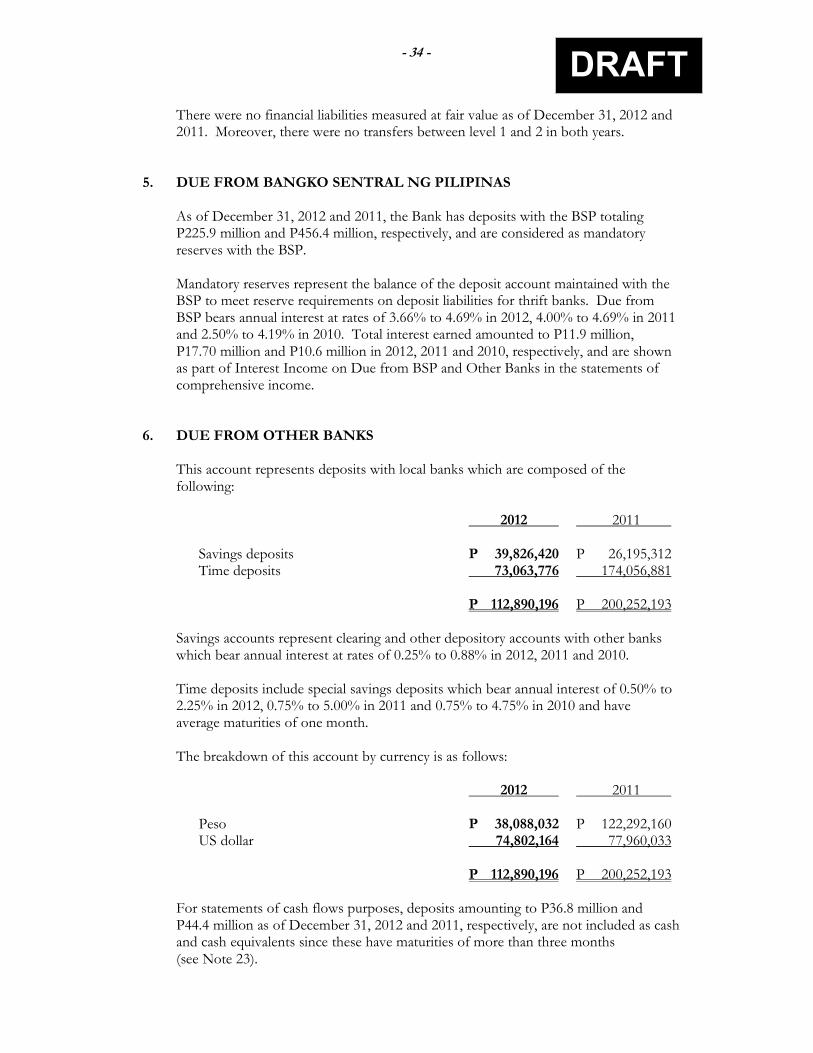
- 34 -
DRAFT
There were no financial liabilities measured at fair value as of December 31, 2012 and 2011. Moreover, there were no transfers between level 1 and 2 in both years.
5. DUE FROM BANGKO SENTRAL NG PILIPINAS
As of December 31, 2012 and 2011, the Bank has deposits with the BSP totaling P225.9 million and P456.4 million, respectively, and are considered as mandatory reserves with the BSP.
Mandatory reserves represent the balance of the deposit account maintained with the BSP to meet reserve requirements on deposit liabilities for thrift banks. Due from BSP bears annual interest at rates of 3.66% to 4.69% in 2012, 4.00% to 4.69% in 2011 and 2.50% to 4.19% in 2010. Total interest earned amounted to P11.9 million, P17.70 million and P10.6 million in 2012, 2011 and 2010, respectively, and are shown as part of Interest Income on Due from BSP and Other Banks in the statements of comprehensive income.
6. DUE FROM OTHER BANKS
This account represents deposits with local banks which are composed of the following:
2012 2011 Savings deposits P 39,826,420 P 26,195,312 Time deposits 73,063,776 174,056,881 P 112,890,196 P 200,252,193
Savings accounts represent clearing and other depository accounts with other banks which bear annual interest at rates of 0.25% to 0.88% in 2012, 2011 and 2010. Time deposits include special savings deposits which bear annual interest of 0.50% to 2.25% in 2012, 0.75% to 5.00% in 2011 and 0.75% to 4.75% in 2010 and have average maturities of one month. The breakdown of this account by currency is as follows:
2012 2011 Peso P 38,088,032 P 122,292,160 US dollar 74,802,164 77,960,033 P 112,890,196 P 200,252,193
For statements of cash flows purposes, deposits amounting to P36.8 million and P44.4 million as of December 31, 2012 and 2011, respectively, are not included as cash and cash equivalents since these have maturities of more than three months (see Note 23).
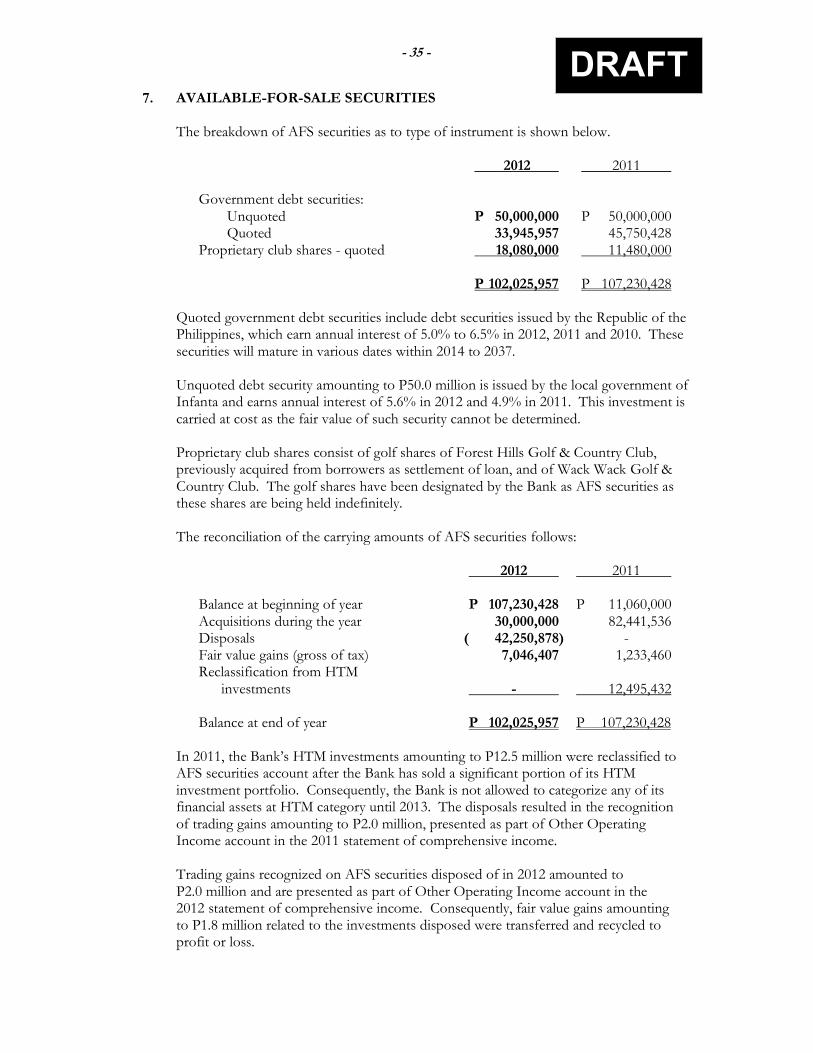
- 35 -
DRAFT
7. AVAILABLE-FOR-SALE SECURITIES The breakdown of AFS securities as to type of instrument is shown below.
2012 2011 Government debt securities: Unquoted P 50,000,000 P 50,000,000 Quoted 33,945,957 45,750,428 Proprietary club shares - quoted 18,080,000 11,480,000 P 102,025,957 P 107,230,428
Quoted government debt securities include debt securities issued by the Republic of the Philippines, which earn annual interest of 5.0% to 6.5% in 2012, 2011 and 2010. These securities will mature in various dates within 2014 to 2037. Unquoted debt security amounting to P50.0 million is issued by the local government of Infanta and earns annual interest of 5.6% in 2012 and 4.9% in 2011. This investment is carried at cost as the fair value of such security cannot be determined.
Proprietary club shares consist of golf shares of Forest Hills Golf & Country Club, previously acquired from borrowers as settlement of loan, and of Wack Wack Golf & Country Club. The golf shares have been designated by the Bank as AFS securities as these shares are being held indefinitely. The reconciliation of the carrying amounts of AFS securities follows:
2012 2011 Balance at beginning of year P 107,230,428 P 11,060,000 Acquisitions during the year 30,000,000 82,441,536 Disposals ( 42,250,878) - Fair value gains (gross of tax) 7,046,407 1,233,460 Reclassification from HTM investments - 12,495,432 Balance at end of year P 102,025,957 P 107,230,428
In 2011, the Bank’s HTM investments amounting to P12.5 million were reclassified to AFS securities account after the Bank has sold a significant portion of its HTM investment portfolio. Consequently, the Bank is not allowed to categorize any of its financial assets at HTM category until 2013. The disposals resulted in the recognition of trading gains amounting to P2.0 million, presented as part of Other Operating Income account in the 2011 statement of comprehensive income.
Trading gains recognized on AFS securities disposed of in 2012 amounted to P2.0 million and are presented as part of Other Operating Income account in the 2012 statement of comprehensive income. Consequently, fair value gains amounting to P1.8 million related to the investments disposed were transferred and recycled to profit or loss.
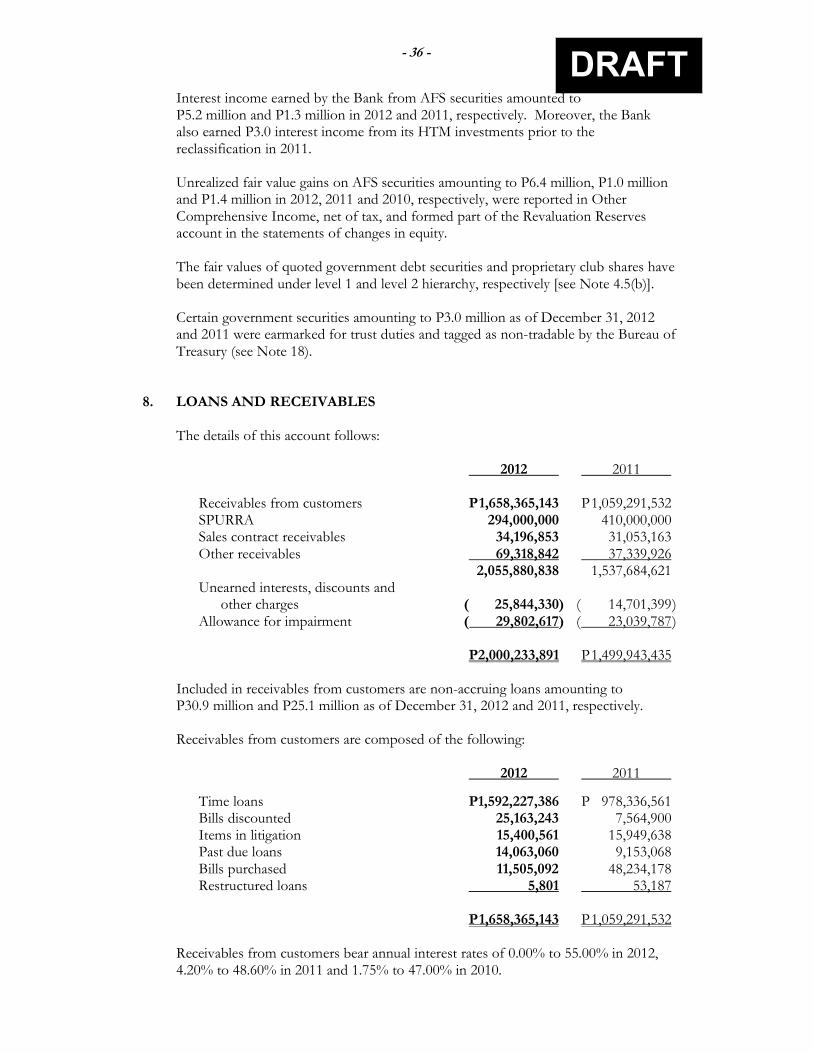
- 36 -
DRAFT
Interest income earned by the Bank from AFS securities amounted to P5.2 million and P1.3 million in 2012 and 2011, respectively. Moreover, the Bank also earned P3.0 interest income from its HTM investments prior to the reclassification in 2011. Unrealized fair value gains on AFS securities amounting to P6.4 million, P1.0 million and P1.4 million in 2012, 2011 and 2010, respectively, were reported in Other Comprehensive Income, net of tax, and formed part of the Revaluation Reserves account in the statements of changes in equity. The fair values of quoted government debt securities and proprietary club shares have been determined under level 1 and level 2 hierarchy, respectively [see Note 4.5(b)]. Certain government securities amounting to P3.0 million as of December 31, 2012 and 2011 were earmarked for trust duties and tagged as non-tradable by the Bureau of Treasury (see Note 18).
8. LOANS AND RECEIVABLES The details of this account follows:
2012 2011
Receivables from customers P 1,658,365,143 P 1,059,291,532 SPURRA 294,000,000 410,000,000
Sales contract receivables 34,196,853 31,053,163 Other receivables 69,318,842 37,339,926
2,055,880,838 1,537,684,621 Unearned interests, discounts and other charges ( 25,844,330) ( 14,701,399 )
Allowance for impairment ( 29,802,617) ( 23,039,787 ) P2,000,233,891 P 1,499,943,435
Included in receivables from customers are non-accruing loans amounting to P30.9 million and P25.1 million as of December 31, 2012 and 2011, respectively. Receivables from customers are composed of the following:
2012 2011
Time loans P1,592,227,386 P 978,336,561 Bills discounted 25,163,243 7,564,900 Items in litigation 15,400,561 15,949,638 Past due loans 14,063,060 9,153,068 Bills purchased 11,505,092 48,234,178 Restructured loans 5,801 53,187 P 1,658,365,143 P 1,059,291,532
Receivables from customers bear annual interest rates of 0.00% to 55.00% in 2012, 4.20% to 48.60% in 2011 and 1.75% to 47.00% in 2010.
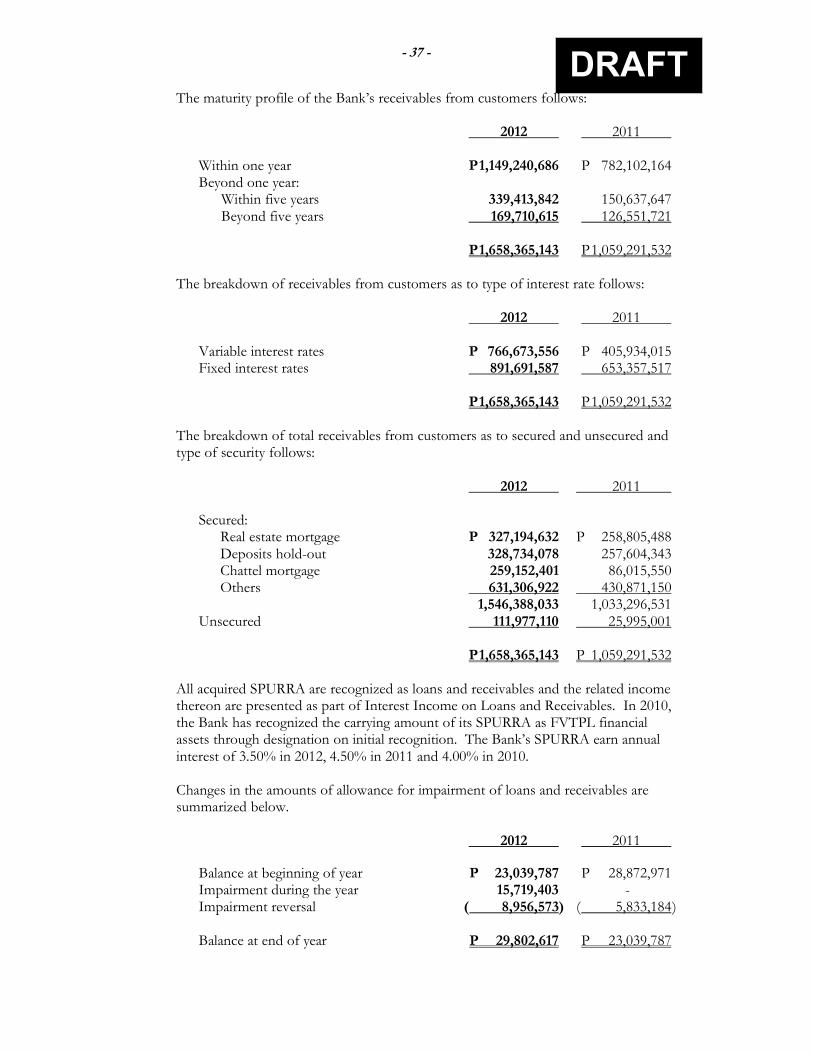
- 37 -
DRAFT
The maturity profile of the Bank’s receivables from customers follows:
2012 2011 Within one year P 1,149,240,686 P 782,102,164 Beyond one year: Within five years 339,413,842 150,637,647 Beyond five years 169,710,615 126,551,721 P 1,658,365,143 P 1,059,291,532
The breakdown of receivables from customers as to type of interest rate follows:
2012 2011 Variable interest rates P 766,673,556 P 405,934,015 Fixed interest rates 891,691,587 653,357,517 P 1,658,365,143 P 1,059,291,532
The breakdown of total receivables from customers as to secured and unsecured and type of security follows:
2012 2011 Secured: Real estate mortgage P 327,194,632 P 258,805,488 Deposits hold-out 328,734,078 257,604,343 Chattel mortgage 259,152,401 86,015,550 Others 631,306,922 430,871,150 1,546,388,033 1,033,296,531 Unsecured 111,977,110 25,995,001 P 1,658,365,143 P 1,059,291,532
All acquired SPURRA are recognized as loans and receivables and the related income thereon are presented as part of Interest Income on Loans and Receivables. In 2010, the Bank has recognized the carrying amount of its SPURRA as FVTPL financial assets through designation on initial recognition. The Bank’s SPURRA earn annual interest of 3.50% in 2012, 4.50% in 2011 and 4.00% in 2010.
Changes in the amounts of allowance for impairment of loans and receivables are summarized below.
2012 2011
Balance at beginning of year P 23,039,787 P 28,872,971 Impairment during the year 15,719,403 - Impairment reversal ( 8,956,573) ( 5,833,184 ) Balance at end of year P 29,802,617 P 23,039,787
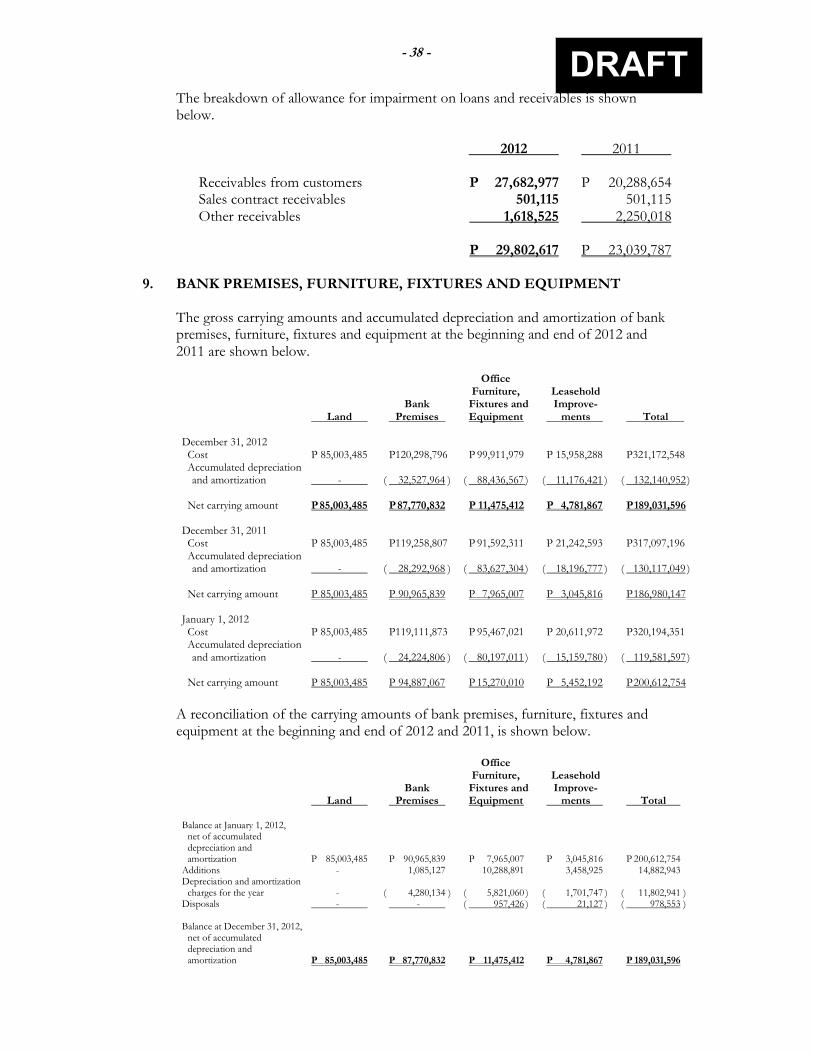
- 38 -
DRAFT
The breakdown of allowance for impairment on loans and receivables is shown below.
2012 2011
Receivables from customers P 27,682,977 P 20,288,654 Sales contract receivables 501,115 501,115 Other receivables 1,618,525 2,250,018
P 29,802,617 P 23,039,787 9. BANK PREMISES, FURNITURE, FIXTURES AND EQUIPMENT
The gross carrying amounts and accumulated depreciation and amortization of bank premises, furniture, fixtures and equipment at the beginning and end of 2012 and 2011 are shown below.
Office Furniture, Leasehold Bank Fixtures and Improve- Land Premises Equipment ments Total December 31, 2012 Cost P 85,003,485 P120,298,796 P 99,911,979 P 15,958,288 P321,172,548 Accumulated depreciation and amortization - ( 32,527,964 ) ( 88,436,567 ) ( 11,176,421 ) ( 132,140,952 ) Net carrying amount P 85,003,485 P 87,770,832 P 11,475,412 P 4,781,867 P 189,031,596 December 31, 2011 Cost P 85,003,485 P119,258,807 P 91,592,311 P 21,242,593 P317,097,196 Accumulated depreciation and amortization - ( 28,292,968 ) ( 83,627,304 ) ( 18,196,777 ) ( 130,117,049 ) Net carrying amount P 85,003,485 P 90,965,839 P 7,965,007 P 3,045,816 P 186,980,147 January 1, 2012 Cost P 85,003,485 P119,111,873 P 95,467,021 P 20,611,972 P320,194,351 Accumulated depreciation and amortization - ( 24,224,806 ) ( 80,197,011 ) ( 15,159,780 ) ( 119,581,597 ) Net carrying amount P 85,003,485 P 94,887,067 P 15,270,010 P 5,452,192 P 200,612,754
A reconciliation of the carrying amounts of bank premises, furniture, fixtures and equipment at the beginning and end of 2012 and 2011, is shown below. Office Furniture, Leasehold Bank Fixtures and Improve- Land Premises Equipment ments Total Balance at January 1, 2012, net of accumulated depreciation and amortization P 85,003,485 P 90,965,839 P 7,965,007 P 3,045,816 P 200,612,754 Additions - 1,085,127 10,288,891 3,458,925 14,882,943 Depreciation and amortization charges for the year - ( 4,280,134 ) ( 5,821,060 ) ( 1,701,747 ) ( 11,802,941 ) Disposals - - ( 957,426 ) ( 21,127 ) ( 978,553 )
Balance at December 31, 2012, net of accumulated depreciation and amortization P 85,003,485 P 87,770,832 P 11,475,412 P 4,781,867 P 189,031,596

- 39 -
DRAFT
Office Furniture, Leasehold Bank Fixtures and Improve- Land Premises Equipment ments Total Balance at January 1, 2011, net of accumulated depreciation and amortization P 85,003,485 P 94,887,067 P 15,270,010 P 5,452,192 P 200,612,754 Additions - 146,934 2,236,522 630,621 3,014,077 Depreciation and amortization charges for the year - ( 4,068,162 ) ( 8,277,777 ) ( 3,036,997 ) ( 15,382,936 ) Disposals - - ( 1,263,748 ) - ( 1,263,748 )
Balance at December 31, 2011, net of accumulated depreciation and amortization P 85,003,485 P 90,965,839 P 7,965,007 P 3,045,816 P 186,980,147
Depreciation and amortization expenses amounting to P11.8 million in 2012, P15.4 million in 2011 and P15.1 million in 2010 are shown as part of the Depreciation and Amortization account in the statements of comprehensive income. As of December 31, 2012, the gross carrying amount of the Bank’s fully-depreciated assets that are still in use is P86.4 million. The BSP requires that investments in fixed assets do not exceed 50% of the Bank’s unimpaired capital. As of December 31, 2012, the Bank has satisfactorily complied with this BSP requirement.
10. INVESTMENT PROPERTIES
The gross carrying amounts and accumulated depreciation and impairment of investment properties at the beginning and end of 2012 and 2011 are shown below.
Land Buildings Total December 31, 2012 Cost P 18,877,674 P 21,607,723 P 40,485,397 Accumulated depreciation - ( 4,969,614 ) ( 4,969,614 ) Allowance for impairment ( 550,089 ) - ( 550,089 ) Net carrying amount P 23,087,919 P 16,638,109 P 34,965,694 December 31, 2011 Cost P 23,638,008 P 18,358,950 P 41,996,958 Accumulated depreciation - ( 3,821,981 ) ( 3,821,981 ) Allowance for impairment ( 550,089 ) - ( 550,089 ) Net carrying amount P 23,087,919 P 14,536,969 P 37,624,888 January 1, 2011 Cost P 31,955,288 P 16,463,602 P 48,418,890 Accumulated depreciation - ( 2,524,382 ) ( 2,524,382 ) Allowance for impairment ( 550,089 ) - ( 550,089 ) Net carrying amount P 31,405,199 P 13,939,220 P 45,344,419
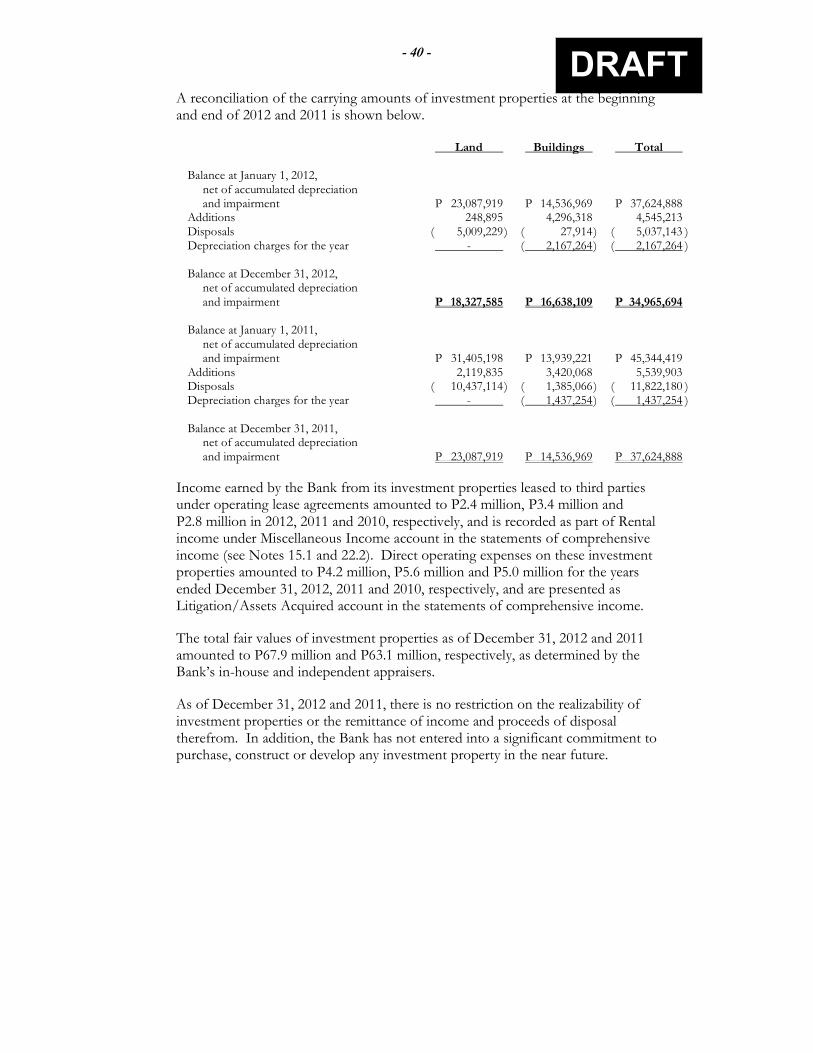
- 40 -
DRAFT
A reconciliation of the carrying amounts of investment properties at the beginning and end of 2012 and 2011 is shown below.
Land Buildings Total Balance at January 1, 2012, net of accumulated depreciation and impairment P 23,087,919 P 14,536,969 P 37,624,888 Additions 248,895 4,296,318 4,545,213 Disposals ( 5,009,229 ) ( 27,914 ) ( 5,037,143 ) Depreciation charges for the year - ( 2,167,264 ) ( 2,167,264 ) Balance at December 31, 2012, net of accumulated depreciation and impairment P 18,327,585 P 16,638,109 P 34,965,694 Balance at January 1, 2011, net of accumulated depreciation and impairment P 31,405,198 P 13,939,221 P 45,344,419 Additions 2,119,835 3,420,068 5,539,903 Disposals ( 10,437,114 ) ( 1,385,066 ) ( 11,822,180 ) Depreciation charges for the year - ( 1,437,254 ) ( 1,437,254 ) Balance at December 31, 2011, net of accumulated depreciation and impairment P 23,087,919 P 14,536,969 P 37,624,888
Income earned by the Bank from its investment properties leased to third parties under operating lease agreements amounted to P2.4 million, P3.4 million and P2.8 million in 2012, 2011 and 2010, respectively, and is recorded as part of Rental income under Miscellaneous Income account in the statements of comprehensive income (see Notes 15.1 and 22.2). Direct operating expenses on these investment properties amounted to P4.2 million, P5.6 million and P5.0 million for the years ended December 31, 2012, 2011 and 2010, respectively, and are presented as Litigation/Assets Acquired account in the statements of comprehensive income. The total fair values of investment properties as of December 31, 2012 and 2011 amounted to P67.9 million and P63.1 million, respectively, as determined by the Bank’s in-house and independent appraisers. As of December 31, 2012 and 2011, there is no restriction on the realizability of investment properties or the remittance of income and proceeds of disposal therefrom. In addition, the Bank has not entered into a significant commitment to purchase, construct or develop any investment property in the near future.
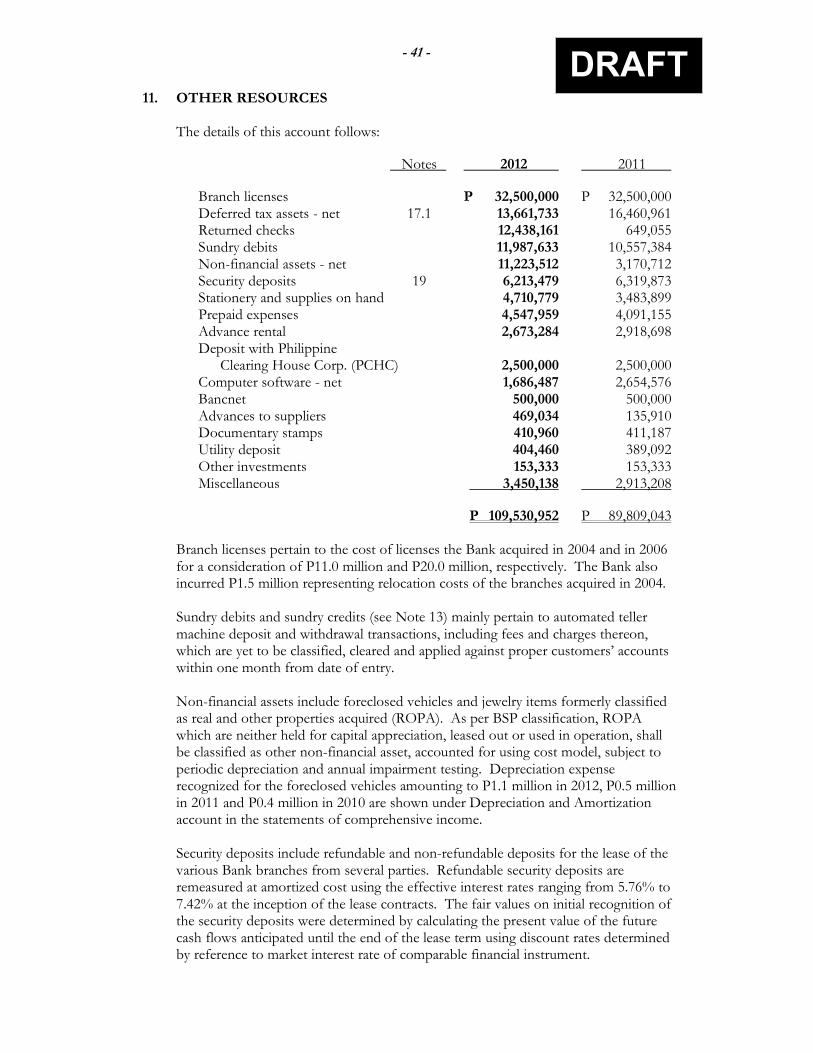
- 41 -
DRAFT
11. OTHER RESOURCES The details of this account follows:
Notes 2012 2011 Branch licenses P 32,500,000 P 32,500,000 Deferred tax assets - net 17.1 13,661,733 16,460,961 Returned checks 12,438,161 649,055 Sundry debits 11,987,633 10,557,384 Non-financial assets - net 11,223,512 3,170,712 Security deposits 19 6,213,479 6,319,873 Stationery and supplies on hand 4,710,779 3,483,899 Prepaid expenses 4,547,959 4,091,155 Advance rental 2,673,284 2,918,698 Deposit with Philippine Clearing House Corp. (PCHC) 2,500,000 2,500,000 Computer software - net 1,686,487 2,654,576 Bancnet 500,000 500,000 Advances to suppliers 469,034 135,910 Documentary stamps 410,960 411,187 Utility deposit 404,460 389,092 Other investments 153,333 153,333 Miscellaneous 3,450,138 2,913,208 P 109,530,952 P 89,809,043
Branch licenses pertain to the cost of licenses the Bank acquired in 2004 and in 2006 for a consideration of P11.0 million and P20.0 million, respectively. The Bank also incurred P1.5 million representing relocation costs of the branches acquired in 2004. Sundry debits and sundry credits (see Note 13) mainly pertain to automated teller machine deposit and withdrawal transactions, including fees and charges thereon, which are yet to be classified, cleared and applied against proper customers’ accounts within one month from date of entry. Non-financial assets include foreclosed vehicles and jewelry items formerly classified as real and other properties acquired (ROPA). As per BSP classification, ROPA which are neither held for capital appreciation, leased out or used in operation, shall be classified as other non-financial asset, accounted for using cost model, subject to periodic depreciation and annual impairment testing. Depreciation expense recognized for the foreclosed vehicles amounting to P1.1 million in 2012, P0.5 million in 2011 and P0.4 million in 2010 are shown under Depreciation and Amortization account in the statements of comprehensive income. Security deposits include refundable and non-refundable deposits for the lease of the various Bank branches from several parties. Refundable security deposits are remeasured at amortized cost using the effective interest rates ranging from 5.76% to 7.42% at the inception of the lease contracts. The fair values on initial recognition of the security deposits were determined by calculating the present value of the future cash flows anticipated until the end of the lease term using discount rates determined by reference to market interest rate of comparable financial instrument.
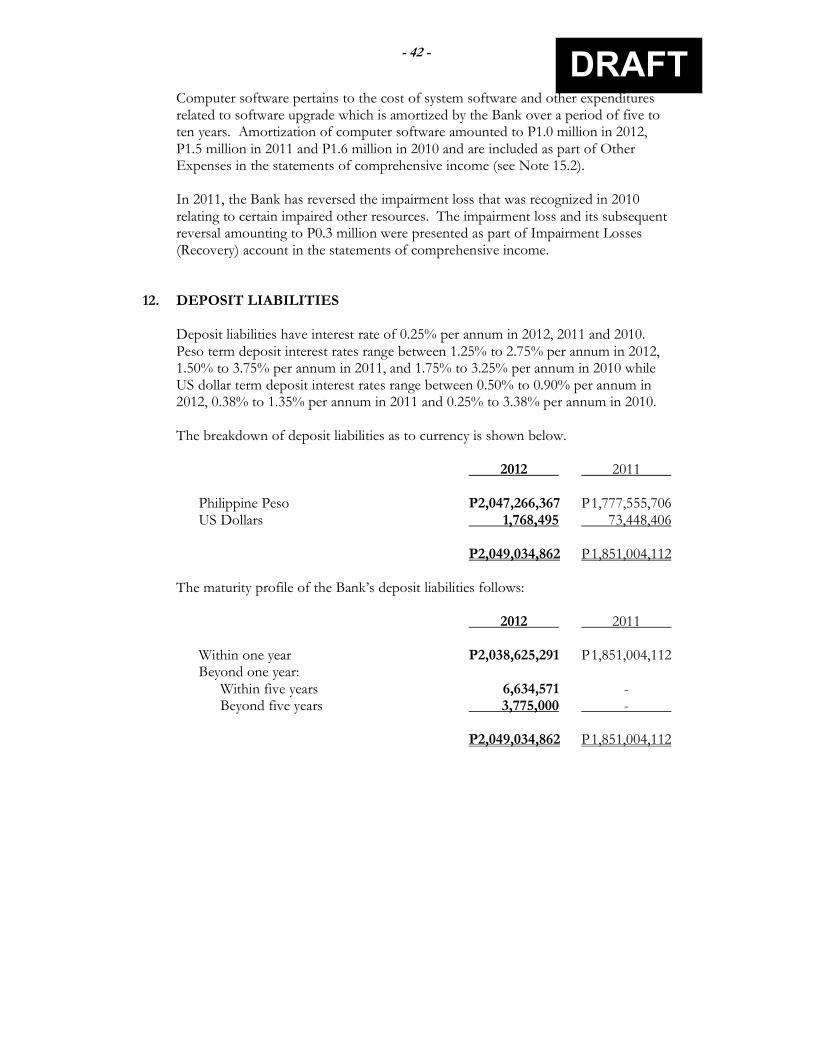
- 42 -
DRAFT
Computer software pertains to the cost of system software and other expenditures related to software upgrade which is amortized by the Bank over a period of five to ten years. Amortization of computer software amounted to P1.0 million in 2012, P1.5 million in 2011 and P1.6 million in 2010 and are included as part of Other Expenses in the statements of comprehensive income (see Note 15.2). In 2011, the Bank has reversed the impairment loss that was recognized in 2010 relating to certain impaired other resources. The impairment loss and its subsequent reversal amounting to P0.3 million were presented as part of Impairment Losses (Recovery) account in the statements of comprehensive income.
12. DEPOSIT LIABILITIES Deposit liabilities have interest rate of 0.25% per annum in 2012, 2011 and 2010. Peso term deposit interest rates range between 1.25% to 2.75% per annum in 2012, 1.50% to 3.75% per annum in 2011, and 1.75% to 3.25% per annum in 2010 while US dollar term deposit interest rates range between 0.50% to 0.90% per annum in 2012, 0.38% to 1.35% per annum in 2011 and 0.25% to 3.38% per annum in 2010. The breakdown of deposit liabilities as to currency is shown below.
2012 2011 Philippine Peso P2,047,266,367 P 1,777,555,706 US Dollars 1,768,495 73,448,406 P2,049,034,862 P 1,851,004,112
The maturity profile of the Bank’s deposit liabilities follows:
2012 2011
Within one year P2,038,625,291 P 1,851,004,112 Beyond one year: Within five years 6,634,571 - Beyond five years 3,775,000 - P2,049,034,862 P 1,851,004,112
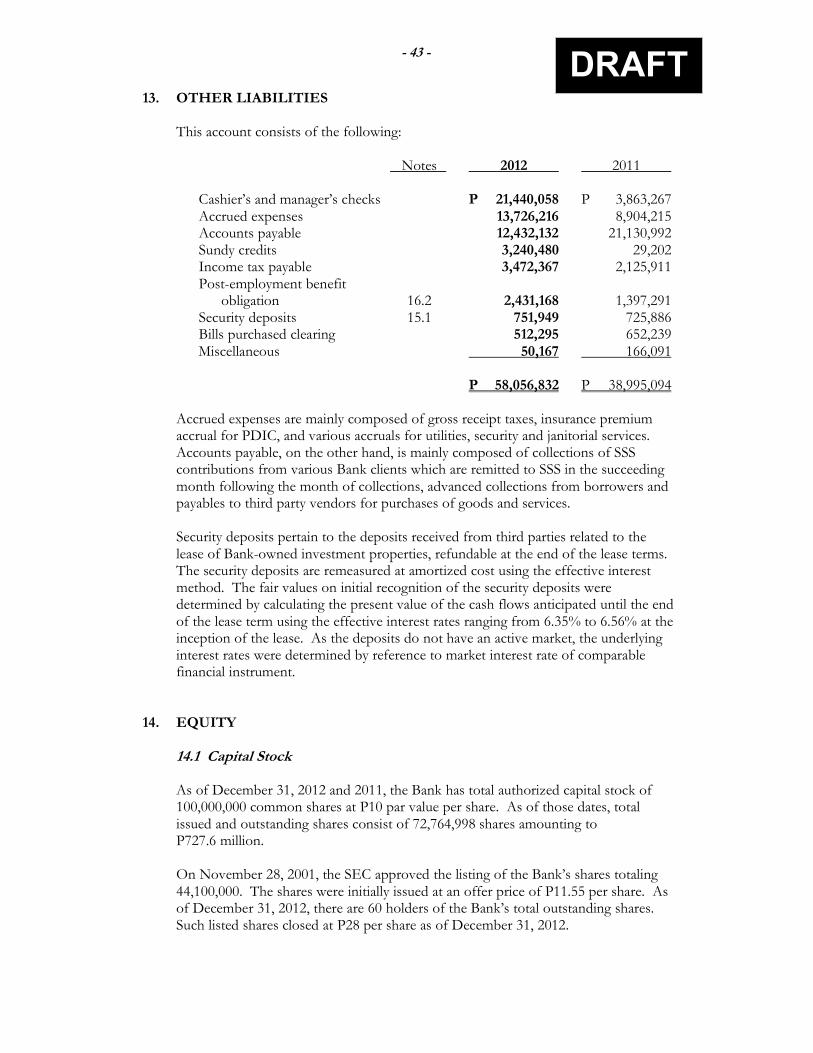
- 43 -
DRAFT
13. OTHER LIABILITIES
This account consists of the following:
Notes 2012 2011 Cashier’s and manager’s checks P 21,440,058 P 3,863,267 Accrued expenses 13,726,216 8,904,215 Accounts payable 12,432,132 21,130,992 Sundy credits 3,240,480 29,202 Income tax payable 3,472,367 2,125,911 Post-employment benefit obligation 16.2 2,431,168 1,397,291 Security deposits 15.1 751,949 725,886 Bills purchased clearing 512,295 652,239 Miscellaneous 50,167 166,091 P 58,056,832 P 38,995,094
Accrued expenses are mainly composed of gross receipt taxes, insurance premium accrual for PDIC, and various accruals for utilities, security and janitorial services. Accounts payable, on the other hand, is mainly composed of collections of SSS contributions from various Bank clients which are remitted to SSS in the succeeding month following the month of collections, advanced collections from borrowers and payables to third party vendors for purchases of goods and services. Security deposits pertain to the deposits received from third parties related to the lease of Bank-owned investment properties, refundable at the end of the lease terms. The security deposits are remeasured at amortized cost using the effective interest method. The fair values on initial recognition of the security deposits were determined by calculating the present value of the cash flows anticipated until the end of the lease term using the effective interest rates ranging from 6.35% to 6.56% at the inception of the lease. As the deposits do not have an active market, the underlying interest rates were determined by reference to market interest rate of comparable financial instrument.
14. EQUITY 14.1 Capital Stock As of December 31, 2012 and 2011, the Bank has total authorized capital stock of 100,000,000 common shares at P10 par value per share. As of those dates, total issued and outstanding shares consist of 72,764,998 shares amounting to P727.6 million. On November 28, 2001, the SEC approved the listing of the Bank’s shares totaling 44,100,000. The shares were initially issued at an offer price of P11.55 per share. As of December 31, 2012, there are 60 holders of the Bank’s total outstanding shares. Such listed shares closed at P28 per share as of December 31, 2012.

- 44 -
DRAFT
14.2 Retained Earnings On September 30, 2010, the Bank paid cash dividends amounting to P2.2 million. Such dividends were approved for declration by the Bank’s BOD on May 26, 2009 and by the BSP on July 28, 2010. 14.3 Capital Management and Regulatory Capital The BSP, as a lead regulator, sets and monitors capital requirements for the Bank. In implementing current capital requirements, the BSP requires the Bank to maintain a prescribed ratio of qualifying capital to risk-weighted assets. Under current banking regulations, the combined capital accounts of the Bank should not be less than an amount equal to 10% of its risk assets. The qualifying capital of the Bank for purposes of determining the capital-to-risk assets ratio is total equity excluding: (a) unbooked valuation reserves and other capital adjustments as may be required by
the BSP; (b) total outstanding unsecured credit accommodations to directors, officers,
stockholders and related interests; (c) deferred tax asset or liability; (d) goodwill;
(e) accumulated equity in earnings of investee where the Bank holds 50% or less but
where the equity method of accounting has been applied; and (f) appraisal increment on bank premises, furniture, fixtures and equipment other
than those allowed to be recognized in connection with a merger or acquisition.
Risk assets consist of total assets after exclusion of cash on hand, due from BSP, loans covered by hold-out on or assignment of deposits, loans or acceptances under letters of credit to the extent covered by margin deposits, and other non-risk items as determined by the Monetary Board of the BSP. The Bank’s regulatory capital position at the end of the reporting period follows:
2012 2011 2010 Tier 1 Capital P 717,386,920 P 730,872,193 728,053,536 Tier 2 Capital 10,420,949 7,605,742 4,798,313 Total Qualifying Capital 727,807,869 738,477,935 732,851,849 Total Risk Weighted Assets P 1,724,236,787 P 1,117,153,330 P 953,236,023 CAR 42.2% 66.1% 76.9%
The amount of surplus funds available for dividend declaration is determined also on the basis of regulatory net worth after considering certain adjustments.
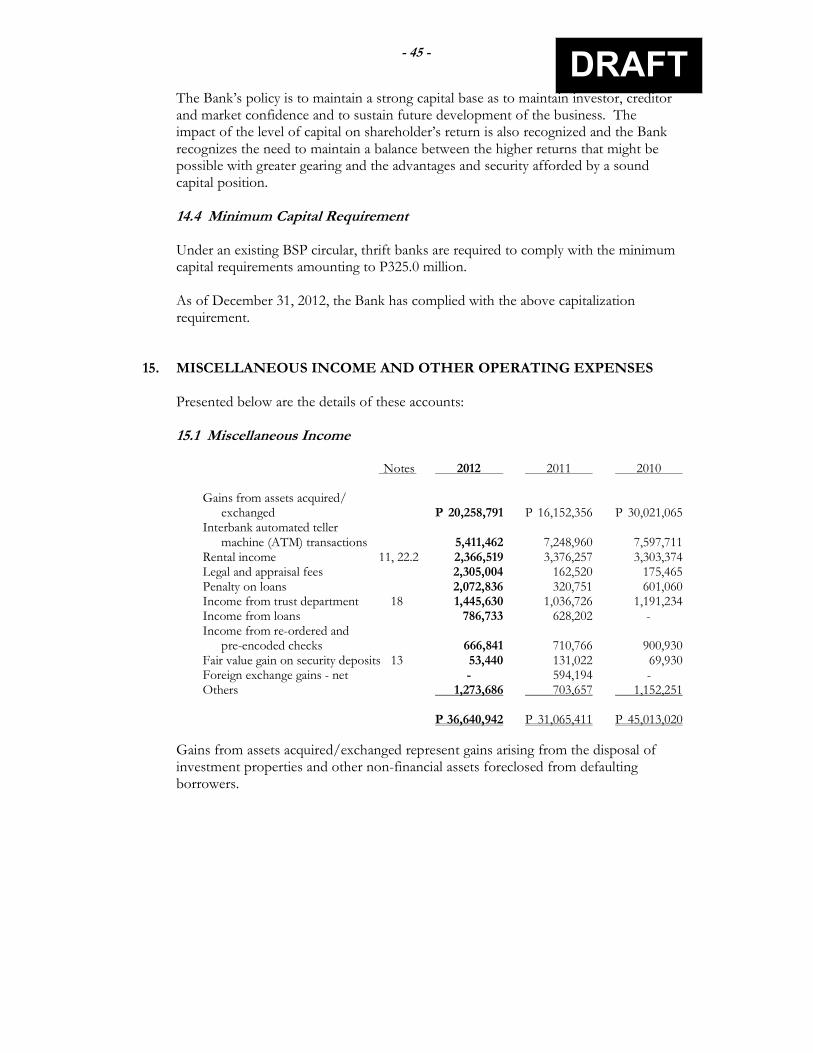
- 45 -
DRAFT
The Bank’s policy is to maintain a strong capital base as to maintain investor, creditor and market confidence and to sustain future development of the business. The impact of the level of capital on shareholder’s return is also recognized and the Bank recognizes the need to maintain a balance between the higher returns that might be possible with greater gearing and the advantages and security afforded by a sound capital position. 14.4 Minimum Capital Requirement Under an existing BSP circular, thrift banks are required to comply with the minimum capital requirements amounting to P325.0 million. As of December 31, 2012, the Bank has complied with the above capitalization requirement.
15. MISCELLANEOUS INCOME AND OTHER OPERATING EXPENSES
Presented below are the details of these accounts: 15.1 Miscellaneous Income
Notes 2012 2011 2010 Gains from assets acquired/ exchanged P 20,258,791 P 16,152,356 P 30,021,065 Interbank automated teller machine (ATM) transactions 5,411,462 7,248,960 7,597,711 Rental income 11, 22.2 2,366,519 3,376,257 3,303,374 Legal and appraisal fees 2,305,004 162,520 175,465 Penalty on loans 2,072,836 320,751 601,060 Income from trust department 18 1,445,630 1,036,726 1,191,234 Income from loans 786,733 628,202 - Income from re-ordered and pre-encoded checks 666,841 710,766 900,930 Fair value gain on security deposits 13 53,440 131,022 69,930 Foreign exchange gains - net - 594,194 - Others 1,273,686 703,657 1,152,251 P 36,640,942 P 31,065,411 P 45,013,020
Gains from assets acquired/exchanged represent gains arising from the disposal of investment properties and other non-financial assets foreclosed from defaulting borrowers.
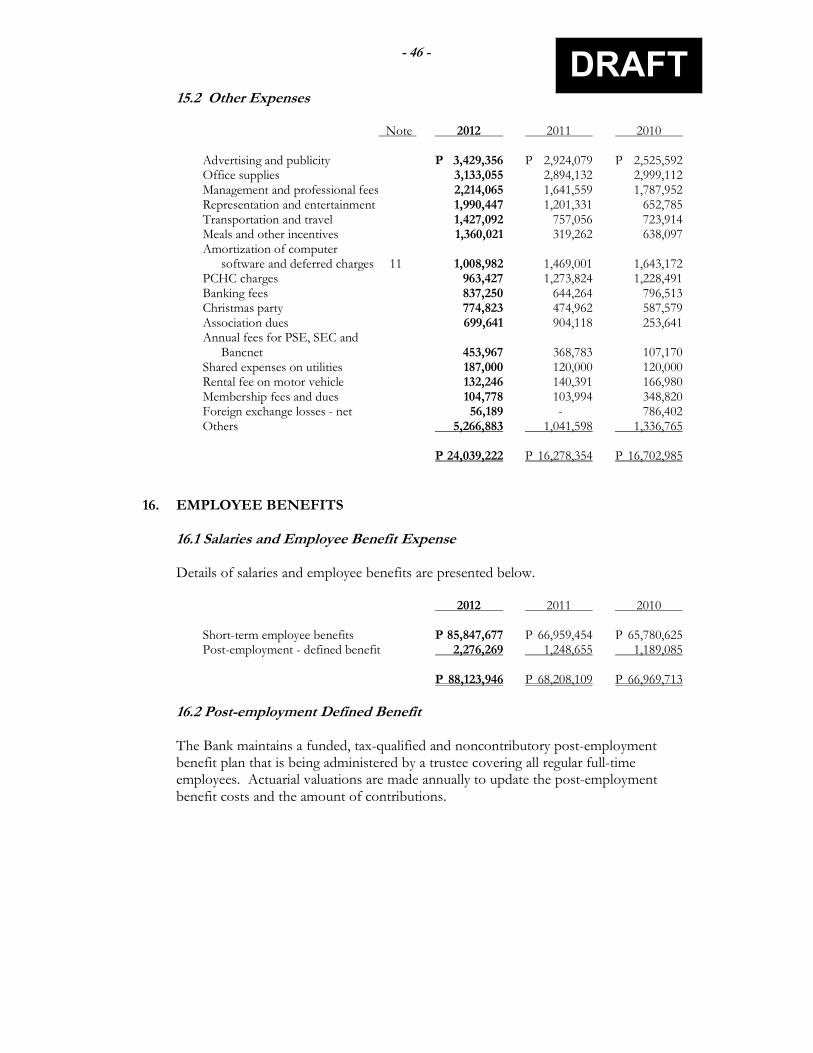
- 46 -
DRAFT
15.2 Other Expenses Note 2012 2011 2010 Advertising and publicity P 3,429,356 P 2,924,079 P 2,525,592 Office supplies 3,133,055 2,894,132 2,999,112 Management and professional fees 2,214,065 1,641,559 1,787,952 Representation and entertainment 1,990,447 1,201,331 652,785 Transportation and travel 1,427,092 757,056 723,914 Meals and other incentives 1,360,021 319,262 638,097 Amortization of computer software and deferred charges 11 1,008,982 1,469,001 1,643,172 PCHC charges 963,427 1,273,824 1,228,491 Banking fees 837,250 644,264 796,513 Christmas party 774,823 474,962 587,579 Association dues 699,641 904,118 253,641 Annual fees for PSE, SEC and Bancnet 453,967 368,783 107,170 Shared expenses on utilities 187,000 120,000 120,000 Rental fee on motor vehicle 132,246 140,391 166,980 Membership fees and dues 104,778 103,994 348,820 Foreign exchange losses - net 56,189 - 786,402 Others 5,266,883 1,041,598 1,336,765 P 24,039,222 P 16,278,354 P 16,702,985
16. EMPLOYEE BENEFITS
16.1 Salaries and Employee Benefit Expense
Details of salaries and employee benefits are presented below.
2012 2011 2010 Short-term employee benefits P 85,847,677 P 66,959,454 P 65,780,625 Post-employment - defined benefit 2,276,269 1,248,655 1,189,085 P 88,123,946 P 68,208,109 P 66,969,713
16.2 Post-employment Defined Benefit The Bank maintains a funded, tax-qualified and noncontributory post-employment benefit plan that is being administered by a trustee covering all regular full-time employees. Actuarial valuations are made annually to update the post-employment benefit costs and the amount of contributions.
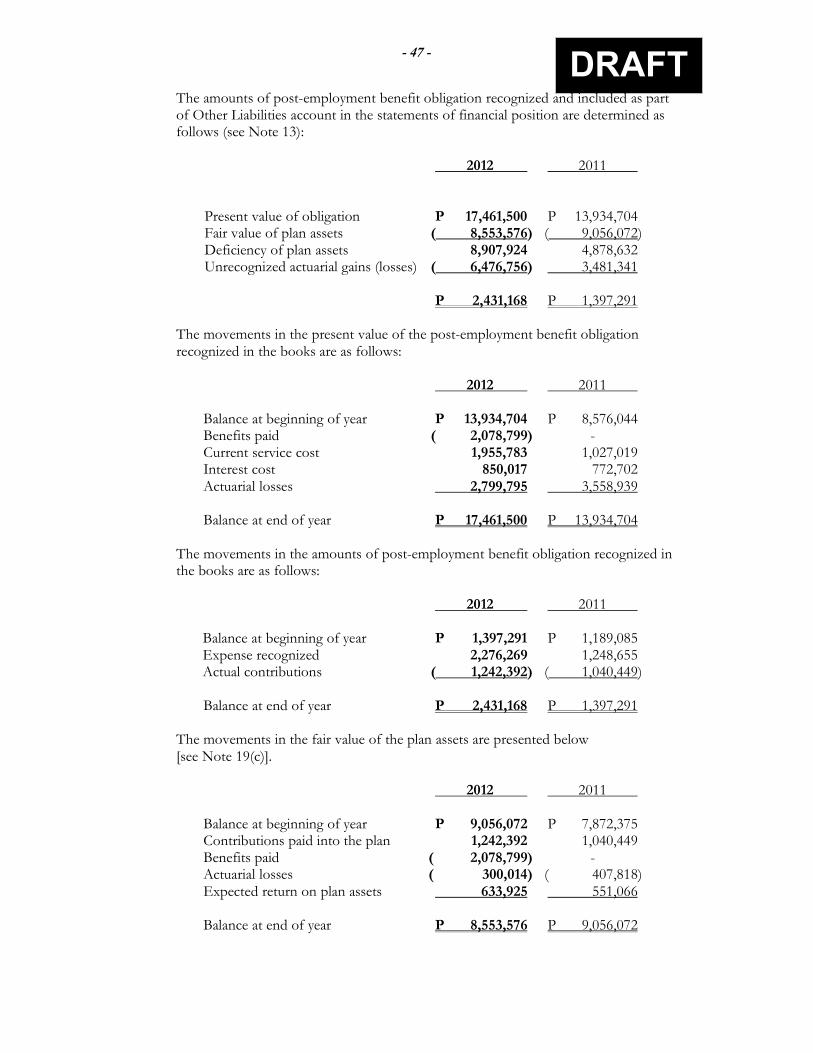
- 47 -
DRAFT
The amounts of post-employment benefit obligation recognized and included as part of Other Liabilities account in the statements of financial position are determined as follows (see Note 13):
2012 2011 Present value of obligation P 17,461,500 P 13,934,704 Fair value of plan assets ( 8,553,576) ( 9,056,072 ) Deficiency of plan assets 8,907,924 4,878,632 Unrecognized actuarial gains (losses) ( 6,476,756) 3,481,341 P 2,431,168 P 1,397,291
The movements in the present value of the post-employment benefit obligation recognized in the books are as follows:
2012 2011 Balance at beginning of year P 13,934,704 P 8,576,044 Benefits paid ( 2,078,799) - Current service cost 1,955,783 1,027,019 Interest cost 850,017 772,702 Actuarial losses 2,799,795 3,558,939 Balance at end of year P 17,461,500 P 13,934,704
The movements in the amounts of post-employment benefit obligation recognized in the books are as follows:
2012 2011 Balance at beginning of year P 1,397,291 P 1,189,085 Expense recognized 2,276,269 1,248,655 Actual contributions ( 1,242,392) ( 1,040,449 ) Balance at end of year P 2,431,168 P 1,397,291
The movements in the fair value of the plan assets are presented below [see Note 19(c)].
2012 2011 Balance at beginning of year P 9,056,072 P 7,872,375 Contributions paid into the plan 1,242,392 1,040,449 Benefits paid ( 2,078,799) - Actuarial losses ( 300,014) ( 407,818 ) Expected return on plan assets 633,925 551,066 Balance at end of year P 8,553,576 P 9,056,072
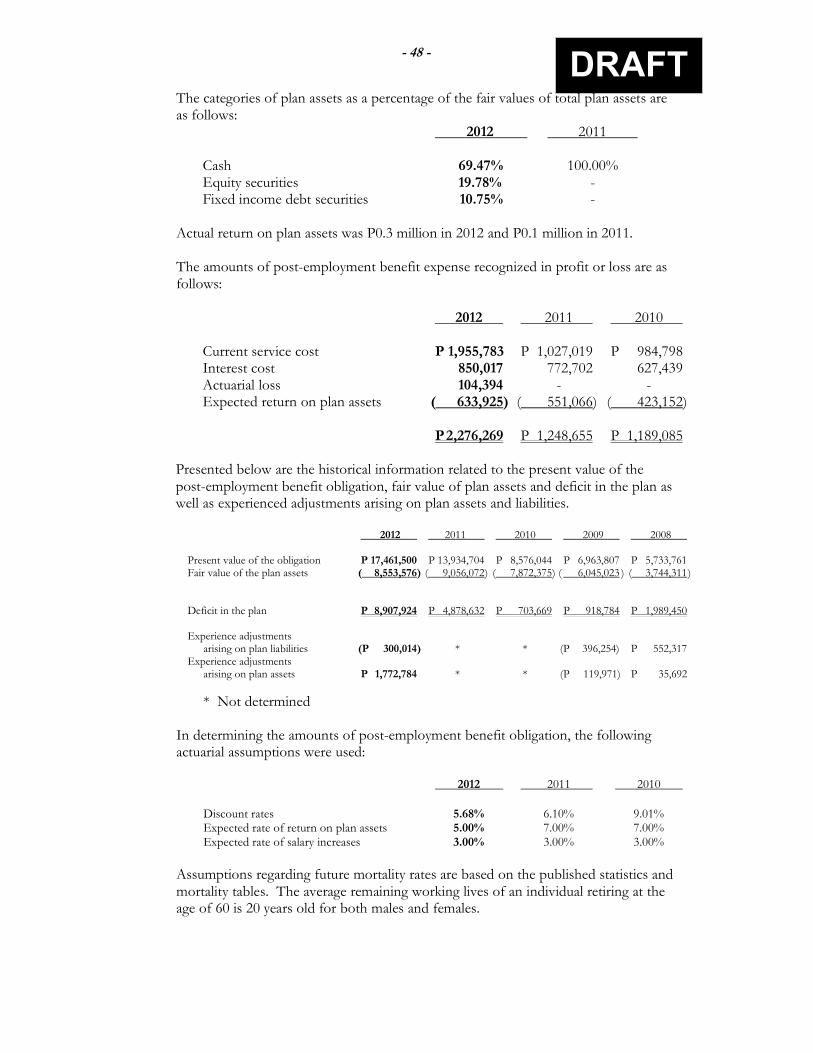
- 48 -
DRAFT
The categories of plan assets as a percentage of the fair values of total plan assets are as follows:
2012 2011 Cash 69.47% 100.00% Equity securities 19.78% - Fixed income debt securities 10.75% -
Actual return on plan assets was P0.3 million in 2012 and P0.1 million in 2011. The amounts of post-employment benefit expense recognized in profit or loss are as follows:
2012 2011 2010 Current service cost P 1,955,783 P 1,027,019 P 984,798 Interest cost 850,017 772,702 627,439 Actuarial loss 104,394 - - Expected return on plan assets ( 633,925) ( 551,066 ) ( 423,152 ) P 2,276,269 P 1,248,655 P 1,189,085
Presented below are the historical information related to the present value of the post-employment benefit obligation, fair value of plan assets and deficit in the plan as well as experienced adjustments arising on plan assets and liabilities.
2012 2011 2010 2009 2008
Present value of the obligation P 17,461,500 P 13,934,704 P 8,576,044 P 6,963,807 P 5,733,761 Fair value of the plan assets ( 8,553,576) ( 9,056,072 ) ( 7,872,375) ( 6,045,023 ) ( 3,744,311 )
Deficit in the plan P 8,907,924 P 4,878,632 P 703,669 P 918,784 P 1,989,450
Experience adjustments arising on plan liabilities (P 300,014) * * (P 396,254) P 552,317
Experience adjustments arising on plan assets P 1,772,784 * * (P 119,971) P 35,692
* Not determined In determining the amounts of post-employment benefit obligation, the following actuarial assumptions were used:
2012 2011 2010
Discount rates 5.68% 6.10% 9.01% Expected rate of return on plan assets 5.00% 7.00% 7.00% Expected rate of salary increases 3.00% 3.00% 3.00%
Assumptions regarding future mortality rates are based on the published statistics and mortality tables. The average remaining working lives of an individual retiring at the age of 60 is 20 years old for both males and females.
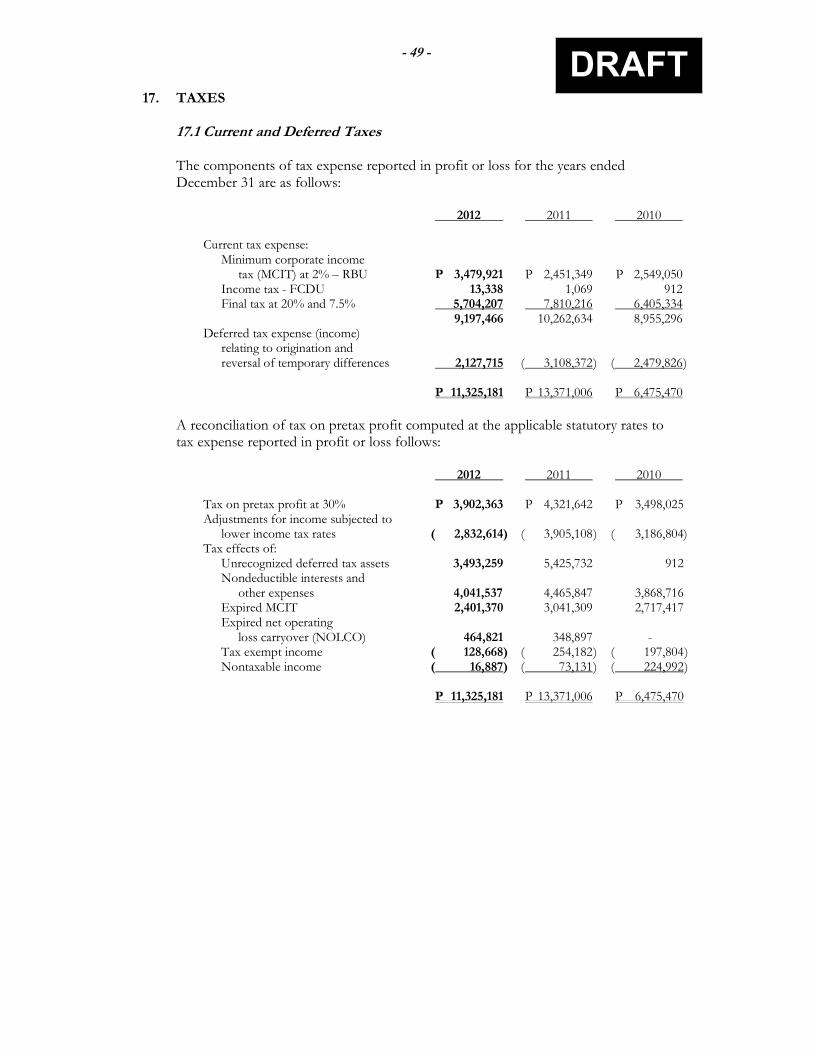
- 49 -
DRAFT
17. TAXES 17.1 Current and Deferred Taxes The components of tax expense reported in profit or loss for the years ended December 31 are as follows:
2012 2011 2010 Current tax expense: Minimum corporate income tax (MCIT) at 2% – RBU P 3,479,921 P 2,451,349 P 2,549,050 Income tax - FCDU 13,338 1,069 912 Final tax at 20% and 7.5% 5,704,207 7,810,216 6,405,334 9,197,466 10,262,634 8,955,296 Deferred tax expense (income) relating to origination and reversal of temporary differences 2,127,715 ( 3,108,372 ) ( 2,479,826 ) P 11,325,181 P 13,371,006 P 6,475,470
A reconciliation of tax on pretax profit computed at the applicable statutory rates to tax expense reported in profit or loss follows:
2012 2011 2010 Tax on pretax profit at 30% P 3,902,363 P 4,321,642 P 3,498,025 Adjustments for income subjected to lower income tax rates ( 2,832,614) ( 3,905,108 ) ( 3,186,804) Tax effects of: Unrecognized deferred tax assets 3,493,259 5,425,732 912 Nondeductible interests and other expenses 4,041,537 4,465,847 3,868,716 Expired MCIT 2,401,370 3,041,309 2,717,417 Expired net operating loss carryover (NOLCO) 464,821 348,897 - Tax exempt income ( 128,668) ( 254,182 ) ( 197,804 ) Nontaxable income ( 16,887) ( 73,131 ) ( 224,992 ) P 11,325,181 P 13,371,006 P 6,475,470
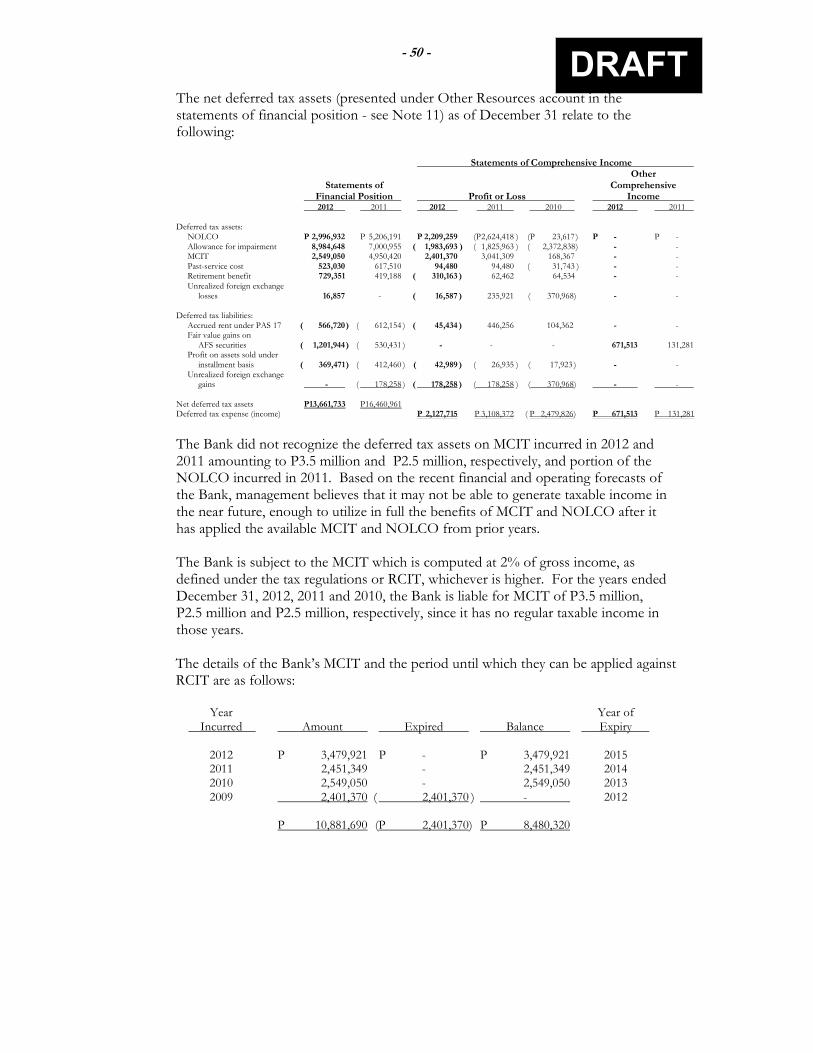
- 50 -
DRAFT
The net deferred tax assets (presented under Other Resources account in the statements of financial position - see Note 11) as of December 31 relate to the following: Statements of Comprehensive Income Other Statements of Comprehensive Financial Position Profit or Loss Income 2012 2011 2012 2011 2010 2012 2011 Deferred tax assets:
NOLCO P 2,996,932 P 5,206,191 P 2,209,259 (P 2,624,418 ) (P 23,617 ) P - P - Allowance for impairment 8,984,648 7,000,955 ( 1,983,693 ) ( 1,825,963 ) ( 2,372,838 ) - - MCIT 2,549,050 4,950,420 2,401,370 3,041,309 168,367 - - Past-service cost 523,030 617,510 94,480 94,480 ( 31,743 ) - - Retirement benefit 729,351 419,188 ( 310,163 ) 62,462 64,534 - - Unrealized foreign exchange losses 16,857 - ( 16,587 ) 235,921 ( 370,968) - -
Deferred tax liabilities: Accrued rent under PAS 17 ( 566,720 ) ( 612,154 ) ( 45,434 ) 446,256 104,362 - - Fair value gains on AFS securities ( 1,201,944 ) ( 530,431 ) - - - 671,513 131,281 Profit on assets sold under installment basis ( 369,471 ) ( 412,460 ) ( 42,989 ) ( 26,935 ) ( 17,923 ) - - Unrealized foreign exchange gains - ( 178,258 ) ( 178,258 ) ( 178,258 ) ( 370,968) - - Net deferred tax assets P13,661,733 P16,460,961 Deferred tax expense (income) P 2,127,715 P 3,108,372 ( P 2,479,826) P 671,513 P 131,281
The Bank did not recognize the deferred tax assets on MCIT incurred in 2012 and 2011 amounting to P3.5 million and P2.5 million, respectively, and portion of the NOLCO incurred in 2011. Based on the recent financial and operating forecasts of the Bank, management believes that it may not be able to generate taxable income in the near future, enough to utilize in full the benefits of MCIT and NOLCO after it has applied the available MCIT and NOLCO from prior years. The Bank is subject to the MCIT which is computed at 2% of gross income, as defined under the tax regulations or RCIT, whichever is higher. For the years ended December 31, 2012, 2011 and 2010, the Bank is liable for MCIT of P3.5 million, P2.5 million and P2.5 million, respectively, since it has no regular taxable income in those years. The details of the Bank’s MCIT and the period until which they can be applied against RCIT are as follows:
Year Year of Incurred Amount Expired Balance Expiry 2012 P 3,479,921 P - P 3,479,921 2015 2011 2,451,349 - 2,451,349 2014 2010 2,549,050 - 2,549,050 2013 2009 2,401,370 ( 2,401,370 ) - 2012 P 10,881,690 (P 2,401,370) P 8,480,320
- 51 -
DRAFT
The breakdown of NOLCO, which can be claimed as deduction from future taxable income within three years from the year the taxable loss was incurred, is shown below.
Year Original Applied/ Remaining Year of Incurred Amount Expired Balance Expiry 2011 P 19,822,097 P - P 19,822,097 2014 2010 78,725 - 78,725 2013 2009 7,364,195 ( 7,364,195) - 2012 P 27,265,017 (P 7,364,195 ) P 19,900,822
In 2012, the Bank claimed as deduction from its taxable income portion of its available NOLCO incurred in 2009 amounting to P5.8 million. The remaining NOLCO amounting to P1.6 million expired during the year. In 2012, the Bank’s FCDU also claimed as deduction from its tax due the MCIT incurred in 2011 and 2010 amounting to P1,056 and P844, respectively. The remaining MCIT amounting to P211 expired during the year. The Bank opted to claim itemized deductions in all years presented. 17.2 Gross Receipts Tax (GRT) On January 29, 2004, RA No. 9238 reverted the imposition of GRT on banks and financial institutions. This law is retroactive from January 1, 2004. Further, on May 24, 2005, the amendments on RA No. 9337 was approved imposing the following rates to be collected on gross receipts derived from sources in the Philippines by all banks and non-bank financial intermediaries: (a) On interest, commissions and discounts from lending activities as well as
income from financial leasing, on the basis of remaining maturities of instruments from which such receipts are derived:
With maturity period of five years or less 5% With maturity period of more than five years 1% (b) On dividends and equity shares in the net income
of subsidiaries 0% (c) On royalties, rentals of property, real or personal,
profits from exchange and all other items treated as gross income under Section 32 of the NIRC 7% (d) On net trading within the taxable year on foreign currency, debt securities, derivatives, and other similar financial instruments 7% Provided, however, that in case the maturity period referred to in paragraph (a) is shortened thru pretermination, then the maturity period shall be reckoned to end as of the date of pretermination for purposes of classifying the transaction and the correct rate of tax shall be applied accordingly.
- 52 -
DRAFT
17.3 Documentary Stamp Tax (DST) DST at rates ranging from P0.30 to P2 on each P200 of the face value of the certificate or document are imposed on the following (amounts herein are expressed in absolute value): (a) Bank checks, drafts, or certificate of deposit not bearing interest, and other
instruments; and, (b) Bonds, loan agreements, promissory notes, bills of exchange, drafts, instruments
and securities issued by the Government or any of its instrumentalities, deposit substitute debt instruments, certificates of deposits bearing interest and other not payable on sight or demand.
(c) Acceptance of bills of exchange and letters of credit; and,
(d) Bills of lading or receipt. On February 7, 2004, RA No. 9243 was passed amending the rates of DST, the significant provisions of which are summarized below. (a) On every issue of debt instruments, there shall be collected DST of P1 on each
P200 or fractional part of the issue price of any such debt instrument; (b) On all sales or transfer of shares or certificates of stock in any corporation,
there shall be collected a DST of P0.75 on each P200, or fractional part, of the par value of such stock;
(c) On all bills of exchange or drafts, there shall be collected DST of P0.30 on each
P200, or fractional part, of the face value of any such bill of exchange or draft; and,
(d) The following instruments, documents and papers shall be exempt from DST:
• Borrowings and lending of securities executed under the Securities Borrowing and Lending Program of a registered exchange, or in accordance with regulations prescribed by the appropriate regulatory authority;
• Loan agreements or promissory notes, the aggregate of which do not exceed P250 thousand or any such amount as may be determined by the Secretary of Finance, executed by an individual for his purchase on instalment for his personal use;
• Sale, barter or exchange of shares of stock listed and traded through the local stock exchange for a period of five years from the effectivity of RA No. 9243;
• Fixed income and other securities traded in the secondary market or through an exchange;
• Derivatives including repurchase agreements and reverse repurchase agreements;
- 53 -
DRAFT
• Bank deposit accounts without a fixed term or maturity; and,
• Interbank call loans with maturity of not more than seven days to cover deficiency in reserve against deposit liabilities.
18. TRUST OPERATIONS Investments amounting to P257.0 million and P190.2 million held by the Bank as of December 31, 2012 and 2011, respectively, in fiduciary or agency capacity (for a fee) for its customers are not included in the statement of financial position since these are not properties of the Bank (see Note 22.3). In compliance with the requirements of the General Banking Act relative to the Bank's trust functions: (a) Investment in government securities of P3.0 million deposited with BSP as
security for the Bank’s faithful compliance with its fiduciary obligations (see Note 7); and,
(b) A certain percentage of the Bank’s trust income is transferred to surplus reserve.
This yearly transfer is required until the surplus reserve for trust function is equivalent to 20% of the Bank’s authorized capital stock. As of December 31, 2012 and 2011, the reserve for trust operations amounted to P0.1 million and P0.4 million, respectively, and is shown as Surplus Reserves in the statement of changes in equity.
Income from trust operations, net of the related expenses amounted to P1.4 million, P1.0 million and P1.2 million for the years ended December 31, 2012, 2011 and 2010, respectively, and are shown as part of Miscellaneous Income in the statements of comprehensive income (see Note 15.1).
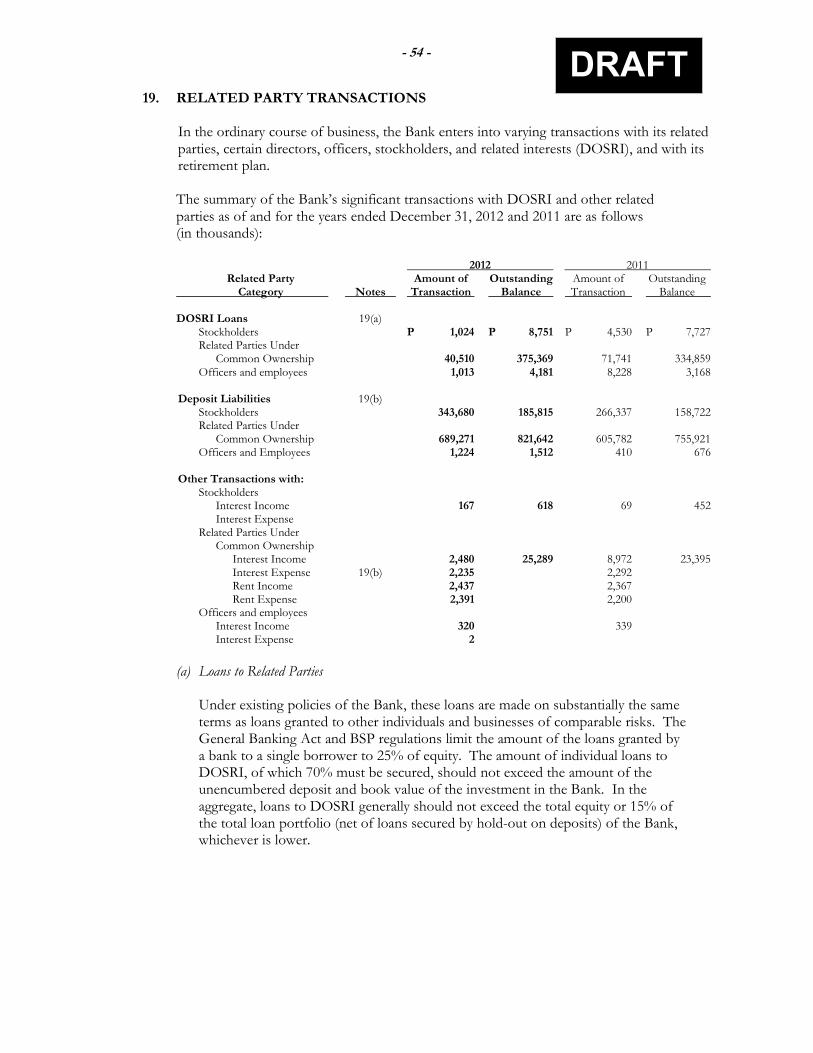
- 54 -
DRAFT
19. RELATED PARTY TRANSACTIONS
In the ordinary course of business, the Bank enters into varying transactions with its related parties, certain directors, officers, stockholders, and related interests (DOSRI), and with its retirement plan. The summary of the Bank’s significant transactions with DOSRI and other related parties as of and for the years ended December 31, 2012 and 2011 are as follows (in thousands):
2012 2011 Related Party Amount of Outstanding Amount of Outstanding Category Notes Transaction Balance Transaction Balance DOSRI Loans 19(a) Stockholders P 1,024 P 8,751 P 4,530 P 7,727 Related Parties Under Common Ownership 40,510 375,369 71,741 334,859 Officers and employees 1,013 4,181 8,228 3,168 Deposit Liabilities 19(b) Stockholders 343,680 185,815 266,337 158,722 Related Parties Under Common Ownership 689,271 821,642 605,782 755,921 Officers and Employees 1,224 1,512 410 676 Other Transactions with: Stockholders Interest Income 167 618 69 452 Interest Expense Related Parties Under Common Ownership Interest Income 2,480 25,289 8,972 23,395 Interest Expense 19(b) 2,235 2,292 Rent Income 2,437 2,367 Rent Expense 2,391 2,200 Officers and employees Interest Income 320 339 Interest Expense 2
(a) Loans to Related Parties
Under existing policies of the Bank, these loans are made on substantially the same terms as loans granted to other individuals and businesses of comparable risks. The General Banking Act and BSP regulations limit the amount of the loans granted by a bank to a single borrower to 25% of equity. The amount of individual loans to DOSRI, of which 70% must be secured, should not exceed the amount of the unencumbered deposit and book value of the investment in the Bank. In the aggregate, loans to DOSRI generally should not exceed the total equity or 15% of the total loan portfolio (net of loans secured by hold-out on deposits) of the Bank, whichever is lower.
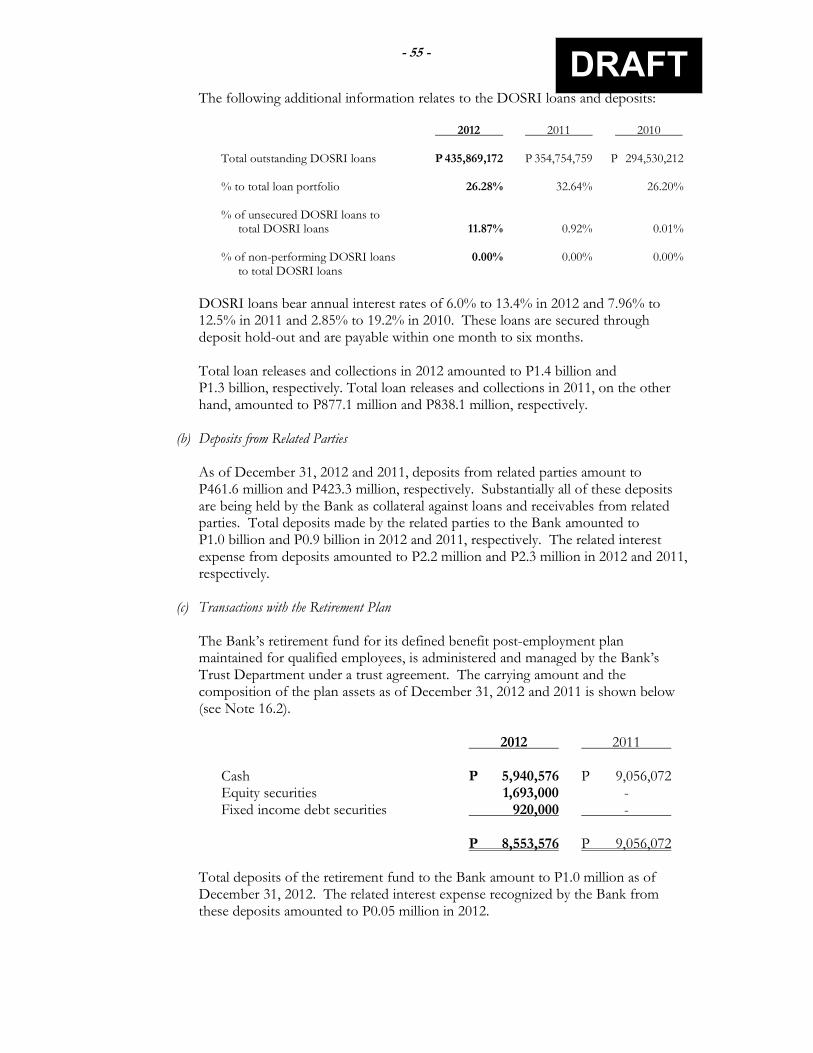
- 55 -
DRAFT
The following additional information relates to the DOSRI loans and deposits:
2012 2011 2010 Total outstanding DOSRI loans P 435,869,172 P 354,754,759 P 294,530,212 % to total loan portfolio 26.28% 32.64% 26.20% % of unsecured DOSRI loans to total DOSRI loans 11.87% 0.92% 0.01% % of non-performing DOSRI loans 0.00% 0.00% 0.00% to total DOSRI loans
DOSRI loans bear annual interest rates of 6.0% to 13.4% in 2012 and 7.96% to 12.5% in 2011 and 2.85% to 19.2% in 2010. These loans are secured through deposit hold-out and are payable within one month to six months. Total loan releases and collections in 2012 amounted to P1.4 billion and P1.3 billion, respectively. Total loan releases and collections in 2011, on the other hand, amounted to P877.1 million and P838.1 million, respectively.
(b) Deposits from Related Parties
As of December 31, 2012 and 2011, deposits from related parties amount to P461.6 million and P423.3 million, respectively. Substantially all of these deposits are being held by the Bank as collateral against loans and receivables from related parties. Total deposits made by the related parties to the Bank amounted to P1.0 billion and P0.9 billion in 2012 and 2011, respectively. The related interest expense from deposits amounted to P2.2 million and P2.3 million in 2012 and 2011, respectively.
(c) Transactions with the Retirement Plan The Bank’s retirement fund for its defined benefit post-employment plan maintained for qualified employees, is administered and managed by the Bank’s Trust Department under a trust agreement. The carrying amount and the composition of the plan assets as of December 31, 2012 and 2011 is shown below (see Note 16.2). 2012 2011
Cash P 5,940,576 P 9,056,072 Equity securities 1,693,000 - Fixed income debt securities 920,000 - P 8,553,576 P 9,056,072
Total deposits of the retirement fund to the Bank amount to P1.0 million as of December 31, 2012. The related interest expense recognized by the Bank from these deposits amounted to P0.05 million in 2012.
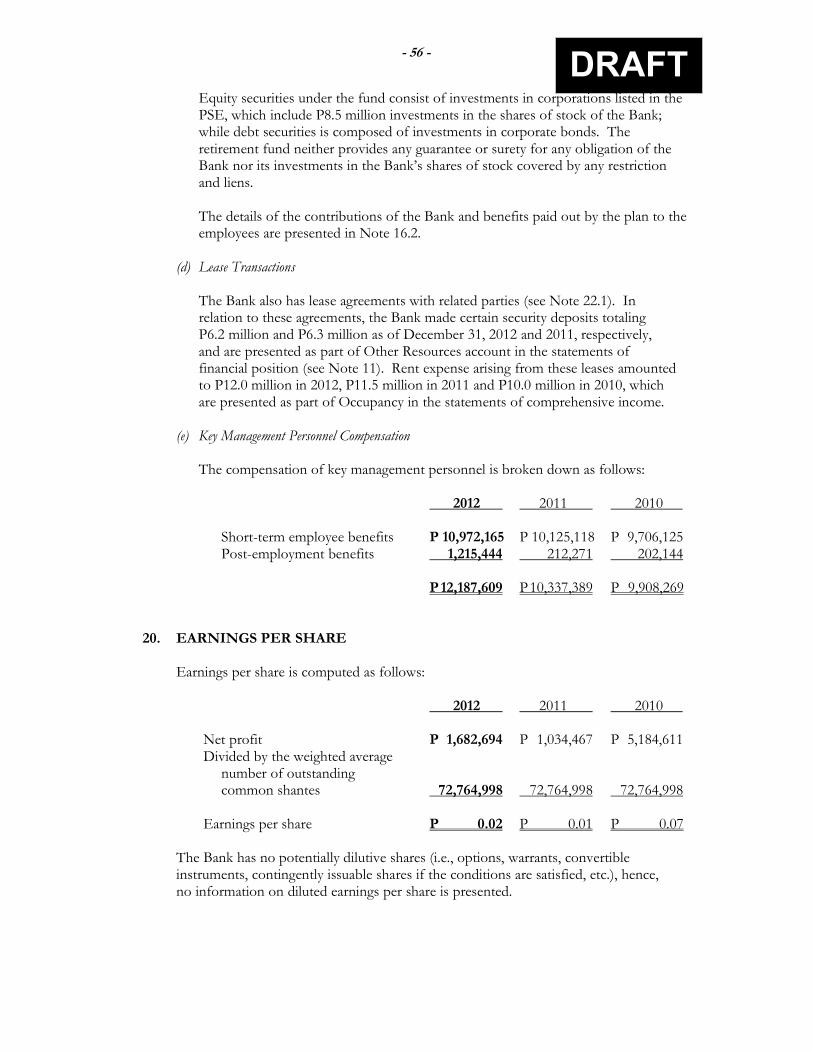
- 56 -
DRAFT
Equity securities under the fund consist of investments in corporations listed in the PSE, which include P8.5 million investments in the shares of stock of the Bank; while debt securities is composed of investments in corporate bonds. The retirement fund neither provides any guarantee or surety for any obligation of the Bank nor its investments in the Bank’s shares of stock covered by any restriction and liens. The details of the contributions of the Bank and benefits paid out by the plan to the employees are presented in Note 16.2.
(d) Lease Transactions The Bank also has lease agreements with related parties (see Note 22.1). In relation to these agreements, the Bank made certain security deposits totaling P6.2 million and P6.3 million as of December 31, 2012 and 2011, respectively, and are presented as part of Other Resources account in the statements of financial position (see Note 11). Rent expense arising from these leases amounted to P12.0 million in 2012, P11.5 million in 2011 and P10.0 million in 2010, which are presented as part of Occupancy in the statements of comprehensive income.
(e) Key Management Personnel Compensation The compensation of key management personnel is broken down as follows:
2012 2011 2010 Short-term employee benefits P 10,972,165 P 10,125,118 P 9,706,125 Post-employment benefits 1,215,444 212,271 202,144 P 12,187,609 P 10,337,389 P 9,908,269 20. EARNINGS PER SHARE
Earnings per share is computed as follows:
2012 2011 2010 Net profit P 1,682,694 P 1,034,467 P 5,184,611 Divided by the weighted average number of outstanding common shantes 72,764,998 72,764,998 72,764,998 Earnings per share P 0.02 P 0.01 P 0.07
The Bank has no potentially dilutive shares (i.e., options, warrants, convertible instruments, contingently issuable shares if the conditions are satisfied, etc.), hence, no information on diluted earnings per share is presented.
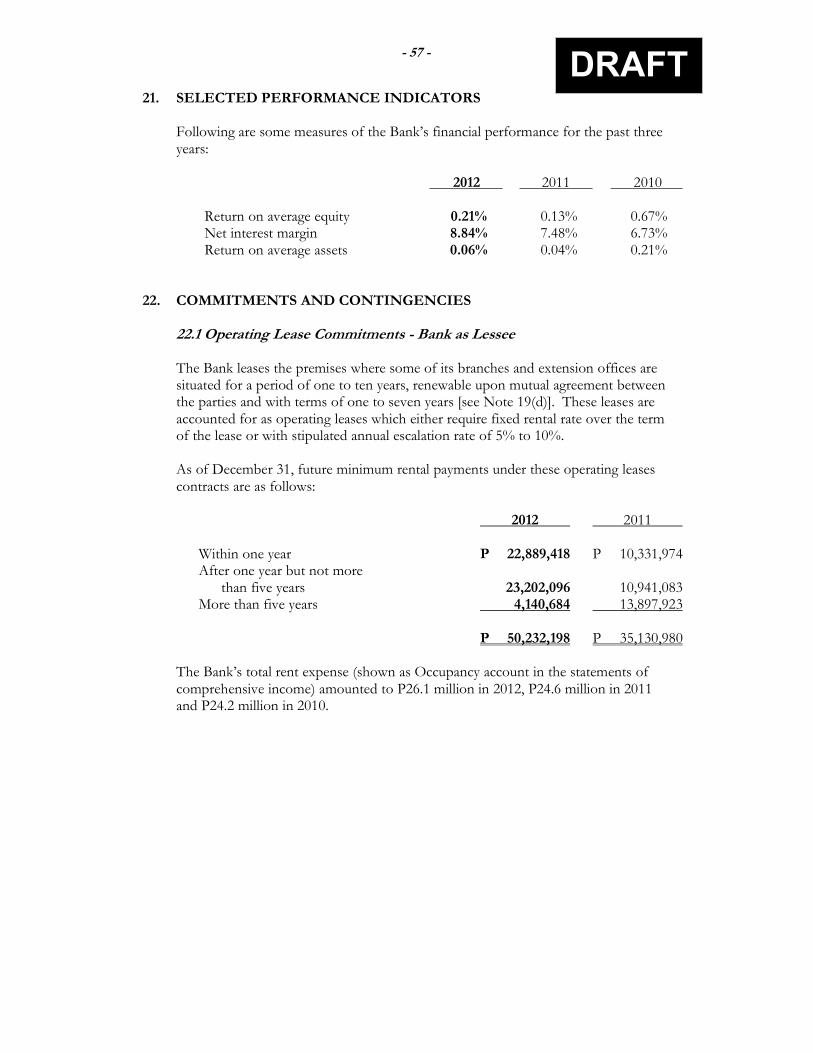
- 57 -
DRAFT
21. SELECTED PERFORMANCE INDICATORS Following are some measures of the Bank’s financial performance for the past three years:
2012 2011 2010 Return on average equity 0.21% 0.13% 0.67% Net interest margin 8.84% 7.48% 6.73% Return on average assets 0.06% 0.04% 0.21%
22. COMMITMENTS AND CONTINGENCIES 22.1 Operating Lease Commitments - Bank as Lessee The Bank leases the premises where some of its branches and extension offices are situated for a period of one to ten years, renewable upon mutual agreement between the parties and with terms of one to seven years [see Note 19(d)]. These leases are accounted for as operating leases which either require fixed rental rate over the term of the lease or with stipulated annual escalation rate of 5% to 10%. As of December 31, future minimum rental payments under these operating leases contracts are as follows:
2012 2011 Within one year P 22,889,418 P 10,331,974 After one year but not more than five years 23,202,096 10,941,083 More than five years 4,140,684 13,897,923 P 50,232,198 P 35,130,980
The Bank’s total rent expense (shown as Occupancy account in the statements of comprehensive income) amounted to P26.1 million in 2012, P24.6 million in 2011 and P24.2 million in 2010.
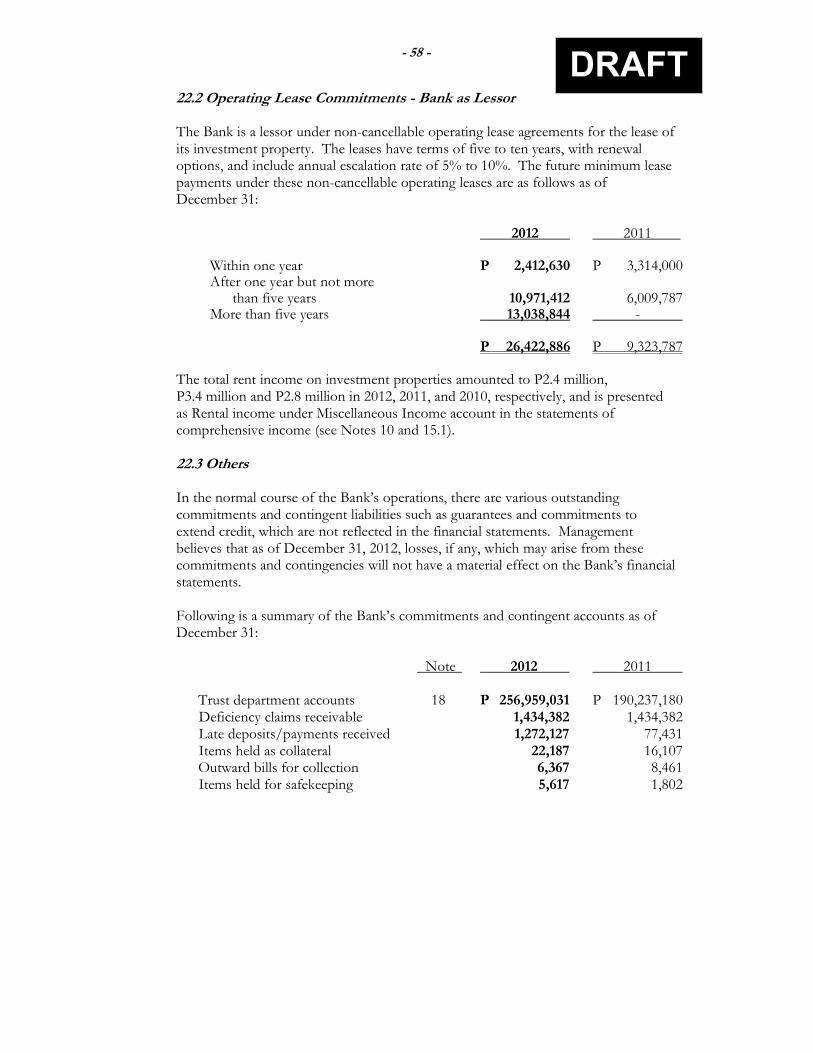
- 58 -
DRAFT
22.2 Operating Lease Commitments - Bank as Lessor The Bank is a lessor under non-cancellable operating lease agreements for the lease of its investment property. The leases have terms of five to ten years, with renewal options, and include annual escalation rate of 5% to 10%. The future minimum lease payments under these non-cancellable operating leases are as follows as of December 31:
2012 2011 Within one year P 2,412,630 P 3,314,000 After one year but not more than five years 10,971,412 6,009,787 More than five years 13,038,844 - P 26,422,886 P 9,323,787
The total rent income on investment properties amounted to P2.4 million, P3.4 million and P2.8 million in 2012, 2011, and 2010, respectively, and is presented as Rental income under Miscellaneous Income account in the statements of comprehensive income (see Notes 10 and 15.1). 22.3 Others
In the normal course of the Bank’s operations, there are various outstanding commitments and contingent liabilities such as guarantees and commitments to extend credit, which are not reflected in the financial statements. Management believes that as of December 31, 2012, losses, if any, which may arise from these commitments and contingencies will not have a material effect on the Bank’s financial statements. Following is a summary of the Bank’s commitments and contingent accounts as of December 31: Note 2012 2011 Trust department accounts 18 P 256,959,031 P 190,237,180 Deficiency claims receivable 1,434,382 1,434,382 Late deposits/payments received 1,272,127 77,431 Items held as collateral 22,187 16,107 Outward bills for collection 6,367 8,461 Items held for safekeeping 5,617 1,802
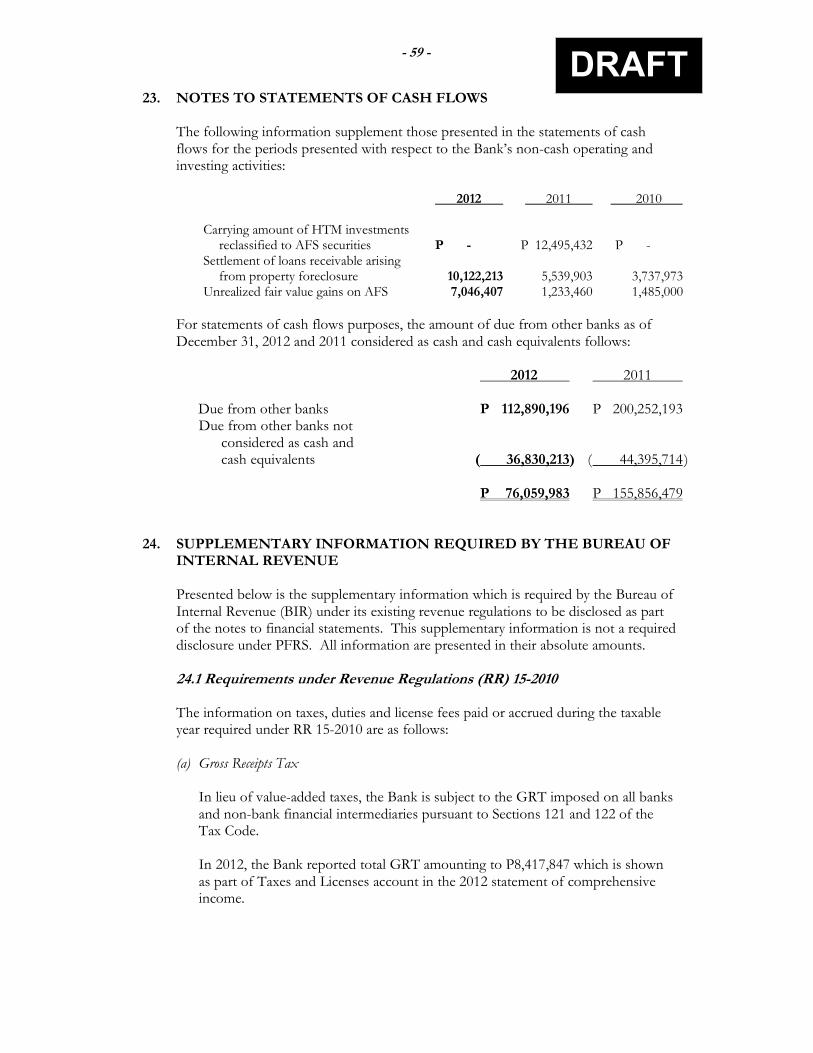
- 59 -
DRAFT
23. NOTES TO STATEMENTS OF CASH FLOWS The following information supplement those presented in the statements of cash flows for the periods presented with respect to the Bank’s non-cash operating and investing activities:
2012 2011 2010 Carrying amount of HTM investments reclassified to AFS securities P - P 12,495,432 P - Settlement of loans receivable arising from property foreclosure 10,122,213 5,539,903 3,737,973 Unrealized fair value gains on AFS 7,046,407 1,233,460 1,485,000
For statements of cash flows purposes, the amount of due from other banks as of December 31, 2012 and 2011 considered as cash and cash equivalents follows:
2012 2011 Due from other banks P 112,890,196 P 200,252,193
Due from other banks not considered as cash and cash equivalents ( 36,830,213) ( 44,395,714 ) P 76,059,983 P 155,856,479
24. SUPPLEMENTARY INFORMATION REQUIRED BY THE BUREAU OF
INTERNAL REVENUE
Presented below is the supplementary information which is required by the Bureau of Internal Revenue (BIR) under its existing revenue regulations to be disclosed as part of the notes to financial statements. This supplementary information is not a required disclosure under PFRS. All information are presented in their absolute amounts. 24.1 Requirements under Revenue Regulations (RR) 15-2010 The information on taxes, duties and license fees paid or accrued during the taxable year required under RR 15-2010 are as follows: (a) Gross Receipts Tax In lieu of value-added taxes, the Bank is subject to the GRT imposed on all banks
and non-bank financial intermediaries pursuant to Sections 121 and 122 of the Tax Code.
In 2012, the Bank reported total GRT amounting to P8,417,847 which is shown
as part of Taxes and Licenses account in the 2012 statement of comprehensive income.
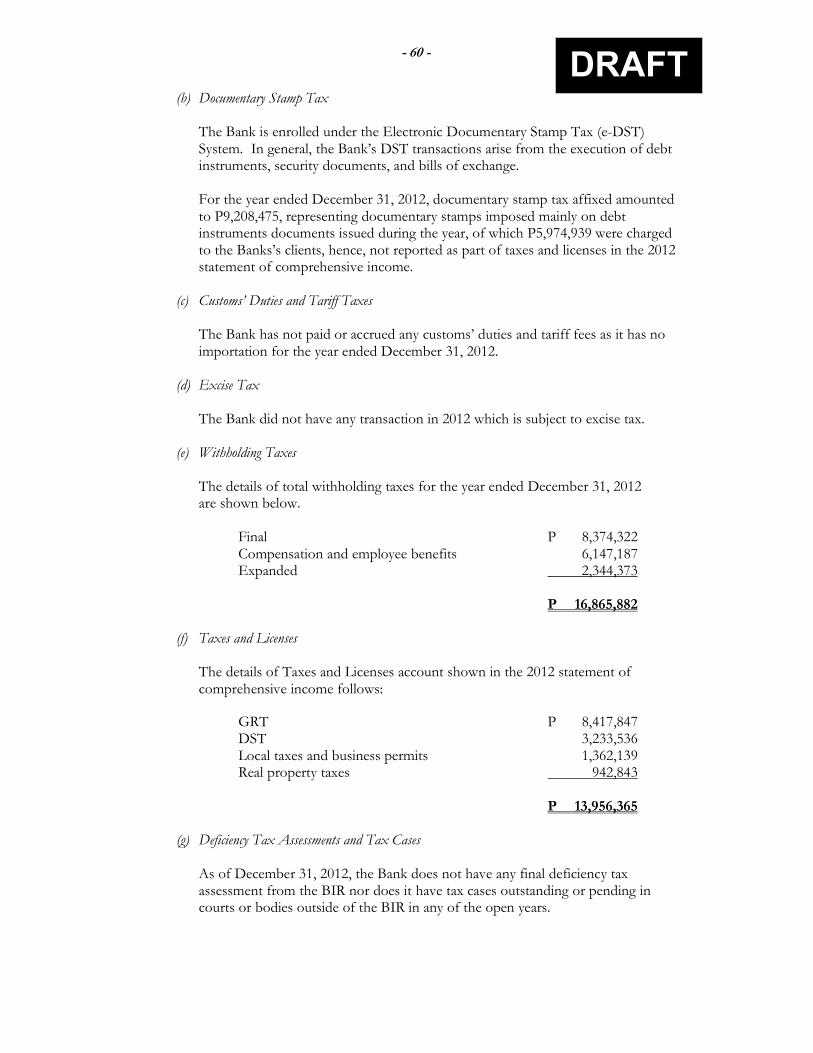
- 60 -
DRAFT
(b) Documentary Stamp Tax The Bank is enrolled under the Electronic Documentary Stamp Tax (e-DST) System. In general, the Bank’s DST transactions arise from the execution of debt instruments, security documents, and bills of exchange. For the year ended December 31, 2012, documentary stamp tax affixed amounted to P9,208,475, representing documentary stamps imposed mainly on debt instruments documents issued during the year, of which P5,974,939 were charged to the Banks’s clients, hence, not reported as part of taxes and licenses in the 2012 statement of comprehensive income.
(c) Customs’ Duties and Tariff Taxes The Bank has not paid or accrued any customs’ duties and tariff fees as it has no importation for the year ended December 31, 2012.
(d) Excise Tax The Bank did not have any transaction in 2012 which is subject to excise tax.
(e) Withholding Taxes The details of total withholding taxes for the year ended December 31, 2012 are shown below.
Final P 8,374,322 Compensation and employee benefits 6,147,187 Expanded 2,344,373
P 16,865,882
(f) Taxes and Licenses The details of Taxes and Licenses account shown in the 2012 statement of comprehensive income follows:
GRT P 8,417,847 DST 3,233,536 Local taxes and business permits 1,362,139 Real property taxes 942,843 P 13,956,365
(g) Deficiency Tax Assessments and Tax Cases As of December 31, 2012, the Bank does not have any final deficiency tax assessment from the BIR nor does it have tax cases outstanding or pending in courts or bodies outside of the BIR in any of the open years.
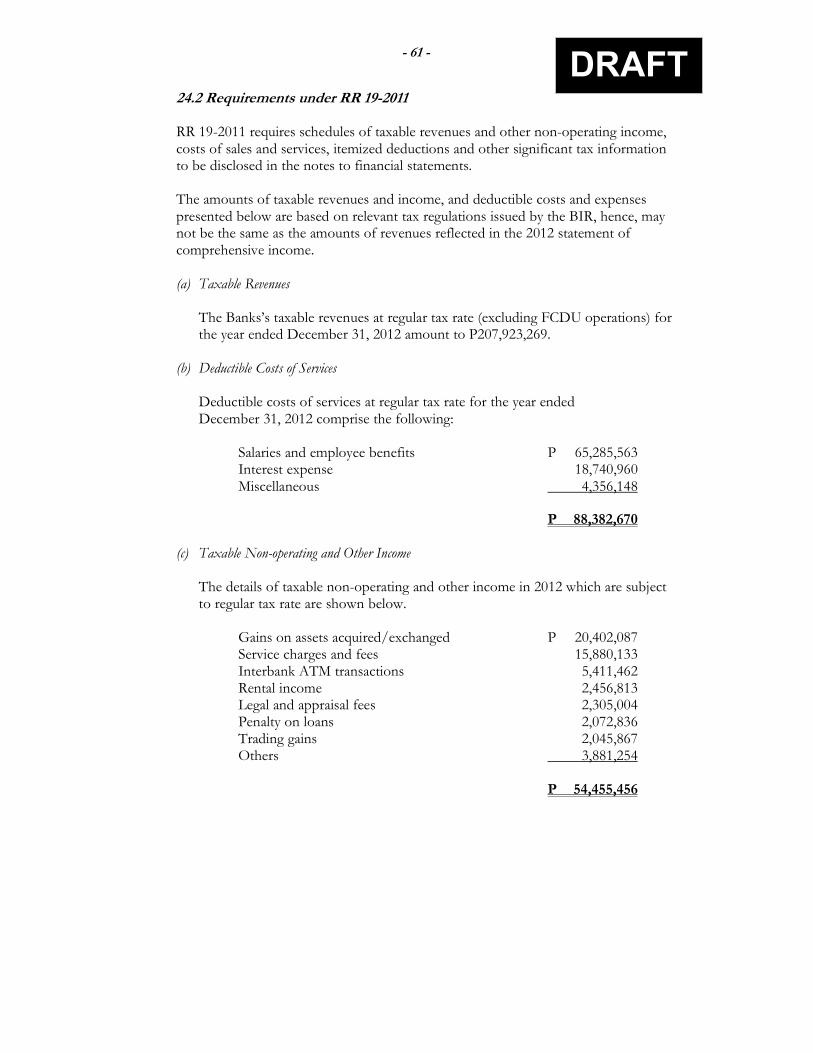
- 61 -
DRAFT
24.2 Requirements under RR 19-2011
RR 19-2011 requires schedules of taxable revenues and other non-operating income, costs of sales and services, itemized deductions and other significant tax information to be disclosed in the notes to financial statements. The amounts of taxable revenues and income, and deductible costs and expenses presented below are based on relevant tax regulations issued by the BIR, hence, may not be the same as the amounts of revenues reflected in the 2012 statement of comprehensive income.
(a) Taxable Revenues
The Banks’s taxable revenues at regular tax rate (excluding FCDU operations) for the year ended December 31, 2012 amount to P207,923,269.
(b) Deductible Costs of Services Deductible costs of services at regular tax rate for the year ended December 31, 2012 comprise the following:
Salaries and employee benefits P 65,285,563 Interest expense 18,740,960 Miscellaneous 4,356,148 P 88,382,670
(c) Taxable Non-operating and Other Income The details of taxable non-operating and other income in 2012 which are subject to regular tax rate are shown below.
Gains on assets acquired/exchanged P 20,402,087 Service charges and fees 15,880,133 Interbank ATM transactions 5,411,462 Rental income 2,456,813 Legal and appraisal fees 2,305,004 Penalty on loans 2,072,836 Trading gains 2,045,867 Others 3,881,254 P 54,455,456
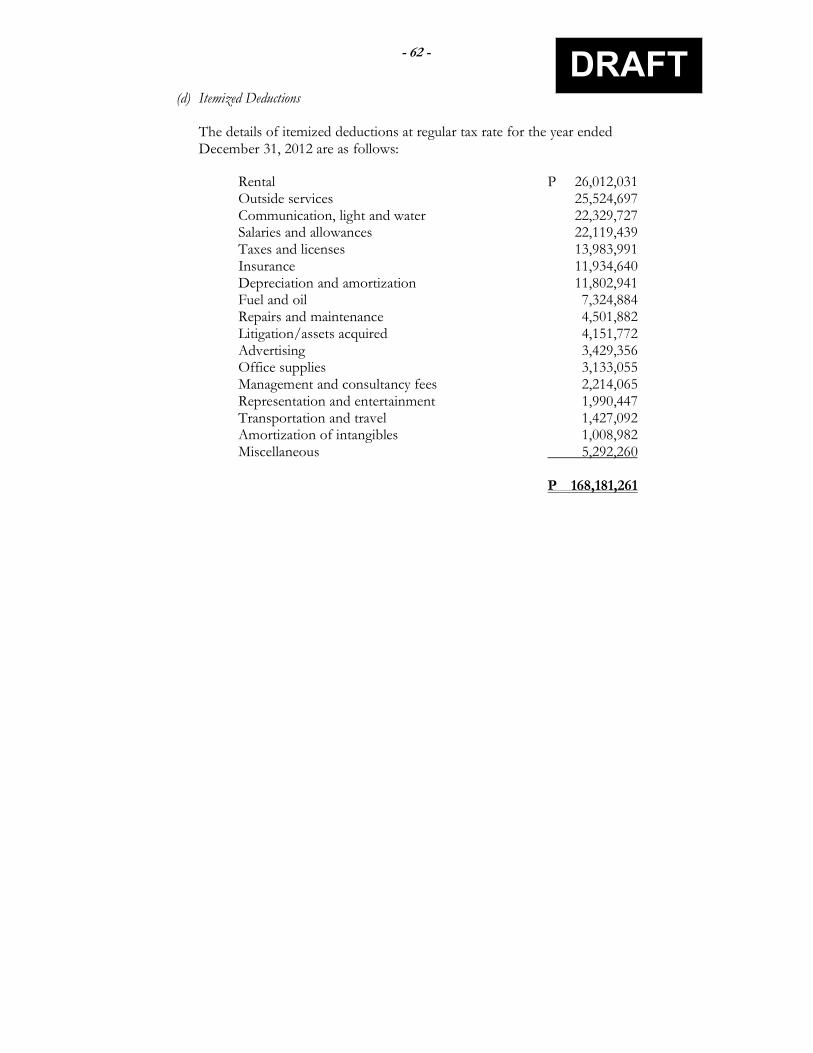
- 62 -
DRAFT
(d) Itemized Deductions
The details of itemized deductions at regular tax rate for the year ended December 31, 2012 are as follows:
Rental P 26,012,031 Outside services 25,524,697 Communication, light and water 22,329,727 Salaries and allowances 22,119,439 Taxes and licenses 13,983,991 Insurance 11,934,640 Depreciation and amortization 11,802,941 Fuel and oil 7,324,884 Repairs and maintenance 4,501,882 Litigation/assets acquired 4,151,772 Advertising 3,429,356 Office supplies 3,133,055 Management and consultancy fees 2,214,065 Representation and entertainment 1,990,447 Transportation and travel 1,427,092 Amortization of intangibles 1,008,982 Miscellaneous 5,292,260 P 168,181,261
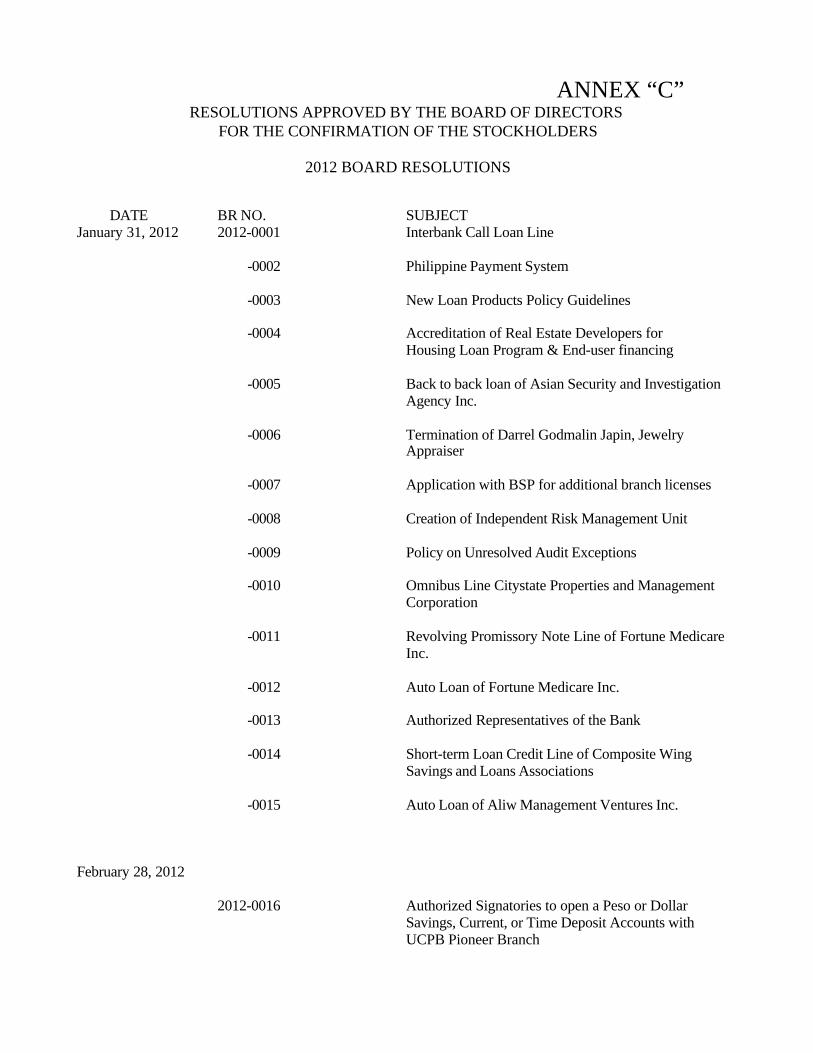
ANNEX “C”RESOLUTIONS APPROVED BY THE BOARD OF DIRECTORS
FOR THE CONFIRMATION OF THE STOCKHOLDERS
2012 BOARD RESOLUTIONS
DATE BR NO. SUBJECTJanuary 31, 2012 2012-0001 Interbank Call Loan Line
-0002 Philippine Payment System
-0003 New Loan Products Policy Guidelines
-0004 Accreditation of Real Estate Developers for Housing Loan Program & End-user financing
-0005 Back to back loan of Asian Security and Investigation Agency Inc.
-0006 Termination of Darrel Godmalin Japin, Jewelry Appraiser
-0007 Application with BSP for additional branch licenses
-0008 Creation of Independent Risk Management Unit
-0009 Policy on Unresolved Audit Exceptions
-0010 Omnibus Line Citystate Properties and Management Corporation
-0011 Revolving Promissory Note Line of Fortune Medicare Inc.
-0012 Auto Loan of Fortune Medicare Inc.
-0013 Authorized Representatives of the Bank
-0014 Short-term Loan Credit Line of Composite Wing Savings and Loans Associations
-0015 Auto Loan of Aliw Management Ventures Inc.
February 28, 2012
2012-0016 Authorized Signatories to open a Peso or Dollar Savings, Current, or Time Deposit Accounts withUCPB Pioneer Branch
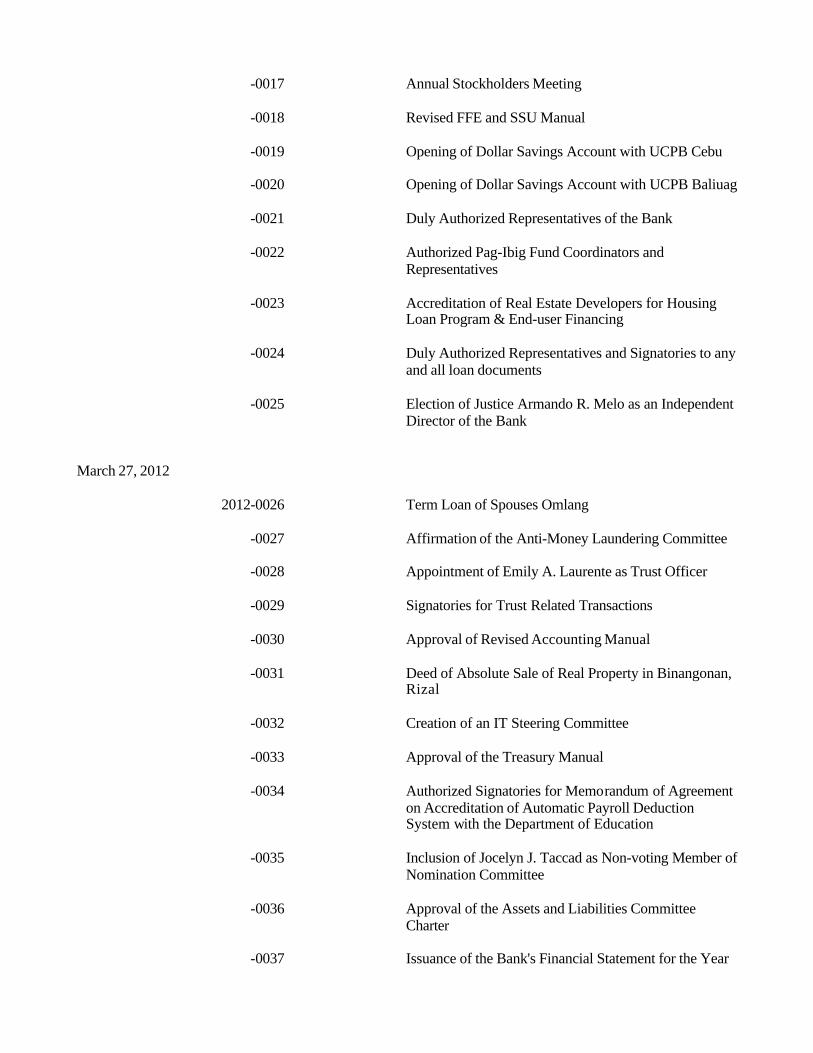
-0017 Annual Stockholders Meeting
-0018 Revised FFE and SSU Manual
-0019 Opening of Dollar Savings Account with UCPB Cebu
-0020 Opening of Dollar Savings Account with UCPB Baliuag
-0021 Duly Authorized Representatives of the Bank
-0022 Authorized Pag-Ibig Fund Coordinators and Representatives
-0023 Accreditation of Real Estate Developers for Housing Loan Program & End-user Financing
-0024 Duly Authorized Representatives and Signatories to any
and all loan documents
-0025 Election of Justice Armando R. Melo as an Independent Director of the Bank
March 27, 2012
2012-0026 Term Loan of Spouses Omlang
-0027 Affirmation of the Anti-Money Laundering Committee
-0028 Appointment of Emily A. Laurente as Trust Officer
-0029 Signatories for Trust Related Transactions
-0030 Approval of Revised Accounting Manual
-0031 Deed of Absolute Sale of Real Property in Binangonan, Rizal
-0032 Creation of an IT Steering Committee
-0033 Approval of the Treasury Manual
-0034 Authorized Signatories for Memorandum of Agreement on Accreditation of Automatic Payroll Deduction System with the Department of Education
-0035 Inclusion of Jocelyn J. Taccad as Non-voting Member ofNomination Committee
-0036 Approval of the Assets and Liabilities Committee Charter
-0037 Issuance of the Bank's Financial Statement for the Year
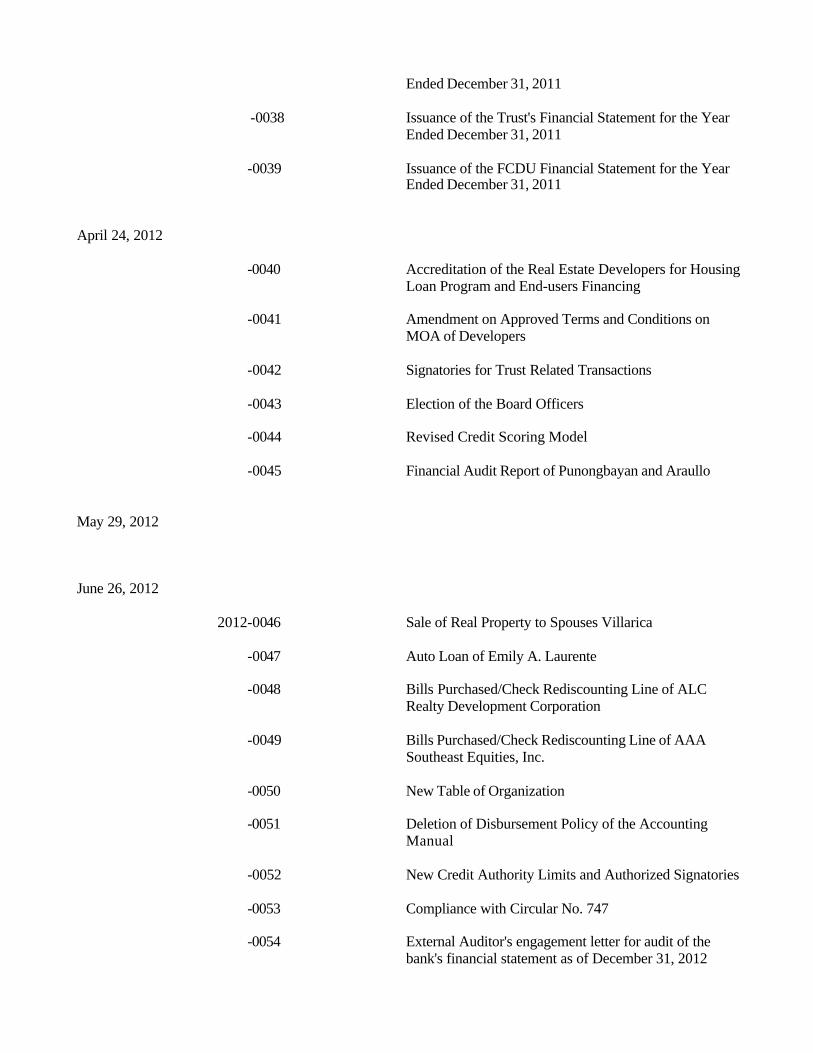
Ended December 31, 2011
-0038 Issuance of the Trust's Financial Statement for the Year Ended December 31, 2011
-0039 Issuance of the FCDU Financial Statement for the Year Ended December 31, 2011
April 24, 2012
-0040 Accreditation of the Real Estate Developers for HousingLoan Program and End-users Financing
-0041 Amendment on Approved Terms and Conditions on
MOA of Developers
-0042 Signatories for Trust Related Transactions
-0043 Election of the Board Officers
-0044 Revised Credit Scoring Model
-0045 Financial Audit Report of Punongbayan and Araullo
May 29, 2012
June 26, 2012
2012-0046 Sale of Real Property to Spouses Villarica
-0047 Auto Loan of Emily A. Laurente
-0048 Bills Purchased/Check Rediscounting Line of ALC Realty Development Corporation
-0049 Bills Purchased/Check Rediscounting Line of AAA Southeast Equities, Inc.
-0050 New Table of Organization
-0051 Deletion of Disbursement Policy of the Accounting Manual
-0052 New Credit Authority Limits and Authorized Signatories
-0053 Compliance with Circular No. 747
-0054 External Auditor's engagement letter for audit of the bank's financial statement as of December 31, 2012
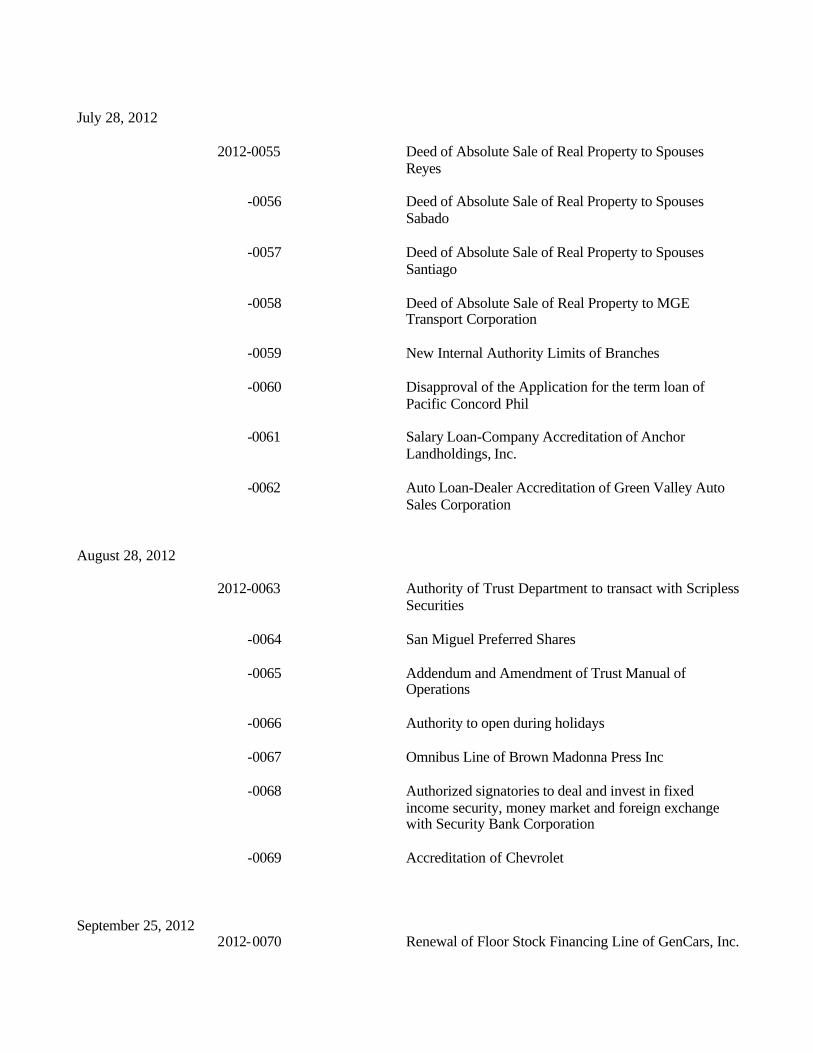
July 28, 2012
2012-0055 Deed of Absolute Sale of Real Property to Spouses Reyes
-0056 Deed of Absolute Sale of Real Property to Spouses Sabado
-0057 Deed of Absolute Sale of Real Property to Spouses Santiago
-0058 Deed of Absolute Sale of Real Property to MGE Transport Corporation
-0059 New Internal Authority Limits of Branches
-0060 Disapproval of the Application for the term loan of Pacific Concord Phil
-0061 Salary Loan-Company Accreditation of Anchor Landholdings, Inc.
-0062 Auto Loan-Dealer Accreditation of Green Valley Auto Sales Corporation
August 28, 2012
2012-0063 Authority of Trust Department to transact with ScriplessSecurities
-0064 San Miguel Preferred Shares
-0065 Addendum and Amendment of Trust Manual of Operations
-0066 Authority to open during holidays
-0067 Omnibus Line of Brown Madonna Press Inc
-0068 Authorized signatories to deal and invest in fixed income security, money market and foreign exchange with Security Bank Corporation
-0069 Accreditation of Chevrolet
September 25, 20122012-0070 Renewal of Floor Stock Financing Line of GenCars, Inc.
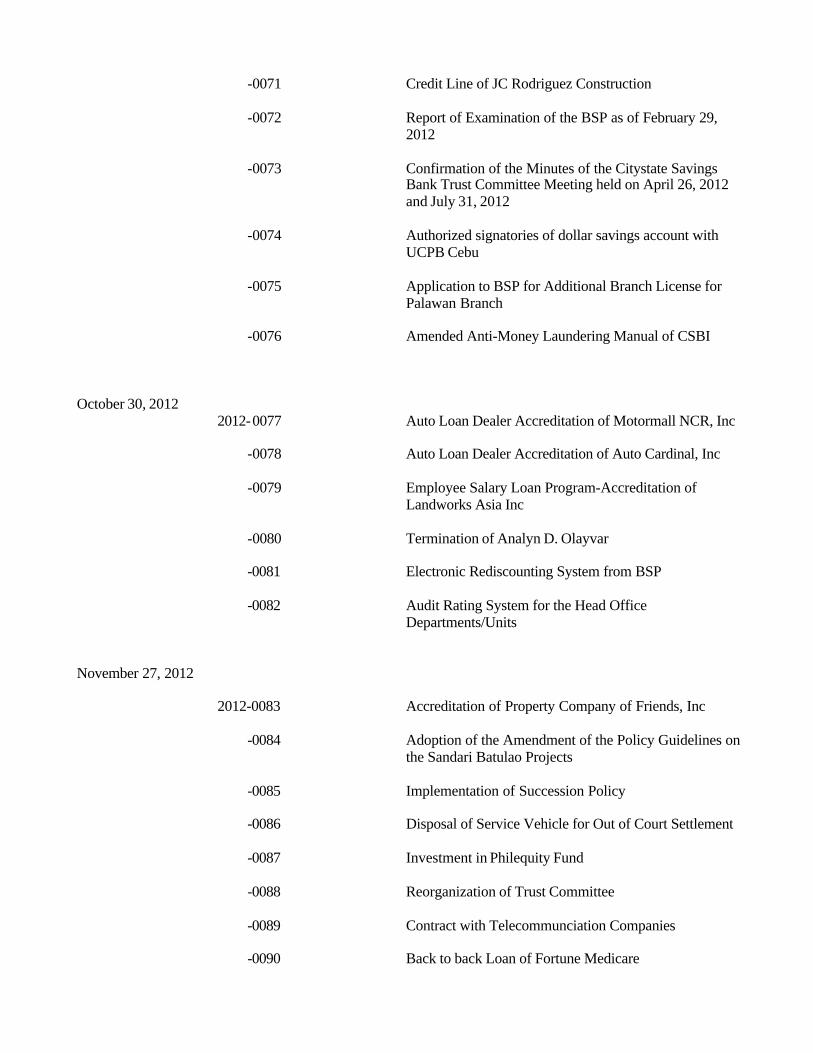
-0071 Credit Line of JC Rodriguez Construction
-0072 Report of Examination of the BSP as of February 29, 2012
-0073 Confirmation of the Minutes of the Citystate Savings Bank Trust Committee Meeting held on April 26, 2012 and July 31, 2012
-0074 Authorized signatories of dollar savings account with UCPB Cebu
-0075 Application to BSP for Additional Branch License for Palawan Branch
-0076 Amended Anti-Money Laundering Manual of CSBI
October 30, 20122012-0077 Auto Loan Dealer Accreditation of Motormall NCR, Inc
-0078 Auto Loan Dealer Accreditation of Auto Cardinal, Inc
-0079 Employee Salary Loan Program-Accreditation of Landworks Asia Inc
-0080 Termination of Analyn D. Olayvar
-0081 Electronic Rediscounting System from BSP
-0082 Audit Rating System for the Head Office Departments/Units
November 27, 2012
2012-0083 Accreditation of Property Company of Friends, Inc
-0084 Adoption of the Amendment of the Policy Guidelines onthe Sandari Batulao Projects
-0085 Implementation of Succession Policy
-0086 Disposal of Service Vehicle for Out of Court Settlement
-0087 Investment in Philequity Fund
-0088 Reorganization of Trust Committee
-0089 Contract with Telecommunciation Companies
-0090 Back to back Loan of Fortune Medicare
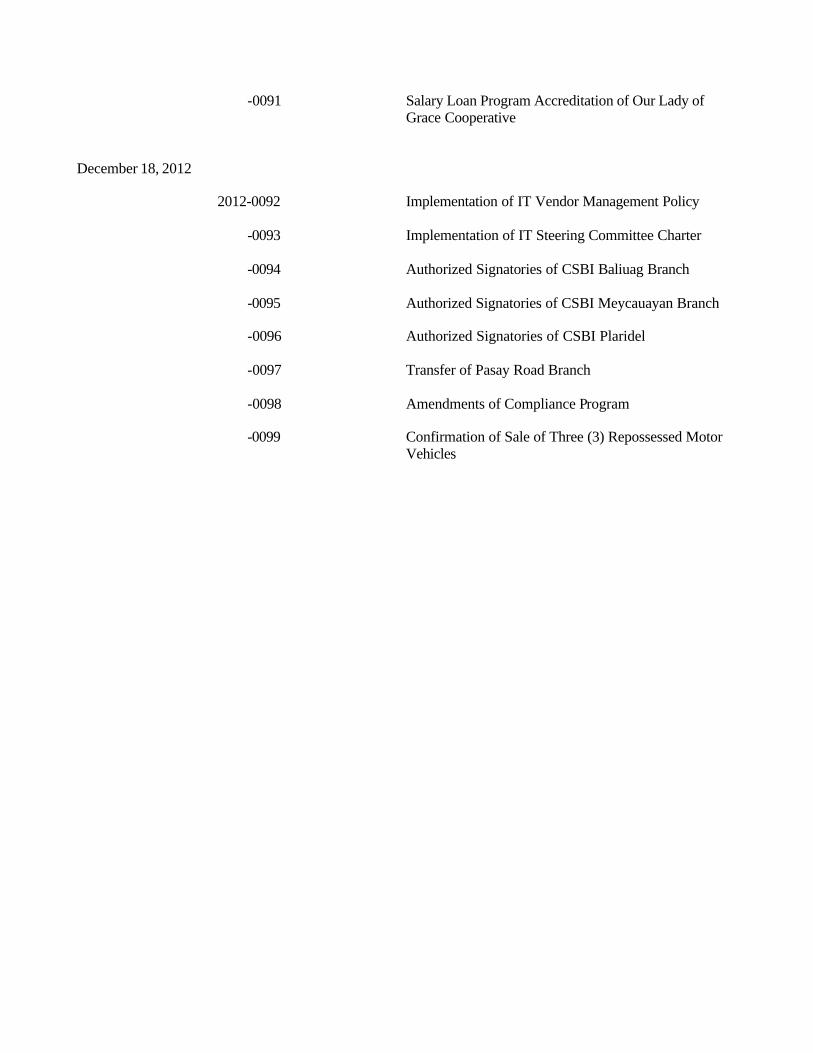
-0091 Salary Loan Program Accreditation of Our Lady of
Grace Cooperative
December 18, 2012
2012-0092 Implementation of IT Vendor Management Policy
-0093 Implementation of IT Steering Committee Charter
-0094 Authorized Signatories of CSBI Baliuag Branch
-0095 Authorized Signatories of CSBI Meycauayan Branch
-0096 Authorized Signatories of CSBI Plaridel
-0097 Transfer of Pasay Road Branch
-0098 Amendments of Compliance Program
-0099 Confirmation of Sale of Three (3) Repossessed Motor Vehicles


![[Smarter Makati Presentation : Makati City, Philipines]](https://img.pdfslide.net/doc/110x75/558624e6d8b42a56578b4595/smarter-makati-presentation-makati-city-philipines.jpg)