Embed Size (px)
Citation preview
CORNERSTONE RESEARCH
Securities Class Action Filings
ECONOMIC AND FINANCIAL CONSULTING AND EXPERT TESTIMONY
2014 Year in Review
2014 Trends | U.S. Exchange-Listed Companies | IPO Activity | MDL/DDL Values | Dismissal Rates
Securities Class Action Filings—2014 Year in Review i TABLE OF CONTENTS
Executive Summary ..................................................................................................................................................................... 1 New for the 2014 Year in Review ................................................................................................................................................ 3 Number of Filings ........................................................................................................................................................................ 4 Market Capitalization Losses ....................................................................................................................................................... 6 Classification of Complaints ........................................................................................................................................................ 8 New Analysis: Litigation Likelihood of U.S. Exchange-Listed Companies................................................................................ 9 New Analysis: IPO Activity ...................................................................................................................................................... 10 New Analysis: Number of Filings with MDL/DDL Values ...................................................................................................... 11 New Analysis: Status of Securities Class Action Filings ........................................................................................................... 12 Filing Lag .................................................................................................................................................................................. 14 Foreign Filings ........................................................................................................................................................................... 15 Heat Maps: S&P 500 Securities Litigation™ ............................................................................................................................. 17 Mega Filings .............................................................................................................................................................................. 19 New Analysis: Distribution of MDL Values ............................................................................................................................. 20 New Analysis: Distribution of DDL Values .............................................................................................................................. 21 Industry ...................................................................................................................................................................................... 22 Exchange ................................................................................................................................................................................... 24 Circuit ........................................................................................................................................................................................ 25 New Developments .................................................................................................................................................................... 26 Glossary ..................................................................................................................................................................................... 27 Appendices ................................................................................................................................................................................ 29 Research Sample ........................................................................................................................................................................ 31
The views expressed in this report are solely those of the authors, who are responsible for the content, and do not necessarily represent the views of Cornerstone Research.
Securities Class Action Filings—2014 Year in Review ii TABLE OF FIGURES AND APPENDICES
Figure 1: Class Action Filings Summary ..................................................................................................................................... 1 Figure 2: Class Action Filings (CAF) Index™ Annual Number of Class Action Filings ............................................................ 4 Figure 3: Class Action Filings (CAF) Index™ Semiannual Number of Class Action Filings..................................................... 5 Figure 4: Disclosure Dollar Loss (DDL) Index™ ....................................................................................................................... 6 Figure 5: Maximum Dollar Loss (MDL) Index™ ....................................................................................................................... 7 Figure 6: 2014 Allegations Box Score ......................................................................................................................................... 8 Figure 7: Percentage of U.S. Exchange-Listed Companies Subject to Filings and Change in the Number of Companies
Listed on U.S. Exchanges ..................................................................................................................................................... 9 Figure 8: Number of IPOs on Major U.S. Exchanges................................................................................................................ 10 Figure 9: Filings with MDL/DDL Values.................................................................................................................................. 11 Figure 10: Status of Filings by Year .......................................................................................................................................... 12 Figure 11: Settlement and Dismissal Rates in Recent Years ..................................................................................................... 13 Figure 12: Annual Median Lag between Class End Date and Filing Date ................................................................................ 14 Figure 13: Class Action Filings-Foreign (CAF-F) Index™ Annual Number of Class Action Filings by Location
of Headquarters .................................................................................................................................................................. 15 Figure 14: Foreign Filings by Location of Headquarters ........................................................................................................... 16 Figure 15: Heat Maps of S&P 500 Securities Litigation™ Percentage of Companies Subject to New Filings ........................ 17 Figure 16: Heat Maps of S&P 500 Securities Litigation™ Percentage of Market Capitalization Subject to New Filings........ 18 Figure 17: Mega Filings ............................................................................................................................................................. 19 Figure 18: Distribution of MDL—Percentage of Total MDL Attributable to Filings in the Grouping ..................................... 20 Figure 19: Distribution of DDL—Percentage of Total DDL Attributable to Filings in the Grouping ...................................... 21 Figure 20: Filings by Industry ................................................................................................................................................... 22 Figure 21: Filings in the Consumer, Non-Cyclical Sector ......................................................................................................... 23 Figure 22: Filings by Exchange Listing ..................................................................................................................................... 24 Figure 23: Filings by Court Circuit ............................................................................................................................................ 25 Appendix 1: Filings Comparison ............................................................................................................................................... 29 Appendix 2: Filings by Industry ................................................................................................................................................ 29 Appendix 3: Filings by Court Circuit ........................................................................................................................................ 30
Securities Class Action Filings—2014 Year in Review 1 EXECUTIVE SUMMARY
NUMBER AND SIZE OF FILINGS
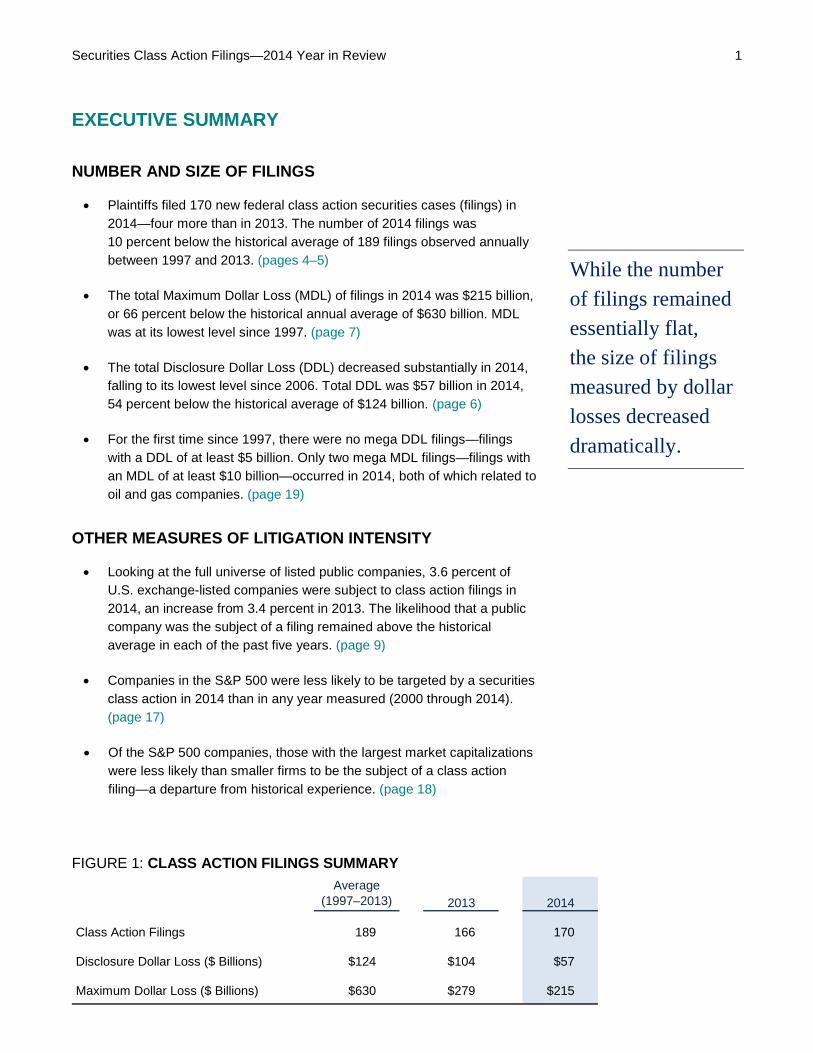
• Plaintiffs filed 170 new federal class action securities cases (filings) in 2014—four more than in 2013. The number of 2014 filings was 10 percent below the historical average of 189 filings observed annually between 1997 and 2013. (pages 4–5)
• The total Maximum Dollar Loss (MDL) of filings in 2014 was $215 billion, or 66 percent below the historical annual average of $630 billion. MDL was at its lowest level since 1997. (page 7)
• The total Disclosure Dollar Loss (DDL) decreased substantially in 2014, falling to its lowest level since 2006. Total DDL was $57 billion in 2014, 54 percent below the historical average of $124 billion. (page 6)
• For the first time since 1997, there were no mega DDL filings—filings with a DDL of at least $5 billion. Only two mega MDL filings—filings with an MDL of at least $10 billion—occurred in 2014, both of which related to oil and gas companies. (page 19)
While the number of filings remained essentially flat, the size of filings measured by dollar losses decreased dramatically.
OTHER MEASURES OF LITIGATION INTENSITY
• Looking at the full universe of listed public companies, 3.6 percent of U.S. exchange-listed companies were subject to class action filings in 2014, an increase from 3.4 percent in 2013. The likelihood that a public company was the subject of a filing remained above the historical average in each of the past five years. (page 9)
• Companies in the S&P 500 were less likely to be targeted by a securities class action in 2014 than in any year measured (2000 through 2014). (page 17)
• Of the S&P 500 companies, those with the largest market capitalizations were less likely than smaller firms to be the subject of a class action filing—a departure from historical experience. (page 18)
FIGURE 1: CLASS ACTION FILINGS SUMMARY
2013 2014
Class Action Filings 189 166 170
Disclosure Dollar Loss ($ Billions) $124 $104 $57
Maximum Dollar Loss ($ Billions) $630 $279 $215
Average(1997–2013)
Securities Class Action Filings—2014 Year in Review 2 EXECUTIVE SUMMARY continued
KEY TRENDS
• IPO activity continued the upward trajectory that has followed the nadir of offerings in 2008 (with potential implications for future litigation). (page 10)
• The percentage of filings against foreign issuers increased in 2014 for the first time in three years. (pages 15–16)
• Filings against companies in the Consumer Non-Cyclical sector—which includes biotechnology and pharmaceutical firms—increased markedly in 2014. (pages 22–23)
• Filings against energy companies gained prominence in the fourth quarter of 2014 as oil and gas prices declined. (pages 19 and 22)
• Collectively, filings in the Second and Ninth Circuits in 2014 were more consistent with historical averages compared with the number filed last year, although total MDL and DDL declined considerably relative to historical averages. Filings in the Third Circuit increased to the highest level since 2004. (page 25)
Filings have increasingly targeted firms in the biotechnology and pharmaceutical industries.
Securities Class Action Filings—2014 Year in Review 3 NEW FOR THE 2014 YEAR IN REVIEW
TRENDS IN THE NUMBER OF PUBLIC COMPANIES AND THEIR LITIGATION EXPOSURE
This analysis tracks the number of companies listed on U.S. exchanges, as well as the likelihood they were the subject of a class action filing. (pages 9–10)
• The number of companies listed on U.S. exchanges increased recently after a 15-year decline, due in part to the quickening pace of IPO activity in 2014.
• On major U.S. exchanges, there were 206 IPOs in 2014, a 31 percent increase from 2013.
• The likelihood that a public company was the subject of a filing remained above the historical average in each of the past five years.
Dismissal rates have continued to increase for filings in cohort years 2010, 2011, and 2012.
DISMISSAL TRENDS
This analysis revisits earlier work conducted in 2010 and 2013 examining the outcomes of class action filings. Starting in the mid-2000s, the likelihood of dismissal began increasing. (pages 12–13)
• Filings have been dismissed at a rate of 59 percent and 58 percent in cohort years 2010 and 2011, respectively. Dismissal rates for these years may edge higher as pending cases are resolved.
• For cohort year 2012, 40 percent of filings have been dismissed. Dismissal rates for this cohort year will increase as class actions are resolved for the ongoing cases filed in that year.
• Statistical tests indicate that the likelihood of dismissal remains higher for filings in recent cohorts even after controlling for filing characteristics such as filing type, industry, and circuit.
NEW DEVELOPMENTS
• Halliburton Co. v. Erica P. John Fund (page 26)
Securities Class Action Filings—2014 Year in Review 4 NUMBER OF FILINGS
KEY FINDINGS
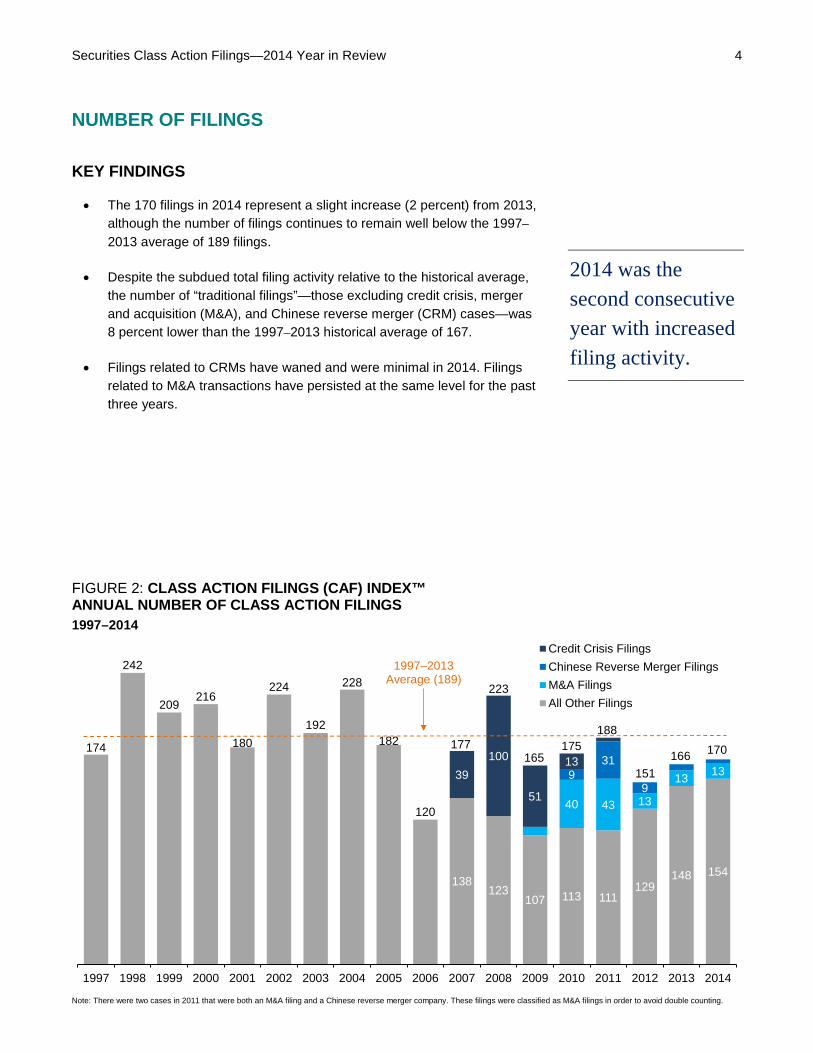
• The 170 filings in 2014 represent a slight increase (2 percent) from 2013, although the number of filings continues to remain well below the 1997–2013 average of 189 filings.
• Despite the subdued total filing activity relative to the historical average, the number of “traditional filings”—those excluding credit crisis, merger and acquisition (M&A), and Chinese reverse merger (CRM) cases—was 8 percent lower than the 1997–2013 historical average of 167.
• Filings related to CRMs have waned and were minimal in 2014. Filings related to M&A transactions have persisted at the same level for the past three years.
2014 was the second consecutive year with increased filing activity.
FIGURE 2: CLASS ACTION FILINGS (CAF) INDEX™ ANNUAL NUMBER OF CLASS ACTION FILINGS 1997–2014
Note: There were two cases in 2011 that were both an M&A filing and a Chinese reverse merger company. These filings were classified as M&A filings in order to avoid double counting.
174
242
209216
180
224
192
228
182
120
138123
107 113 111129
148 154
40 43 13
13 13931
939
100
51
13
1997 1998 1999 2000 2001 2002 2003 2004 2005 2006 2007 2008 2009 2010 2011 2012 2013 2014
Credit Crisis FilingsChinese Reverse Merger FilingsM&A FilingsAll Other Filings
1997–2013 Average (189)
177
223
165175
188
151
170166
Securities Class Action Filings—2014 Year in Review 5 NUMBER OF FILINGS continued
KEY FINDINGS
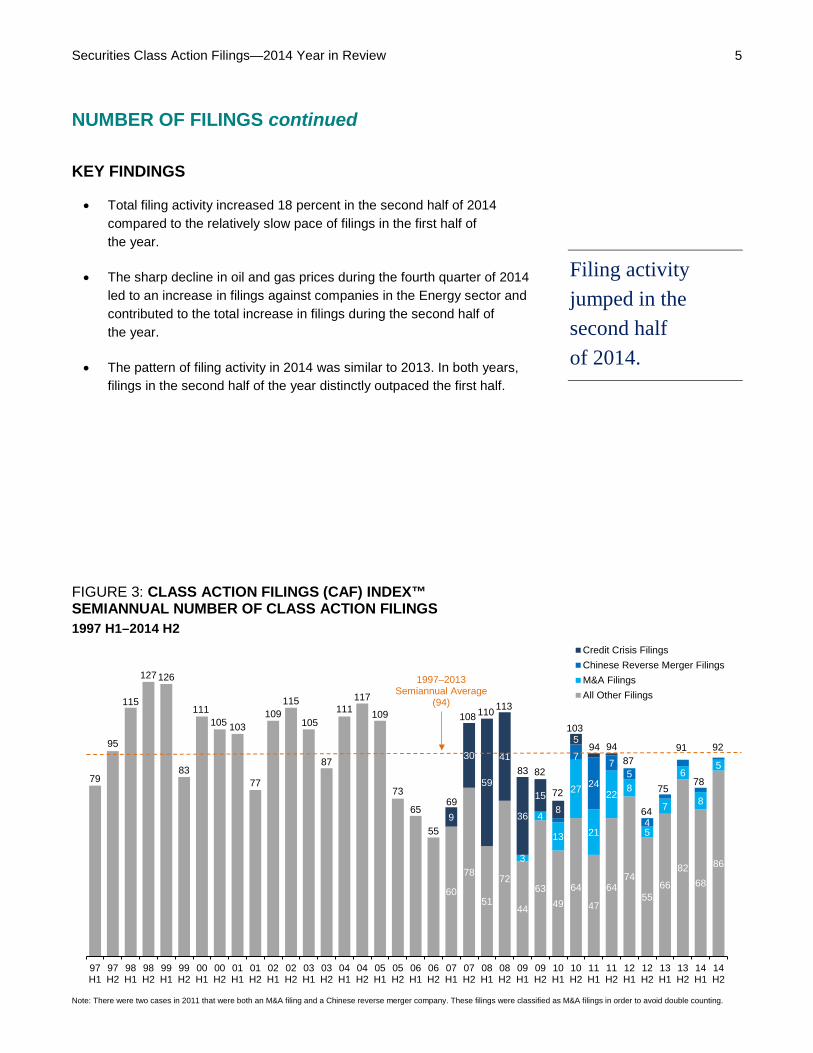
• Total filing activity increased 18 percent in the second half of 2014 compared to the relatively slow pace of filings in the first half of the year.
• The sharp decline in oil and gas prices during the fourth quarter of 2014 led to an increase in filings against companies in the Energy sector and contributed to the total increase in filings during the second half of the year.
• The pattern of filing activity in 2014 was similar to 2013. In both years, filings in the second half of the year distinctly outpaced the first half.
Filing activity jumped in the second half of 2014.
FIGURE 3: CLASS ACTION FILINGS (CAF) INDEX™ SEMIANNUAL NUMBER OF CLASS ACTION FILINGS 1997 H1–2014 H2
Note: There were two cases in 2011 that were both an M&A filing and a Chinese reverse merger company. These filings were classified as M&A filings in order to avoid double counting.
79
95
115
127126
83
111105 103
77
109115
105
87
111117
109
73
65
55
60
78
51
72
44
6349
64
47
6474
5566
8268
863
4
13
27
21
22 8
5
7
6
8
57
24
75
49
30
59
41
36
158
5
97H1
97H2
98H1
98H2
99H1
99H2
00H1
00H2
01H1
01H2
02H1
02H2
03H1
03H2
04H1
04H2
05H1
05H2
06H1
06H2
07H1
07H2
08H1
08H2
09H1
09H2
10H1
10H2
11H1
11H2
12H1
12H2
13H1
13H2
14H1
14H2
Credit Crisis FilingsChinese Reverse Merger FilingsM&A FilingsAll Other Filings
6964
879494
103
72
8283
113110108
1997–2013 Semiannual Average
(94)
75
91 92
78
Securities Class Action Filings—2014 Year in Review 6 MARKET CAPITALIZATION LOSSES
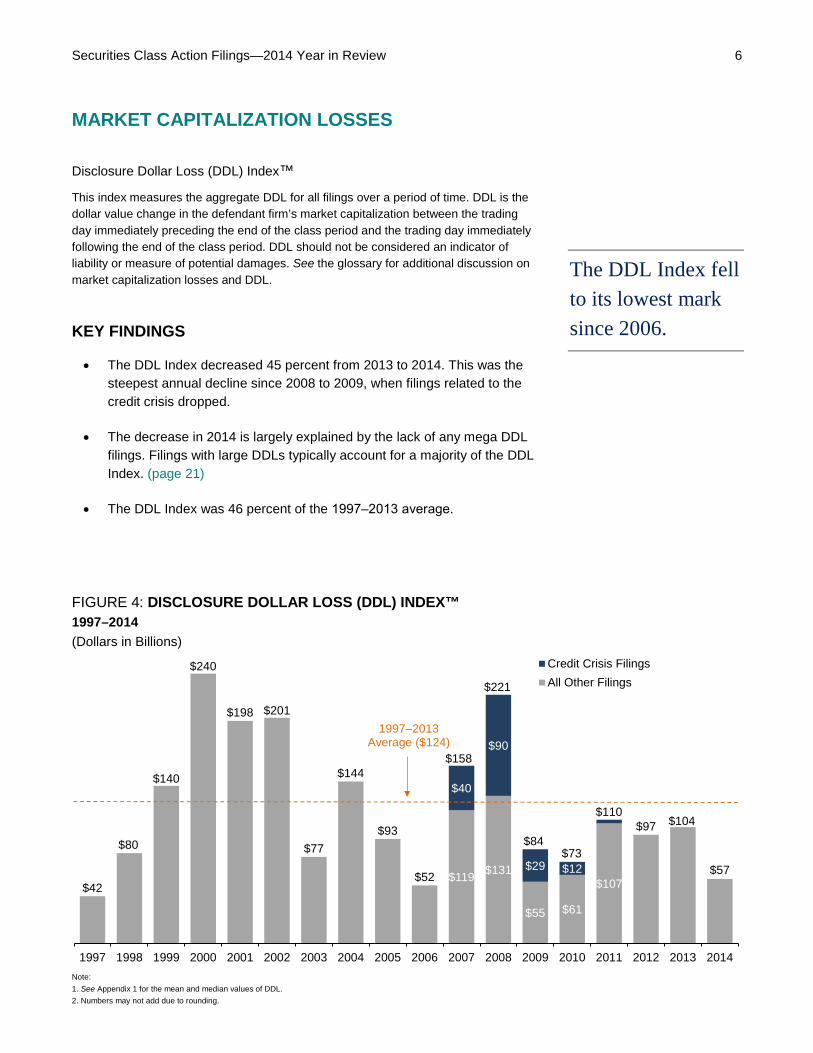
Disclosure Dollar Loss (DDL) Index™
This index measures the aggregate DDL for all filings over a period of time. DDL is the dollar value change in the defendant firm’s market capitalization between the trading day immediately preceding the end of the class period and the trading day immediately following the end of the class period. DDL should not be considered an indicator of liability or measure of potential damages. See the glossary for additional discussion on market capitalization losses and DDL.
The DDL Index fell to its lowest mark since 2006. KEY FINDINGS
• The DDL Index decreased 45 percent from 2013 to 2014. This was the steepest annual decline since 2008 to 2009, when filings related to the credit crisis dropped.
• The decrease in 2014 is largely explained by the lack of any mega DDL filings. Filings with large DDLs typically account for a majority of the DDL Index. (page 21)
• The DDL Index was 46 percent of the 1997‒2013 average.
FIGURE 4: DISCLOSURE DOLLAR LOSS (DDL) INDEX™ 1997–2014 (Dollars in Billions)
Note: 1. See Appendix 1 for the mean and median values of DDL. 2. Numbers may not add due to rounding.
$42
$80
$140
$240
$198 $201
$77
$144
$93
$52 $119 $131
$55 $61
$107
$97 $104
$57
$40
$90
$29 $12
1997 1998 1999 2000 2001 2002 2003 2004 2005 2006 2007 2008 2009 2010 2011 2012 2013 2014
Credit Crisis FilingsAll Other Filings
1997–2013 Average ($124)
$55
$158
$221
$84$73
$110
Securities Class Action Filings—2014 Year in Review 7 MARKET CAPITALIZATION LOSSES continued
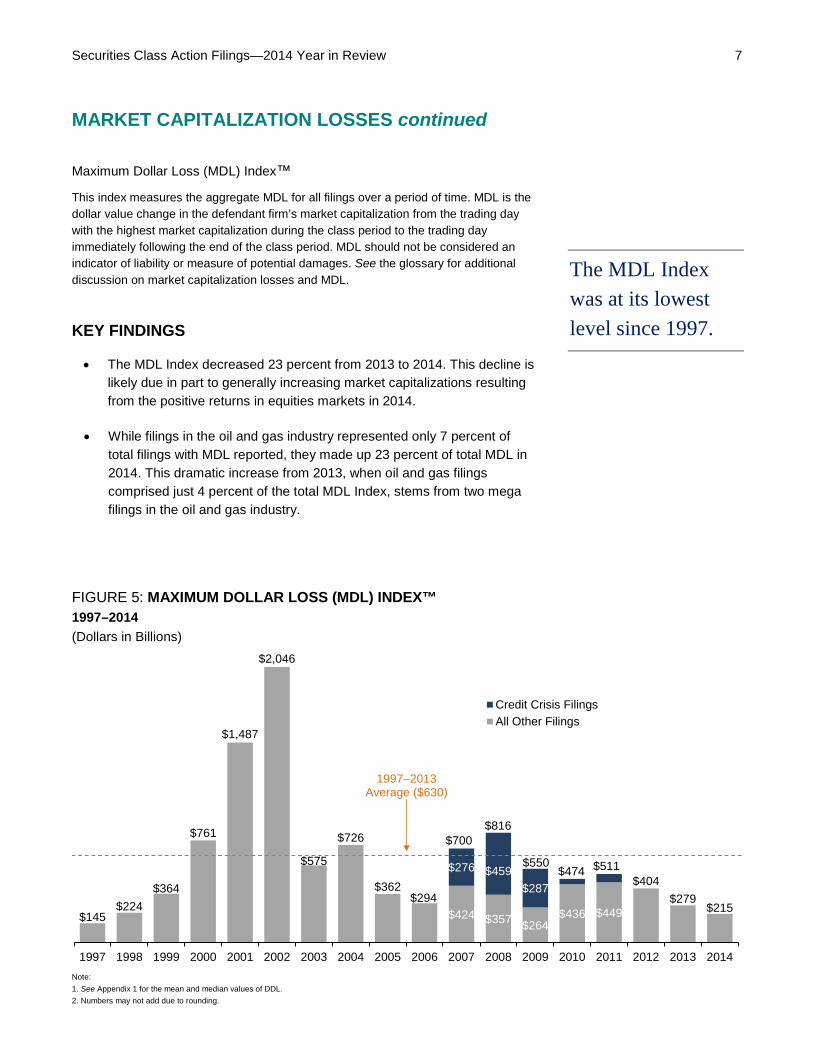
Maximum Dollar Loss (MDL) Index™
This index measures the aggregate MDL for all filings over a period of time. MDL is the dollar value change in the defendant firm’s market capitalization from the trading day with the highest market capitalization during the class period to the trading day immediately following the end of the class period. MDL should not be considered an indicator of liability or measure of potential damages. See the glossary for additional discussion on market capitalization losses and MDL.
The MDL Index was at its lowest level since 1997. KEY FINDINGS
• The MDL Index decreased 23 percent from 2013 to 2014. This decline is likely due in part to generally increasing market capitalizations resulting from the positive returns in equities markets in 2014.
• While filings in the oil and gas industry represented only 7 percent of total filings with MDL reported, they made up 23 percent of total MDL in 2014. This dramatic increase from 2013, when oil and gas filings comprised just 4 percent of the total MDL Index, stems from two mega filings in the oil and gas industry.
FIGURE 5: MAXIMUM DOLLAR LOSS (MDL) INDEX™ 1997–2014 (Dollars in Billions)
Note: 1. See Appendix 1 for the mean and median values of DDL. 2. Numbers may not add due to rounding.
$145$224
$364
$761
$1,487
$2,046
$575
$726
$362$294
$424 $357 $264$436 $449
$404$279
$215
$276 $459$287
1997 1998 1999 2000 2001 2002 2003 2004 2005 2006 2007 2008 2009 2010 2011 2012 2013 2014
Credit Crisis FilingsAll Other Filings
1997–2013 Average ($630)
$55
$40
$90
$700$816
$550$474 $511
Securities Class Action Filings—2014 Year in Review 8 CLASSIFICATION OF COMPLAINTS
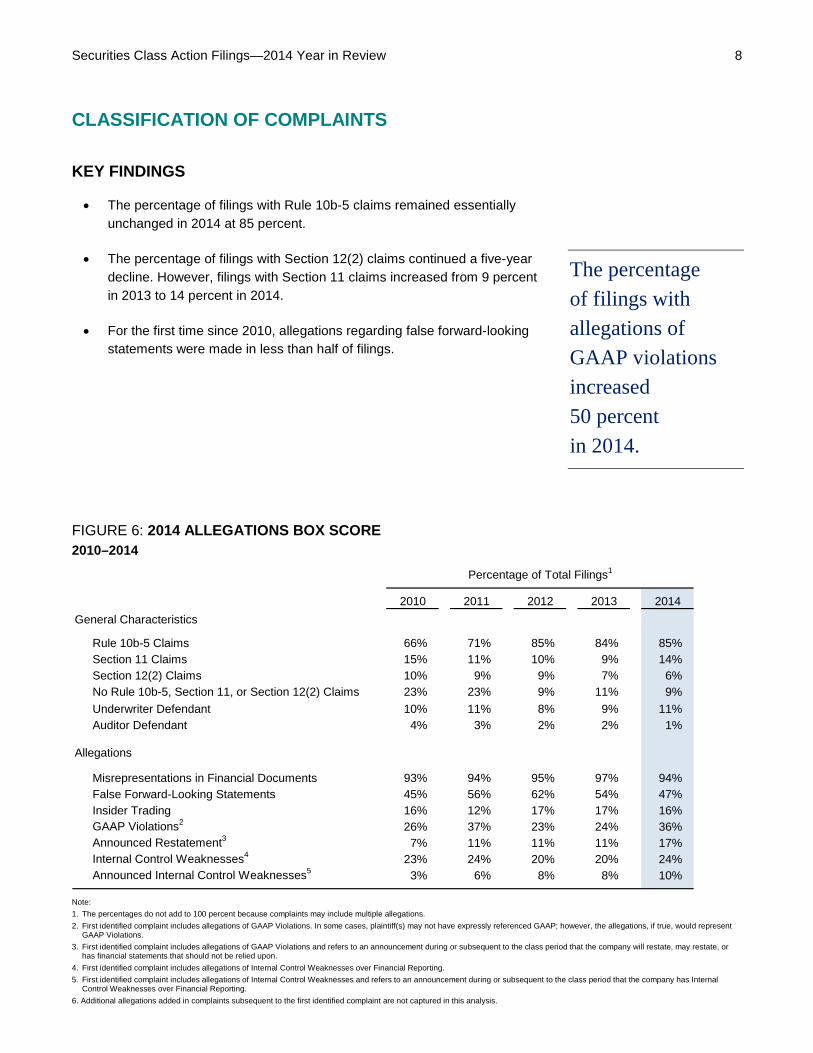
KEY FINDINGS
• The percentage of filings with Rule 10b-5 claims remained essentially unchanged in 2014 at 85 percent.
• The percentage of filings with Section 12(2) claims continued a five-year decline. However, filings with Section 11 claims increased from 9 percent in 2013 to 14 percent in 2014.
• For the first time since 2010, allegations regarding false forward-looking statements were made in less than half of filings.
The percentage of filings with allegations of GAAP violations increased 50 percent in 2014.
FIGURE 6: 2014 ALLEGATIONS BOX SCORE 2010–2014
Note: 1. The percentages do not add to 100 percent because complaints may include multiple allegations. 2. First identified complaint includes allegations of GAAP Violations. In some cases, plaintiff(s) may not have expressly referenced GAAP; however, the allegations, if true, would represent
GAAP Violations. 3. First identified complaint includes allegations of GAAP Violations and refers to an announcement during or subsequent to the class period that the company will restate, may restate, or
has financial statements that should not be relied upon. 4. First identified complaint includes allegations of Internal Control Weaknesses over Financial Reporting. 5. First identified complaint includes allegations of Internal Control Weaknesses and refers to an announcement during or subsequent to the class period that the company has Internal
Control Weaknesses over Financial Reporting. 6. Additional allegations added in complaints subsequent to the first identified complaint are not captured in this analysis.
Percentage of Total Filings1
2010 2011 2012 2013 2014General Characteristics
Rule 10b-5 Claims 66% 71% 85% 84% 85%Section 11 Claims 15% 11% 10% 9% 14%Section 12(2) Claims 10% 9% 9% 7% 6%No Rule 10b-5, Section 11, or Section 12(2) Claims 23% 23% 9% 11% 9%Underwriter Defendant 10% 11% 8% 9% 11%Auditor Defendant 4% 3% 2% 2% 1%
Allegations
Misrepresentations in Financial Documents 93% 94% 95% 97% 94%False Forward-Looking Statements 45% 56% 62% 54% 47%Insider Trading 16% 12% 17% 17% 16%GAAP Violations2 26% 37% 23% 24% 36%Announced Restatement3 7% 11% 11% 11% 17%Internal Control Weaknesses4 23% 24% 20% 20% 24%Announced Internal Control Weaknesses5 3% 6% 8% 8% 10%
Securities Class Action Filings—2014 Year in Review 9 NEW ANALYSIS: LITIGATION LIKELIHOOD OF U.S. EXCHANGE-LISTED COMPANIES
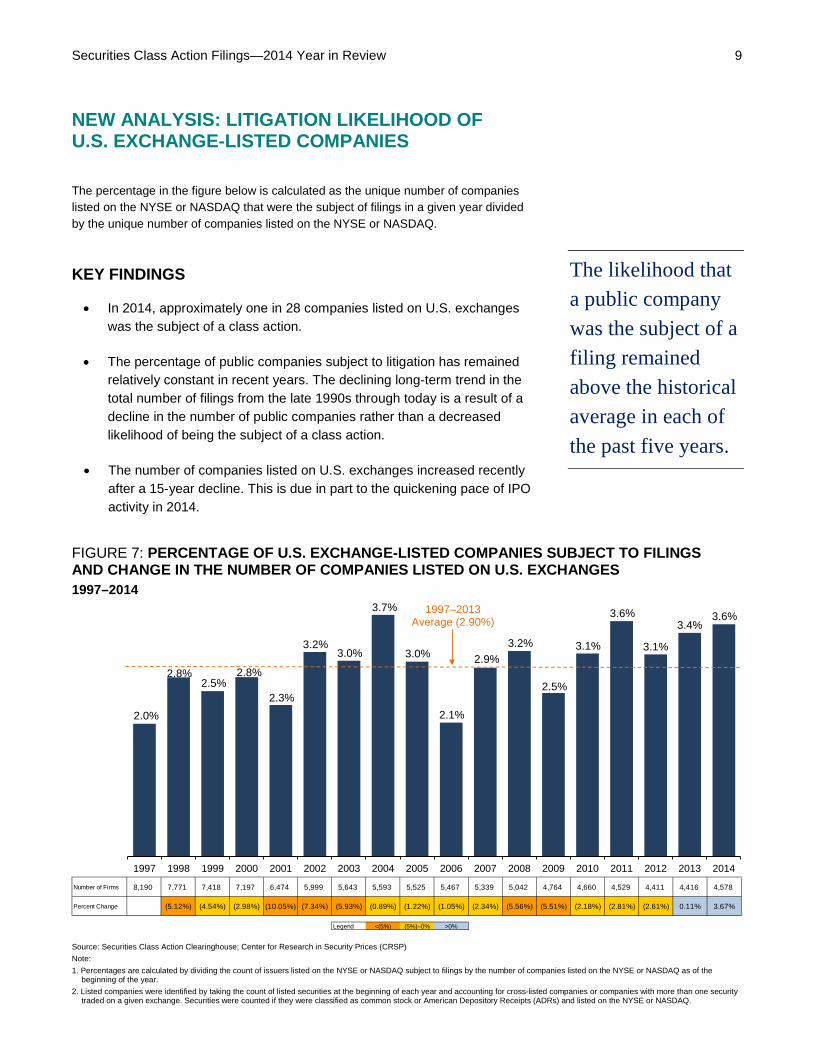
The percentage in the figure below is calculated as the unique number of companies listed on the NYSE or NASDAQ that were the subject of filings in a given year divided by the unique number of companies listed on the NYSE or NASDAQ.
The likelihood that a public company was the subject of a filing remained above the historical average in each of the past five years.
KEY FINDINGS
• In 2014, approximately one in 28 companies listed on U.S. exchanges was the subject of a class action.
• The percentage of public companies subject to litigation has remained relatively constant in recent years. The declining long-term trend in the total number of filings from the late 1990s through today is a result of a decline in the number of public companies rather than a decreased likelihood of being the subject of a class action.
• The number of companies listed on U.S. exchanges increased recently after a 15-year decline. This is due in part to the quickening pace of IPO activity in 2014.
FIGURE 7: PERCENTAGE OF U.S. EXCHANGE-LISTED COMPANIES SUBJECT TO FILINGS AND CHANGE IN THE NUMBER OF COMPANIES LISTED ON U.S. EXCHANGES 1997–2014
Source: Securities Class Action Clearinghouse; Center for Research in Security Prices (CRSP) Note: 1. Percentages are calculated by dividing the count of issuers listed on the NYSE or NASDAQ subject to filings by the number of companies listed on the NYSE or NASDAQ as of the
beginning of the year. 2. Listed companies were identified by taking the count of listed securities at the beginning of each year and accounting for cross-listed companies or companies with more than one security
traded on a given exchange. Securities were counted if they were classified as common stock or American Depository Receipts (ADRs) and listed on the NYSE or NASDAQ.
2.0%
2.8%2.5%
2.8%
2.3%
3.2%3.0%
3.7%
3.0%
2.1%
2.9%3.2%
2.5%
3.1%
3.6%
3.1%
3.4%3.6%
1997 1998 1999 2000 2001 2002 2003 2004 2005 2006 2007 2008 2009 2010 2011 2012 2013 2014
1997–2013Average (2.90%)
Number of Firms 8,190 7,771 7,418 7,197 6,474 5,999 5,643 5,593 5,525 5,467 5,339 5,042 4,764 4,660 4,529 4,411 4,416 4,578
Percent Change (5.12%) (4.54%) (2.98%) (10.05%) (7.34%) (5.93%) (0.89%) (1.22%) (1.05%) (2.34%) (5.56%) (5.51%) (2.18%) (2.81%) (2.61%) 0.11% 3.67%
Legend <(5%) (5%)–0% >0%
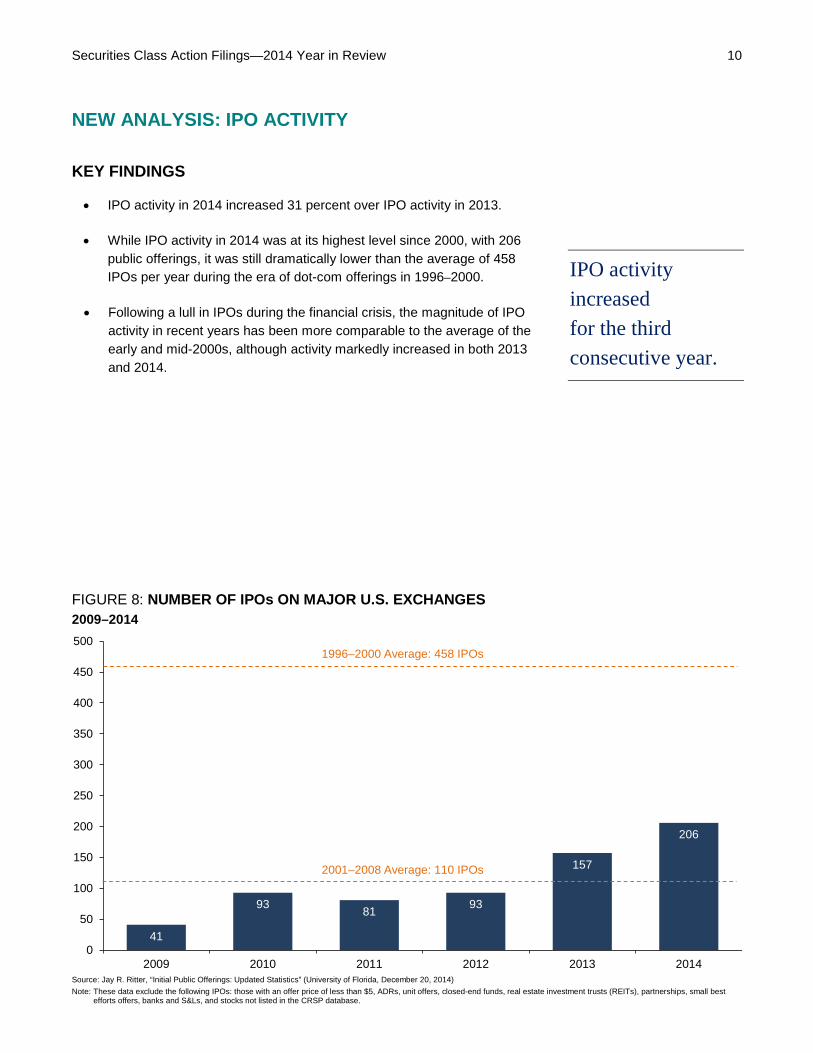
Securities Class Action Filings—2014 Year in Review 10 NEW ANALYSIS: IPO ACTIVITY
KEY FINDINGS
• IPO activity in 2014 increased 31 percent over IPO activity in 2013.
• While IPO activity in 2014 was at its highest level since 2000, with 206 public offerings, it was still dramatically lower than the average of 458 IPOs per year during the era of dot-com offerings in 1996–2000.
• Following a lull in IPOs during the financial crisis, the magnitude of IPO activity in recent years has been more comparable to the average of the early and mid-2000s, although activity markedly increased in both 2013 and 2014.
IPO activity increased for the third consecutive year.
FIGURE 8: NUMBER OF IPOs ON MAJOR U.S. EXCHANGES 2009–2014
Source: Jay R. Ritter, “Initial Public Offerings: Updated Statistics” (University of Florida, December 20, 2014) Note: These data exclude the following IPOs: those with an offer price of less than $5, ADRs, unit offers, closed-end funds, real estate investment trusts (REITs), partnerships, small best
efforts offers, banks and S&Ls, and stocks not listed in the CRSP database.
41
93 81 93
157
206
0
50
100
150
200
250
300
350
400
450
500
2009 2010 2011 2012 2013 2014
2001–2008 Average: 110 IPOs
1996–2000 Average: 458 IPOs
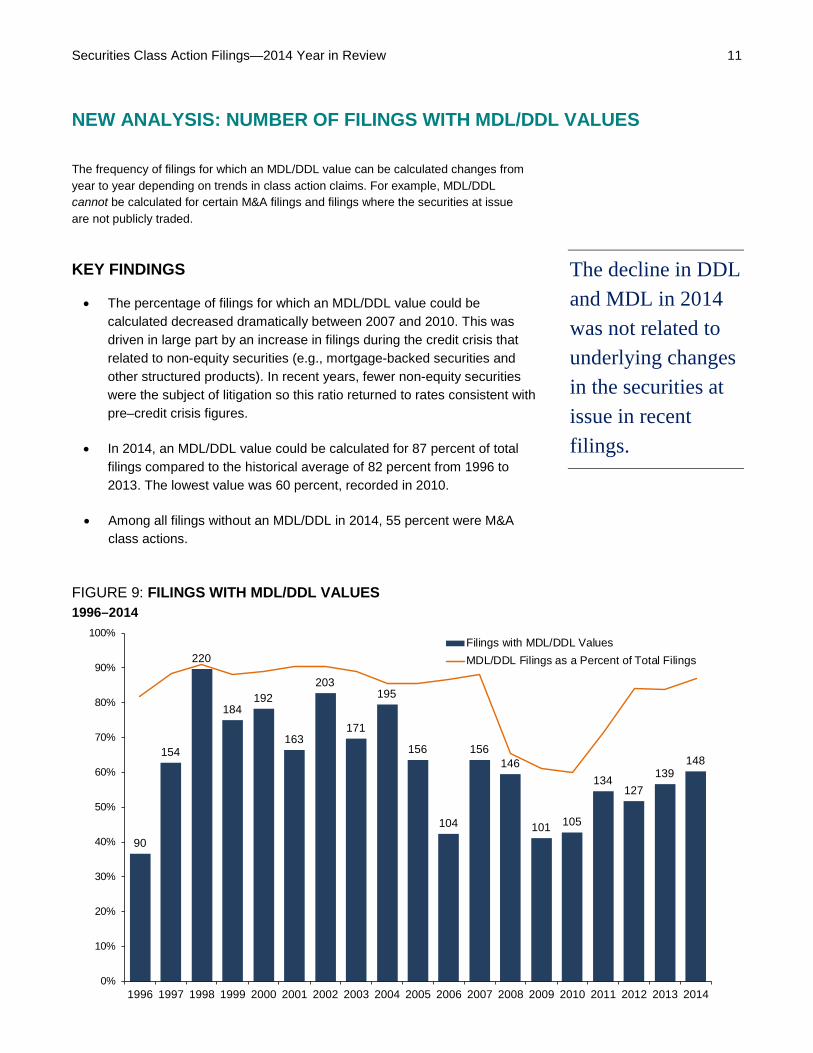
Securities Class Action Filings—2014 Year in Review 11 NEW ANALYSIS: NUMBER OF FILINGS WITH MDL/DDL VALUES
The frequency of filings for which an MDL/DDL value can be calculated changes from year to year depending on trends in class action claims. For example, MDL/DDL cannot be calculated for certain M&A filings and filings where the securities at issue are not publicly traded.
The decline in DDL and MDL in 2014 was not related to underlying changes in the securities at issue in recent filings.
KEY FINDINGS
• The percentage of filings for which an MDL/DDL value could be calculated decreased dramatically between 2007 and 2010. This was driven in large part by an increase in filings during the credit crisis that related to non-equity securities (e.g., mortgage-backed securities and other structured products). In recent years, fewer non-equity securities were the subject of litigation so this ratio returned to rates consistent with pre–credit crisis figures.
• In 2014, an MDL/DDL value could be calculated for 87 percent of total filings compared to the historical average of 82 percent from 1996 to 2013. The lowest value was 60 percent, recorded in 2010.
• Among all filings without an MDL/DDL in 2014, 55 percent were M&A class actions.
FIGURE 9: FILINGS WITH MDL/DDL VALUES 1996–2014
90
154
220
184192
163
203
171
195
156
104
156146
101 105
134127
139148
0%
10%
20%
30%
40%
50%
60%
70%
80%
90%
100%
1996 1997 1998 1999 2000 2001 2002 2003 2004 2005 2006 2007 2008 2009 2010 2011 2012 2013 2014
Filings with MDL/DDL ValuesMDL/DDL Filings as a Percent of Total Filings
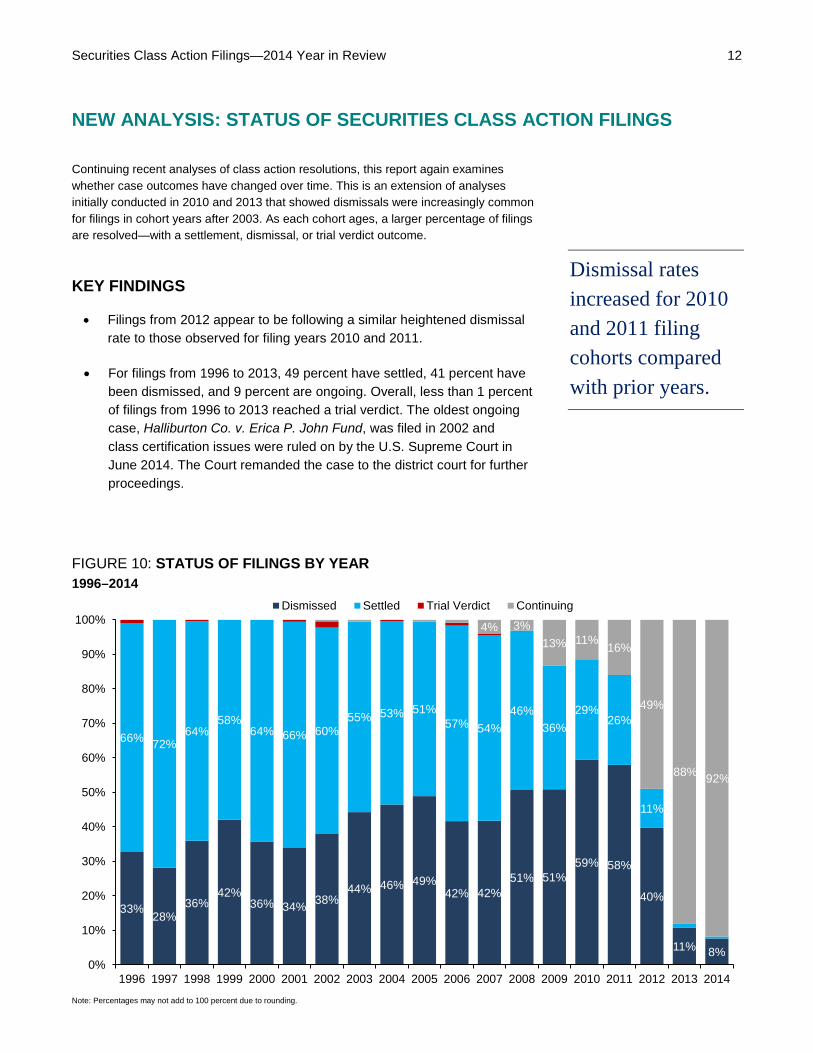
Securities Class Action Filings—2014 Year in Review 12 NEW ANALYSIS: STATUS OF SECURITIES CLASS ACTION FILINGS
Continuing recent analyses of class action resolutions, this report again examines whether case outcomes have changed over time. This is an extension of analyses initially conducted in 2010 and 2013 that showed dismissals were increasingly common for filings in cohort years after 2003. As each cohort ages, a larger percentage of filings are resolved—with a settlement, dismissal, or trial verdict outcome.
Dismissal rates increased for 2010 and 2011 filing cohorts compared with prior years.
KEY FINDINGS
• Filings from 2012 appear to be following a similar heightened dismissal rate to those observed for filing years 2010 and 2011.
• For filings from 1996 to 2013, 49 percent have settled, 41 percent have been dismissed, and 9 percent are ongoing. Overall, less than 1 percent of filings from 1996 to 2013 reached a trial verdict. The oldest ongoing case, Halliburton Co. v. Erica P. John Fund, was filed in 2002 and class certification issues were ruled on by the U.S. Supreme Court in June 2014. The Court remanded the case to the district court for further proceedings.
FIGURE 10: STATUS OF FILINGS BY YEAR 1996–2014
Note: Percentages may not add to 100 percent due to rounding.
33% 28%36%
42%36% 34% 38%
44% 46% 49%42% 42%
51% 51%59% 58%
40%
11% 8%
66% 72%64%
58%64% 66% 60%
55% 53% 51%57% 54%
46%36%
29%26%
11%
4% 3%13% 11% 16%
49%
88% 92%
0%
10%
20%
30%
40%
50%
60%
70%
80%
90%
100%
1996 1997 1998 1999 2000 2001 2002 2003 2004 2005 2006 2007 2008 2009 2010 2011 2012 2013 2014
Dismissed Settled Trial Verdict Continuing
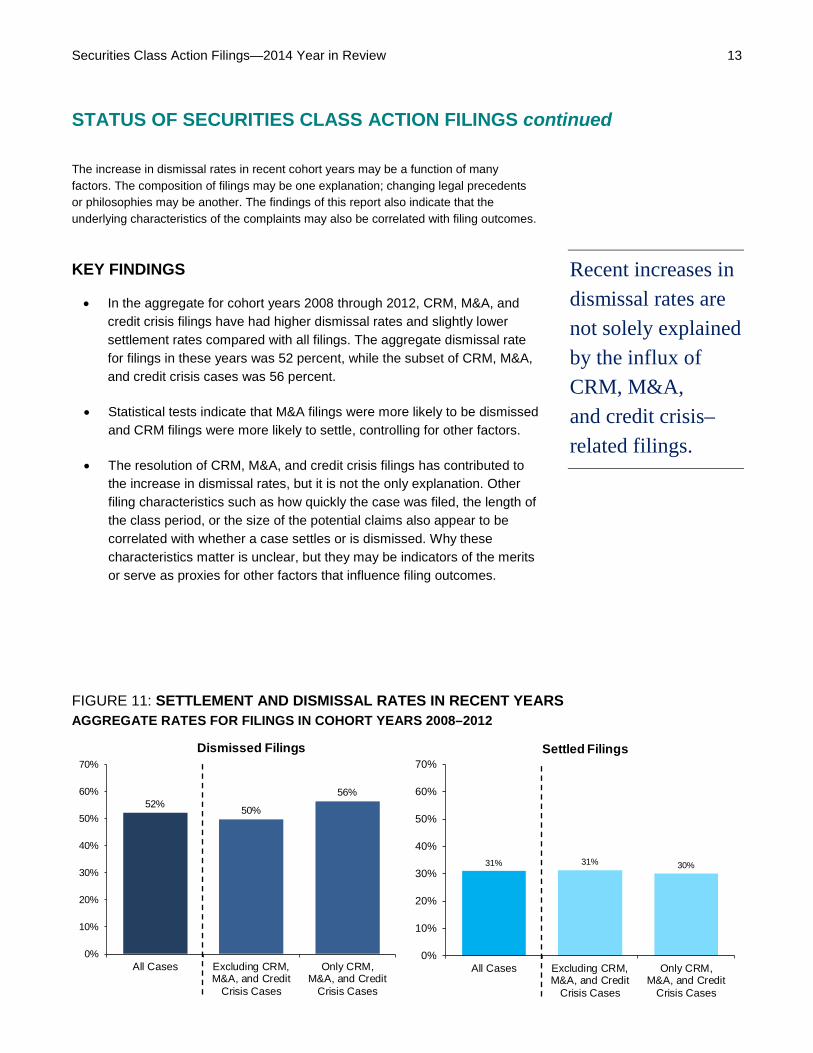
Securities Class Action Filings—2014 Year in Review 13 STATUS OF SECURITIES CLASS ACTION FILINGS continued
The increase in dismissal rates in recent cohort years may be a function of many factors. The composition of filings may be one explanation; changing legal precedents or philosophies may be another. The findings of this report also indicate that the underlying characteristics of the complaints may also be correlated with filing outcomes.
Recent increases in dismissal rates are not solely explained by the influx of CRM, M&A, and credit crisis–related filings.
KEY FINDINGS
• In the aggregate for cohort years 2008 through 2012, CRM, M&A, and credit crisis filings have had higher dismissal rates and slightly lower settlement rates compared with all filings. The aggregate dismissal rate for filings in these years was 52 percent, while the subset of CRM, M&A, and credit crisis cases was 56 percent.
• Statistical tests indicate that M&A filings were more likely to be dismissed and CRM filings were more likely to settle, controlling for other factors.
• The resolution of CRM, M&A, and credit crisis filings has contributed to the increase in dismissal rates, but it is not the only explanation. Other filing characteristics such as how quickly the case was filed, the length of the class period, or the size of the potential claims also appear to be correlated with whether a case settles or is dismissed. Why these characteristics matter is unclear, but they may be indicators of the merits or serve as proxies for other factors that influence filing outcomes.
FIGURE 11: SETTLEMENT AND DISMISSAL RATES IN RECENT YEARS AGGREGATE RATES FOR FILINGS IN COHORT YEARS 2008–2012
31% 31% 30%
0%
10%
20%
30%
40%
50%
60%
70%
All Cases Excluding CRM,M&A, and Credit
Crisis Cases
Only CRM,M&A, and Credit
Crisis Cases
Settled Filings
52% 50%
56%
0%
10%
20%
30%
40%
50%
60%
70%
All Cases Excluding CRM,M&A, and Credit
Crisis Cases
Only CRM,M&A, and Credit
Crisis Cases
Dismissed Filings
Securities Class Action Filings—2014 Year in Review 14 FILING LAG
KEY FINDINGS
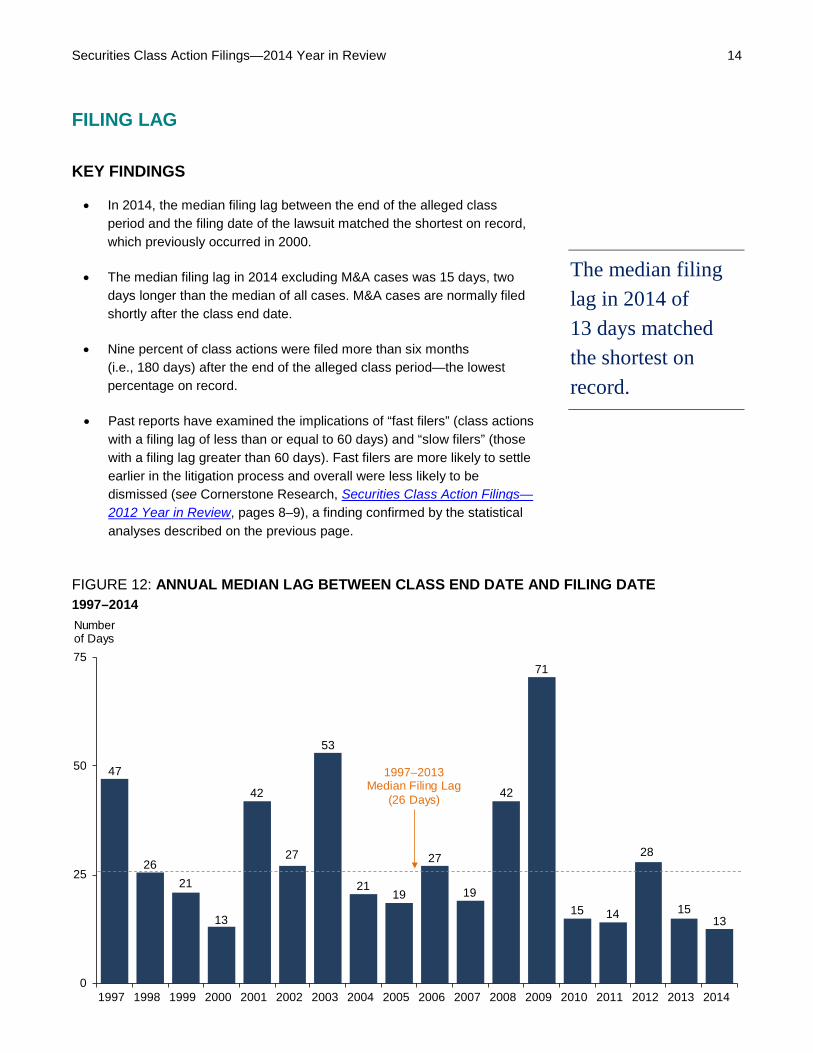
• In 2014, the median filing lag between the end of the alleged class period and the filing date of the lawsuit matched the shortest on record, which previously occurred in 2000.
• The median filing lag in 2014 excluding M&A cases was 15 days, two days longer than the median of all cases. M&A cases are normally filed shortly after the class end date.
• Nine percent of class actions were filed more than six months (i.e., 180 days) after the end of the alleged class period—the lowest percentage on record.
• Past reports have examined the implications of “fast filers” (class actions with a filing lag of less than or equal to 60 days) and “slow filers” (those with a filing lag greater than 60 days). Fast filers are more likely to settle earlier in the litigation process and overall were less likely to be dismissed (see Cornerstone Research, Securities Class Action Filings—2012 Year in Review, pages 8–9), a finding confirmed by the statistical analyses described on the previous page.
The median filing lag in 2014 of 13 days matched the shortest on record.
FIGURE 12: ANNUAL MEDIAN LAG BETWEEN CLASS END DATE AND FILING DATE 1997–2014
47
2621
13
42
27
53
2119
27
19
42
71
15 14
28
1513
0
25
50
75
1997 1998 1999 2000 2001 2002 2003 2004 2005 2006 2007 2008 2009 2010 2011 2012 2013 2014
Number of Days
1997–2013 Median Filing Lag
(26 Days)
Securities Class Action Filings—2014 Year in Review 15 FOREIGN FILINGS
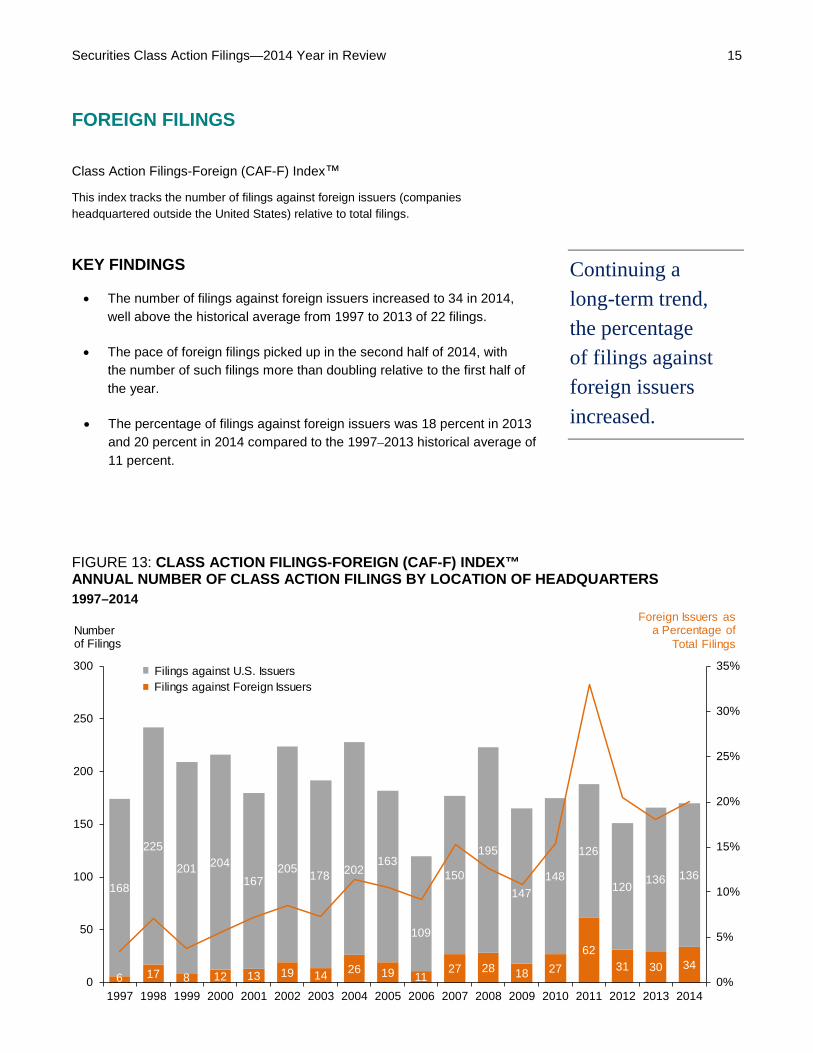
Class Action Filings-Foreign (CAF-F) Index™
This index tracks the number of filings against foreign issuers (companies headquartered outside the United States) relative to total filings.
Continuing a long-term trend, the percentage of filings against foreign issuers increased.
KEY FINDINGS
• The number of filings against foreign issuers increased to 34 in 2014, well above the historical average from 1997 to 2013 of 22 filings.
• The pace of foreign filings picked up in the second half of 2014, with the number of such filings more than doubling relative to the first half of the year.
• The percentage of filings against foreign issuers was 18 percent in 2013 and 20 percent in 2014 compared to the 1997–2013 historical average of 11 percent.
FIGURE 13: CLASS ACTION FILINGS-FOREIGN (CAF-F) INDEX™ ANNUAL NUMBER OF CLASS ACTION FILINGS BY LOCATION OF HEADQUARTERS 1997–2014
6 17 8 12 13 19 14 26 19 11
27 28 18 2762
31 30 34
168
225
201 204167
205 178 202163
109
150
195
147148
126
120 136 136
0%
5%
10%
15%
20%
25%
30%
35%
0
50
100
150
200
250
300
1997 1998 1999 2000 2001 2002 2003 2004 2005 2006 2007 2008 2009 2010 2011 2012 2013 2014
Foreign Issuers as a Percentage of
Total FilingsNumberof Filings
Filings against Foreign IssuersFilings against U.S. Issuers
Securities Class Action Filings—2014 Year in Review 16 FOREIGN FILINGS continued
KEY FINDINGS
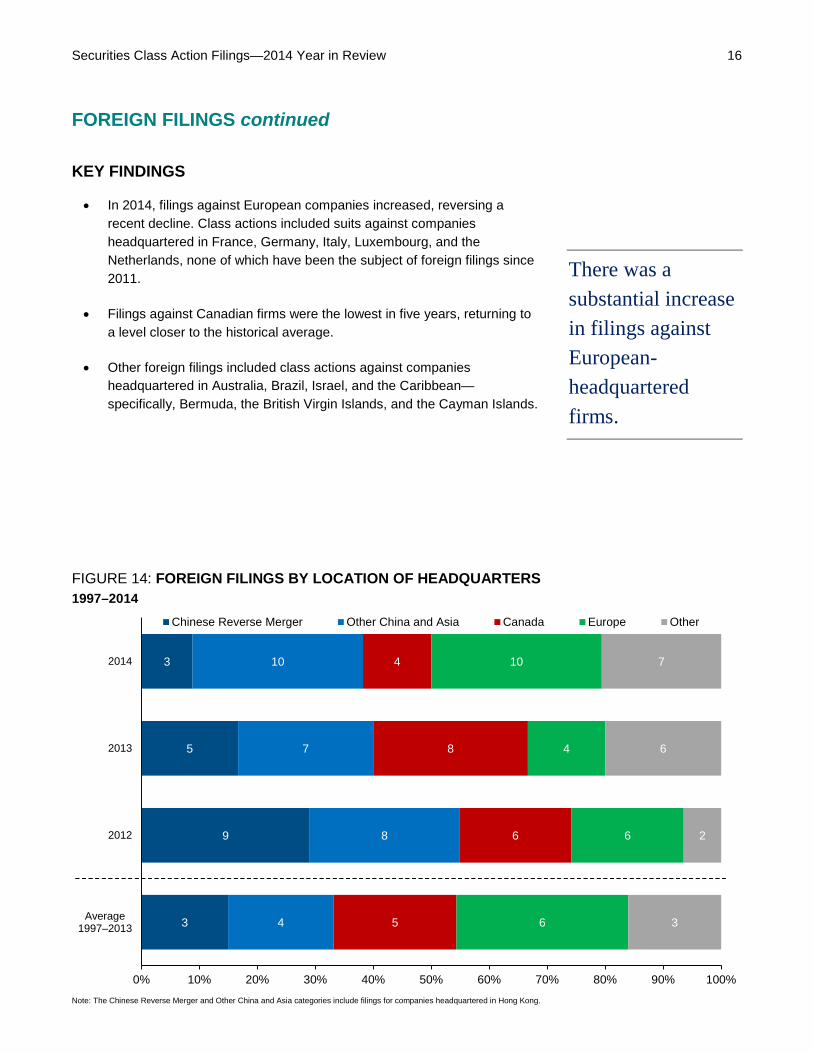
• In 2014, filings against European companies increased, reversing a recent decline. Class actions included suits against companies headquartered in France, Germany, Italy, Luxembourg, and the Netherlands, none of which have been the subject of foreign filings since 2011.
• Filings against Canadian firms were the lowest in five years, returning to a level closer to the historical average.
• Other foreign filings included class actions against companies headquartered in Australia, Brazil, Israel, and the Caribbean—specifically, Bermuda, the British Virgin Islands, and the Cayman Islands.
There was a substantial increase in filings against European-headquartered firms.
FIGURE 14: FOREIGN FILINGS BY LOCATION OF HEADQUARTERS 1997–2014
Note: The Chinese Reverse Merger and Other China and Asia categories include filings for companies headquartered in Hong Kong.
3
9
5
3
4
8
7
10
5
6
8
4
6
6
4
10
3
2
6
7
0% 10% 20% 30% 40% 50% 60% 70% 80% 90% 100%
Average1997–2013
2012
2013
2014
Chinese Reverse Merger Other China and Asia Canada Europe Other
Securities Class Action Filings—2014 Year in Review 17 HEAT MAPS: S&P 500 SECURITIES LITIGATION™
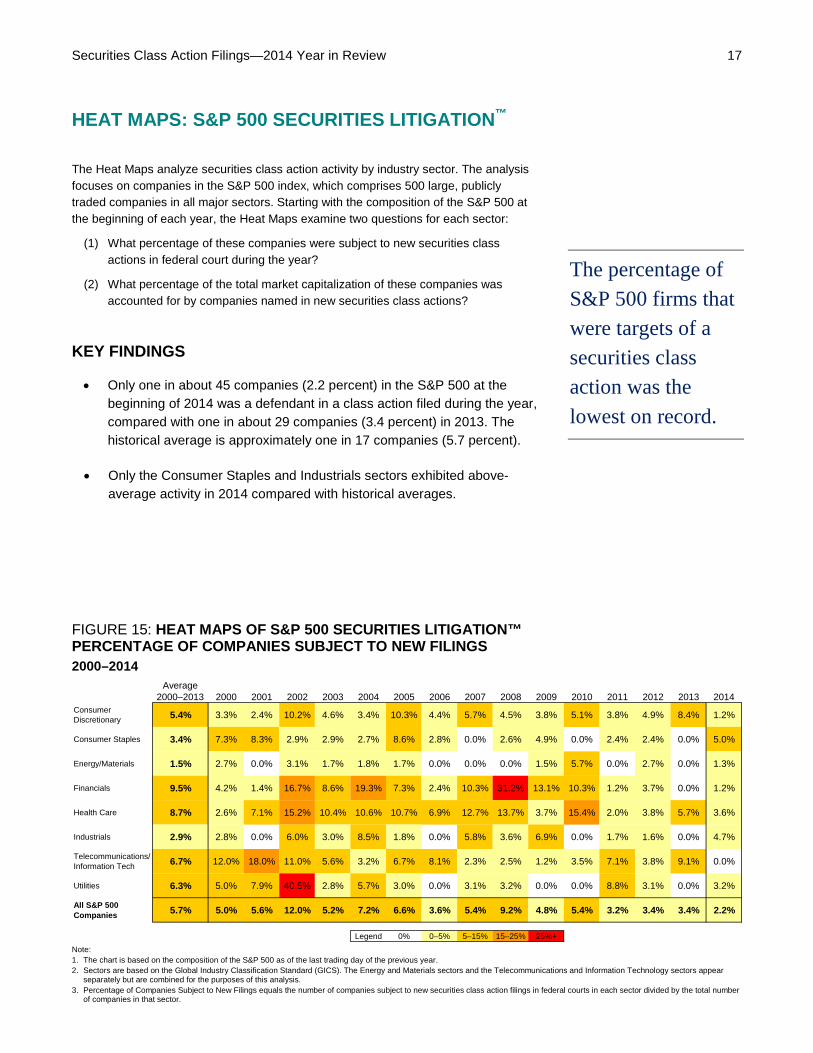
The Heat Maps analyze securities class action activity by industry sector. The analysis focuses on companies in the S&P 500 index, which comprises 500 large, publicly traded companies in all major sectors. Starting with the composition of the S&P 500 at the beginning of each year, the Heat Maps examine two questions for each sector:
(1) What percentage of these companies were subject to new securities class actions in federal court during the year?
(2) What percentage of the total market capitalization of these companies was accounted for by companies named in new securities class actions?
The percentage of S&P 500 firms that were targets of a securities class action was the lowest on record.
KEY FINDINGS
• Only one in about 45 companies (2.2 percent) in the S&P 500 at the beginning of 2014 was a defendant in a class action filed during the year, compared with one in about 29 companies (3.4 percent) in 2013. The historical average is approximately one in 17 companies (5.7 percent).
• Only the Consumer Staples and Industrials sectors exhibited above-average activity in 2014 compared with historical averages.
FIGURE 15: HEAT MAPS OF S&P 500 SECURITIES LITIGATION™ PERCENTAGE OF COMPANIES SUBJECT TO NEW FILINGS 2000–2014
Note: 1. The chart is based on the composition of the S&P 500 as of the last trading day of the previous year. 2. Sectors are based on the Global Industry Classification Standard (GICS). The Energy and Materials sectors and the Telecommunications and Information Technology sectors appear
separately but are combined for the purposes of this analysis. 3. Percentage of Companies Subject to New Filings equals the number of companies subject to new securities class action filings in federal courts in each sector divided by the total number
of companies in that sector.
Average 2000–2013 2000 2001 2002 2003 2004 2005 2006 2007 2008 2009 2010 2011 2012 2013 2014
Consumer Discretionary 5.4% 3.3% 2.4% 10.2% 4.6% 3.4% 10.3% 4.4% 5.7% 4.5% 3.8% 5.1% 3.8% 4.9% 8.4% 1.2%
Consumer Staples 3.4% 7.3% 8.3% 2.9% 2.9% 2.7% 8.6% 2.8% 0.0% 2.6% 4.9% 0.0% 2.4% 2.4% 0.0% 5.0%
Energy/Materials 1.5% 2.7% 0.0% 3.1% 1.7% 1.8% 1.7% 0.0% 0.0% 0.0% 1.5% 5.7% 0.0% 2.7% 0.0% 1.3%
Financials 9.5% 4.2% 1.4% 16.7% 8.6% 19.3% 7.3% 2.4% 10.3% 31.2% 13.1% 10.3% 1.2% 3.7% 0.0% 1.2%
Health Care 8.7% 2.6% 7.1% 15.2% 10.4% 10.6% 10.7% 6.9% 12.7% 13.7% 3.7% 15.4% 2.0% 3.8% 5.7% 3.6%
Industrials 2.9% 2.8% 0.0% 6.0% 3.0% 8.5% 1.8% 0.0% 5.8% 3.6% 6.9% 0.0% 1.7% 1.6% 0.0% 4.7%
Telecommunications/ Information Tech 6.7% 12.0% 18.0% 11.0% 5.6% 3.2% 6.7% 8.1% 2.3% 2.5% 1.2% 3.5% 7.1% 3.8% 9.1% 0.0%
Utilities 6.3% 5.0% 7.9% 40.5% 2.8% 5.7% 3.0% 0.0% 3.1% 3.2% 0.0% 0.0% 8.8% 3.1% 0.0% 3.2%
All S&P 500 Companies 5.7% 5.0% 5.6% 12.0% 5.2% 7.2% 6.6% 3.6% 5.4% 9.2% 4.8% 5.4% 3.2% 3.4% 3.4% 2.2%
Legend 0% 0–5% 5–15% 15–25% 25%+
Securities Class Action Filings—2014 Year in Review 18 HEAT MAPS: S&P 500 SECURITIES LITIGATION continued
KEY FINDINGS
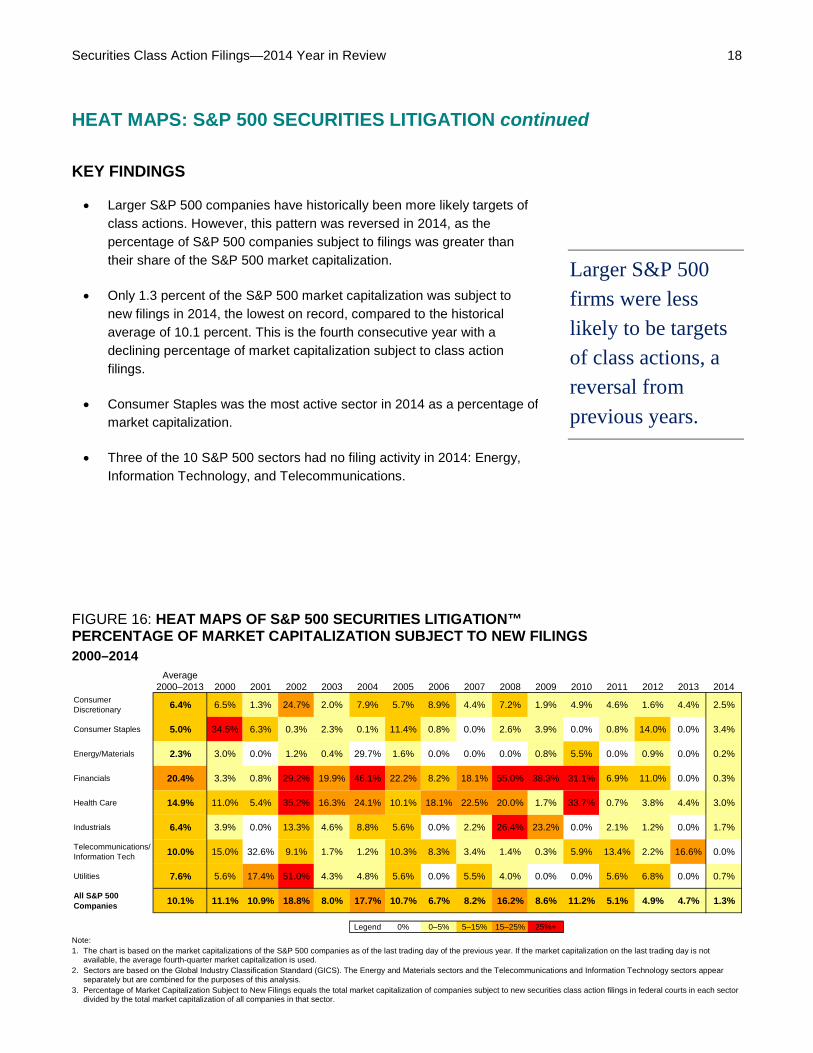
• Larger S&P 500 companies have historically been more likely targets of class actions. However, this pattern was reversed in 2014, as the percentage of S&P 500 companies subject to filings was greater than their share of the S&P 500 market capitalization.
• Only 1.3 percent of the S&P 500 market capitalization was subject to new filings in 2014, the lowest on record, compared to the historical average of 10.1 percent. This is the fourth consecutive year with a declining percentage of market capitalization subject to class action filings.
• Consumer Staples was the most active sector in 2014 as a percentage of market capitalization.
• Three of the 10 S&P 500 sectors had no filing activity in 2014: Energy, Information Technology, and Telecommunications.
Larger S&P 500 firms were less likely to be targets of class actions, a reversal from previous years.
FIGURE 16: HEAT MAPS OF S&P 500 SECURITIES LITIGATION™ PERCENTAGE OF MARKET CAPITALIZATION SUBJECT TO NEW FILINGS 2000–2014
Note: 1. The chart is based on the market capitalizations of the S&P 500 companies as of the last trading day of the previous year. If the market capitalization on the last trading day is not
available, the average fourth-quarter market capitalization is used. 2. Sectors are based on the Global Industry Classification Standard (GICS). The Energy and Materials sectors and the Telecommunications and Information Technology sectors appear
separately but are combined for the purposes of this analysis. 3. Percentage of Market Capitalization Subject to New Filings equals the total market capitalization of companies subject to new securities class action filings in federal courts in each sector
divided by the total market capitalization of all companies in that sector.
Average 2000–2013 2000 2001 2002 2003 2004 2005 2006 2007 2008 2009 2010 2011 2012 2013 2014
Consumer Discretionary 6.4% 6.5% 1.3% 24.7% 2.0% 7.9% 5.7% 8.9% 4.4% 7.2% 1.9% 4.9% 4.6% 1.6% 4.4% 2.5%
Consumer Staples 5.0% 34.5% 6.3% 0.3% 2.3% 0.1% 11.4% 0.8% 0.0% 2.6% 3.9% 0.0% 0.8% 14.0% 0.0% 3.4%
Energy/Materials 2.3% 3.0% 0.0% 1.2% 0.4% 29.7% 1.6% 0.0% 0.0% 0.0% 0.8% 5.5% 0.0% 0.9% 0.0% 0.2%
Financials 20.4% 3.3% 0.8% 29.2% 19.9% 46.1% 22.2% 8.2% 18.1% 55.0% 38.3% 31.1% 6.9% 11.0% 0.0% 0.3%
Health Care 14.9% 11.0% 5.4% 35.2% 16.3% 24.1% 10.1% 18.1% 22.5% 20.0% 1.7% 33.7% 0.7% 3.8% 4.4% 3.0%
Industrials 6.4% 3.9% 0.0% 13.3% 4.6% 8.8% 5.6% 0.0% 2.2% 26.4% 23.2% 0.0% 2.1% 1.2% 0.0% 1.7%
Telecommunications/ Information Tech 10.0% 15.0% 32.6% 9.1% 1.7% 1.2% 10.3% 8.3% 3.4% 1.4% 0.3% 5.9% 13.4% 2.2% 16.6% 0.0%
Utilities 7.6% 5.6% 17.4% 51.0% 4.3% 4.8% 5.6% 0.0% 5.5% 4.0% 0.0% 0.0% 5.6% 6.8% 0.0% 0.7%
All S&P 500 Companies 10.1% 11.1% 10.9% 18.8% 8.0% 17.7% 10.7% 6.7% 8.2% 16.2% 8.6% 11.2% 5.1% 4.9% 4.7% 1.3%
Legend 0% 0–5% 5–15% 15–25% 25%+
Securities Class Action Filings—2014 Year in Review 19 MEGA FILINGS
Mega DDL and MDL Filings
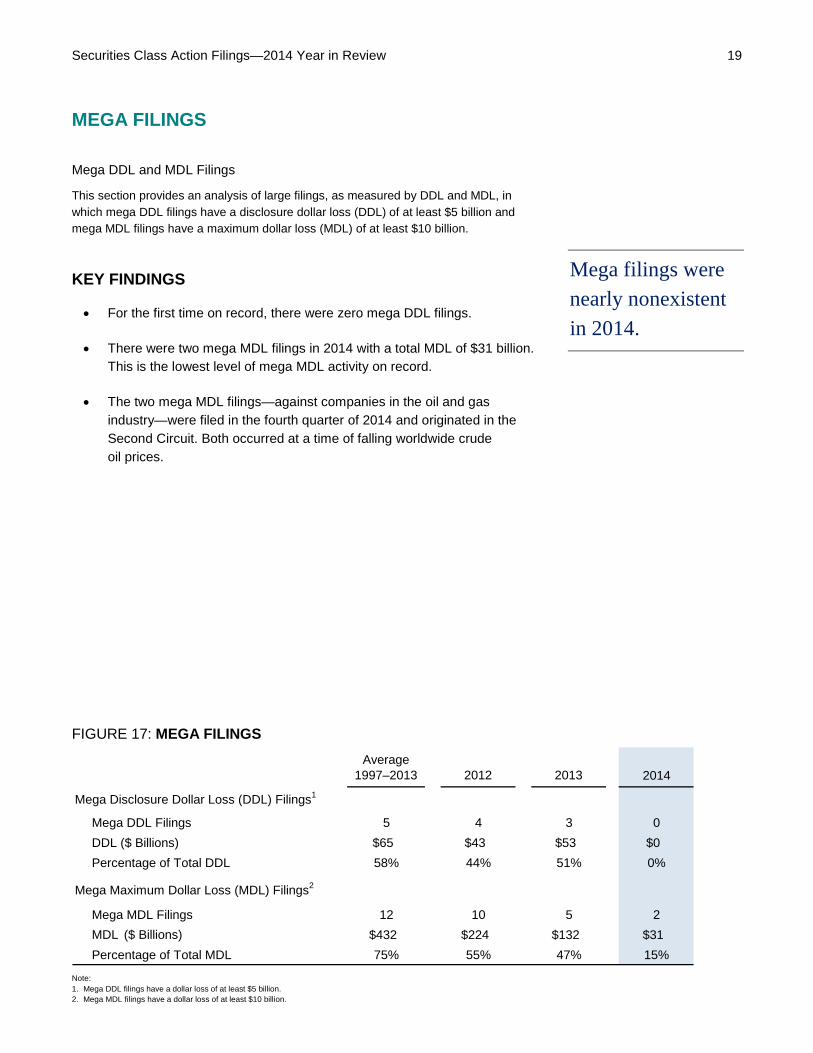
This section provides an analysis of large filings, as measured by DDL and MDL, in which mega DDL filings have a disclosure dollar loss (DDL) of at least $5 billion and mega MDL filings have a maximum dollar loss (MDL) of at least $10 billion.
Mega filings were nearly nonexistent in 2014.
KEY FINDINGS
• For the first time on record, there were zero mega DDL filings.
• There were two mega MDL filings in 2014 with a total MDL of $31 billion. This is the lowest level of mega MDL activity on record.
• The two mega MDL filings—against companies in the oil and gas industry—were filed in the fourth quarter of 2014 and originated in the Second Circuit. Both occurred at a time of falling worldwide crude oil prices.
FIGURE 17: MEGA FILINGS
Note: 1. Mega DDL filings have a dollar loss of at least $5 billion. 2. Mega MDL filings have a dollar loss of at least $10 billion.
Average1997–2013 2012 2013 2014
Mega Disclosure Dollar Loss (DDL) Filings1
Mega DDL Filings 5 4 3 0DDL ($ Billions) $65 $43 $53 $0Percentage of Total DDL 58% 44% 51% 0%
Mega Maximum Dollar Loss (MDL) Filings2
Mega MDL Filings 12 10 5 2MDL ($ Billions) $432 $224 $132 $31Percentage of Total MDL 75% 55% 47% 15%
Securities Class Action Filings—2014 Year in Review 20 NEW ANALYSIS: DISTRIBUTION OF MDL VALUES
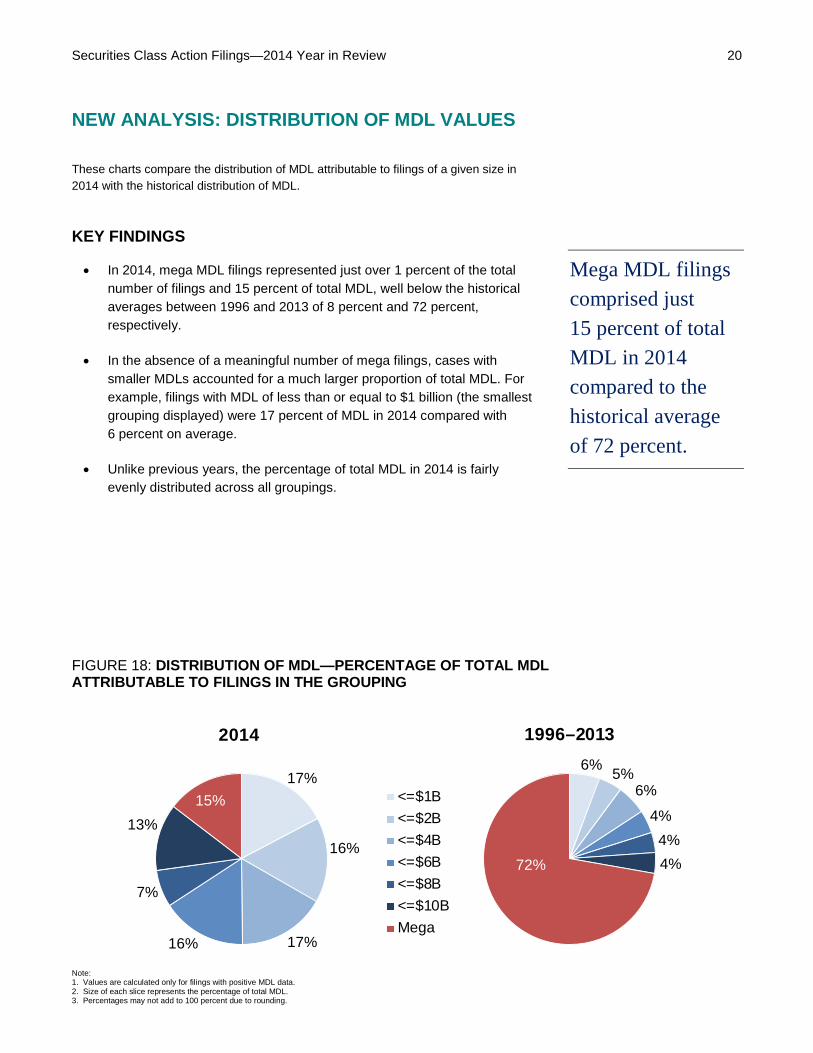
These charts compare the distribution of MDL attributable to filings of a given size in 2014 with the historical distribution of MDL.
Mega MDL filings comprised just 15 percent of total MDL in 2014 compared to the historical average of 72 percent.
KEY FINDINGS
• In 2014, mega MDL filings represented just over 1 percent of the total number of filings and 15 percent of total MDL, well below the historical averages between 1996 and 2013 of 8 percent and 72 percent, respectively.
• In the absence of a meaningful number of mega filings, cases with smaller MDLs accounted for a much larger proportion of total MDL. For example, filings with MDL of less than or equal to $1 billion (the smallest grouping displayed) were 17 percent of MDL in 2014 compared with 6 percent on average.
• Unlike previous years, the percentage of total MDL in 2014 is fairly evenly distributed across all groupings.
FIGURE 18: DISTRIBUTION OF MDL—PERCENTAGE OF TOTAL MDL ATTRIBUTABLE TO FILINGS IN THE GROUPING
Note: 1. Values are calculated only for filings with positive MDL data. 2. Size of each slice represents the percentage of total MDL. 3. Percentages may not add to 100 percent due to rounding.
6% 5%6%
4%4%4%72%
1996–2013
17%
16%
17%16%
7%
13%15%
2014
<=$1B<=$2B<=$4B<=$6B<=$8B<=$10BMega
Securities Class Action Filings—2014 Year in Review 21 NEW ANALYSIS: DISTRIBUTION OF DDL VALUES
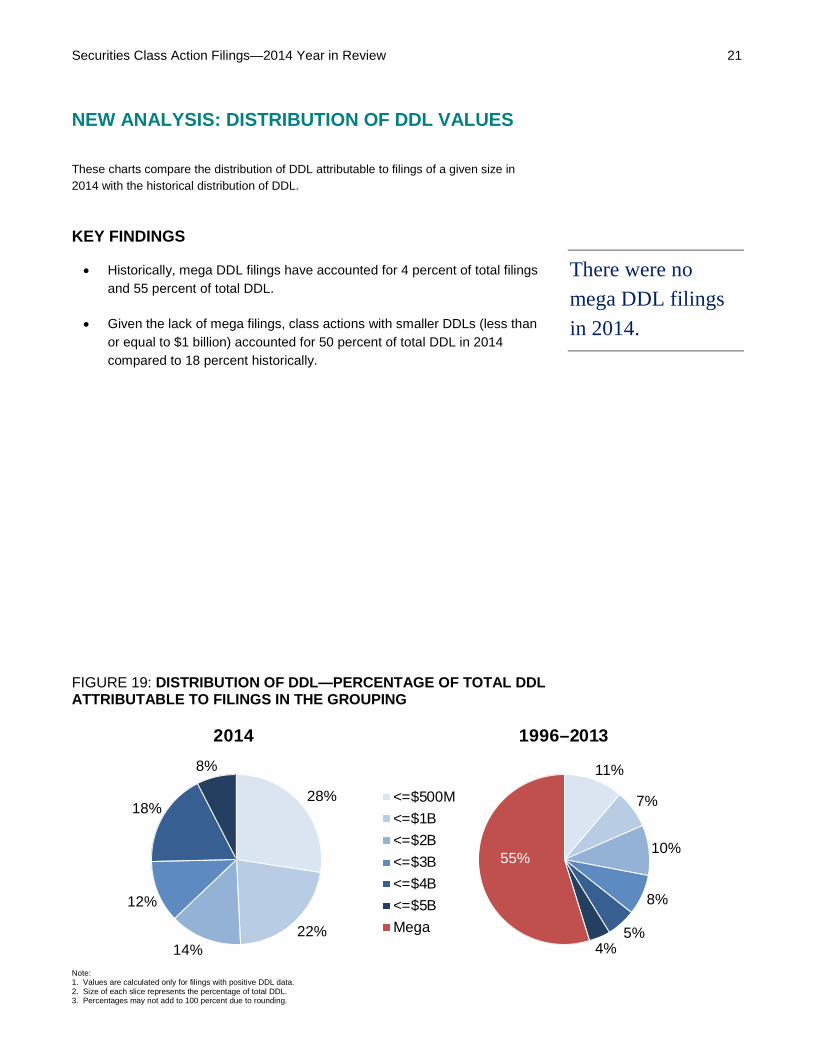
These charts compare the distribution of DDL attributable to filings of a given size in 2014 with the historical distribution of DDL.
There were no mega DDL filings in 2014.
KEY FINDINGS
• Historically, mega DDL filings have accounted for 4 percent of total filings and 55 percent of total DDL.
• Given the lack of mega filings, class actions with smaller DDLs (less than or equal to $1 billion) accounted for 50 percent of total DDL in 2014 compared to 18 percent historically.
FIGURE 19: DISTRIBUTION OF DDL—PERCENTAGE OF TOTAL DDL ATTRIBUTABLE TO FILINGS IN THE GROUPING
Note: 1. Values are calculated only for filings with positive DDL data. 2. Size of each slice represents the percentage of total DDL. 3. Percentages may not add to 100 percent due to rounding.
11%
7%
10%
8%
5%4%
55%
1996–2013
28%
22%14%
12%
18%
8%
2014
<=$500M<=$1B<=$2B<=$3B<=$4B<=$5BMega
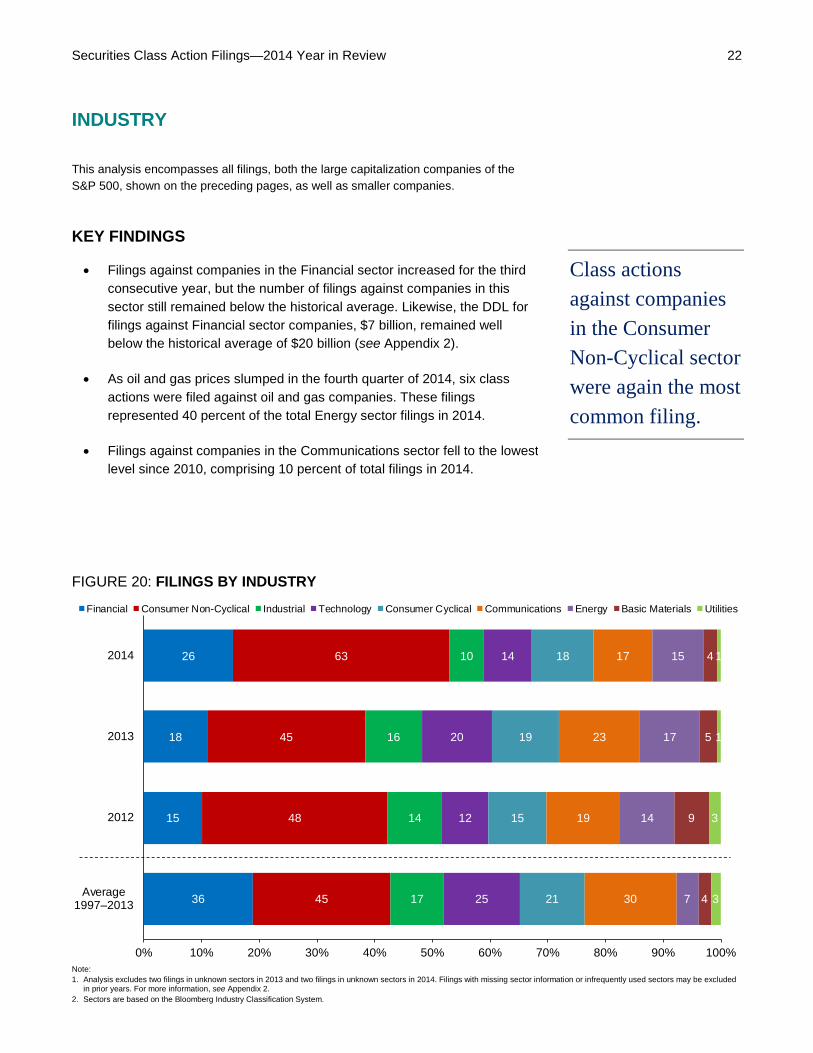
Securities Class Action Filings—2014 Year in Review 22 INDUSTRY
This analysis encompasses all filings, both the large capitalization companies of the S&P 500, shown on the preceding pages, as well as smaller companies.
Class actions against companies in the Consumer Non-Cyclical sector were again the most common filing.
KEY FINDINGS
• Filings against companies in the Financial sector increased for the third consecutive year, but the number of filings against companies in this sector still remained below the historical average. Likewise, the DDL for filings against Financial sector companies, $7 billion, remained well below the historical average of $20 billion (see Appendix 2).
• As oil and gas prices slumped in the fourth quarter of 2014, six class actions were filed against oil and gas companies. These filings represented 40 percent of the total Energy sector filings in 2014.
• Filings against companies in the Communications sector fell to the lowest level since 2010, comprising 10 percent of total filings in 2014.
FIGURE 20: FILINGS BY INDUSTRY
Note: 1. Analysis excludes two filings in unknown sectors in 2013 and two filings in unknown sectors in 2014. Filings with missing sector information or infrequently used sectors may be excluded
in prior years. For more information, see Appendix 2. 2. Sectors are based on the Bloomberg Industry Classification System.
36
15
18
26
45
48
45
63
17
14
16
10
25
12
20
14
21
15
19
18
30
19
23
17
7
14
17
15
4
9
5
4
3
3
1
1
0% 10% 20% 30% 40% 50% 60% 70% 80% 90% 100%
Average1997–2013
2012
2013
2014
Financial Consumer Non-Cyclical Industrial Technology Consumer Cyclical Communications Energy Basic Materials Utilities
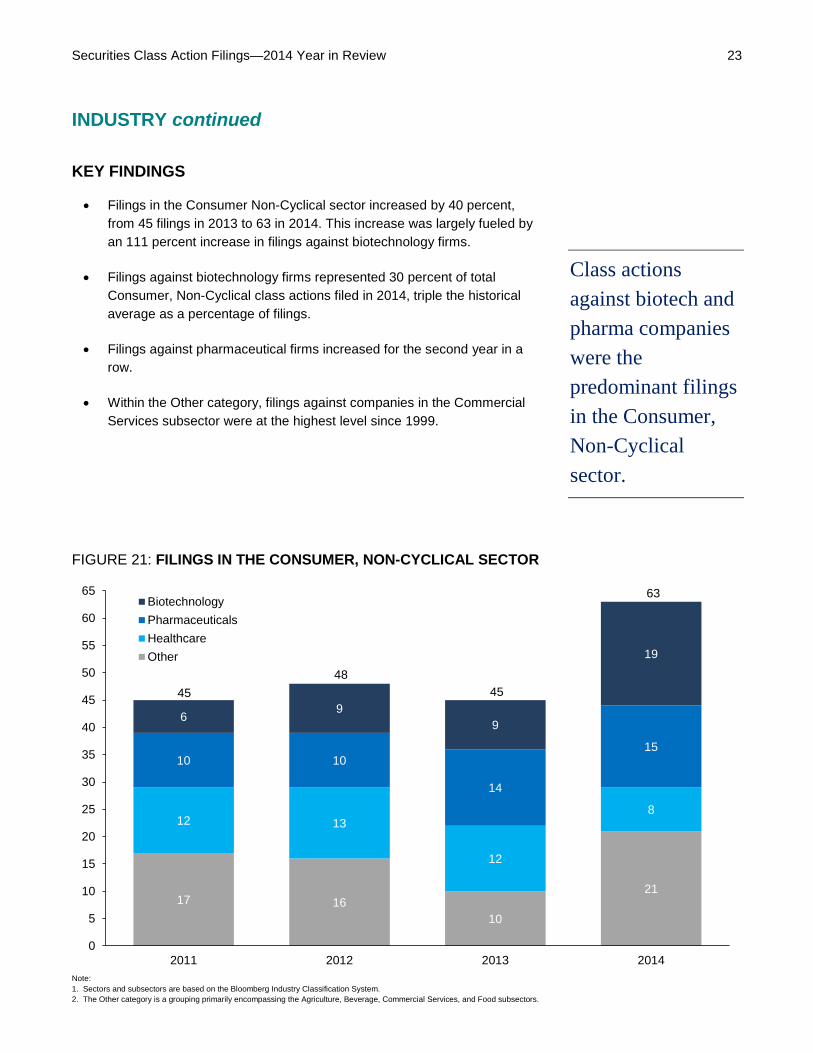
Securities Class Action Filings—2014 Year in Review 23 INDUSTRY continued
KEY FINDINGS
• Filings in the Consumer Non-Cyclical sector increased by 40 percent, from 45 filings in 2013 to 63 in 2014. This increase was largely fueled by an 111 percent increase in filings against biotechnology firms.
• Filings against biotechnology firms represented 30 percent of total Consumer, Non-Cyclical class actions filed in 2014, triple the historical average as a percentage of filings.
• Filings against pharmaceutical firms increased for the second year in a row.
• Within the Other category, filings against companies in the Commercial Services subsector were at the highest level since 1999.
Class actions against biotech and pharma companies were the predominant filings in the Consumer, Non-Cyclical sector.
FIGURE 21: FILINGS IN THE CONSUMER, NON-CYCLICAL SECTOR
Note: 1. Sectors and subsectors are based on the Bloomberg Industry Classification System. 2. The Other category is a grouping primarily encompassing the Agriculture, Beverage, Commercial Services, and Food subsectors.
17 1610
21
12 13
12
8
10 10
14
15
69
9
19
0
5
10
15
20
25
30
35
40
45
50
55
60
65
2011 2012 2013 2014
BiotechnologyPharmaceuticalsHealthcareOther
4548
45
63
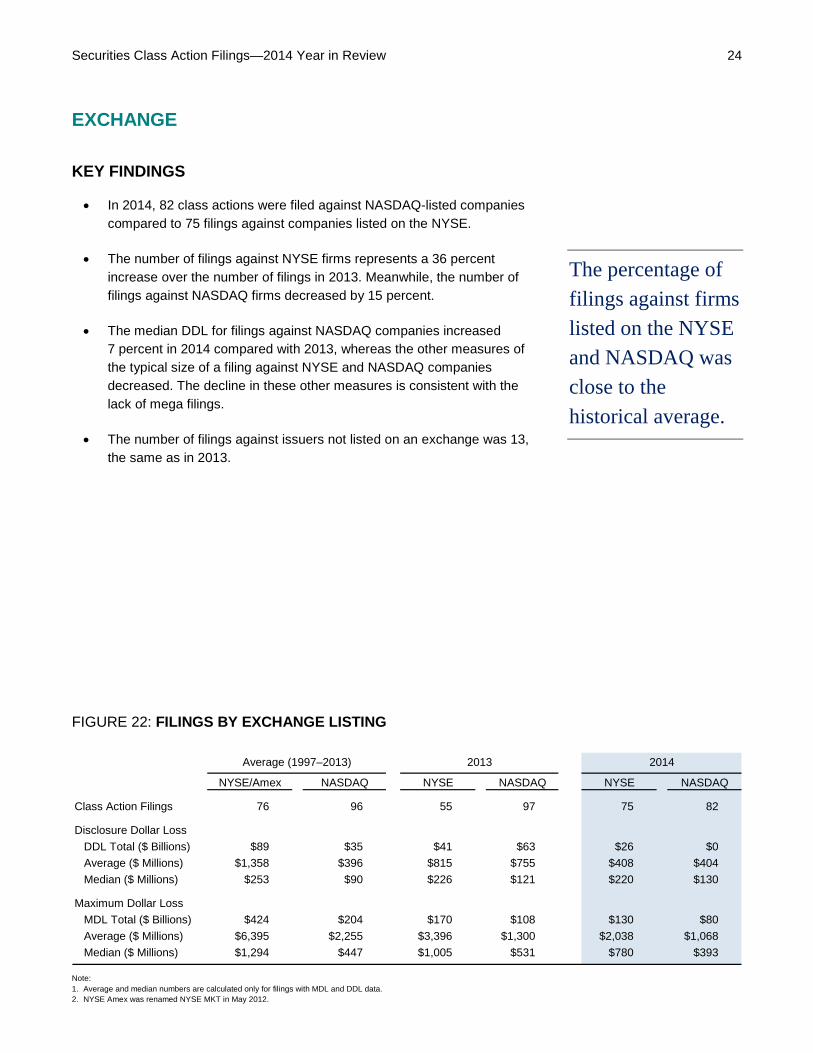
Securities Class Action Filings—2014 Year in Review 24 EXCHANGE
KEY FINDINGS
• In 2014, 82 class actions were filed against NASDAQ-listed companies compared to 75 filings against companies listed on the NYSE.
• The number of filings against NYSE firms represents a 36 percent increase over the number of filings in 2013. Meanwhile, the number of filings against NASDAQ firms decreased by 15 percent.
• The median DDL for filings against NASDAQ companies increased 7 percent in 2014 compared with 2013, whereas the other measures of the typical size of a filing against NYSE and NASDAQ companies decreased. The decline in these other measures is consistent with the lack of mega filings.
• The number of filings against issuers not listed on an exchange was 13, the same as in 2013.
The percentage of filings against firms listed on the NYSE and NASDAQ was close to the historical average.
FIGURE 22: FILINGS BY EXCHANGE LISTING
Note: 1. Average and median numbers are calculated only for filings with MDL and DDL data. 2. NYSE Amex was renamed NYSE MKT in May 2012.
Average (1997–2013) 2013 2014
NYSE/Amex NASDAQ NYSE NASDAQ NYSE NASDAQ
Class Action Filings 76 96 55 97 75 82
Disclosure Dollar Loss DDL Total ($ Billions) $89 $35 $41 $63 $26 $0Average ($ Millions) $1,358 $396 $815 $755 $408 $404Median ($ Millions) $253 $90 $226 $121 $220 $130
Maximum Dollar LossMDL Total ($ Billions) $424 $204 $170 $108 $130 $80Average ($ Millions) $6,395 $2,255 $3,396 $1,300 $2,038 $1,068Median ($ Millions) $1,294 $447 $1,005 $531 $780 $393
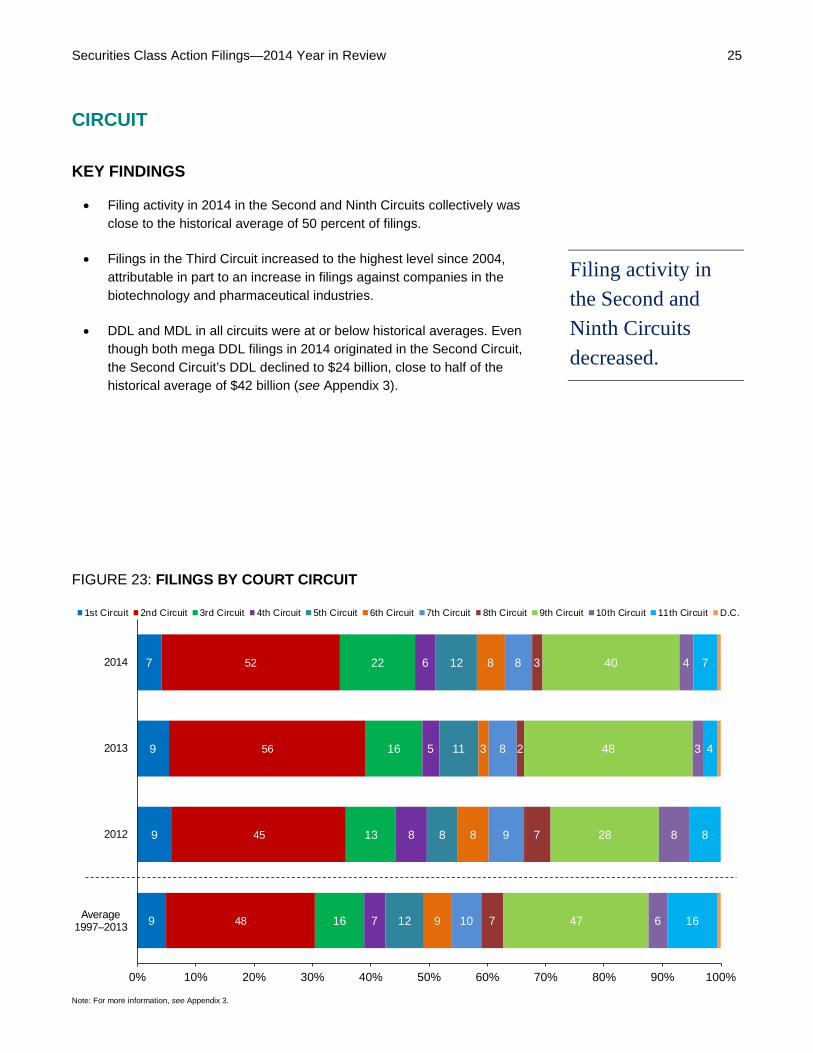
Securities Class Action Filings—2014 Year in Review 25 CIRCUIT
KEY FINDINGS
• Filing activity in 2014 in the Second and Ninth Circuits collectively was close to the historical average of 50 percent of filings.
• Filings in the Third Circuit increased to the highest level since 2004, attributable in part to an increase in filings against companies in the biotechnology and pharmaceutical industries.
• DDL and MDL in all circuits were at or below historical averages. Even though both mega DDL filings in 2014 originated in the Second Circuit, the Second Circuit’s DDL declined to $24 billion, close to half of the historical average of $42 billion (see Appendix 3).
Filing activity in the Second and Ninth Circuits decreased.
FIGURE 23: FILINGS BY COURT CIRCUIT
Note: For more information, see Appendix 3.
9
9
9
7
48
45
56
52
16
13
16
22
7
8
5
6
12
8
11
12
9
8
3
8
10
9
8
8
7
7
2
3
47
28
48
40
6
8
3
4
16
8
4
7
0% 10% 20% 30% 40% 50% 60% 70% 80% 90% 100%
Average1997–2013
2012
2013
2014
1st Circuit 2nd Circuit 3rd Circuit 4th Circuit 5th Circuit 6th Circuit 7th Circuit 8th Circuit 9th Circuit 10th Circuit 11th Circuit D.C.
Securities Class Action Filings—2014 Year in Review 26 NEW DEVELOPMENTS
HALLIBURTON CO. V. ERICA P. JOHN FUND
In a highly anticipated ruling, on June 23, 2014, the U.S. Supreme Court issued its opinion in Halliburton Co. v. Erica P. John Fund (Halliburton II). At issue in this appeal by Halliburton was the fraud-on-the-market presumption established in Basic Inc. v. Levinson (1988).
For a typical Rule 10b-5 securities class action with allegations of misrepresentations, Basic established that plaintiffs did not need to demonstrate that individual class members relied on any allegedly misleading statements if the market in which the security at issue traded can be shown to be “efficient”—that is, the market price reflected all publicly available information. In those circumstances, any material misrepresentations were deemed to be reflected in the price of the security.
Petitioners asked the Court to overrule or substantially modify Basic. They further asked whether defendants may rebut the presumption of reliance, when invoked by plaintiffs, by introducing evidence that the alleged misrepresentations did not distort the market price of the security at issue.
In Halliburton II, the Court declined to overturn Basic. It did find, however, that defendants could rebut the presumption prior to class certification by showing direct evidence “that the alleged misrepresentations did not actually affect the stock price—that is, that it had no ‘price impact.’” It is too early to tell the long-term impact of the Supreme Court’s ruling. Clarification regarding the standard of proof of no price impact that courts may require of defendants is but one area of future uncertainty.
Securities Class Action Filings—2014 Year in Review 27 GLOSSARY
Chinese reverse merger (CRM) filing is a securities class action against a China-headquartered company listed on a U.S. exchange as a result of a reverse merger with a public shell company. See Cornerstone Research, Investigations and Litigation Related to Chinese Reverse Merger Companies.
Class Action Filings (CAF) Index™ tracks the number of federal securities class action filings.
Class Action Filings-Foreign (CAF-F) Index™ tracks the number of filings against foreign issuers (companies headquartered outside the United States) relative to total filings.
Disclosure Dollar Loss (DDL) Index™ measures the aggregate DDL for all filings over a period of time. DDL is the dollar value change in the defendant firm’s market capitalization between the trading day immediately preceding the end of the class period and the trading day immediately following the end of the class period. DDL should not be considered an indicator of liability or measure of potential damages. Instead, it estimates the impact of all information revealed during or at the end of the class period, including information unrelated to the litigation.
Filing lag is the time between the end of a class period and the filing of a securities class action.
Heat Maps of S&P 500 Securities Litigation™ analyze securities class action activity by industry sector. The analysis focuses on companies in the Standard & Poor’s 500 (S&P 500) index, which comprises 500 large, publicly traded companies in all major sectors. Starting with the composition of the S&P 500 at the beginning of each year, the Heat Maps examine two questions for each sector: (1) What percentage of these companies were subject to new securities class actions in federal court during the year? (2) What percentage of the total market capitalization of these companies was accounted for by companies named in new securities class actions?
Market capitalization losses measure changes to market values of the companies subject to class action filings. Market capitalization losses are tracked for defendant firms during and at the end of class periods. They are calculated for publicly traded common equity securities, closed-ended mutual funds, and exchange-traded funds where data are available. Declines in market capitalization may be driven by market, industry, and/or firm-specific factors. To the extent that the observed losses reflect factors unrelated to the allegations in class action complaints, indices based on class period losses would not be representative of potential defendant exposure in class actions. This is especially relevant in the post-Dura securities litigation environment. In April 2005, the U.S. Supreme Court ruled that plaintiffs in a securities class action are required to plead a causal connection between alleged wrongdoing and subsequent shareholder losses. This report tracks market capitalization losses at the end of each class period using DDL, and market capitalization losses during each class period using MDL.
Maximum Dollar Loss (MDL) Index™ measures the aggregate MDL for all filings over a period of time. MDL is the dollar value change in the defendant firm’s market capitalization from the trading day with the highest market capitalization during the class period to the trading day immediately following the end of the class period. MDL should not be considered an indicator of liability or measure of potential damages. Instead, it estimates the impact of all information revealed during or at the end of the class period, including information unrelated to the litigation.
Securities Class Action Filings—2014 Year in Review 28 GLOSSARY continued
Mega filings include mega DDL filings, securities class action filings with a DDL of at least $5 billion; and mega MDL filings, securities class action filings with an MDL of at least $10 billion.
Merger and acquisition (M&A) filing is a securities class action that has Section 14 claims, but no Rule 10b-5, Section 11, or Section 12(2) claims, and involves a merger and acquisition transaction.
Securities Class Action Clearinghouse is an authoritative source of data and analysis on the financial and economic characteristics of federal securities fraud class action litigation, cosponsored by Cornerstone Research and Stanford Law School.
Securities Class Action Filings—2014 Year in Review 29 APPENDICES
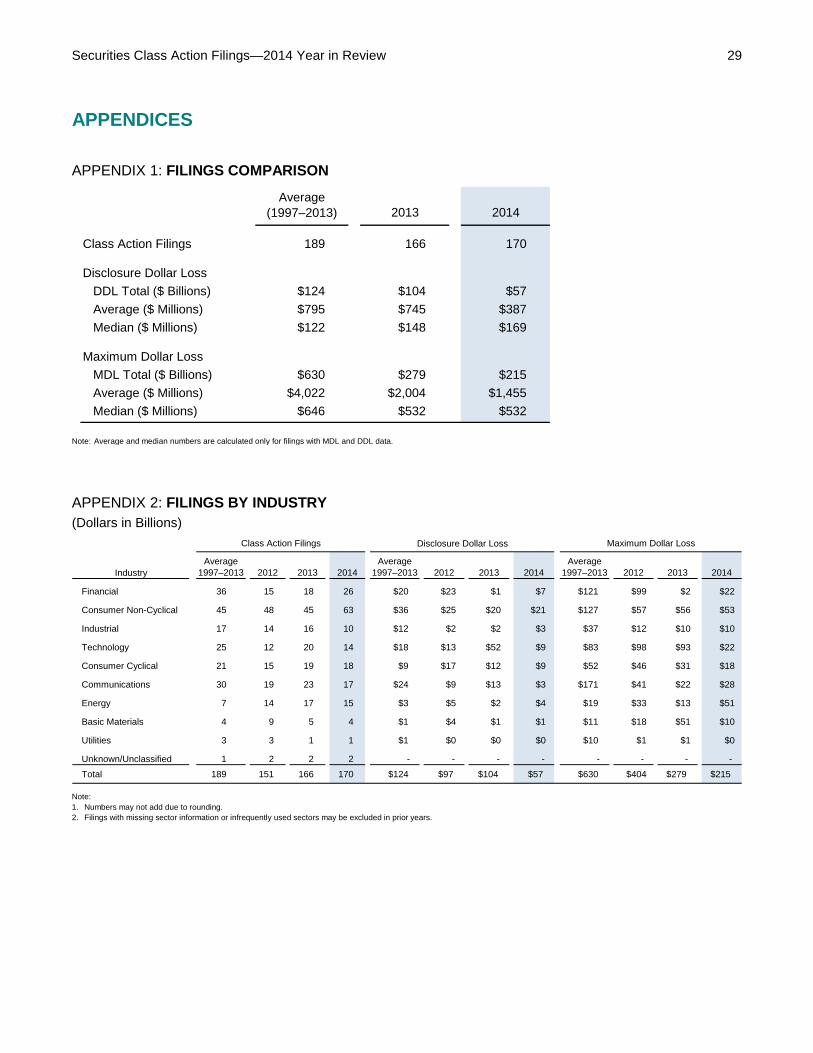
APPENDIX 1: FILINGS COMPARISON
Note: Average and median numbers are calculated only for filings with MDL and DDL data.
APPENDIX 2: FILINGS BY INDUSTRY (Dollars in Billions)
Note: 1. Numbers may not add due to rounding. 2. Filings with missing sector information or infrequently used sectors may be excluded in prior years.
2013 2014
Class Action Filings 189 166 170
Disclosure Dollar LossDDL Total ($ Billions) $124 $104 $57Average ($ Millions) $795 $745 $387Median ($ Millions) $122 $148 $169
Maximum Dollar LossMDL Total ($ Billions) $630 $279 $215Average ($ Millions) $4,022 $2,004 $1,455Median ($ Millions) $646 $532 $532
Average(1997–2013)
Class Action Filings Disclosure Dollar Loss Maximum Dollar Loss
IndustryAverage
1997–2013 2012 2013 2014Average
1997–2013 2012 2013 2014Average
1997–2013 2012 2013 2014
Financial 36 15 18 26 $20 $23 $1 $7 $121 $99 $2 $22
Consumer Non-Cyclical 45 48 45 63 $36 $25 $20 $21 $127 $57 $56 $53
Industrial 17 14 16 10 $12 $2 $2 $3 $37 $12 $10 $10
Technology 25 12 20 14 $18 $13 $52 $9 $83 $98 $93 $22
Consumer Cyclical 21 15 19 18 $9 $17 $12 $9 $52 $46 $31 $18
Communications 30 19 23 17 $24 $9 $13 $3 $171 $41 $22 $28
Energy 7 14 17 15 $3 $5 $2 $4 $19 $33 $13 $51
Basic Materials 4 9 5 4 $1 $4 $1 $1 $11 $18 $51 $10
Utilities 3 3 1 1 $1 $0 $0 $0 $10 $1 $1 $0
Unknown/Unclassified 1 2 2 2 - - - - - - - -Total 189 151 166 170 $124 $97 $104 $57 $630 $404 $279 $215
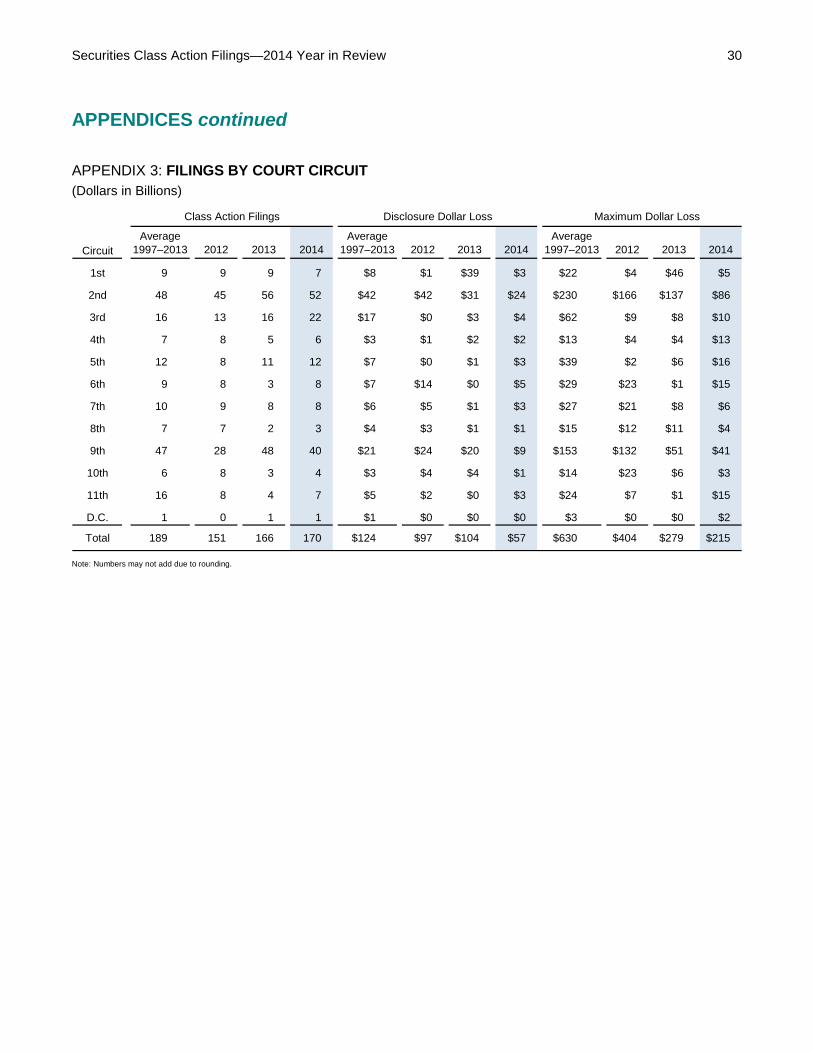
Securities Class Action Filings—2014 Year in Review 30 APPENDICES continued
APPENDIX 3: FILINGS BY COURT CIRCUIT (Dollars in Billions)
Note: Numbers may not add due to rounding.
Class Action Filings Disclosure Dollar Loss Maximum Dollar Loss
CircuitAverage
1997–2013 2012 2013 2014Average
1997–2013 2012 2013 2014Average
1997–2013 2012 2013 2014
1st 9 9 9 7 $8 $1 $39 $3 $22 $4 $46 $5
2nd 48 45 56 52 $42 $42 $31 $24 $230 $166 $137 $86
3rd 16 13 16 22 $17 $0 $3 $4 $62 $9 $8 $10
4th 7 8 5 6 $3 $1 $2 $2 $13 $4 $4 $13
5th 12 8 11 12 $7 $0 $1 $3 $39 $2 $6 $16
6th 9 8 3 8 $7 $14 $0 $5 $29 $23 $1 $15
7th 10 9 8 8 $6 $5 $1 $3 $27 $21 $8 $6
8th 7 7 2 3 $4 $3 $1 $1 $15 $12 $11 $4
9th 47 28 48 40 $21 $24 $20 $9 $153 $132 $51 $41
10th 6 8 3 4 $3 $4 $4 $1 $14 $23 $6 $3
11th 16 8 4 7 $5 $2 $0 $3 $24 $7 $1 $15
D.C. 1 0 1 1 $1 $0 $0 $0 $3 $0 $0 $2
Total 189 151 166 170 $124 $97 $104 $57 $630 $404 $279 $215
Securities Class Action Filings—2014 Year in Review 31 RESEARCH SAMPLE
• The Stanford Law School Securities Class Action Clearinghouse, in collaboration with Cornerstone Research, has identified 3,895 federal securities class action filings between January 1, 1996, and December 31, 2014 (securities.stanford.edu).
• The sample used in this report is referred to as the “classic filings” sample and excludes IPO allocation, analyst, and mutual fund filings (313, 68, and 25 filings, respectively).
• Multiple filings related to the same allegations against the same defendant(s) are consolidated in the database through a unique record indexed to the first identified complaint.
Boston617.927.3000
Chicago312.345.7300
London+44.20.3655.0900
Los Angeles213.553.2500
Menlo Park650.853.1660
New York212.605.5000
San Francisco415.229.8100
Washington202.912.8900
www.cornerstone.com
The authors request that you reference Cornerstone Research and the Stanford Law School Securities Class Action Clearinghouse in any reprint of the information or figures included in this study.
Please direct any questions to:
Alexander Aganin 650.853.1660 [email protected]
© 2015 by Cornerstone Research. All rights reserved. Cornerstone Research is a registered service mark of Cornerstone Research, Inc. C and design is a registered trademark of Cornerstone Research, Inc.