Embed Size (px)
Citation preview

August 10, 2018
Securities Code:7157 TSE Mothers
Reference Datafor
First QuarterFiscal 2018

Contents
1. Results for 1Q of Fiscal 2018 2. Future Initiatives
1

Key Highlight of 1Q for Fiscal 2018
2
Achieved significant business results• Annualized premium of new business up 67%
year on yearOrdinary income up 11% year on yearOrdinary loss 90 million yen, further investment to continue
Changed into new management team for further business growth
Revision of business forecast for FY2018

2017/1Q 2018/1Q Year on year
Ordinary income 2,651 2,954 111.4%Operating expenses 1,005 1,380 137.3%Ordinary profit (loss) 136 (90) -
Net income (loss) 109 (95) -
Mortality margin 616 681 110.5%Annualized premium1 of policies-in-force 10,263 11,529 112.3%Number of policies-in-force 243,610 272,830 112.0%
Annualized premium1 of new business 343 572 166.7%Number of new business 7,793 13,285 170.5%
3
(JPY mn)
1. The amount of money equivalent to what is to be paid to have the insurance coverage for one year. All payments are monthly installments, thus the annualized premium is calculated as multiplying the monthly premium by 12 months.
Summary of 1Q for FY2018 Results

Increased strongly by investment in marketing expenses and channel development
417/1Q 17/4Q 18/1Q17/2Q 17/3Q
Annualized Premium/Number of New Business (Quarterly)
:Number of new business:Annualized premium of new business (JPY mn)
13,285
7,793 8,649
10,555
12,178
343387
460
523572
Y-on-Y 70% increase
Y-on-Y 67% increase

(YY/MM) 5
: Number of policies-in-force
: Annualized premium of policies-in-force (JPY bn)
17/06 18/03 18/0617/09 17/12
272,830
Annualized Premium/Number of Policies-in-force (Quarterly)
243,610 248,635
255,614 263,847
10.2 10.410.7
11.1
1 2 3 4 5
11.5
Policies-in-force exceeded 270,000 and steadily increased

17/1Q 18/1Q(Reference) Surrender and lapse ratio3 6.5% 6.3%
Breakdown of Policies-in-force
6
(YY/MM) 17/06 18/06 Component ratio
Number of policies-in-force 243,610 272,830 100%- Term Life1 124,325 135,060 50%- Whole-Life Medical1 72,092 78,298 29%- Term Medical Care1 10,299 9,824 4%- Long-term Disability1 36,894 44,280 16%- Cancer1 - 5,368 2%
Sum insured of policies-in-force2
(JPY mn)1,981,955 2,106,247
Number of policyholders 155,817 175,337
175,337 in-force policyholders (as of June 30)
1. Term Life insurance: Kazoku and au Term Insurance, Whole-life Medical insurance: Jibun, New Jibun, New Jibun for Women, au Medical Insurance and au Medical Insurance for Women, Term Medical Care insurance: Jibun Plus, Long-term Disability insurance: Hataraku-Hito, Hataraku-Hito 2 and au Long-term Disability Insurance, Cancer insurance: Double Yell and au Cancer insurance.
2. Sum insured of polices-in-force are the sum of death coverage, and do not include third-sector insurance. 3. The surrender and lapse ratio is the annual equivalent of the monthly number of policies surrendered and/or lapsed divided by the monthly average number of policies-in-force.
7
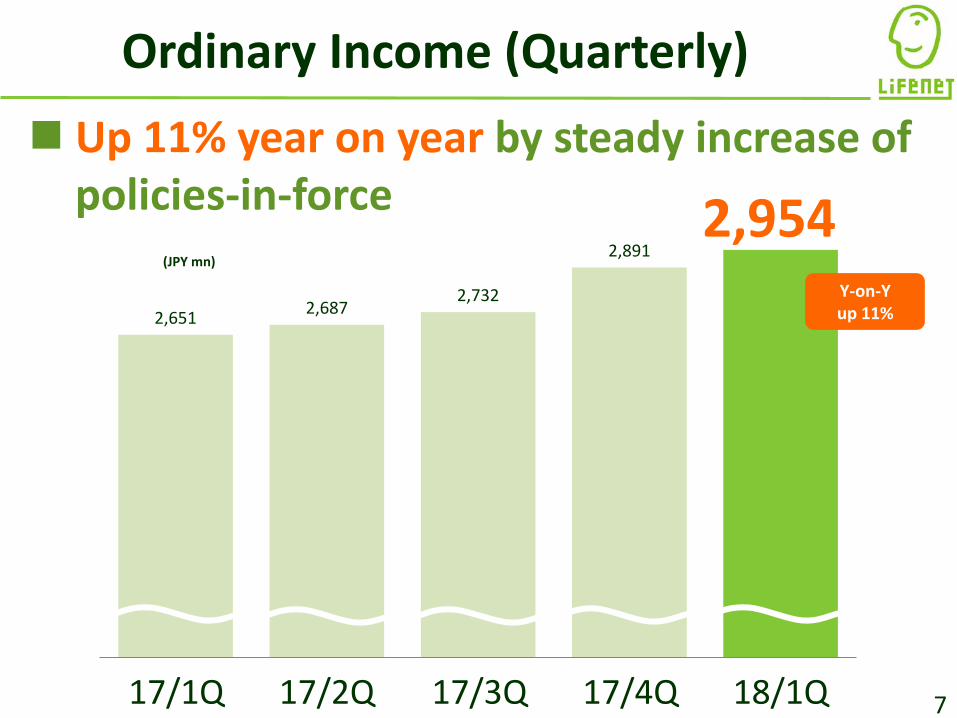
Ordinary Income (Quarterly)
(JPY mn)
2,954 Up 11% year on year by steady increase of
policies-in-force
2,651 2,687 2,732
2,891
1 2 3 4 5
17/1Q 17/2Q 17/3Q 17/4Q 18/1Q
Y-on-Y up 11%

Increased due to growth of policies-in-force
8
Insurance claims
Benefit claims
: Amount of insurance payments (JPY mn): Amount of insurance payments / Premiums income (%)
Insurance Claims and Benefits (Quarterly)
134 153 145 149 159
260 273
228 217
334
15.7% 16.7%14.2% 13.6%
2017 1Q 2017 2Q 2017 3Q 2017 4Q 2018 1Q17/1Q 17/2Q 17/3Q 17/4Q 18/1QInsurance claims 20 15 20 20 22Benefit claims 1,445 1,594 1,565 1,561 1,606Total 1,465 1,609 1,585 1,581 1,628
493
17.7%
366373
426394

879 907 903
876
34.9% 35.4% 34.3%32.4%
1 2 3 4 5
Provision for Policy Reserves (Quarterly)
9
899
32.2%
17/1Q 17/4Q 18/1Q17/2Q 17/3Q
Transferred from 5-year Zillmer's method tostandard policy reserves1
Limited impactfor 1Q
:Provision for policy reserves (JPY mn):Provision for policy reserves/Premiums income (%)
1. Transferred to standard policy reserves of new business including renewal insurance contracts from fiscal 2018

Continued aggressive investment in marketing expenses since new product launch
Operating Expenses (Quarterly)
10
1,380
Marketing
System and other
Customer service
17/1Q 17/4Q 18/1Q17/2Q 17/3Q
(JPY mn) LaunchedAug 2017
413 438 380 395 453
166 160 182 177
188
425
690 626
885 739
1,458
1,1881,289
1,005

54
79
59
72
1.2
1.7
1.3
1.6
Kept same level year on year despite increase in marketing expenses
11
: Marketing expenses per new business (JPY thousand): Marketing expenses / Annualized premium of new business
55
1.2
17/1Q 17/4Q 18/1Q17/2Q 17/3Q
Marketing Expenses per New Business (Quarterly)

Ordinary Profit/Loss (Quarterly)
12
(JPY mn) 17/1Q 17/2Q 17/3Q 17/4Q 18/1QOrdinary profit (loss) 136 (135) (12) (186) (90)Net income (loss) 109 (124) (27) (206) (95)
(JPY mn)Ordinary profit (loss)
Decreased by aggressive investment in marketing expenses
136
(135)
(12)
(186)(90)

13
Structure Breakdown of Ordinary Profit/Loss
17/1Q 18/1Q
136
(JPY mn)
Decreased due to increase of in operating expenses by marketing investment
Transition of ordinary profit (loss)Increase
of insurancepremiums and other
294Other
8 Increase of operating expenses
(374)Other
(35)
(90)
Increase of insurance
claims and other
(133)
Decrease of provision
for policy reservesand other
12
Income Expense

17/1Q 18/1Q ChangeInsurance premiums and other 2,588 2,882 294Other 63 71 8
Ordinary income 2,651 2,954 302
Insurance claims and other 467 600 133Provision for policy reserves and other 912 899 (12)
Operating expenses 1,005 1,380 374Other 128 163 35
Ordinary expenses 2,514 3,045 530
Ordinary profit (loss) 136 (90) (227)
Extraordinary losses and income taxes 27 4 (23)Net income (loss) 109 (95) (204)
14
(JPY mn)
Condensed Statements of Operation (Quarterly)

616661 662 682
15
Fundamental Profit
681
(JPY mn) 17/1Q 17/2Q 17/3Q 17/4Q 18/1QMortality margin 616 661 662 682 681Expense margin (loss) (454) (778) (642) (877) (754)Interest margin (loss) (2) 7 (2) 6 (5)
Fundamental profit (loss) 159 (109) 17 (188) (77)
Mortality margin(JPY mn)
Mortality margin recorded steadily

(JPY mn) (YY/MM) 17/03 18/03 18/06
Total assets 31,934 35,541 36,435Cash and deposits 1,004 926 977Monetary claims bought 1,999 1,999 1,499
Money held in trust 995 2,567 2,641Securities 26,372 28,303 29,498
Government bonds 9,876 8,398 8,402Municipal bonds 1,496 1,505 1,506Corporate bonds 11,751 13,892 14,997Stocks1 334 346 432Foreign securities2 819 - -Other securities3 2,095 4,161 4,158
Total liabilities 18,288 22,153 23,044Policy reserves and other 17,501 21,186 22,082
Total net assets 13,645 13,387 13,391
Solvency margin ratio 2,723% 2,455% 2,402%
16
Financial Condition
Promote diversificationin investment assets
Modified duration 12.3 years
1. Holds shares of Advance Create Co., Ltd. and others for the purpose of business partnership etc. in online sales
2. Investment in Kyobo Lifeplanet Life Insurance Company in Korea, sold in March 2018
3. Investment trust including foreign bonds and others
17
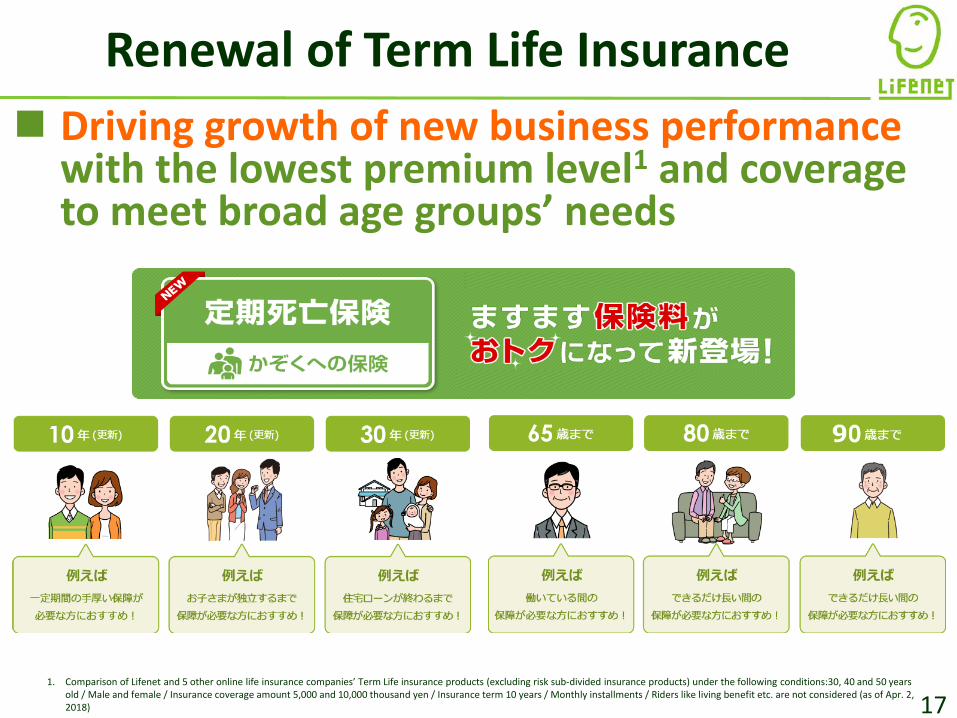
Renewal of Term Life Insurance
1. Comparison of Lifenet and 5 other online life insurance companies’ Term Life insurance products (excluding risk sub-divided insurance products) under the following conditions:30, 40 and 50 years old / Male and female / Insurance coverage amount 5,000 and 10,000 thousand yen / Insurance term 10 years / Monthly installments / Riders like living benefit etc. are not considered (as of Apr. 2, 2018)
Driving growth of new business performance with the lowest premium level1 and coverage to meet broad age groups’ needs

18
Expanding of au Life Insurance
April 2018 RENEWAL
April 2018 NEW!
Steady growth with au Cancer Insurance newly launched

Evaluation for Products
19
Product lineup highly evaluated
1. The most popular insurance products in each category from January through December 2017, receiving the highest number of applications of Kakaku.com Insurance, the sales agent company of insurance products2. The Most Chosen Insurance Ranking 2018 of HOKEN ICHIBA is based on compiled date from the number of brochure request and application from January through December 2017.3. Lifenet Cancer Insurance Double Yell received the Grand Prize in the cancer insurance product category in the Nikkei TRENDY magazine published by Nikkei Business Publications, Inc. in May 2018

20https://www.lifenet-seimei.co.jp/survivorship/ (Japanese only)
Introduces necessary services by partnering companies based on cancer survivors’ voice
Enhanced Survivorship Support Services
New!New!
New!
Remotesecond opinion services
Appearance care
Housekeeping services
Commuting to hospital/work
21
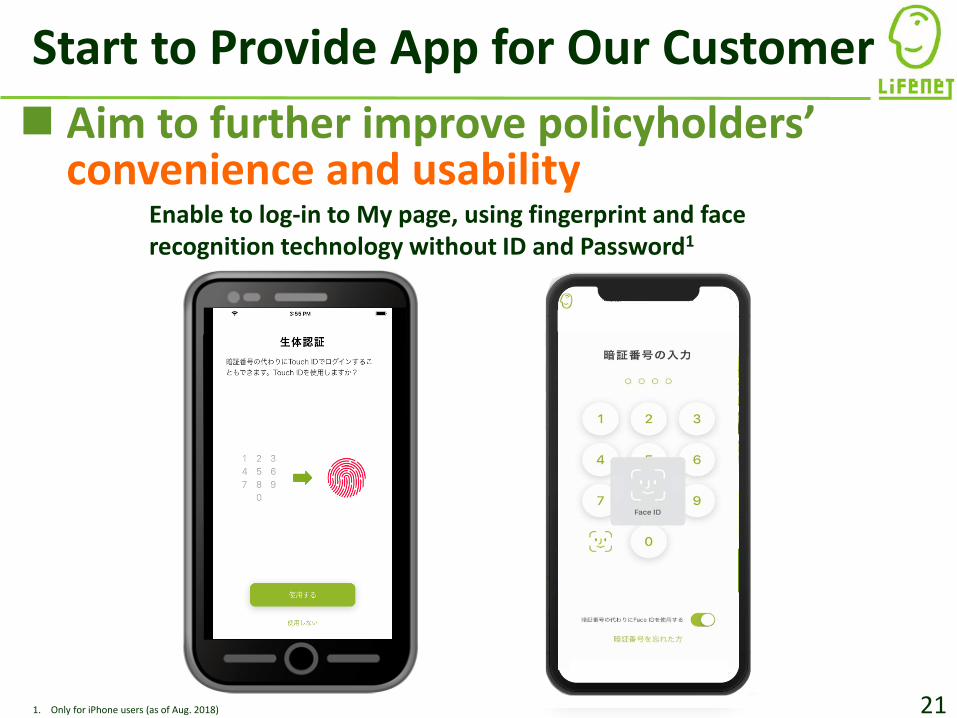
Start to Provide App for Our Customer
1. Only for iPhone users (as of Aug. 2018)
Enable to log-in to My page, using fingerprint and face recognition technology without ID and Password1
Aim to further improve policyholders’ convenience and usability

Contents
1. Results for 1Q of Fiscal 2018 2. Future Initiatives
22

23
Number of policies-in-force
09/03 18/03
Exceeded 100,000
Exceeded200,000
Continuing our challenge with customer-oriented approach
10th Anniversary of Business Commencement

24
Striving for significant business growth under new leadership
Masanori SakasaiExecutive Managing
Director
Changed into New Management Team
Masayuki NishidaExecutive Vice President,
Director
Eiko Shinotsuka Outside Director
Masanobu Takatani Outside Director
Yutaka Mizukoshi Outside Director
Tomohiko KatsukiOutside Director
Hitoshi HattaExecutive Managing
Director
Daisuke IwaseChairman, Director
Ryosuke Mori President, Representative Director
Yasuhiro KobaDirector

25
Direction of New Management
Focusing on further expanding business scale by accelerating investment for growth
Transform to Internet company of life insurance from online insurer
Consistent principle; “Comprehensible, Cost-Competitive, Convenient”

26
Focusing on Expanding Scale of Our Business
Aggressive investment in marketing expenses for improving profitability in the mid-to-long term
Cycle of expanding business
scale
Profitability improvement in the mid-to-
long term
Further investment
in marketing expenses
Lower ratio of operating
expenses1Insurance premiums increase
Growth of new business performance
Enhanced profit base
1. The ratio of operating expenses (excluding marketing expenses) to premiums income
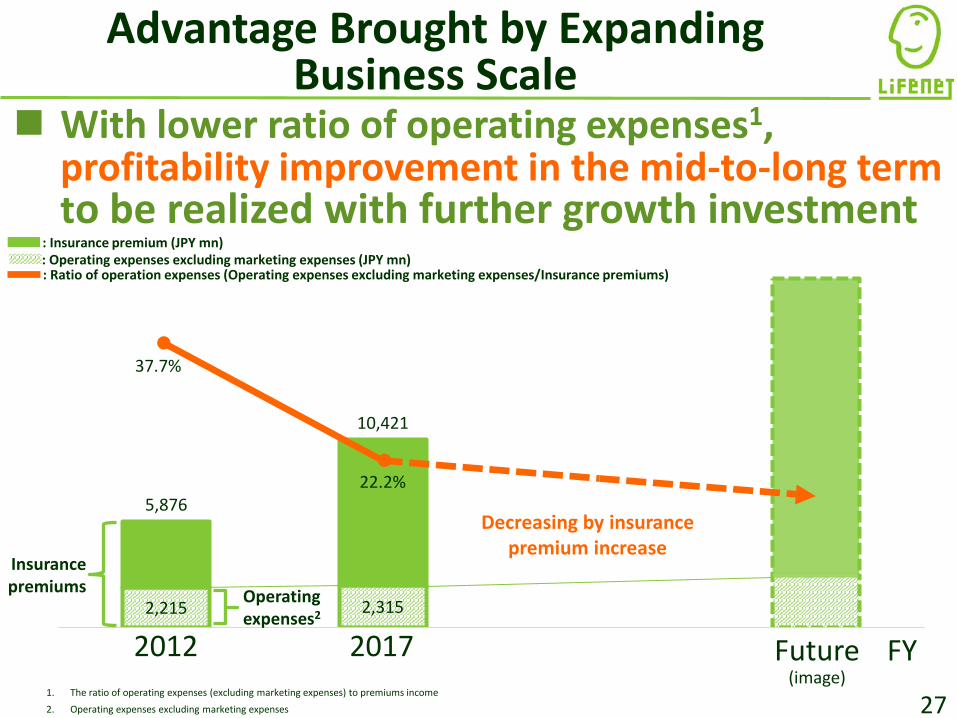
2,215 2,315
5,876
10,421
37.7%
22.2%
Advantage Brought by Expanding Business Scale
27
2012 2017 Future(image)
Insurancepremiums
: Operating expenses excluding marketing expenses (JPY mn): Ratio of operation expenses (Operating expenses excluding marketing expenses/Insurance premiums)
: Insurance premium (JPY mn)
Operating expenses2
FY
Decreasing by insurance premium increase
1. The ratio of operating expenses (excluding marketing expenses) to premiums income2. Operating expenses excluding marketing expenses
With lower ratio of operating expenses1,profitability improvement in the mid-to-long term to be realized with further growth investment

5,756 5,647
6,864 6,883 7,307
6,312 6,980
9,142
7,793
8,649
10,555
12,178
13,285
279 269 312
441
339 323
428
731
425
690 626
885
739
15/1Q 2Q 3Q 4Q 16/1Q 2Q 3Q 4Q 17/1Q 2Q 3Q 4Q 18/1Q28
Started to invest aggressively in marketing
expenses in Aug. 2017
: Number of new business: Marketing expenses (JPY mn)
Steadily contributed to growth of new business performance
Investment Effect of Marketing Expenses

Business Forecast FY2018
29
【Revised】
Business forecast
for FY2018
【Original】
Business forecast
for FY2018
(Reference)
Results for FY2017
Ordinary income 12,300 12,000 10,962Ordinary profit
(loss) (800) 0 (197)Net income
(loss) (600) 0 (249)
Accelerate investment in marketing expenses to expand scale of our business
(JPY mn)

30
Online directsales
AgentKDDI
Online direct sales→ Promote sales by aggressive
investment in marketing expenses→ Improve website continuously to
optimize smartphone site
KDDI (agent) → Enhance sales of new Cancer
Insurance product→ Trial sales at shops in progress
Agent→ Expanding scale of agents/shops→ Enhance sales of Long-term
Disability product
Enhancement of Three Channels Aim for further business growth
31
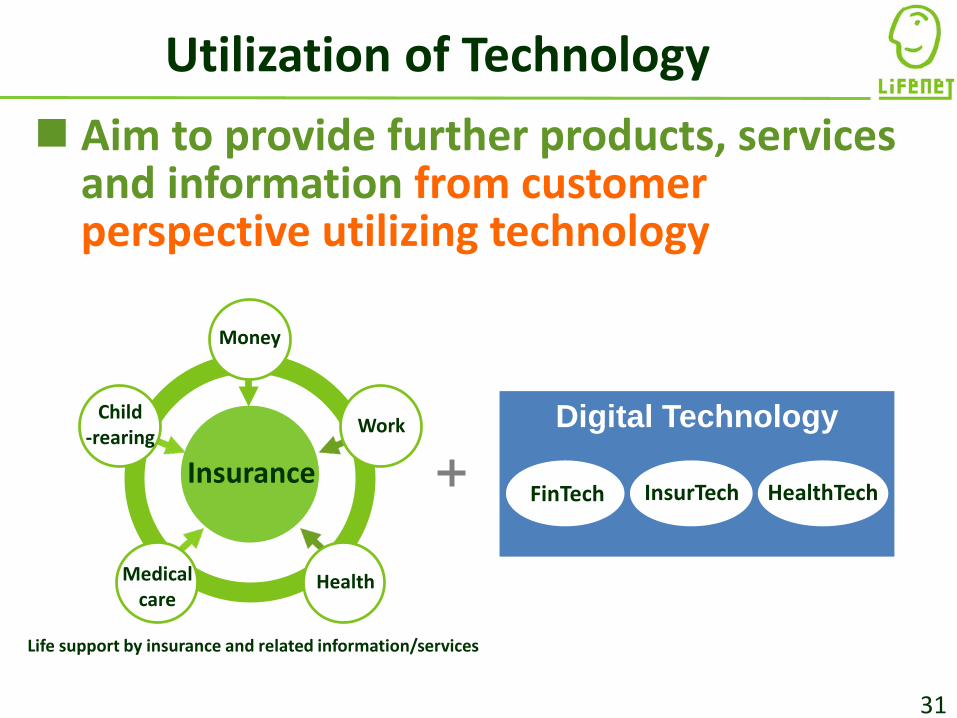
Life support by insurance and related information/services
Money
Work
HealthMedicalcare
Child-rearing
Insurance
Digital Technology
FinTech InsurTech HealthTech
Utilization of Technology Aim to provide further products, services
and information from customer perspective utilizing technology

32
LIFENET Manifesto
We wish to be a company that helps our customers embrace life more fully.In order to live out that vision, we continue to challenge ourselves.
(1) Creating the life insurance of the future without losing sight of its originalpremise: “an ounce of prevention is worth more than a pound of cure.”
(2) Listening to what our customers are saying. Recognizing their needs andacting accordingly. Allowing our actions to be borne out of their voices andneeds.
(3) Delivering the caliber of products and services that we would feelconfident recommending to our own friends and families.
(4) Being a “straight-shooter”. Committing to transparency. Communicatingopenly about our management team, our products, and our employees.
(5) Embracing diversity and dialogue to keep us abreast of changing needsand preferences. Delivering peace of mind that we’ll be around in 100years.
(6) Acting in good faith means always taking the high road when it comes tocompliance and ethics.
(1) Helping the customers help themselves. By making our materials easy tounderstand, customers can determine which coverage is truly the best fit.
(2) Turning “clauses” in the insurance contract into succinct points that yourgrandmother could grasp.
(3) Making all touch points headache-free. Beyond the application process,ensuring the claims and billing processes are also easy to understand.
(1) Giving the customer what he/she needs. No more, no less at a fair price.(2) Staying vigilant as to how we can provide our products more cost-
efficiently.(3) Always putting ourselves in our customers’ shoes in thinking about how to
minimize their premiums.
(1) Thinking about our customers’ convenience from every angle and everytouch point along the way.
(2) Forming alliances with like-minded partners who can add value above andbeyond our products and services to our customers.
(3) Providing health and wellness tips beyond the framework of life insuranceto create value in our policyholders’ lives.
(4) Creating a precedent for future generations as to what life insurance is(and should be) all about.
Our Guiding PrinciplesI. Making Life Insurance Accessible Again - Headache-freeII.
Making Life Insurance Accessible Again - AffordableIII. Making Life Insurance Accessible Again - ConvenientIV.
Comprehensible, Cost-Competitive, ConvenientRevised in June 2018 for the future

Subscribe to our "IR email service" to receive news releases and website updates via email.
All information on this document that is not historical fact constitutes forward-looking information and is based on assumptions and forecasts available to the company at the time of preparation. The company cannot guarantee the accuracy of these assumptions and forecasts. Earnings projections and other information on this may differ materially from actual performance due to various risks and uncertainties. This is a translation of the original Japanese document, prepared and provided solely for readers' convenience. In case of any discrepancy or dispute, the Japanese document prevails.
https://ir.lifenet-seimei.co.jp/en/

Appendix

35
Three Surplus Factors of Fundamental Profit
Net profit (loss) (95)Net profit (loss) (95)
Ordinary profit (loss) (90)
Mortality margin (loss)
681
Insurance claims and benefits
Interest margin (loss)
(5)
Expense margin (loss)
(754)
Expense loading
Other ordinary income
Operating expenses
Other ordinary expenses Capital gains
(losses) 0
Provision for contingency
reserves
Other onetime
gains (losses) (13)
Insurance premiums and other 2,882
Investment income 61
Other ordinary income 10Ord
inar
y in
com
e
Interest and dividends
Change in policy reserves
Projected interest
Change in policy reserves
Insurance claims and other 600
Provision for policy reserves and others 899
Operating expenses 1,380
Other ordinary expenses 163
Ord
inar
y ex
pens
es
Investment expenses 0
Income taxes 1
Extraordinary profit (loss) (2)
Interest expenses
Income taxes 1
Extraordinary profit (loss) (2)
Premiums income 2,792
Reinsurance income 89 Reinsurance income
Statements of operations
Insurance claims and benefits493
Reinsurance commissions 107
Reinsurance commissions
Net premiums
Profit analysis
Gains on sales of securities
Losses on sales of securities
1. Some items with minimal amounts have been omitted.
1Q of FY2018
Reversal of reserves for outstanding
claims
36
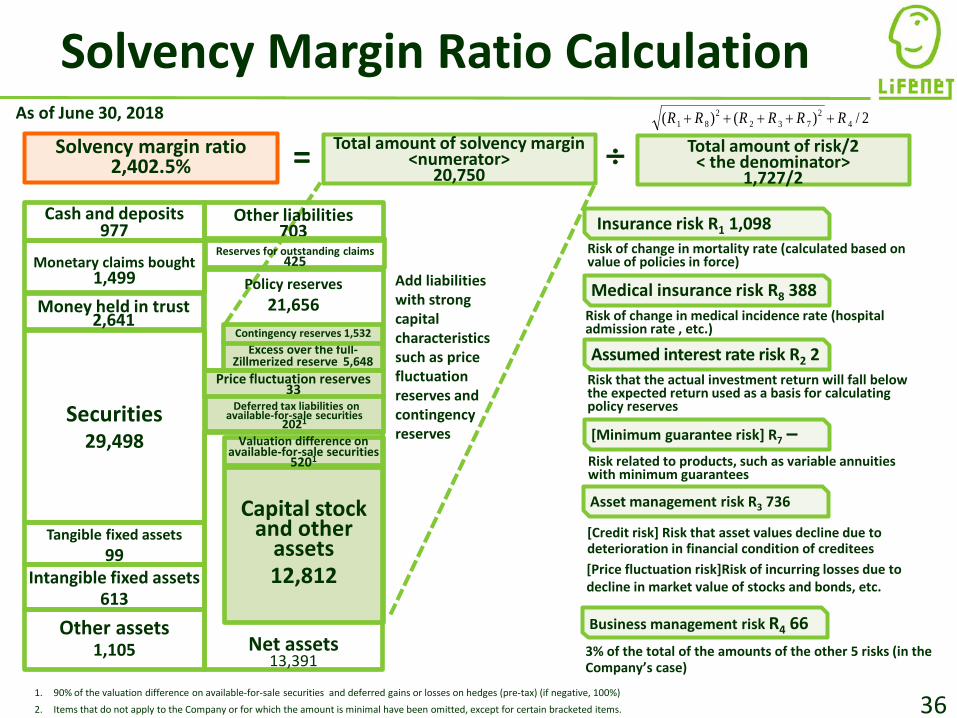
Solvency Margin Ratio Calculation
Tangible fixed assets99
Monetary claims bought 1,499
Cash and deposits977
Securities29,498
Intangible fixed assets 613
Other assets1,105
Other liabilities703
Excess over the full-Zillmerized reserve 5,648
Capital stock and other
assets12,812
Price fluctuation reserves 33
Deferred tax liabilities on available-for-sale securities
2021
Policy reserves 21,656
Contingency reserves 1,532
Money held in trust 2,641
Valuation difference on available-for-sale securities
5201
Total amount of solvency margin<numerator>
20,750Solvency margin ratio
2,402.5%
Insurance risk R1 1,098
Medical insurance risk R8 388
Assumed interest rate risk R2 2
Asset management risk R3 736
[Minimum guarantee risk] R7 -
Business management risk R4 66
Total amount of risk/2< the denominator>
1,727/2
2/)()( 42
7322
81 RRRRRR +++++
Risk of change in mortality rate (calculated based on value of policies in force)
Risk of change in medical incidence rate (hospital admission rate , etc.)
Risk that the actual investment return will fall below the expected return used as a basis for calculating policy reserves
Risk related to products, such as variable annuities with minimum guarantees
[Credit risk] Risk that asset values decline due to deterioration in financial condition of creditees[Price fluctuation risk]Risk of incurring losses due to decline in market value of stocks and bonds, etc.
3% of the total of the amounts of the other 5 risks (in the Company’s case)
= ÷
1. 90% of the valuation difference on available-for-sale securities and deferred gains or losses on hedges (pre-tax) (if negative, 100%)2. Items that do not apply to the Company or for which the amount is minimal have been omitted, except for certain bracketed items.
Add liabilities with strong capital characteristics such as price fluctuation reserves and contingency reserves
As of June 30, 2018
Reserves for outstanding claims 425
Net assets13,391