Embed Size (px)
Citation preview

Highlights of This Issue
In the course of the last several years the Merrill Lynch InternationalStructured Finance Research Team has published numerous introductoryreports to the international securitisation and structured credit markets. Untilthe beginning of this year we thought that they have fulfilled their role andcan be put to rest. Since then, however, we have received numerousrequests for introductory reports and commentaries, driven by the wide entryof new investors into the sector. Hence, the need to dust out some of the oldreports, update them and publish them in a new binding.
Here are the key topics covered in this publication:
• Investors’ approach to building a pan-European structured credit andsecuritisation portfolio
• Introduction to securitisation
• ABS and CDO rating transitions as a key investor consideration
• Analyzing subordinated tranches of ABS
• Master Trust structures on the example of credit card ABS
• Investor analysis of MBS
• Real estate and CMBS considerations
• Key features of synthetic and cash CLOs
• Static and dynamic synthetic CDOs
ASSET-BACKED
Europe
Asse
t-B
ac
ke
d16 July 2003
Alexander Batchvarov, PhD, [email protected]
Jenna [email protected]
William [email protected]
London(44) 20 7995 2685
ABS/MBS/CMBS/CDO 101A Compendium of Pieces for New and Not So New Investors
Merrill Lynch Global Securities Research & Economics GroupGlobal Fundamental Equity Research Department
RC#61419701
Investors should assume that Merrill Lynch isseeking or will seek investment banking or otherbusiness relationships with the companies inthis report.
Refer to important disclosures at the end of this report.Analyst Certification on page 1.

ABS/MBS/CMBS/CDO 101 – 16 July 2003
Refer to important disclosures at the end of this report. 2
CONTENTS
� Section Page
Section 1 European Structured Credit Portfolios 3
Section 2 Securitisation Fundamentals 11
2.1 What is Structured Finance and What is Securitisation? 12
2.2 Structural and Legal Aspects of ABS and MBS 17
2.3 Asset Classes and Basic Securitisation Structures 26
2.4 Benefits and Potential Drawbacks of Secuitisation 33
2.5 ABS Investors and Their Considerations 38
Section 3 Rating Stability of Structured Finance Bonds 41
3.1 Moody’s ABS Rating Transition Study 2002 – Many Things to WriteHome About!
42
3.2 Moody’s CDO Rating Migration Study 1996-2002 – More Doom ThanGloom!
50
Section 4 Assessing Subordinated Tranches in ABS Capital Structure 55
4.1 Framework for Subordinated Tranches Analysis 56
4.2 Break-Even and Sensitivity Analysis 60
Section 5 Key Consideration for Master Trust Structures 65
Section 6 Commercial Real Estate and Securitisation 73
6.1 Investment Landscape 74
6.2 CMBS: Securitised Property Portfolios 76
6.3 Legal Aspects of European Commercial Property 81
Section 7 Basics of Synthetic Collateralised Debt Obligation 85
7.1 Synthetic CLOs Explained 86
7.2 Synthetic Static and Dynamic CDOs – Structural Variations 99
7.3 Investor Protection and Strategies 104
Section 8 MBS Investor Considerations 107
8.1 Analytical Framework 108
8.2 Calculus for MBS 119

ABS/MBS/CMBS/CDO 101 – 16 July 2003
Refer to important disclosures at the end of this report. 3
1. European StructuredCredit Portfolios

ABS/MBS/CMBS/CDO 101 – 16 July 2003
Refer to important disclosures at the end of this report. 4
Structured finance and securitisation are usually used as substitute terms, althoughthe former is by definition broader and includes traditional asset backedsecuritisations, as well as more recent, innovative funding and risk transferapproaches. Such innovations include the future flow (or revenue-based) financingand operating assets (or whole business) securitisation. More recently, acombination of structured finance techniques and credit derivatives has come tocreate synthetic credit exposures and credit risk transfers, embraced under thegeneric term synthetic securitisations.
In this article we introduce an analytical credit framework for structured financebonds in order to make them easier to understand and position in an investmentportfolio. It is important to emphasize that securitisation’s most ‘notorious’feature stems from the level of separation of the underlying pool of assets fromtheir originator. For that separation to occur, however, third parties may beintroduced and other credit linkages may be created. Hence, the need for a two-dimensional credit plane to populate with structured finance and securitisationcredits.
Defining the Credit Space of Securitisation
All fixed income credits can be placed on a credit continuum:
• From credits fully dependent on the operating and payment ability, and hencebankruptcy risk, of the company issuer/originator within the respectiveindustry-specific and market environment.
• Through credits gradually removed from those risks to a point where they arefully separated from the originator and they rely entirely on the performanceof the ring-fenced assets, transferred and pledged as bond collateral.
The former, are usually referred to as plain vanilla unsecured bonds, while thelatter have come to be known as asset-backed securities. Between these two well-understood extremes lies a series of credits, which occupy an intermediate positionin terms of credit dependence, structural enhancements, legal underpinnings,operating exposure – they have come to be referred to interchangeably asstructured financings or securitisations.
The different types of structured credits occupy a different spot along that creditcontinuum. The degree of their autonomy from the underlying originator isusually reflected in the gap between the rating assigned to the structured credit andthe rating assigned to the related asset originator. The level of dependence on thecredit quality of the underlying assets is reflected in the level of creditenhancement, which partially bridges that gap. In an attempt to mitigate theinfluence of the originator of the assets or the risks associated with the assetsthemselves on the structured bonds and achieve a higher rating for the latter,additional parties with their own credit risk profiles are introduced. We refer tothe latter collectively from here on as third parties or third parties risk. Such thirdparties may include servicer, insurance provider, swap provider, portfoliomanager, property manager, off-takers, letter of credit provider, etc. Hence, atwo-dimensional credit plane is needed to position the universe of securitisationsand structured finance credits. (See Chart 1)
Understanding the position of any given structured credit within the frame of thecredit plane has serious implications for:
• Originators, as they determine the role they play during the life of a givenstructured credit and related effects on their operating and financial results,and ;
• Investors, as they determine the role of a given structured credit in the overallportfolio management - the portfolio’s credit diversification, performance,monitoring.

ABS/MBS/CMBS/CDO 101 – 16 July 2003
Refer to important disclosures at the end of this report. 5
Chart 1: Credit Independence of Securitisation Credits from Originator (horizontal axis)and from Third Party (vertical axis)
Ideal SecuritisedBond
Corp Bond
CLN
FutureFlow
Operating Assets
HIGH LOW
Synthetic Securitisations
De-linked
LOW
THIRDPARTY
HIGH
ORGINATOR/ISSUER
Single asset/managerFew assets portfolio
Single industry portfolio
ABS/MBS /CMBSCLO/CBO
Diversifiedmultiple asset
portfolio
General insurer
Monolinewrap
Insured Securitisations
Portfolio ofinsured
assets
Single asset
Multiple assets
Source: Merrill Lynch
Source: Merrill Lynch
Populating the Credit Space of Securitisation
Structured finance or securitisation comprises an array of approximations to debtfinancing. With a range of options to use, companies can implement variations ofany one basic design, depending on their particular needs. With a range of optionsto choose from, investors can find the best match for their portfolios and portfoliomanagement objectives.
The terms structured finance and securitisation are applied freely to include:
• Asset-backed securities (ABS) and Mortgage-backed securities (MBS),Collateralised Debt Obligations (CDOs) and Commercial Mortgage BackedSecurities (CMBS). This is the most fundamental format of securitisation andinvolves the issuance of off-balance-sheet debt, backed by a homogenouspool of assets. Securitised assets include bank and finance company assetssuch as credit cards, auto loans, mortgages, leases, corporate loans, real estateloans, etc., or corporate assets like trade receivables, vendor financing, realestate, etc. Securitisation in its narrow traditional sense is usually associatedwith ABS and MBS only.
• Future flow (or revenue-based) securitisations. This type of financing isusually associated with emerging markets and project finance. Assets includerevenues generated in the normal course of business of a given company, be ita manufacturer or a property manager - export receivables, fee-basedrevenues, rental flows, etc.
• Operating assets (or whole business) securitisations. Viewed as, but notlimited to, exit strategies for principal finance and mergers and acquisitionsactivities, the financing in this case is backed by the core operating assets of acompany and the revenues they generate, and typically has a strong real estateelement, which helps put some of these deals in the commercial real estatesecuritisation and CMBS field.

ABS/MBS/CMBS/CDO 101 – 16 July 2003
Refer to important disclosures at the end of this report. 6
• Insured securitisations. Any of the above securitisation formats can besubject to a ‘wrap’ – insurance protection against the credit and cash flowrisks of a securitised transaction. It allows for the substitution of the creditrisk of the assets for the credit risk of the insurance provider.
• Synthetic securitisations. It is aimed at achieving a transfer of the credit risksassociated with given assets, while the originator retains them on its balancesheet. Full or partial financing against those assets may or may not berealised. Synthetic securitisations may actually involve many of thesecuritisation listed so far and it should be viewed more as a form ofexecution rather than independent securitisation type.
� Asset-Backed and Mortgage-Backed SecuritiesThe legal separation of assets from the originator (i.e., a ‘true sale’) ensures thatinvestors in the asset-backed bonds are not directly exposed to credit deteriorationor bankruptcy of the originator. This feature fundamentally distinguishes asset-backed securities from unsecured debt issued by the same originator or from otherforms of securitisation. Bondholders have no recourse to the originator, exceptunder limited circumstances.
In most cases, the originator remains the servicer of the pool of assets, with aback-up servicer identified at the outset of the transaction in case the originatorunderperforms or is declared bankrupt during the term of the transaction. Cashflows generated by the underlying assets are used to service the bonds. The creditquality of the asset-backed debt is, therefore, based in the first instance on thecredit quality of the legally segregated, ring-fenced pool of assets. However, theratings assigned to the asset-backed bonds will reflect the extent of internal orexternal credit support, i.e. their credit enhancement.
From investors’ point of view ‘true’ securitisation provides credit exposuresmitigated through structural, legal and credit enhancements, generally unavailablein the plain vanilla bond market. The exposures can vary widely and include lotsof combinations: numerous obligors – numerous industries portfolio, numerousobligors - single industry portfolio, numerous obligors – single asset, singlemanager – diversified portfolio, single asset - single manager, etc.
� Future Flow (Revenue-Based) Securitisation
In case of the revenue-based securitisation, the well being of the companygenerating the assets-revenue is of paramount importance for the performance ofthe securities. The bonds are usually backed by a defined and specific revenuestream generated in the normal course of business of the respective company.These could include fees for services provided to customers; payments due forexported goods, utilisation fees, settlement payments, money transfers, etc.Bondholders’ rights are not limited only to those revenues: in case of default orbankruptcy of the originator, the bondholders have a right to recourse and becomegeneral unsecured creditor to the originator.
The credit quality of the revenue-based bonds are generally in line with the creditquality (the unsecured senior debt rating) of the respective originator (representinggeneration risk for the assets) and the related obligors (representing payment riskfor the assets, off-take contacts). Credit support in the structure is achievedthrough a desired level of debt service coverage, and excess debt service flows areremitted back to the originator or retained in case of adverse events. Covenantsmay also play an important role.
Investors take full credit exposure to the company and a set of its customers, yetcertain other risks (which are inherent in the company’s plain-vanilla bonds) maybe well mitigated (e.g. currency and sovereign risks in case of emerging marketsexport based deals). They can also have access to areas of credit traditionallyreserved for the banks and bank loan market, as is the case with project finance.In the worst case they may be treated as a general non-secured creditor of thecompany. Investors’ exposure can be defined as multiple obligors – singleoriginator or single obligor-single originator.

ABS/MBS/CMBS/CDO 101 – 16 July 2003
Refer to important disclosures at the end of this report. 7
� Operating Asset Securitisation
• An operating asset securitisation quite simply encompasses debt financingbacked by a company’s operating assets, typically its core assets generatinghighly predictable income streams given the company’s unique position.Under the specific legal structure, known as ‘secured bond structure’, acombination of fixed and floating charges over the assets of the companygives investors the legal right to determine whether to operate or liquidate thecompany in question in case of default on their debt.
• The transaction can be structured with credit enhancement (insurance or credittranching, or both) and structural covenants to protect investors, just like intraditional ABS. Unlike them, though, operating asset-based securitisationsretain a certain level of operating risk. The assets are not typicallytransferred, only the income from such assets is assigned for the benefit ofinvestors. However, in case of a bond default, investors can choosecollectively to run the company or liquidate it (and apply the liquidationproceeds to redeem their principal).
Credit quality of operating asset securitisations does not need to be capped at thelevel of the operating company, particularly, if the assets can be shown to generateincome reliably with little input from the operator and/or to preserve their value incase of company’s bankruptcy. Obviously, the credit quality of the underlyingobligors (i.e. paying customers of the company, in some cases government orquasi-government bodies) is also an essential feature of the bonds’ credit.
Investors gain exposure to companies which otherwise may not issue debt andface full credit exposure to the company in question. They are entitled to a fullpriority claim against the company with the potential downside in the value of theassets (decline in the market value of the assets) and the timing of the realisationof that value (length of period needed to realise those assets). Credit exposuremay take the forms: pool of assets - single industry, single asset – multipleobligors.
� Insured Securitisations
Insurance can play different roles in securitisations – it can be applied to the assetsin the securitised portfolio, or it can be applied to the securitisation bond in orderto enhance its credit quality. Insurance can be provided on the bond level by bothgeneral and specialised bond (monoline) insurance companies and on thecollateral level by both general and specialised (primary mortgage) insurers.
Through the insurance the risk of the assets or the bonds is shifted to the insuranceprovider. And the insurers’ credit substitutes the credit of the bond or the assets.It is prudent, though, to look through the insurance cover or wrap and determinethe risk, to which the insurance provider is exposed and the investor or issuercould be exposed in case of insurers’ default.
The application of the ‘look through’ principal require understanding of theprocess of insurance underwriting, the minimum credit level requirement for theinsurance to be applied, the general business of the insurer and the management ofthe insurers’ risk portfolio and overall business. In that respect, the levels of riskshould be different and analysed differently for
• Insurance providers on assets level (e.g. insurers specialising in mortgageinsurance who provide coverage on an individual or pool basis) where thesecuritisation bond is backed by a pool of multiple assets insured onindividual or pool basis by one or several insurers;
• Insurance providers on a bond level through specialised bond (monoline)insurers, whereby such insurers take only investment grade risk, manage theirrisks on a portfolio basis and are tightly monitored by the rating agencies interms of individual and portfolio risks;
• General insurance providers, for whom bond insurance is just one of thenumerous lines of business.

ABS/MBS/CMBS/CDO 101 – 16 July 2003
Refer to important disclosures at the end of this report. 8
For investors, this is a way of shifting the exposure from the assets and theoriginator away to another party, yet such exposure to the third party is only to theextent of the credit performance of the underlying bond or pool of assets. Inaddition, depending on the type of insurance as discussed above, investorsexposure to the third party may be viewed as exposures to: a pool of assets, amanaged portfolio of risks or a general insurance business.
� Synthetic Securitisations
In the case of synthetic securitisation, the assets, usually used for credit referenceonly, remain on the balance sheet of the respective originator/issuer. Through anumber of mechanisms the originator seeks to shift the risk of those assets to otherparties: through a credit default swap to the swap provider or through the purchaseof protection from the market, or a combination thereof. Raising financing is ofsecondary importance, if any, for the seeker of credit protection.
The reference portfolio of assets is clearly defined but remains on the sponsor’sbalance sheet – the portfolio comprises residential or commercial mortgages,unsecured or secured consumer and corporate loans, real estate. The risksassociated with this portfolio and subject to the transfer are defined through ‘creditevents’. If bonds are issued, in the case of partially funded or fully fundedstructures, their credit performance is fully linked to the portfolio and its creditenhancement. In an effort to de-link the rating of the bonds from the rating of theissuing bank, the note proceeds may be used to purchase a portfolio of governmentbonds, mortgage bonds or MTNs, as collateral for the bonds.
Hence, the credit performance of the bonds depends on the credit performance ofthe referenced portfolio, the enforcement of credit events, while their cashperformance is linked to the cash performance of the collateral portfolio. Unlikeconventional ABS or CLN structures, the amortization proceeds of the referencedassets are not used to make payments under the structured bonds. Investors onlyhave synthetic exposure to the referenced portfolio, whilst debt service is met bythe yield of the collateral portfolio supplemented by insurance premiums paid bythe sponsor in return for credit protection for the referenced portfolio. Thepurchased collateral is reduced to the extent necessary in order to compensate thesponsor for losses incurred on the referenced portfolio. Ultimately, the collateral isliquidated to meet note holders’ principal payments.
Credit exposures are related to the reference portfolio, its credit quality and creditperformance related to the definition of credit events and the determination oftheir occurrence (where the trustee’s role is broader than usual). Others stem fromthe collateral portfolio and its performance, mechanics to protect against itsmarket risk. Credit default swap counterparty is another element in the creditpicture. The originator plays a role by assuming the negative carry on thecollateral through regular payments made in the form of insurance premiums.
Investors’ levels and nature of credit exposure depends on the particular type ofsynthetic securitisation. In the case of credit-linked bonds, investors’ exposure isto both the credit quality of the asset portfolio and the issuer’s credit standing. Inthe case of unfunded or partially funded structures, the exposure is to a diversifiedassets pool, highly leveraged for the latter. Investors are gaining exposure to thecredit risk as defined by the credit events of a diversified and enhanced pool, whilethe cash flows for debt service are derived from a non-related highly liquid, highcredit quality bond portfolio.
� Securitisation Credit Space and Investment Portfolio
The stated initial purpose of securitisation was to achieve structured bonds whosecredit risk lies with the transferred assets and is entirely de-linked from the creditrisk of the originator of the assets. The developing the structured techniques andtheir application to different asset classes and company needs have increasinglylead to introduction of third party risks or to leaving residual originator risk in thesecuritisation bonds.

ABS/MBS/CMBS/CDO 101 – 16 July 2003
Refer to important disclosures at the end of this report. 9
Hence, the need for a credit framework within which to position the securitisationbonds. The proposed framework includes two dimensions to reflect the level ofcredit (in)dependence of the securitisation bond from the originator and the thirdparties. The credit risk of the asset itself is a reflection of the risk of the originatorand the third party in combination with the credit enhancement as determined bythe rating agencies.
In the language of our schematic increasing credit dependence of the securitisationbond from the originator and the third parties would be reflected in moving left onthe horizontal axis and up on the vertical axis, respectively. By determining thelevel of credit dependence of each bond on the originator and the third parties, wecan position it in our securitisation credit plane:
• We believe the ideal starting point for full credit independence would be asecuritisation bond based on a multiple asset, well geographically andindustry diversified amortising portfolio with easily replaceable servicer. Inthe low right corner of our credit plane credit dependence is de minimum.Such a securitisaton bond should pretty well fit in any portfolio with minimalsurveillance.
• Moving left (backwards) on the horizontal axis, the securitisation bonds havean increasing degree of originator risk, i.e. risk specific to a given companyand a given industry. At its extreme, future flow securitisation bonds offeralmost full company risk along with mitigated through structuralenhancements certain particularly unpalatable risks. In this case, creditsurveillance would require primarily focus on the originator. Intermediarypoints will include operating assets securitisations based on portfolio ofbusinesses units or a single business.
• Moving up the vertical axis from the ideal starting point, securitisation bondshave an increasing degree of a third party risk to the point of extreme of, say,fully insured by a general insurer single asset transaction with some riskmitigants on the underlying asset. Hence, surveillance is required for theinsurance company in question and the associated insurance industry segment.Intermediary points would include on the insurance side: bonds based on abroad portfolio of insured assets, monoline insured bonds, and on thetraditional ABS/ MBS side multiple industry portfolios, single industryportfolios, decreasing number of assets in a pool down to a single asset/ singlemanager situation.
• Moving away from the axes and towards the middle of the credit plane,securitisation bonds would represent different combinations of originator –third parties credit risks. Different level of monitoring of all the partiesinvolved would then be necessary.
The above three extreme points and the relevant intermediary points should beused as points of reference when building and re-balancing the credit risk of asecuritisation bond portfolio.

ABS/MBS/CMBS/CDO 101 – 16 July 2003
Refer to important disclosures at the end of this report. 10

ABS/MBS/CMBS/CDO 101 – 16 July 2003
Refer to important disclosures at the end of this report. 11
2. Securitisation Fundamentals

ABS/MBS/CMBS/CDO 101 – 16 July 2003
Refer to important disclosures at the end of this report. 12
Structured finance and securitisation are usually used as substituteexpressions, although the former is by definition broader and includestraditional asset-backed securities, as well as more creative and innovativeapproaches, such as future flow (or revenue-based) financing and operatingassets (or whole business) securitisation, and most recently syntheticsecuritisation.
2.1 What is Structured Finance and What isSecuritisation?
Securitisation is a form of debt financing technology, developed two decades agoand actively used in a variety of forms to raise off-balance and alternativefinancing for companies and banks. In its most recent modification, syntheticsecuritisation is used as a risk transfer rather than financing mechanism.
In its most generic form, securitisation involves the sale, transfer or pledge of thespecified assets to a special purpose, bankruptcy-remote vehicle or trust (SPV),which in turn issues notes or certificates to investors. Investors (banks, insurancecompanies and specialised funds) generally rely on those assets and associatedpledges for the redemption of their bonds, either from the cash flows generated bythe assets or from the assets’ sale/ liquidation under adverse conditions.
Securitisation and structured finance are generic terms, which are appliedinterchangeably to include:
• Asset and mortgage-backed securities (ABS and MBS). This is the mostfundamental format of securitisation and involves the issuance of debt, orasset-backed securities, secured by a homogenous pool of assets. Securitisedassets could include bank and finance company assets such as credit cards,auto loans, mortgages, real estate, equipment leases and corporate loans, orcorporate assets like trade receivables, vendor financing and real estate.Initially, the term securitisation was used to mean ABS and MBS only.
• Future flow (or revenue-based) financing. In this case, the financing isbacked by specified revenues generated in the normal course of business of agiven company - export receivables, settlement and utilisation fees, workersremittances, etc.
• Operating assets (or whole business) securitisation. The financing in thiscase is backed by the core operating assets of a company and typically has astrong real estate element.
• Synthetic securitisation. A combination of structured finance and creditderivatives techniques, synthetic securitisation has recently come to addressbanks’ need for transfer of risk associated with given assets without thetransfer of the assets themselves. It can be executed as partially or fullyfunded securitisation.
� Asset and Mortgage-Backed Securities
The legal separation of assets from the originator (i.e., a ‘true sale’) ensures thatinvestors in the asset-backed notes are not directly exposed to credit deteriorationor bankruptcy of the originator. This feature fundamentally distinguishes thesesecurities from unsecured debt issued by the same originator or from other formsof securitisation.

ABS/MBS/CMBS/CDO 101 – 16 July 2003
Refer to important disclosures at the end of this report. 13
Slide 2: Traditional Securitisation – ABS/MBS
❏ Legal segregation of the assets backing the ABS/MBS from the assets originator
❏ Bankruptcy- remote issuing vehicle
❏ No investor recourse to assets originator in case of losses in the assets pool
❏ Rating on senior notes exceeds rating of asset originator
❏ Off-balance sheet financing for asset originator
❏ Higher yield and more protections for investors
Source: Merrill Lynch
In most cases, the originator remains the servicer of the pool of assets, with aback-up servicer identified at the outset of the transaction in case the originatorunderperforms or is declared bankrupt during the term of the transaction. Cashflows generated by the underlying assets are used to service the notes issued. Thecredit quality of the debt is therefore, based in the first instance on the creditquality of the legally segregated, ring-fenced pool of assets. However, the ratingsassigned to the asset-backed notes will take into account not just the credit qualityof the underlying pool, but also the extent of internal or external credit support, i.e.the credit enhancement for the notes, as well as other structural and legal features.
The assets backing the transaction are sold or transferred to the special purpose,bankruptcy remote entity, issuing the asset-backed securities. The sale or transferis ‘absolute’, so that the creditors of the originator of the assets have no claimagainst those assets, whereas the investors in the asset-backed securities have norecourse to the originator of those assets in case of losses under the latter.
The benefits of securitisation to issuers is in the off balance sheet treatmentachieved, as well as the capital relief gained to the extent that the underlying assetsattract regulatory capital charges. Another essential benefit is the diversificationof funding sources. The cost of funding through securitisation is sometimes morecompetitive for certain issuers.
Investors in asset-backed securities may be able to pick up yield over comparableplain vanilla bonds. To a large degree, this incremental spread reflects the relativecomplexity of structures and – sometimes – the lower liquidity of securities in thesecondary marketplace.
� Future Flow (Revenue-Based) Financing
In case of the revenue-based securitisation, the wellbeing of the companygenerating the assets is of paramount importance to the performance of thesecurities. The bonds are backed by the revenue stream generated in the normalcourse of business of the respective company. These could include fees forservices provided to customers, payments due for exported goods, utilisation fees(charges for the use of a pipeline or other distribution networks), settlementpayments for telecom services or credit card usage, etc.

ABS/MBS/CMBS/CDO 101 – 16 July 2003
Refer to important disclosures at the end of this report. 14
Slide 3: Future Flow Securitisation
❏ Defined revenue stream pledged to noteholders
❏ Revenue stream depends on generation capabilities of originator and paying capabilities ofits clients
❏ Originator circumvents restrictive covenants and sovereign ceiling
❏ Investors gain access to borrowers in emerging markets without the correspondingsovereign currency exposure
❏ Rating of notes in line with rating of originator
Source: Merrill Lynch
A defined revenue stream is pledged to the bondholders for the purposes of thesecuritisation deal. However, bondholders’ rights are not limited only to thoserevenues. In case of default or bankruptcy of the originator, the bondholders havea right to recourse and become general unsecured creditors to the originator.
Many of the future flow transactions are structured to mitigate certain sovereignrisks (e.g. currency risk) and allow a highly rated corporate or bank borrower froma given low rated country to raise financing at more advantageous conditions thanthe country’s sovereign ceiling would otherwise permit.
The ratings of the revenue-based bonds are generally in line with the unsecuredsenior debt ratings of the respective originator. Credit support in the structure isachieved through a desired level of debt service coverage, and excess debt servicecash flows are remitted back to the originator or retained in case of adverse events.As in some other debt financing transactions, covenants play an important role toprotect investors.
Revenue-based securitisation is often used when the company faces restrictivecovenants on its other debt preventing it from pledging assets. The sale of future-generated revenue circumvents such restrictions. In addition, in emerging marketsit helps accommodate higher credit quality companies located in lower creditquality sovereigns, and allow the former to raise funds at more advantageousterms than the sovereign ceiling would otherwise allow them. Project financebonds are yet another user of this securitisation structure.
� Operating Asset Securitisation
An operating asset securitisation simply encompasses debt financing backed bythe operating assets of a company, typically the core revenue generating assets ofthe company. Such assets should generate highly predictable income streamsgiven the company’s superior competitive position as a result of, say, a monopolyor a particular business niche.
Many operating asset securitisations have been employed as a mainstreamcorporate finance exercise by companies involved in acquisition finance,especially by principal finance groups and companies involved in operationsrelated to government tendered service contracts.
In operating assets-based securitisation, the core assets of a company arespecifically ear-marked to secure the debt issued. Such securitisations have beenexecuted mainly in the UK, where legal aspects of the transaction typically ensurethat investors have first recourse to the assets in case of originator’s bankruptcy

ABS/MBS/CMBS/CDO 101 – 16 July 2003
Refer to important disclosures at the end of this report. 15
through the so-called ‘secured loan structure’: investors are granted fixed andfloating charges over the assets of the company, which allow them to take overthose assets in case of default and determine whether to operate or liquidate themto satisfy debt payments before potential creditors.
Slide 4: Operating Asset Securitisation
❏ Assets backing the transaction are the core operating assets of a company or entity
❏ ‘Secured loan structure’ allowing investors to take over the company in case of default onthe notes
❏ Operating risk
❏ Reliance on operating cash flows and liquidation value
❏ Widely applicable in acquisition, privatisation and principal finance
❏ Exposure to sectors which otherwise may not issue debt
❏ Risks of changes in the value of the assets and the timing of its realisation
Source: Merrill Lynch
Operating assets securitisation is based on operating cash flows (EBITDA) andcan be structured with credit enhancement (insurance or credit tranching, or both)and structural covenants to protect investors.
However, operating assets-based securitisations are fundamentally different in thata certain level of operating risk remains and is assumed by investors. The assetsare not typically transferred. The income from such assets is assigned to the SPVin benefit of investors. Generation of revenue used to service the debt depends onthe continued operational use of these assets by the company.
From issuers’ perspective, operating asset securitisations can be employed as yetanother corporate finance tool especially by companies involved in acquisition andprincipal finance, companies involved in operations related to governmenttendered service contracts.

ABS/MBS/CMBS/CDO 101 – 16 July 2003
Refer to important disclosures at the end of this report. 16
Credit ratings for operating asset securitisations do not need to be capped at theratings of the company, particularly, if the assets can be shown to generate incomereliably with little input from the operator and to preserve their value in case oforiginator bankruptcy. Obviously, the credit quality of the underlying obligors(i.e. paying customers of the company) is also an essential feature of the ratinganalysis. In addition, some operating assets-based securitisations benefit fromreliance on payments from the government or quasi-public bodies.
From issuers’ perspective, operating asset securitisations can be employed as yetanother corporate finance tool especially by companies involved in acquisition andprincipal finance, as well as companies involved in operations related togovernment tendered service contracts.
Investors gain exposure to companies which otherwise may not issue debt andface full credit exposure to the company in question. They are entitled to a fullpriority claim against the company with the potential downside in the value of theassets (decline in the market value of the assets) and the timing of the realisationof that value (length of period needed to realise those assets).
� Synthetic Securitisation
Slide 5: Synthetic Securitisation
❏ Non-funded, partially funded or fully funded structures
❏ Main goal credit risk transfer (and not necessarily asset transfer or financing)
❏ Referenced pool of assets remain on balance sheet
❏ Collateral portfolio of highly rated bonds assures rating de-linkage
❏ Bank pays for the protection - ‘insurance premium’ makes up the difference between thebond coupon and the yield of collateral portfolio
❏ Applicable to a variety of asset classes on bank’s balance sheet
❏ Ease of execution for investors
❏ Wide range of exposures for investors-sellers of credit protection
Source: Merrill Lynch
In the case of synthetic securitisation, the assets, usually used for credit referenceonly, remain on the balance sheet of the respective originator/issuer. Through anumber of mechanisms, the originator seeks to shift the risk of those assets toother parties: through a credit default swap to the swap provider or through thepurchase of protection from the market, or a combination thereof. Raisingfinancing is of secondary importance, if any, for the seeker of credit protection.
The reference portfolio of assets is clearly defined but remains on the sponsor’sbalance sheet – the portfolio comprises residential or commercial mortgages,unsecured or secured consumer and corporate loans, as well as real estate. Therisks associated with this portfolio and subject to the transfer are defined through‘credit events’. If bonds are issued, in the case of partially funded or fully fundedstructures, their credit performance is fully linked to the portfolio and its creditenhancement. In an effort to de-link the rating of the bonds from the rating of theissuing bank, the note proceeds may be used to purchase a portfolio of governmentbonds, mortgage bonds or MTNs, as collateral for the bonds.

ABS/MBS/CMBS/CDO 101 – 16 July 2003
Refer to important disclosures at the end of this report. 17
Hence, the credit performance of the bonds depends on the credit performance ofthe referenced portfolio and the enforcement of credit events, while their cashperformance is linked to the cash performance of the collateral portfolio. Unlikeconventional ABS or CLN structures, the amortization proceeds of the referencedassets are not used to make payments under the structured bonds. Investors onlyhave synthetic exposure to the referenced portfolio, whilst debt service is met bythe yield of the collateral portfolio supplemented by insurance premiums paid bythe sponsor in return for credit protection for the referenced portfolio. Thepurchased collateral is reduced to the extent necessary in order to compensate thesponsor for losses incurred on the referenced portfolio. Ultimately, the collateral isliquidated to meet note holders’ principal payments.
Credit exposures are related to the reference portfolio, its credit quality and creditperformance related to the definition of credit events and the determination oftheir occurrence (where the trustee’s role is broader than usual). Others stem fromthe collateral portfolio and its performance, mechanics to protect against itsmarket risk. Credit default swap counterparty is another element in the creditpicture. The originator plays a role by assuming the negative carry on thecollateral through regular payments made in the form of insurance premiums.
From issuer’s point of view, synthetic securitisation is a simpler and easier way oftransferring risk especially when financing is not a primary goal, and can beapplied to much larger (than for traditional ABS) portfolios.
Investors’ exposure levels and the nature of credit exposure depend on theparticular type of synthetic securitisation. In the case of credit-linked bonds,investors’ exposure is to both the credit quality of the asset portfolio and theissuer’s credit standing. In the case of unfunded or partially funded structures, theexposure is to a diversified assets pool, highly leveraged for the latter. Investorsare gaining exposure to the credit risk as defined by the credit events of adiversified and enhanced pool, while the cash flows for debt service are derivedfrom a non-related highly liquid, high credit quality bond portfolio.
2.2 Structural and Legal Aspects ABS and MBS
The securitisation process features many legal and structural aspects with the mainobjective of separation of credit risk of the underlying assets from the originator’scredit risk. That separation is the necessary prerequisite for achieving a highercredit quality of the asset-backed securities than that of the originator. Otherprerequisites include credit and liquidity risk mitigants.

ABS/MBS/CMBS/CDO 101 – 16 July 2003
Refer to important disclosures at the end of this report. 18
� The Securitisation Process
Slide 6: Generic Securitisation Chart
OriginatorOriginator
SPV / Trust - IssuerSPV / Trust - Issuer
AssetsAssets
InvestorsInvestors
CreditEnhancer
CreditEnhancer
AAA rated bonds
SwapSwap
Transfer of Asset Pool(Sale or Assignment)
Structural/ LegalElements
Structural/ LegalElements
ServicerServicer
Liquidity ProviderLiquidity Provider
Source: Merrill Lynch
Let us look at a very simple schematic diagram that outlines the main genericstructure of securitisation transaction (Slide 9).
The originator, a company or bank originates assets in the normal course of itsbusiness and retains them on its balance sheet. It needs financing, and one way ofacquiring it, is by monetising the assets it has, selling them to another entity, (anSPV) established solely for the purpose of that financing. The SPV (the Issuer)issues securitisation bonds to investors and applies the issuance proceeds topurchase the assets from the asset originator. The SPV’s balance sheet nowconsists of assets – the assets acquired from the originator (as they are no longeron the originator’s balance sheet) and liabilities in the form of the bonds issued.The SPV is a shell company, which holds the assets for the benefit of the bondinvestors. Hence, the need for a company to look after those assets (the servicer).In order to achieve desired credit quality of the bonds issued based on the assets,there is a need for additional supports: credit, structural and legal enhancements.These are put in place to mitigate the credit, legal, liquidity, interest rate, currencyor other risks associated with the assets and the transaction. Hence, the roles ofcredit enhancer, liquidity provider and swap counterparty. The securitisationtransaction is structured within a given legal framework in order to achieve thelegal separation of the assets from the originator.
The most senior tranches of a securitisation bonds, generally achieve AAA rating.This is an essential aspect of securitisation. Securitisation allows originators withlower credit quality to issue AAA rated bonds. In other words, the originatorreceives better funding irrespective of its own credit worthiness on a stand-alonebasis.
The legal separation of the assets from the originator, the credit and structuralenhancement in the securitisation structure altogether provide for a securitisationbond for highest credit quality (rating).
� Key Securitisation Parties
Let us analyse the parties and their role in a securitisation structure.

ABS/MBS/CMBS/CDO 101 – 16 July 2003
Refer to important disclosures at the end of this report. 19
Slide 7: Key Parties to ABS/MBS Financing
❏ Assets Originator
➢ entity with funding needs and with assets which can be used as collateral for ABS/MBS funding
❏ Issuer of ABS/ MBS
➢ entity specifically created for the purposes of the securitisation - Special Purpose Vehicle (SPV) orSpecial purpose Company (SPC)
❏ Outside Credit Enhancer
➢ entity providing credit enhancement through insurance, guarantee or reserve account
❏ Servicer
➢ entity which collects and distributes the cash flows from the assets
❏ Liquidity Provider
➢ entity that addresses the timing mismatches between the collected cash flows from the assets and thecash flows to be distributed under the structured bonds
❏ Rating Agencies
➢ determine the credit strength of an ABS and size the credit enhancement level necessary to achievethat credit strength
Source: Merrill Lynch
The originator is an entity which has funding needs and holds assets that are usedas collateral in an asset-backed structure to achieve higher rating and, hence, betterfunding. The originator could be any entity, which has well defined assets on itsbalance sheet. These assets should generate predictable and stable future cashflows. They should not only be clearly defined, but also be legally transferable bythe originator to the issuer.
The issuer is a specially created entity for the purposes of the securitisation,known as a special purpose vehicle (SPV) or special purpose company (SPC), or atrust under some Anglo Saxon jurisdictions. We have to stress the fact that thisentity is established only for the purposes of the respective funding and expectedissuance of asset-backed securities. Its obligations, hence, should be limited to thesatisfaction of this particular purpose. It is an entity structured to be legallydifferent and independent from the originator of the assets. The functions of thatentity are limited to the issuance of the bonds (its main creditors are thebondholders) and the acquisition of the assets (thus its main assets are thesecuritised asset pool). The SPV is not meant to have any other substantialobligations or incur other debt, which could jeopardise its status of a bankruptcy –remote entity.
Outside credit enhancer could be an insurance company or monoline insurer, or insome cases could simply be a reserve account which is funded with a letter ofcredit. For most securitisation transactions, however, the credit enhancement isinternal to the deal, i.e. through subordination or overcollateralisation.
The servicer could be an outside party or a party in the structure such as theoriginator. This is a very important point to understand when analysing asset-backed securities. The servicer is responsible for the assets: the generation of thecash, its collection, pursuing delinquent and defaulted accounts. This role iscrucial because investors rely for their repayment only on the cash generated fromthe assets, as there is no recourse back to the originator of those assets. If theservicer is the originator, any negative changes that the originator could encountercould affect his role as servicer, influencing the performance and rating of therespective asset-backed securities. As we mentioned earlier, one of the objectivesof the securitisation process is to de-link the rating of the asset-backed securitiesfrom the rating of the pool and the rating of the originator. However, the rating ofthe originator may continue to have a bearing over the structure and theperformance of the deal in its role as a servicer.
Originator
Issuer
Outside credit enhancer
Servicer

ABS/MBS/CMBS/CDO 101 – 16 July 2003
Refer to important disclosures at the end of this report. 20
The liquidity provider addresses only timing mismatches between the cash flowsgenerated in the asset pool and cash flows needed to be paid under the asset-backed security. These timing mismatches may arise because of delays intransferring the money, rising delinquencies or some technical glitches. It isimportant to remember that the liquidity provider only covers timing mismatchesin the cash flows, not cash shortfalls due to losses in the asset pool.
Important players in the securitisation process are the rating agencies. The ratingagency in the asset-backed securities and mortgage-backed securities marketestablishes the credit enhancement levels, i.e. the cushion that investors receive toprotect them against losses, according to the desired rating levels. The ratingagency has the role of determining the size of the cushion, which ultimatelydepends on the credit quality of the asset pool and the desired rating of the bonds.
� Key Legal Concepts in ABS Securitisation
Slide 8: Key Legal Concepts in Securitisation
❏ Assets are transferred from the originator to the SPC
➢ assets are removed from the bankruptcy estate of the originator who retains no legaland equitable interest in those assets - absolute removal, true sale
➢ absolute (true) sale tests: degree of transfer of ‘risk of loss’ away from the originator;degree of retention of ownership benefits by originator; degree of control over the assetsafter the transfer; accounting treatment of asset transfer by originator; intent of sale
➢ asset transfer results in monetising the assets for cash in consideration of their value - nofraudulent conveyance
❏ SPC is structured to be a bankruptcy remote (not bankruptcy-proof) entity
➢ its assets are unlikely to be considered part of the assets of the originator in case of theoriginator’s bankruptcy - no substantive consolidation
➢ limited risk of bankruptcy filing - voluntary or involuntary
Separation of Asset Risk from Originator Risk
Source: Merrill Lynch
It is vital to achieve a full separation between the assets and the originator of thoseassets to obtain AAA rating for the asset-backed securities, so that the assets (andsubsequently the bond investors) are not affected negatively by the originator’sbankruptcy, which could be particularly severe in the case of low-ratedoriginators. There must be a particular structure that allows ‘absolute’ separationin the ownership of these assets from the originator in order to avoid the threat ofthe assets being consolidated back into the bankruptcy estate of the originator.
One of the aspects of the separation is the so called ‘true’ sale of the assets, i.e.ensuring that no creditors of the originator have any claims against the sold assets,and those assets cannot be consolidated in the bankruptcy estate in case ofinsolvency proceedings against the originator. Furthermore, the sale of the assetsis subject to a special agreement between the originator and the SPV.
The agreement must be an arms-length agreement and the payment must representfair value of the assets. The originator normally does not retain any control overthe SPV nor over the transferred assets. In general, the aim is to fully transfer theassets with their underlying benefits and risks to the SPV.
Another element in the structure is the SPV (Issuer), a bankruptcy remote, notbankruptcy proof, entity. The SPV could be structured as a corporate entity or atrust, in all cases independent from the originator. Arrangements are made so thatthe risk of involuntary or voluntary bankruptcy of the SVP is remote. One way of
Liquidity provider
Rating agencies
SPV is structured to be abankruptcy remote, not
bankruptcy-proof

ABS/MBS/CMBS/CDO 101 – 16 July 2003
Refer to important disclosures at the end of this report. 21
achieving this is defining explicitly the purpose of the SPV and its obligationstowards outside parties. These obligations could be related to the payment ofservicing fee of the servicer, fees under the letter of credit provider, amongstothers, but its core obligations remain those to the securitisation bond investors.Normally, the SPV should not incur any additional debt.
If there is a swap in the structure, it is important to determine what is the potentialtermination payment that the SVP could owe to the swap counterparty, and whatpriority this payment has in the deal’s cash flow waterfall. In case of currencyswaps, the termination payments could be large and the issuer may face a problemmaking such a termination payment.
� Credit Enhancement – A Key Feature of All Securitisations
A common feature of all types of securitisation transactions is the use of creditenhancement, i.e. a cushion put in place to protect investors against expectedlosses. The credit enhancement is sized to reflect an expected loss leveldetermined under a series of adverse scenarios that could affect the asset poolduring its life.
The credit enhancement for a specific deal is usually a combination of severalforms of credit enhancement mechanisms and is a reflection of the specificcharacteristics of the securitised assets, the goals of the securitisation sponsor andthe requirements of the rating agencies.
Credit enhancement is normally sized by the rating agencies to help attain thedesired ratings for the securitisation notes. Senior asset-backed notes are usuallyassigned the highest rating (triple-A).
Internal or external credit enhancement for asset-backed notes is typicallycomplemented with structural investor protection built into the securitisationtransaction.
The credit enhancement and the other structural enhancements should amongstthem address most of the adverse eventualities that could affect the asset pool andthe securitisation bonds. Along with the legal protections they help create bondswhich are fundamentally different and more resilient than other fixed incomeinstruments.
� Forms of Credit Enhancement (CE)
One of the most essential elements in structuring an asset-backed security isestablishing adequate credit enhancement levels. The role of credit enhancementis to bridge the credit quality of the assets, which may be B or BB, to the level ofthe desired rating of the asset-backed security, generally AAA. The creditenhancement is sized to absorb the expected losses that the pool could experienceduring the life of the asset-backed security, down to a residual level correspondingwith the expected losses under the required rating level.
The credit enhancement can be structured in a number of different ways.
External - Provided by an Outside PartyIn the earlier stages of the development of the asset-backed market, the externalcredit enhancement prevailed. It is called external because it is provided by anoutside party, a bank opening a letter of credit (LOC) or an insurance companyand a monoline insurer providing a surety bond, or a company giving some otherform of guarantee. It would also take the form of a loan provided by a third partyand subordinated to the senior asset-backed bonds sold to investors.
The role of credit enhancementis to protect against the credit
risk of the assets and helpachieve the required rating of
the asset-backed security
In the earliest stages of themarket development, the
external credit enhancementprevailed

ABS/MBS/CMBS/CDO 101 – 16 July 2003
Refer to important disclosures at the end of this report. 22
Slide 9: Forms of Credit Enhancement
❏ External - provided by an outside party
➢ bank letter of credit
➢ insurance company surety bond
➢ financial assurance company guarantee
➢ subordinated loans from third party
❏ Internal - provided by originator or within the deal structure
➢ reserve account/refunded or build up from excess spread
➢ originators guarantee
➢ senior-subordinated structure
➢ excess spread
➢ overcollateralisation
➢ minimum required debt service coverage ratio (DSCR)
❏ Trigger events
Source: Merrill Lynch
However, it is important to remember that in the case of external creditenhancement the rating of the security has a direct link with the rating of the creditenhancer, whether it is a bank providing an LOC or an insurance companyproviding a surety bond. Any rating downgrade, any bad news, any volatility inthe quality or performance of the respective credit enhancer will have a directimpact on the performance or the rating of the insured securitisation bond.
Internal - Provided by Originator or Within the Deal StructureAs the market developed, a new type of credit enhancement emerged. This creditsupport is provided within the structure by the originator or through mechanismsinternal to the deal structure (subordination, overcollateralisation, etc). Theoriginator for instance, could provide some kind of a corporate guarantee for theasset-backed securities issued. Such a guarantee is typically attached to the mostjunior tranches of an asset-backed security for the purposes of improving theirrating and improving their distribution in the market place.
The most common form of internal credit enhancement is subordination.Subordination or ‘credit-tranching’, means that the cash flows generated by theassets are allocated with different priority to the different classes of notes in orderof their seniority. In case of subordination, the face value of the bonds is equal tothe value of the assets. The subordinate structures are known as asenior/subordinated structure, or also as a senior/mezzanine/subordinatedstructure. In a simple senior/subordinated structure the senior tranche is usuallyrated AAA and it receives the cash flow generated by the assets first, for thepurposes of interest and principal payment while the subordinated piece (alsocalled equity piece), receives cash flows second and absorbs the losses first. Thepriority of the cash flow distribution comes from the top, waterfall like, while thedistribution of the losses rises from the bottom.
In case of overcollateralisation, the value of the assets exceeds the face value ofthe notes. For instance, the assets can be purchased at a discount. The level of thediscount reflects the level of expected losses to be potentially incurred by theassets, as well as the level of deal expenses.
Another form of internal credit enhancement is the requirement that the cash flowsgenerated by the assets over a specified period of time exceed the debt servicerequirement of the bonds over the same period by a predetermined factor. The

ABS/MBS/CMBS/CDO 101 – 16 July 2003
Refer to important disclosures at the end of this report. 23
minimum required debt service coverage ratio (DSCR) it that factor. The revenuefrom the assets must exceed the debt service several times, thus allowing formonitoring performance and applying excess debt service to accelerate bondamortisation in case of adverse events affecting the transaction.
� Excess Spread Capture Mechanics
Slide 10: Calculation of Excess Spread
❏ Yield- revenue generated by the asset pool from interest payments and other charges -penalties, annual fees, etc.
Minus
❏ Coupon (interest paid under the securitisation bonds)
❏ Servicing fees (payments made to the servicer)
Net Yield
Minus
❏ Losses (or charge-offs, lost revenue of the asset pool due to defaults, shortfalls in assetliquidation proceeds, etc)
❏ Excess Spread
❏ Excess spread capture mechanisms
Base Rate
Source: Merrill Lynch
There is one additional aspect of credit enhancement, which rating agenciesfrequently do not take into consideration when they establish the required creditprotection level for a given rating. This is the excess spread. The assets in thesecuritised pool generate certain revenue, called revenue yield or gross yield. Theassets generate revenues, associated with the interest charges on the respectivedebt obligations in that pool. The revenue is used to cover the expenses of theSPV. The expenses are related to the coupon payments under the asset-backedsecurities to investors and payments to the other parties in the deal (like theservicing fee, the swap counterparty fee or letter of credit fee). Generally, thecombination of a coupon payment and servicing fee payment is known as the baserate in a structure. The difference between the revenue yield and the base rate orbase expenses is known as net yield.
The net yield absorbs one of the main ‘expenses’ in a securitisation, which are thepool losses. The excess spread is an indicator of the credit health of the asset poolsince the excess spread moves in the opposite direction of losses anddelinquencies. By deducting the losses from the net yield, we get the excessspread, also known as excess servicing fee. The excess spread generated in eachperiod could be used to cover losses produced in that period or in the next one, ifthere is any way to capture this excess spread and use it for in future.
Generally, the excess spread is remitted back to the originator when not needed.However, many structures have mechanisms in place to build up reserve accountsfrom excess to be used in case of pool performance deterioration. Thus, theexcess spread in each period, or excess spread captured through respectivemechanics in a reserve account, provide additional credit support for the asset-backed security. This additional credit enhancement is of particular importance toinvestors who are focusing on the mezzanine, subordinated and equity tranches.
The trigger events in an asset-backed security are structural enhancements in thetransaction and are often linked to certain credit events. Occurrence of specified
The excess spread reflects thehealth of the credit
performance of the asset pool

ABS/MBS/CMBS/CDO 101 – 16 July 2003
Refer to important disclosures at the end of this report. 24
events such as insolvency of originator or deterioration in pool credit qualityexpressed in increase in delinquency or loss levels or decrease in excess spread,triggers ‘early amortisation’, leading to an accelerated repayment of the notes.
� Credit Enhancement
Slide 11: Credit Enhancement
❏ Credit enhancement sized to protect against prolonged reductions in cash flow
➢ modelled on severe stress scenarios, conservative assumptions
➢ based on a multiple of historical losses
➢ adjusted for certain structural risks (e.g., commingling, set-off, servicer transfer, cashtransfer delays)
➢ level of enhancement commensurate with desired rating
❏ Differences in rating approaches
➢ ‘weak link’
➢ ‘expected loss’
Source: Merrill Lynch
We can recall that the credit enhancement is established to absorb expected lossesin the performance of the underlying pool of assets. It acts like a loss cushion thatis there to absorb the expected losses that the pool could accumulate during thelife of the asset-backed security. Consequently, to determine the creditenhancement the rating agencies try to predict the performance of the pool. Itsfuture performance depends on the initial pool quality, general development of theeconomy, the performance of the originator and the servicer, etc. In other words,certain assumptions about pool characteristics and how they can be affected by thefuture developments should be made to size the credit enhancement. One of thebest predictive tools available is the scenario analysis based on either probabilitydistribution of scenarios or on certain extreme (stress) scenarios.
The stress scenarios are generally related to the bankruptcy of the originator andassume that the asset pool incurs excessive losses. The bankruptcy of theoriginator is usually the stating assumption in sizing the credit enhancement; if theoriginator is also the servicer, the bankruptcy of the former would require thetransfer of the servicing function, and this would increase the pool losses. Theselosses then accumulate during the life of the pool beyond historical averages orextremes. The new line should reflect particular risks at a given pool, forexample, the risk of set off, commingling and others. In case of credit cards theoriginator may issue a credit card to a physical person who also holds depositswith the bank. In case the bank goes bankrupt, these deposits form part of itsbankruptcy estate, yet the individual can claim that his debt under the credit card(subject to securitisation) is off-set (extinguished) by the deposit he/she holds withthe bank (and now held in the bankruptcy estate); thus the credit cardsecuritisation pool incurs a loss equal to that deposit.
Furthermore, if the servicer is the originator, when accumulating the cash flowsfrom the assets transferred to the SPV, these collections, may be co-mingled, ormixed with collections from other assets of the originator. If the originator goesbankrupt it may be difficult to differentiate between the two cash flows, the onesthat belong and should be remitted to the asset-backed pool and the others thatbelong to the bank (and other creditors).
The credit enhancement is sizedto absorb expected losses in the
asset pool, backing the ABS
Credit enhancement is sized toprotect from certain risks:
commingling, set-off, servicetransfer, cash transfer delays

ABS/MBS/CMBS/CDO 101 – 16 July 2003
Refer to important disclosures at the end of this report. 25
Finally, the credit enhancement level, or the cushion sized to absorb the asset poollosses, should correspond to the required or expected credit rating under the asset-back securities: the respective rating requires different levels of creditenhancement: highest for AAA, lower for A and even lower for BBB or BBsecurity.
� Differences in Rating Approaches
We emphasise that the credit enhancement is determined by the rating agencies,after evaluating the current, historical and future performance of the pool of assetsbacking the securitisation bond. To establish its size though, the rating agenciesuse different approaches.
Some of them apply the expected loss approach, where they determine theexpected losses in the pool under various scenarios. Under this approach, theexpected severity of loss to investors as well as their frequency or probability ofoccurrence is determined. The rating agencies simulate the expected cash flowsthat the pool could generate, determining the potential losses that it couldaccumulate. Some go further and link the expected loss to the level of reductionof the internal rate of return (IRR) of the bond: the higher the IRR reduction, thelower the bond rating.
Other rating agencies base their assessment on the so-called weak link approach.Under this methodology, the rating agencies look at the confluence of differententities and assets in the structure and determine where the structure could ‘break’,that is, the weakest link in the chain of assets, counterparties and entities. Thefinal rating of the security cannot be higher than the weakest link in the structure.On that basis, the rating agency could determine the probability of first dollar loss.
‘Probability of first dollar loss’ is another rating approach, which can becontrasted to the ‘expected loss’ approach. Market convention differentiatesbetween the two by stating that the expected loss approach involves aconsideration of both probability of default and severity of loss on the liability sideof the securitisation, while first dollar loss approach considers only the probabilityof default, or other words, a missed dollar payment is considered a defaultregardless of the recovery (may be even equal to 100%) that could follow.
It is also important to understand that more often than not an asset-backed securityis rated by at least two rating agencies. Each of them may have a differentapproach and may focus on different factors or weigh differently the same factorsto determine the performance under stress scenarios and related expected loss.The credit enhancement which the respective asset-backed security carries is thehighest required by any one of the rating agencies in order to achieve the desiredbond rating. In this respect, it is worth investigating any split ratings that existespecially on lower-rated tranches of the securitisation bonds.
The level of credit enhancementcorresponds to the level of
desired rating
Expected loss approach
Weak link approach
First dollar loss

ABS/MBS/CMBS/CDO 101 – 16 July 2003
Refer to important disclosures at the end of this report. 26
2.3 Asset Classes and Basic SecuritisationStructures
The different classes of assets determine the different securitisation structures thatare available in the market. Almost any asset type can be securitised if it meetssome basic conditions. The broad variety of assets in general fits into twosecuritisation bond structures: revolving and amortising.
� Asset Classes
Slide 12: Selected Asset Classes
❏ Auto Loans
❏ Wholesale Auto Receivables
❏ Credit Card Receivables
❏ Home Equity Loans
❏ Manufactured Housing Contracts
❏ Recreational Vehicles
❏ Boat/Truck Loans
❏ Agricultural Equipment Loans
❏ Student Loans
❏ Trade Receivables
❏ Stranded Costs
❏ Auto Leases
❏ Aircraft and Computer Leases
❏ Reinsurance
❏ Tax Liens
❏ CBO’s/ CLO’s
❏ Commercial Real Estate
❏ Credit Card Voucher Receivables
❏ Workers’ Remittances
❏ Oil and Other Raw Materials Exports
❏ Project Finance
❏ Sports and Entertainment (Sales, TVRights)
Source: Merrill Lynch
Let us briefly talk about the asset types that can be securitised. On slide 15, onecan see a panoply of asset classes ranging from auto loans or credit cards all theway through TV rights, sports and entertainment contracts, exports and workersremittances. We generally talk about traditional and more esoteric, or non-traditional, asset types. But the range of different asset classes that have beensecuritised basically proves that pretty much any asset type can be securitised if itmeets a few basic conditions.
Some of these conditions are related to the ability to transfer the legal ownershipor entitlement to the benefits and losses of these assets by the originator to anotherparty for the benefit of the asset-backed investors. These assets should alsogenerate predictable and stable cash flows. Further, rating agencies usuallyrequire some historical performance data and performance track record of therespective assets in order to be able to quantify their credit risk and to size thecredit enhancement for the asset-backed deals. To illustrate these points we lookat the nature of corporate asset securitisation.
� Nature of the Assets Backing Corporate Securitisations
Corporate assets (as opposed to bank ones) present a particular challenge indetermining the type of securitisation they are subject to. Corporates have assetsof different nature:
• Some of them are existing assets, such as real estate or export receivables,trade receivables, vendor financing, generated based on the performance ofcertain, often contractual, obligations (goods exported, services performed,products shipped, etc.).
Almost any asset type can besecuritised, if it meets some
basic conditions

ABS/MBS/CMBS/CDO 101 – 16 July 2003
Refer to important disclosures at the end of this report. 27
• Others are future assets, such as export receivables, trade receivables, vendorfinancing, to be generated in the future based on the performance of some,often contracted today, obligations.
The key differentiating factor is whether the obligation has been performed, sothat the assets are existing now (current assets), or will be performed, so that theassets will be existing some time in the future (future assets). Hence:
• The current assets will be less dependent on the corporate originator, becauseit has already performed its obligations and the assets are in existence – now,it is a matter of collection or obligation performance by the counterpart(importer, buyer). So, the linkage with the originator is limited if theoriginator is also the servicer and to the degree a real servicer replacement isavailable.
• The future assets will be more dependent on the corporate originator, becauseit has to perform its obligations in the future in order to generate the assets(export the products, ship the goods, perform the services such as deliverelectricity for example). If the originator does not exist in the future, therewill be no assets backing the securitisation. So, the linkage to thecreditworthiness expressed through the credit rating of the originators isalmost 100%. We say ‘almost’ because the credit rating expresses theprobability of default on a financial obligation, and not necessarily on acontractual obligation – a company may be in a financial default, but stillcontinue to perform services to clients and thus generate receivables.
Hence, the linkage of the securitisation bonds’ rating with the corporate rating ofthe originator in the second case is much stronger than in the first case. Case inpoint, EDF transaction in comparison to Cremonini deal (Italian trade receivablesdeal priced last week).
Another Issue is the Value of the Assets Backing the Corporate Securitisation.Deals may be structured on the basis of existing receivables (Cremonini), futurereceivables (EDF) or a mixture of both (Chargeur). A revolving feature added tothe existing receivables securitisation does not change their nature – every newpurchase of receivables involves existing receivables.
We suggest a simple calculation to determine corporate linkage and exposure: areview whether the corporate receivables’ face value is higher, equal or less thanthe bonds’ face value:
• If the existing receivables’ value is higher (bond is structured with over-collateralisation) or equal (bond is structured with subordination) than thebond’s face value, then the corporate linkage is low – securitisation bondrating will stand alone dependent more on the credit quality of thereceivables, than on the credit quality of the originator.
• If the existing receivables value is less than the bond’s face value or the bondis backed by future receivables whose generation depends on the performanceof the originator, then the corporate linkage is high – the securitisation bondrating will be almost fully linked to that of the originator.
The above has credit analysis, rating and pricing implications:
• In the first case, the focus is on the credit quality of the assets and linkage toservicer, hence the pricing should be more independent of the pricing of theoriginator’s stand-alone bonds.
• In the second case, the focus is on the credit quality of the originator andsecondarily on the credit quality of the assets, hence the pricing of thesecuritisation bonds should be closely linked to the pricing of the corporate’sstand-alone bonds.
• Furthermore, the rating of the securitisation bonds in the first case should befairly independent from the rating of the corporate sponsor, while in thesecond case it will not only be highly dependent on day one, but will be asvolatile during the life of the transaction as that of the corporate.

ABS/MBS/CMBS/CDO 101 – 16 July 2003
Refer to important disclosures at the end of this report. 28
� Basic Structure Types
The different asset classes give rise to different ABS and MBS structures. Theimportant element in these structures is to match the cash flows generated by theassets with the cash flows required to service the asset-backed security. It isalmost like asset and liability matching in a balance sheet situation.
Slide 13: Basic Structure Types
ABSABS
HYBRIDHYBRIDPASSTHROUGH
Amortising
PASSTHROUGH
Amortising
REVOLVING
Bullet/Cont.Am.
REVOLVING
Bullet/Cont.Am.
HELOCsTrade Receivables
HELOCsTrade Receivables
MBSHELs
Auto LoansAuto Leases
MBSHELs
Auto LoansAuto Leases
Credit CardsFloorplan
Trade ReceivablesCLO/CBOs
Credit CardsFloorplan
Trade ReceivablesCLO/CBOs
Source: Merrill Lynch
There are two basic asset-backed securities structures: the revolving structures,and the pass through structure.
Revolving StructuresIn most general terms, the revolving structure is applied when a pool of short-termassets is used to back a longer-term asset-backed security. Let us say, a pool ofcredit cards or trade receivables, which have a life of between 60 and 120 days, isused to back five-year credit card or trade receivables asset-backed notes. Thepool of assets generates interest and principal, and how and when the principal isdistributed to investors is the main differentiating feature of the respectivestructure applied. In the case of a revolving structure, the principal generated isused to purchase new receivables during a specified period of time (the revolvingperiod) and is applied afterwards to repay the bonds.
Collected principal is used topurchase new assets, whichextends the maturity of the
underlying pool and the notes itsupports

ABS/MBS/CMBS/CDO 101 – 16 July 2003
Refer to important disclosures at the end of this report. 29
Slide 14: Revolving ABS Cashflows
Bullet – One payment at the end of last year.
Controlled Amortisation – 12 equal monthly payments over the last year.
Year
0
2
4
6
8
10
12
1 2 3 4 5
Payments
Interest Only (Revolving)
BulletControlled Amortisation
Source: Merrill Lynch
Generally, these revolving structures incorporate two periods. The first period isthe revolving period. During the revolving period the principal under the asset-backed security remains outstanding in full and the investors receive only interestpayments. This reflects the cash flows generated by the assets. The revenue orthe yield generated by the assets is used to pay interest to investors (coupon) andall the other expenses we talked about – servicing fee, LOC provider fees, losses.The principal is used to purchase new receivables. This could continue for anumber of years, and in our example on slide 17, it continues for four years.
The question now is, once the revolving period is over, how do we applyprincipal? One way of using principal is to deposit it into a reserve account, andgenerally, we refer to this as principal accumulation period, an accumulationperiod. We accumulate principal in a reserve account in order to pay the asset-backed security at its maturity through a soft bullet payment. In other words, wehave a revolving/accumulation/soft bullet structure.
In other cases, instead of accumulating the principal in a reserve account, we canstart paying it out in regular instalments to investors. In other words, a revolvingperiod is followed by controlled amortisation and investors receive their principalback in several regular equal instalments. This is referred to as controlledamortisation period. Alternatively, we have a revolving/controlled amortisationstructure.
� Early Amortisation Triggers
Essential features in these structures are the early amortisation events or triggers.During the revolving period, the principal is applied to buy new receivables. If theoriginator of those receivables goes bankrupt, there will be no receivables togenerate and there will be no receivables to be purchased with the principalcollected. The solution then is to start passing through the principal to investors.In other words, certain events (or the trigger event), ‘trigger’ the amortisation ofthe bonds on a pass through basis. All principal, as collected, is passed through toinvestors to pay down the asset-backed notes. The early amortisation event couldoccur at any point in time during the revolving period, the accumulation period orthe controlled amortisation period.

ABS/MBS/CMBS/CDO 101 – 16 July 2003
Refer to important disclosures at the end of this report. 30
Examples of typical amortisation events are shown on Slide 15. Some of them arerelated to the originator or the servicer in the transaction, but others are more‘economic’ in nature, for example, the deterioration of the excess spread below acertain level or the increase of pool losses above a given level.
Slide 15: Typical Amortisation (Payout) Events
❏ Deterioration of net portfolio yield / net excess yield triggers
❏ Originator / servicer insolvency
❏ Failure to pay principal on expected payment date
❏ Minimum seller interest triggers
❏ Bank breach of representations and warranties
❏ Failure to transfer funds
❏ Failure to replace interest rate cap provider in the event of rating reduction belowrequired level
Source: Merrill Lynch
As we discussed earlier, the difference between the revenue generated by theassets and the expenses needed under the asset-backed security provides excessspread. If this excess spread goes below a certain level, this indicates deteriorationin the pool performance. In order to protect investors against further deterioration,an early amortisation of the bond is triggered. The revolving or accumulationperiod is over, and now principal is passed through directly to investors and theycan still benefit from the remaining excess spread generated in the structure.
Just to illustrate this with numbers, let’s assume that the trigger is set at 3%. Ifduring the revolving period the excess spread varies between 4% and 6%, thestructure is OK. If the excess spread falls below 4%, it signals deterioration andindicates a risk of the excess spread trigger being breached. When the excessspread reaches 3% the trigger is breached and the early amortisation begins. Theexcess spread trigger is usually set on a three-month rolling average basis, whichmeans that if in any one month excess spread is below 3% and in the other twomonths of a three-month period it is above 3%, so that the average is above 3%,there will be no early amortisation. This protects against one-off adverse eventsand seasonal fluctuations.
Pass-Through StructuresOn the other side of the structural spectrum is the pass through structure where theprincipal, instead of applied to purchase new receivables, is passed through toinvestors to repay gradually the outstanding amount of the asset or mortgage-backed securities. Assets with longer maturities include mortgages, auto loans andhome equity loans. Because they have a longer amortisation horizon, generallythey are used to structure longer-term pass-through securities. Again, this is inmost generic terms.
Now let us briefly look at the pass through structures. In the case of pass throughstructures, the principal collected from the assets is passed directly through toinvestors to pay down the bonds. Slide 19 shows the repayment schedule of atypical pass-through structure (or a typical loan underlying such structure).
Early amortisation triggers areestablished to protect investors
against further deterioration ofthe underlying pool

ABS/MBS/CMBS/CDO 101 – 16 July 2003
Refer to important disclosures at the end of this report. 31
You have probably seen this graph in any textbook dealing with mortgage or autoloans, where it shows how such a loan amortises.
Slide 16: Pass-Through Securities
0
200
400
600
800
1000
1200
1400
1600
1800
2000
1 2 3 4 5 6 7 8 9 10 11 12 13 14 15 16 17 18 19 20 21 22 23 24 25 26
Time
Monthly Payments
Principal
Interest
Stylised Repayments Schedule for Pass-Through Security
Source: Merrill Lynch
In the case of a level pay loan, the borrower makes an equal payment every month,which is split between interest and principal. Usually, in the earlier stages of thelife of the loan, more of this payment is allocated to interest and less to principal,and as the loan amortises more payment is allocated to principal and less tointerest. From the point of view of the borrower, the borrower pays more interestat the beginning and more principal later on, which means that later on theborrower acquires more equity in the asset and has higher motivation to continuepaying the loan.
Constant (Conditional) Prepayment Rate (CPR)Many of the auto loans and mortgage loans allow borrowers to prepay. One of themain reasons borrowers prepay is because they can obtain a cheaper financing forthe respective house or car, which usually happens when interest rates go down orprice competition among lenders increases. So, at any stage in the life of amortgage, the borrower could take a new mortgage and prepay the outstandingamount of the old ones. This is probably all good and clean from the point ofview of the borrower. However, from the point of view of the investor in amortgage-backed security, this means that the investor receives back the principalmuch earlier than expected. If this happened while interest rates are falling, theinvestor in a mortgage-backed security would be exposed to higher reinvestmentrisk and convexity risk.
Hence, a key element in determining the payment profile of such pass-throughsecurities is the determination of the constant prepayment speed for the purposesof pricing the security. The CPR states the average speed at which an investorshould expect to receive principal back.
The CPR is established as an average over a certain horizon, while in real life theprepayment rate varies from month to month. The monthly prepayment rate couldvary due to changes in the interest rate environment, the industry, as well as due toseasonal developments. For example, competition in mortgage lending, couldforce mortgage lenders to lower the price of a mortgage loan, and could also makeborrowers more aware of their refinancing options. That would speed up
An essential element whendetermining the payment profile
is to establish the CPR

ABS/MBS/CMBS/CDO 101 – 16 July 2003
Refer to important disclosures at the end of this report. 32
refinancing of the loans. Specific industry events or tax considerations couldintroduce definite pattern of seasonal changes. Another factor would be theexistence of prepayment penalties and their enforceabilities. Generally, borrowersfacing high prepayment penalties are less willing to refinance their loans.However, if the interest rates drop sharply and there are other legal or structuralelements in the mortgage, (say, reset dates when they are allowed to prepaywithout penalty) the borrower may consider refinancing the mortgage even ifshe/he has to pay a prepayment penalty.
Other elements driving prepayments could also be related to the demographics of agiven country or people moving from one city to another: in the US from the EastCoast to the West Coast; in the Euro-zone, relocating for jobs or other purposes,which has not happened on a large scale yet. In other words, when investors considerbuying pass through amortising bonds, (especially if they have fixed rate coupons)investors are facing prepayments risk and have to understand clearly what factorsdrive prepayment in the underlying assets. To sum up, prepayments are important indetermining the maturity of a floating rate pass-thorough securitisation bond, and theconvexity and maturity of a fixed rate pass-through securitisation bond.

ABS/MBS/CMBS/CDO 101 – 16 July 2003
Refer to important disclosures at the end of this report. 33
2.4 Benefits and Potential Drawbacks of Securitisation
The most often touted benefits of securitisation are for issuers the ability to raiseoff-balance sheet financing and to diversify funding sources, and for investors –the ability to pick up yield while buying bonds based on credit enhanced, well-diversified assets pools. However, securitisation can have drawbacks for bothissuers and investors if not properly executed or not fully understood.
� Securitisation Sponsors
Slide 17: Securitisation Sponsors
❏ Banks
➢ assets on their balance sheet, risk transfers
❏ Companies
➢ trade receivables, exports
❏ Project Finance
➢ cash flow stream generated post completion
❏ Municipalities
➢ tax liens, social security contributions, parking tickets
➢ revenues from a specified entity - toll road, bridge, hospital, etc.
❏ Real estate developers
➢ commercial real estate (offices, shopping malls, hotels, etc.)
❏ Countries
➢ privatisation (PFI in the UK)
➢ export credits, external credits, etc.
Source: Merrill Lynch
Banks - Consumer and Corporate Loans, Mortgages, Real estateBanks are the most obvious candidates for securitisation. They have assets ontheir balance sheet and want to transfer them to raise funding. In addition, theycan transfer the risk associated with these assets through their sale or other means.By doing that, banks release some of the regulatory capital they hold against thoseassets.
Companies - Trade Receivables, ExportsCompanies have assets in the form of trade receivables, export receivables or anyother assets (real estate) that could be used in securitisation transactions, for thepurposes of financing and streamlining their balance sheet.
Project Finance - Cash Flow Stream Generated Post CompletionAfter the completion, a project generates sizeable stable cash flows that can beused for the purposes of securitisation. It is also possible early in the constructionphase to leverage the cash flows to be generated post completion.
Income from Public Entities - Tax Liens, Social Security Contributions andTollsMunicipalities generate stable cash flows and possess certain assets that can besecuritised, such as tax liens, social security contributions, parking tickets and taximedallions. Public institutions may also sponsor specific projects such as tollroads, bridges or hospitals. Municipal assets also can be subjected ofsecuritisation whether they are in the form of existing assets and related cashflows (like tax liens, social security contributions, government reimbursements fortaxes collected), or assets which will be generated in the future (like fees fromcrossing a bridge or for using a toll road).

ABS/MBS/CMBS/CDO 101 – 16 July 2003
Refer to important disclosures at the end of this report. 34
Real Estate Developers - Commercial Real EstateReal estate developers have commercial real estates, offices, shopping malls,hotels that generate rental and capital income. Many banks also hold on theirbalance sheets respective real estate assets. Such assets can be subject tocommercial mortgage-backed securities or commercial real estate securitisations.
Countries - Privatisations, Export Credits, External Credits, etc.Countries have export credits, different assets that they may want to privatise (aswas the case in the UK with the Private Finance Initiative [PFI]). These assetscould be securitised or the purchase of these assets by another entity, privatisationcould be financed through securitisation.
� Incentives for Securitisation – The Originator’s Perspective
Slide 18: Securitisation – Benefits for Originators
❏ Off-balance sheet financing
❏ Regulatory treatment (regulatory arbitrage) for banks
➢ off-balance sheet treatment allowed by regulators - by transferring risk capital is‘freed up’ (equity relief) - “cost of securitisation < cost of capital”
➢ asset transfer off-balance sheet reduces leverage and improves ROE
❏ Alternative source of liquidity
➢ diversified funding mix
➢ reduced correlation between the financial performance of the issuer and the riskof the assets
❏ Exposure management
➢ transferring loans from credit lines where exposure limits have been reached
❏ Removal of illiquid assets from loan book
❏ Transfer uncertainties related to loan prepayments to investors (improve maturitymanagement)
❏ Achieve better pricing (through higher debt rating) or longer term financing especially forcross-border securitisations
Why securitise?
Source: Merrill Lynch
Off-balance sheet financing securitisation allows companies and banks to raisefinancing off-balance sheet, by monetising their currently existing or future assets.Such financing, especially given its non recourse nature most of the time, is notrecorded as debt and does not affect their financial ratios.
Regulatory Treatment (Regulatory Arbitrage) for BanksWe already briefly referred to the banks’ need for regulatory capital relief. Whenselling assets off-balance sheet the banks gain off-balance sheet funding (fundingagainst their assets or monetisation of their assets). Also by transferring theseassets or risk associated with them away from their balance sheets, they free upregulatory capital, receiving equity relief. The asset transfer off the balance sheetreduces the leverage and improves the return on equity. In order for securitisationto make economic sense, the cost of securitisation should be less than the cost ofequity for the bank. That may or may not be the case, yet there are other benefitsfrom securitisation for the banks.
Alternative Sources of Liquidity and Diversified Funding MixThrough securitisation banks and companies can access alternative sources ofliquidity and diversify their funding mix reducing the correlation between theirown financial and the risks of the assets – a point we made earlier. A lower creditquality bank or company, say B or BB, faces very high funding spreads. Thisissuer may reduce such funding spreads by issuing asset-backed securities, whichfeaturing a AAA rating would be priced much tighter.
Off-balance sheet treatmentallowed by regulators - by
transferring risk, capital is‘freed up’ (equity relief)
Dependence on traditionalsources of funding is reduced
ABS/MBS/CMBS/CDO 101 – 16 July 2003
Refer to important disclosures at the end of this report. 35
Exposure ManagementBanks and companies have certain exposure limits or credit lines, specified limitsfor their credit exposure to different entities. By transferring loans off its balancesheet, or transferring risk associated with some of their loans and other assets, thebanks could free their credit lines and avoid breaching their credit limits. Theycan free up the lines for further lending to the respective sectors or clients.
Removal of Illiquid Assets from Loan BookBanks and companies can remove illiquid assets from their balance sheets, as isthe case with non-performing or sub-performing loans (NPL), and sub-performingreal estate. Securitisation is often the solution for banks burdened by NPL and anacute need to sanitise their balance sheet. Companies that have accumulated largeamounts of real estate may want to focus on their core businesses, but retain use oftheir real estate assets without burdening their balance sheets. They can transferthose assets through securitisation by selling real estate and leasing it back to theirown rise.
Transfer Uncertainties Related to Loan Prepayments to InvestorsWhen finance companies and banks lend for mortgages, they are exposed to theinterest risk of those loans, expressed in their prepayment behaviour. Normally,when interest rates fall mortgage borrowers tend to refinance their mortgages, i.e.taking a new mortgage with a lower interest rate, and using its proceeds to repayin full the old mortgage loan. This creates prepayment risk for the banks on theirbalance sheets, and requires more active management of their assets. Bytransferring such assets away, the banks transfer the related prepayments risk,simplify, and improve the maturity management of their balance sheet.
Achieve Better Pricing (Through Higher Debt Rating)With certain types of structures, like future flow deals (say in the case of exportsfrom emerging markets), highly rated companies in lower rated countries can raisedebt at better terms than the respective sovereign ceiling would allow them to doon a straight corporate bond basis. This is achieved by structuring a deal, wherethe cash flows are generated by exports denominated in hard currency andcaptured offshore. The deal can be structured with a rating above the sovereignceiling of that country, usually at the level of the credit rating of the exporter on astand-alone basis, and the bond may have much longer maturity that theirrespective country or exporter would normally get under straight bond funding.
Transfer of loans from creditlines where exposure limits
have been reached
Increased liquidity
Improvement of risk and asset-liability management
Better pricing and longer termfinancing especially for cross-
border securitisation

ABS/MBS/CMBS/CDO 101 – 16 July 2003
Refer to important disclosures at the end of this report. 36
Slide 19: Bank Securitisation – a Numerical Example
Portfolio (100)
Yield: L+35bpLosses:6bp pa.
Portfolio (100)
Yield: L+35bpLosses:6bp pa.
AAA ratedSenior Debt
(91.5)
L+11bp
AAA ratedSenior Debt
(91.5)
L+11bp
Junior Debt (7.5)L+40bp
Junior Debt (7.5)L+40bp
AA rated SeniorDebt(92)
L+15bp
AA rated SeniorDebt(92)
L+15bp
Tier 2 (4)L+60bp
Tier 2 (4)L+60bp
Equity (4)Equity (4) Tier 2 (0.5) L+60Tier 2 (0.5) L+60
Equity (0.5)Equity (0.5)
VS
Assets Bank Funded ABS Funded
Assumes LIBOR = 5% Bank Funded ABS FundedFunding Cost = 4.96% Funding Cost = 5.12%
Net Income = 5.29% Profit = 0.33% Profit = 0.17%ROE = 8.25% ROE = 34%
Source: Merrill Lynch
We discussed the different motivations different types of issuers may have toresort to asset-backed financing. We conclude this discussion with a numericalexample, which illustrates the effect on securitisation on bank ROE, to describethe benefits for the banks. We show in Slide 24 a pool of assets that a bank canfund in a traditional way - through a bank loan, or innovatively - through ABS.There are two important points to note in the table: the funding cost and theresulting ROE under the two different funding alternatives.
It is obvious that the asset-backed funding may be slightly more expensive thanthe bank funding. On the other hand, it results in a much higher return on equitythan the bank funding. In this general example, the asset-backed funding achievesa ROE of 34% versus 8.25% in the case of traditional funding sources, i.e. ROEincreases roughly four times using securitisation. This is a very important issue, inthe context of merger and acquisition activities, and growing shareholderdemands.
Securitisation helps to improvereturn on equity

ABS/MBS/CMBS/CDO 101 – 16 July 2003
Refer to important disclosures at the end of this report. 37
� Potential Drawbacks of Securitisation
We looked at the incentives banks and companies have to securitise as well as therelated derived benefits. Securitisation also has some potential shortcomings andnegative aspects.
Retaining the First Loss PositionIn many securitisations the banks or the companies retain the most junior piece inthe bond structure. As we discussed earlier, cash flows generated by the pool aredistributed from the top, from the senior tranche downwards, whereas the lossesare absorbed from the bottom, from the junior tranche upwards. A bank or acompany retaining the junior equity piece is in a first loss position and in onesmall piece, retains the concentrated losses of the large pool of assets it has sold.When an entity relies heavily on securitisation by retaining more equity tranches itincreases its effective leverage of the balance sheet. One of the best ways to avoidthat is to find a way to sell the equity piece to investors willing to assume theassociated risks.
Slide 20: Bank Securitisation
❏ Company retains its first loss position
➢ increased effective leverage of the firm to the detriment of unsecured creditors
➢ by transferring assets off-balance sheet leverage declines even though no materialchange has occurred in the capital structure and no material transfer of risk hastaken place
➢ company transfer of its best assets results in a deterioration of its balance sheet andrisk profile
❏ Company’s commitment to support securitisation
❏ Over-reliance on securitisation
❏ Asset risk transference can be achieved through other means - monoline wraps, syntheticstructures
Why not to securitise? Or…how not to securitise?
Source: Merrill Lynch
Over-reliance on SecuritisationIf a company heavily relies on securitisation, it will be determined to maintainhigh levels of performance of the securitised assets at any cost. Performance ofany given asset pool securitisation bond below expectations would make it moredifficult for that company to access the securitisation market in the future. Toavoid that the originator may be willing to take some residual risk in the asset poolor to step in to support the asset pool performance. In other words, the originatormay indirectly allow for partial recourse, which is not really the stated purpose ofsecuritisation and may provoke regulators’ objections.
Asset Risk Transfer Can Be Achieved Through Other MeansFinally, the transfer of risk associated with a given pool of assets could beachieved without selling the assets, but simply by the transfer of that risk throughcredit default swaps in credit structures, or insuring that risk with an insurancepolicy for an outside insurer or guarantor. We are referring here to securitisationmethods – synthetic and insured structures, different from the traditionalsecuritisation based on asset sale.

ABS/MBS/CMBS/CDO 101 – 16 July 2003
Refer to important disclosures at the end of this report. 38
2.5. ABS/MBS Investors and Their Considerations
It is important to underline the broad range of investors in the securitisationmarket and the dominant role of banks in that context. The benefits ofsecuritisation relative to other fixed income papers undoubtedly attract ever-increasing number of ABS investors.
� Investors in Non-US ABS/MBS
Slide 21-24 presents indicative investor distribution for non-US ABS and MBS in2002. Two features clearly stand out. Firstly, banks continue to be the biggestinvestors in asset and mortgage-backed securities. Nevertheless, the role ofinvestment advisers and commercial paper (CP) conduits has been growing,representing 20% and 10% of the investor base for new issuance. We have tostress the role of the CP conduits, as in CP conduits we include two different typesof entities: the asset-backed commercial paper conduits, which focus exclusivelyon purchasing bond portfolios and funding them with CP, and the stand-alonesecurities finance companies, the likes of Beta, Sigma, Centauri, K2, Links, and soon, which also purchase substantial amounts of asset-backed securities.
Two other entities on this pie chart are worth mentioning, the insurance companiesand the pension funds. Their share of the purchases of new issuance of asset-backed securities has been gradually growing over the years, and it may also haveinfluenced the structures of the securities issued. Traditionally, asset-backed
Chart 21: Tentative ABS Investors Distribution by Country Chart 22: Tentative Investor Distribution by Investor Type
UK30%
Germany / Austria18%
France15%
Benelux14%
Iberia4%
Italy6%
Ireland6%
Rest of the World4%
Scandinavia3%
Banks43%
Insurance Co.s12%Pension Funds
3%
Sovereign / Supranationals / Govt Agencies
3%
Other8%
Asset Managers20%
Corporates1%
SIV10%
Source: Merrill Lynch Source: Merrill Lynch
Chart 23: Tentative Corporate Bond Investors by Country Chart 24: Title Tentative Corporate Bond Investors Distributionby Investor Type
UK18%
France17%
Germany / Austria27%
Scandinavia5%
Rest of the World2%
Ireland1%Italy
12%
Iberia10%
Benelux8%
Banks15%
Insurance Co.s18%
Pension Funds6%
SIV0%
Corporates2%
Asset Managers57%
Other2%
Source: Merrill Lynch Source: Merrill Lynch
Banks continue to be thebiggest investor in ABS/MBS
The share of insurancecompanies and the pension
funds has been graduallygrowing over the years

ABS/MBS/CMBS/CDO 101 – 16 July 2003
Refer to important disclosures at the end of this report. 39
securities in Europe are issued as floating rate pass-through notes. With thedemand of the insurance companies and pension funds for ABS/MBS increasing,more of them are issued as fixed rate bullet notes, as these are the structures whichinsurance companies and pension funds tend to buy, given their asset/liabilitystructure.
In terms of geographic distribution of new issuance of non-US asset andmortgage-backed securities, the UK and Irish investors prevail and account forroughly 40% of the placements. The role of German, French and Italian investors,though, has been growing fast in recent years, while the Benelux countries alreadyhave a group of well established sophisticated investors for this type of securities.
We have to emphasise the rapid development of the investor base since theintroduction of the Euro. As the currencies were eliminated and 11 countries inEurope started functioning as one Eurozone market, investors who traditionallyfocused on their domestic bonds due to currency considerations are now able topurchase Euro denominated asset-backed securities from issuers domiciled in anycountry in the Eurozone. In addition, with the rapid development of securitisationwithin the Eurozone and the affirmation of the Euro as a reserve currency, there isincreasing demand for Eurozone ABS and MBS from non-European investors.
� Investor Considerations
Slide 25: Investor Considerations
❏ Attractiveness of ABS investments
➢ a diversified pool of consumer or corporate assets
➢ built-in structural and legal protections
➢ credit enhancement reflecting multiple performance scenarios
➢ limitations for sovereign risk exposure
❏ Diversification tool
❏ Defensive investment
❏ Higher risk-adjusted returns
❏ Rating Stability
Source: Merrill Lynch
Attractiveness of ABS InvestmentsAsset-backed securities are attractive to investors because they give themexposure to a diversified pool of consumer or corporate assets. Instead of buyingloans or bonds in a number of industries or geographic areas and building up sucha portfolio alone, investors could simply buy into a CLO, a collateralised loanobligation, which is already such a portfolio. They could also buy into adiversified pool of consumer loans, be it through a credit card, mortgage or autoloan-backed security.
In addition, each of the securities has built-in structural and legal protections wediscussed earlier, and are also structured to withstand levels of losses sized undernegative future scenarios. This certainly limits the risks, especially for the seniorinvestors in the asset-backed structure. Investors buying into asset-backed orfuture flow securities from emerging markets are acquiring bonds with reducedcurrency and sovereign risks.
UK and Irish investors prevailwith roughly 40% of the
placements

ABS/MBS/CMBS/CDO 101 – 16 July 2003
Refer to important disclosures at the end of this report. 40
Diversification ToolBuying into an asset or mortgage-backed security is definitely a diversificationtool when managing a broad portfolio of fixed income instruments. In addition,asset-backed securities generally price wider than comparable corporate bonds,which gives them attractive higher risk adjusted returns.
Rating StabilityHistorically asset-backed securities ratings have been demonstrated to be generallystable. There is lower rating volatility in the asset-backed bonds world than in thecorporate or bank bonds world. This is to a large degree because these securitiesalready have built in credit and structural enhancements, as discussed earlier.
ABS/MBS/CMBS/CDO 101 – 16 July 2003
Refer to important disclosures at the end of this report. 41
3. Rating Stability of StructuredFinance Bonds

ABS/MBS/CMBS/CDO 101 – 16 July 2003
Refer to important disclosures at the end of this report. 42
Rating agencies rating transition studies have long been a key investmentdecision making tool. In this regard, every new study is anticipated with greatinterest – even more so, in difficult years for the market. The catch, however, isthat even if the results presented by the studies are positive, investors, andparticularly those who have experienced problems, remain sceptical. And that isnatural – even when the averages are good, there are extremes with bothpositive and negative signs, and the individual investor’s perception depends onunder which sign s/he happens to be.
3.1 Moody’s ABS Rating Transition Study 2002 –Many Things to Write Home About!
This year’s Moody’s rating structured finance transition study ‘Structured FinanceRating Transitions: 1983 – 2002’ published in January 2003 is an exception inseveral respects. First, it is much more detailed and comprehensive than everbefore. Secondly, it brings much needed good news (contrary to the expectations,we would say) for structured finance investors. Thirdly, it deepens thecomparative analysis between structured finance and corporate bond ratings, aswell as the comparisons within the structured finance sector itself. These are allstrong points! Where the study is a bit weak is on the interpretations of theobserved rating behaviors. To fully understand them, one has to sift through otherMoody’s reports – alas, they exist!
While we encourage everyone to read the study for oneself, we undertake to shareour read of the study. We follow the transition report as it unfolds and providesome of the conclusions and our associated comments.
Given the volume of the study, we plan to provide a series of commentaries on itsdifferent aspects. In this first instalment we focus on the study’s data pool andmore general rating transitions findings.
Let’s start with the study methodology and the data pool. Here one familiar withthe performance of the structured finance market to-date can detect the early signsof the results to come. Let’s look at the data (see Tables 1 and 2):
• Structured finance ratings are predominantly – close to 90% - investmentgrade, with predominance of Aaa‘s –about a third, while in corporate financeslightly above half are investment grade – a quarter of them Baa, and morethan 40% are speculative grade.
- This reflects the nature of the two different sectors: structured financedeals are ‘structured’ to achieve a certain rating – preferably the highest,while corporate finance ratings reflect the creditworthiness of therespective company as a going concern.
- It also raises questions about the validity of comparisons of the twosectors, particularly in the sub-investment grade area – too few structuredfinance ratings to derive viable comparisons with corporate high yieldratings.
• The number of ratings differs substantially between structured finance andcorporate finance. The former are related to the number of securities(approximation for tranches) and the latter – to number of the corporateissuers. This, along with the growth of the structured finance market in recentyears, explains the significantly larger (by a factor of almost 5) ratinguniverse in structured finance compared to corporate finance. If we comparethe number of structured finance deals to the number of corporate issuers, thedifferential is much smaller (5136 vs. 2950).
- A question remains unanswered here and that is – how are the ratings ofdifferent categories of debt of a given corporate issuer treated? Thecapital structured of a corporate issuer has numerous layers of debt, at aminimum three – senior secured, senior unsecured and subordinated debt,and each has a different rating level with a differential as high as 3 - 5notches.

ABS/MBS/CMBS/CDO 101 – 16 July 2003
Refer to important disclosures at the end of this report. 43
- The answer to the above question above should be used in theinterpretation of the contemporaneous rating change dependencydiscussed in the report with regards to structured finance, but notanalyzed for corporate finance – that is, the likelihood that if one trancheof a securitization transaction is downgraded other tranches will bedowngraded as well. That should be true for the different ratedcategories of debt for corporates, but it is unclear how it is reflected in thestudy, if at all.
• The composition of the structured finance ratings across sectors hasdramatically changed over time – from highly weighted in favor of MBS to amore balanced distribution across sectors.
- It is worth noting, however, that the overwhelming majority of structuredfinance ratings are assigned to transactions based on pools of securedloans (RMBS, HEL, CMBS).
- The composition also shows the much higher weight of the traditionalsecuritization (ABS, RMBS and one can argue CMBS) vs. the newercategories (CDOs and ‘others’). One should relate to that theconsiderably different structures and motivations underlying theexecution of the traditional and non-traditional structured financings –food for thought when interpreting rating performance.
- Structured finance ratings include securities whose ratings can beinfluenced by the ratings of two or more securities or issuers, even if oneplays a dominant role. In practical terms that means that ratings highlydependent on corporate or sovereign entity are included in the study andmay to some degree distort the results – example, rating transitions oftranches guaranteed by Green Tree/ Conseco have a serious impact on theBaa rating transition levels; another example – structured ratings subjectto sovereign ceiling in emerging markets.
Table 1: Distribution of Structured Finance and Corporate Finance Ratings
Ratings Structured Finance Corporate Finance1/1/85 1/1/90 1/1/95 1/1/00 1/1/02 1/1/85 1/1/90 1/1/95 1/1/00 1/1/02
Aaa 91.7% 36.4% 41.5% 35.4% 33.2% 3.5% 3.7% 2.5% 1.4% 1.5%Aa 0.0% 58.2% 28.2% 16.9% 16.2% 17.4% 10.0% 10.1% 8.3% 10.3%A 8.3% 1.8% 13.7% 20.0% 20.3% 31.2% 24.4% 27.6% 21.9% 22.4%Baa 0.0% 2.9% 10.9% 16.2% 17.4% 17.1% 15.1% 18.6% 22.1% 24.3%Ba 0.0% 0.5% 3.7% 6.2% 7.7% 18.0% 22.1% 17.0% 11.9% 11.5%B 0.0% 0.0% 1.7% 3.7% 3.7% 9.8% 19.6% 18.8% 25.2% 19.6%Caa-C 0.0% 0.2% 0.3% 1.6% 1.6% 3.0% 5.2% 5.4% 9.3% 10.4%InvestmentGrade
100% 99.4% 94.3% 88.6% 87.1% 69.2% 53.1% 58.8% 53.7% 58.5%
SpeculativeGrade
0.0% 0.6% 5.7% 11.4% 12.9% 30.8% 46.9% 41.2% 46.3% 41.5%
Total ratingsoutstanding
12 649 3325 8201 12296 1585 2119 2200 3149 2950
Source: Moody’s Investors Service

ABS/MBS/CMBS/CDO 101 – 16 July 2003
Refer to important disclosures at the end of this report. 44
Table 2: Distribution of Structured Finance Ratings and Deals by Sector
Ratings Structured Finance Ratings Structured Finance Deals1/1/85 1/1/90 1/1/95 1/1/00 1/1/02 1/1/85 1/1/90 1/1/95 1/1/00 1/1/02
ABS 8.3% 18.6% 23.9% 36.7% 35.6% 8.3% 18.3% 25.7% 38.6% 38.8%CDO 0.0% 0.0% 2.0% 9.3% 14.5% 0.0% 0.0% 2.5% 8.0% 12.3%CMBS 0.0% 1.4% 5.1% 13.4% 16.5% 0.0% 1.5% 3.0% 5.7% 6.9%RMBS 91.7% 79.8% 68.1% 36.3% 29.4% 91.7% 80.1% 67.5% 39.1% 33.2%OTHERS 0.0% 0.2% 0.9% 4.3% 4.0% 0.0% 0.2% 1.2% 8.6% 8.8%Totalratings/dealsoutstanding
12 649 3325 8201 12296 12 617 2072 3788 5136
Source: Moody’s Investors Service
Now that we better understand the data, let’s look at the study’s results and its keysummary – the annual rating transition matrix, 1983 – 2002 (see Tables 3, 4 and5). We particularly focus on the comparison between structured finance andcorporate finance rating transitions:
• Structured finance ratings are very stable with five of seven structured finance(and only one of seven corporate) broad rating categories experiencing norating change in more than 90% of the cases.
- Structured finance ratings are more stable in both investment and sub-investment grade categories.
- While in the sub-investment grade category structured finance ratings areless likely than corporate ratings to be downgraded, they are nonethelessless likely to be upgraded – this may be a reflection of the going concernnature of a corporate entity and the liquidating nature of the assetsbacking a structured finance rating.
• In addition, structured finance ratings are particularly less likely to bedowngraded than similarly rated corporates.
- Downgrade to upgrade ratio is much lower for structured finance than forcorporate ratings historically and remained lower in 2002 despite thesignificant increases in downgrades experienced by both sectors.
- Structured finance ratings, however, appear less likely to be upgradedthan corporate ratings judging by the upgrade ratios. We believe thisconclusion while correct based on the numbers presented, is somewhatmisleading when considering existing market practices. It is a well-known fact that as the senior tranches of a structured finance securityamortize the credit strength of the junior tranches improves all otherconditions being equal – however, this is rarely reflected in a ratingupgrade for a number of reasons.
• Structured finance securities appear more likely (almost twice) to bedowngraded to Caa and below category from all broad rating categories(except single B) in comparison to corporate finance ratings. This is asomewhat worrisome observation. A better review of the instances ofstructured finance ratings moving into the Caa and below category is neededin order to derive the reasons behind such transition results.
- A possible explanation is that once a significant deterioration takes placein a securitized pool, a reversal is unlikely and the ratings are likely tocontinue to slide to the lowest possible category.
- The above finding, on the other hand, may contradict some assertions thatstructured finance ratings are stable because of intervention of originatorsto support troubled transactions, a limited instances of which have beenobserved in the past.

ABS/MBS/CMBS/CDO 101 – 16 July 2003
Refer to important disclosures at the end of this report. 45
Table 3: Moody’s All Structured Finance Annual Rating TransitionMatrix, 1983-2002 (adjusted for Withdrawn Ratings)
Moody’s Structured Finance Rating Transitions 1983-2002To
From Aaa Aa A Baa Ba B Caa orbelow
Aaa 98.90% 0.89% 0.13% 0.04% 0.00% 0.00% 0.03%Aa 5.45% 91.46% 2.28% 0.63% 0.09% 0.03% 0.06%A 1.13% 2.74% 93.54% 1.82% 0.52% 0.07% 0.18%Baa 0.53% 0.65% 2.25% 90.40% 3.83% 1.26% 1.08%Ba 0.14% 0.06% 0.78% 3.99% 86.33% 3.24% 5.46%B 0.00% 0.06% 0.06% 0.46% 0.85% 88.95% 9.62%Caa or below 0.00% 0.00% 0.00% 0.00% 0.17% 0.34% 99.49%
Source: Moody’s Investors Service
Table 4: Moody’s All Structured Finance Annual Rating TransitionMatrix, 1983-2002 (adjusted for Withdrawn Ratings)
Moody’s Corporate Finance Rating Transitions 1983-2002To
From Aaa Aa A Baa Ba B Caa orbelow
Aaa 89.93% 9.17% 1.00% 0.00% 0.00% 0.00% 0.00%Aa 0.79% 89.66% 9.04% 0.37% 0.09% 0.02% 0.03%A 0.05% 2.53% 90.68% 5.77% 0.70% 0.22% 0.04%Baa 0.05% 0.28% 5.94% 86.95% 5.25% 1.12% 0.41%Ba 0.01% 0.04% 0.61% 5.50% 82.59% 9.01% 2.23%B 0.01% 0.06% 0.23% 0.61% 6.19% 81.22% 11.68%Caa or below 0.00% 0.00% 0.00% 1.01% 2.57% 6.53% 89.88%
Source: Moody’s Investors Service
Table 5: Comparison of Aggregate Average Downgrade and UpgradeRates between Structured Finance and Corporate Finance, 1983-2002(Broad-Rating-Based, Adjusted for Withdrawn Ratings)
DowngradeRate
UpgradeRate
UnchangedRate
Downgrade/Upgraderatio
Structured Finance, 1983-2002 3.21% 2.70% 94.09% 1.2Corporate Finance, 1983-2002 9.42% 4.14% 86.44% 2.3Structured Finance, 2002 only 6.46% 1.41% 92.13% 4.6Corporate Finance, 2002 only 14.42% 2.61% 82.97% 5.5
Source: Moody’s Investors Service
In our weekly commentary of the same title from Feb 20, 2003 we drew attentionto the latest Moody’s structured finance rating transition study capturing theperiod 1983-2002. Here we expand our commentary to include several additionalaspects of the study.
We emphasised Moody’s conclusion about the higher rating stability of structuredfinance as compared to corporate ratings.
• Structured finance better rating stability is confirmed over a horizon longerthan one year. For example, triple-As retain their ratings in more than 95% ofthe cases over even a five-year period.
Reviewing the multi-year transition matrices we note the following:
• The incidence of ratings withdrawn for investment grade structured creditratings is much higher for the higher investment grade ratings than for lowerinvestment grade and sub-investment grade by a factor of two or three. This isthe exact opposite to corporate ratings – they have a much higher incidence of

ABS/MBS/CMBS/CDO 101 – 16 July 2003
Refer to important disclosures at the end of this report. 46
withdrawn ratings at sub-investment grade level. This difference should bedistorting somewhat other conclusions made on the basis of rating transitionsfor corporate and structured finance bonds.
• The longer the period, the higher the incidence of ratings withdrawn for thelower rated classes in structured finance – this is logical given theamortisation structure of many structured finance bonds and the longeraverage life of the junior classes compared to the senior classes in a givenstructure.
• The cumulative frequency of transition from investment grade into the lowestrating category is higher for structured finance bonds, while the cumulativefrequency of transition from sub-investment grade to the lowest ratingcategory is higher for corporate bonds.
While these results may be considered intuitive by many, they should be viewed inthe light of the background data. It shows that investment grade ratings dominatein structured finance and sub-investment grade ratings are significantly higherpercentage of all ratings in the corporate world as well as much higher percentagecompared to the structured finance world. In addition, the prevailing amortisingnature of structured finance bonds (although that depends on the asset class) ascompared to predominantly bullet corporate bonds must also have an impact onthe results. The much higher cumulative frequency of transition of sub-investmentgrade corporate to the lowest rating category in comparison to structured financeratings refutes strongly the claims by some market participants that junior tranchesof structured financings are riskier than comparatively rated corporate bonds. Thedata does not support such a claim, or, at worst, is inconclusive.
• Given the nature of a structured finance rating, i.e. it is a transaction specificrating and remains outstanding for the life of the transaction, it is worthtracking rating transition performance according to the outstanding age profileof the ratings. Given the issuer specific nature of corporate ratings and thegoing concern nature of the issuers, such ageing profile will be lessmeaningful, except maybe in high yield world.
Structured finance ratings ageing seem to confirm what investors have long knowabout the ageing, that is seasoning, of underlying pools – their credit quality maydeteriorate with time initially, then stabilise after a peak. So it seems to be true forthe ratings as well – the rating volatility increases up to about year four, thendecreases and stabilises. Such rating volatility, though, while having aninteresting pattern – both upgrades and downgrades climb up initially, withdowngrades exceeding upgrades, and then both climb down after year 3d – to - 5thwith upgrades exceeding downgrades.
This confirms that it is not only that the pool credit quality is age dependent, butalso that the rating transition frequencies may also be age-dependent, as Moody’ssays. The two may not be necessarily correlated, though, although somerelationship must exist. Such conclusions may argue in favour of maintaining aweighed average seasoning for the deals in a portfolio in addition to the weightingaverage seasoning for the underling pools.
• Rating drift is defined by Moody’s as the difference between the weightedaverage upgrade frequency and the weighted average downgrade frequency,weighted by notches per rating change and adjusted for withdrawn ratings.Rating volatility, on the other hand, is the sum of the upgrade and downgraderates. While the first shows the prevailing direction of the rating changes, thesecond indicates the relative volume of rating changes.
Historically, rating volatility was about 20% with no particular rating drift, that israting changes in both directions traditionally offset each other over time. Theexception is year 2002, which recorded a significantly higher negative rating driftand rating volatility. It is certainly a question whether 2002 was an aberrationfrom historical averages or a beginning of a new trend. There are arguments infavour of both views: aberration induced by the negative performance of the CDOsector or a new trend driven by the credit deterioration in consumer credit in theUS!

ABS/MBS/CMBS/CDO 101 – 16 July 2003
Refer to important disclosures at the end of this report. 47
We could not find a similar data for the corporate bond world in order to derivemeaningful comparisons, maybe because the corporate world is more preoccupiedwith defaults – that should be another point in favour of structured finance.However, comparison of the average number of notches per rating move shows amuch more stable corporate sector (approximately 1.6) versus a more dynamicstructured finance sector (more than 2.6 notches in recent years and trendingupward).
This leads us to conclude that while structured finance ratings are more stable,but once they start changing their rating changes tend to be much more dramaticin either direction.
• The question arises then as to whether a given rating change is predicated on apreceding rating change of the same security – Moody’s calls this feature arating change momentum or path dependency. Structured finance ratingsappear to have stronger downgrade and upgrade momentum than corporates –this is to some extent confirmed by the conditional annual rating transitionmatrices.
When talking about rating dependency, it is worth noting that when one tranche ina structured finance transaction experiences a rating change, there is a high degreeof certainty that one or more tranches of the same transaction will experience arating change in the same direction. That is particularly notable in the sub-investment grade tranches. This confirms what investors have always knowintuitively that there is a common denominator to the ratings of all tranches in agiven structured financing – that of the credit performance of the underlying pool,among others.
Table 6: Rating Change Momentum 1983-2002
Structured Finance RatingsDowngraded in t Upgraded in t Unchanged in t
Downgraded in t-1 36.36% 3.55% 60.10%Upgraded in t-1 3.39% 9.97% 86.65%No change in t-1 3.52% 4.32% 92.16%Unconditional 4.15% 3.71% 92.14%
Corporate Finance RatingsDowngraded in t Upgraded in t Unchanged in t
Downgraded in t-1 25.78% 7.11% 67.11%Upgraded in t-1 6.68% 16.15% 77.17%No change in t-1 14.01% 8.53% 77.46%Unconditional 14.70% 8.84% 76.46%
Source: Moody’s Investors ServiceNote: t is the current year and t-1 is the previous year, and downgrades include transitions iinto default(Adjusted for Withdrawn ratings, Refined-Rating Based, Unadjusted for the Number of Notches Per Rating Move)

ABS/MBS/CMBS/CDO 101 – 16 July 2003
Refer to important disclosures at the end of this report. 48
Table 7: Conditional Annual Rating Transition Matrices in Structured Finance,1983-2002
Structured Finance Annual Rating Transition Matrix, Conditional on previously downgradedAaa Aa A Baa Ba B Caa or below
Aaa 0.00% 0.00% 0.00% 0.00% 0.00% 0.00% 0.00%Aa 0.36% 83.27% 10.32% 5.34% 0.71% 0.00% 0.00%A 0.30% 0.30% 80.91% 13.33% 3.03% 0.00% 2.12%Baa 0.48% 0.00% 0.48% 62.32% 22.22% 5.80% 8.70%Ba 0.00% 0.00% 0.00% 15.96% 52.84% 13.83% 17.38%B 0.00% 0.00% 0.00% 0.00% 0.00% 44.06% 55.94%Caa or below 0.00% 0.00% 0.00% 0.00% 0.00% 0.00% 100.00%
Structured Finance Annual Rating Transition Matrix, Conditional on previously upgradedAaa Aa A Baa Ba B Caa or below
Aaa 100.00% 0.00% 0.00% 0.00% 0.00% 0.00% 0.00%Aa 13.44% 86.32% 0.24% 0.00% 0.00% 0.00% 0.00%A 2.14% 8.93% 88.21% 0.71% 0.00% 0.00% 0.00%Baa 1.12% 5.03% 7.82% 59.78% 26.26% 0.00% 0.00%Ba 0.00% 0.00% 3.03% 21.21% 75.76% 0.00% 0.00%B 0.00% 0.00% 0.00% 0.00% 22.22% 77.78% 0.00%Caa or below 0.00% 0.00% 0.00% 0.00% 0.00% 0.00% 0.00%
Source: Moody’s Investors Service
Question arises, however, about the corporate ratings, given that in the corporateworld there are both issuer and issue specific ratings, and the range of issuespecific ratings are dependent on the issuer rating level and it changes, readnotching. In other words as corporate rating transitions track only issuer specificratings, the magnitude of rating change and particularly of contemporaneous ratingchanges is not reflected in the corporate rating transition study, while it affects,apparently quite severely, the structured finance rating transition study.
Finally, as rating changes due to the ratings of Conseco/ Green Tree were reflectedin the structured finance study, we believe this fact distorts the rating transitionconclusions made with regards to Baa and Ba – both in terms of general andconditional (upgrade conditional on a downgrade) rating transitions.
Table 8: Contemporaneous Rating Change Dependency across Tranches in theSame Deal, 1983-2002
Downgraded Upgraded UnchangedConditional on Another Tranche Being Downgraded 70.53% 0.60% 28.87%Conditional on Another Tranche Being Upgraded 0.57% 66.62% 32.81%Conditional on Another Tranche Sustaining No Rating Change 1.69% 2.29% 96.02%Unconditional 4.15% 3.71% 92.14%
Source: Moody’s Investors Service(Adjusted for Withdrawn Ratings, Refined-Rating Based, Unadjusted for the Number of Notches Per Rating Move)
• Finally, while the conclusions from the rating transition study are generally infavour of structured finance ratings in comparison to the corporate ratings, thestructured finance world is not homogeneous and comprises several distinctlydifferent sub-sectors. While they demonstrate similar rating stability levels(excluding, naturally CDOs), they are distinctly different in terms of theirdowngrade and upgrade frequencies and rating withdrawn frequency.
The tables below demonstrate the significant differences in terms of ratingstability and transition among the four major sub-sectors of the structured financemarket.

ABS/MBS/CMBS/CDO 101 – 16 July 2003
Refer to important disclosures at the end of this report. 49
Table 9: Weighted Average Annual Transition Matrices in theStructured Finance Sectors, 1991-2002
ABSAaa Aa A Baa Ba B Caa or below
Aaa 99.05% 0.82% 0.04% 0.01% 0.00% 0.00% 0.08%Aa 2.57% 94.62% 1.82% 0.67% 0.08% 0.00% 0.24%A 0.63% 1.07% 96.34% 1.15% 0.63% 0.08% 0.10%Baa 0.59% 0.46% 0.97% 89.59% 6.47% 1.22% 0.71%Ba 0.28% 0.14% 0.42% 7.45% 74.40% 5.63% 11.67%B 0.00% 0.00% 0.00% 0.60% 0.00% 76.65% 22.75%Caa or below 0.00% 0.00% 0.00% 0.00% 0.00% 0.00% 100.00%CDO
Aaa Aa A Baa Ba B Caa or belowAaa 95.37% 3.09% 0.93% 0.51% 0.10% 0.00% 0.00%Aa 0.58% 89.04% 5.48% 3.50% 1.05% 0.23% 0.12%A 0.16% 0.98% 89.59% 6.02% 1.95% 0.33% 0.98%Baa 0.00% 0.09% 0.51% 86.19% 6.17% 3.69% 3.34%Ba 0.00% 0.00% 0.00% 1.37% 81.48% 5.83% 11.32%B 0.00% 0.00% 0.00% 0.00% 0.00% 68.98% 31.02%Caa or below 0.00% 0.00% 0.00% 0.00% 0.00% 0.00% 100.00%CMBS
Aaa Aa A Baa Ba B Caa or belowAaa 98.49% 1.51% 0.00% 0.00% 0.00% 0.00% 0.00%Aa 5.58% 93.35% 0.63% 0.18% 0.00% 0.18% 0.09%A 1.45% 3.23% 93.87% 1.45% 0.00% 0.00% 0.00%Baa 0.62% 1.24% 3.03% 93.18% 1.45% 0.28% 0.21%Ba 0.00% 0.00% 0.59% 2.52% 94.67% 1.78% 0.44%B 0.00% 0.00% 0.16% 0.65% 1.79% 94.95% 2.44%Caa or below 0.00% 0.00% 0.00% 0.00% 0.00% 2.70% 97.30%RMBS
Aaa Aa A Baa Ba B Caa or belowAaa 99.34% 0.49% 0.14% 0.03% 0.00% 0.00% 0.00%Aa 8.03% 89.85% 1.70% 0.43% 0.00% 0.00% 0.00%A 2.07% 4.28% 91.06% 2.15% 0.21% 0.03% 0.21%Baa 0.67% 0.76% 3.37% 91.58% 1.88% 0.85% 0.88%Ba 0.21% 0.07% 1.41% 4.08% 90.01% 1.76% 2.46%B 0.00% 0.14% 0.00% 0.42% 0.56% 92.31% 6.57%Caa or below 0.00% 0.00% 0.00% 0.00% 0.28% 0.00% 99.72%
Source: Moody’s Investors Service
As becomes clear from the comparison among sub-sectors, CDO has the worsttrack record in structured finance world. While this is true, investors shouldconsider the CDO rating transition study for better understanding of the CDOsector performance – as we have stated on many occasions this is not ahomogeneous sector and it owes its poor name primarily to US high yieldarbitrage CDOs.
In addition, the different type of structures predominant in the CDO and othersectors of the structured finance market, along with the different levels of stressexperienced by the underlying should be taken into consideration wheninterpreting the data. We note the strong performance of the real estate basedsecuritisations, RMBS and CMBS sectors – there is something to be said about thestrength of the collateral! While the CDO sector tracked the performance shadowsthe performance of the corporate sector, RMBS and CMBS mirror the real estateone. However, we again emphasise the importance of the deal structures in therespective sectors to counter or connive with the collateral performance.
Considering the performance of the sub-investment grade area, again there isevidence of significant difference among sectors – CDOs and ABS being muchmore volatile than CMBS and RMBS. Furthermore, the frequency of emergingfrom the Caa and below is very low in the structured finance world – and muchhigher in the corporate world – there seems to be little cure for terminal illness!

ABS/MBS/CMBS/CDO 101 – 16 July 2003
Refer to important disclosures at the end of this report. 50
• Comparison of rating transitions between the US and international structuredfinance sectors yield remarkably similar results. A closer look at the numbersindicates a marginally higher downgrade frequency for internationalstructured finance, which Moody’s attributes to the higher share of the CDOsector in international structured finance compared to US structured finance.
Table 10: International Structured Finance Annual Rating TransitionMatrix, 1989-2002
Aaa Aa A Baa Ba BCaa orbelow
Aaa 97.43% 2.18% 0.32% 0.07% 0.00% 0.00% 0.00%Aa 1.48% 92.65% 4.18% 1.28% 0.27% 0.07% 0.07%A 0.55% 4.79% 90.96% 2.81% 0.68% 0.00% 0.21%Baa 0.00% 0.24% 1.71% 88.20% 5.13% 2.44% 2.28%Ba 0.00% 0.00% 0.20% 2.00% 85.60% 4.40% 7.80%B 0.00% 0.00% 0.00% 0.00% 0.00% 77.51% 22.49%Caa or below 0.00% 0.00% 0.00% 0.00% 0.00% 0.00% 100.00%
Source: Moody’s Investors Service
Table 11: U.S. Structured Finance Annual Rating Transition Matrix,1989-2002
Aaa Aa A Baa Ba BCaa orbelow
Aaa 99.12% 0.70% 0.10% 0.04% 0.01% 0.00% 0.03%Aa 6.00% 91.26% 2.04% 0.55% 0.06% 0.03% 0.06%A 1.23% 2.41% 93.96% 1.65% 0.49% 0.08% 0.18%Baa 0.62% 0.72% 2.35% 90.77% 3.61% 1.06% 0.87%Ba 0.17% 0.07% 0.88% 4.32% 86.46% 3.04% 5.07%B 0.00% 0.06% 0.06% 0.50% 0.95% 90.22% 8.20%Caa or below 0.00% 0.00% 0.00% 0.00% 0.18% 0.37% 99.45%
Source: Moody’s Investors Service
3.2 Moody’s CDO Rating Migration Study 1996-2002:More Doom than Gloom!
The long-awaited Moody’s update on the performance of the CDO sector globallyis finally out (see Credit Migration of CDO Notes, 1996-2002, for US andEuropean Transactions, April 15, 2003).
Although it is a mandatory read for any investor, it is hardly telling theexperienced CDO veteran anything new. It may further enhance the position – beit negative or positive – regarding CDOs, a specific investor has adopted overtime.
But, maybe it is a time for another look! Why so? To answer this question, wewill take a look at some of the data and conclusions of the study:
First, the credit trends of the various sectors of the CDO market exhibitedduring 2001 continued in 2002. That is, some sectors continued to suffer, otherscontinued to be stable or mildly affected. However, these trends highlight againthe existence of significant differentiation and related diversification possibilitieswithin the sector.
Here comes a market reality, which has so far been largely disregarded byEuropean investors: the CDO market has various sectors and they have performedcredit-wise differently, often significantly differently, from one another:
• Moody’s counts 12 such sectors. An additional one can be added – B/S CashFlow non-US$. Furthermore, one of the sectors is obviously a composite ofseveral more – resecuritisations may include CDO of CDO, CDO of ABS,CDO of Real Estate, etc.

ABS/MBS/CMBS/CDO 101 – 16 July 2003
Refer to important disclosures at the end of this report. 51
• Moody’s has increased over time the number of CDO sectors – from 4 in the2000 study, to 10 in 2001 to 12 at present – this reflects the marketdevelopment and data availability, and is akin in some respects to adding newindustries to the corporate sector.
As the data shows arbitrage cash flow CBOs have been consistently the worstperformers in the CDO world in terms of downgrades – say, half of alldowngrades, followed well behind by the arbitrage synthetic US$ and non-US$transactions, and even further behind, by Balance Sheet Synthetic US$ and non-US$ transactions. It is interesting, that while arbitrage cash flow CBOs haveperformed fairly poorly across the board, the other two transaction types have hada distinctly different performance: arbitrage synthetic non-US$ deals performedworse than the US$ ones, while balance sheet synthetic non-US$ deals performedbetter than the US$ ones. Overall, more than half of the CDO types have had afairly good performance, all considered and particularly taking into account themost stressful conditions the corporate and other fixed income marketsexperienced in the last several years.
Table 12: Moody’s CDO Downgrade by Sector for US and European Market (Tranches)(% of total CDO downgrades from January 1, 2002 to December 31, 2002 (Row 2002)and from January 1, 2001 to December 1, 2001 (Row 2001))
Deal Type/ Vintage 1995 1996 1997 1998 1999 2000 2001 2002 TotalACF CBO 2001 3.45 14.94 14.37 13.22 1.15 47.13
2002 4.0 6.8 10.8 23.6 8.5 0.8 54.6Arb Synth non-US$ 2001 0.57 2.87 10.34 13.79
2002 0.2 3.6 8.9 12.7Arb Synth US$ 2001 1.15 3.45 4.6
2002 0.4 0.8 5.5 0.4 7.2B/S Synthetic US$ 2001 1.15 10.92 2.3 4.6 0.57 19.54
2002 0.8 2.1 0.4 2.1 1.3 6.8ACF CLO 2001 1.15 0.57 4.02 5.75
2002 1.1 1.5 2.8 0.4 5.7ACF IG CBO US$ 2001
2002 0.2 0.2 0.6 3.6 4.7B/S Synthetic non-US$ 2001 1.15 5.75 6.9
2002 0.2 2.5 1.7 4.5Resecuritisations 2001
2002 0.2 0.4 0.6 1.3Market Value 2001
2002 1.1 1.1Emerging Markets 2001 1.15 0.57 1.72
2002 0.4 0.2 0.2 0.8B/S Cash Flow US$ 2001 0.57 0.57
2002 0.4 0.4ACF IG CBO non-US$ 2001
2002 0.2 0.2Totals 2001 4.6 17.8 29.9 19 17.8 10.9 174
2002 0.4 5.3 9.1 16.1 26.8 19.1 22.7 0.4 471
Note: CDOP Downgrades by vintage, by tranches as % of tal CDO Downgrades by trancheSource: Moody’s, Credit Migration of CDO Notes, 1996-2002, for US and European Transactions, April, 15, 2003 andCredit Migration of CDO Notes, 1996-2001, February 27, 2002
A review of this table coupled with the experienced accumulated on the CDOmarket would suggest that:
• It is incorrect to talk about the CDO market performance in general, as muchas it is incorrect to talk about the corporate market performance in general.
• Different credit performance may be suggesting that there is a potentialdiversification benefit from investing in different CDO types. This is not,however, the same as saying that the underlying CDO exposures present

ABS/MBS/CMBS/CDO 101 – 16 July 2003
Refer to important disclosures at the end of this report. 52
diversification opportunities from the perspective of a corporate bond investor– they may (as in the case of emerging markets or structured financeinstruments) or they may not (as in the case of corporate bonds and loans).
• There is also a timing aspect of investing in CDOs as performance by vintageindicates, but there may well be a seasoning effect at least in some of the sub-sectors.
• CLOs perform better than CBOs, primarily related to the inherent differencesbetween loans and bonds as it affects arbitrage transactions and the differentlevel of lender’s involvement in each case.
Second, comparing corporate and CDO rating transitions could be quitechallenging. Data for 2002 indicates wide differences by credit category and byCDO type. It also confirms some of the experiences of 2001 and refutes others.Yet, on an ‘apples with apples’ basis the performance of CDOs and corporateslooks remarkably similar, as one would expect them to.
Table 13: Corporate vs. CDO Transitions in 2002 and 2001, Probability for Downgradefor Selected Credit Ratings (adjusted for withdrawn ratings)
2002 ACF-CBO ACF-CLOSynth Arb
(US$)Synth Arb
(Non US$) Em. Mkts All CDOs CorporatesAAA 19.4 1.0 31.8 55.0 0.0 10.7 8.2Aa2 47.4 12.5 80.0 100.0 12.5 23.9 14.7Baa2 44.3 4.3 66.7 66.7 16.7 26.4 24.1Baa3 55.6 30.8 nm 85.7 12.5 35.9 21.6Ba2 59.6 5.6 71.4 nm nm 30.6 33.6Ba3 46.2 3.3 nm nm nm 26.1 27.7
2001 ACF-CBO ACF-CLOSynth B/S
(US$)Synth B/S(Non US$) Corporates
AAA 1.7 0.0 10.0 0.0 1.0Aa2 25.6 8.0 0.0 7.7 16.3Baa2 12.7 2.8 33.3 11.1 14.8Baa3 34.8 7.7 nm nm 10.8Ba2 12.1 15.4 50.0 30.0 23.4Ba3 14.7 9.1 nm nm 18.2
Source: Moody’s, Credit Migration of CDO Notes, 1996-2002, for US and European Transactions, April, 15, 2003 andCredit Migration of CDO Notes, 1996-2001, February 27, 2002
It is worth noting that:
• CDOs on average have performed more or less in line with corporates,although the differences among CDO types relative to corporates are clearlyquite significant. We believe that such significant differences will existamong the different industries within the corporate sector, as well. We stillwonder, though, why the former difference is viewed so negatively by themarket participants, while the latter is widely accepted as normal.
To expand on this point: CDOs on average have performed more or less in linewith corporates, although the deviation from the corporate performance may differsignificantly by CDO type. Similarly, in the corporate world alone – differentindustries perform differently and have different risks. So deviations from theaverages can be also significant for different industries. This is widely accepted asnormal, and necessitates diversification and a view on a particular industry. Thefact that different CDO asset classes perform differently and have different risk isnot, in contrast, viewed by the market as an opportunity to diversify and take aview on different CDO types, but, perversely, used as an excuse to stay out of thesector as a whole.
• From downgrade point of view, investment grade rating categories for CDOshave exhibited higher downgrade risk than similarly rated corporates, whilesub-investment grade CDO tranches have demonstrated lower downgrade riskthan similarly rated high yield corporates. Such observations go against the

ABS/MBS/CMBS/CDO 101 – 16 July 2003
Refer to important disclosures at the end of this report. 53
widely accepted views, which have ultimately found their way into investorand regulator stance towards CDOs.
• These numbers are actual and are not adjusted for the significantly differentnumbers of securities in each rating category for corporates and CDOs, that’sthere is sample size error inevitably distorting the results. Said differently, thecomparison is between ‘apples and oranges’ – you choose which is which.
It is a pity that Moody’s has not presented a similar analysis of the differentcorporate sector – we are fairly certain that different corporate sectors downgradeperformance will look significantly different among themselves and against thecomposite over a given period of time.
While the actual downgrade experience in given years is enlightening, it is longer-term averages on which investment portfolios are structured. In that regardMoody’s creates a weighted-average one-year transition matrix for CDOs andtheoretical one-year transition rate for Corporates (weighting each year’s one-yearcorporate transition rates by the number of CDO ratings outstanding at each ratinglevel as of the beginning of that year) to allow for proper comparison. On suchbasis the comparison is between ‘apples and apples’, and it looks increasinglysimilar, as most apples do, except for those belonging to top brands.
Table 14: Average One-Year Downgrade Risk.Comparison of 1-Year Average Rating Transition, 1996-2002, Probability ofDowngrade*
1yr Av ACF-CBO ACF-CLO Synth B/S (US$)** Em. Mkts All CDOs Corporates***AAA 7.0 0.4 8.8 0.0 5.2 6.0Aa2 16.3 6.0 6.7 9.3 13.4 13.5Baa2 20.5 3.6 26.7 3.7 14.3 17.1Baa3 21.8 10.7 37.5 17.2 17.5 14.3Ba2 36.6 10.5 31.3 9.1 20.4 26.2Ba3 19.8 5.8 50.0 14.3 16.8 24.1
*Probability of downgrade is adjusted for withdrawn ratings**For the period 1998-2002***Figures are from ’theoretical’ corporate transition matrix, developed by Moody’sSource: Moody’s, Credit Migration of CDO Notes, 1996-2002, for US and European Transactions, April, 15, 2003
Third, near-term CDO sector performance trends, observed during the lastseveral years, look set to continue. That means that sub-sectors that under-performed in the past should continue to do so, maybe to a lesser extent due todeal de-leveraging and hopefully some improvement in corporate credit, while theCDO sectors, which performed reasonably well in the past may continue to do sowith some exceptions, which may see slight deterioration.
An indicator of future performance could be the CDO watchlist. Below wecompare Moody’s CDO watchlists in early 2002 and early 2003. This watchlistfrom early 2002 can be compared with the performance in 2002 shown earlier inthis report to determine its predictive power. The comparison seems to indicate afairly strong predictive power.
In the early 2002 watchlist the sectors ranked from worst-to-best in the followingorder: ACF CBO, ACF CLO, B/S Synthetic USD, Arbitrage Synthetic USD, etc.The actual performance in 2002 ranks the sectors from worst-to-best in thefollowing order: ACF CBO, Arbitrage Synthetic non-USD, Arbitrage SyntheticUS$, B/S synthetic US$, ACF CLO.
Judging by the watchlist from early 2003, the 2003 ranking of CDO sector byperformance in worst-to-best order could be as follows: ACF CBO, ACF IG CBO,ACF CLO, Arbitrage Synthetic US$, Resecuritisation, etc. And again ACF CBOare well ahead of the pack – a watchlist ratio of 4 to 1, at least – and will continuecasting a long shadow on the CDO market.

ABS/MBS/CMBS/CDO 101 – 16 July 2003
Refer to important disclosures at the end of this report. 54
Table 15: Moody’s CDO Downgrade Watchlist by Sector for US Market and EuropeanMarket As of March 18, 2003 for Row 2003 and as of February 8, 2002 for Row 2002
Deal Type/ Vintage 1995 1996 1997 1998 1999 2000 2001 2002 TotalACF CBO 2002 4 12 20 36 8 80
2003 2 8 27 37 16 90Arb Synth non-US$ 2002 2 2
2003 4 2 6Arb Synth US$ 2002 7 7
2003 1 17 1 19B/S Synthetic US$ 2002 6 2 8
2003 1 4 5ACF CLO 2002 2 6 6 14
2003 1 2 6 9 2 20ACF IG CBO US$ 2002
2003 2 13 6 21B/S Synthetic non-US$ 2002
2003 1 1 2Resecuritisations 2002
2003 10 5 15Market Value 2002
2003 4 2 6Emerging Markets 2002 2 1 3
2003B/S Cash Flow non-US$ 2002
2003 3 3B/S Cash Flow US$ 2002 2 2
2003 3ACF IG CBO non-US$ 2002
2003Totals 2002 2 6 19 32 38 8 11 116
2003 1 4 14 44 74 46 4 187
Source: Moody’s, Credit Migration of CDO Notes, 1996-2002, for US and European Transactions, April, 15, 2003 andCredit Migration of CDO Notes, 1996-2001, February 27, 2002
In conclusion, CDO market performance apparently owes its bad name to thearbitrage cash flow CBO sector, which in fact represents 36.56% of all CDOtranches rated by Moody’s. It is unfortunate that one third, the bad third, of themarket has such a strong negative bearing on the rest of it in the eyes of Europeaninvestors. It may be time to re-examine the current attitude and adopt a stancemuch more relevant to the market realities.

ABS/MBS/CMBS/CDO 101 – 16 July 2003
Refer to important disclosures at the end of this report. 55
4. Assessing SubordinatedTranches in ABS Capital Structure

ABS/MBS/CMBS/CDO 101 – 16 July 2003
Refer to important disclosures at the end of this report. 56
As subordinated tranches continue to increase in availability, investors need aframework for their analysis. Regardless of whether it is a true sale orsynthetic transaction, subordinated tranche investments require a moreintensive initial analysis and more active monitoring. The lower investorsmove in the ABS capital structure, the more intensive the credit analysisshould become. Analytical methods such as sensitivity and break evenanalysis come handy when reviewing payment rates, charge-offs and excessspread.
4.1 Framework for Subordinated Tranche Analysis
The analysis of the subordinated tranches of unsecured consumer assets ABSfollows the general principles and guidelines of the investment analysis for ABSand their senior tranches. It is or should be, however, more credit intensive - thelower in the ABS capital structure the investors move, the more intensive thecredit considerations should become.
The framework for credit analysis of subordinated tranches of unsecuredconsumer loans and credit cards in most generic terms include the followingaspects:
• Quality of initial collateral pool and originator’s historical pool performance;
• Originator and servicer capabilities and credit standing;
• Structural enhancements (credit enhancement, liquidity facility, reserveaccounts, reserve account build-up triggers, early amortisation triggers, etc.);
• Legal enhancement (bankruptcy remoteness of the structure, ‘true’ saletreatment); and
• Cash flow ‘waterfall’ and priorities of payment of principal and interest atdifferent subordination levels.
• The revolving (substitution) feature of these deals entails changes in the poolcomposition within the respective eligibility criteria, hence the need toascertain:
• Tightness of the eligibility criteria.
• Consistency in the underwriting criteria of the originator and ability tomanage accounts in accordance with the changing economic and competitiveenvironment.
• Frequency of replenishment and account additions.
• Tightness of economic triggers.
• Ability to build up additional credit support (reserve accounts and excessspread).
• Likelihood of the occurrence of trigger events.
All of the above aspects are relevant to the analysis of both senior andsubordinated ABS tranches. With regards to the analysis of the subordinatedtranches several additional considerations should be included:
• Excess spread stability or erosion, and, particularly, excess spread variabilityand determining factors (yield, delinquency and loss management).
• Originator’s pool management capabilities - ability to manage yield,delinquencies and losses.
• Potential levels of excess spread build-up in an additional reserve accountin accordance with the respective triggers.
• Applicability of the reserve accounts.
• Current, historical and expected losses compared to actual and potentialcredit enhancement levels.
Analysis of senior andsubordinated tranches share a
common basis . . .
. . . subordinated tranches,however, introduce unique
analytical aspects

ABS/MBS/CMBS/CDO 101 – 16 July 2003
Refer to important disclosures at the end of this report. 57
• Likelihood of servicer bankruptcy/replacement and its effects on poolperformance.
• Effects of payment rates on the accumulation of losses and excess spreadvariability.
• Break-even and sensitivity analysis, etc.
These aspects are more important to subordinated tranches investors than to themost senior tranches investors given the lower loss cushion protection they haveand the higher likelihood of negative consequences of performance volatility. Wewould discuss those particular aspects in more detail below.
� Excess Spread Stability
The main source of loss protection for an investor in the lower tranches of theABS capital structure is the excess spread. That is, the difference between therevenue from the asset pool (pool yield, which depends on interest rate charged onthe underlying accounts, as well as other charges – late payment penalty, annualfees, interchange, etc.) and the expenses under the securitisation (ABS coupon,servicing fees, losses, etc.). Hence, excess spread is a function mainly of the poolyield and pool losses, which both depend on the ability of the originator/servicerto manage the asset pool under different economic scenarios, see below.
A key aspect of the analysis of excess spread is its variability. We are concernedwith excess spread variability for a number of reasons:
• It determines the level of the available cushion against loss increases;
• It determines the extent, to which a reserve account can be built up in case ofneed; and
• It determines the likelihood of the occurrence of an early amortisation event,i.e. hitting the economic trigger associated with specified level of excessspread typically on a three-month rolling average basis.
A high volatility of excess spread or its rapid drop may prompt early amortisationwithout sufficient time to build up additional reserves against future loss increasesand depletion of the available protection to the subordinated tranches.
Furthermore, highly volatile excess spread, and especially a steep rapid drop in thelevels of excess spread would not allow sufficient build-up of the reserve account,i.e. would limit the available additional cushion against loss increases.
� Originator’s Underwriting and Servicing
As mentioned above the unsecured consumer loan and credit card deals areusually structured with a revolving period, during which the principal collectionsfrom the existing pool are used to purchase new receivables from the originalaccounts or new accounts altogether. In the case of a master trust, the originatorcan add new accounts and the associated receivables to the pool on an ongoingbasis, which could alter the pool composition and performance over the term ofthe transaction. Any performance variability would first of all affect thesubordinated tranches.
Originator’s ability to manage the pool is crucial and depends on a number offactors:
• Type and purpose of the unsecured loan or credit card, e.g. general credit cardor retail credit card, instalment consumer loans or revolving unsecured loanfacility. For example, one would expect a lower yield and higher first bucketdelinquencies for retail cards as compared to general credit cards.
• Market competition has effects on the way loans are originated and the ratescharged, e.g. teaser rates, lower interest rates, annual fees, etc.
• Ability to enforce risk-based pricing, thus reflecting the riskiness of the pool.
Excess spread is the first line ofdefence against losses
Volatility in excess spread canprove negative
Servicing is crucial to thesubordinated tranches’
performance

ABS/MBS/CMBS/CDO 101 – 16 July 2003
Refer to important disclosures at the end of this report. 58
• Balance between ‘convenience users’ (borrowers who pay their balances infull every payment date) and ‘credit users’ (real users of the credit facility andpayers of interest rate charges) – the effect on pool yield is obvious.
• Ability to retain good quality accounts, especially among the ‘credit users’.
� Likelihood of Servicer Bankruptcy/Replacement
Servicer bankruptcy is not only a trigger event in revolving structures but alsocould lead to a significant deterioration of the collateral pool performance at leaston a temporary basis, e.g. an increase in delinquencies and losses, which affectsthe lower tranches in the ABS structure first.
Overall, the ability to replace a servicer of a credit card pool in the US, forexample, is fairly high without much delay, while that may not be the case inEurope. This likelihood, though, should be evaluated against the currentcreditworthiness of the servicer (usually also the originator) – in Europe all thecredit card issuers for example are investment grade banks.
In both cases above, originator’s ability to manage the pool and a servicerbankruptcy would effect the ability to build-up an additional reserve accountamong other things.
� Applicability of the Reserve Accounts
A key issue for subordinated investors to understand is the applicability of thereserve account, i.e. whether it is available to the senior investors or is availableonly to the subordinated investor, be it the mezzanine or the equity one. It is fairlyobvious that a reserve account ‘reserved’ for the sub investor reduces the amountof losses it can experience. On the other hand, such an account may be providinga false support for the senior investor.
� Losses and Credit Enhancement
In order to determine the level of protection provided by the credit enhancement,investors should compare the current, expected and historical portfolio losses tothe available credit enhancement at their position in the capital structure.
In this regard, we would like to stress several points:
• When sizing the credit enhancement the rating agencies generally assumezero or negative excess spread.
• In case of amortising assets, the seasoning of the pool with reference to therelevant static loss pool curve becomes crucial in determining the expectedloss developments. That should also be valid for revolving pools which allowaddition of new receivables but not of new accounts.
• Pool losses should be adjusted for pool growth. Rapid pool growth couldmask loss increases because newly added accounts have initially low lossesand delinquencies. In case of an early amortisation, however, no newadditions are allowed and then the losses of the underlying pool shouldincrease and test the sufficiency of the available credit enhancement.
� Effects of Payment Rates
One of the key variables of the pool performance is the payment rate. Paymentrate has potentially different effects on investors:
• On the one hand, it determines how fast the pool pays down, i.e. how quicklyinvestors are out of their positions.
• On the other, it determines how quickly the pool quality deteriorates, as thebetter borrowers tend to pay first.
The combination of the two determines the level of losses that the pool couldaccumulate – the lower the payment rate, the higher the accumulated losses, thehigher the investor exposure.
Though remote, the ability toreplace a servicer should be
considered
Investors need to evaluate theirloss expectations against
available enhancement

ABS/MBS/CMBS/CDO 101 – 16 July 2003
Refer to important disclosures at the end of this report. 59
� Waterfall Priorities
ABS capital structure determines the prioritisation of cash flows among differenttranches. The senior tranche (usually rated AAA) is the one, which usuallyreceives its payments of interest and principal first – that assures that any cashcollections first service the senior tranche. As for the subordinated tranches, oneshould understand how the interest and principal cash payments are distributed,for example:
• Whether interest is paid pari passu or sequentially for the senior andmezzanine tranche;
• Whether principal is paid pro rata or sequentially for the senior andsubordinated tranches;
• Whether interest payments for the junior tranches can be subordinated toprincipal payments for the senior tranches; and
• Whether there is some kind of a trigger, which changes the priority of interestor principal distribution during the life of the transaction.
As a rule of thumb, with the risk of stating the obvious, it is best for asubordinated tranche to receive its interest on a pari passu basis and its principalon a pro rata basis.
� Likelihood of an Occurrence of a Trigger Event
The trigger events (early amortisation events) in unsecured consumer loan andcredit card ABS are associated with two types of negative events – one effectingthe originator and/or servicer and their ability to perform their obligations, and theothers associated with the quality of the asset pool.
The potential negative impact for the occurrence of an early amortisation event ismore likely to be greater at subordinated tranche level than on senior tranche level.Hence, it is more important for the subordinated tranche investor to evaluate thelikelihood of such an event taking place. Their occurrence will lead to changes inthe average life of the ABS notes. Depending on the nature of the event, it couldhave the consequences of increasing volatility in pool performance and rapidreduction in excess spread (reduced cushion against losses and inability to buildadditional reserves).
� Specific Features of Master Trust Structures
• When evaluating the credit quality of the different subordinated tranches fromseries issued by a master trust, several additional aspects come intoconsideration.
Utilisation of Excess SpreadAs discussed in the appendix all master trusts are not the same. They differ in theways cash flows are allocated and distributed among the numerous series of notesoutstanding. In particular, investors should be aware of the ability to allocateexcess spread from series with a surplus to others that face shortfalls in theirrequired cash flows.
In that respect a proper question to ask is how the performance of the outstandingseries of the trust affect the performance of the particular series held by theinvestor? The different series in a trust are exposed to the same level of yield andsame level of losses and servicing fee expenses, but to different levels of couponpayments, i.e., interest expenses and other expenses (swaps, etc.); as a result theservicing shortfall/excess may differ among series. In some cases, the shortfalls(when they are very large) may be shared by all series, in other cases they may belimited to the respective series facing a shortfall. Yet in other cases, excess spreadfrom one series may be re-directed to series facing shortfalls.
Investors should evaluatestructural mechanics that could
result in the redirection ofexcess spread

ABS/MBS/CMBS/CDO 101 – 16 July 2003
Refer to important disclosures at the end of this report. 60
In addition, the series may have certain specific excess spread capturemechanisms, which require accumulation of excess spreads in a designated reserveaccount for the benefit of that series or its most junior tranche under certaincircumstances. Consequently, the excess spread from that series available to otherseries in the master trust would be reduced. In most cases of master truststructures any residual excess spread is released to the originator. One exceptionis the aircraft master trust structure, where in some cases the excess spread is usedto ‘turbo’ the principal repayment of the senior bonds outstanding.
• The location of principal from non-amortising to amortising series, or fromnon-accumulating to accumulating series.
Utilisation of Principal CollectionsAnother key point in a master trust structure is the allocation of principal to repaythe series, or put differently, the type of amortisation. The principal can be:
• Accumulated in a special account to ensure a bullet payment at expectedmaturity of the notes (the so-called accumulation structure meant to establisha soft bullet), for example: the CARDS Master Trust; or
• Passed-through to investors up to a specified amount (controlled or regulatedamortisation structure), for example: Arran One MT, or fully (rapidamortisation structure, usually a result of the occurrence of a trigger event inall master trusts).
In this regard, it is the level of principal payment rate that determines the speed ofaccumulation of the principal to achieve the soft bullet structure or the speed ofamortisation in case of rapid amortisation. In case of controlled amortisation therequired principal payment rate necessary to meet the required controlled principalpayment amount is usually much lower than the actual pool principal paymentrate.
In a typical credit card master trust structure the revolving period is followed byan amortisation or an accumulation period. In a mortgage master trust structure therevolving period may be interrupted in order to accumulate collected principal andprepayments, and resume upon payment of the soft bullet. Under normalcircumstances, in a master trust there are series in a revolving period and in anaccumulation/amortisation period. Hence, principal from the revolving series maybe re-directed to support series in their amortisation or accumulation periods.Such redistribution mechanism will not work if all series are accumulating oramortising simultaneously.
With regards to the amortisation or accumulation period, a corollary question isrelated to the speed of amortisation or accumulation. The payment rate becomesimportant as it determines the likelihood of extension affecting in a dominofashion the senior and the junior tranches.
4.2 Break-even and Sensitivity Analysis
Many of the issues we discussed above can be put into perspective through cashflow simulations of any given deal. We believe that such simulations areparticularly important in the analysis of subordinated tranches. They involve theapplication of stress scenarios to one key variable of the asset pool in order todetermine the effect on cumulative losses for the pool, hence potential losses forinvestors at a different levels of the ABS capital structure.
We use in-house developed credit card ABS default model, to stress certain keyportfolio statistics to determine the break-even loss rate that a hypothetical creditcard ABS can withstand before the most junior class loses a dollar of eitherinterest or principal. We illustrate our approach through an example.
We assume a sample capital structure of 10% subordination, hence 90% AAArated Class A, 6% A rated Class B, and 4% BBB rated Class C. Initially, weassume a base case of 8% payment rate, 6% charge-off rate, no reserve account,and no trapping of excess spread. First, we alternatively stress the payment rateand the charge-offs rate to determine loss accumulation and compare it to the
Spread traps can be unique to aseries, reducing the amount
available to other series
Principal can be re-directed tosupport series in their
accumulation phase
Break-even and sensitivityanalysis are based on a specific
example

ABS/MBS/CMBS/CDO 101 – 16 July 2003
Refer to important disclosures at the end of this report. 61
available credit enhancement level (excluding excess spread and reserve account).Second, we evaluating the role of the reserve account and excess spread trappingon the cumulative loss levels.
� Effect of Payment Rate on Losses
As noted earlier, the payment rate is the percentage of outstanding balances paid(collected) on average monthly. Our first stress test aims to evaluate the impact offluctuations in the payment rate on principal amortization and cumulative losses.To this end we stressed our base case payment rate of 8% by 50% and 100%.
Chart 26: Payment Rate Analysis
0%
20%
40%
60%
80%
100%
0 5 10 15 20 25 30
0%
2%
4%
6%
8%
10%8%
12%
16%
Principal Outstanding Cumulative Losses
Source: Merrill Lynch
Our example reveals that payment rates are inversely related with cumulativelosses and length of amortization period. Intuitively as the payment rate increasesthe time required to make the necessary principal payments decreases and,therefore, investor’s exposure decreases as well. Notably, with less outstandingprincipal exposed to time, cumulative losses decrease. We are left to draw theconclusion that any increase in payment rates is positive for our investor.
Investors in subordinated tranches need to evaluate the factors that could cause thepayment rates in portfolios to fluctuate, and in particular slow down. These rangefrom the seasonal (Christmas time, summer holidays), to the fiscal (taxes) andmacroeconomic (unemployment, interest rates). For example, in any period ofeconomic slowdown, the subordinated investor must evaluate the extent to whichthe changing conditions could slow payment rates. Will consumers feeling thepinch slow down repayment, or will they defensively seek to clear debt burdenscutting corners elsewhere? Answering these questions requires an examination ofthe portfolio’s aggregates and understanding consumer behaviour in the respectivecountry. The seasoning of the accounts, the average balances outstanding, thetypical utilization of the credit line or credit card, the average interest rate are allfactors bearing upon payment rate volatility.
� Effect of Monthly Charge-Offs on Losses
In this stress test, we evaluate the extent to which changes in charge-off ratesincrease cumulative losses. Intuitively we know that cumulative losses will rise.The question, however, is the extent to which charge-offs can fluctuate withoutcompromising the performance of a subordinated piece. To this end, weincreased our base case of 6% by 100% and 200% respectively.
A decrease in payment ratesaccelerates the accumulation of
losses

ABS/MBS/CMBS/CDO 101 – 16 July 2003
Refer to important disclosures at the end of this report. 62
Chart 27: Charge-Off Analysis
0%
20%
40%
60%
80%
100%
0 5 10 15 20 25 30
0%
4%
8%
12%
16%
20%
6% 12% 18%
Oustanding Principal Cumulative Losses
Source: Merrill Lynch
In all three cases losses wipe out Class C principal in its entirety. In our base case,losses reach Class B principal very near to the transaction’s maturity. Increasingour base case by 50% produces a large impact on losses. The first dollar of lossoccurs substantially earlier in the transaction (approximately the ninth month).Cumulative losses for the B piece increase to nearly six dollars of principal,essentially eating through the entire piece. Further increasing the stress to doublethe base case causes losses to eat through both the Class B and C pieces. Class Alosses amount to over four dollars of principal.
What is notable in this nightmare scenario is that cumulative losses never increaseby the same magnitude as the change in charge-off rates. This is due to theconstant amortisation of principal. In a real world example, similar results wouldhold true accumulation period of a transaction. By extension this suggests thatincreases in charge-off rates are most damaging to a transaction when they occurduring the revolving period, leaving the full principal amount exposed to theincrease in loss.
For subordinated tranche investors, the question is whether an increase in charge-off rates is a temporary fluctuation or an indication of erosion of the underlyingportfolio’s credit quality. In this regard the investor needs to turn to thetransaction’s performance monitoring for guidance. The investor needs to notonly evaluate changes in charge-off rates, but the evolution in the trust’s arrearsprofile. A steady increase of amounts in all arrears bands suggests erosion ofportfolio credit quality. No change in the arrears profile suggests a blip.
The investor can look further into the matter by examining the same sort of detailconsidered for changes in payment rates. However in this case the question is notwhat will cause borrowers to slow down repayment, but cease it all together? Aswith all forms of default, it is a matter of willingness and ability to pay. Thoughability to repay (liquidity) is not captured as a credit card variable, a proxy existsfor willingness in the distribution of the portfolio’s credit scores.
It is worth, however, emphasizing one more time that this simulation assumes zeroexcess spread and no reserve account. In a more realistic scenario, the monthlyexcess spread would dampen the accumulation of losses, by absorbing monthlyloss fluctuations out of the reserve account. We discuss this issue in the followingsection.
Cumulative loss rates lag thechange in charge-off rates

ABS/MBS/CMBS/CDO 101 – 16 July 2003
Refer to important disclosures at the end of this report. 63
� Reserve Accounts Effects
Our final example seeks to quantify the support that exists beneath a transaction’srated tranches, namely reserve accounts and excess spread. Hitherto our exampleshave assumed that neither a reserve account nor the trapping of excess spread is inplace. For analytical simplicity we will assume the inclusion of a fully fundedreserve account sized at 5% of the portfolio’s notional amount.
For the first time in our stress testing our Class C notes emerge with their principalvirtually intact. Unlike our base case (where cumulative losses are just over 5%),cumulative losses with the 5% reserve account total 20 bps. Clearly, the amountof credit enhancement beneath the “C” piece is key to evaluation of subordinatedtranche performance.
Typically structures that include “C” pieces provide for the provision for charge-offs out excess spread and for an excess spread funded reserve account. Aspointed out earlier the level of excess spread in the transactions typically dictatesthe required funding level of the reserve account. This generally ranges between0% to the equivalent of 4% of the portfolio’s notional value.
With charge-offs met out of excess spread funded reserve account, the majority ofcapital losses borne by our Class B and Class C notes in our example would nothave occurred. Further, had excess spread fallen below zero on a three-monthrolling average basis the transaction would have gone into early amortisation.
The risk for investors, however, is a sudden drop in excess spread that preventsfull funding of the reserve account and triggers an early amortisation of thetransaction. In that respect, comfort with the excess spread volatility of aparticular transaction and the adequate management of the servicer of the factorsthat affect excess spread, as discussed above, become crucial.
Chart 28: Reserve Account Analysis
0%
20%
40%
60%
80%
100%
0 5 10 15 20 25 30
0%
2%
4%
6%
8%
10%0% Reserve Account
5% Reserve Account
Principal Outstanding Controlled Accumulation
Source: Merrill Lynch
An important question for investors is the cause and duration of any changes inexcess spread. A one-off drop in excess spread due to accounting adjustment is nocause for concern, while gradual yet rapid decline would create problems. Forexample, trust excess spread on MBNA International Bank’s master trust droppedfrom 6.65% in November 2000 to 1.41% the following month. The dramaticdecline is no cause for alarm - it is the result of an exceptional item resulting fromMBNA’s implementation of the FFEIC’s common charge-off policy. Theimplementation expedited the charge-off of long term arrears as a one-off item.
Reserve accounts delay the firstand reduce the cumulative loss
to investors
Table 16: Sample S&PReserve Account
3-month ExcessSpread
Required ReserveAmount
> 4.54% 0.00%4.0% to 4.5% 1.50%3.5% to 4.0% 2.00%3.0% to 3.5% 3.00%< 3.0% 4.00%
Source: S&P
Subordinated investors shouldfocus on the cause and duration
of excess spread declines

ABS/MBS/CMBS/CDO 101 – 16 July 2003
Refer to important disclosures at the end of this report. 64
Indeed trust excess spread returned to 6.5% during January 2001. Of greaterconcern would have been a gradual erosion in excess spread from 6.6% to 1.4%over a period of a few months, which would suggest an erosion of portfolio creditquality, diminishing the credit enhancement available beneath the subordinatedpieces.
� In Conclusion
ABS capital structure allows investors to assume different risks and achievedifferent awards by taking a view on the performance of a specific asset pool andits originator/ servicer. The lower the investor moves down the capital structure,the more intensive the credit analysis becomes and a more sophisticated cash flowreview is required. The a priori understanding of the collateral pool and itsexpected performance, and the subsequent close monitoring of its actualperformance are more time consuming. However, the rewards, as evidenced bythe yield pick-up when moving down the credit levels, would compensateinvestors for that.

ABS/MBS/CMBS/CDO 101 – 16 July 2003
Refer to important disclosures at the end of this report. 65
5. Key Consideration for MasterTrust Structures

ABS/MBS/CMBS/CDO 101 – 16 July 2003
Refer to important disclosures at the end of this report. 66
Following its introduction in the mid-1990s, the Master Trust quickly becamethe typical structure for credit card securitisations. Since then itsapplicability has expanded to embrace other asset classes: unsecuredconsumer loans, corporate loan obligations, residential mortgages, etc. As aresult, inevitable evolution in the structure has taken place. Though manyinvestors are comfortable with the basic operation of the Master Truststructure, we believe that a detailed understanding is necessary whenfocussing on the subordinated tranches of series issued by a master trust.
� Basic Structure
Generally, a credit card ABS is issued by a trust as a series of investor certificatesand a seller certificate (also known as the seller’s interest). Certificates giveinvestors undivided beneficial interests in a pool of assets. This element of sharedownership differentiates them from the Notes (which are typically issued by ABS)are debt obligations. The use of certificates is intentional as, unlike a discretetrust, Master Trusts can be used to issue multiple series of notes. The same poolof receivables generated by the accounts specifically assigned to the trust secureseach series of notes issued. Further each series of notes has a pari passu claim onthe pool’s yield, less liability for trust’s costs and delinquencies.
� Seller Certificate
The seller certificate’s primary purpose is to absorb the daily fluctuations in theamount of receivables in the trust. Fluctuations in the amount of receivables aredue to many factors including seasonal effects, returns of merchandise, and thereversal of fraudulent charges. As the amount of receivables outstanding declines(increases) the principal amount of the seller certificate also declines (increases).The minimum amount of the seller certificates for most Master Trusts is generallyaround 4-7% of the principal receivables transferred to the trust.
� Investor Certificates
Each series of investor certificates may have several classes. The senior, Class A,is rated AAA while the junior classes, the B and Class C, are generally rated Aand BBB, respectively. Prior to the introduction of BBB pieces, issuers used cashcollateral accounts (“CCA”) or collateral investment amounts (“CIA”). Though allthree methods work to provide the same credit enhancement, they differ in bothcash flow mechanics and marketability. For the purposes of our discussion, wewill only focus on the Class C structure which has grown to be the European normover the past year through transactions by Barclays, Royal Bank of Scotland, andMBNA.
Part of a Master Trust’s appeal for issuers is that it can issue multiple series,thereby spreading the cost across various transactions. Series issued by the sametrust can have different characteristics (e.g., coupons, principal amounts, andmaturities) despite representing a claim on a common pool of assets. For investorsthis raises questions as the manner and extent to which cash flows can be allocatedamongst the series.
� Source and Uses of Cash
There are four - two major and two minor - sources of cash for monthlycollections. The first is the payment of principal. The speed at which this occurs iscalled the payment rate, which is the percentage of outstanding principal repaidon average each month. The second major source of cash is finance chargeincome – the interest on the outstanding receivable balances. The two minorsources of cash are any fees payable on the cards and interchange.
Interchange is a payment of fees generated from the usage of credit card networks.Payable to issuers by the networks, interchange is not always included in thedefinition of income. The sum of interest charges, fees and interchange are theportfolio’s income. Dividing income by the total nominal size of the portfoliogives its yield.
Master Trust Structures rely ona series of building blocks
Investor certificates are thenotes sold to the market
Principal receipts and financecharges are the main sources of
cash

ABS/MBS/CMBS/CDO 101 – 16 July 2003
Refer to important disclosures at the end of this report. 67
Similarly, there are four uses for the cash received. They are ranked in order ofpriority for disbursement. Foremost is payment for the servicing of the portfolio.Typically the portfolio’s seller remains its servicer. Next in priority is payment ofthe fees for the maintenance of the trust. This covers all expenses from corporateservices (accountants, lawyers, etc.) through to trustee fees. The first two uses areadministrative and logistical charges. The final two uses represent the actualperformance of the transaction, namely the payment of interest and principal.Their treatment is detailed at length below. Any funds left over after meeting allcosts is called Excess Spread. Its treatment is also detailed below.
It is important to note that it is convention to express all sources and uses of cashas a percentage of the notional value of the portfolio.
� Redemption ProfilesThe first role of cash flow allocation in a Master Trust is to extend the term the of(mostly) monthly credit receivables to match the term of the notes. Credit CardABS do not contain a static pool of assets. Instead, with each monthly collectionby the servicer, existing receivables are individually discharged either in whole orin part depending upon the principal collected. Rather than pass these principalreceipts directly on to certificate holders, the Trustee uses principal receipts topurchase additional receivables, thereby maintaining the required level ofreceivables in the trust. “Revolving” asset pools in this manner can create CreditCard ABS of varying maturities.
Credit card ABS typically redeem as “soft bullets” in a single repayment ofprincipal. Sinking fund redemptions, however, are possible. A series that has abullet repayment of principal utilises a controlled accumulation feature, while aseries that has multiple principal payments uses a controlled amortisationfeature.
A controlled accumulation structure traps cash received from monthly collectionsuntil it has enough collected to repay the principal in full. The cash accumulatesin a principal funding account (“PFA”), where it is invested in highly rated short-term or money market instruments. This results in negative carry as cash returnsare typically less than the interest rate on the certificates. The time period requiredto accumulate the required amount of cash depends upon the payment rate of theunderlying collateral.
Chart 29: Sample Soft Bullet Redemption
0%
100%
1 11 21 31 41 51 61 71 81 91 101 111
Principal Balance
Rev olv ing Period Accumulation
Period
Ex pected
Maturity
Legal
Maturity
Time
Source: Merrill LynchWith a controlled amortisation structure, equal instalments of principal arepassed-through to investors over a specified period of time (e.g., 6, 12 or 24months). This is an attractive feature for issuers since a shorter accumulationperiod reduces the amount of negative carry experienced by the trust andultimately the seller/servicer. Common in the early days of credit cardsecuritisation, sinking fund redemptions are now rare.
Master Trusts serve to extendthe lifetime of the receivables to
the term of the notes
Soft Bullets use controlledaccumulation
Sinking funds rely oncontrolled amortisation

ABS/MBS/CMBS/CDO 101 – 16 July 2003
Refer to important disclosures at the end of this report. 68
Key to credit card redemption profiles is the concept of soft maturity schedules.All credit card ABS carry an expected maturity date as well as a legal finalmaturity date. The expected maturity date is the planned date of the bulletredemption or the final payment under the sinking fund. The trust’s ability tomeet the payment is a function of the payment rate of the underlying collateral. Ifpayment rates severely under perform from expectations, there is a risk that thatthe trust will have insufficient cash to make the payment. To mitigate this riskthere is a time buffer between the expected and legal final maturity to give thetrust an opportunity to accumulate the required cash. Indeed, a transaction’s ratingtypically address its ability to repay principal in its entirety by the legal finalmaturity not the expected maturity date. Further, missing an expected maturity isnot an act of default, though would understandably be viewed very negatively bythe market. The risk that that a transaction will not be able to meet its expectedmaturity date is called extension risk.
� Cash Flow AllocationsThe cash flow derived from the underlying receivables and charged-off amountsare allocated between the seller certificates and each series of investor certificates.The allocation process occurs in stages. At the highest level, the principal balanceof the seller certificate and, assuming more than one series has been issued, theaggregate principal balance of the investors certificates are used to allocate cashflow and charged-off amounts. Unless the cash flow allocated to the sellercertificate is being used as credit enhancement, or is needed to maintain the sellerinterest at a specified level, it is released to the holder of the seller certificate.
The next level of allocation occurs among each series of investor certificates.There are three primary methods to allocate cash flow and charged off amounts.These methods are used to distinguish three different types of Master Trusts.
Under the first and second method, the amount allocated to each series dependsupon its size relative to the total investor interest. The trust allocates monthlyprincipal receipts among series based upon a floating percentage during therevolving period and a fixed/floating percentage during any other period (e.g., theaccumulation or amortisation period). The trust uses the same formula to allocatefinance charge collections (the interest on the underlying collateral) and chargeoffs amounts. Once allocated to a series, principal collections can be used topurchase new receivables, fund the PFA, or passed-through to investors. Financecharge collections (interest on the underlying receivables) are used to covercoupon payments, charge offs, and servicing fees.
Up to this point the first method and the second method have been the same. Theydiffer in their treatment of excess spread, which represents any excess in financecharge receivable collections. Under the first method (Type 1 Master Trusts),excess spread is related to either the credit enhancement provider or the seller.The holders of the senior class of any series do not have any rights to the excessspread.
In the second method of allocation (Type II Master Trusts), before excess spreadis released to the seller, excess spread for one series is made available to any otherseries that cannot cover its expenses. Varying coupons of each series issued bythe same master trust is the primary reason for different excess spread amongseries. By allowing the sharing of excess spread, early amortisation risk isreduced for series with relatively high expenses. If the situation continues todeteriorate, however, delaying an early amortisation may expose investors toincreased credit risk.
In the third method of allocation (Type III Master Trusts), principal collections areallocated and used in the same manner as the other two methods. The allocationof finance charge receivable collections, however, is quite different. Under thethird method, allocation among series depends upon each series’ expenses (i.e.,coupon, charged off amounts and servicing fees) relative to the combinedexpenses of all series. By allocating finance charge receivables in this manner,series that have more expenses receive more dollars of finance charge collections.
“Soft” redemption schedulesreflect extension risk
There are three commonmethods for allocating cash
flow across series
Methods 1 and 2 differ in theirtreatment of excess spread
Method 3 allocates excessspread in proportion to
expenses

ABS/MBS/CMBS/CDO 101 – 16 July 2003
Refer to important disclosures at the end of this report. 69
As such, series with relative low expenses are subsidising the series with relativelyhigh expenses. The higher expenses are usually the result of relatively highcoupons. Although this allocation method can reduce the credit risk and earlyamortisation risk for series with relatively high expenses, it increases those samerisks for series with relatively low expenses.
Table 17: Sample Allocation of Excess of Spread
Method 1 Method 2 Method 3Series 1 Series 2 Series 1 Series 2 Series 1 Series 2
Yield 18% 18% 15% 15% 20% 20%Expenses 14% 15% 14% 16% 10% 15%Difference 4% 3% 1% -1% 10% 5%Allocated Excess Spread 4% 3% 0% 1% 6% 9%
Source: Merrill Lynch
A final note on the allocation of principal collections, most Master Trusts allowfor the sharing of principal collections. The sharing of principal collections allowsa series that is currently in its accumulation or amortisation period to utilise theprincipal collections allocated to other series that would normally be used topurchase additional receivables from the seller. Recall principal collectionsallocated to a series are used to purchase additional receivables from the sellerwhen such series is in its revolving period or are allocated principal collectionsthat exceed either their controlled accumulation amounts or controlledamortisation amounts. By sharing principal collections, the receiving series canshorten its accumulation or controlled amortisation period.
Once the cash flow has been allocated to each series, cash flow is further allocatedto each class of certificates within a series. Generally, principal payments aremade on a sequential basis, with principal payments made to the holders of theClass A then to the holders of the Class B and then finally to the holders of theClass C. Generally, the interest payments on the Class B is pari passu with theinterest payments on the Class A and the interest payments on the Class C issubordinated to the interest and principal payments on the Class A and B.
� Credit Protection
As previously mentioned the credit enhancement for most credit cards ABSconsists of the subordination of cash flows and, in certain circumstances, reservecash accounts. The subordinated cash flows represent excess spread and juniorclasses.
� Subordination and Reserve Accounts
Generally, excess spread is the amount of finance charge collections remainingafter paying for the current period’s interest payments on Class A and Class Binterest and servicing fee payments and covering the current period’s charged offreceivables. Excess spread is also used to cover unpaid amounts of interestpayments, servicing fees and charged off receivables. In certain structures, excessspread from one series can be shared other series issued by the trust. As discussedabove, the method used to allocate finance charge collections determines at whatpoint excess spread will be shared. The amount of excess spread that is not usedby investors can either be used to fund a spread account, pay fees to providers ofcredit enhancement or be released to the seller/servicer.
The junior classes include a Class B and a class C or a collateral investmentamount (CIA). A Class C is generally structured for institutional investors, whilea CIA is structured for traditional bank providers of credit enhancement. Asnoted, we will be focussing only on the investment merits of the Class C. Cash, ifavailable, is usually deposited into a cash collateral account (CCA) which supportsthe Class A and Class B and a spread (reserve) account, which supports the ClassC. The CCA is usually fully funded at closing. The spread account may be fullyfunded, partially funded or unfunded at the time of issuance. If the spread account
The sharing of principalcollections is also possible
Excess spread typicallyrepresents the first layer of
credit protection
The junior “tranche” in atransaction can be structured in
different ways

ABS/MBS/CMBS/CDO 101 – 16 July 2003
Refer to important disclosures at the end of this report. 70
is partially or unfunded at the time of issuance and additional deposits arerequired, such amounts are funded by excess spread. Additional amounts areusually required, if the excess spread is below certain predetermined levels.
The amount of credit enhancement depends upon a variety of factors, includingthe capability of the seller/servicer to manage its credit card business, collateralperformance (e.g., defaults, delinquencies, portfolio yield, and payment rate) andthe transaction’s structure.
As previously mentioned, the reserve account supporting the Class C can either befully-, partially, or unfunded at the time of issuance. If it is partially or unfundedthe structure will provide a mechanism to trap cash flow in the spread accountuntil it reaches a specified level. The ability to fully fund the spread account willdepend upon how quickly the portfolio’s credit quality deteriorates. Thoughexcess spread is expected to be able to fund the reserve account during a shortperiod of time, it is susceptible to the risk of a sudden, sharp erosion in portfolioyield. As such there is a risk that the structure might not be able to fund thereserve account to the required levels, thereby weakening the transaction’sexpected credit enhancement.
Early Pay-out EventsCredit card ABS benefit from structural protections that require the earlyrepayment of principal if certain adverse events occur. These events are classifiedas either series related or trust related. A series related pay out event would resultin the early repayment of only the affected series issued by the master trust.
Series related events include the following:
• The average excess spread for any three month period is less than zero.
• The principal balance of any class of certificates is greater than zero after theexpected final payment date.
• Failure by the seller to add receivables when required.
• Failure by the seller/servicer to make required payments.
• Failure of the seller/servicer to cure any breach of its representations orwarranties.
• Failure by the servicer to replace any interest rate swap or interest rate capprovider counterparty that does meet the minimum credit rating requirements(in some cases).
• Trust related events include:
• Insolvency of the seller/servicer.
• The trust is deemed to be an investment company.
� Seller/Servicer Support
Despite the legal separation between seller/servicer’s and the transaction, mosthave a strong interest to have their transactions perform successfully. Reasonsrange from reputational risk to the desire not to compromise future access to theABS capital markets. This results in an unwritten form of credit enhancementcomes in the guise of “moral” support from the transactions’s seller/servicer. Thisconsists of providing “support” to credit their credit card ABS, which was notrequired under the legal documentation. Possible methods include over-collateralising investor certificates or substituting assets of a superior creditquality into the pool.
Though this is yet to publicly occur in European Credit Card ABS market, a USexample is First Union who subordinated its right to receive a servicing fee toABS holders. For example, Mercantile discounted principal receivables whichincreased the trust’s portfolio yield. Similarly, Banc One (First Chicago) addedbetter performing seasoned accounts to its trust.
Table 18: Sample S&P ReserveAccounts3-month ExcessSpread
Required ReserveAmount
> 4.54% 0.00%4.0% to 4.5% 1.50%3.5% to 4.0% 2.00%3.0% to 3.5% 3.00%< 3.0% 4.00%
Source: S&P
Both series and trust relatedevents could prompt the early
amortisation of principal
Though not an explicit form ofenhancement, seller “support”
is an important protection

ABS/MBS/CMBS/CDO 101 – 16 July 2003
Refer to important disclosures at the end of this report. 71
Providing moral support is not without some cost to seller/servicers. Bysupporting deals after the fact, bank issuers of credit card ABS risk losing theiraccounting and regulatory off balance sheet treatment. Although investorsgenerally prefer deals that do not need support, most investors welcome suchsupport as its maintains the rating of the ABS. Investors should be aware that atthe time of “support” these deals generally trade at a concession to the overallmarket. Further, though in many cases “support” can be expected, it should neverbe counted on. This point should be made even more firmly given the recentlypublished second draft of the proposed BIS capital adequacy guidelines. Inrevolving structures with early amortisation features, for example, triggering earlyamortisation leaves banks exposed to the need to fund newly generated receivableson-balance sheet (since collections are used to rapidly repay the outstandingsecuritisation bonds). This could result in liquidity pressures. In addition, there isa potential for reputational damage due to an early amortisation triggered by poorpool performance raising the stakes for the originating bank to find ways toimplicitly support the transaction. As a result, the Committee seeks to addressthese risks by introducing a minimum capital requirement of 10% (or higher, up to20%) of the notional amount of the off-balance sheet securitised pool of suchsecuritisations.
� Master Trust Evolution
Following its introduction in the mid-1990s, the Master Trust quickly became thetypical structure for credit card securitisations. Since then its applicability hasexpanded to embrace other asset classes: unsecured consumer loans, corporateloan obligations, residential mortgages, etc. As a result, inevitable evolution in thestructure has taken place. Launched in September 2000, Citibank Credit CardIssuance Trust (CCCIT) represents the latest evolution. The structure is notablefor its ability (subject to required credit enhancement levels) to issue the differenttranches at individual points in time, rather than all at once. The program debutedin September 2000 with the placement of a $800 mln C piece. Over the remainderof 2000, the trust intermittently issued $4.5 bln in Class A and $500.0 mln in ClassB notes on the back of pre-placed Class C notes.
The structure operates by re-packaging certificates purchased from Citigroup’sCitibank Credit Card Master Trust. These certificates are used as the collateral toback the issuance of notes from CCCIT, for which it has a shelf registration. Asnoted, the CCCIT is able to issue tranches at its discretion, provided that thefollowing credit enhancement levels are available. They are 12.25% below theAAA rated Class A notes, 7.0% below the A rated Class B notes, and theavailability of a reserve fund below the BBB rated Class C notes. As with otherstructures, the required funding level of the reserve account is a function of theamount of available excess spread.
We believe the structure provides a positive model for European transactions forthe following reasons.
Timing Flexibility – Structured to be MTN-like in its ability to issue on demand,the structure allows the issuer to discriminate between changes in appetite alongthe credit curve and respond appropriately. This enables an issuer to respondtactically to favourable demand conditions as well as meeting on-going fundingrequirements. Further, it reduces the pressure on issuers to place subordinatedpieces when attempting to fund during difficult market periods.
ERISA Eligibility – Eligible investments for US pension plans is governed by theEmployment Retirement Investment Savings Act (ERISA). Understandably,securities enjoy a liquidity benefit from ERISA eligibility. ERISA providesdifferent treatments for equity and debt. Due to their shared ownership properties,ERISA regulations treats certificates as equity not debt. While investment gradenotes may be purchased by funds, pass-through certificates typically must pass the“100 holders rule”. Under the 100-holders rule securities must be held by at least100 investors to be an eligible investment for pension funds. Though the ruleapplies to all certificates issued from trust regardless of credit rating, it has

ABS/MBS/CMBS/CDO 101 – 16 July 2003
Refer to important disclosures at the end of this report. 72
historically been hardest for subordinated tranches to pass the test given theirrelatively small sizes. By issuing all tranches within a series as notes, CCCIT by-passes this issue. In past other issuers have used a second trust to packagecertificates into notes, but primarily at the BBB level.
Application to MBS – One of the most important innovations in the securitisationof mortgages is the application of the master trust structure, typically associatedwith credit card ABS, to residential MBS. Pioneered in the UK, it quickly gainedfavor with the largest mortgage originators and securitisers, leading to theestablishment of large securitisation programs with regular multi-currency andmulti-tranche issuance.

ABS/MBS/CMBS/CDO 101 – 16 July 2003
Refer to important disclosures at the end of this report. 73
6. Commercial Real Estate andSecuritisation

ABS/MBS/CMBS/CDO 101 – 16 July 2003
Refer to important disclosures at the end of this report. 74
Securitisation techniques are often used to package disparate exposurestogether, allowing for diversification. However, the range of commercial realestate securitisations available is even wider than for traditional MBS orABS: from single-loan or single-borrower transactions to multiple-loanportfolio transactions. The investment landscape is complex too. Suchtransaction diversity requires different analytical approaches and investorconsiderations. Nevertheless, one can always begin with an assessment ofdebt-service coverage, tenant quality, lease types, and property valuation.
6.1 Investment Landscape
The European investment market for commercial property is dominated by realestate in six countries: the UK, Germany, France, the Netherlands, Sweden andItaly. Of these, the UK investment property market accounts for roughly one-fourth of total investment property. Several different aspects determine thelandscape of the European property investment market:
� Owner-Occupied vs. Tenant-Occupied
Greater focus on corporate profitability on the part of UK corporates has beenpartly responsible for the relatively large supply of UK investment property, as aresult of the transition over the last twenty years from owner-occupiers to tenant-occupiers. This shift is only beginning on the Continent, and France, Italy andSpain, among others, still consist of a preponderance of owner-occupiedproperties. Over the next decade, we expect increased supply and liquidity inContinental markets, as the Continent experiences its own shift of occupiers out ofthe role of property owners, particularly governments or ex-governmentcorporates, and into the role of lessee.
� Property-Type Mix
The UK and Continent also differ by types of property available in the real estateinvestment market. The UK market remains the most transparent market, andlong lease structures have facilitated historic property lending in the retail andoffice sectors. Office properties represent just under 40% of UK commercialproperty stock, and retail properties a further 40%. Industrial property accountsfor much of the remaining 20% of stock. In contrast, Continental commercialproperty markets consist of 50 to 70% office properties, less than 10% retailproperties (excluding Ireland), and less than 5% industrial properties. The balanceof Continental properties consists of multi-family/housing association residentialreal estate.
� Effects of Consumer and Corporate Cycles
European commercial property markets exhibit unique cycles because of varyingdegrees of correlation with the corporate credit and consumer credit cycles. Thecorrelation reflects the characteristics of the underlying tenant mix. In particular:
• Office property rental values are correlated to the fortunes of the serviceindustries.
• Industrial properties are correlated to manufacturing and distribution.
• Retail and multi-family properties are correlated to the consumer economy.
• Hotel properties are correlated to tourism and business and consumerconfidence.
The largest commercialproperty market remains the
UK, but market forces willcontinue to increase supply and
liquidity on the Continent
Commercial property is neitherdirectly correlated to the
corporate cycle, nor to theconsumer cycle
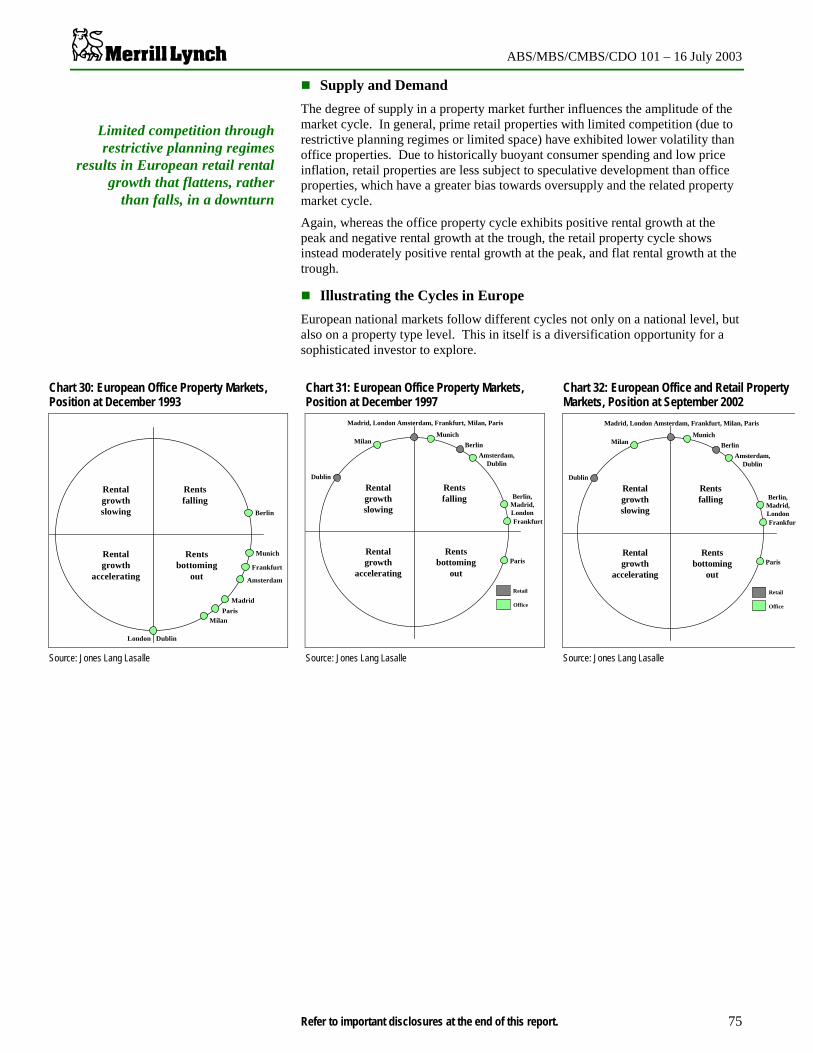
ABS/MBS/CMBS/CDO 101 – 16 July 2003
Refer to important disclosures at the end of this report. 75
� Supply and Demand
The degree of supply in a property market further influences the amplitude of themarket cycle. In general, prime retail properties with limited competition (due torestrictive planning regimes or limited space) have exhibited lower volatility thanoffice properties. Due to historically buoyant consumer spending and low priceinflation, retail properties are less subject to speculative development than officeproperties, which have a greater bias towards oversupply and the related propertymarket cycle.
Again, whereas the office property cycle exhibits positive rental growth at thepeak and negative rental growth at the trough, the retail property cycle showsinstead moderately positive rental growth at the peak, and flat rental growth at thetrough.
� Illustrating the Cycles in Europe
European national markets follow different cycles not only on a national level, butalso on a property type level. This in itself is a diversification opportunity for asophisticated investor to explore.
Limited competition throughrestrictive planning regimes
results in European retail rentalgrowth that flattens, rather
than falls, in a downturn
Chart 30: European Office Property Markets,Position at December 1993
Chart 31: European Office Property Markets,Position at December 1997
Chart 32: European Office and Retail PropertyMarkets, Position at September 2002
Rentalgrowthslowing
Rentsfalling
Rentalgrowth
accelerating
Rentsbottoming
out
London Dublin
Madrid
Munich
Paris
Amsterdam
Berlin
Frankfurt
Milan
Madrid, London Amsterdam, Frankfurt, Milan, Paris
Rentalgrowthslowing
Rentsfalling
Rentalgrowth
accelerating
Rentsbottoming
out
Frankfurt
Munich
Paris
Berlin,Madrid,London
Berlin
Amsterdam,Dublin
Milan
Dublin
Retail
Office
Madrid, London Amsterdam, Frankfurt, Milan, Paris
Rentalgrowthslowing
Rentsfalling
Rentalgrowth
accelerating
Rentsbottoming
out
Frankfur
Munich
Paris
Berlin,Madrid,London
Berlin
Amsterdam,Dublin
Milan
Dublin
Retail
Office
Source: Jones Lang Lasalle Source: Jones Lang Lasalle Source: Jones Lang Lasalle

ABS/MBS/CMBS/CDO 101 – 16 July 2003
Refer to important disclosures at the end of this report. 76
6.2 CMBS: Securitised Property Portfolios
Unlike other types of securitised collateral, European CMBS are not homogeneousasset pools that are automatically suited to statistical analysis. In fact, CMBS inEurope come in a variety of shapes and sizes, and often different property typesand geographic locales are packaged together to enhance diversification benefitsfor investors.
� Major Transaction Types
In creating European property securitisations, there are three major types oftransactions employed, each of which require a somewhat different analysis.Chart 33 succinctly lays them out and illustrates each with actual transactionsexecuted in Europe in recent years. With each type of transaction, a different riskis contemplated, and each transaction type may include one or more propertytypes:
• Portfolio transactions generally refer to multi-borrower, multi-propertydiversified loan pools with more than 50 to 100 individual loans.
• Multi-borrower diversified loan portfolios (UK balance sheet, German andItalian transactions to date) best employ a similar analysis to that of USconduit transactions – primarily an actuarial analysis.
• Property transactions generally refer to multi-borrower loan pools with lessthan 20 loans with a potentially wide or narrow range of properties. Thesetransactions are often classified as “conduit” transactions.
European conduits, despite their moniker, in many ways do not resemble theUS-style CMBS conduits, which are more akin to the portfolio-typetransactions above. European conduits warrant instead a large-loan, orfundamental, analysis. These large-loan transactions may be further brokendown into two sub-groups, based upon whom the cash flows of the loan and,hence, the notes rely:
• - Those containing properties with a diversified tenant base.
• - Those with a few tenants.
The former group requires predominately a property analysis, whereas thelatter requires both a property and a tenant analysis.
Multi-borrower pools with between 20 and 50 loans require a hybridapproach, both an examination of the large and/or riskier loans, as well asscenario analysis to determine portfolio impact of loan delinquencies anddefaults.
• Tenant transactions generally refer to sale-leaseback, single-borrowersingle-property loans and single-borrower multi-property loans with longtenancies.
• Single-property transactions resemble traditional securitisations even less, andare really more of an investment in a particular property, particular tenant orgroup of tenants and precise property market (or business district). Althoughrisk is tranched, the normal benefits of property diversification seen in mostsecuritisations are not present. These transactions do, however, varyconsiderably if the property in question is an office building, retailestablishment, industrial warehouse or hotel property, each of which has adifferent cycle, expenses and tenant mix, as noted in the chapter on The FourCornerstones of Commercial Property.
• Finally, due to an emergent trend of European corporations and governments(particularly on the Continent) shifting from owner-occupants to tenants, sale-leaseback CMBS have become increasingly common. Sale-leasebacks areeffectively secured bonds of the property tenant – again, very different fromother CMBS transactions.
Some CMBS portfolios may besuited to a statistical analysis,
others require morefundamental property
assessment
European conduits do notresemble US conduits, but are
more akin to a large-loanportfolio
Where a single tenant is a long-term occupier, the property
itself becomes secondary to thecredit quality of tenant

ABS/MBS/CMBS/CDO 101 – 16 July 2003
Refer to important disclosures at the end of this report. 77
Chart 33: Types of CMBS Exposures
CMBS
Portfolio
Diversified Loan Portfolios
(>50 loans)
Conduits & Large Loan Portfolios
(<20 loans)
MultiProperty
•Global Commercial One (Synthetic)•Bamburgh•Duke•Monument•Dolerite•SCIP•GECO (Synthetic)•Wuertthyp EU (Synthetic)•Dutch Dream (Synthetic)•Europa (Synthetic)
•ELOC 1 to 8, and 11•Windermere
•Canary Wharf•Broadgate•Trafford Centre•La Defense•ELOC 12
Other Loan Portfolios
(<50>20 loans)
•Nymphenburg (Synthetic)•Eurohypo 2001-1 (Synthetic)•Real Value One (Synthetic)•Paternoster•Acres•Heritage Mortgage Securities
•Pan-European Industrial Properties•France Industrial Properties•HOTELoC•CIT
Property
Tenant
Sale-Leaseback
Single-Borrower
SingleProperty
•ELOC 9 and 10•IMSER•Telereal
Source: Merrill Lynch
� Transaction Motivation
Not only do the risk profiles differ among the three exposure types, but themotivation behind the transactions and, often, the ongoing servicer commitmentalso vary. We differentiate, by originator, among:
Commercial BanksDiversified multi-borrower portfolios generally represent part of the commercialproperty book of a financial institution seeking to transfer risk from its balancesheet to the capital markets.
DevelopersDevelopers often employ large-loan “property exposure” CMBS in order toachieve lower financing costs than in the traditional bank lending market.
Corporates and GovernmentsCorporates and governments often become the sole and long-term tenants ofproperties within a “tenant-type” CMBS transaction. In these cases, suchinsititutions have sought to divest of non-core assets, restructure the balance sheet,or have desired a source of long-term financing.
Table 19: Typical Motivation Behind CMBS TransactionsExposure Type Institution Purpose of TransactionPortfolio Bank Capital managementProperty Developer Lower cost of fundsTenant Corporate Divest of non-core assets, long-term financing
Source: Merrill Lynch
� Common Aspects of the Analysis of Different Transaction Types
Despite the difference in required analytical framework mentioned above, aninvestor in any commercial property transaction must first take a number offundamental credit views.

ABS/MBS/CMBS/CDO 101 – 16 July 2003
Refer to important disclosures at the end of this report. 78
� Location is the Most Important Determinant of PropertyPerformance
Location is the number one factor determining current and long-term viability ofcommercial real estate. Location implies both the country, as well as the localmarket area and/or city where the properties are situated. In European CMBS, thegeographic location not only impacts the relative position within the commercialproperty cycle, but also the legal and regulatory environments and valuation rigorto which the mortgage loan and property are subject.
Location is so important because the success of any property location depends onthe economy of the area, whose employment, planning and demographic trendsimpact the property’s ability to attract stable tenants on a regular basis.
A portfolio geographically diversified across the major European commercialproperty markets is key to a European CMBS investor’s ability to deliverconsistent returns and avoid the peaks and valleys of credit deteriorationassociated with any single market.
� Debt-Service Coverage
The second most important indicator of commercial property performance is cashflow. The first year net cash flow figure can be derived for any propertyinvestment and represents the EBITDA of the property (or Net Operating Income,“NOI”, in real estate parlance) less capital expenses (e.g. tenant improvements).This figure is then compared with the required debt-service under the loan toarrive at debt-service coverage (“DSCR”) and interest coverage (“ICR”) measures.
Of note, Moody’s DSCR often differs from the published underwriter’s. Incalculating the DSCR, Moody’s assumes a standard annuity amortisation,regardless of the terms of the loan, as well as uses its own forecast of futureinterest and capitalisation rates in order to arrive at the debt-service figures.
It is important to inquire as to the components of NOI and rental income, as theyare not standard across Europe (see the discussion of Lease Terms in the chapteron Legal Aspects of European Commercial Property).
� Loan-to-Value Ratio
In addition to interest and debt service coverage, the other key credit metric is theloan-to-value ratio (“LTV"). The LTV measures the property value relative to thedebt financing. Though an important factor in determining recovery values upon aloan default, the LTV is subject to varying degrees of error depending on the:
• Quality of the appraisal in the related country.
• Elapse of time since the most recent or initial appraisal.
• Relative illiquidity of the commercial real estate market.
• Presence (or lack) of comparable transaction data.
Furthermore, “exit” or “balloon” LTVs do not estimate future increases, or moreimportantly, decreases in property value. Although some properties are re-appraised annually, in general, the LTV is not a mark-to-market measure. ExitLTV therefore indicates only that principal amortisation is occurring, and loansare being re-paid. Though important credit indicators, these are largely capturedalready in DSCR and, as time progresses, speak little about the saleability of aproperty upon the default of a loan (the primary purpose of the LTV ratio being anestimate of recovery value upon default). Investors must therefore take their ownview as to the likelihood of a significant decline in realisable value.
Location, Location,LOCATION
DSCR is generally moreimportant than LTV
Components of rental incomediffer by jurisdiction and
impact coverage ratios andvaluation
LTV is often not marked-to-market

ABS/MBS/CMBS/CDO 101 – 16 July 2003
Refer to important disclosures at the end of this report. 79
� More About ValuationValuation of the properties within a CMBS portfolio is particularly important inportfolios consisting of smaller properties, which may be sold upon enforcement,if necessary. Investors should not, however, place too much emphasis on propertyvaluation for large, unique or illiquid properties. For these properties, e.g. trophyoffice assets or custom fit industrial properties, the liquidity of the asset is verylow, and alternative uses may be quite limited. In such cases, the credit quality ofthe tenant and the lease terms to which they are contractually bound shouldprovide the basis of investors’ cash flow and credit analysis.
Regardless, for multi-property portfolios with smaller, more liquid individualproperty exposures, consistent valuation practices are central to the reliability ofthe LTV measure as an indicator of recovery value upon loan default.
A number of general issues should be noted when considering LTV measures forEuropean CMBS:
• In general, loans with greater than 80% LTV (or DSCR below 1.1) areconsidered higher risk. Sale-leaseback transactions are the exception to thisrule (DSCR’s as low at 1.0 are acceptable, due to the low credit ascribed tothe property value in question).
• The value of the collateral will likely decrease during the foreclosure perioddue to property deterioration and declining rental income. Building permitsmay expire, capital improvements will likely be deferred, and additional fundsto bring the property up to market standards may not be available.
• Disposition proceeds may differ significantly from a dated market valuation.
• If a property is left vacant, due to the default of a single occupier tenant, thepossession value and liquidity of the property will diminish significantly, asinvestment purchasers of the property may be limited to speculative investors.
• Differing views on value are typically captured in the capitalisation rate usedto discount the future rental and other cashflows.
• Fully amortising loans are considerably more common in Europe than in theUS. Loans that fully amortise over the term avert the need to refinance theproperty to re-pay the loan, and hence reduce the risk associated with volatileproperty markets. Nevertheless, such loans may be longer term, increasepressure on debt service ratios during the life of the loan, and introduce therisk of obsolescence and the need for capital improvements.
• As there are fixed costs to foreclose and liquidate a property, which vary byjurisdiction, smaller loans may experience proportionately higher losses.
In addition to these points, a view must always be taken as to the type and qualityof property, outlook for such properties, and the industries to which they areexposed over the near and long term.
� Tenant Concerns in Single Borrower TransactionsIn a single asset transaction, the property is exposed to two major risks,concentrated tenant default and tenant non-renewal. The first depends on thecredit quality of the tenant and its position within the industry in which itcompetes. The second often depends on market rents and the presence (or lack) ofnew, competitive properties built in relative proximity to the existing building. Adiverse and granular tenant base may address the former concern, such that anysingle tenant default impacts the property’s vacancy in only a small way. Thesecond risk may be mitigated by long-term leases, the bulk of which shouldterminate after the loan maturity.
Rating agencies will consider both the duration and timing of the lease roll-off,which are ideally long (most after loan maturity) and wide-ranging, respectively.Assumptions will also be made with respect to re-leasing periods. All else beingequal, a variety of tenant businesses and a high credit quality tenant or tenants willdiminish defaults and increase the likelihood of lease renewals.
Disposition proceeds may differsignificantly from an out-of-
date market valuation
Amortising loans are morecommon in European property
than in the US
Tenant, Tenant, TENANT

ABS/MBS/CMBS/CDO 101 – 16 July 2003
Refer to important disclosures at the end of this report. 80
� Sale-leasebacks are Secured Corporate Debt
Sale-leasebacks are a special case of a single borrower. During the lease term therental cashflows from a single occupying entity flow through to the securitisationinvestor. In European transactions to date, the underlying property has often beenhighly customised for the tenant (such as a utility), and alternative tenants may behard to find. In this case, a European sale-leaseback becomes analogous to a UScredit tenant lease, where the rental income is the sole source of repayment for theissued securities, and the rating volatility of the CMBS is highly correlated to thecredit quality of the tenant. To some degree, structural enhancements can mitigatethe risk of tenant default, e.g. credit enhancement and liquidity facilities sized tocover a void or liquidation period. Liquidity facilities should be placed at theissuer, rather than the loan, level as loan level facilities may have the effect ofputting junior tranche interest payments ahead of senior liabilities in the paymentwaterfall.
In addition, for sale-leasebacks involving regulated entities, the regulator may beable to interfere with the ability of the creditor to evict the tenant or acquire anddispose of the property. The regulator may also be able to modify (i.e. reduce) therent without regard to the property’s cost base or market rents.
� Other Risks to Keep in Mind
In addition to the areas explored above, a number of other areas should becontemplated in assessing the investment merits of a given CMBS transaction,including:
• Construction Risk. Construction of improvements can have a deleteriouseffect upon issued existing securities. Cash reserves or other forms ofenhancement may be sized to accommodate this, but unless this risk istransferred to the tenant, the risk remains that the developer spends above andbeyond intention.
• Form of risk transfer. CMBS risk transfer may be executed in cash orsynthetic format, each requiring careful analysis as to the nature and thetiming of the loss to which the noteholder (or swap provider) is exposed.Often, in CMBS, synthetic transactions expose the investor to a more limitednumber of credit events than the typical cash transaction. This is becauseaccrued interest, costs of foreclosure and recovery may be limited or excludedfrom the definition of loss.
Synthetic risk transfer mayoften reduce the credit exposure
from that of a typical cashtransaction

ABS/MBS/CMBS/CDO 101 – 16 July 2003
Refer to important disclosures at the end of this report. 81
6.3 Legal Aspects of European CommercialProperty
Understanding of the legal framework of one European commercial propertymarket does not transfer directly to that of another, except perhaps in termsof the questions that an investor must ask. The answers will differ accordingto the structural differences in lease terms, tenant rights, planningregulations, valuation methodologies, and asset security and enforcementprocedures. These also influence the timing and nature of commercialproperty cycles between countries and cities and consequently impact theappropriate timing of investments. Understanding these features allowsinvestors to properly compare the plethora of European CMBS transactions,their underlying properties and to make adequate investment decisions.
In analysing CMBS, experience in one European country’s property market doesnot transfer directly to that of another. The most fundamental tenet, that of fullyunderstanding location desirability and competition, remains applicable regardlessof the country in which a property resides. However, the next several majorconcerns of a credit investor may be influenced by the statutory environment inwhich the property resides, including:
• Security of the rental stream;
• Projected growth of rental flows (DSCR); and
• Maintenance or improvement of property value (LTV).
Commercial implications of different legal systems must therefore be borne inmind in order to ensure that rental income flows, loan security and the structuralprotections of similar CMBS investments in different jurisdictions are comparable.
� Lease Terms Vary
Commercial leases across Europe vary as to the balance of property rights andcosts allocated between the tenant and landlord. Lease terms and tenant rightsalso vary between office or industrial tenants, and retail tenants, the latter of whichmay have greater rights in some jurisdictions. All leases other than UK and Irishleases are generally indexed to inflation, in the form of a proportion of the cost ofliving index in the respective country. In any case, the basic factors determiningthe strength of a lease include:
• Term;
• Rental rate;
• Rent review;
• Landlord obligations and tenant rights; and
• Tenant quality.
Lease terms range from considerably landlord-friendly in the UK and Ireland, tomore tenant-focused as one moves south across the Continent. The landlord-friendliness of a selection of European lease terms are arranged from top tobottom, generally most to least favourable.
� Customary and Statutory Recovery Procedures Vary
Unlike the US, there are very few non-performing commercial property specialistsin Europe. Those that do exist usually have an element of US ownership ormanagement. As such, like in the residential market, commercial mortgageoriginators are vertically integrated, managing all aspects of the property loans.As most bank originators felt the pain of the last commercial property recession,many are well equipped to handle (or avoid) problem loans. In fact, as vacanciestrend upwards in a number of jurisdictions, LTVs on new financings havedeclined, as lenders required additional equity in the properties.
Lease terms range fromlandlord-friendly in the UK andIreland to tenant-focused in the
southern European countries
Originating lenders typicallyservice both performing and
non-performing loans

ABS/MBS/CMBS/CDO 101 – 16 July 2003
Refer to important disclosures at the end of this report. 82
Regardless, in most CMBS transactions, it is crucial that an investor understandsthe likely recovery value of the property upon loan default. Three key elementsdetermine this value:
• Procedure to obtain the property;
• Time from property possession until sale; and
• Costs associated with the property sale.
The right to obtain the property lies in the insolvency framework of the relevantjurisdiction. The extent and duration of the possession process varies by legaljurisdiction, ranging from a lengthy court-driven process in Italy (as much asseveral years in length), to creditor friendly foreclosure environments in the UKand the Netherlands (Table 20).
Depending on the length of the foreclosure process, potential losses relating toaccrued interest could be substantial. In jurisdictions where long foreclosure andrecovery periods are possible, the maturity date on underlying loans should beseveral years earlier than those on the issued securities.
Table 20: Foreclosure Periods Vary by CountryCountry Foreclosure ProcessUK Legal repossession process commences, with court order required, and lasts 12 months, on
average. Eviction and sale in open market. No government mandated auction system.Ireland Period of beginning of arrears status to forced sale no longer than 18 months. Presentation
of civil bill, notice of trial/court hearing, order for repossession, execution order,repossession by county sheriff.
Germany 1 to 2-year recovery period.France Foreclosure, 50% more than 1 year, 33% more than 2 years. Creditor must have court
decision to seize property.Italy Lengthy court process with a period of as long as 8 years from time of default to recovery.Netherlands Foreclosure process usually within 3 months.Spain Regulated, new law reduces number of required auctions from 3 to 1 to speed up process.
However, foreclosure or auction is rare, normal course of action renegotiation of rate orterm of debt. Typically 3 years to foreclose.
Source: Merrill Lynch
The costs of selling the possessed property depend on loan size and cost of carry,as well as legal fees, commissions, improvement expenses, and management fees.As an example, stamp tax payable upon property transfer in the event of apossession, differs by jurisdiction and ranges from 3% of the property value inSweden to 10% in Italy (Table 21).
� Valuation Frequency and Methodologies Vary
The key factor to determining the quality of valuation is market liquidity.Liquidity is imperative when determining comparison values and appropriatecapitalisation rates for properties similar to those within a selected portfolio.Liquidity may be assessed by the frequency of commercial properties changinghands within a given jurisdiction. This ranges broadly across Europe, fromLondon and Paris, with the most liquid commercial property markets, to Italy andScandinavia, with the least liquid markets. Although less liquid than Paris andLondon, the key German markets, including Berlin and Frankfurt, exhibit a fairdegree of transaction evidence, as does Amsterdam and, increasingly, Spain.
Some European countries offer greater impartiality (and frequency) in theappraisal process than others (Table 21). Most Continental appraisers use initialyields and recent prices of similar properties to value a property. The UK, Ireland,the Netherlands, and Germany have national professional organisations of which avaluer must be a member. On the other end of the spectrum lies Italy, where theappraisal process is far more subjective and national guidelines are not present.Spain and France fall somewhere in the middle.
The UK and the Netherlandsexhibit the shortest foreclosure
periods; Italy, the longest
Professional organisationsprovide for consistent valuation
methodology in the UK,Ireland, the Netherlands and
Germany

ABS/MBS/CMBS/CDO 101 – 16 July 2003
Refer to important disclosures at the end of this report. 83
In Spain, although valuation companies are independent, they lack a professionalassociation to ensure uniform practices. In the absence of a professionalassociation, valuers may market themselves based upon relatively aggressivevaluations.
Table 21: Appraisal Varies by Country
Country Responsibility for AppraisalUK Valued by surveyors who are members of the Royal Institute of Chartered SurveyorsIreland Independent valuers from Irish Assocation of ValuersGermany Federal Office for Supervision of Credit Sector verifies appraiser’s expertiseFrance Appraisal non-standard, varies by regionItaly Surveyors may be in-house, pre-selected, or selected by borrowerNetherlands Dutch Association of Estate Agents (NVM) and lenders determine foreclosure valueSpain Several large independent valuation companiesSweden Independent valuation companies, discounted cash flow driven
Source: Merrill Lynch
These discrepancies in valuation methodologies are of particular import whenanalysing Continental bank portfolio transactions, often containing loans frommore than one European locale. For continental transactions where the originatorof the commercial loan is a developer or a conduit, internationally recognisedagents and their approved appraisers are used almost exclusively. These propertyappraisers typically use valuation techniques established by the UK Royal Instituteof Chartered Surveyors, without regard for the location of the property.
� Appraisal for Industrial Properties is Cost and Tenant-Based
Apart from London and Geneva, across Europe, industrial rents are relativelyuniform, with prime rents averaging Euro 70 per square meter. Space forindustrial properties is not limited, again apart from London. As such, unlikeretail and office properties, rather than being demand driven, industrial valuationsare more heavily based upon the cost of the building, the length of the lease andany alternative value. For custom fit properties, the credit quality of the tenantand strength of the lease are of utmost importance.
� Country comparison
The table below summarized concisely several structural elements (including leaseterms, tenant and landlord rights, enforcement of security, and planningpermissions) of the commercial mortgage markets in France; Germany; Italy; theNetherlands; Spain; Sweden; the UK and Ireland (see Table 22). Other aspects,which need to be examined include: standard lease terms, tenant rights, sublettingand assignment, planning permissions, appraisal and valuation, security andenforcement. This is a subject to a much more detailed report.
Unlike office and retailproperties, industrial values are
driven most by building costsand lease quality

AB
S/MB
S/CM
BS/C
DO
101 – 16 July 2003
Refer to important disclosures at the end of this report.
84
Table 22: Commercial Property in Europe
Repair and Service Charges Obligations of:
ValuationandRe-valuation
StandardLease
TypicalLeaseLength
Freq. ofRentReview
StatutoryRight toRenewal
Basis ofRentReview
Indexa-tion ofRent
Stamp Taxfor PropertyTransfer
FullRecoveryFromTenant
RecoveryExcl.Structural
Landlordinsures, butrecoversfrom tenant Landlord Tenant
LocalPropertyTaxes
VATpayable onRent
Assign/Sub-Let
TenantRight toTermin.Early
UK Net, OMV,Independent,Annually
Yes 15 years 5 years(upwardonly)
Yes Openmarketrents
None 4% Yes No Yes Minimal Structuraland internalrepairs
Tenant 17.50% Yes/Yes ** Only atbreakclause
Ireland Net, OMV,Independent,at least onceevery 3 years
Yes 20-25years(break atyear 10and 15)
5 years(upwardonly)
Yes (inmostcases)
Openmarketrents
None Up to 6% Yes No Yes Minimal All Repairs Tenant -20-25% ofannual rent
21% Yes/Yes**)
Only atbreakclause
US Gross orNet, OMV,Independent,Annually
Yes(threetypes)
5-10 years None (steprent usual)
No (inpractice,usually forat least 1term)
COLI*** or2-5% fixedpercentageincrease
Annual Varies bystate/ county
Yes, inmanycases
Yes Yes(unlesstriple net)
Dependson whethergross ornet lease
Dependson whethergross ornet lease
Dependson whethergross ornet lease
0% Usuallyprohibited**
Only atbreakclause
Germany Net, “Long-term” value,Infreq
Yes 5-10 years Rare No COLI Annual 3.50% No Yes Yes Structuralrepairs
Normalmaint.Costs
Landlord,butreimbursedby tenant
16%(whereparties optto tax)
No/Yes ** No
Netherlands Net,Independent,Annually
Yes 5-10 years 5 or 10years (if atall)
No (exceptfor retailproperty)
Cost ofLivingIndex(marketreview*)
Annual 6% No Yes No Structuralrepairs
Minorinternalrepairs
Real estatetax: 2-3.5%(owner55%,tenant45%)
19%(whereparties optto tax)
Yes/Yes ** No
Italy Gross,Historicalcost/Independent,Infreq
Yes 6+6 years 6 years Yes 75% ofCOLI
Annual 10%(individual)
No Yes Yes Structuralrepairs
Normalmaint.Costs
Tenant 20%(somelandlordsare exempt)
Usuallyprohibited
Only atbreakclause
Sweden DCF,Historicalcost/Independent
Yes 3-5 years 3-5 years(end oflease)
Yes (inmostcases)
75-100% ofCOLI(aboveinitiallease*)
Annual 3% No Not usual No Structuralrepair andnormalmaint.
Internalrepairs andunusualwear
Landlord(1% ofassessedvalue)
25% (wherelandlordopts to tax)
NA NA
Spain Gross, OMV,Historicalcost/Independent,Infreq
No 3, 5 or 10years
3-5 years(longleasesonly)
No COLI Annual 6% No Yes Not Usual Structuraland internalrepairs
Normalmaint.Costs
Landlord 16% Usuallyprohibited
Only atbreakclause
France Gross,Historicalcost/Independent,Annually
Yes 9 years(tenantbreak every3 years)
3 years Yes INSEECost ofConstruction Index
3 yearly,orannual*
4.8% (slightregionalvariation)
No Yes Yes Structuralrepairs(land tax*)
Normalmaint.Costs
Negotiable 19.60% Usuallyrestricted
At breakclause(tenantonly)
Source: Jones Lang Lasalle, DTZ Research, Merrill Lynch * By agreement ** Subject to landlord approval *** Cost of Living Index

ABS/MBS/CMBS/CDO 101 – 16 July 2003
Refer to important disclosures at the end of this report. 85
7. Basics of SyntheticCollateralised Debt Obligation

ABS/MBS/CMBS/CDO 101 – 16 July 2003
Refer to important disclosures at the end of this report. 86
7.1 Synthetic CLOs Explained
A synthetic CLO is effectively a combination of a short position in a creditdefault swap (allowing the bank to transfer credit risk) and a long position ina portfolio of highly rated bonds (which generates the cash necessary to repaythe synthetic bond). These structures can be fully or partially funded. Keyfeatures to consider include the flow of funds mechanism within the capitalstructure, and the determination and allocation of credit loss. SyntheticCLOs can be de-linked from the bank sponsor through a number ofmechanisms, which assure the synthetic bonds’ credit independence.
� Why Issue Synthetic CLOs?
Synthetic CLOs allow banks to meet their primary objective of managing creditexposure while overcoming many of the limitations of true sale and CLNstructures. Some view them as a refined version of pure CLN structures (limitingor eliminating the credit linkage to the sponsor bank), while others consider thema logical step in the development of credit derivatives structures (from single namecredit default swaps through to portfolio credit default swaps to public partiallyfunded credit default swap structures).
In particular, synthetic CLOs can be structured to eliminate or limit any investorexposure to the credit worthiness of the bank, allowing for credit ratings thatexceed that of the sponsor. Synthetic CLO structures emerged, not surprisingly,during the credit bearish period in autumn 1998 when investors’ were beginning topenalize CLOs with any credit linkage to the bank. Yet like CLNs, however, thebank remains the lender of record and can maintain its confidential businessrelationship with its client that comes with continued servicing of the loan. Non-disclosure of obligor identity is particularly useful in jurisdictions with stringentbanking secrecy regulations.
Table 23: Cash versus Synthetic Securitisation
Cash SyntheticCredit Line Capacity Management Yes YesRegulatory Capital Management Yes YesEconomic Capital Management Depends on First Loss Retention Depends on First Loss RetentionFunding Yes NoOff Balance Sheet Treatment Yes NoTransfer of Ownership Necessary Not NecessaryEase of Execution/Administration Medium HighFlexibility Medium High
Source: Merrill Lynch
One of the other key advantages of synthetic CLOs – and one that is arguably theprimary driver behind growth of European bank synthetic CLOs – is that suchstructures allow for on balance sheet credit hedging of an asset pool that mayotherwise be unsuitable for securitisation, or funding off-balance sheet. Thiswould include unfunded assets (guarantees, derivative positions, etc), loans withrestrictions on assignment or loans from jurisdictions with legal or other obstacleson transferability. Indeed, many synthetic CLOs are referenced to a portfolio ofmulti-jurisdictional loans.
As a matter of course there is much less transaction documentation involved inEuropean synthetic CLO deals compared to the true sale variety – it is enough tomention the absence of an asset sale and transfer agreement. Synthetic CLOsallow banks to avoid the onerous process of combing through each underlyingloan document and unraveling assignment clauses or other restrictions in order tosell the asset. As a result, transaction execution is that much simpler.
Synthetic CLOs can bestructured to be de-linked from
the sponsor, even though thebank remains the lender of
record
A broader range of asset typescan be used as reference
collateral
Transaction execution issimpler

ABS/MBS/CMBS/CDO 101 – 16 July 2003
Refer to important disclosures at the end of this report. 87
� The Cost-Benefit Economics of Synthetic CLOs
Chart 34: Example of Regulatory Capital Relief
Senior N otes (3)L + 27
M ezzanine N otes(4)
L + 60
Junior N otes (3) L + 150
R etained E quity (3)
Fully Funded Partially Funded
F ully F unded / C onventional P artia lly F undedPre-D eal R egulatory C apita l = 8 .00% = 8.00%Post-D eal R egulatory C apital = 3 .00% = 4.39%R egula tory C apita l R elief = 5 .00% = 3.61%C ost Per U nit of C apital R elief = 0.17 bps 0.20 bps
Senior N otes(90)
L +25
M ezzan ine N otes(4)
L +60
Junior N otes (3) L +150
R etained E quity (3)
Super Senior C reditD efault Sw ap
(87)10 bps
E xam ple of funding costs(pa) assum ing 5% L IB O R
29 bps 18 bps
Assumes (1) dollar-for-dollar capital charge on retained equity, (2) 20% risk weight counterparty for super senior swapand (3) assets that collateralize the notes pay LIBOR – 15 bps.Source: Merrill Lynch
The economics of issuing a synthetic CLO is basically a function of the cost ofbuying protection versus the benefit from regulatory equity release. Bankstypically get full capital relief in synthetic transactions where the collateralcomprises zero risk-weighted securities, such as government bonds. Pfandbriefenormally attract a 10% risk weighting, unless the securities are issued by one ofthe bank’s mortgage subsidiaries, in which case we understand the bank achievesfull capital relief on a consolidated basis. The super senior swap, if underwrittenby an OECD bank, carries a 20% risk weighting.
To be sure, borrowers would face lower all-in costs using a synthetic structurecompared to a conventional structure, quite simply because the risk isunderwritten using swaps as opposed to bonds (the cost of issuing bonds equalsthe risk free rate plus a credit spread). In our example above, we have used 10 bpsas the cost of swapping the super senior risk (this being the most often quotedfigure) and, together with other assumptions, have arrived at a lower cost for apartially funded structure compared to a fully funded synthetic transaction. Butreally, the difference in cost between fully funded and partially funded structureswould depend on the extent of leverage in the latter, the yield accruing to thecollateral pool relative to the costs of the funded liabilities (that is, the interestdeficiency in the capital structure) as well as the cost of the super senior swap.
� Partially and Fully Funded Structures
Synthetic CLOs can be either partially or fully funded structures – this is asomewhat confusing terminology considering most sponsor banks do not actuallyrealize any funding. A fully funded structure is where the risk in the entireportfolio of reference assets is hedged through the issuance of bonds. Thisstructure is used less often – only three transactions in the European syntheticmarketplace have been fully funded.
Benefit of regulatory capitalrelief . . .
. . . versus the cost ofbuying protection

ABS/MBS/CMBS/CDO 101 – 16 July 2003
Refer to important disclosures at the end of this report. 88
A partially funded structure is where CLO investors underwrite the riskiest(bottom layer) portion of the reference assets, with the top layer of the assetportfolio (so-called the ‘super senior’ tranche) hedged through a credit defaultswap contracted with a separate counterparty. Noteholders in a partially fundedstructure are effectively in the first loss position (subordinate to the ‘super senior’credit default swap). Of course, this first loss position is further credit tranchedinto notes of different seniority and ratings. Compared to fully funded synthetic orconventional CLOs, the most senior tranche of a partially funded synthetic CLO ismuch smaller in size.
Chart 35: A Typical Partially Funded Synthetic CLO
‘Super Senior’UnfundedPortion
‘Super Senior’ CreditDefault Swap
Bankruptcy RemoteIssuing SPV
Swap Premiums
Originator’sReference
LoanPortfolio
Commercial Bank &Reference Loans
Investors
SwapCounterparty
Asset BackedFunded Portion
Credit Default SwapAgreement Noteholders
Collateral
Interest
Principal
Interest Payments dueto Noteholders
Principal Payments dueto Noteholders
Sale ofCollateral
Pay-out of realised lossunder ‘Credit Event’
Source: Merrill Lynch
In a partially funded structure, investors are typically long the first 6% - 15% ofcredit exposure in the reference portfolio. We understand that full regulatorycapital relief on an asset pool may only be granted when the credit hedge coversthe entire asset pool – this is primarily why a credit default swap is taken out forthe (near riskless) senior most portion of a reference asset portfolio. The extent ofcapital release may vary between jurisdictions depending on the domesticinterpretation of guidelines regarding capital treatment of credit derivatives.
� Key Features of Synthetic CLOs
The Credit Risk Transfer MechanismMost synthetic CLOs use credit default swaps to effect credit risk transfer. In theHypoVereins Bank’s Geldilux transactions, however, the SPV issues limitedrecourse guarantees to the bank, which protect against any credit loss in thereference portfolio. And in Deutsche’s Blue Stripe deal, a ‘financial contract’ isdrawn out allowing the bank to short the credit risk in its reference portfolio.There is little material variation in all cases, however. The sponsor bank makesregular premium payments to the counterparties underwriting the credit risk in itsreference asset portfolio (i.e., the SPV and the super senior swap counterparty).
What Are Credit Default Swaps?Credit default swaps are derivative instruments used to hedge credit exposure on areference asset, be it a single credit, a basket of credits or a portfolio of assets. Ina plain vanilla credit default swap, the buyer of protection pays regular premiums(the swap quote) to the seller of protection in return for the seller agreeing to covercertain ‘Credit Events’, as defined in the swap documentation. Payments to theprotection buyer, contingent on the occurrence of losses following a ‘CreditEvent’, may be physically settled (being the norm for single name or basketswaps) or cash settled (being the norm for portfolio swaps).
Reference portfolio risk isnormally transferred through
credit default swaps

ABS/MBS/CMBS/CDO 101 – 16 July 2003
Refer to important disclosures at the end of this report. 89
Chart 36: Credit Default Swap Cash Flows
Protection Buyer Protection Seller
Credit Default Swap Premiums
No PayOut if CreditEvent does not occur
PayOut under‘Credit Event’
Reference Credit
Occurrence of‘Credit Event’
Source: Merrill Lynch
Credit Loss AllocationA key element in a synthetic CLO is the definition, determination and allocationof losses, against which the sponsor bank is seeking protection. Losses in thisinstance are contingent upon the occurrence of a ‘credit event’, as defined in thecredit default swap documentation. Such ‘credit events’ would normallyconstitute some or all of the International Swaps and Derivative Association(ISDA) definitions of credit events, to include a failure to pay, bankruptcy,insolvency related reorganization of the underlying entity, repudiation ormoratorium and obligation accelerations. Failure to pay and bankruptcy are the‘standard’ credit events normally documented in a synthetic CLO. Therestructuring of an underlying loan, repudiation, moratorium, obligationacceleration or a cross default with another obligation of the borrower may or maynot constitute credit events in synthetic CLOs.
Losses in the reference portfolio are normally covered by reducing the collateralamounts held by the SPV. Depending on the particular deal structure, the SPVcan:
• Sell the collateral to the extent required, remitting proceeds to the bank as abuyer of credit protection.
• Deliver the collateral in kind to the bank to cover any losses.
• Under a repo agreement, the bank repurchases the collateral less the value ofany losses experienced in the portfolio.
The remaining collateral proceeds are sequentially allocated to redeem the notes atmaturity in order of the notes’ seniority, and hence the credit losses first affect thejunior note holders.
Under credit default swap or equivalent agreements, non-payment by anunderlying borrower would normally have to exceed a minimum threshold beforeinvestors become liable. The amounts payable by the SPV for underlyingreference credit losses in synthetic CLOs may be computed by the calculationagent in a number of ways:
• Cash settlement of the underlying defaulted loan. Such settlement can takeplace a defined number of days following default (ISDA definitions call for a60-day period) based on market bids, or can be based on actual (realized)recovery values. If there are insufficient market bids for the defaulted assets,it is not uncommon for independent auditors or appraisers to value the assetfor the purposes of loss determination.
• A fixed percentage of loan face value initially (i.e., a “digital” pay-out),following which any excess recoveries or losses within a specified time frame(12 months for example) may be allocated to investors. We understand thatregulators do not usually give full capital relief for structures with digital pay-out provisions. (Digital payout structures are rare in synthetic CLOs, anexample being Triangle Funding II).
Coverage of losses in thereference portfolio
Determination of credit losses

ABS/MBS/CMBS/CDO 101 – 16 July 2003
Refer to important disclosures at the end of this report. 90
• Realized losses usually include any costs associated with the recovery or saleof the defaulted reference claim, but may or may not include accrued interest.The timing of loss allocation may also vary. Losses may be allocated againstthe collateral at the time of default, upon the crystallization of recoveries oronly when the notes are redeemed (i.e., at the termination of the deal).
� Collateralization of the Notes and Credit Event Settlements
In a synthetic CLO, the issuing SPV either purchases the collateral on the marketor from the sponsor bank. Purchases of collateral from the sponsor bank arenormally transacted through a repo agreement where the originating bank isobligated to repurchase the collateral at some future date that would coincide withthe bond redemption.
Assets used to collateralize synthetic CLOs are usually highly rated (typicallytriple-A), low risk weighted debt instruments, such as – but not limited to –government securities. A number of German bank synthetic CLOs have beencollateralized by triple-A rated public sector Pfandbriefe. Where the Pfandbriefeis issued by the bank or one of its subsidiaries, the sponsor bank benefitsultimately from the issue proceeds and thus funding, in addition to risk transfer.
� Flow of Funds
The mechanics of synthetic structure cash flow can be used to describe thegeneration and payment of interest and principal to investors.
Interest on the issued notes in synthetic CLOs is met from:
• Coupons due on the purchased collateral.
• The premium paid by the bank to the SPV for credit protection.
• Any net repo interest payable by the sponsor bank should the structureincorporate a repo agreement between the Issuer and the bank.
Synthetic CLO transactions are normally structured such that the premiumpayments, coupled with any repo interest, covers the residual negative carry (orinterest deficiency) that would inevitably exist given lower coupons accruing tothe collateral versus interest due under the capital structure.
Principal repayment on the issued notes is normally met from the sale of thecollateral, either in the market or through a repurchase agreement with the bank. Inthe absence of a repo agreement, note redemption would be met by redemptionand/or sale of the collateral into the market (examples of this include Scala 1,CitiStar 1 and the Blue Stripe transactions). As described earlier, the sale,redemption or repurchase of the collateral will be in effect net of any amountsneeded to cover eligible losses accruing to the reference pool.
In a synthetic CLO referenced against a multi-currency asset pool, the sponsorbank usually assumes all foreign exchange risk (in cash structures, an adequatelyrated swap counterparty always assumes this risk). As an illustration, losses onforeign currency denominated reference assets can be based on the lower ofmarket exchange rate or the rate determined at the outset (or replenishment date).Examples of such deals are Natix and Globe-2000.
� Early Amortization and Acceleration Events
Broadly similar to cash flow based CLOs, early amortization events in syntheticCLOs would include economic triggers, such as accumulated reference portfolioloss or default thresholds. Should such triggers be breached, reference poolreplenishments (or substitutions) are ceased and the notes begin to pay down.Note redemption in this instance usually mirrors the amortization of the referencepool. That is, the amount of collateral liquidated or repurchased to paynoteholders reflects the redemption profile of the reference pool, taking intoaccount any losses. Under an early amortization event, therefore, synthetic CLOnotes will in effect become pass throughs. This resembles what happens undersimilar events in conventional cash flow CLOs.
The separate collateral pool isused to provide note debt
service and any loss protectionto the sponsor
Sources of cash flow to servicenote interest . . .
. . . and principal payments

ABS/MBS/CMBS/CDO 101 – 16 July 2003
Refer to important disclosures at the end of this report. 91
But unlike cash flow CLOs, certain ‘acceleration’ events in synthetic CLOs – suchas seller insolvency or material non-compliance of warranties – triggers theimmediate redemption of the notes using available collateral.
� De-linking the Ratings of the Synthetic CLO from Sponsor Bank
Here we discuss how de-linkage of the synthetic CLO rating from the rating of thesponsor bank is achieved, looking specifically at the generation of cash flowsnecessary to service the notes and the features that mitigate risks associated withthese cash flows.
Higher Reliance on the Purchased CollateralAs a first step, de-linkage can be achieved for the notes provided the purchasedcollateral is itself de-linked from the creditworthiness of the sponsor. Governmentsecurities clearly are, and so are the Pfandbriefe, at least given the currentapproach to their credit analysis and ratings. Of course, a sound legal ownershipor charge over the collateral is a necessary pre-requisite before de-linkage can beachieved.
Market risks to both the value and liquidity of the purchased collateral representcredit risks to the transaction and are usually mitigated through:
• Margin call provisions, where the sponsor bank would be required to postadditional assets in order to maintain the required collateral value should thisvalue fall below a certain threshold. Debt collateral backing synthetic CLOsis normally marked-to-market on a daily basis.
• A hedging agreement (essentially, put option) allowing the SPV to sell thecollateral at purchase price plus any accrued interest at the redemption date.This option is underwritten either by the bank or by another adequately ratedcounterparty.
If the transaction’s structure does not sufficiently hedge mark-to-market riskinherent in the collateral, there may be some measure of overcollateralisation tofurther protect note holders should the bank or counterparty fail to perform underits obligations as described above. The extent of overcollateralisation wouldincorporate rating agencies’ assessment of the potential decline in market value ofthe collateral during the time it takes the trustee to liquidate such collateral and de-lever the transaction sequentially.
Should the bank default and there is no ready market for the collateral (when, say,the collateral consists of non-government bonds), the transaction may allow an in-kind delivery of the collateral to investors in lieu of cash redemption.
It should be noted that synthetic CLOs could attain triple-A ratings even if thecollateral is rated lower than triple-A (examples include KBC’s Cygnus Financewhere AA1/AA+/AA- rated Belgian OLOs are used). This is limited, however, tocases where the joint probability of collateral and bank default is deemedsufficiently remote to be consistent with a triple-A rating of the synthetic CLO.Further provisos would include a repurchase or similar agreement in place, andthat the collateral bears no default correlation with the bank (governmentsecurities, for example).
Lesser Reliance on the Sponsor BankThe sponsor’s bank credit comes into play in its ability to meet the residualinterest payments (or, alternatively, the credit protection premium) under thecapital structure.
Sponsor bank risk can be adequately mitigated by requiring the bank to fund itsobligations one or more payment dates ahead of schedule. So if the bank defaults(a trigger event), payments already made allow for continued interest servicing ofthe notes while the trustee sells the collateral to repay noteholders. Interestdeficiency in case of bank insolvency can also be adequately mitigated byinsurance taken out with a suitably rated third party (HypoVereinsbank Geldilux
Protection against shortfalls inthe value of the collateral over
the term of the deal
Mitigating sponsor bank risk

ABS/MBS/CMBS/CDO 101 – 16 July 2003
Refer to important disclosures at the end of this report. 92
deals being examples of this). Another method of hedging sponsor bank risk vis-à-vis credit protection premiums is by sufficiently overcollateralising the notessuch that interest coupons accruing to the issuing SPV’s asset side matchespayments due under its liabilities.
In a number of synthetic CLOs, investor exposure to the sponsor bank may extendto the bank being able to perform under a repurchase or hedging agreement.Additionally, certain transactions are structured such that payments made by thebank include a measure of ‘excess spread’ which the notes are dependent on forthe purposes of credit enhancement.
De-linking the notes in transactions where there is greater reliance on the bank isnormally supported by adequate rating triggers built into the transaction. Inparticular:
• If the sponsor bank is downgraded, the risk to its obligations may be mitigatedby, for example, the full pre-funding of such payments due to the SPV, orother similar measures (joint-and-several or performance guarantees, or aletter of credit, from adequately rated third parties) that would protectinvestors. Failing to do so would normally be captured by an earlyamortization trigger.
• A downgrade of the sponsor bank as repo/option provider is normallycountered by finding an adequately rated replacement counterparty, or bycash collateralization of the obligations.
From a credit perspective, the bank’s role in such synthetic transactions is,therefore, not dissimilar to the role of a swap counterparty in a more conventionalABS structure1, that is, its ratings need not be constrained by the ratings assignedto the notes provided adequate protection is in place. However, where the bank’srole extends to being a hedging counterparty (or any other similar additionalobligations), we would expect the bank to be rated in the highest short term ratingcategory in order to support triple-A rated notes in the capital structure.
1 See for example Standard & Poor’s report titled ‘New Structured FinanceInterest Rate And Currency Swap Criteria Broadens Allowable Counterparties’,January 1999.
Downgrade language

ABS/MBS/CMBS/CDO 101 – 16 July 2003
Refer to important disclosures at the end of this report. 93
Chart 37: A Recap: Main Variations in Synthetic CLO Structures
Types ofcollateral
Possiblesponsor bank
roles
Types ofprotection
againstcollateral risks
Types ofprotection
against sponsorrisks
Types of CreditEvents
Types of losssettlement
• Government bonds• Public sector
Pfandbriefe• Other triple-A
credits• Bonds linked to
sponsor
• Failure to pay *• Bankruptcy *• Restructuring of reference
asset• Repudiation or moratorium• Obligation acceleration
• Cash settlement,based usually onmarket bids adefined number ofdays after default,recovery valuesfollowing workout orindependentvaluation
• Fixed percentage ofloan face value **
• Payer of creditprotection premiums
• Agreement torepurchase collateralat deal termination
• Hedge counterparty(e.g. put optionprovider) against riskto value of collateral
• Requirement tomaintain collateralmark-to-market value
• Other paymentobligations, like theprovision of ‘synthetic’excess spread, etc.
• At loss settlement• At deal termination
• Repurchase agreementwith sponsor / third party
• Margin calls• Hedging agreement
(e.g., put option)• Overcollateralisation• Matching collateral and
note maturities
• Credit protectionpremiums paid inadvance
• Overcollateralisation• Full matching of
collateral and noteprofiles
• Interest deficiencyinsurance
• Downgrade language
Possible timingof loss
allocation
* Credit Events that are standard in synthetic CLOs. ** Very uncommon type of loss settlementSource: Merrill Lynch

ABS/MBS/CMBS/CDO 101 – 16 July 2003
Refer to important disclosures at the end of this report. 94
Finding Value in European CLOs
The first step in bank CLO asset selection is to differentiate between linkedand de-linked CLOs. We prefer de-linked structures. Through de-linkedCLOs investors can gain exposure to the European corporate economythrough bonds structured to be more credit resilient – yet typically cheaper –than plain vanilla bonds. We view diversification as an importantconsideration when comparing CLOs to other structured financeinstruments. The synthetic structures add an additional layer of investmentconsiderations for the European CLO investors. We view the lack of spreadtiering within the synthetic CLO marketplace as an opportunity for investorsto exploit synthetic CLOs with inherently stronger credit profiles, thusenhancing their risk-return exposures.
� The Question of Credit LinkageAs we already discussed, bank CLOs can be structured as linked or de-linked fromthe credit of the sponsor bank. A third variation, credit linkage that is contingenton specified events, the so-called contingent perfection structures, are unlikely tobe seen on the European market. It should be noted that, each deal is different andeven the de-linked structures may exhibit different levels of linkage to the sponsorbank. There are two key points to note:
Sponsor Linked CLOs Offer Credit Exposure to Both the UnderlyingPortfolio and to the Unsecured Risk of the Sponsor BankWhile tranching of the capital structure allows investors to select their desiredseniority vis-à-vis the allocation of portfolio credit loss, all investors in credit-linked CLOs with ratings equal to that of the bank are exposed to thecreditworthiness of the bank, and thus any rating volatility that goes with it. Thebulk of downgrades in the global CLO market have occurred in the credit-linkedsector (examples include ROSE2 and York Funding).
Many Sponsor Linked CLOs Have High Credit Ratings Only Because of theHigh Supporting Ratings of the Sponsor BankInvestors should understand how the ratings are achieved, noting that sponsorlinked CLO ratings are capped at those of the bank. This is particularly importantin synthetic structures, where certain notes in the capital structure may be directlylinked to the sponsor bank. Examples of such structures include themezzanine/junior notes in SPV-less structures, or transactions where the notes arecollateralized by bonds linked to the sponsor. A case in point: the mezzaninetranche (Class B) of the GeldiLux 1999-2 transaction was recently downgradedfrom Aa2/AA-/AA to Aa3/A+/AA- given a downgrade of the sponsor bank. Themezzanine and junior notes in this transaction are collateralized by cash depositsheld at the bank and unsecured bonds issued by the bank under its MTNprogramme, thus underlining its credit linkage to the bank.
On a relative value basis, sponsor-linked CLOs should therefore trade at areasonable discount to the de-linked market, though to us such tiering is notimmediately observable in today’s marketplace. This is particularly apparentamong the subordinated CLO market, where sponsor-linked paper (from a numberof synthetic deals, for instance) typically price similar to comparable de-linkedCLOs.
We continue our analysis by focusing on the relative value of de-linked CLOs.
� Comparison with Spread ProductsEuropean de-linked CLOs offer the credit investor an opportunity to gain adiversified exposure to the European corporate economy. Many CLOs also giveinvestors exposure to a sector of the European corporate community that mayotherwise be inaccessible – that is, credits originated to entities that rely wholly onbank financing (small-to-medium sized companies, etc.).
Sponsor-linked CLOs shouldtrade cheaper than de-linked
paper

ABS/MBS/CMBS/CDO 101 – 16 July 2003
Refer to important disclosures at the end of this report. 95
Credit enhancement and structural support in de-linked cash or synthetic CLOsunderpin their ability to endure greater underlying credit deterioration compared tounsecured corporate or bank bonds. The degree of credit resilience will vary withbond seniority and ratings. Our point is that, given a rating, the CLO product isstructured to be able to hold out against more credit stress compared to anunsecured bond and is therefore less at risk of being downgraded compared to anunsecured credit of the same rating (ceteris paribus). We believe this strength ofCLOs makes it an excellent defensive instrument for the credit investor,particularly in more credit volatile periods.
� Revisiting Synthetic Structures: Synthetic Versus Cash Flow CLOs
Let’s recap: In piecing together investors’ exposure in synthetic structures, wenote that the credit profile of a synthetic CLO is a function of:
• The reference assets (whose losses are allocated to noteholders).
• The collateral (liquidation or redemption of which pays-down the notes).
• The sponsor bank as credit protection buyer (payments from which coverresidual interest servicing on the notes).
The schematic below captures the credit considerations for synthetic structurescompared to the more traditional cash based structures. The credit quality of thereference assets is, of course, an investment consideration in any structure.Beyond that, investor considerations for synthetic CLOs differ somewhat fromanalysis used in cash structures. Certain aspects of cash flow as well as servicerrisks inherent in cash based structures are principally absent in syntheticstructures. On the other hand, investors in synthetic CLOs may be potentiallyexposed to additional layers of risk associated with the collateral backing the notesand the sponsor bank’s role in the transaction.
Below, we describe some of these key features that differentiate synthetic CLOsfrom cash based structures. These differences stem largely from the fact thatinvestors in synthetic CLOs take synthetic exposure to the underlying referencepool, and cash exposure to the collateral backing the notes.
Credit resilience compared toplain vanilla corporate bonds
Investor considerations forsynthetic CLOs differ somewhat
from analysis used inconventional structures, largelygiven the synthetic exposure to
the reference pool but cashexposure to the collateral in the
former

ABS/MBS/CMBS/CDO 101 – 16 July 2003
Refer to important disclosures at the end of this report. 96
Chart 38: Key Risk Considerations in Bank CLOs – Conventional Versus Synthetic
Reference PoolCredit Quality
CASHCLO
SYNTHETIC CLO
Originator /Servicer
Considerations
Sponsor BankCredit Risks
RisksAssociated with
Collateral
StructuralConsiderations
MarketConsiderations
• Historicalperformance
• Credit quality ofobligors
• Diversification• Type of reference
assets• Portfolio payment
rate and profile• Margin on
reference loans
• Underwriting standards• Competence in
administrating collectionsand remitting payments
• Relationship withborrowers
• Effectiveness ofprocedures in dealing witharrears
• Write-off policies• Potential for breach of
duties and obligations(eligibility criteria,warranties, etc.)
• Availability of back upservicer
• Ability to call the notes, ifapplicable
• Historicalperformance
• Credit quality ofobligors
• Diversification• Type of reference
assets
• Credit enhancement as acushion for potential losses(including excess spread)
• Eligibility / substitution criteria• Priority of payments under
different scenarios• Early amortisation triggers• Protection against any risks of
commingling, set-off, interestrate mismatch, forex, etc)
• Role of supporting parties(swap counterparty, etc.) andmitigants against associatedrisks
• Legal integrity (‘true sale’)• Retention of first loss
• Bond profile (passthrough vs bullet, calloptions, etc)
• Potential for headlineand/or event risks
• Secondary liquidity
• Underwriting standards• Relationship with
borrowers• Effectiveness of
procedures in dealing witharrears
• Ability to pay interestdeficiency (creditprotection premiums)
• Ability to perform otherroles in transaction (foreg., a repo or hedgecounterparty)
• Credit quality, andscope for ratingvolatility
• Reduction in marketvalue
• Liquidity ormarketability
• Potential linkage to thesponsor bank
• Credit enhancement as acushion for potential losses
• Eligibility / substitution criteria• Priority of payments under
different scenarios• Early amortisation and
acceleration triggers• Definition of Credit Events• Loss determination and timing
of settlement, allocation• Protection against credit
deterioration of bank• Protection against
deterioration in value orsaleability of collateral
• Role of supporting parties (likea hedge c/party, if different tosponsor) and mitigantsagainst associated risks
• Legal integrity (‘perfection ofsecurity interest in collateral,use of SPV, etc’)
• Retention of first loss
• Bond profile (passthrough vs bullet, calloptions, etc)
• Potential for headlineand/ or event risks
• Secondary liquidity• Extent of senior note
leverage in partiallyfunded structures
• Reliance on trustee inbeing able to protectnoteholder interests
• Ability to perform as swapcounterparty (if applicable)
Text in italics denote considerations that are unique to the respective structure type. Source: Merrill Lynch
� Some Differences Between Synthetic and Conventional CLOs
We have identified several key investment differences between a typical syntheticCLO and a conventional, true sale CLO:
Bullet Redemption, Liquid CollateralThe availability of readily saleable collateral in synthetic CLOs allows for bulletredemption of the notes in most cases, which in itself is investor positive. Apowerful feature here is that full note redemption – assuming a default neutralscenario – will be immediately realizable under certain acceleration trigger events(sponsor bankruptcy for instance). By contrast, in cash based transactions thelength of an early amortization payout window will be determined by underlyingpool payment rates.
Of course, full note redemption in this instance will depend on the value andsaleability of the collateral in the open market and/or on the ability of the put orrepo counterparty to meet its obligations.
Potential Exposure to Collateral Credit RisksThe credit quality of the collateral determines the credit quality of the syntheticCLO notes.
From an investment perspective, the collateral presents less credit concerns whenit is comprised of selected government securities. But a number of transactionsare backed against non-government securities including most often Pfandbriefe.

ABS/MBS/CMBS/CDO 101 – 16 July 2003
Refer to important disclosures at the end of this report. 97
The triple-A ratings on these non-zero risk weighted securities allow for the seniornotes of synthetic CLOs to achieve similarly high ratings. Yet non-governmentcollateral is likely to be more credit volatile than true ‘risk free’ paper. Forexample, it is far from certain whether Pfandbriefe ratings can withstand asignificant deterioration of the respective bank’s rating, or indeed a change in thelegal or regulatory framework supporting these instruments2. A downgrade of thecollateral may result in a downgrade of the notes.
Less Scope for Servicing and Structure Related RisksAdequate servicing of the asset pool (administering collections, remittingpayments, etc.) in order to meet debt servicing under the capital structure is animportant consideration in cash flow CLOs. The servicing aspect of a CLO is lessof an issue in a synthetic structure:
• In case of the outright insolvency of the seller/servicer, there is no need totransfer the servicing function. Using the collateral pool, as described above,investors can be taken out of the transaction immediately. Hence, the risksinherent in cash based structures that a proficient substitute servicer cannot befound are of no relevance to synthetic CLOs.
• Any breach of servicer duties or warranties can be easily ‘reversed’ as no sale/transfer of assets would have taken place. Having synthetic – as opposed tocash – exposure to the reference pool also means that any breach of structuralcriteria (such as eligibility conditions) can be quickly ‘reversed’. A reversalin this instance amounts simply to canceling the default protection coveringthose particular assets.
• As there is no cash flowing from the reference pool, risks associated with cashtransfer, commingling or set-off inherent in true sale CLOs are not relevantfor synthetic structures.
Synthetic CLOs also have less scope for other structural cash flow related riskssuch as basis or currency mismatches. In multi-currency denominated deals, forinstance, foreign exchange risk can be assumed by the protection buyer. In cashstructures, any collections denominated in currencies other than the issuingcurrency will need to be hedged, of course, exposing investors to counterpartyrisk.
Potential Exposure to Sponsor Bank RiskThe exposure to the sponsor bank depends on the roles it performs in a syntheticCLO structure. Such exposure could include and be mitigated in the followingways:
• The risks to the payment obligations of the sponsor bank as credit protectionbuyer can be fully mitigated in synthetic CLOs, as noted earlier in the report,through – for example – an arrangement to deposit the payment well beforethe payment date.
• In addition to being the buyer of credit protection, the sponsor bank may alsobe a repo or hedging counterparty (vis-à-vis collateral mark-to-market risks)in the transaction. The risks associated with the sponsor bank being a repo orhedging counterparty based on its short-term rating can be mitigated throughappropriate downgrade language. While not a constraint to rating thesynthetic CLO notes, any deterioration in the bank’s credit quality will requireremedial action, failing which the collateral is liquidated and the notes paiddown.
2 In its report titled ‘German Pfandbriefe, Moody’s Analytical Approach’ (June1996), the rating agency stated that “the probability of default for Pfandbriefe cannot be isolated from the creditworthiness of the issuing entity”.

ABS/MBS/CMBS/CDO 101 – 16 July 2003
Refer to important disclosures at the end of this report. 98
• Clearly, investors are directly exposed to the sponsor bank’s credit in anysynthetic structure where the collateral pool consists of bonds credit-linked tothe bank. Where the collateral comprises highly rated non-governmentcollateral that is ‘related’ – though not technically ‘linked’ – to the sponsorbank (to include, in our opinion, Pfandbriefe), the ability to pay down thenotes under seller credit deterioration or insolvency may not be entirelyassured either. Such collateral is likely to be sensitive to the performanceand/or credit profile of the bank (a hedge provided by a suitably rated thirdparty should mitigate this risk). In a number of synthetic CLOs, note holdersmay ultimately have to take physical delivery of the collateral in lieu ofredemption if a market sale or repurchase cannot be effected3 (examples ofsuch deals include Globe 2000 and Cast 2000).
In conclusion, many synthetic CLOs are structured in such a way that there ismultiple reliance on the sponsor bank. That is, there may be many ‘layers’ ofbank risk in the transaction – for instance, credit dependence given the nature ofthe collateral, reliance on the bank as a hedging and/or repo counterparty, etc. Themore such layers, the greater the ultimate linkage to the bank, in our view, even ifsuch risks are mitigated at each level. True de-linked cash flow CLOs do nottypically have exposure to the sponsor bank to the extent that many synthetictransactions may do.
Loss Determination and SettlementSynthetic CLOs have more complex settlement and valuation issues related to thecredit events in comparison to the cash based structures, where loss crystallizationand impact on the deal’s liabilities are relatively straightforward:
• On the one hand, credit events and payout amounts in synthetic CLOs are pre-defined, whereas in cash or ‘true sale’ based structures any form ofunderlying non-payment or default adversely affects investors. This featureof synthetic CLOs is clearly investor positive.
• But on the other hand, credit events that are too broadly defined may triggerpremature and more severe loss for noteholders. In transactions where thecredit events are not clearly described, investors would have to rely on a thirdparty for the interpretation and validation of a covered event.
The credit events, therefore, need to be carefully examined. In our view, syntheticCLOs with broad credit event definitions and complex workout procedures provea challenge to rating agency analysis – default probabilities and loss severityassumptions in such deals are far from being an exact science. Structures wherethe loss payout is fixed from the outset mitigate risk of loss volatility, but werealize that only very few deals are structured this way.
Greater Reliance on the TrusteeThere is a greater reliance on trustees in being able to protect the interests ofnoteholders in synthetic CLOs. Among other duties, the trustee in synthetic CLOswill be required to be vigilant vis-à-vis:
• Monitoring and selling the collateral as required.
• Verifying the determination and allocation of losses.
But there is one important exception – under a seller bankruptcy (as mentioned),the trustee’s performance in a conventional structure becomes crucial. Continueddeal servicing post seller insolvency, by contrast, is of no relevance in synthetictransactions.
3 In our analysis, we do not take into consideration the potential benefits of beingdelivered collateral in lieu of payment. Such benefits include the replacement ofnotes by lower risk weighted paper.

ABS/MBS/CMBS/CDO 101 – 16 July 2003
Refer to important disclosures at the end of this report. 99
Leveraging the Triple-A Tranche in a Partially Funded StructureIn a partially funded structure, senior noteholders are in a more leveraged positioncompared to senior noteholders in a similar fully funded or cash flow CLO. Putdifferently, senior noteholders could face greater relative losses (as a % ofprincipal) compared to senior investors in fully funded or conventional structuresshould defaults reach a level where all subordination is wiped out. To be sure, thelikelihood of such high defaults is extremely remote being as it is consistent withtriple-A ratings.
As for the subordinated tranches, noteholders in partially funded structures are nomore aggressively long the underlying credit exposure from either a ‘first dollar ofloss’ or ‘expected loss’ position compared to their counterparts in a conventionalor fully funded structure.
Regulatory Call OptionOne last point we would make on investing in synthetic CLOs is the potential forissuers to exercise regulatory call options built into many such transactions. Aswe pointed out earlier in this report, these options typically relate to proposedchanges under the new BIS Accord and are normally exercisable after 2002.Given that funding the option (or refinancing the deal) will not be a deterrent tocalling a synthetic CLO transaction, we would expect issuers to call theirtransactions at the earliest opportunity should the new regulatory capital regimeadversely impact on the economic benefits of keeping the synthetic securitisationin place.
These call options may therefore limit the opportunities for synthetic CLOinvestors to benefit from any spread rally post BIS. On the other hand, we notethat callable synthetic CLO paper usually price to scheduled expected maturityrather than the call date, which in turn makes certain transactions look cheaprelative to their call tenor. But identifying precisely which deals would be calledis a difficult exercise currently given the ambiguity of what the final BIS proposalsmay look like.
7.2 Synthetic Static and Dynamic CDOs -Structural Variations
We address some of the key structural variations in synthetic CDOs underseveral rubrics: static and dynamic, cash and synthetic, liquidity, etc. Thedelineation, though, is not as clear-cut now as it was in the past. We suggestthat, now more than ever, investors should go beyond the classifications andfocus on the key issues and search for the right analytical questions toaddress.
� Static and/or Dynamic CDO
The key differential in synthetic CDOs, as with their cash counterparts, is whetherthey are static or dynamic, including both those, which allow for substitution andthe ones, which are managed. We doubt that the investor debate as to which oneis superior will ever be satisfactorily resolved, given the pros and cons of both.The direction the market seems to be taking, though, is to find ways to mitigate thedownside of each of the two structures.
Hence, the key questions an investor should ask is not whether the pool ofreferenced obligations is static or dynamic, but rather:
1. Who selects the referenced obligations? and
2. Who has the right to change one or more of them, when and how? We willadd more details to the answer of the second question later on.
All kinds of variations in the answers are possible:

ABS/MBS/CMBS/CDO 101 – 16 July 2003
Refer to important disclosures at the end of this report. 100
• Referenced pool may be selected by CDO equity investor, CDO arranger orthe CDO manager. In all cases, there is some ground for moral hazard due tothe possibly diverging interests of these parties.
The case where CDO equity investor or CDO manager selects referencedobligations is the classic case of moral hazard demonstrated in many cash CDOdeals and motivated by reward. The mitigation to this risk or, in other words, theways to re-align the interest of the equity and debt holders are discussed below.
• Either CDO investor or manager may be allowed to replace referenced namesonly under certain conditions, and within strict pre-determinedeligibility/selection criteria. In fact, in some cases the role of the managermay be assumed by the CDO arranger or CDS counterparty (which saves onmanagement fees), but may result in the selection of the cheapest to includenames. In fact the ability to make changes in the portfolio can vary frombroad to increasingly restricted, the latter being more widely used recently.
• CDO manager may or may not have trading discretion or such discretion maybe limited to a certain percentage of the pool (trading bucket) or may berestricted by certain conditions for trading (e.g., selling only reference credits,which may become impaired according to manager’s judgment).
Investors should consider this range of options to be inversely proportional to theirconfidence in the manager, and related to the quality of the referenced pool andtheir investment objectives. A wider discretion in trading is probably moreappropriate for high yield portfolios (although they are not yet in the CDS domain)and more experienced managers.
• The ability of the manager to change the portfolio and to what degree alsodepends on the investment strategy permitted. In this regard, the range canalso be wide not only in terms of market sectors as mentioned above, but alsoin terms of investment strategies allowed (long and/or short trades, nakedshort CDS, basis positioning – adding and unwinding basis positions, etc.).
In any individual case, it is a balance between flexibility granted to the managerand complexity of the deal associated with the given level of flexibility, andwhether the results of the manager’s use of all flexibility he is given willmaterialize in rewards sufficient to compensate for that complexity.
Manager’s ability to trade may be limited to ‘credit improvement trades’ (linkedto spread tightening beyond certain predetermined level, premium ratios and othertests) or ‘credit deterioration trades’ (risk of a credit event occurring as assessedby the manager).
Furthermore, trading may be done either by termination or offsetting exposures.In fact, different transactions can be differentiated by the level of prescription ofthe use of termination and/or offsetting trades. For example, the deal structuremay allow the manager to choose one of the above actions. Or, alternatively, itmay direct manager to:
• Pursue a termination in case of an improved credit, thus generating cash intothe structure, and
• Pursue an off-setting trade in case of a deteriorated credit, which does notrequire any cash outflow from the structure, contrary to the termination of adeteriorated credit.
� Cash and/or Synthetic Pool
Initially, when synthetic securitisation was launched, the question cash orsynthetic referred to the form of transfer of the credit risk of the securitisationpool.

ABS/MBS/CMBS/CDO 101 – 16 July 2003
Refer to important disclosures at the end of this report. 101
More recently, the question cash or synthetic is equally applicable to the way theexposures in the CDO portfolio are created through:
• CDS: selling protection on given names (CDS); buying protection (which isthe equivalent of cash bond shorting) is also possible in some cases.
• Cash: buying exposure to given names in the form of bond purchases (short-selling of bonds has not been allowed, to our knowledge), or
• Hybrid: a combination of the two above above.
To these two broad categories of assets, one can also add total rate of returnswaps, bi-variate risk positions, etc., which we believe will be of limited use infuture deals, as have been in past ones.
In this regard, we believe that the key question is not so much how the referencepool is created (we will address this issue later), but rather
1. What is its credit quality? and
2. What level of diversification can be achieved and maintained?
Given that CDS exist primarily on investment grade corporates, in order toimprove the diversification of a CDS pool, cash bonds are a welcome addition. Infact, cash exposures can take the form of bonds, ABS, convertibles (stripped), etc.
We note that particularly ABS, in its broadest meaning (that is, all asset classes),can add to the portfolio exposures to credit sectors not easily available throughCDS or other cash alternatives. Such sectors include consumer loan portfolios asin the traditional ABS/RMBS, corporate portfolios on names, where CDS arescarce (high yield) or non-existent (mezzanine loans, SME bank loans, CMBS,etc.). Such a portfolio should benefit from broader defensive diversification andhigher rating stability, judging by recent studies of rating transitions of differentfixed income instruments performed by the rating agencies. These studies alsoemphasize the difference in transition ratios and in spread volatility for ABS andcorporates under the same economic conditions of duress experienced in the lastfew years – this can be viewed as evidence of lower correlations between the twosectors.In addition, a hybrid managed CDO allows CDO manager to explore possiblerelative value opportunities that may emerge between CDS and cash assets to thebenefit of investors in the respective CDO or achieve better returns through moreefficient leverage through CDS. Overall, a hybrid structure should allow for theoptimization of asset allocation given CDO manager’s skills and sectorknowledge.
One should not forget that regardless of how a given deal is structured it is, afterall, mainly about credit. A portfolio of credits – cash bonds or reference entities –require similar analysis in terms of credit quality, diversity, single credit exposure,total spread, default and recovery expectations, etc. However, the way one arrivesat them may require somewhat different analysis.
� One/Multiple CDS – One/Multiple CDS CounterpartiesIn its early days synthetic securitisation usually involved the transfer of the risk ofthe entire portfolio through a single basket credit-default swap to onecounterparty, often the SPV. A possible variation, in the case of partially fundedsynthetic CDOs for example, would be two separate risk transfers: one CDSdirectly with the super-senior protection provider and one with the SPV.
While these structures are applicable to static and dynamic arbitrage syntheticCDOs, the choice depends on the level of management anticipated in a giventransaction.
For static deal one CDS counterparty is the rule, as could be with lightly managedportfolios, where the SPV can trade with or through the CDS counterparty. As thelevel of management and manager discretion increases, the number ofcounterparties to the SPV can increase into multiple counterparties.

ABS/MBS/CMBS/CDO 101 – 16 July 2003
Refer to important disclosures at the end of this report. 102
Hence, the simplicity and ease of execution of the static balance sheet structuresare replaced with higher documentary complexity of actively managed CDSstructures to allow for an active and more efficient portfolio management. Whilethe need for competitive pricing for trading and settlement of CDS requiresseveral CDS counterparties, an excessive number of counterparties used mayinadvertently create the additional problems of documentation complexity andmanagement of counterparty risk. Hedging and offsetting trades with twocounterparties creates additional difficulties in determining the credit risk of theposition.
So the question is not so much how many CDS there are in the deal, but rather:
1. How many swap counterparties- one or multiple - are used? and
2. How is counterparty risk managed?
3. Is it necessary to have multiple conterparties, i.e. is the portfolio expected tobe actively managed?
Given that a CDS is an agreement between a protection seller and a protectionbuyer and the related payment flows going in both directions, the buyer and theseller have credit exposure to each other, that is – counterparty risk. A CDScounterparty default has implications for:
• Regular payments of protection premium by the protection buyer. A mitigantto the protection buyer counterparty risk is the requirement to make protectionpayments in advance, i.e. at the beginning of the protection period.
• Event-related, one-time protection payment due from the protection seller.Such risk can be addressed through a requirement of a minimum rating triggerof the protection seller. A trigger breach requires a substitution of theprotection seller with a higher rated one, a guarantee of the protection seller’sobligation by an appropriately rated third party, or posting of collateral by theprotection seller (the level of collateral depends on the level of deviation fromthe minimum required rating).
• CDS MTM valuation in case of termination and funding of the terminationpayment (repayment at par) through a liquidity line or through a seniorposition in the deal’s cash flow allocation. MTM should not be eroding thesubordination levels in the deal.
� P/L SPV vs. Pass-Through SPV
In traditional securitisation structures the SPV is set up as a bankruptcy remoteentity, so that it has no obligations other than those to ABS noteholders. Allpotential liabilities it may have in a given transaction should be satisfied from thecash flows generated by the assets supporting the securitisation and all cash flows,profits and losses should be passed-through on to the ABS noteholders andequityholders.
In case of a synthetic securitisation and particularly managed synthetic CDO profitor loss can arise at the SPV level due to unwinding of a CDS or an offsettingtrade.
The question is here is not whether a loss can arise, but rather
1. How does loss arise? and
2. How is the loss covered?
In case of a loss arising from offsetting trades, it can be covered by the premiumflows and hence absorbed by the excess margin. A loss due to termination mustbe funded in cash, but can be amortized over time through the interest flows or befunded by the liquidity facility.

ABS/MBS/CMBS/CDO 101 – 16 July 2003
Refer to important disclosures at the end of this report. 103
� Excess Margin vs. Excess Spread
In both cash and synthetic securitisations the excess cash flows arise from theexcess of the cash flows generated by the assets over the cash flows needed toservice the liabilities of the structure. In both cases key elements of the investoranalysis, particularly by investors at the lower steps of the capital structure, are:
• At what level are the excess cash flows likely to be during the life of thetransaction?
• Which are the key variables, which can affect excess spread negatively?
• How are excess cash flow used in the structure?
In synthetic CDOs the excess cash flows are a function of, among other things, thecredit quality of the pool, trading strategies, counterparty risk, CDS shorting,MTM variations, etc. Some of these aspects are different from the traditional cashsecuritisations and should be carefully examined in conjunction with the otherelements of the synthetic CDO structure discussed elsewhere in this report.
The use of excess cash flow in the structure can fall into one of three categories:
• Never used – released to equity holders and manager.
• Always used – retention in a reserve account for future use or used to purchaseadditional collateral, thus creating additional credit protection in the form ofovercollateralisation.
• Used under certain circumstances, such as increase of portfolio losses beyondcertain level or breach of OC or other tests.
In synthetic managed CDO the level of excess margin may be used as a keytrigger as to whether shorting can be executed. Shorting CDS may lead to spreaderosion in the pool and to additional counterparty risk, both of which couldtranslate into liquidity shortfalls.
� Single Currency vs. Multiple Currencies
Most securitisations usually have assets and liabilities in the same currency, or ifthere is a mismatch between the two it is easy to address on an SPV level. In cashCDOs, the mismatch can occur on part of the assets, given CDO funding in, say,Euros and CDO pool in a combination of Euro and USD denominated bonds,whose relative share of the pool can change. The currencies are usually knownfrom the outset and the respective hedging mechanisms can be established. In anCDS pool, the potential currency mismatches and the currencies involved may notbe known in advance, given that they can spontaneously arise in case of a deliveryof a foreign currency denominated bond should a credit event occur and is settled.So the question is not how currency risk is hedged, but rather
1. What currency mismatches can potentially arise? and
2. How are investors protected against them?
As mentioned above currency risk can arise from the delivery, in case of a creditevent, of a bond, whose currency is not predetermined and could be different fromthe currency of the CDO’s assets and liabilities. We stress that FX risk onlyapplies to recoveries, so it may play a small role. The simplest solution is to optfor a cash settlement. Alternatively, it is through the reliance on the liquidityfacility that the currency risk, translated into the risk of cash shortfall due toconversion risk, can be addressed.
� Liquidity
In typical cash CDO structure, given the pass-through nature of the cash flowsemanating from the asset pool and directed to servicing the CDO liabilities,liquidity is usually needed to cover temporary cash flow shortfalls usually due totiming mismatches. In a synthetic CDO structure and particularly managed

ABS/MBS/CMBS/CDO 101 – 16 July 2003
Refer to important disclosures at the end of this report. 104
synthetic CDOs, particular needs for liquidity may or may not arise. So instead ofan assumption that there is a liquidity facility in the deal, the questions insteadshould be:
1. Is there a need for a liquidity facility in a given synthetic CDO structure? and
2. How is the liquidity facility sized and procured?
Particular need for liquidity in a synthetic CDO are created by:
• Shorting CDS,
• Trading losses that are crystallized by termination,
• Credit events requiring cash settlement or bond delivery (bond must bepurchased).
Furthermore, liquidity may play an active part in the execution of portfoliomanagement strategy and specifically asset allocation changes.
Certain trading strategies, for example uncovered shorts, the liquidity needs maybe substantial and can be satisfied only through a dedicated liquidity facility. Thesize and cost of such facility are of key importance, as high liquidity cost mayreduce the benefits of some savings achieved on the liability side of the syntheticCDO through the low cost super-senior tranche hedging.
Another aspect of liquidity management is the shortfall of Classes B and C interestpayments. A potential solution is introducing pikeable interest for these classes inthe form of the capitalization of the missed interest for two consecutive periods forthe single-A rated tranche and indefinitely for the BBB-rated tranche.
7.3 Investor Protection and Strategies
One of the key concerns derived from the experience of the cash CDO market isthat of the perennial conflict between the interests of debt and equity investors.We explore potential measures implemented in synthetic CDO structures to re-align their interests. We also suggest a simple decision-making tree for investorsin finding their way through the world of synthetic CDOs.
� Re-Alignment of Debt and Equity Investors’ Interests
The potential or real conflict between the interests of debt investors and of CDOmanager/equityholder as well as the mechanism of manager compensation havebeen often used to explain partially the underperformance of arbitrage cash flowCBOs. Static and managed synthetic CDOs are not immune to similarshortcomings; in fact, they can be magnified given the higher leverage in amanaged synthetic CDO due to predominantly investment grade credits.
In some cases of a static synthetic CDO, the equity tranche may be written downwith the difference of the notional amount and settlement amount as a credit eventis crystallized. The-write down depends on the level of recoveries and reduces theCDO liabilities (lowest tranches pay highest coupon), thus reducing the CDOliabilities by potentially larger degree than CDO income and boosting excessspread flowing out of the structure, if not captured under specific CDO features.
On the other hand, in a static synthetic structure, the equity investor is moreconcerned with defaults rather than rating migration, while the latter, especially inits more acute form, is the primary preoccupation of the mezzanine investors.
In a managed synthetic structure a CDS manager may be have the incentivethrough the remuneration structure (being an equity investor and receiving aperformance fee) to provide exposure on riskier names of similar rating, that is,buy CDS paying higher premium for the same perceived risk in order to boostexcess margin. This is an investment strategy similar to deep-discount buying inmanaged high yield CBOs. This may have a negative longer-term effectparticularly on the mezzanine tranches of synthetic CDOs.

ABS/MBS/CMBS/CDO 101 – 16 July 2003
Refer to important disclosures at the end of this report. 105
Some mechanisms embedded in the structures to re-align investors and managersinterests are:
• Limitations on trading – the extreme points of the range are: full discretionarytrading to investor approved trades only. Within this range fall such measuresas: limitations of the trading bucket; limitations to trading based on creditquality of portfolio, limiting trading to impaired credits only, for materializinggains or substitution trades (selling lower credit quality and buying highercredit quality credits), etc.
• Definition of ‘credit impaired’ assets – definition can be changed in caselosses undermine portion of the subordinated tranches or an O/C test isbreached to incorporate rating downgrade or spread movement concept.
• Tranches retained – managers may buy both at the equity and debt level ofthe capital structure of the respective synthetic CDO. In some cases managershave purchases a piece of every single tranche of the capital structure, whilein others, they have purchased pieces of the equity and mezzanine tranches.
• Equity IRR – reasonable level of promised IRR on the equity tranche entails amore conservative CDO management.
• Controlling position – in a typical CDO only the controlling class – seniorand super senior holders, have the right to remove a CDO manager andapprove a replacement. In some cases, such rights are granted to themezzanine tranche investors, giving them additional rights of control andprotection and putting them in par with the senior investors in some respects.Granting of such rights may be linked to a threshold of losses due to creditevents or to a notional amount of reference entities that have experiencedcredit events.
• Utilization of excess margin – as addressed above.
• Management fee – key issues here are not different from the ones in the cashCDO market. It has become a norm to split the fee into two components: oneflat fee up in the waterfall and a second one based on performance at thebottom of the waterfall. Variations of the latter are possible, and the key issueis how manager’s motivation or course of action may be altered by the feesstructure.

ABS/MBS/CMBS/CDO 101 – 16 July 2003
Refer to important disclosures at the end of this report. 106

ABS/MBS/CMBS/CDO 101 – 16 July 2003
Refer to important disclosures at the end of this report. 107
8. MBS Investor Consideration

ABS/MBS/CMBS/CDO 101 – 16 July 2003
Refer to important disclosures at the end of this report. 108
The purpose of analyzing mortgage-backed securities is to define their creditand non-credit-related characteristics, and to consider how they fit withinvestment objectives in the context of the current and expected status of aninvestor’s portfolio. Mortgage-backed securities require a detailed analysisof:
• The underlying mortgage pool, its servicing and expected performance.
• The financial and legal structure of the deal.
• The relationship between the performance of the underlying mortgagepool and changes in the performance of the MBS and each of its tranches.
Furthermore, the broad range of mortgage products, mortgage securitiesstructures, regional housing price differences, obligor behavioral differences,and foreclosure proceedings, necessitate a thorough understanding of thedifferences between mortgage markets.
8.1. Analytical Framework
Investors interested in mortgage-backed securities need to determine thelikelihood of full repayment of the bonds as well as the likely timing of therepayment cash flows. Investors should also be concerned with changes to anyaspect of the deal that could have an effect on the bonds’ pricing initially or onsecondary market pricing. These factors include the bond’s rating and the potentialfor rating changes during its life, the performance of the underlying collateral andthe performance of the servicer, among other things.
� Credit Rating Agencies
The credit rating agencies – such as Standard & Poor’s, Moody’s InvestorsService, Fitch IBCA – are an important source of information for investors inmortgage-backed securities. These agencies publish credit reports, which aim todetermine the likelihood of the timely payment of interest and the timely orultimate payment of principal (reflected in the credit rating) on the rated tranchesof the mortgage-backed securities. But first an agency must assess the creditquality of the underlying pool of mortgages and, on that basis, assess the necessarylevel of credit enhancement relevant to the assigned rating level.
To do this, the agencies evaluate the credit characteristics of the collateral pool,the servicing capabilities of the servicer, the underwriting criteria of theoriginating entity, the degree to which the cash flows generated by the collateralpool match the cash flows promised to investors under the mortgage-backedsecurities, credit events, collateral and counterparty risk in synthetic risk transfers,and the soundness of the legal and financial structure of the deal. The ratingagencies subject the mortgage pool to a variety of stress scenarios, the severity ofwhich is directly related to the assigned final rating on the bonds.
The agencies’ credit rating of the bonds provides an indication of thecreditworthiness of those bonds. However, investors should also look at a numberof other features to better understand the current and future performance of theirinvestments. Such analysis should include the following three factors:
• The potential for rating changes affecting the bonds, associated with:
− The status and ratings of the parties involved in the MBS transaction, forexample, the originator, the servicer, the swap counterparty.
− The collateral backing the MBS transaction (the assumptions of the expectedperformance of the pool) and any change in those assumptions over time.
• The liquidity characteristics of the MBS, associated with:
− The size of the initial issuance.
− The syndicate – its breadth and commitment as a market maker.

ABS/MBS/CMBS/CDO 101 – 16 July 2003
Refer to important disclosures at the end of this report. 109
• The prepayment characteristics of the MBS, such as:
− The prepayment speed assumed for pricing purposes.
− The effects of changes in prepayment speed on a bond’s duration, weightedaverage maturity (WAM) and convexity.
The remainder of this chapter is devoted to the specific aspects and features ofmortgage-backed securities that investors should analyze grouped according totheir relevance to the collateral pool, the legal and financial structures ofmortgage-backed securities, origination, servicing and monitoring of the pool, andprepayment analysis.
Key Characteristics of the Collateral Pool
� Mortgage Balance Diversification
We start by considering the number and average size of the mortgages in acollateral pool and the distribution by mortgage balance. All things being equal, agreater number of mortgages in the pool correlates to higher diversity and lowerdefault levels. The larger the mortgage loan with a similar maturity profile, thelarger the debt service payments and the more potential stress created, given achange in borrower circumstances or a rise in interest rates.
� Loan-to-Value Ratios
Loan-to-value (LTV) averages and distribution within a pool are also important.The LTV ratio is considered the determinant of the borrower’s willingness to pay,reflecting the portion of the borrower’s equity in the property. LTVs are, for manyreasons, not directly comparable across geographic borders; therefore the LTVprofile must be examined against benchmark performing pools in each jurisdictionto determine whether pool LTVs are more or less aggressive.
A key element of the LTV ratio is the determination of property value. In the UKand Ireland, for example, property value is based on appraised values byprofessional surveyors. In France, some properties are valued simply on the basisof market values of properties in the surrounding area. In Germany, lenders arerequired by law to value property based on ‘sustainable’ rent. In Sweden, policiesdiffer from lender to lender, but generally use tax valuations, which are performedevery six years but are indexed annually, based on recent sales. In the Netherlands,the concept of loan-to-value is instead sized to loan-to-foreclosure value, resultingin a value between 80%-90% of the market value (not dissimilar to the practice ofGerman lenders).
� Income Ratios
Price-to-income or net income-to-mortgage payment determines the borrower’sability to pay debt service out of current income. Price-to-income ratios are lesscommonly used by non-US mortgage lenders, where debt service as a proportionof monthly income is a more powerful determinant of the approved loan amount.
� Interest Rate Composition
The weighted average interest rate on the mortgage pool when the deal closesmust be considered, along with the expectation of change, as determined by thetype of mortgages in the pool – whether fixed rate or variable rate mortgages, orfixed rate mortgages with periodic resets – and the rate at which loans are repaid.Higher interest rate loans are generally first to be prepaid, thereby reducing excessspread. The remaining time to the first reset should also be noted, as refinancing ismore likely to occur at a reset or ‘change of condition’ date, when little or nopenalties are attached to the repayment.

ABS/MBS/CMBS/CDO 101 – 16 July 2003
Refer to important disclosures at the end of this report. 110
� Characteristics of Underlying Property
The type and quality of the underlying property are key elements of the collateralpool. Detached single-family or two-family property, semi-detached property, ablock of flats, a single flat, investment property, residential property, multi-purpose property (such as part commercial, part residential, which is common inItaly) – each type of property has different characteristics from the point of viewof the borrower’s motivation to service the mortgage debt and from theperspective of the property liquidation and recovery value in case of borrowerdefault.
� Mortgage Products
The type of mortgage products – such as annuity mortgages and life insurancemortgages – and the effects of the mortgage type on debt servicing and debtrecoveries also factor into an investor’s consideration. Redraw and equity-releaseloans, for example, are available in a number of markets, including Australia, theUK and Ireland, and increase the leverage of a given borrower. In the Netherlands,savings and investment-linked loans are the norm, while in Italy mortgage loansmay be linked to family businesses.
� Tax Implications
Tax implications relating to mortgage debt must be considered. In severaljurisdictions, tax advantages drive the structure of the mortgage product offered,as well as the manner in which debt is repaid. Tax regimes have a heavy influenceon payment behavior and loan structure. For example, in the Netherlands,mortgages are used as a tax-planning instrument and are linked to savingsaccounts, investment portfolios or life insurance contracts where the relatedinvestment returns are generally not taxed. Hence interest-only loans are verycommon, and loans outstanding do not decrease, as rapidly over time as in the US,despite being similar in that it is largely a fixed rate market. Another exampleoccurs in Australia where mortgages receive a tax deduction on principal repaidbut not on interest, thus providing an incentive for early repayment.
� Pool Seasoning
The seasoning, or ageing, of a mortgage is associated with the building up of theborrower’s equity in the acquired property, which has a strong influence on theborrower’s motivation to continue servicing the mortgage or to abandon it. Apool’s ageing is also associated with a loss curve; mortgage loss curves tend to befront-loaded, in that losses occur early in the life of the mortgage pool anddecrease and stabilise later in its life.
� Obligor Profile
The characteristics of the obligors in the pool – whether they are sub-prime ornon-conforming, salaried or self-employed, private or social housing – areimportant; some characteristics are more negative, others are more positive. Forsub-prime and non-conforming mortgage pools, although not an established sectoroutside the UK and Australia, performance varies dramatically from that of primemortgage pools. Generally, these differences include a higher expectation ofdefaults, and prepayments are typically faster and are driven by a change inborrower credit quality, due to a change in circumstances rather than interest rates,which are the dominant factor for prepayment in prime mortgage pools. In contrastto pools with riskier obligors, some pools carry a large proportion of high-qualityobligors, such as civil-servant mortgage loans. These borrowers are consideredhigher quality because they are less likely to become unemployed.
� Nature of the Security
The nature of the mortgage security has a bearing on performance. For instance, isit a first, second or third lien mortgage? In Germany, some loans are upper LTV

ABS/MBS/CMBS/CDO 101 – 16 July 2003
Refer to important disclosures at the end of this report. 111
(exceeding 60% LTV), but are secured by first-ranking mortgages. Is the mortgagefor a tenant-owner or a single family? In Sweden, tenant-owner loans are securednot by a lien on the property, but by a perpetual right to occupy the property. Forthese loans it is important to scrutinize the financial condition of the cooperativeand the credit quality of the borrower. In Italy, the distinction between fondiarioand ipotecario is critical in that fondiario loans usually achieve beneficialtreatment during the enforcement process.
� Geographic Concentration
The geographic concentration of mortgage loans is related to the demographic andeconomic characteristics of the region. For instance, Italian mortgages forproperties in the south and the islands have historically exhibited higher defaultrates than those for northern and central Italy. Hong Kong Island housing hastraditionally been more resilient to price downturns than Kowloon and the NewTerritories. In Portugal and Sweden, the population is heavily concentrated in oneor two large cities, so mortgage pools may be subject to housing market dynamicsthat are less well diversified than in other markets.
� House Price Movements
House price movements by region are another consideration, but there is adisparity in the availability of house price indices across Europe. Belgium,Sweden, the UK, the Netherlands and Ireland all have national and regional houseprice indices, while Italy has none. Germany has some pricing information, but noofficial national statistics.
� Recovery Value
Recovery value and the time it takes to recover a property should not beoverlooked. Property values could be reduced by market value declines,foreclosure costs and carrying costs from delinquency to foreclosure. Recoverytimes vary widely across markets; in the Netherlands, foreclosure to recoveryproceedings can take as little as three months, while in Italy the process can takeup to 10 years.
� ‘Set-Off’ Risk
‘Set-off’ is the risk associated with the borrower’s ability to offset mortgage debtagainst a deposit held with the bank originator of the mortgage. In Germany andthe Netherlands, set-off is allowed between savings or insurance contracts andmortgage debt in the event that the originating bank defaults. Structural stepstaken to reduce or eliminate this risk should be examined. That said, set-off is onlyan issue for cash transactions. Synthetic transfer (which is typical in Germany)obviates the need for any additional legal provisions.
� Substitution
Substitution is a structural provision, common in master trust and revolvingtransactions, allowing for the addition of new mortgages to the original pool.Eligibility criteria should be examined carefully to minimize the potential for pooldeterioration over time.
� Insurance Policies
Insurance policies may be present in a number of forms. Private mortgageguarantee insurance is used almost exclusively in Australia, on both a pool andindividual loan basis. Private mortgage guarantee insurance is also used, althoughnot as broadly, in France, the UK, Ireland and Hong Kong. State mortgageinsurance is available in Belgium and the Netherlands. In jurisdictions such asGermany, Spain and Portugal, lenders may require life insurance policies inconjunction with certain mortgages, for example, to assure balloon payments oninterest-only mortgages.

ABS/MBS/CMBS/CDO 101 – 16 July 2003
Refer to important disclosures at the end of this report. 112
� Static Pool Data
Static and/or dynamic pool default information should be provided by mortgageissuers but might also be available on a national basis for comparison purposes.
� Consumer Protection
Consumer protection laws vary by jurisdiction. In Sweden, over indebtednesslegislation excludes mortgage payments, in that it leaves the borrower responsiblefor the debt even if otherwise over indebted; in France, similar legislation includesmortgage debt, as well as other consumer debt.
Key Features of the Financial Structure of theSecuritisation Pool
Investors must not only be aware of the nature and peculiarities of the underlyingcollateral, but also:
• Credit enhancement and the method of its provision. Via subordination,insurance or reserve funds. When credit enhancement is established throughsubordination of several tranches with significantly different maturities, thepay down of the senior tranches and pool performance within, or better than,initial expectations are prerequisites for subordinated tranches upgrade orspread tightening.
• Cash flow mechanics of the structure. Or the priority of cash flowdistribution – this includes interest and principal payments on the differenttranches, trustee, servicer and issuer expenses, swap payments, and missedpayments of interest and principal.
• For synthetic transactions. Definitions of credit events must be examinedand compared with default recovery assumptions; realized loss definitionsshould be examined to size collateral and counterparty risk.
• Liquidity support. This includes liquidity line or servicer advances forliquidity support for payments of interest and/or principal for borrowers inarrears
• Swaps. These address potential cash flow mismatches between the weightedaverage coupon (WAC) of the underlying pool and WAC on the MBS.Actions to be taken should be clearly identified in case of swap counterpartydefault or downgrade and/or swap termination.
• Application of excess spread, if any. The excess spread is the differencebetween WAC of underlying mortgage pool and the sum of WAC of MBS,servicing fee and other trust expenses, and serves as a first level of protectionagainst current and potential future losses on the mortgage pool.
� Outline of the Legal Structure of the Transaction
• To securitise a pool of receivables, a number of steps must be taken to ensurethat the legal and economic interest in the pool is removed from the originatorand transferred to an unaffiliated ‘bankruptcy-remote’ issuer. In particular,investors should examine the following:
• Legal transfer and perfection of security interest. Two broad categories oflegal transfer exist: those that have been established by securitisation laws(for example, Italy, Spain, France, and Portugal), and those in common-lawjurisdictions (for example, Ireland, the UK, Australia and Hong Kong). Incommon-law jurisdictions, a true sale is not effected, but an equitableassignment is used instead. A true sale (retitling) can only be effected withborrower notification.
• Transfer of mortgages securing the loans. True transfer of the mortgagesecurity usually only takes place on the occurrence of certain events, such as

ABS/MBS/CMBS/CDO 101 – 16 July 2003
Refer to important disclosures at the end of this report. 113
the downgrading of the originator below a certain level (for example, A orA-). Collateral remains with the seller until such an occurrence – borrowersmay or may not have been notified about transfer.
• Representations and warranties by the seller/servicer. Investors shouldensure that these are provided by an appropriately capitalized entity.
• Bankruptcy remoteness of the issuing entity.
• Data protection trustee. The trustee has custody over certain data lists inorder to identify borrowers and enforce the loans and the collateral.
Key Features of Originating and Servicing theCollateral Pool
Although the pool of receivables is segregated from the originator in anysecuritisation, there typically remains a link to the quality of the originating entitydue to the continued requirement for servicing the pool receivables as well as thepotential impact on the MBS of negative news related to the originator. As such, anumber of issues that directly or indirectly related to the originator services shouldbe monitored:
• Credit quality of the originator. This should be examined in the context ofthe likelihood of requiring a replacement of the servicing function.
• Underwriting criteria and guidelines. The conservativeness and theconsistency of the underwriting criteria inevitably affect the performance ofthe mortgage pool. Mortgages originated through a bank branch network, andbased on a long-term relationship with a borrower, including the provision ofother financial services to that same client, tend to perform better thanmortgages originated by a broker and sold to a mortgage consolidator for thepurposes of an MBS deal. The trend of underwriting standards should also bemonitored. In some jurisdictions, such as Ireland, average debt-to-incomeratios and LTVs for approved loans have gradually risen over the past fiveyears. Absolute levels must also be considered, however; in the case ofIreland, despite rising LTVs, these remain lower than their UK counterparts.
• Payment methods. Such as direct debit, where borrowers have a currentaccount with the originator, ensuring timely mortgage debt service.
• Availability of a credit scoring system. For faster and standardizedassessment of borrowers’ credit quality – for instance, credit scoring is widelyused in Holland, selectively used in the UK, and rarely used in Germany, Italyor Spain.
• Availability of information regarding borrowers’ debt burdens andcredit performance. Through a centralized, nationwide, data-sharing systemamong the credit institutions – detailed nationwide credit information is mostwidely available in Scandinavia (where a large electronic infrastructureprovides timely information) and least available in southern Europe (Italy,Portugal and Spain).
• Property value assessment. The availability of established practices andmechanisms for current determination, and subsequent update, of propertyvalue information. In Germany, for example, the established valuationpractice sets value between 10%-15% below the market value.
Key Features of MBS Bonds
In addition to a thorough understanding of the credit quality of the collateral andqualifications of the servicer, investors should be aware of the implications of thestructuring of these cash flows into an MBS bond, and the resultant maturity andrisk profile of the investment under evaluation.

ABS/MBS/CMBS/CDO 101 – 16 July 2003
Refer to important disclosures at the end of this report. 114
• Prepayments and their effect on floating rate MBS (mainly weighted averagelife, or WAL) and fixed rate MBS (duration and convexity).
• Prepayment assumptions used in credit enhancement modeling and MBSpricing.
• Clear understanding of the differences between expected maturity and legalmaturity for pass-through structures, for example, pass-through structures arerated by legal, not expected, maturity.
• Investment characteristics of specific MBS tranches – for example, senior,subordinated, interest only (IO) payments or principal only (PO) payments; inthe case of IO, this includes the effects of prepayments, resets on the fixedrate loans, excess spread, and WANM (weighted average net mortgage rate).
• Syndicate composition and commitment to secondary market makingassociated with the expected liquidity of the bonds.
• Finding an appropriate benchmark for pricing disparate asset classes, allfalling under the label of MBS, e.g. performing versus non-performing loans,originator experience, geographic distribution and loan seasoning. As defaultcurves vary by jurisdiction (e.g. defaults peak, on average, two years fromorigination for Italian mortgages, and four years from origination for UKmortgages), similar seasoning for different jurisdictions may have differentcredit implications.
� Monitoring Ongoing Transactions
To ensure that an investment broadly reflects the characteristics under which theinitial commitment was made, monitoring the pool’s performance is crucial. Priorto investment, investors should examine the following:
• Mechanisms for receiving timely information regarding pool performance(trustee reports, rating agencies reports, reporting on Bloomberg or a specifiedwebsite).
• Sufficiency of the information received for evaluation of pool performance –reporting criteria, clarity about calculation of different performanceindicators, comparability of reported information among similar deals in therespective country and across countries.
� Explanation of Selected Key Review Points
The following is a closer examination of a few of the points mentioned in theabove sections (for a summary of the key aspects of the analysis of the asset andliability side of MBS, see figure 2.1 at the end of this chapter):
� House Price Sustainability
Borrower inclination to remain current on a mortgage is a direct result of theperceived equity captured in the property securing the loan. If the value of a homeis rising, borrower equity is growing and if the borrower were to default on themortgage, the equity invested would be lost. On the other hand, if housing pricesare deteriorating and equity is diminished (as in eastern Germany), eliminated, oreven negative (as in Hong Kong), there is less incentive to remain current on themortgage. In these circumstances, the loan amount on which servicing is requiredmay be in fact larger than the value of the property itself.
As residential mortgage market cycles differ widely depending on jurisdiction, toidentify the likelihood of a sharp reversal in prices it is important to monitor thedevelopment of both structural and cyclical factors driving house prices. In short,the greater the cyclical element behind the level of prices in a given locale, thegreater the likelihood that an economic slowdown would precipitate a reduction inprices. A number of trends may be analyzed to determine the degree of structuralinfluence, among them:

ABS/MBS/CMBS/CDO 101 – 16 July 2003
Refer to important disclosures at the end of this report. 115
• Household growth and size of household
• Home ownership trends
• Availability of a secondary market for homes (upgrade mentality)
• Population growth
• Migration to (or from) country and/or major cities
• Divorce and separation rates
• Age and background of individuals when purchasing a first mortgage
To the extent that the first six factors on this list are increasing, and the last isdecreasing, such structural support in the markets under review may support homeprices even in the face of moderately rising interest rates, unemployment, andincreased house construction (supply).
� Analyzing MBS Prepayments
An important aspect of MBS deals and underlying pools for investors tounderstand is that of prepayments. Mortgage borrowers have the right, and areoften induced by a number of circumstances (such as market interest rates fallingwell below the borrower’s initial mortgage rate, increased income and desire tomove to a bigger house, or change of job location and the need to move house) toprepay their mortgage loans voluntarily. Alternatively, mortgage borrowers mayface another set of conditions (such as increasing mortgage payments due tointerest rate hikes, loss of income due to unemployment or disability) that mayforce them to default on their mortgages and lead to involuntary mortgage paydown as a result of a foreclosure on the mortgaged property.
Both voluntary and involuntary pay downs of outstanding mortgages have theeffect of changing the composition of a given mortgage pool backing an MBS,thus changing the cash flows generated by the pool and ultimately affecting theMBS amortization schedule. This is why investors must understand the effectprepayments have on MBS, and form adequate expectations as to when they willbe repaid.
An analysis of the effect of prepayments on fixed and floating rate MBS, issummarized as follows:
• Prepayments may affect the weighted average yield generated by themortgage pool, compared with the weighted average coupon as paid under theMBS. The difference between the two is the excess spread (after deduction oflosses and servicing fees), which serves investors as the first protectionagainst losses – reduction in excess spread diminishes the cushion protectinginvestors against losses. Reduction in excess spread due to prepaymentsoccurs as mortgage borrowers tend to prepay or default sooner on higherinterest rate loans – thus reducing the weighted average yield generated by themortgage pool – in a respectively falling or rising interest rate environment.
• Prepayments shorten the WAL of MBS, as investors receive principalrepayments earlier than expected.
• Receiving principal repayments earlier than anticipated may have little effectfor floating rate MBS investors, as the reinvestment risk of the repaidprincipal is relatively small – the floating rate coupon on an MBS shouldclosely trace the reinvestment rate, save for a spread over a common index.
• The effect on fixed rate MBS could, however, be significant and can beexpressed in:
- Reinvestment risk. MBS prepay mainly when interest rates are declining andlow, hence an MBS investor may have to reinvest prepaid principal at a ratebelow that of the MBS coupon.

ABS/MBS/CMBS/CDO 101 – 16 July 2003
Refer to important disclosures at the end of this report. 116
- Convexity risk. Prepayments lead to decreasing convexity for MBS. In adeclining interest rate environment, the value of a portfolio with decreasedconvexity increases by a smaller percentage than that of a portfolio withlarger convexity.
Hence the need for investors in fixed rate MBS to understand the prepaymentdynamics of a pool backing the respective MBS, the prepayments of which giverise to the prepayments under the MBS itself.
� Analyzing Interest-Only (IO) MBSIssuers launch IOs with a view to receiving the excess spread on the mortgagepool upfront, instead of receiving it on a monthly or quarterly basis. The excessspread is the difference between the revenue from the mortgage pool WAC on themortgages and the expenses under the MBS (servicing), WAC on MBS, andlosses. In an IO, the issuer can receive excess spread at the beginning of the dealby packaging the stream of excess spread payments into interest-only security. IOscan also be created by stripping the interest component of an MBS and creatingtwo complementary securities – one entitled to the principal payments only (PO)and another entitled to the interest payments only.
Here we discuss only the IOs created on the basis of excess spread. By doing this,the issuer in effect passes on to investors:
• Risk associated with the generation of excess spread – changes to WAC of theunderlying mortgage pool due to voluntary and involuntary prepayments(because of borrower default and subsequent repossession and liquidation ofthe underlying property), as well as losses.
• Market interest rate risks (repayments on mortgages are heavily influenced bya changing interest rate environment, and differences in indexes used forpricing the underlying mortgages and the MBS).
IOs are mainly structured as notional amount securities, which promise to payinvestors specified interest on the outstanding notional amount of securities. Theoutstanding notional amount is determined based on a specified formula.
IOs are usually rated securities. However, investors should take little comfort inthe assigned rating, as they address the likelihood of investors receiving apromised coupon rate on the outstanding notional balance, but not the return of theprincipal invested nor the timing of the cash flow receipts, nor the internal rate ofreturn.
� Banded Swaps and Yield Maintenance Agreements (YMA)
The mortgage pools underlying some MBS deals typically contain at least somefixed rate mortgage loans. With the MBS notes structured as floating rateobligations, the issuer must hedge the interest rate risk.
The hedging instrument is a swap between the issuer (the SPV) and acounterparty, which absorbs the risk of mismatch between the interest received bythe issuer on the underlying mortgages and the coupon paid to the noteholders. Fornoteholders this means that the issuer is able to meet its payments irrespective ofthe interest paid on the underlying mortgage loans.
The main difference between the familiar plain vanilla interest rate swap and aninterest rate swap embedded in a MBS transaction lies in the notional amount onwhich periodical payments are based.
• Under a simple plain vanilla interest rate swap, periodic payments betweenthe two swap parties are based on a notional amount, which is determined atthe outset and remains constant through time.
• Under an interest rate swap embedded in an MBS transaction, the notionalamount of the swap should ideally be equal to the outstanding collateral. Thedifficulty is that this amount varies with mortgage pre- and repayments andthese variations cannot be predicted exactly.

ABS/MBS/CMBS/CDO 101 – 16 July 2003
Refer to important disclosures at the end of this report. 117
• MBS transactions outstanding as at the end of 2002 deal with theunpredictability of the notional amount of the swap using two techniques:periodical swap payments can either vary without restrictions with the actualoutstanding amount of collateral (a yield maintenance agreement), or thevariations can be restricted, as is the case under a banded swap. In a bandedswap, the issuer is fully hedged against interest rate risk, as long as theoutstanding principal remains within a certain corridor, based upon maximumand minimum conditional prepayment rate (CPR) assumptions. If theoutstanding principal moves out of that corridor, the issuer is exposed tointerest rate risk on the difference between the actual collateral amount andthe upper/lower limit of the corridor. This leads to extra revenues or costs forthe issuer, thus increasing or diminishing excess spread.
� Guarantor-Dependent Ratings
In a number of jurisdictions, insurance is provided by either state or privateinsurers to encourage mortgage lending. In Australia, for example, it is awidespread practice for the mortgage loans in securitised pools to be insured on anindividual basis and on a pool basis. Private insurers also play a role in the Irish,French and UK mortgage markets. State guaranteed mortgages are often present inmortgage pools in the Netherlands and Belgium. These additional parties withinthe mortgage chain emphasizes the need for a clear understanding of the role ofmortgage insurers in the credit performance, credit rating, and rating volatility forsuch MBS.
Australian mortgage pools are generally insured by pool policies (up to a definedlimit) or individual loan policies. As such, any credit-related aspects of theirperformance defer to the performance of the respective insurance companies underthe insurance contracts. Changes in the process of mortgage origination, mortgageproduct features, and the consequences of increased competition have specificcredit effects on mortgage performance, the effects of which are dampened orabsorbed by the respective mortgage insurers. In this regard, it is important tofollow market changes that could affect the motivation of mortgage insurers tohonor claims or increase their ability to reject claims.
Investors’ exposure to the mortgage insurers is to the extent claims are submittedand are expected to be honored by the insurance companies. As the credit ratingsof MBS depend on the insurance coverage of the underlying mortgage pools, MBSratings may be correlated with the ratings of the insurance providers for a specificMBS pool. The rating of the insurance providers reflects their ability to pay claimsunder the granted insurance policies. Hence changes in the ratings of the claim-paying ability of insurers could lead to changes in the credit quality of the insuredmortgage pools and the related ratings of the respective MBS.

ABS/MBS/CMBS/CDO 101 – 16 July 2003
Refer to important disclosures at the end of this report. 118
Analytical Framework for Evaluating Mortgage Lenders
Criteria Considerations AimCompany Story Background
Previous incarnationsCommenced lendingTarget sectorCompany philosophyMarket positioningBrands
To develop an opinion on the company’scharacter and its positioning in the market.The aim is to understand the key drivers thatdifferentiate a given lender from the rest.
FundingWarehouse linesCapacityAdvance ratesWhole loan sales to dateSecuritisations to date
To determine a lender’s flexibility infinancing and how this impacts its originationtargets and funding exercises.
OwnershipStatusMajor shareholders/‘parent’Parent’s ratingGuarantees/comfort lettersHistorical experience
To identify the driving forces behind thecompany, its objective, and the potential forsupport in challenging times.
Corporate governanceManagement structureManagement experiencePolicy-setting procedure for
Risk targetsCredit committeesProfitability targets
To understand the company’s managementstructure and decision-making process, andhow it and management’s profitability targetsaffect the company’s risk appetite.
OutlookMarket strategyCompetitionMarket directionProjected volumes
To establish where the lender sees theindustry at present and in the future going,and where it aims to position itself therein.
Origination Target mortgage sectorProducts originatedUnique productsExclusionsBrandsCross-sale products
To determine the company’s full range ofproducts, and how that corresponds to thecompany’s stated target sector and riskappetite.
DistributionSourcesFinancial intermediary networkProcurement feesOrigination costPackaging proceduresUse of the third-party servicesProcess capture
To identify the company’s distribution model,its capacity, and viability based on thecompany’s outlook for the market.
UnderwritingProcess captureNumber of underwritersRisk bandingCredit scoringExplicit exclusionsUse of the third-party servicesUnique features
To determine how the company deals withspecific factors associated with its targetmarket in originating mortgages; in particularemphasis is placed on the basis for creditdecisions.

ABS/MBS/CMBS/CDO 101 – 16 July 2003
Refer to important disclosures at the end of this report. 119
Analytical Framework for Evaluating Mortgage Lenders
Operations ServicingModelOut-source companyIn-source servicesTotal book servicedCostsSystemsManagement information systemsDevelopmentsUnique products
To evaluate the strength of a lender’sservicing platform and its ability to extractvalue from a mortgage portfolio throughout arange of economic scenarios.
Arrears managementPayment methodStructureWork-out accountingRecovery proceduresShortfall proceduresUse of third-party servicesUnique features
To confirm a lender’s ability to effectivelyfollow a viable arrears-management processto manage the risk on the overall book, andminimize losses.
PerformanceFirst-payment defaultsTotal 30+ arrearsTotal 90+ arrearsPossessionsSales, and time to sellLosses
To draw insight from the historicalperformance of the company’s portfolio andhow it compares to the overall market andthe company’s risk appetite.
PrepaymentHistorical ratesDrivers
To understand the relationships betweenprepayment rates and variousmacroeconomic factors and how theseimpact portfolio performance.
Securitisation Structure To identify any unique features, strengths,and weaknesses in MBS structuresemployed.
Transactions to date To document the evolving capital structureand execution levels across all of a lender’stransactions, and compare these to thebroader market.
Source: Merrill Lynch
8.2. Calculus for MBS
As the supply of European MBS increases across the board (meaning countries,different type of originators, different types of mortgage products, varying bondstructures, etc.) the opportunities for comparisons abound. And such comparisonsare becoming a must from a relative value perspective within the MBS sector.
The quantitative comparisons, though, cannot be done directly given the differentmethodologies and conventions that exist in the different markets within Europe.Hence, the need for adjustments. Below we discuss simple, back-of-the-envelopeadjustments that would help improve the comparability of the differentquantitative characteristics of the mortgage bonds in Europe.
One of the key features of MBS collateral pool is the weighted average LTV(loan-to-value ratio) of the mortgages at deal closing. The LTV is a key feature ofa mortgage loan or a mortgage pool given its role of main indicator of the defaultprobability of the mortgagee. That is, the higher the LTV the lower the equitystake of the mortgagee in the property and the more likely s/he is to hand back thekeys in case of a financial trouble.

ABS/MBS/CMBS/CDO 101 – 16 July 2003
Refer to important disclosures at the end of this report. 120
So, comparing the LTV of the mortgage pools of different MBS, all other thingsbeing equal, should give investors a good indication of their respective defaultprobabilities. If only the LTVs were calculated the same way in all MBS!Unfortunately, they are not. And in order to use them in a meaningful way incomparing different MBS, investors should make proper adjustments.
� Recalculating MBS LTV
But let’s start from the beginning, the most generic loan-to-value ratio, i.e. theamount of the mortgage loan divided by the value of the mortgage property. So thefirst set of questions is:
• What does the amount of the mortgage loan include? (ratio numerator); and
• How is the value of the mortgaged property determined? (ratio denominator).
When buying a property, the mortgagee faces a number of expenses – tax, broker,legal, appraisal, environmental evaluation, insurance, etc. fees and expenses.These expenses can be quite substantial varying from approximately 5% in the UKto 14%-23% in Belgium. And they can be financed differently: out-of-pocketexpenses for the mortgagee in Germany and Belgium or fully included in themortgage loan in the Netherlands, or a combination thereof in France. In theextreme, high out of pocket expenses associated with the purchase of a propertyincrease the borrower’s equity in that property even though they are not reflectedin the LTV calculation. On the other extreme are high expenses fully funded bythe mortgage loan – they not only increase the LTV, but also decreasemortgagee’s commitment to the property – s/he has made no expenses, no up-frontfinancial commitment to the property in question. Somewhat off the focus of ourdiscussion, it is worth mentioning that the high up front out-of-pocket expenses ofthe mortgagee act as a deterrent to housing turnover, i.e. moving house at the spurof the moment.
Determination of the property value evokes a series of other questions:
• Who does it? – the lender himself, branch manager, internal evaluationdepartment, certified specialist; or an outside party, qualified or certifiedappraisers.
• How is it done? – using current market value, market comparisons, adjustedmarket value (normalized for long-term trends) or liquidation value (fire-saleassumptions).
Needless to say, the most conservative valuation would be the one performed by acertified outside appraiser using the liquidation value approach.
Now, let’s summarize: an MBS from the Netherlands has an LTV of 80%, so doesthe MBS from Germany. Depending on how the numerator and denominator ofthe two LTV ratios are calculated they may not be really the same. In theNetherlands the loan calculation may include all up-front mortgagee expenses(assume 10% of the loan) and the property is valued at liquidation value (15%below current market value), while in Germany the mortgage does not cover anyup-front mortgagee expenses and the property is valued at liquidation value (15%below current market value).
Therefore, in order to make the two LTVs comparable, one should adjust theDutch LTV by decreasing the amount of the loan by 10% and decreasing the valueof the property by 20%. Hence 80/100 = 80% would be after adjustments (80 –8)/(100 – 15) = 85%. For Germany, the LTV would be 80/(100 – 15) = 94%. So ifthe same LTV calculation method is used the MBS in Germany would be riskierwith LTV of 94% compared to the LTV in the Netherlands with 85% LTV. Suchback-of-the-envelop calculations can be applied to the pool LTV of two MBSfrom different countries, as well.
ABS/MBS/CMBS/CDO 101 – 16 July 2003
Refer to important disclosures at the end of this report. 121
� Adjusting MBS LTV for Seasoning
The adjustments, however, do not stop here. The next logical questions to ask are:
• When was the LTV calculated?
• What is the mortgage (or mortgage pool) seasoning?
• Have there been any adjustments made to the LTV reflecting the mortgageseasoning – the repayment of principal or the changes in the property value?
As before these questions reflect the differences in the practices of differentcountries and mortgage lenders, and directly affect the comparability of themortgage pools. Let’s look at the extremes again: an MBS from England wherethe LTV is determined at the time of the mortgage origination and no furtheradjustments are made, and an MBS from Sweden, where the LTV is re-calculatedregularly to reflect the value of the house and the mortgage loan amortization.
And again let’s assume that the mortgage from both countries have an LTV of80% reported in the second year of their lives. An LTV of 80% in Sweden is theactual current mortgage LTV. For England, LTV of 80% must be adjusted toreflect:
• One year of scheduled loan amortization – we assume that this is 20 year levelprincipal payment mortgage, so 80/20 = 4;
• Prepayment of principal – we assume a CPR of 20%, i.e. 16; and
• Housing price index change – we assume 20% index appreciation year-on-year.
• Therefore, the LTV of the mortgage loan in England would be (80 – 4 –16)/(100 + 20) = 50%. If we perform this adjustment on the basis of amortgage pool weighted average LTV for two MBS reported with 80% LTV,it is clear that the MBS from England would be less risky than the MBS fromSweden, all other conditions being equal. But the analysis does not stop here.
� Reflecting the Housing Market Cycle
We move on to determine the stage of the housing market development and moreprecisely, its point in the housing market cycle. The stage in the housing marketcycle is indicative of various factors affecting the mortgage loans and MBSmortgage pools: solidity of underwriting, competitive pressures, housing priceinflation or deflation, product innovation, interest rate environment. All of theabove affect current and more importantly future mortgagee behavior andmortgage pool performance.
So, with regards to future MBS performance expectation, adjustment should bemade to reflect the respective mortgage pool LTV as an indicator of theprobability of default and the housing market cycle as an indicator of theconditions under which that probability will be played out.
Furthermore, it is necessary to take a view on the status of the respective housingmarket cycle in conjunction with the respective timing of the mortgage pool cashflows matched against the required cash flows under the bond in its average life.

ABS/MBS/CMBS/CDO 101 – 16 July 2003
Refer to important disclosures at the end of this report. 122
Analyst Certification
We, Alexander Batchvarov, Jenna Collins and William Davies, hereby certify thatthe views each of us has expressed in this research report accurately reflect each ofour respective personal views about the subject securities and issuers. We alsocertify that no part of our respective compensation was, is, or will be, directly orindirectly, related to the specific recommendations or view expressed in thisresearch report.
Copyright 2003 Merrill Lynch, Pierce, Fenner & Smith Incorporated (MLPF&S). All rights reserved. Any unauthorized use or disclosure is prohibited. This report has beenprepared and issued by MLPF&S and/or one of its affiliates and has been approved for publication in the United Kingdom by Merrill Lynch, Pierce, Fenner & Smith Limited,which is regulated by the FSA; has been considered and distributed in Australia by Merrill Lynch Equities (Australia) Limited (ACN 006 276 795), a licensed securities dealerunder the Australian Corporations Law; is distributed in Hong Kong by Merrill Lynch (Asia Pacific) Ltd, which is regulated by the Hong Kong SFC; and is distributed inSingapore by Merrill Lynch International Bank Ltd (Merchant Bank) and Merrill Lynch (Singapore) Pte Ltd, which are regulated by the Monetary Authority of Singapore. Theinformation herein was obtained from various sources; we do not guarantee its accuracy or completeness. Additional information available.
Neither the information nor any opinion expressed constitutes an offer, or an invitation to make an offer, to buy or sell any securities or any options, futures or otherderivatives related to such securities ("related investments"). MLPF&S, its affiliates, directors, officers, employees and employee benefit programs may have a long or shortposition in any securities of this issuer(s) or in related investments. MLPF&S or its affiliates may from time to time perform investment banking or other services for, or solicitinvestment banking or other business from, any entity mentioned in this report.
This research report is prepared for general circulation and is circulated for general information only. It does not have regard to the specific investment objectives,financial situation and the particular needs of any specific person who may receive this report. Investors should seek financial advice regarding the appropriateness ofinvesting in any securities or investment strategies discussed or recommended in this report and should understand that statements regarding future prospects may not berealized. Investors should note that income from such securities, if any, may fluctuate and that each security’s price or value may rise or fall. Accordingly, investors mayreceive back less than originally invested. Past performance is not necessarily a guide to future performance.
The bonds of the company are traded over-the-counter. Retail sales and/or distribution of this report may be made only in states where these securities are exempt fromregistration or have been qualified for sale. MLPF&S usually makes a market in the bonds of this company.
Foreign currency rates of exchange may adversely affect the value, price or income of any security or related investment mentioned in this report. In addition, investors insecurities such as ADRs, whose values are influenced by the currency of the underlying security, effectively assume currency risk.