Embed Size (px)
Citation preview
Internet Appendix for:
"The Effect of Mortgage Securitization on Foreclosure and Modification"
1. Modification algorithm
The LPS data set lacks an explicit modification flag but contains enough detailed panel in-
formation to identify changes to loan terms over time. My loan modification algorithm differs in
some details but is essentially the same as the algorithm employed by Adelino, Gerardi, and Willen
(2013). The purpose of the algorithm is to identify changes to loan terms that are consistent with
modification and do not have other likely explanations. Some changes are enough to identify a
modification on their own. For example, absent errors in the data, an interest rate change to a
fixed rate loan must stem from modification. Other changes require confirmatory evidence. For
example, a principal reduction could be from a modification or from a prepayment. The size of the
reduction, changes in monthly payments, and other simultaneous modifications all inform whether
the reduction stems from a modification. In all cases, the loans in question are seriously delinquent
at the time of the potential modification, adding to the likelihood that the algorithm is identifying
true modifications. The algorithm separately identifies four types of modifications: interest rate
reductions, term extensions, principal decreases, and principal increases. These modifications are
not mutually exclusive and often take place simultaneously. I consider a loan to be modified if the
algorithm flags it with any of the four modification types.
1.1. Interest rate reductions
Interest rate reductions are easiest to identify in fixed-rate loans and adjustable-rate loans that
are still in their introductory fixed-rate period. For these loans, I define an interest rate reduction
as a change that reduces a loan’s interest rate to at most 0.5 ppt below the previous month’s rate
and the loan’s origination interest rate.
For adjustable-rate mortgages, I first compute a fully indexed interest rate for each loan in
each month using LPS data on the loan’s reference index and spread combined with time-series
data on the index rates. For example, a loan that references LIBOR and has a spread of 2 ppt
would have a fully indexed rate of LIBOR + 2 ppt in any month. I abstract from details on exactly
1
how frequently rates reset and consider any loan to be adjustable if it is past or within 2 months
of the end of its introductory period. To be flagged as an interest rate reduction, a loan’s interest
rate must decrease to at most 0.5 ppt below the previous month’s rate and 1 ppt below the fully
indexed rate.
1.2. Term extensions
To be flagged as a term extension, a loan’s remaining term to maturity must increase by at
least 12 months. The term extension must be contemporaneous with a payment, interest rate, or
principal change.
1.3. Principal decreases
To be flagged as a principal decrease, the mortgage must have had outstanding principal of at
least $25K in the previous month, and the principal balance must have decreased by between 10%
and 30% and be accompanied by a payment, interest rate, or term change. The 10-30% range is
used to differentiate modifications from scheduled principal decreases and prepayments. Adelino,
Gerardi, and Willen (2013) experiment with the 30% cutoff and find that results are not sensitive
to its exact value.
1.4. Principal increases
To be flagged as a principal increase, principal must increase by at least 1% and be accompanied
by a payment, interest rate, or term change. Because of their potential for negative amortization,
option ARM principal increases are not flagged as modifications.
2
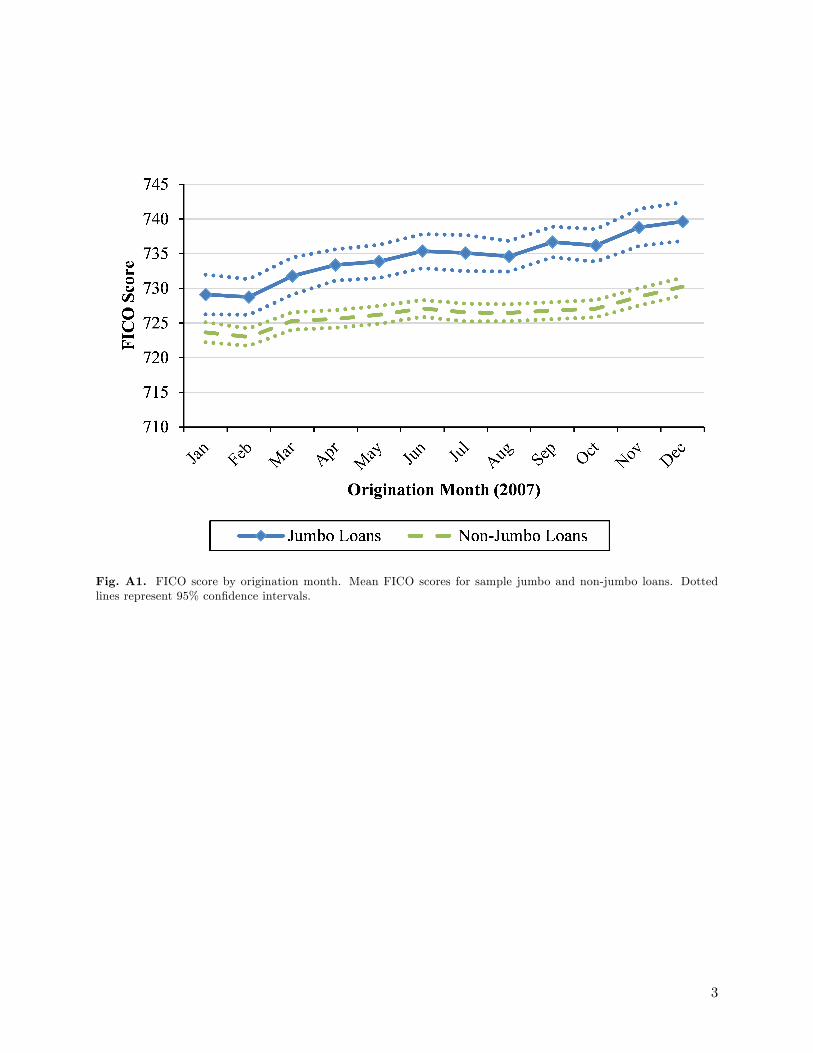
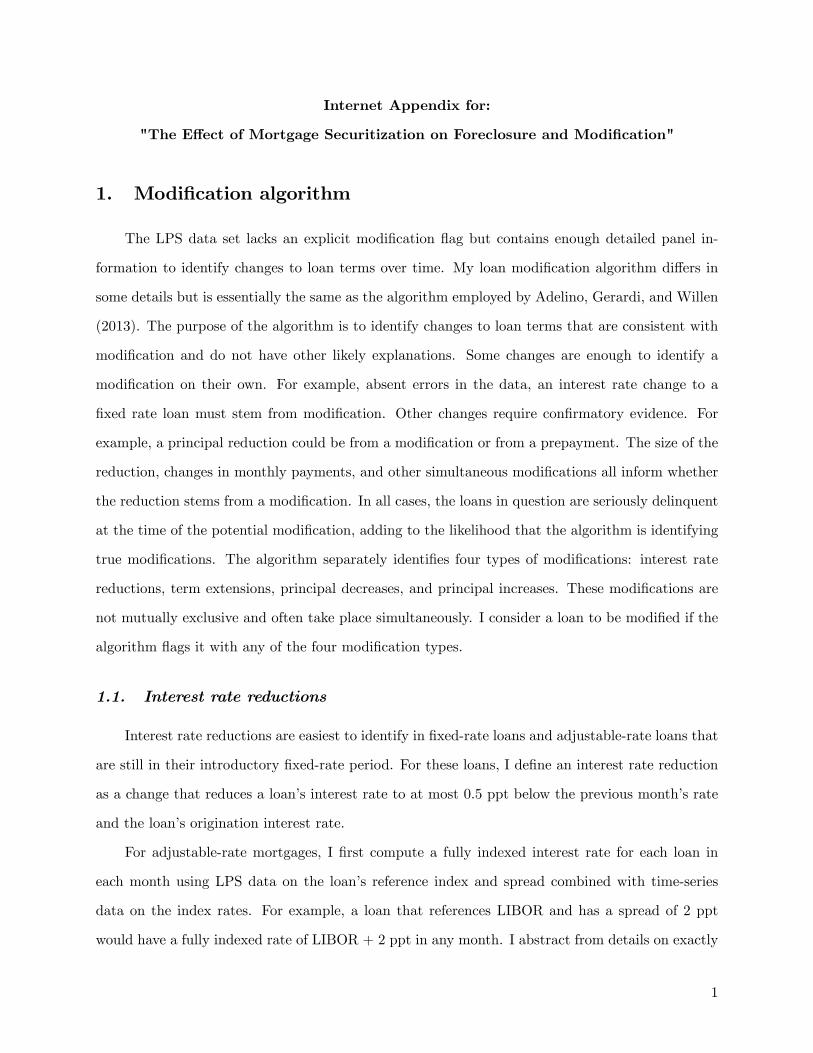
Fig. A1. FICO score by origination month. Mean FICO scores for sample jumbo and non-jumbo loans. Dottedlines represent 95% confidence intervals.
3
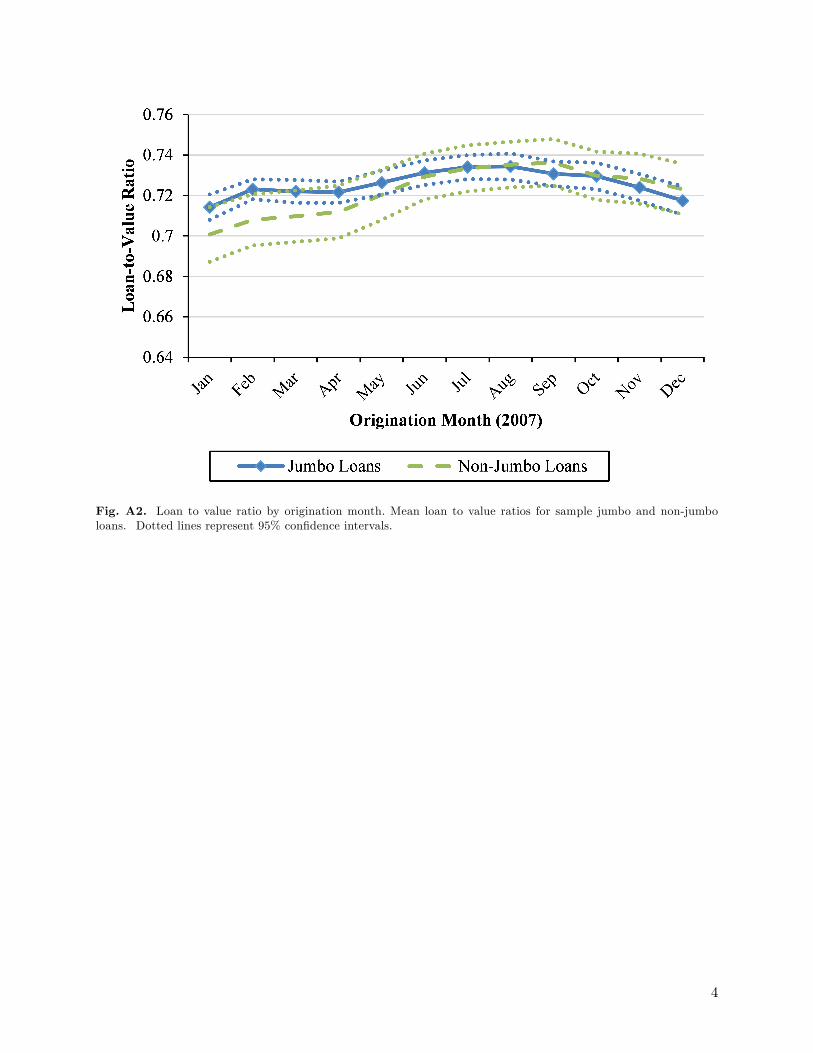
Fig. A2. Loan to value ratio by origination month. Mean loan to value ratios for sample jumbo and non-jumboloans. Dotted lines represent 95% confidence intervals.
4
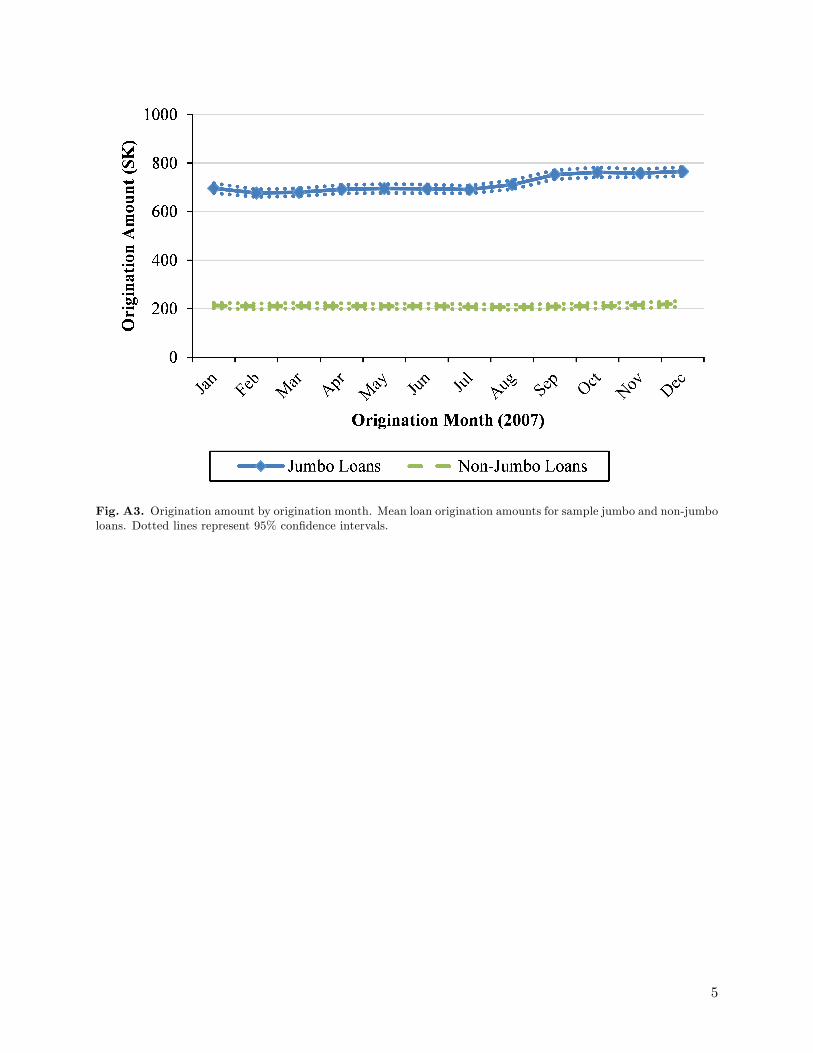
Fig. A3. Origination amount by origination month. Mean loan origination amounts for sample jumbo and non-jumboloans. Dotted lines represent 95% confidence intervals.
5
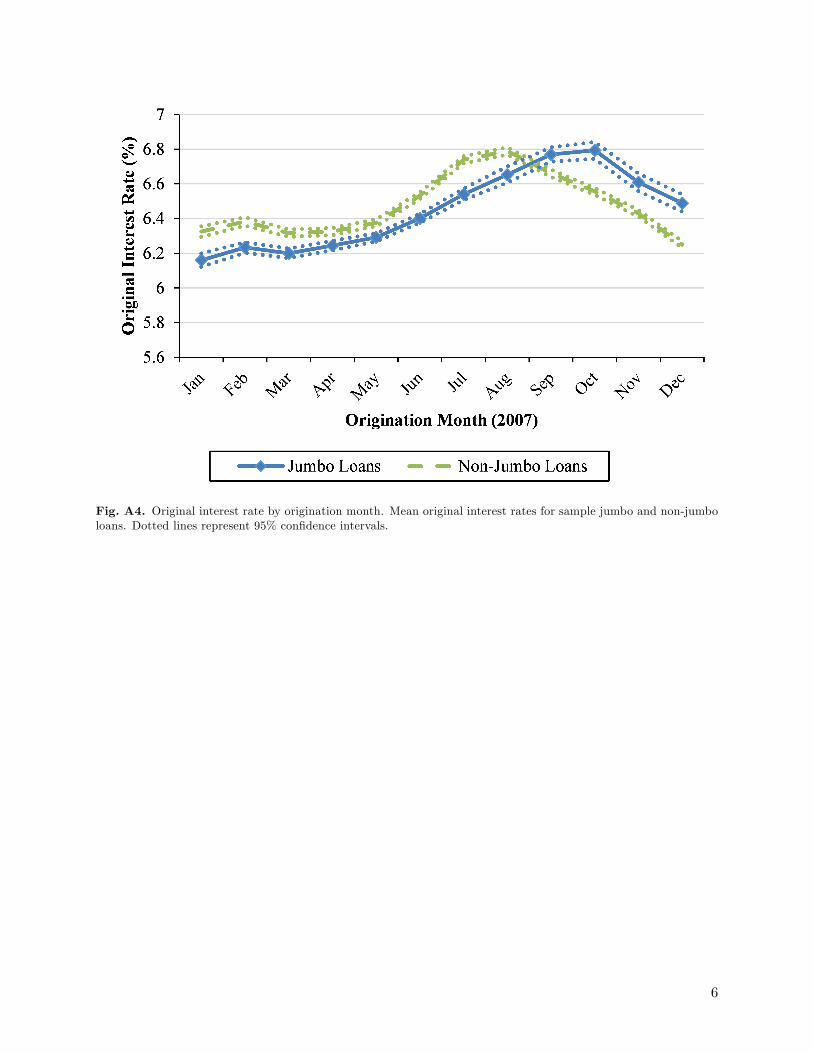
Fig. A4. Original interest rate by origination month. Mean original interest rates for sample jumbo and non-jumboloans. Dotted lines represent 95% confidence intervals.
6
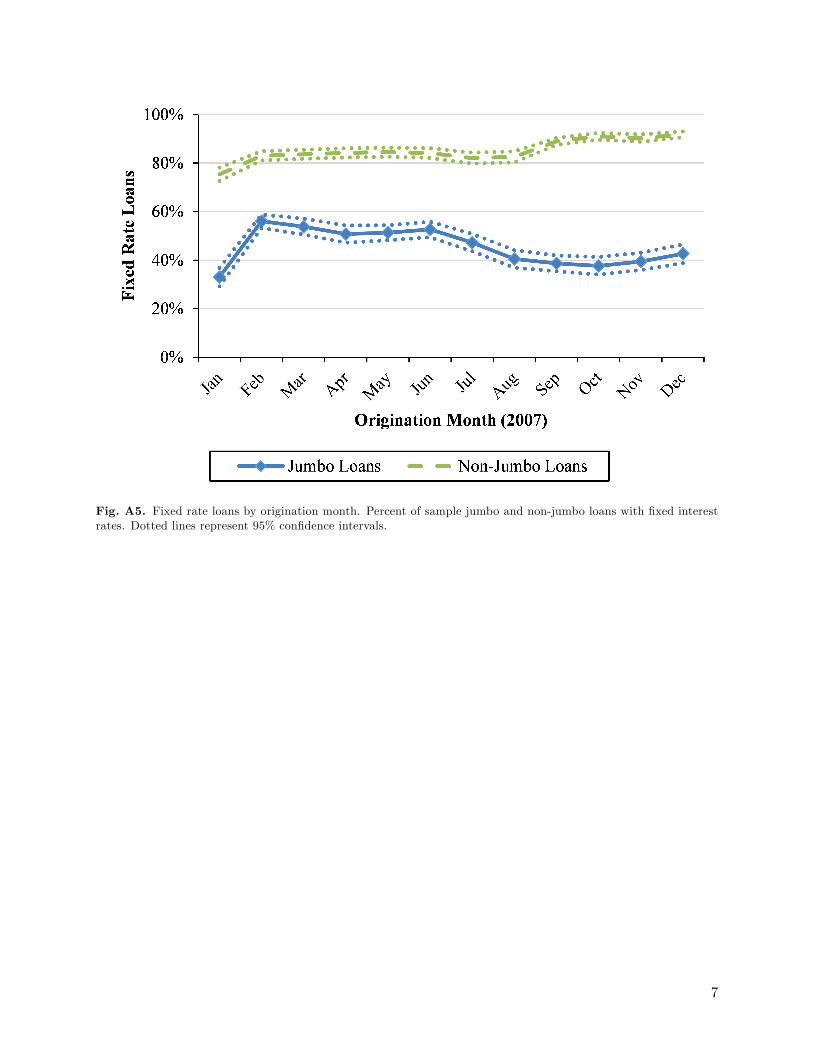
Fig. A5. Fixed rate loans by origination month. Percent of sample jumbo and non-jumbo loans with fixed interestrates. Dotted lines represent 95% confidence intervals.
7
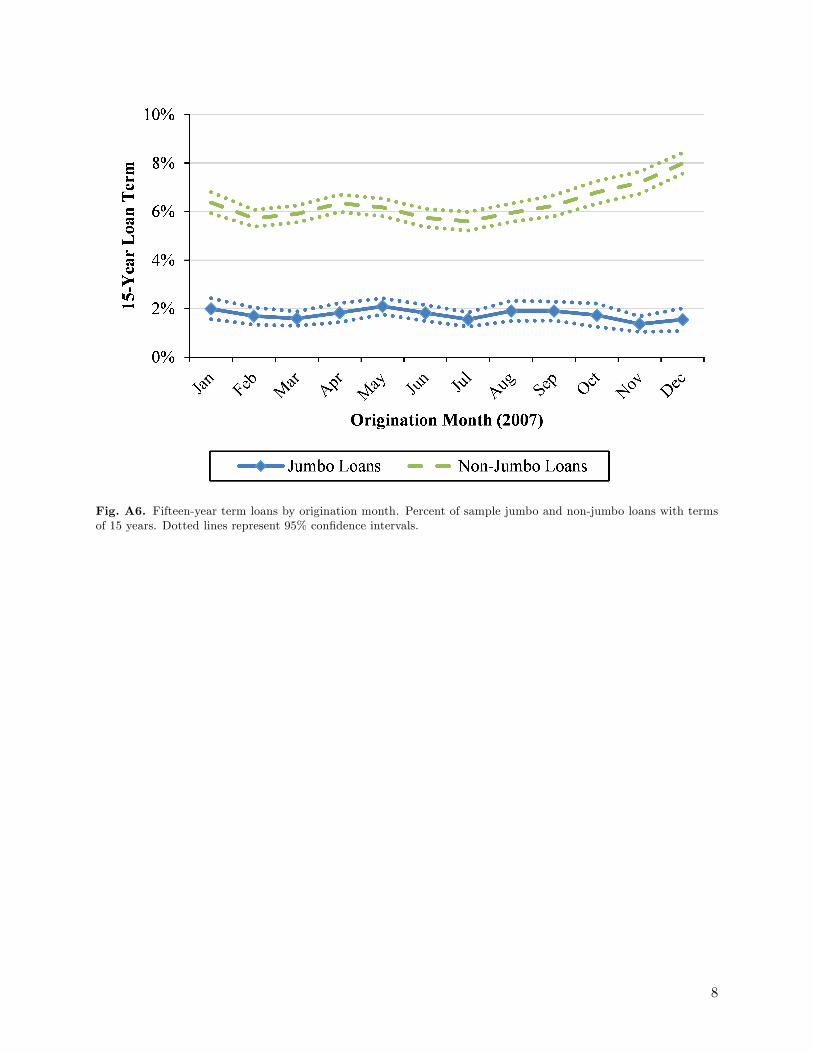
Fig. A6. Fifteen-year term loans by origination month. Percent of sample jumbo and non-jumbo loans with termsof 15 years. Dotted lines represent 95% confidence intervals.
8
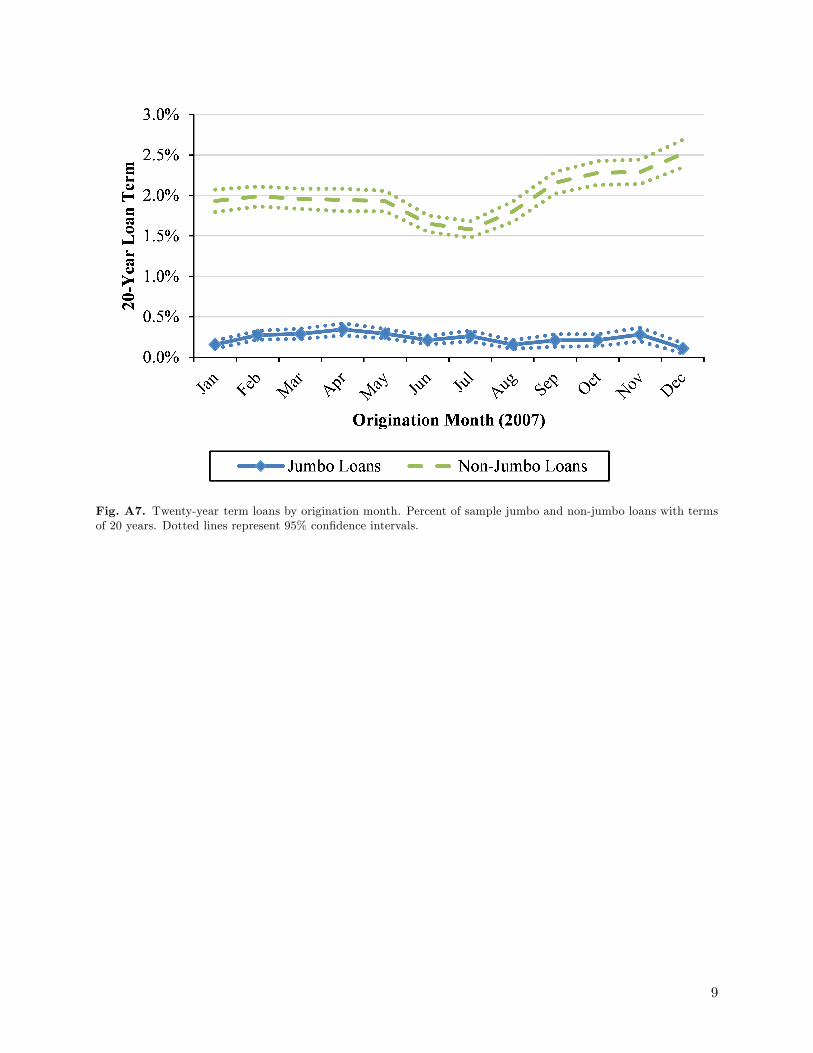
Fig. A7. Twenty-year term loans by origination month. Percent of sample jumbo and non-jumbo loans with termsof 20 years. Dotted lines represent 95% confidence intervals.
9
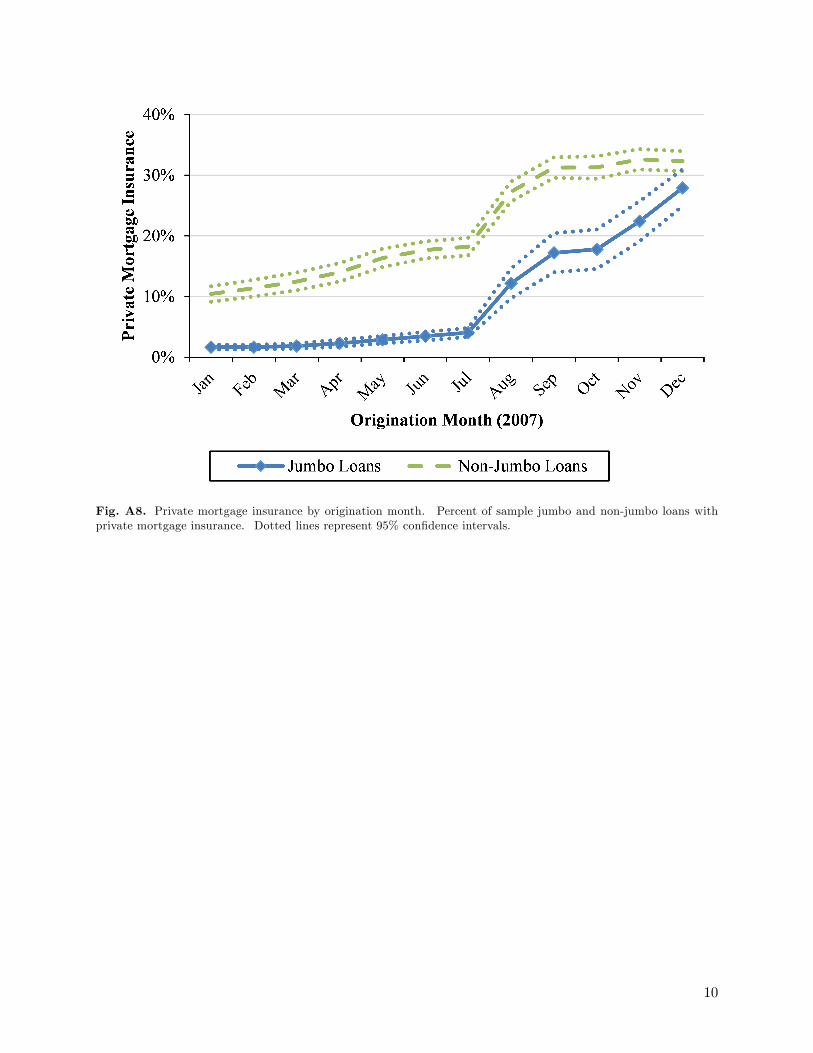
Fig. A8. Private mortgage insurance by origination month. Percent of sample jumbo and non-jumbo loans withprivate mortgage insurance. Dotted lines represent 95% confidence intervals.
10
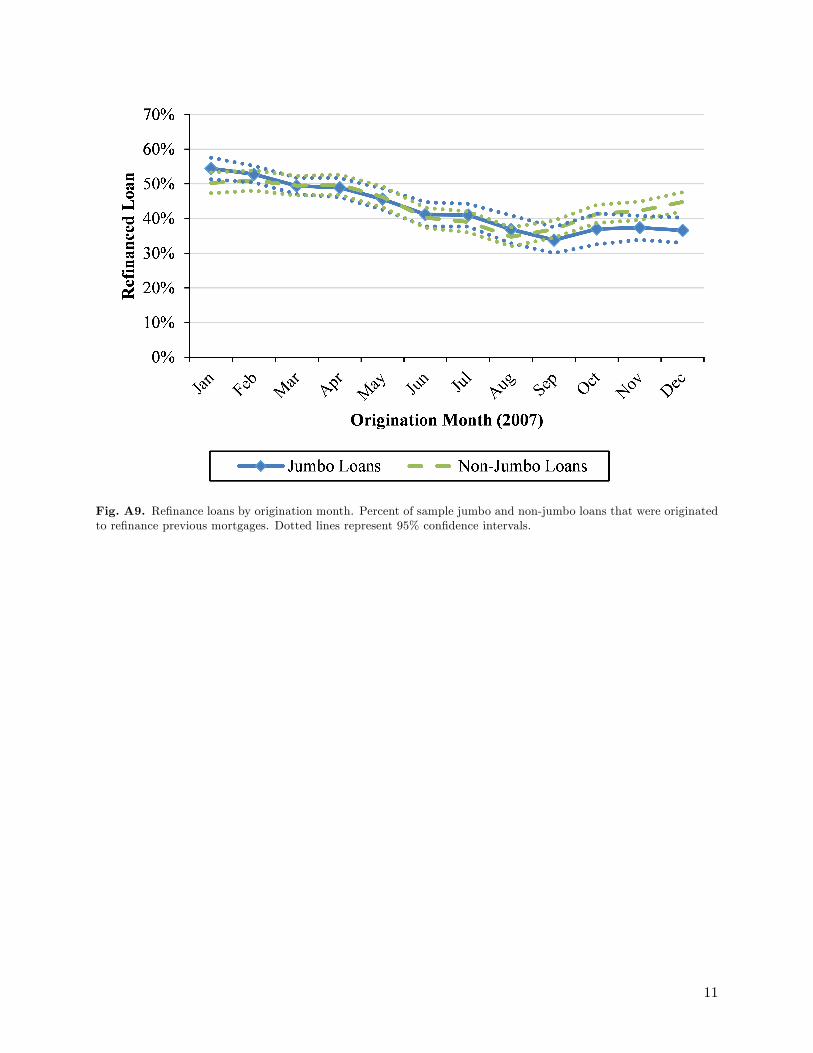
Fig. A9. Refinance loans by origination month. Percent of sample jumbo and non-jumbo loans that were originatedto refinance previous mortgages. Dotted lines represent 95% confidence intervals.
11
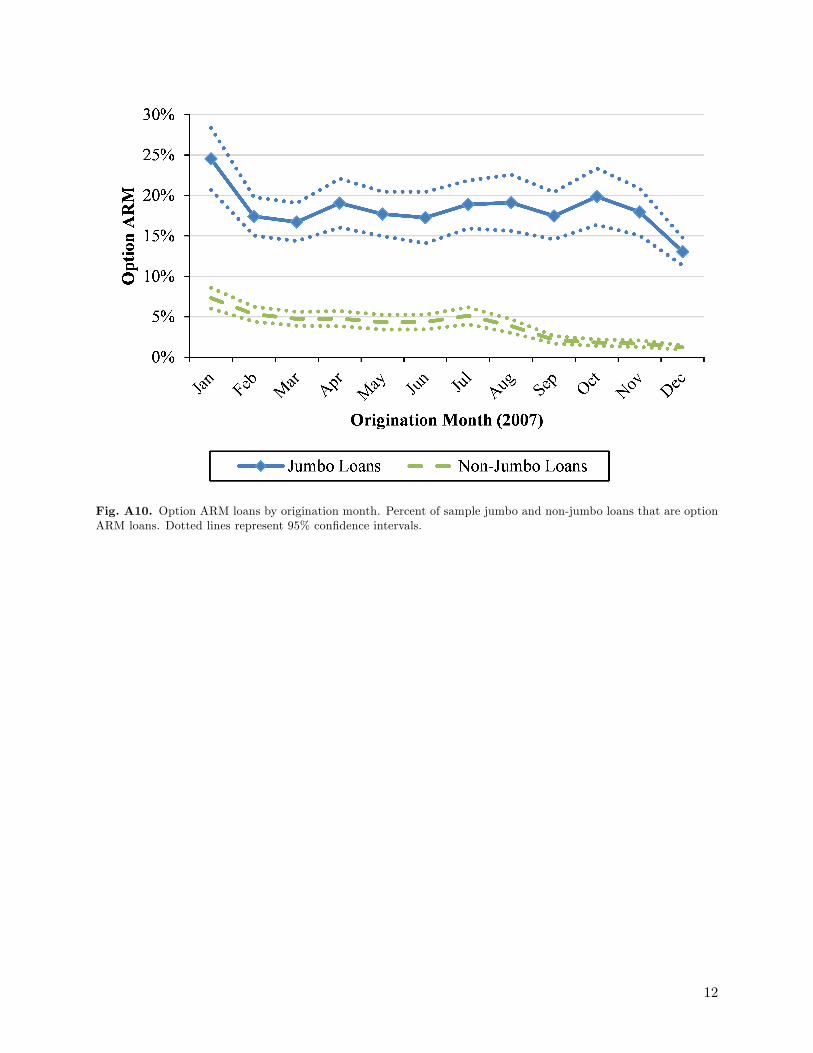
Fig. A10. Option ARM loans by origination month. Percent of sample jumbo and non-jumbo loans that are optionARM loans. Dotted lines represent 95% confidence intervals.
12
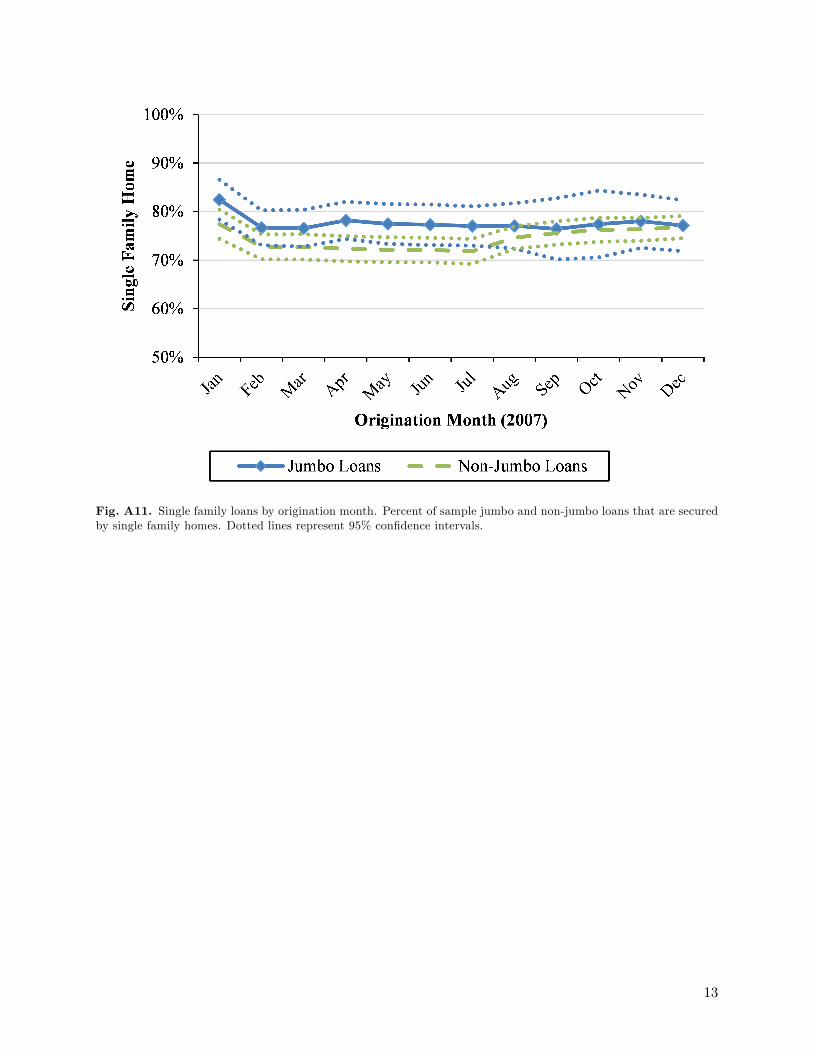
Fig. A11. Single family loans by origination month. Percent of sample jumbo and non-jumbo loans that are securedby single family homes. Dotted lines represent 95% confidence intervals.
13
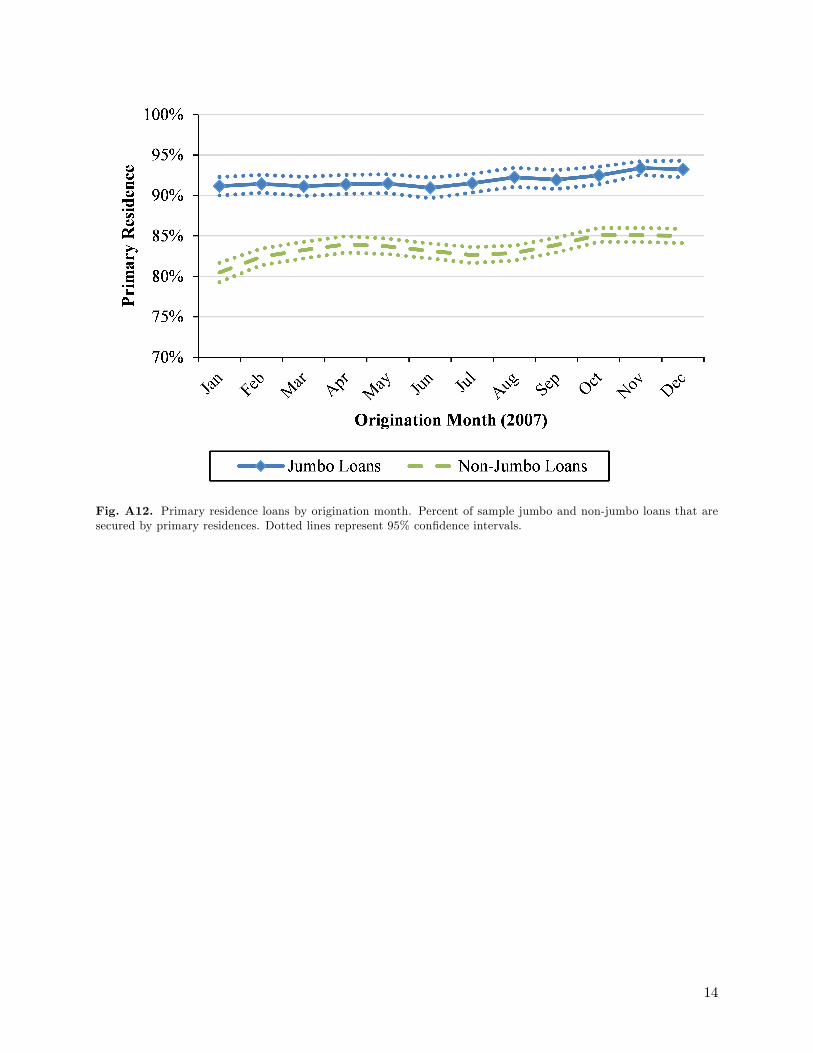
Fig. A12. Primary residence loans by origination month. Percent of sample jumbo and non-jumbo loans that aresecured by primary residences. Dotted lines represent 95% confidence intervals.
14
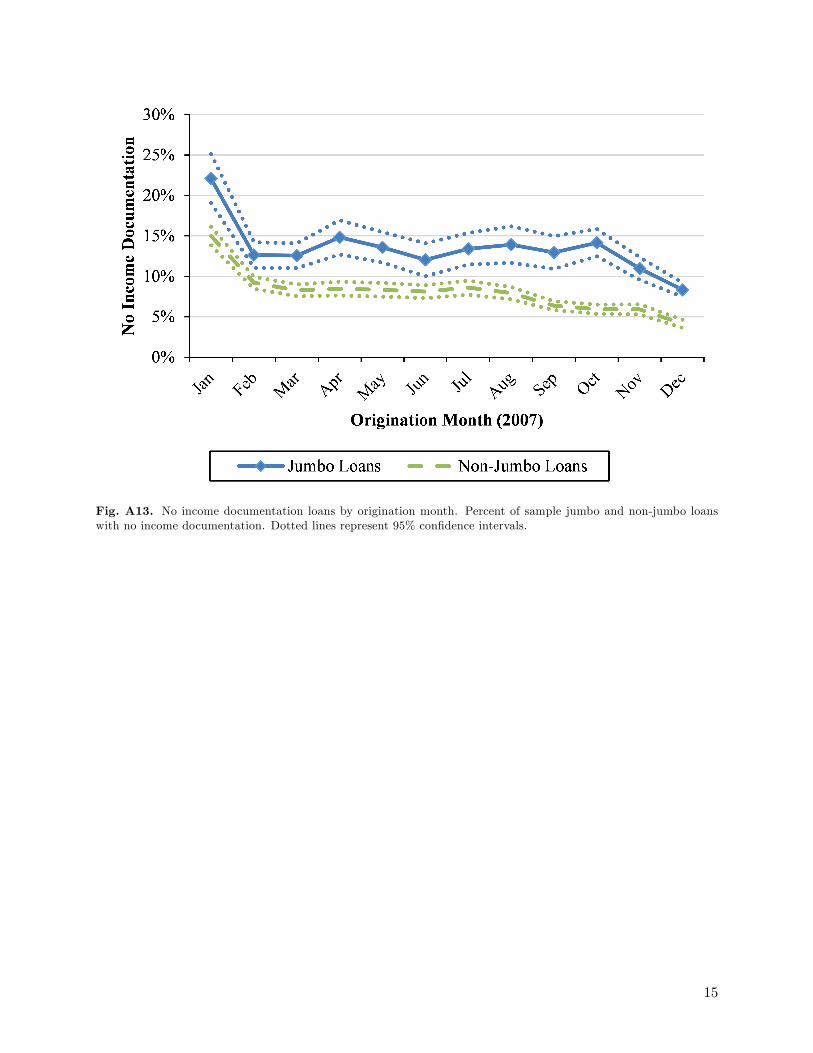
Fig. A13. No income documentation loans by origination month. Percent of sample jumbo and non-jumbo loanswith no income documentation. Dotted lines represent 95% confidence intervals.
15
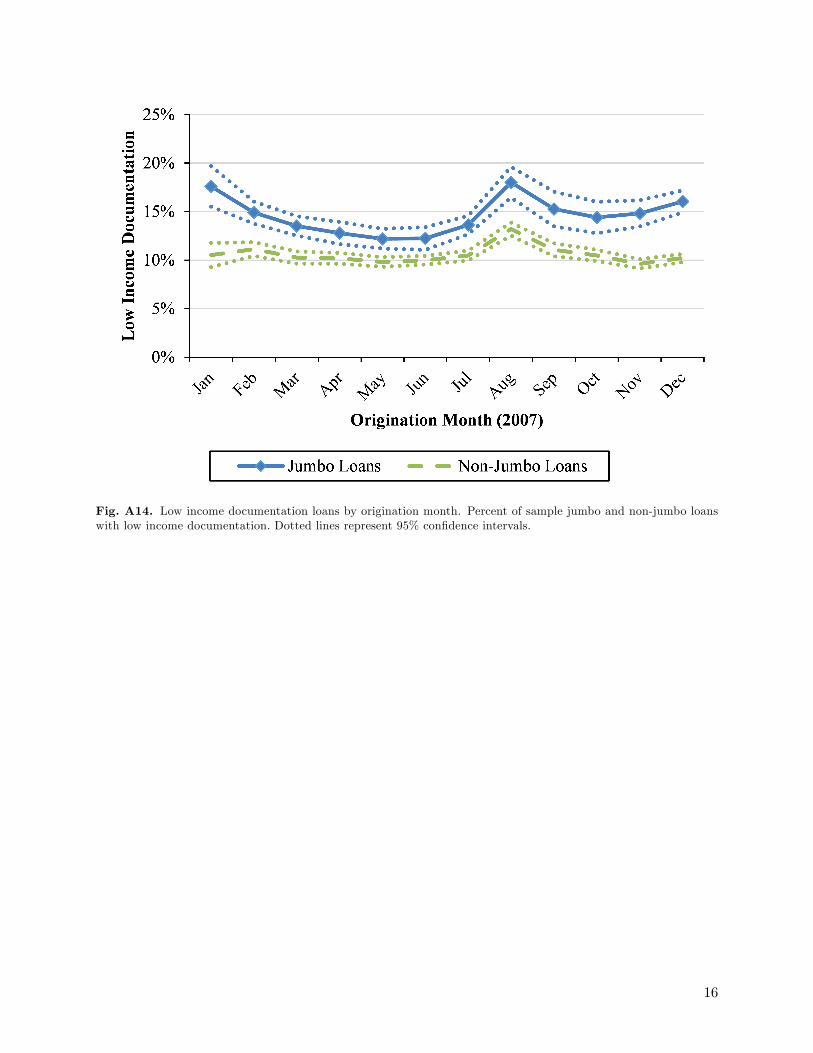
Fig. A14. Low income documentation loans by origination month. Percent of sample jumbo and non-jumbo loanswith low income documentation. Dotted lines represent 95% confidence intervals.
16
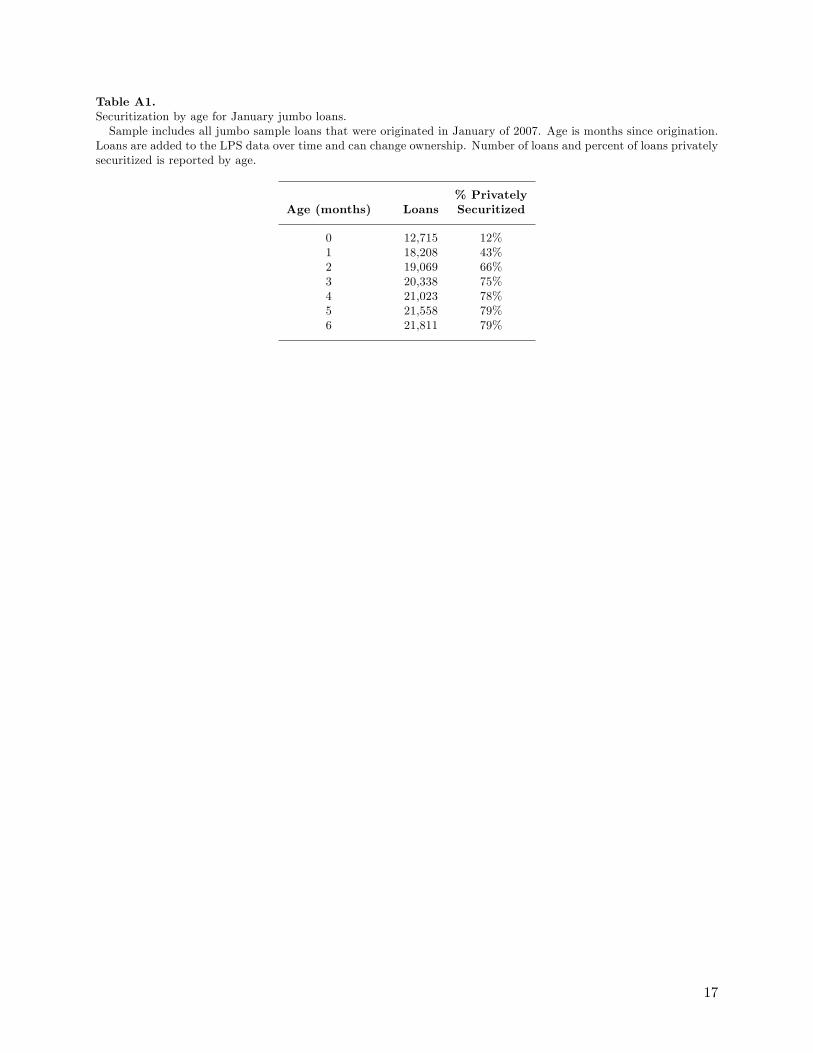
Table A1.Securitization by age for January jumbo loans.Sample includes all jumbo sample loans that were originated in January of 2007. Age is months since origination.
Loans are added to the LPS data over time and can change ownership. Number of loans and percent of loans privatelysecuritized is reported by age.
% PrivatelyAge (months) Loans Securitized
0 12,715 12%1 18,208 43%2 19,069 66%3 20,338 75%4 21,023 78%5 21,558 79%6 21,811 79%
17
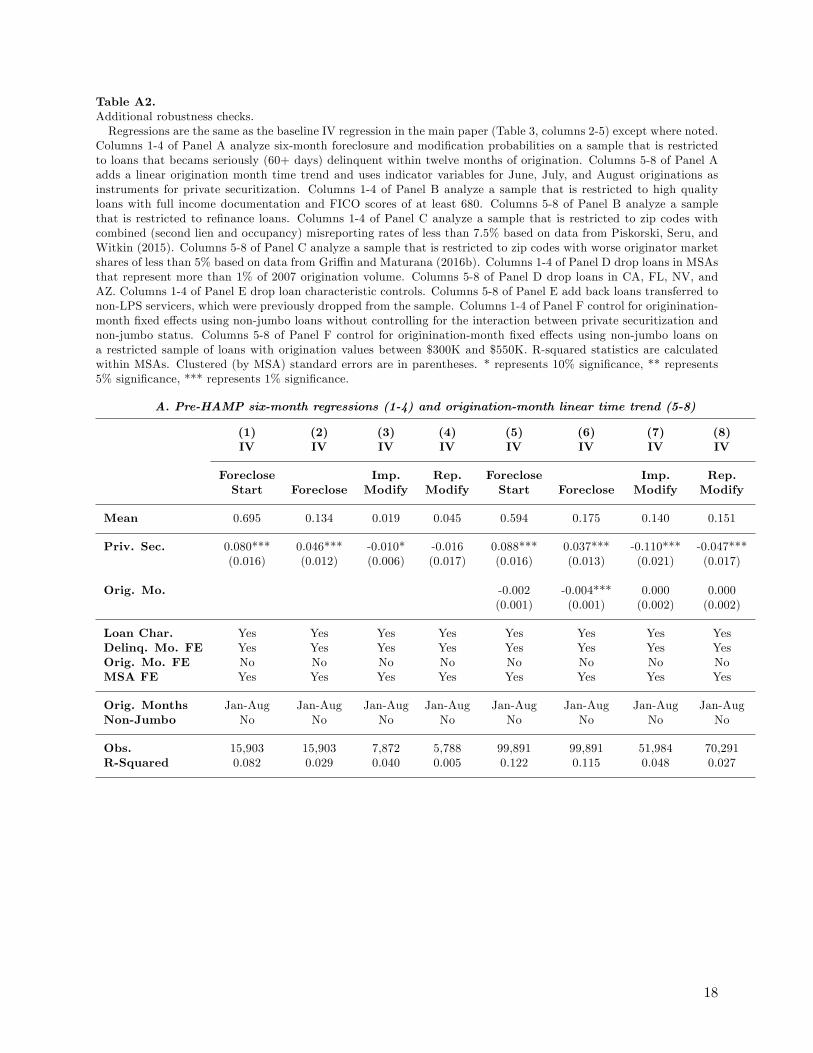
Table A2.Additional robustness checks.Regressions are the same as the baseline IV regression in the main paper (Table 3, columns 2-5) except where noted.
Columns 1-4 of Panel A analyze six-month foreclosure and modification probabilities on a sample that is restrictedto loans that becams seriously (60+ days) delinquent within twelve months of origination. Columns 5-8 of Panel Aadds a linear origination month time trend and uses indicator variables for June, July, and August originations asinstruments for private securitization. Columns 1-4 of Panel B analyze a sample that is restricted to high qualityloans with full income documentation and FICO scores of at least 680. Columns 5-8 of Panel B analyze a samplethat is restricted to refinance loans. Columns 1-4 of Panel C analyze a sample that is restricted to zip codes withcombined (second lien and occupancy) misreporting rates of less than 7.5% based on data from Piskorski, Seru, andWitkin (2015). Columns 5-8 of Panel C analyze a sample that is restricted to zip codes with worse originator marketshares of less than 5% based on data from Griffi n and Maturana (2016b). Columns 1-4 of Panel D drop loans in MSAsthat represent more than 1% of 2007 origination volume. Columns 5-8 of Panel D drop loans in CA, FL, NV, andAZ. Columns 1-4 of Panel E drop loan characteristic controls. Columns 5-8 of Panel E add back loans transferred tonon-LPS servicers, which were previously dropped from the sample. Columns 1-4 of Panel F control for originination-month fixed effects using non-jumbo loans without controlling for the interaction between private securitization andnon-jumbo status. Columns 5-8 of Panel F control for originination-month fixed effects using non-jumbo loans ona restricted sample of loans with origination values between $300K and $550K. R-squared statistics are calculatedwithin MSAs. Clustered (by MSA) standard errors are in parentheses. * represents 10% significance, ** represents5% significance, *** represents 1% significance.
A. Pre-HAMP six-month regressions (1-4) and origination-month linear time trend (5-8)
(1) (2) (3) (4) (5) (6) (7) (8)IV IV IV IV IV IV IV IV
Foreclose Imp. Rep. Foreclose Imp. Rep.Start Foreclose Modify Modify Start Foreclose Modify Modify
Mean 0.695 0.134 0.019 0.045 0.594 0.175 0.140 0.151
Priv. Sec. 0.080*** 0.046*** -0.010* -0.016 0.088*** 0.037*** -0.110*** -0.047***(0.016) (0.012) (0.006) (0.017) (0.016) (0.013) (0.021) (0.017)
Orig. Mo. -0.002 -0.004*** 0.000 0.000(0.001) (0.001) (0.002) (0.002)
Loan Char. Yes Yes Yes Yes Yes Yes Yes YesDelinq. Mo. FE Yes Yes Yes Yes Yes Yes Yes YesOrig. Mo. FE No No No No No No No NoMSA FE Yes Yes Yes Yes Yes Yes Yes Yes
Orig. Months Jan-Aug Jan-Aug Jan-Aug Jan-Aug Jan-Aug Jan-Aug Jan-Aug Jan-AugNon-Jumbo No No No No No No No No
Obs. 15,903 15,903 7,872 5,788 99,891 99,891 51,984 70,291R-Squared 0.082 0.029 0.040 0.005 0.122 0.115 0.048 0.027
18
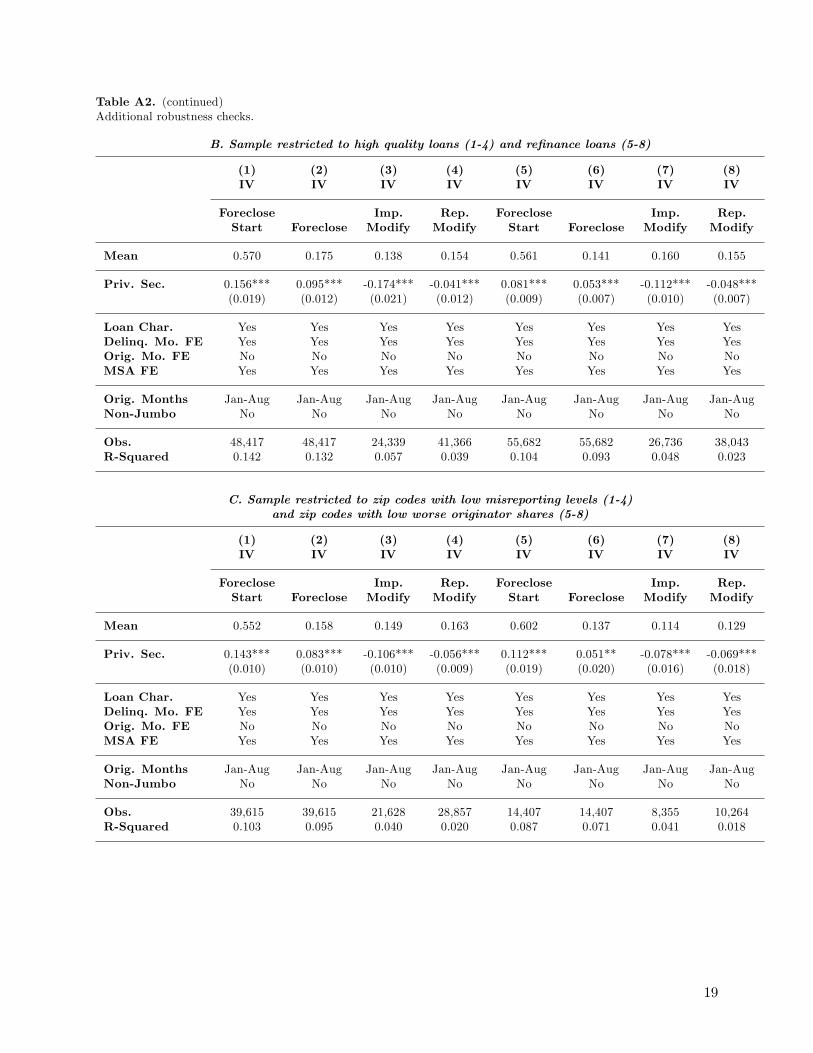
Table A2. (continued)Additional robustness checks.
B. Sample restricted to high quality loans (1-4) and refinance loans (5-8)
(1) (2) (3) (4) (5) (6) (7) (8)IV IV IV IV IV IV IV IV
Foreclose Imp. Rep. Foreclose Imp. Rep.Start Foreclose Modify Modify Start Foreclose Modify Modify
Mean 0.570 0.175 0.138 0.154 0.561 0.141 0.160 0.155
Priv. Sec. 0.156*** 0.095*** -0.174*** -0.041*** 0.081*** 0.053*** -0.112*** -0.048***(0.019) (0.012) (0.021) (0.012) (0.009) (0.007) (0.010) (0.007)
Loan Char. Yes Yes Yes Yes Yes Yes Yes YesDelinq. Mo. FE Yes Yes Yes Yes Yes Yes Yes YesOrig. Mo. FE No No No No No No No NoMSA FE Yes Yes Yes Yes Yes Yes Yes Yes
Orig. Months Jan-Aug Jan-Aug Jan-Aug Jan-Aug Jan-Aug Jan-Aug Jan-Aug Jan-AugNon-Jumbo No No No No No No No No
Obs. 48,417 48,417 24,339 41,366 55,682 55,682 26,736 38,043R-Squared 0.142 0.132 0.057 0.039 0.104 0.093 0.048 0.023
C. Sample restricted to zip codes with low misreporting levels (1-4)and zip codes with low worse originator shares (5-8)
(1) (2) (3) (4) (5) (6) (7) (8)IV IV IV IV IV IV IV IV
Foreclose Imp. Rep. Foreclose Imp. Rep.Start Foreclose Modify Modify Start Foreclose Modify Modify
Mean 0.552 0.158 0.149 0.163 0.602 0.137 0.114 0.129
Priv. Sec. 0.143*** 0.083*** -0.106*** -0.056*** 0.112*** 0.051** -0.078*** -0.069***(0.010) (0.010) (0.010) (0.009) (0.019) (0.020) (0.016) (0.018)
Loan Char. Yes Yes Yes Yes Yes Yes Yes YesDelinq. Mo. FE Yes Yes Yes Yes Yes Yes Yes YesOrig. Mo. FE No No No No No No No NoMSA FE Yes Yes Yes Yes Yes Yes Yes Yes
Orig. Months Jan-Aug Jan-Aug Jan-Aug Jan-Aug Jan-Aug Jan-Aug Jan-Aug Jan-AugNon-Jumbo No No No No No No No No
Obs. 39,615 39,615 21,628 28,857 14,407 14,407 8,355 10,264R-Squared 0.103 0.095 0.040 0.020 0.087 0.071 0.041 0.018
19
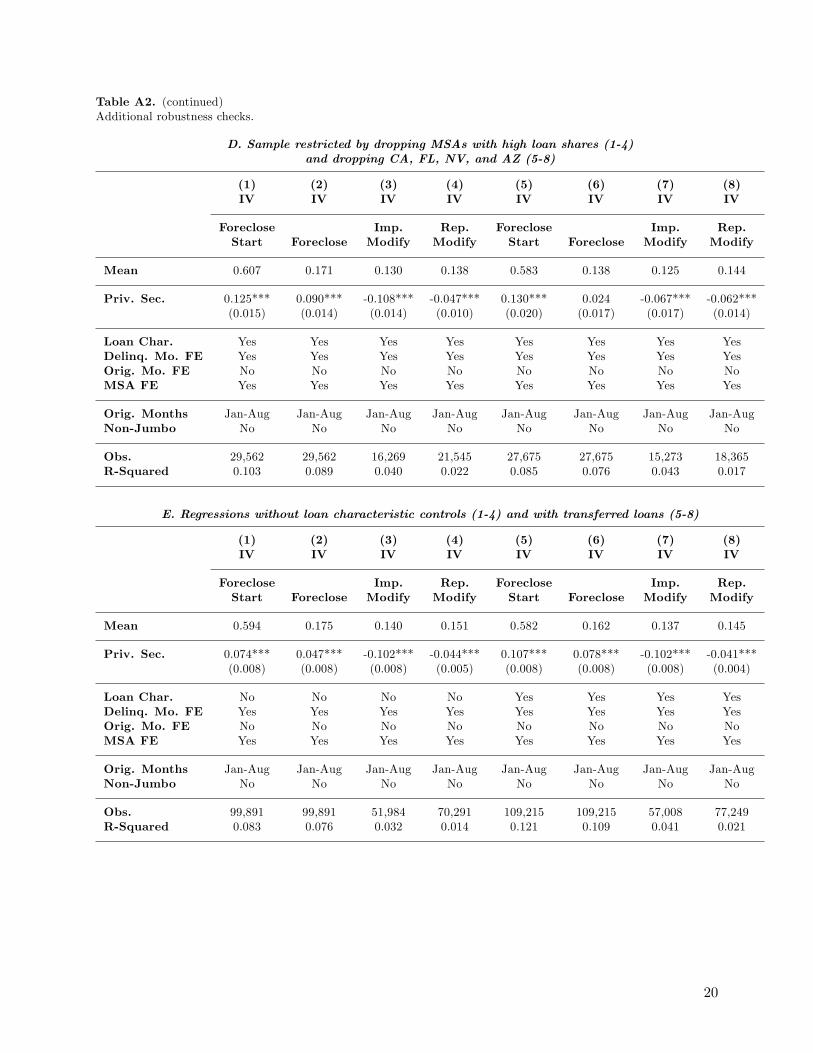
Table A2. (continued)Additional robustness checks.
D. Sample restricted by dropping MSAs with high loan shares (1-4)and dropping CA, FL, NV, and AZ (5-8)
(1) (2) (3) (4) (5) (6) (7) (8)IV IV IV IV IV IV IV IV
Foreclose Imp. Rep. Foreclose Imp. Rep.Start Foreclose Modify Modify Start Foreclose Modify Modify
Mean 0.607 0.171 0.130 0.138 0.583 0.138 0.125 0.144
Priv. Sec. 0.125*** 0.090*** -0.108*** -0.047*** 0.130*** 0.024 -0.067*** -0.062***(0.015) (0.014) (0.014) (0.010) (0.020) (0.017) (0.017) (0.014)
Loan Char. Yes Yes Yes Yes Yes Yes Yes YesDelinq. Mo. FE Yes Yes Yes Yes Yes Yes Yes YesOrig. Mo. FE No No No No No No No NoMSA FE Yes Yes Yes Yes Yes Yes Yes Yes
Orig. Months Jan-Aug Jan-Aug Jan-Aug Jan-Aug Jan-Aug Jan-Aug Jan-Aug Jan-AugNon-Jumbo No No No No No No No No
Obs. 29,562 29,562 16,269 21,545 27,675 27,675 15,273 18,365R-Squared 0.103 0.089 0.040 0.022 0.085 0.076 0.043 0.017
E. Regressions without loan characteristic controls (1-4) and with transferred loans (5-8)
(1) (2) (3) (4) (5) (6) (7) (8)IV IV IV IV IV IV IV IV
Foreclose Imp. Rep. Foreclose Imp. Rep.Start Foreclose Modify Modify Start Foreclose Modify Modify
Mean 0.594 0.175 0.140 0.151 0.582 0.162 0.137 0.145
Priv. Sec. 0.074*** 0.047*** -0.102*** -0.044*** 0.107*** 0.078*** -0.102*** -0.041***(0.008) (0.008) (0.008) (0.005) (0.008) (0.008) (0.008) (0.004)
Loan Char. No No No No Yes Yes Yes YesDelinq. Mo. FE Yes Yes Yes Yes Yes Yes Yes YesOrig. Mo. FE No No No No No No No NoMSA FE Yes Yes Yes Yes Yes Yes Yes Yes
Orig. Months Jan-Aug Jan-Aug Jan-Aug Jan-Aug Jan-Aug Jan-Aug Jan-Aug Jan-AugNon-Jumbo No No No No No No No No
Obs. 99,891 99,891 51,984 70,291 109,215 109,215 57,008 77,249R-Squared 0.083 0.076 0.032 0.014 0.121 0.109 0.041 0.021
20
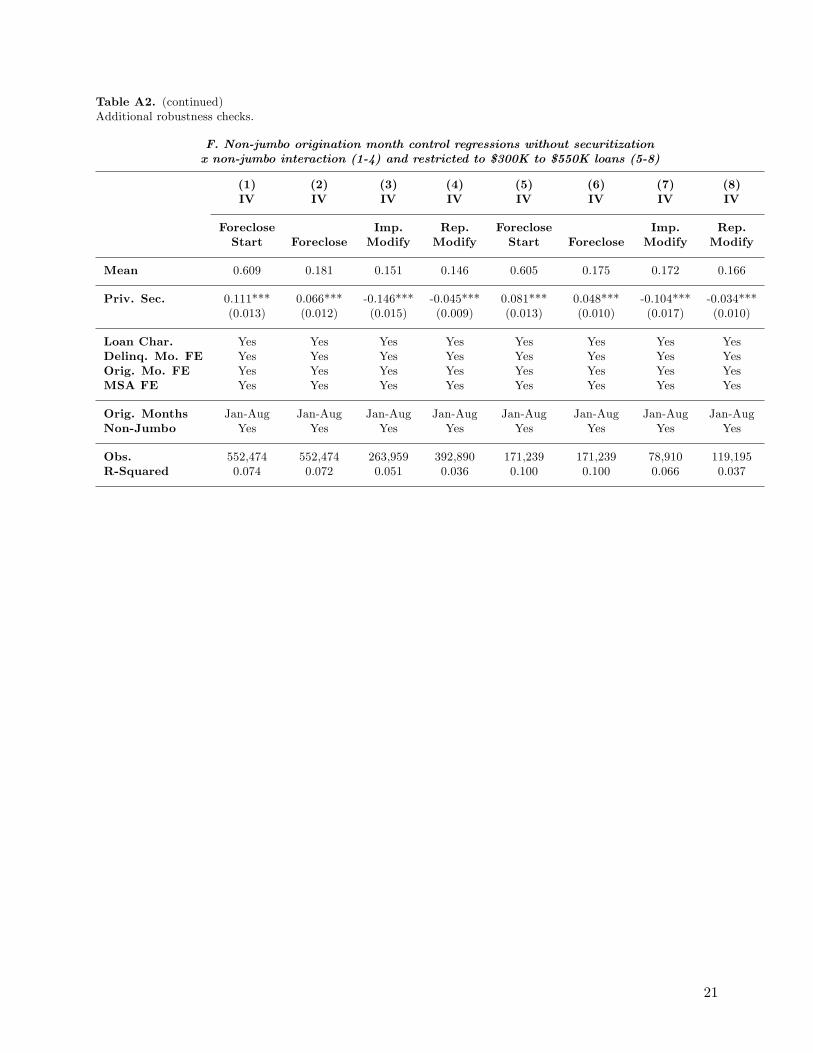
Table A2. (continued)Additional robustness checks.
F. Non-jumbo origination month control regressions without securitizationx non-jumbo interaction (1-4) and restricted to $300K to $550K loans (5-8)
(1) (2) (3) (4) (5) (6) (7) (8)IV IV IV IV IV IV IV IV
Foreclose Imp. Rep. Foreclose Imp. Rep.Start Foreclose Modify Modify Start Foreclose Modify Modify
Mean 0.609 0.181 0.151 0.146 0.605 0.175 0.172 0.166
Priv. Sec. 0.111*** 0.066*** -0.146*** -0.045*** 0.081*** 0.048*** -0.104*** -0.034***(0.013) (0.012) (0.015) (0.009) (0.013) (0.010) (0.017) (0.010)
Loan Char. Yes Yes Yes Yes Yes Yes Yes YesDelinq. Mo. FE Yes Yes Yes Yes Yes Yes Yes YesOrig. Mo. FE Yes Yes Yes Yes Yes Yes Yes YesMSA FE Yes Yes Yes Yes Yes Yes Yes Yes
Orig. Months Jan-Aug Jan-Aug Jan-Aug Jan-Aug Jan-Aug Jan-Aug Jan-Aug Jan-AugNon-Jumbo Yes Yes Yes Yes Yes Yes Yes Yes
Obs. 552,474 552,474 263,959 392,890 171,239 171,239 78,910 119,195R-Squared 0.074 0.072 0.051 0.036 0.100 0.100 0.066 0.037
21
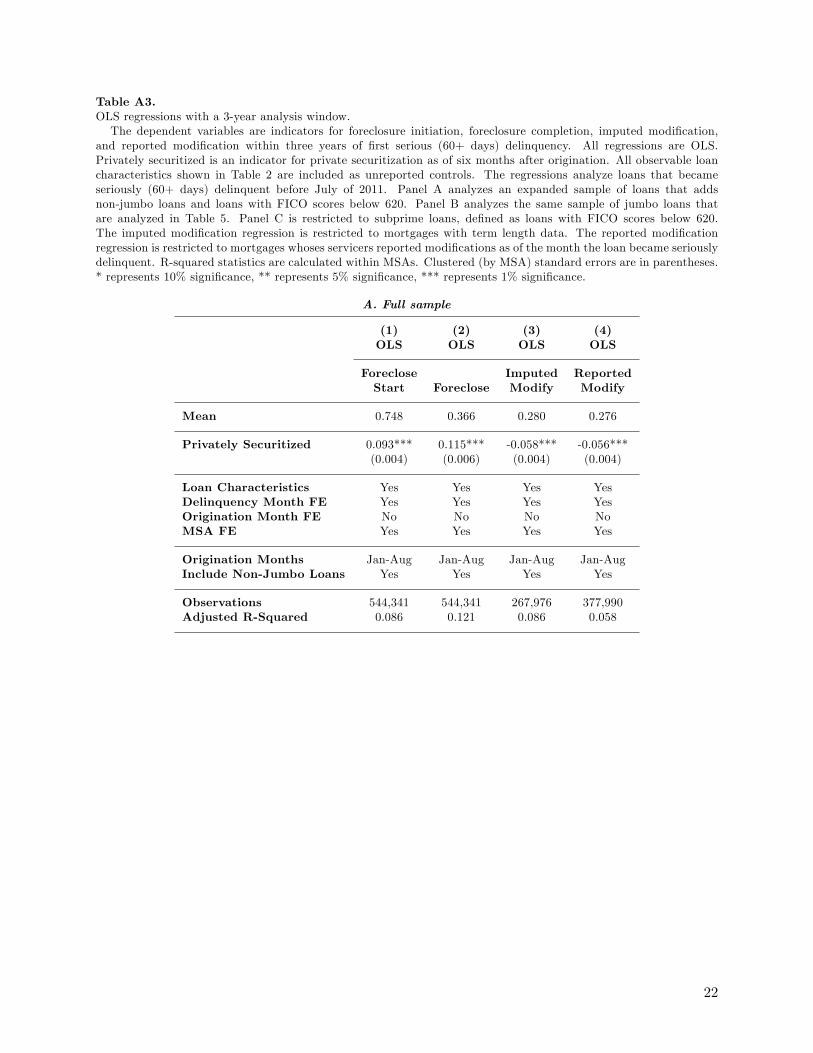
Table A3.OLS regressions with a 3-year analysis window.The dependent variables are indicators for foreclosure initiation, foreclosure completion, imputed modification,
and reported modification within three years of first serious (60+ days) delinquency. All regressions are OLS.Privately securitized is an indicator for private securitization as of six months after origination. All observable loancharacteristics shown in Table 2 are included as unreported controls. The regressions analyze loans that becameseriously (60+ days) delinquent before July of 2011. Panel A analyzes an expanded sample of loans that addsnon-jumbo loans and loans with FICO scores below 620. Panel B analyzes the same sample of jumbo loans thatare analyzed in Table 5. Panel C is restricted to subprime loans, defined as loans with FICO scores below 620.The imputed modification regression is restricted to mortgages with term length data. The reported modificationregression is restricted to mortgages whoses servicers reported modifications as of the month the loan became seriouslydelinquent. R-squared statistics are calculated within MSAs. Clustered (by MSA) standard errors are in parentheses.* represents 10% significance, ** represents 5% significance, *** represents 1% significance.
A. Full sample
(1) (2) (3) (4)OLS OLS OLS OLS
Foreclose Imputed ReportedStart Foreclose Modify Modify
Mean 0.748 0.366 0.280 0.276
Privately Securitized 0.093*** 0.115*** -0.058*** -0.056***(0.004) (0.006) (0.004) (0.004)
Loan Characteristics Yes Yes Yes YesDelinquency Month FE Yes Yes Yes YesOrigination Month FE No No No NoMSA FE Yes Yes Yes Yes
Origination Months Jan-Aug Jan-Aug Jan-Aug Jan-AugInclude Non-Jumbo Loans Yes Yes Yes Yes
Observations 544,341 544,341 267,976 377,990Adjusted R-Squared 0.086 0.121 0.086 0.058
22
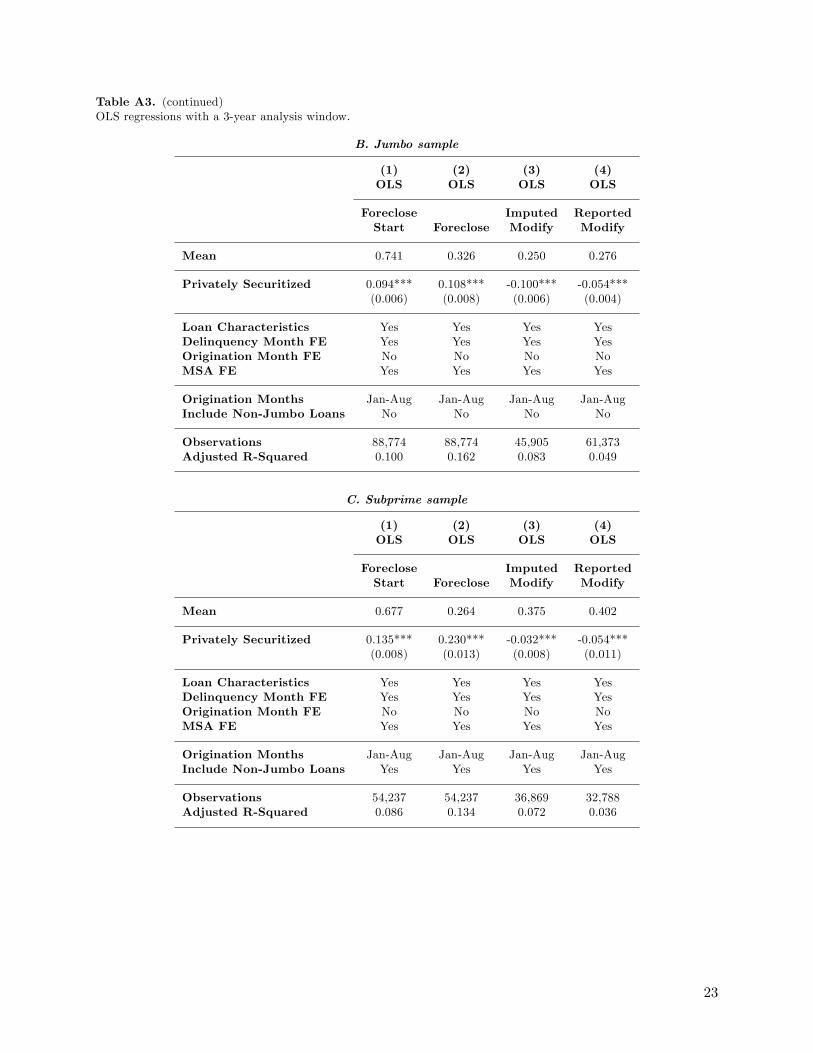
Table A3. (continued)OLS regressions with a 3-year analysis window.
B. Jumbo sample
(1) (2) (3) (4)OLS OLS OLS OLS
Foreclose Imputed ReportedStart Foreclose Modify Modify
Mean 0.741 0.326 0.250 0.276
Privately Securitized 0.094*** 0.108*** -0.100*** -0.054***(0.006) (0.008) (0.006) (0.004)
Loan Characteristics Yes Yes Yes YesDelinquency Month FE Yes Yes Yes YesOrigination Month FE No No No NoMSA FE Yes Yes Yes Yes
Origination Months Jan-Aug Jan-Aug Jan-Aug Jan-AugInclude Non-Jumbo Loans No No No No
Observations 88,774 88,774 45,905 61,373Adjusted R-Squared 0.100 0.162 0.083 0.049
C. Subprime sample
(1) (2) (3) (4)OLS OLS OLS OLS
Foreclose Imputed ReportedStart Foreclose Modify Modify
Mean 0.677 0.264 0.375 0.402
Privately Securitized 0.135*** 0.230*** -0.032*** -0.054***(0.008) (0.013) (0.008) (0.011)
Loan Characteristics Yes Yes Yes YesDelinquency Month FE Yes Yes Yes YesOrigination Month FE No No No NoMSA FE Yes Yes Yes Yes
Origination Months Jan-Aug Jan-Aug Jan-Aug Jan-AugInclude Non-Jumbo Loans Yes Yes Yes Yes
Observations 54,237 54,237 36,869 32,788Adjusted R-Squared 0.086 0.134 0.072 0.036
23
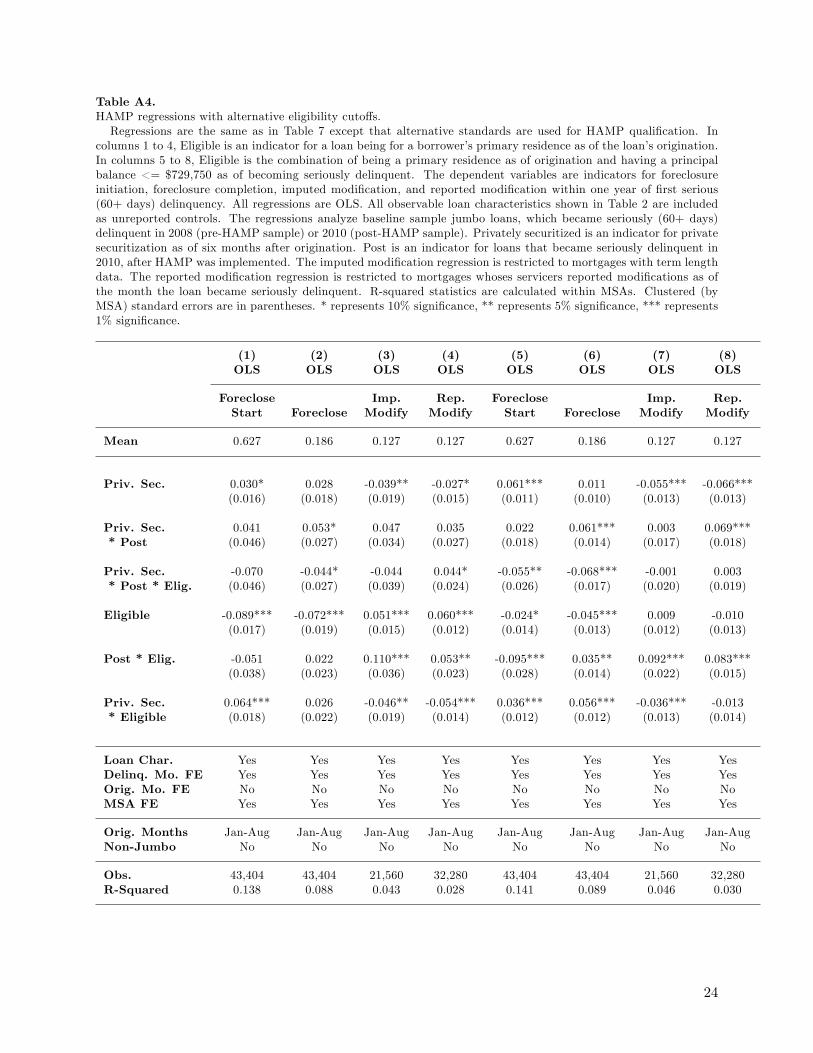
Table A4.HAMP regressions with alternative eligibility cutoffs.Regressions are the same as in Table 7 except that alternative standards are used for HAMP qualification. In
columns 1 to 4, Eligible is an indicator for a loan being for a borrower’s primary residence as of the loan’s origination.In columns 5 to 8, Eligible is the combination of being a primary residence as of origination and having a principalbalance <= $729,750 as of becoming seriously delinquent. The dependent variables are indicators for foreclosureinitiation, foreclosure completion, imputed modification, and reported modification within one year of first serious(60+ days) delinquency. All regressions are OLS. All observable loan characteristics shown in Table 2 are includedas unreported controls. The regressions analyze baseline sample jumbo loans, which became seriously (60+ days)delinquent in 2008 (pre-HAMP sample) or 2010 (post-HAMP sample). Privately securitized is an indicator for privatesecuritization as of six months after origination. Post is an indicator for loans that became seriously delinquent in2010, after HAMP was implemented. The imputed modification regression is restricted to mortgages with term lengthdata. The reported modification regression is restricted to mortgages whoses servicers reported modifications as ofthe month the loan became seriously delinquent. R-squared statistics are calculated within MSAs. Clustered (byMSA) standard errors are in parentheses. * represents 10% significance, ** represents 5% significance, *** represents1% significance.
(1) (2) (3) (4) (5) (6) (7) (8)OLS OLS OLS OLS OLS OLS OLS OLS
Foreclose Imp. Rep. Foreclose Imp. Rep.Start Foreclose Modify Modify Start Foreclose Modify Modify
Mean 0.627 0.186 0.127 0.127 0.627 0.186 0.127 0.127
Priv. Sec. 0.030* 0.028 -0.039** -0.027* 0.061*** 0.011 -0.055*** -0.066***(0.016) (0.018) (0.019) (0.015) (0.011) (0.010) (0.013) (0.013)
Priv. Sec. 0.041 0.053* 0.047 0.035 0.022 0.061*** 0.003 0.069**** Post (0.046) (0.027) (0.034) (0.027) (0.018) (0.014) (0.017) (0.018)
Priv. Sec. -0.070 -0.044* -0.044 0.044* -0.055** -0.068*** -0.001 0.003* Post * Elig. (0.046) (0.027) (0.039) (0.024) (0.026) (0.017) (0.020) (0.019)
Eligible -0.089*** -0.072*** 0.051*** 0.060*** -0.024* -0.045*** 0.009 -0.010(0.017) (0.019) (0.015) (0.012) (0.014) (0.013) (0.012) (0.013)
Post * Elig. -0.051 0.022 0.110*** 0.053** -0.095*** 0.035** 0.092*** 0.083***(0.038) (0.023) (0.036) (0.023) (0.028) (0.014) (0.022) (0.015)
Priv. Sec. 0.064*** 0.026 -0.046** -0.054*** 0.036*** 0.056*** -0.036*** -0.013* Eligible (0.018) (0.022) (0.019) (0.014) (0.012) (0.012) (0.013) (0.014)
Loan Char. Yes Yes Yes Yes Yes Yes Yes YesDelinq. Mo. FE Yes Yes Yes Yes Yes Yes Yes YesOrig. Mo. FE No No No No No No No NoMSA FE Yes Yes Yes Yes Yes Yes Yes Yes
Orig. Months Jan-Aug Jan-Aug Jan-Aug Jan-Aug Jan-Aug Jan-Aug Jan-Aug Jan-AugNon-Jumbo No No No No No No No No
Obs. 43,404 43,404 21,560 32,280 43,404 43,404 21,560 32,280R-Squared 0.138 0.088 0.043 0.028 0.141 0.089 0.046 0.030
24
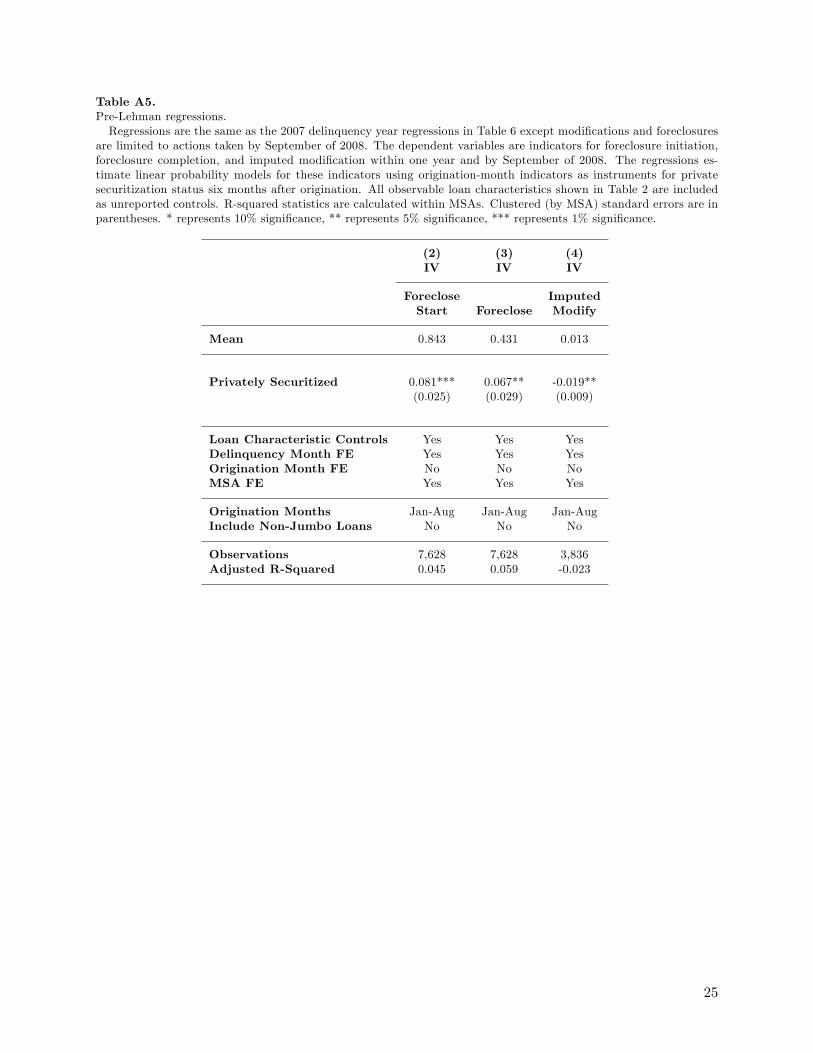
Table A5.Pre-Lehman regressions.Regressions are the same as the 2007 delinquency year regressions in Table 6 except modifications and foreclosures
are limited to actions taken by September of 2008. The dependent variables are indicators for foreclosure initiation,foreclosure completion, and imputed modification within one year and by September of 2008. The regressions es-timate linear probability models for these indicators using origination-month indicators as instruments for privatesecuritization status six months after origination. All observable loan characteristics shown in Table 2 are includedas unreported controls. R-squared statistics are calculated within MSAs. Clustered (by MSA) standard errors are inparentheses. * represents 10% significance, ** represents 5% significance, *** represents 1% significance.
(2) (3) (4)IV IV IV
Foreclose ImputedStart Foreclose Modify
Mean 0.843 0.431 0.013
Privately Securitized 0.081*** 0.067** -0.019**(0.025) (0.029) (0.009)
Loan Characteristic Controls Yes Yes YesDelinquency Month FE Yes Yes YesOrigination Month FE No No NoMSA FE Yes Yes Yes
Origination Months Jan-Aug Jan-Aug Jan-AugInclude Non-Jumbo Loans No No No
Observations 7,628 7,628 3,836Adjusted R-Squared 0.045 0.059 -0.023
25


![CHAPTER 15 Foreclosure and Other Remedies · § 15.08 Transfer Taxes on Foreclosure and Substitute Transactions [1] Foreclosure and Alternatives [2] State Tax [a] Foreclosure Purchase](https://img.pdfslide.net/doc/110x75/5b5e7bb77f8b9aa3048d2307/chapter-15-foreclosure-and-other-1508-transfer-taxes-on-foreclosure-and.jpg)