Embed Size (px)
Citation preview
Monthly Canadian ABS Report
SEPTEMBER 2010
Securitization Servicer Report
Senior Vice PresidentStructured FinanceTel. +1 416 597 [email protected]
CONTACT INFORMATION
Scott Bridges
Vice President SurveillanceStructured FinanceTel. +1 416 597 [email protected]
Clara Vargas
Conventions used in this reportAll currency values are in Canadian Dollars unless otherwise specified.Percentage values may not add exactly to 100% due to rounding.Exchange rate: $1.00 US = $1.029 Canadian
Olga MironenkoFinancial AnalystStructured FinanceTel. +1 416 597 [email protected]
DBRS is a full-service credit rating agencyestablished in 1976. Privately owned and operatedwithout affiliation to any financial institution,DBRS is respected for its independent, third-partyevaluations of corporate and government issues,spanning North America, Europe and Asia.DBRSs extensive coverage of securitizations andstructured finance transactions solidifies ourstanding as a leading provider of comprehensive,in-depth credit analysis.
All DBRS ratings and research are available inhard-copy format and electronically on Bloombergand at DBRS.com, our lead delivery tool fororganized, Web-based, up-to-the-minuteinformation. We remain committed tocontinuously refining our expertise in the analysisof credit quality and are dedicated to maintainingobjective and credible opinions within the globalfinancial marketplace.
Monthly Canadian ABS Report
September 2010
Table of ContentsSummary 5
Market Summary 5Asset Composition and Market Share 9
Auto Loans 11Canadian Capital Auto Receivables Asset Trust II, 2006-1 11Canadian Capital Auto Receivables Asset Trust II, 2006-2 12Canadian Capital Auto Receivables Asset Trust II, 2007-1 13Canadian Capital Auto Receivables Asset Trust II, 2010-1 14Canadian Capital Auto Receivables Asset Trust III, 2010-1 15Ford Auto Securitization Trust 2009-R1 16Ford Auto Securitization Trust 2010-R1 17Ford Auto Securitization Trust 2010-R3 18
Auto Leases 19NIF-T, 2010-1 19
Fleet Leasing 20Fleet Leasing Receivables Trust, Series 2010-1 20
Floorplan Financing 21Canadian SWIFT Master Auto Receivables Trust, Series 2010-1 21CNH Capital Canada Wholesale Trust, 2009-1 22Ford Floorplan Auto Securitization Trust, 2006 23Ford Floorplan Auto Securitization Trust, 2010-F1 24Ford Floorplan Auto Securitization Trust, 2010-F2 25
Credit Cards 26Algonquin Credit Card Trust 26Broadway Credit Card Trust 28Canadian Credit Card Trust 30CARDS II Trust 32Eagle Credit Card Trust 34Glacier Credit Card Trust 36Gloucester Credit Card Trust 38Golden Credit Card Trust 40Master Credit Card Trust 42SCORE Trust 44
Lines of Credit 46Genesis Trust 46
Residential Mortgages 47Canada Mortgage Acceptance Corporation, 2006-C4 47Canada Mortgage Acceptance Corporation, 2006-C5 48Xceed Mortgage Trust, Series 2006-T1 49Xceed Mortgage Trust, Series 2007-T2 50
Other 51CHIP Mortgage Trust 51ASG Trust 52CBC Monetization Trust Notes 53
Covered Bonds 54Bank of Montreal Global Public Sector Covered Bond Programme 54Canadian Imperial Bank of Commerce Global Public Sector Covered Bond Programme 55
Royal Bank of Canada Global Covered Bond Programme 56Toronto-Dominion Bank Global Public Sector Covered Bond Programme 57
Appendix A: Asset Class Information 58
3

Monthly Canadian ABS Report
September 2010
Table of Contents (continued)Glossary 59
4
Market Summary
Monthly Canadian ABS Report
September 2010
Summary
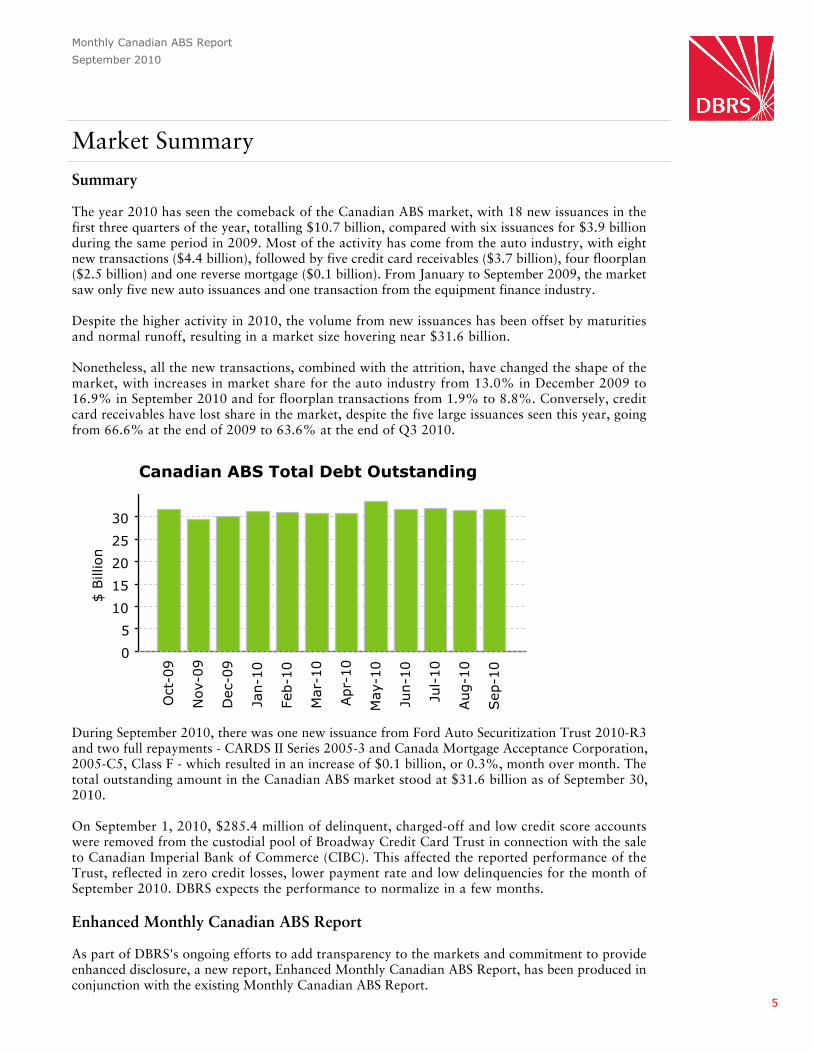
The year 2010 has seen the comeback of the Canadian ABS market, with 18 new issuances in thefirst three quarters of the year, totalling $10.7 billion, compared with six issuances for $3.9 billionduring the same period in 2009. Most of the activity has come from the auto industry, with eightnew transactions ($4.4 billion), followed by five credit card receivables ($3.7 billion), four floorplan($2.5 billion) and one reverse mortgage ($0.1 billion). From January to September 2009, the marketsaw only five new auto issuances and one transaction from the equipment finance industry.
Despite the higher activity in 2010, the volume from new issuances has been offset by maturitiesand normal runoff, resulting in a market size hovering near $31.6 billion.
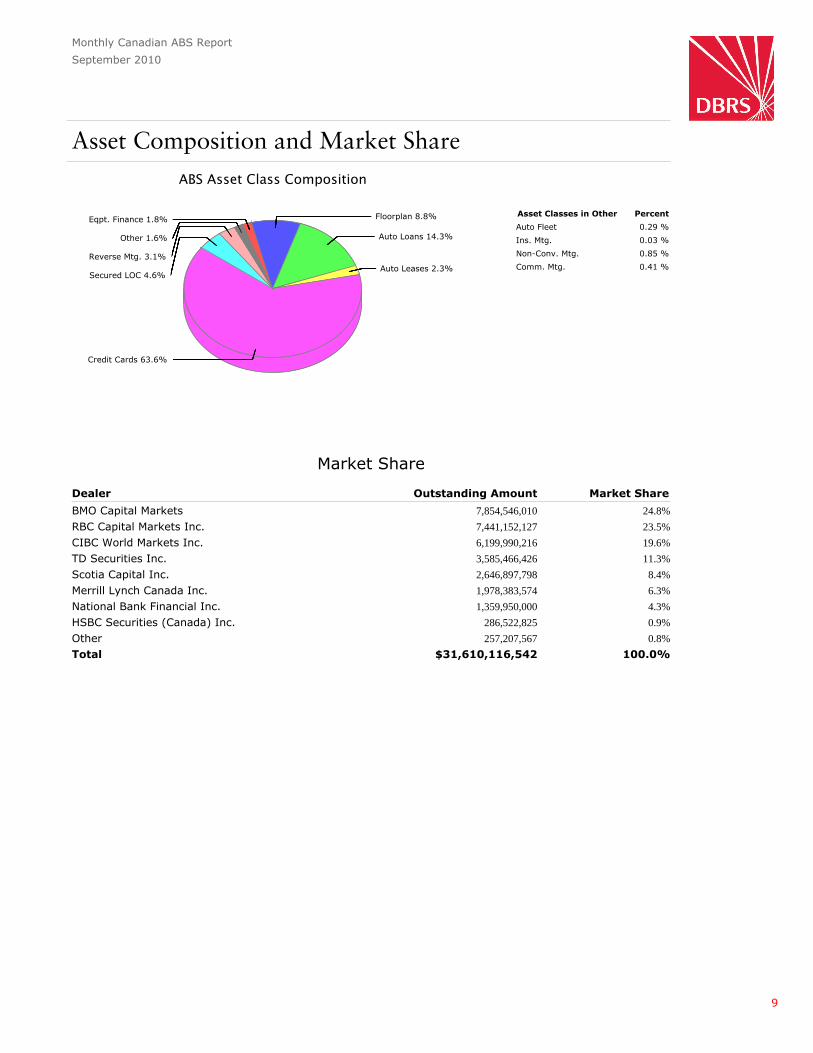
Nonetheless, all the new transactions, combined with the attrition, have changed the shape of themarket, with increases in market share for the auto industry from 13.0% in December 2009 to16.9% in September 2010 and for floorplan transactions from 1.9% to 8.8%. Conversely, creditcard receivables have lost share in the market, despite the five large issuances seen this year, goingfrom 66.6% at the end of 2009 to 63.6% at the end of Q3 2010.
During September 2010, there was one new issuance from Ford Auto Securitization Trust 2010-R3and two full repayments - CARDS II Series 2005-3 and Canada Mortgage Acceptance Corporation,2005-C5, Class F - which resulted in an increase of $0.1 billion, or 0.3%, month over month. Thetotal outstanding amount in the Canadian ABS market stood at $31.6 billion as of September 30,2010.
On September 1, 2010, $285.4 million of delinquent, charged-off and low credit score accountswere removed from the custodial pool of Broadway Credit Card Trust in connection with the saleto Canadian Imperial Bank of Commerce (CIBC). This affected the reported performance of theTrust, reflected in zero credit losses, lower payment rate and low delinquencies for the month ofSeptember 2010. DBRS expects the performance to normalize in a few months.
Enhanced Monthly Canadian ABS Report
As part of DBRS's ongoing efforts to add transparency to the markets and commitment to provideenhanced disclosure, a new report, Enhanced Monthly Canadian ABS Report, has been produced inconjunction with the existing Monthly Canadian ABS Report.
5
Market Summary (continued)
Monthly Canadian ABS Report
September 2010
The Monthly Canadian ABS Report now has links that allow the user to go from the table ofcontents or from the individual transaction page to the corresponding Enhanced Monthly CanadianABS Report for that particular issuance.
The Enhanced Monthly Canadian ABS Report offers additional metrics, longer data series,definitions and charts that provide the user with both a numeric and a graphic presentation toallow a quick review of the overall performance and trends for each transaction as well asbenchmarking of transactions within an asset class.
For a limited period of time, the following select issuances will be available to the general public.Full access to the Enhanced Monthly Canadian ABS Report requires a subscription.
- Canada Mortgage Acceptance Corporation, 2006-C4- Canadian Capital Auto Receivables Asset Trust II, 2006-2- Fleet Leasing Receivables Trust, Series 2010-1- Ford Floorplan Auto Securitization Trust, 2006- Genesis Trust- Golden Credit Card Trust- NIF-T, 2010-1
Rating Actions
On September 1, 2010, DBRS noted that Fleet Leasing Receivables Trust issued Asset-BackedNotes, Series 2010-2, Class A and Class B on August 31, 2010. At this time, DBRS notes that thisissuance has no impact on the ratings of the classes of Asset-Backed Notes, Series 2010-1 issued bythe Trust on January 27, 2010.
On September 1, 2010, DBRS confirmed the ratings of Broadway Credit Card Trust with theclosing of the sale of $2.1 billion in MasterCard receivables from Citi Cards Canada Inc., the initialseller and servicer of the Trust, to Canadian Imperial Bank of Commerce, as discussed in the DBRSpress release dated June 15, 2010. The ratings for the outstanding notes issued by the Trust havebeen confirmed as follows:
- AAA (sf) for the Credit Card Receivables-Backed Class A Notes, Series 2004-2- "A" (sf) for the Credit Card Receivables-Backed Class B Notes, Series 2004-2- BBB (sf) for the Credit Card Receivables-Backed Class C Notes, Series 2004-2- AAA (sf) for the Credit Card Receivables-Backed Class A Notes, Series 2008-1- "A" (sf) for the Credit Card Receivables-Backed Class B Notes, Series 2008-1- BBB (sf) for the Credit Card Receivables-Backed Class C Notes, Series 2008-1- AAA (sf) for the Credit Card Receivables-Backed Class A Notes, Series 2008-2- "A" (sf) for the Credit Card Receivables-Backed Class B Notes, Series 2008-2- BBB (sf) for the Credit Card Receivables-Backed Class C Notes, Series 2008-2
On September 1, 2010, DBRS discontinued the ratings of the Variable Rate Credit CardReceivables-Backed Class A Notes, Series 2008-3, the Credit Card Receivables-Backed Class BNotes, Series 2008-3 and the Credit Card Receivables-Backed Class C Notes, Series 2008-3 issuedby Broadway Credit Card Trust as the Notes were fully repaid as of August 31, 2010.
On September 9, 2010, DBRS discontinued the rating of the Covered Bonds, Series CB1 issuedunder the Canadian Imperial Bank of Commerce (Global Public Sector Covered Bond Programme)as the Series was fully repaid on September 3, 2010.
6
Market Summary (continued)
Monthly Canadian ABS Report
September 2010
On September 15, 2010, DBRS assigned the following provisional ratings to Ford AutoSecuritization Trust 2010-R3 and finalized the ratings on September 28, 2010:
- AAA (sf) to the Asset-Backed Notes, Series 2010-R3, Class A-1 (the Class A-1 Notes)- AAA (sf) to the Asset-Backed Notes, Series 2010-R3, Class A-2 (the Class A-2 Notes)- AAA (sf) to the Asset-Backed Notes, Series 2010-R3, Class A-3 (the Class A-3 Notes)- AA (high) (sf) to the Asset -Backed Notes, Series 2010-R3, Class B (the Class B Notes)- A (high) (sf) to the Asset -Backed Notes, Series 2010-R3, Class C (the Class C Notes)- BBB (high) (sf) to the Asset -Backed Notes, Series 2010-R3, Class D (the Class D Notes)
On September 16, 2010, DBRS confirmed the rating of the Series 2008-1, Class A-2 Notes of CITCanada Equipment Receivables Trust, Series 2008-1 at AAA (sf).
On September 16, 2010, DBRS confirmed the rating of the Series 2009-1, Class A-2 Notes of CITCanada Equipment Receivables Trust II, Series 2009-1 at AAA (sf).
On September 17, 2010, DBRS confirmed the rating of the VPR Loans, Series 2006-1 issued byCanadian Capital Auto Receivables Asset Trust II at AAA (sf), with a Stable trend.
On September 17, 2010, DBRS confirmed the rating of the VPR Loans, Series 2006-2 (the VPRLoans) issued by Canadian Capital Auto Receivables Asset Trust II at AAA (sf), with a Stable trend.
On September 17, 2010, DBRS confirmed the rating of the VPR Loans, Series 2007-1 (the VPRLoans) issued by Canadian Capital Auto Receivables Asset Trust II, Series 2007-1 at AAA (sf), witha Stable trend.
On September 17, 2010, DBRS confirmed the following ratings of Ford Auto Securitization Trust2009-R1:
- AAA (sf) to the Asset-Backed Notes, Series 2009-R1, Class A-1- AAA (sf) to the Asset-Backed Notes, Series 2009-R1, Class A-2- AAA (sf) to the Asset-Backed Notes, Series 2009-R1, Class A-3
On September 17, 2010, DBRS confirmed the rating of the Asset-Backed Notes, Series 2009-R2issued by Ford Auto Securitization Trust 2009-R2 at AAA (sf).
On September 17, 2010, DBRS confirmed the following ratings of the Ford Auto SecuritizationTrust 2009-R3:
- AAA (sf) for the Asset-Backed Notes, Series 2009-R3, Class A-1- AAA (sf) for the Asset-Backed Notes, Series 2009-R3, Class A-2- AAA (sf) for the Asset-Backed Notes, Series 2009-R3, Class A-3
On September 21, 2010, DBRS discontinued the rating of the Covered Bonds, Series CB2 issuedunder the Canadian Imperial Bank of Commerce (Global Public Sector Covered Bond Programme)as the Series was fully repaid on September 16, 2010.
On September 24, 2010, DBRS discontinued the ratings of the Credit Card Receivables BackedFloating Rate Notes, Series 2005-3 issued by CARDS II Trust as the Notes were fully repaid onSeptember 23, 2010.
For more details regarding these rating actions, please refer to the press release on www.dbrs.com.7
Market Summary (continued)
Monthly Canadian ABS Report
September 2010
Subsequent Events
On October 5, 2010, DBRS noted that CNH Capital Canada Wholesale Trust entered into anagreement on September 24, 2010, whereby it issued asset-backed notes Series CW2010-1.
On October 15, 2010, DRBS discontinued the ratings of the Credit Card Receivables-BackedNotes, Series 2005-4 (the Notes) issued by CARDS II Trust as the Notes were fully repaid onOctober 15, 2010.
On October 19, 2010, DBRS discontinued the ratings of the Series 2005-1, Class A Notes, Class BNotes and Class C Notes issued by Algonquin Credit Card Trust as the Notes were fully repaid onOctober 15, 2010.
On October 19, 2010, DBRS assigned a rating of AAA to the Series CB8 covered bonds issuedunder the Canadian Imperial Bank of Commerce Global Public Sector Covered Bond Programme.The Series CB8 (AUD 750 million) covered bonds have a coupon rate of 5.75% and a maturity dateof December 19, 2013. All covered bonds issued under the Programme rank pari passu with eachother.
On October 21, 2010, DBRS assigned a provisional rating of AAA to the Covered Bonds, Series 2to be issued under the Bank of Nova Scotia (BNS) US$15 billion Global Public Sector CoveredBond Programme. The rating was finalized on October 29, 2010. As all covered bonds issued underthe Programme rank pari passu with each other, DBRS assigned a rating of AAA to the CoveredBonds, Series 1 issued on July 26, 2010, under the Programme. The Series 1 (US$2.5 billion)covered bonds have a coupon of 1.45% and a maturity date of July 26, 2013.
On October 22, 2010, DBRS discontinued the rating of the Class A-1 Senior Medium-Term Notes,Series 2009-1, issued by BMW Canada Auto Trust as the Notes were fully repaid as of September20, 2010.
On October 22, 2010, DBRS discontinued the rating of the Class A-1 Senior Medium-Term Notes,Series 2009-1 issued by NIF-T as the Notes were fully repaid as of March 23, 2010.
For more details regarding these rating actions, please refer to the press release on www.dbrs.com.
8
Asset Composition and Market Share
Monthly Canadian ABS Report
September 2010
Market ShareOutstanding AmountDealer
BMO Capital Markets 7,854,546,010 24.8%
RBC Capital Markets Inc. 7,441,152,127 23.5%
CIBC World Markets Inc. 6,199,990,216 19.6%
TD Securities Inc. 3,585,466,426 11.3%
Scotia Capital Inc. 2,646,897,798 8.4%
Merrill Lynch Canada Inc. 1,978,383,574 6.3%
National Bank Financial Inc. 1,359,950,000 4.3%
HSBC Securities (Canada) Inc. 286,522,825 0.9%
Other 257,207,567 0.8%
$31,610,116,542 100.0%Total
Asset Classes in Other Percent
Auto Fleet 0.29 %
Ins. Mtg. 0.03 %
Non-Conv. Mtg. 0.85 %
Comm. Mtg. 0.41 %
Market Share
9
Monthly Canadian ABS Report
September 2010
10 This page intentionally left blank.

Auto Loans
September 2010
Canadian Capital Auto Receivables Asset Trust II, 2006-1Originator: Ally Credit Canada Limited
Collateral: Portfolio of new subvented retail light truck and car loans from Ally
Credit Enhancement: Cash Reserve, Excess Spread, Overcollateralization, Subordination
Program Size: $1.1 billion
Lead Underwriter:
Debt NameOriginalBalance
CurrentBalance Coupon
ExpectedMaturity
LegalMaturity
CurrentRating
Class A-1 190,000,000 0 4.171% Jan 17, 2007 Jul 17, 2012 DiscontinuedClass A-2 235,000,000 0 4.277% Jan 17, 2008 Jul 17, 2012 DiscontinuedClass A-3 255,000,000 0 4.393% Jan 17, 2009 Jul 17, 2012 DiscontinuedClass B 27,000,000 0 4.863% Jan 17, 2009 Jul 17, 2012 DiscontinuedVPR Loans 367,500,000 859,932 Floating Not Applicable Jul 17, 2012 AAA (sf)VPR Loans Class B 27,000,000 27,000,000 Floating Not Applicable Jul 12, 2012 Not Rated
Month Pool Balance Total Collections Net Loss RateDelinquency
Rate Reserve Ratio O/C RatioSep-2010 36,437,285 6,430,316 0.16% 0.23% 26.10% 30.79%Aug-2010 42,604,542 8,962,078 0.09% 0.29% 21.41% 25.21%Jul-2010 51,247,700 10,445,003 0.40% 0.17% 17.07% 20.10%Jun-2010 61,335,964 11,211,477 -0.40% 0.16% 13.81% 16.26%May-2010 72,079,866 11,995,371 0.26% 0.17% 11.47% 13.51%Apr-2010 83,569,982 12,743,376 0.40% 0.16% 9.71% 11.44%Mar-2010 95,743,917 15,535,804 0.15% 0.11% 8.36% 9.84%Feb-2010 110,491,801 12,191,136 0.31% 0.20% 7.15% 8.42%Jan-2010 122,042,250 12,839,404 -0.28% 0.20% 6.42% 7.56%Dec-2009 134,090,232 14,448,198 0.66% 0.19% 5.80% 6.83%Nov-2009 147,698,592 15,444,935 0.34% 0.13% 5.24% 6.17%Oct-2009 162,175,094 16,337,283 0.18% 0.20% 4.74% 5.58%
Month VPR LoansVPR Loans
Class BSep-2010 859,932 27,000,000Aug-2010 7,027,189 27,000,000Jul-2010 15,670,348 27,000,000Jun-2010 25,758,612 27,000,000May-2010 36,502,513 27,000,000Apr-2010 47,992,630 27,000,000Mar-2010 60,166,564 27,000,000Feb-2010 74,914,448 27,000,000Jan-2010 86,464,898 27,000,000Dec-2009 98,512,879 27,000,000Nov-2009 112,121,239 27,000,000Oct-2009 126,597,741 27,000,000
TD Securities Inc.Scotia Capital Inc.
11
Auto Loans
September 2010
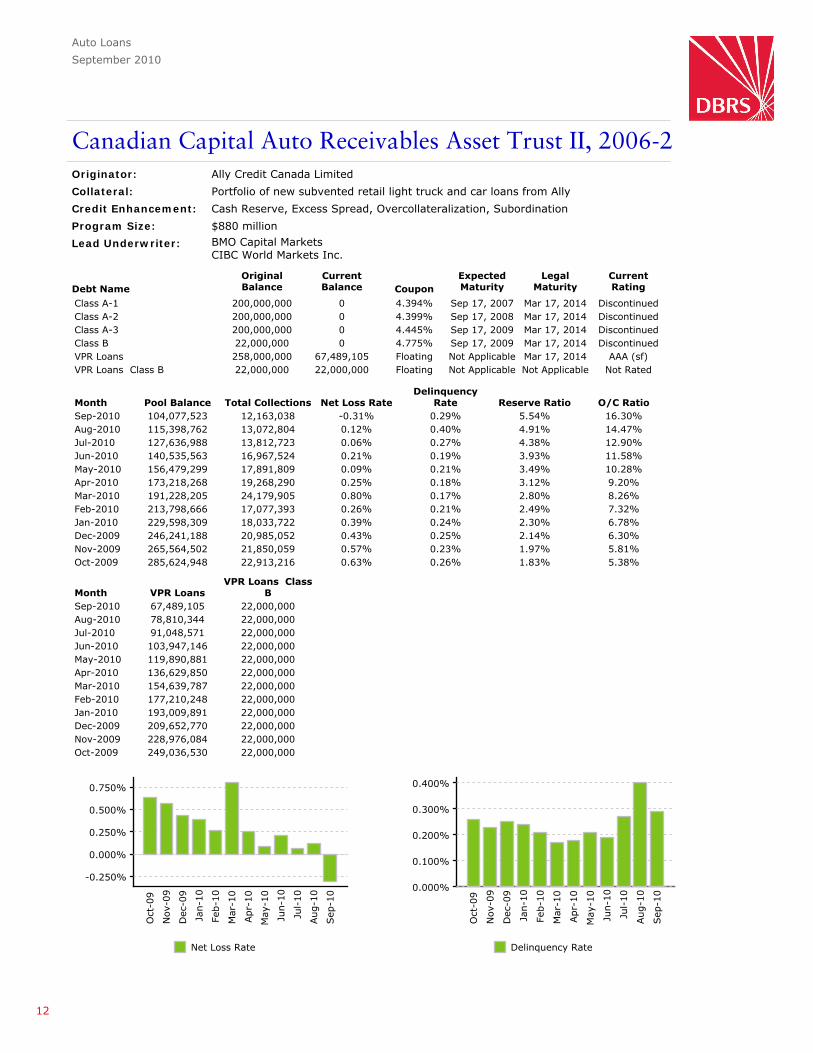
Canadian Capital Auto Receivables Asset Trust II, 2006-2Originator: Ally Credit Canada Limited
Collateral: Portfolio of new subvented retail light truck and car loans from Ally
Credit Enhancement: Cash Reserve, Excess Spread, Overcollateralization, Subordination
Program Size: $880 million
Lead Underwriter:
Debt NameOriginalBalance
CurrentBalance Coupon
ExpectedMaturity
LegalMaturity
CurrentRating
Class A-1 200,000,000 0 4.394% Sep 17, 2007 Mar 17, 2014 DiscontinuedClass A-2 200,000,000 0 4.399% Sep 17, 2008 Mar 17, 2014 DiscontinuedClass A-3 200,000,000 0 4.445% Sep 17, 2009 Mar 17, 2014 DiscontinuedClass B 22,000,000 0 4.775% Sep 17, 2009 Mar 17, 2014 DiscontinuedVPR Loans 258,000,000 67,489,105 Floating Not Applicable Mar 17, 2014 AAA (sf)VPR Loans Class B 22,000,000 22,000,000 Floating Not Applicable Not Applicable Not Rated
Month Pool Balance Total Collections Net Loss RateDelinquency
Rate Reserve Ratio O/C RatioSep-2010 104,077,523 12,163,038 -0.31% 0.29% 5.54% 16.30%Aug-2010 115,398,762 13,072,804 0.12% 0.40% 4.91% 14.47%Jul-2010 127,636,988 13,812,723 0.06% 0.27% 4.38% 12.90%Jun-2010 140,535,563 16,967,524 0.21% 0.19% 3.93% 11.58%May-2010 156,479,299 17,891,809 0.09% 0.21% 3.49% 10.28%Apr-2010 173,218,268 19,268,290 0.25% 0.18% 3.12% 9.20%Mar-2010 191,228,205 24,179,905 0.80% 0.17% 2.80% 8.26%Feb-2010 213,798,666 17,077,393 0.26% 0.21% 2.49% 7.32%Jan-2010 229,598,309 18,033,722 0.39% 0.24% 2.30% 6.78%Dec-2009 246,241,188 20,985,052 0.43% 0.25% 2.14% 6.30%Nov-2009 265,564,502 21,850,059 0.57% 0.23% 1.97% 5.81%Oct-2009 285,624,948 22,913,216 0.63% 0.26% 1.83% 5.38%
Month VPR LoansVPR Loans Class
BSep-2010 67,489,105 22,000,000Aug-2010 78,810,344 22,000,000Jul-2010 91,048,571 22,000,000Jun-2010 103,947,146 22,000,000May-2010 119,890,881 22,000,000Apr-2010 136,629,850 22,000,000Mar-2010 154,639,787 22,000,000Feb-2010 177,210,248 22,000,000Jan-2010 193,009,891 22,000,000Dec-2009 209,652,770 22,000,000Nov-2009 228,976,084 22,000,000Oct-2009 249,036,530 22,000,000
BMO Capital MarketsCIBC World Markets Inc.
12
Auto Loans
September 2010
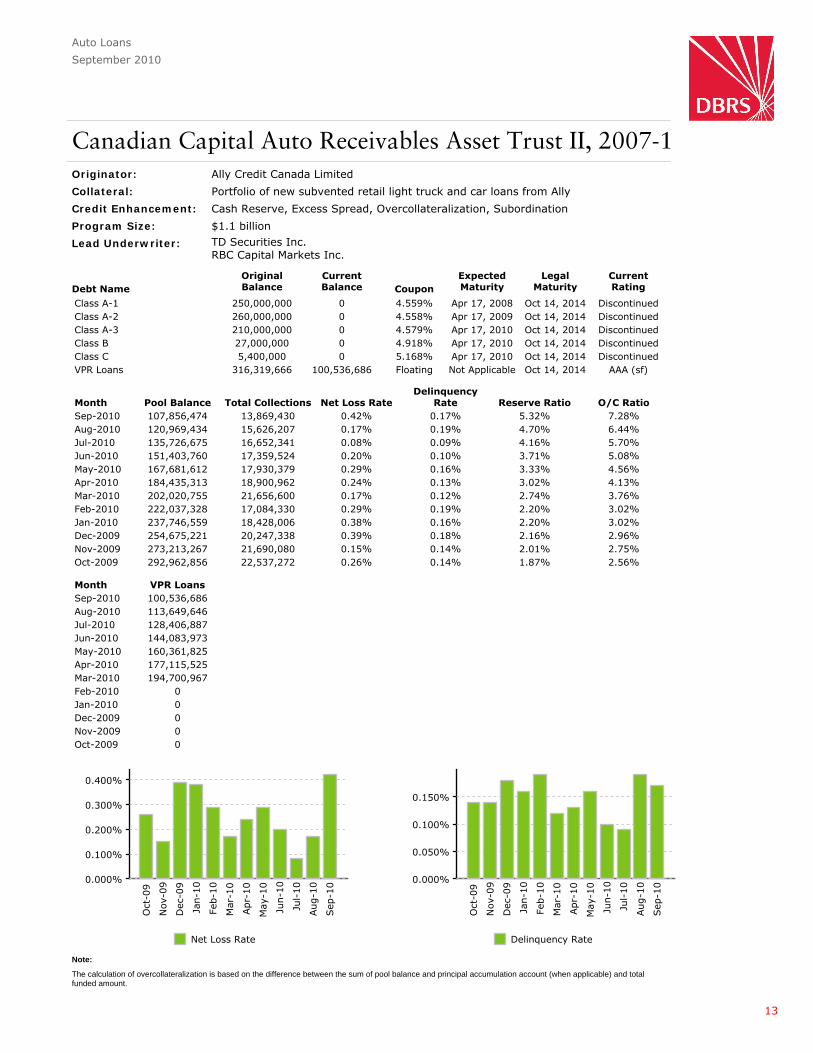
Canadian Capital Auto Receivables Asset Trust II, 2007-1Originator: Ally Credit Canada Limited
Collateral: Portfolio of new subvented retail light truck and car loans from Ally
Credit Enhancement: Cash Reserve, Excess Spread, Overcollateralization, Subordination
Program Size: $1.1 billion
Lead Underwriter:
Debt NameOriginalBalance
CurrentBalance Coupon
ExpectedMaturity
LegalMaturity
CurrentRating
Class A-1 250,000,000 0 4.559% Apr 17, 2008 Oct 14, 2014 DiscontinuedClass A-2 260,000,000 0 4.558% Apr 17, 2009 Oct 14, 2014 DiscontinuedClass A-3 210,000,000 0 4.579% Apr 17, 2010 Oct 14, 2014 DiscontinuedClass B 27,000,000 0 4.918% Apr 17, 2010 Oct 14, 2014 DiscontinuedClass C 5,400,000 0 5.168% Apr 17, 2010 Oct 14, 2014 DiscontinuedVPR Loans 316,319,666 100,536,686 Floating Not Applicable Oct 14, 2014 AAA (sf)
Month Pool Balance Total Collections Net Loss RateDelinquency
Rate Reserve Ratio O/C RatioSep-2010 107,856,474 13,869,430 0.42% 0.17% 5.32% 7.28%Aug-2010 120,969,434 15,626,207 0.17% 0.19% 4.70% 6.44%Jul-2010 135,726,675 16,652,341 0.08% 0.09% 4.16% 5.70%Jun-2010 151,403,760 17,359,524 0.20% 0.10% 3.71% 5.08%May-2010 167,681,612 17,930,379 0.29% 0.16% 3.33% 4.56%Apr-2010 184,435,313 18,900,962 0.24% 0.13% 3.02% 4.13%Mar-2010 202,020,755 21,656,600 0.17% 0.12% 2.74% 3.76%Feb-2010 222,037,328 17,084,330 0.29% 0.19% 2.20% 3.02%Jan-2010 237,746,559 18,428,006 0.38% 0.16% 2.20% 3.02%Dec-2009 254,675,221 20,247,338 0.39% 0.18% 2.16% 2.96%Nov-2009 273,213,267 21,690,080 0.15% 0.14% 2.01% 2.75%Oct-2009 292,962,856 22,537,272 0.26% 0.14% 1.87% 2.56%
Month VPR LoansSep-2010 100,536,686Aug-2010 113,649,646Jul-2010 128,406,887Jun-2010 144,083,973May-2010 160,361,825Apr-2010 177,115,525Mar-2010 194,700,967Feb-2010 0Jan-2010 0Dec-2009 0Nov-2009 0Oct-2009 0
TD Securities Inc.RBC Capital Markets Inc.
The calculation of overcollateralization is based on the difference between the sum of pool balance and principal accumulation account (when applicable) and totalfunded amount.
Note:
13
Auto Loans
September 2010
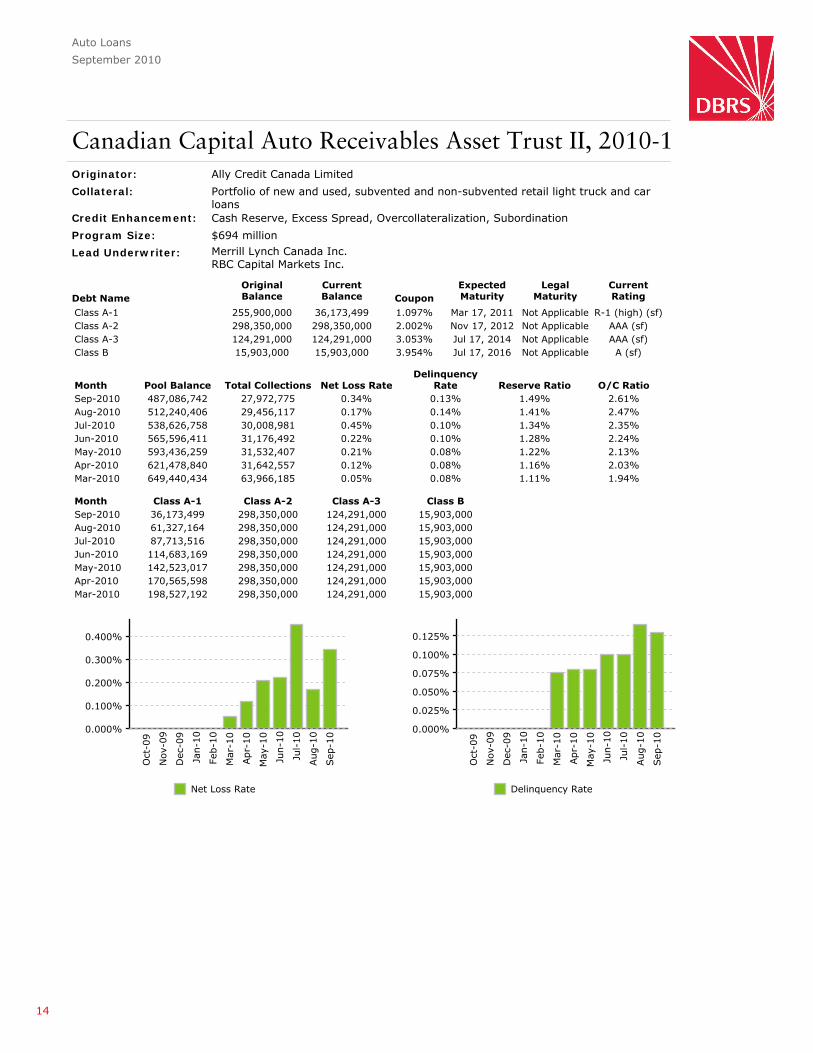
Canadian Capital Auto Receivables Asset Trust II, 2010-1Originator: Ally Credit Canada Limited
Collateral: Portfolio of new and used, subvented and non-subvented retail light truck and carloans
Credit Enhancement: Cash Reserve, Excess Spread, Overcollateralization, Subordination
Program Size: $694 million
Lead Underwriter:
Debt NameOriginalBalance
CurrentBalance Coupon
ExpectedMaturity
LegalMaturity
CurrentRating
Class A-1 255,900,000 36,173,499 1.097% Mar 17, 2011 Not Applicable R-1 (high) (sf)Class A-2 298,350,000 298,350,000 2.002% Nov 17, 2012 Not Applicable AAA (sf)Class A-3 124,291,000 124,291,000 3.053% Jul 17, 2014 Not Applicable AAA (sf)Class B 15,903,000 15,903,000 3.954% Jul 17, 2016 Not Applicable A (sf)
Month Pool Balance Total Collections Net Loss RateDelinquency
Rate Reserve Ratio O/C RatioSep-2010 487,086,742 27,972,775 0.34% 0.13% 1.49% 2.61%Aug-2010 512,240,406 29,456,117 0.17% 0.14% 1.41% 2.47%Jul-2010 538,626,758 30,008,981 0.45% 0.10% 1.34% 2.35%Jun-2010 565,596,411 31,176,492 0.22% 0.10% 1.28% 2.24%May-2010 593,436,259 31,532,407 0.21% 0.08% 1.22% 2.13%Apr-2010 621,478,840 31,642,557 0.12% 0.08% 1.16% 2.03%Mar-2010 649,440,434 63,966,185 0.05% 0.08% 1.11% 1.94%
Month Class A-1 Class A-2 Class A-3 Class BSep-2010 36,173,499 298,350,000 124,291,000 15,903,000Aug-2010 61,327,164 298,350,000 124,291,000 15,903,000Jul-2010 87,713,516 298,350,000 124,291,000 15,903,000Jun-2010 114,683,169 298,350,000 124,291,000 15,903,000May-2010 142,523,017 298,350,000 124,291,000 15,903,000Apr-2010 170,565,598 298,350,000 124,291,000 15,903,000Mar-2010 198,527,192 298,350,000 124,291,000 15,903,000
Merrill Lynch Canada Inc.RBC Capital Markets Inc.
14
Auto Loans
September 2010
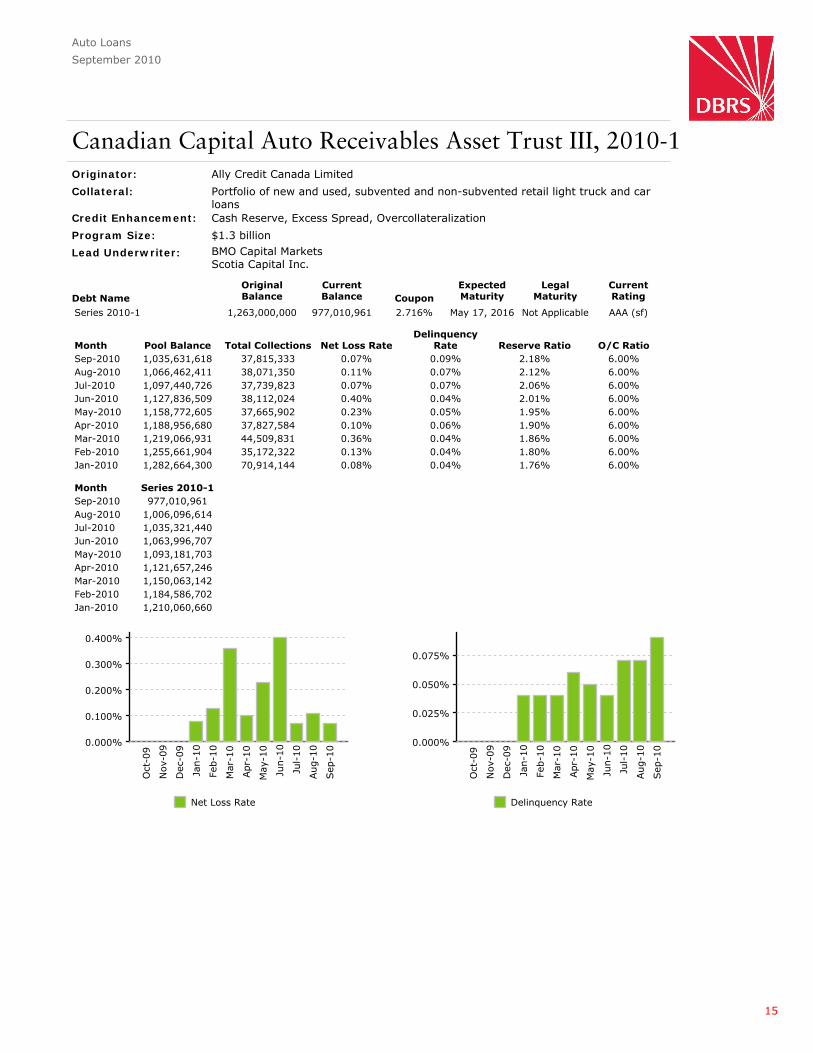
Canadian Capital Auto Receivables Asset Trust III, 2010-1Originator: Ally Credit Canada Limited
Collateral: Portfolio of new and used, subvented and non-subvented retail light truck and carloans
Credit Enhancement: Cash Reserve, Excess Spread, Overcollateralization
Program Size: $1.3 billion
Lead Underwriter:
Debt NameOriginalBalance
CurrentBalance Coupon
ExpectedMaturity
LegalMaturity
CurrentRating
Series 2010-1 1,263,000,000 977,010,961 2.716% May 17, 2016 Not Applicable AAA (sf)
Month Pool Balance Total Collections Net Loss RateDelinquency
Rate Reserve Ratio O/C RatioSep-2010 1,035,631,618 37,815,333 0.07% 0.09% 2.18% 6.00%Aug-2010 1,066,462,411 38,071,350 0.11% 0.07% 2.12% 6.00%Jul-2010 1,097,440,726 37,739,823 0.07% 0.07% 2.06% 6.00%Jun-2010 1,127,836,509 38,112,024 0.40% 0.04% 2.01% 6.00%May-2010 1,158,772,605 37,665,902 0.23% 0.05% 1.95% 6.00%Apr-2010 1,188,956,680 37,827,584 0.10% 0.06% 1.90% 6.00%Mar-2010 1,219,066,931 44,509,831 0.36% 0.04% 1.86% 6.00%Feb-2010 1,255,661,904 35,172,322 0.13% 0.04% 1.80% 6.00%Jan-2010 1,282,664,300 70,914,144 0.08% 0.04% 1.76% 6.00%
Month Series 2010-1Sep-2010 977,010,961Aug-2010 1,006,096,614Jul-2010 1,035,321,440Jun-2010 1,063,996,707May-2010 1,093,181,703Apr-2010 1,121,657,246Mar-2010 1,150,063,142Feb-2010 1,184,586,702Jan-2010 1,210,060,660
BMO Capital MarketsScotia Capital Inc.
15
Auto Loans
September 2010
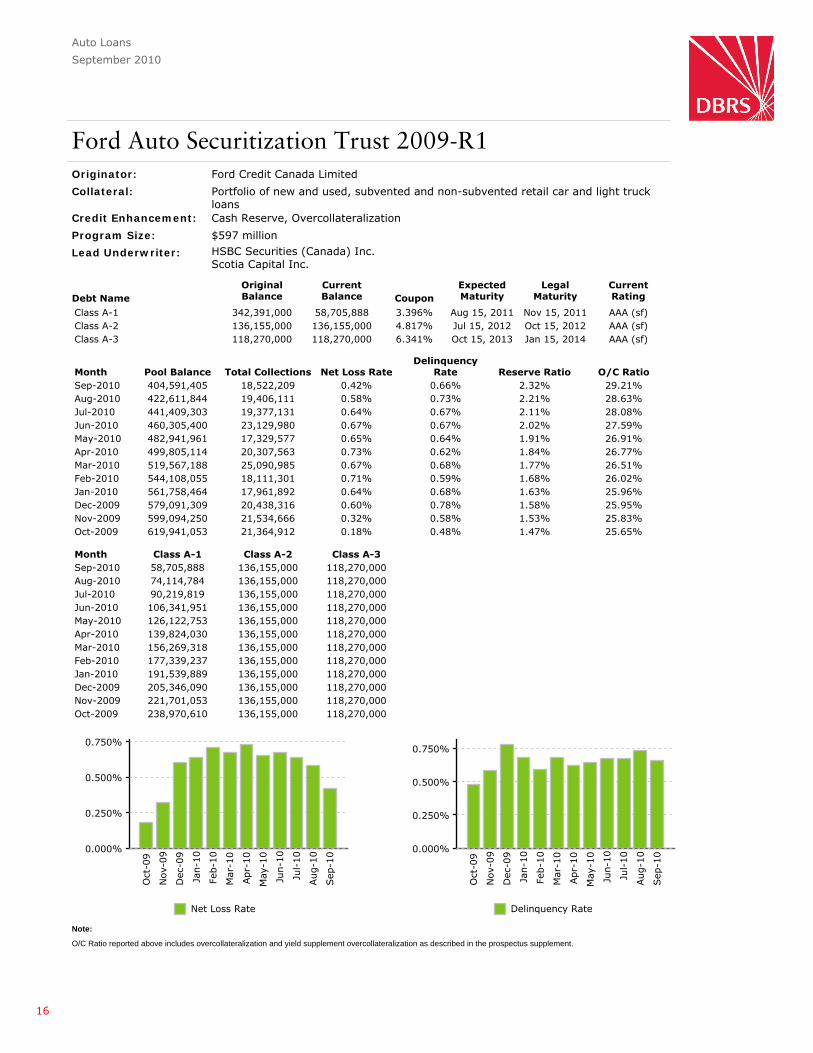
Ford Auto Securitization Trust 2009-R1Originator: Ford Credit Canada Limited
Collateral: Portfolio of new and used, subvented and non-subvented retail car and light truckloans
Credit Enhancement: Cash Reserve, Overcollateralization
Program Size: $597 million
Lead Underwriter:
Debt NameOriginalBalance
CurrentBalance Coupon
ExpectedMaturity
LegalMaturity
CurrentRating
Class A-1 342,391,000 58,705,888 3.396% Aug 15, 2011 Nov 15, 2011 AAA (sf)Class A-2 136,155,000 136,155,000 4.817% Jul 15, 2012 Oct 15, 2012 AAA (sf)Class A-3 118,270,000 118,270,000 6.341% Oct 15, 2013 Jan 15, 2014 AAA (sf)
Month Pool Balance Total Collections Net Loss RateDelinquency
Rate Reserve Ratio O/C RatioSep-2010 404,591,405 18,522,209 0.42% 0.66% 2.32% 29.21%Aug-2010 422,611,844 19,406,111 0.58% 0.73% 2.21% 28.63%Jul-2010 441,409,303 19,377,131 0.64% 0.67% 2.11% 28.08%Jun-2010 460,305,400 23,129,980 0.67% 0.67% 2.02% 27.59%May-2010 482,941,961 17,329,577 0.65% 0.64% 1.91% 26.91%Apr-2010 499,805,114 20,307,563 0.73% 0.62% 1.84% 26.77%Mar-2010 519,567,188 25,090,985 0.67% 0.68% 1.77% 26.51%Feb-2010 544,108,055 18,111,301 0.71% 0.59% 1.68% 26.02%Jan-2010 561,758,464 17,961,892 0.64% 0.68% 1.63% 25.96%Dec-2009 579,091,309 20,438,316 0.60% 0.78% 1.58% 25.95%Nov-2009 599,094,250 21,534,666 0.32% 0.58% 1.53% 25.83%Oct-2009 619,941,053 21,364,912 0.18% 0.48% 1.47% 25.65%
Month Class A-1 Class A-2 Class A-3Sep-2010 58,705,888 136,155,000 118,270,000Aug-2010 74,114,784 136,155,000 118,270,000Jul-2010 90,219,819 136,155,000 118,270,000Jun-2010 106,341,951 136,155,000 118,270,000May-2010 126,122,753 136,155,000 118,270,000Apr-2010 139,824,030 136,155,000 118,270,000Mar-2010 156,269,318 136,155,000 118,270,000Feb-2010 177,339,237 136,155,000 118,270,000Jan-2010 191,539,889 136,155,000 118,270,000Dec-2009 205,346,090 136,155,000 118,270,000Nov-2009 221,701,053 136,155,000 118,270,000Oct-2009 238,970,610 136,155,000 118,270,000
HSBC Securities (Canada) Inc.Scotia Capital Inc.
O/C Ratio reported above includes overcollateralization and yield supplement overcollateralization as described in the prospectus supplement.
Note:
16
Auto Loans
September 2010
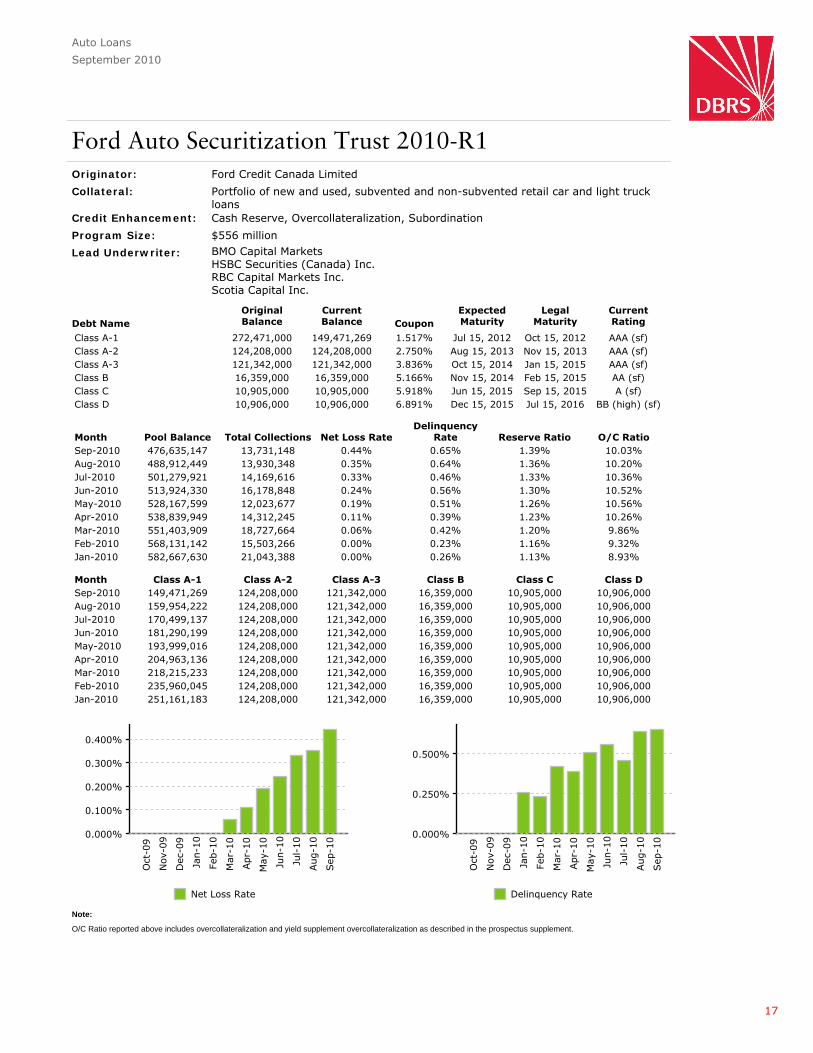
Ford Auto Securitization Trust 2010-R1Originator: Ford Credit Canada Limited
Collateral: Portfolio of new and used, subvented and non-subvented retail car and light truckloans
Credit Enhancement: Cash Reserve, Overcollateralization, Subordination
Program Size: $556 million
Lead Underwriter:
Debt NameOriginalBalance
CurrentBalance Coupon
ExpectedMaturity
LegalMaturity
CurrentRating
Class A-1 272,471,000 149,471,269 1.517% Jul 15, 2012 Oct 15, 2012 AAA (sf)Class A-2 124,208,000 124,208,000 2.750% Aug 15, 2013 Nov 15, 2013 AAA (sf)Class A-3 121,342,000 121,342,000 3.836% Oct 15, 2014 Jan 15, 2015 AAA (sf)Class B 16,359,000 16,359,000 5.166% Nov 15, 2014 Feb 15, 2015 AA (sf)Class C 10,905,000 10,905,000 5.918% Jun 15, 2015 Sep 15, 2015 A (sf)Class D 10,906,000 10,906,000 6.891% Dec 15, 2015 Jul 15, 2016 BB (high) (sf)
Month Pool Balance Total Collections Net Loss RateDelinquency
Rate Reserve Ratio O/C RatioSep-2010 476,635,147 13,731,148 0.44% 0.65% 1.39% 10.03%Aug-2010 488,912,449 13,930,348 0.35% 0.64% 1.36% 10.20%Jul-2010 501,279,921 14,169,616 0.33% 0.46% 1.33% 10.36%Jun-2010 513,924,330 16,178,848 0.24% 0.56% 1.30% 10.52%May-2010 528,167,599 12,023,677 0.19% 0.51% 1.26% 10.56%Apr-2010 538,839,949 14,312,245 0.11% 0.39% 1.23% 10.26%Mar-2010 551,403,909 18,727,664 0.06% 0.42% 1.20% 9.86%Feb-2010 568,131,142 15,503,266 0.00% 0.23% 1.16% 9.32%Jan-2010 582,667,630 21,043,388 0.00% 0.26% 1.13% 8.93%
Month Class A-1 Class A-2 Class A-3 Class B Class C Class DSep-2010 149,471,269 124,208,000 121,342,000 16,359,000 10,905,000 10,906,000Aug-2010 159,954,222 124,208,000 121,342,000 16,359,000 10,905,000 10,906,000Jul-2010 170,499,137 124,208,000 121,342,000 16,359,000 10,905,000 10,906,000Jun-2010 181,290,199 124,208,000 121,342,000 16,359,000 10,905,000 10,906,000May-2010 193,999,016 124,208,000 121,342,000 16,359,000 10,905,000 10,906,000Apr-2010 204,963,136 124,208,000 121,342,000 16,359,000 10,905,000 10,906,000Mar-2010 218,215,233 124,208,000 121,342,000 16,359,000 10,905,000 10,906,000Feb-2010 235,960,045 124,208,000 121,342,000 16,359,000 10,905,000 10,906,000Jan-2010 251,161,183 124,208,000 121,342,000 16,359,000 10,905,000 10,906,000
BMO Capital MarketsHSBC Securities (Canada) Inc.RBC Capital Markets Inc.Scotia Capital Inc.
O/C Ratio reported above includes overcollateralization and yield supplement overcollateralization as described in the prospectus supplement.
Note:
17
Auto Loans
September 2010
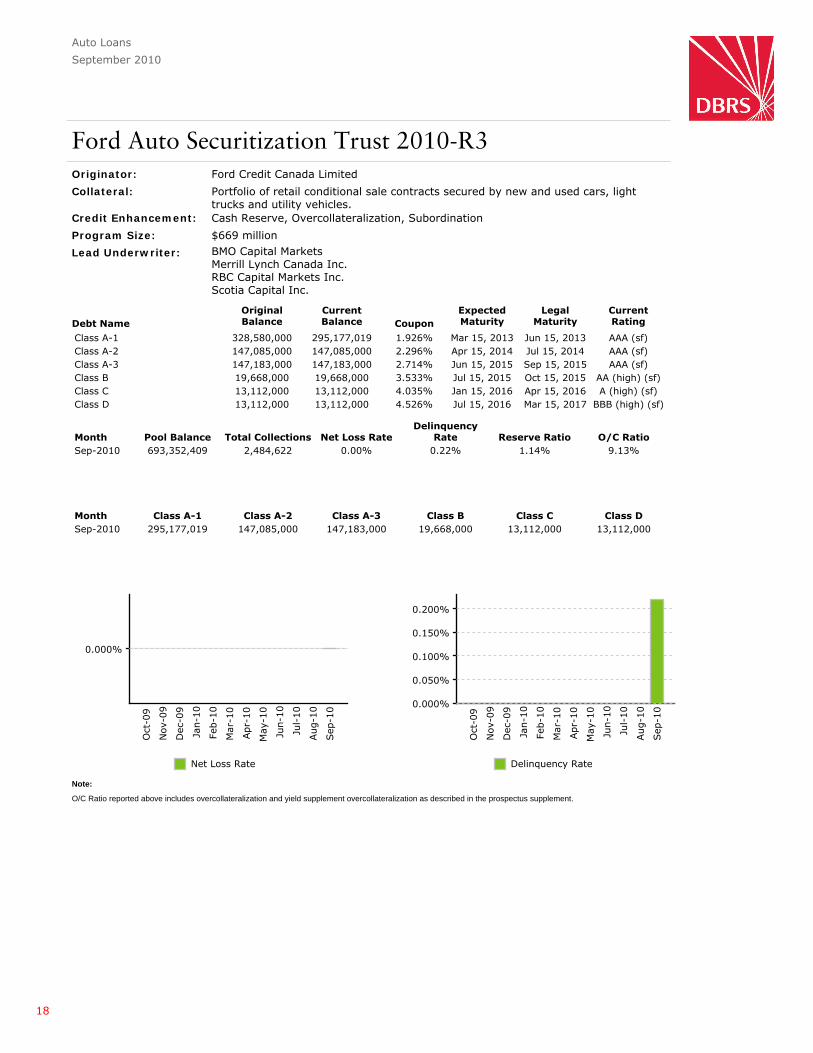
Ford Auto Securitization Trust 2010-R3Originator: Ford Credit Canada Limited
Collateral: Portfolio of retail conditional sale contracts secured by new and used cars, lighttrucks and utility vehicles.
Credit Enhancement: Cash Reserve, Overcollateralization, Subordination
Program Size: $669 million
Lead Underwriter:
Debt NameOriginalBalance
CurrentBalance Coupon
ExpectedMaturity
LegalMaturity
CurrentRating
Class A-1 328,580,000 295,177,019 1.926% Mar 15, 2013 Jun 15, 2013 AAA (sf)Class A-2 147,085,000 147,085,000 2.296% Apr 15, 2014 Jul 15, 2014 AAA (sf)Class A-3 147,183,000 147,183,000 2.714% Jun 15, 2015 Sep 15, 2015 AAA (sf)Class B 19,668,000 19,668,000 3.533% Jul 15, 2015 Oct 15, 2015 AA (high) (sf)Class C 13,112,000 13,112,000 4.035% Jan 15, 2016 Apr 15, 2016 A (high) (sf)Class D 13,112,000 13,112,000 4.526% Jul 15, 2016 Mar 15, 2017 BBB (high) (sf)
Month Pool Balance Total Collections Net Loss RateDelinquency
Rate Reserve Ratio O/C RatioSep-2010 693,352,409 2,484,622 0.00% 0.22% 1.14% 9.13%
Month Class A-1 Class A-2 Class A-3 Class B Class C Class DSep-2010 295,177,019 147,085,000 147,183,000 19,668,000 13,112,000 13,112,000
BMO Capital MarketsMerrill Lynch Canada Inc.RBC Capital Markets Inc.Scotia Capital Inc.
O/C Ratio reported above includes overcollateralization and yield supplement overcollateralization as described in the prospectus supplement.
Note:
18
Auto Leases
September 2010
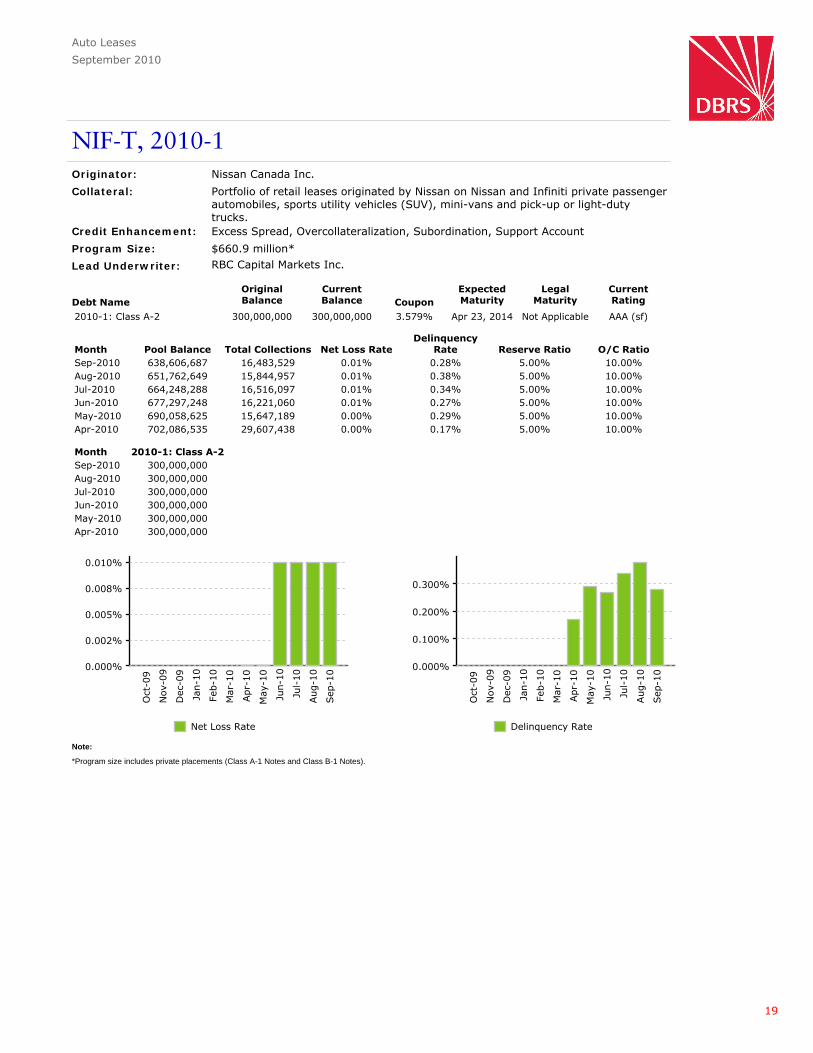
NIF-T, 2010-1Originator: Nissan Canada Inc.
Collateral: Portfolio of retail leases originated by Nissan on Nissan and Infiniti private passengerautomobiles, sports utility vehicles (SUV), mini-vans and pick-up or light-dutytrucks.
Credit Enhancement: Excess Spread, Overcollateralization, Subordination, Support Account
Program Size: $660.9 million*
Lead Underwriter:
Debt NameOriginalBalance
CurrentBalance Coupon
ExpectedMaturity
LegalMaturity
CurrentRating
2010-1: Class A-2 300,000,000 300,000,000 3.579% Apr 23, 2014 Not Applicable AAA (sf)
Month Pool Balance Total Collections Net Loss RateDelinquency
Rate Reserve Ratio O/C RatioSep-2010 638,606,687 16,483,529 0.01% 0.28% 5.00% 10.00%Aug-2010 651,762,649 15,844,957 0.01% 0.38% 5.00% 10.00%Jul-2010 664,248,288 16,516,097 0.01% 0.34% 5.00% 10.00%Jun-2010 677,297,248 16,221,060 0.01% 0.27% 5.00% 10.00%May-2010 690,058,625 15,647,189 0.00% 0.29% 5.00% 10.00%Apr-2010 702,086,535 29,607,438 0.00% 0.17% 5.00% 10.00%
Month 2010-1: Class A-2Sep-2010 300,000,000Aug-2010 300,000,000Jul-2010 300,000,000Jun-2010 300,000,000May-2010 300,000,000Apr-2010 300,000,000
RBC Capital Markets Inc.
*Program size includes private placements (Class A-1 Notes and Class B-1 Notes).
Note:
19
Fleet Leasing
September 2010
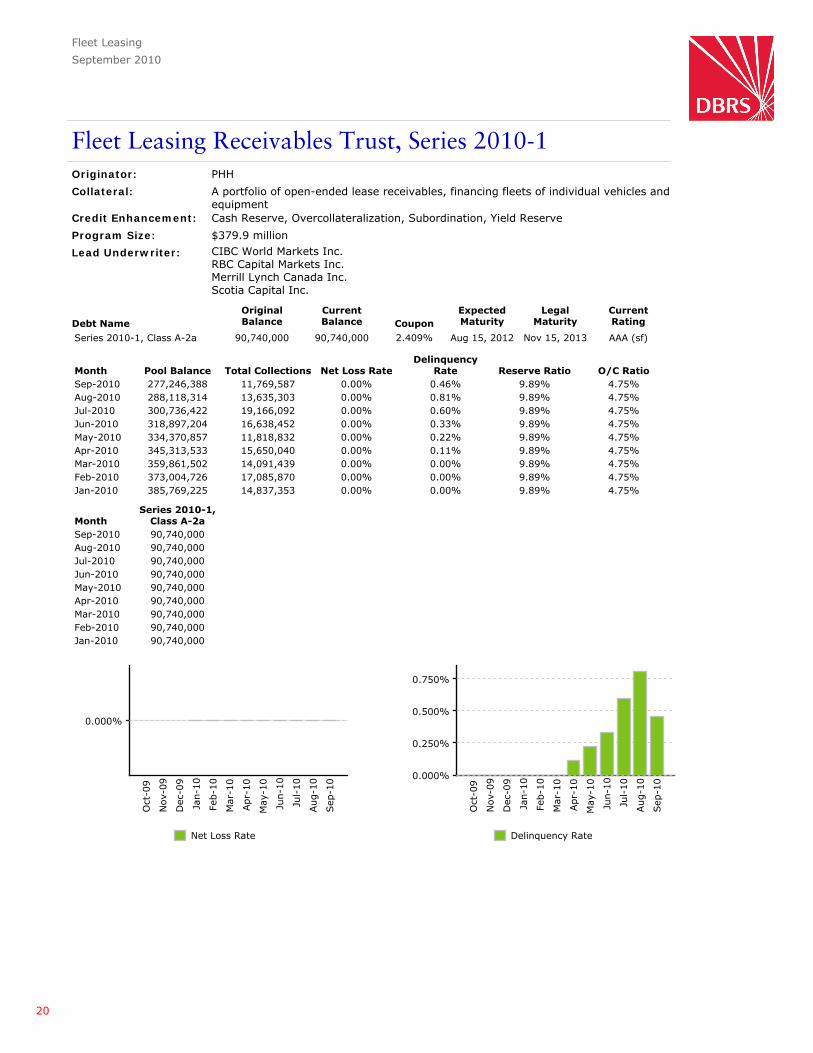
Fleet Leasing Receivables Trust, Series 2010-1Originator: PHH
Collateral: A portfolio of open-ended lease receivables, financing fleets of individual vehicles andequipment
Credit Enhancement: Cash Reserve, Overcollateralization, Subordination, Yield Reserve
Program Size: $379.9 million
Lead Underwriter:
Debt NameOriginalBalance
CurrentBalance Coupon
ExpectedMaturity
LegalMaturity
CurrentRating
Series 2010-1, Class A-2a 90,740,000 90,740,000 2.409% Aug 15, 2012 Nov 15, 2013 AAA (sf)
Month Pool Balance Total Collections Net Loss RateDelinquency
Rate Reserve Ratio O/C RatioSep-2010 277,246,388 11,769,587 0.00% 0.46% 9.89% 4.75%Aug-2010 288,118,314 13,635,303 0.00% 0.81% 9.89% 4.75%Jul-2010 300,736,422 19,166,092 0.00% 0.60% 9.89% 4.75%Jun-2010 318,897,204 16,638,452 0.00% 0.33% 9.89% 4.75%May-2010 334,370,857 11,818,832 0.00% 0.22% 9.89% 4.75%Apr-2010 345,313,533 15,650,040 0.00% 0.11% 9.89% 4.75%Mar-2010 359,861,502 14,091,439 0.00% 0.00% 9.89% 4.75%Feb-2010 373,004,726 17,085,870 0.00% 0.00% 9.89% 4.75%Jan-2010 385,769,225 14,837,353 0.00% 0.00% 9.89% 4.75%
MonthSeries 2010-1,
Class A-2aSep-2010 90,740,000Aug-2010 90,740,000Jul-2010 90,740,000Jun-2010 90,740,000May-2010 90,740,000Apr-2010 90,740,000Mar-2010 90,740,000Feb-2010 90,740,000Jan-2010 90,740,000
CIBC World Markets Inc.RBC Capital Markets Inc.Merrill Lynch Canada Inc.Scotia Capital Inc.
20
Floorplan Financing
September 2010
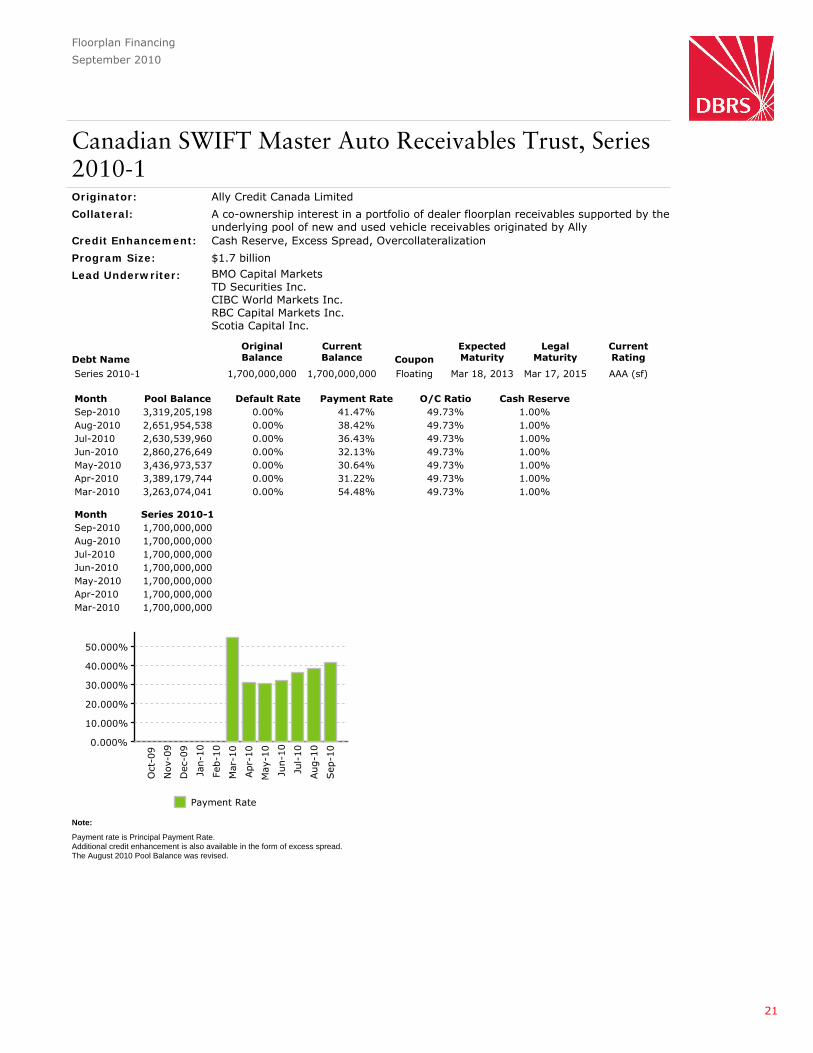
Canadian SWIFT Master Auto Receivables Trust, Series2010-1Originator: Ally Credit Canada Limited
Collateral: A co-ownership interest in a portfolio of dealer floorplan receivables supported by theunderlying pool of new and used vehicle receivables originated by Ally
Credit Enhancement: Cash Reserve, Excess Spread, Overcollateralization
Program Size: $1.7 billion
Lead Underwriter:
Debt NameOriginalBalance
CurrentBalance Coupon
ExpectedMaturity
LegalMaturity
CurrentRating
Series 2010-1 1,700,000,000 1,700,000,000 Floating Mar 18, 2013 Mar 17, 2015 AAA (sf)
Month Pool Balance Default Rate Payment Rate O/C Ratio Cash ReserveSep-2010 3,319,205,198 0.00% 41.47% 49.73% 1.00%Aug-2010 2,651,954,538 0.00% 38.42% 49.73% 1.00%Jul-2010 2,630,539,960 0.00% 36.43% 49.73% 1.00%Jun-2010 2,860,276,649 0.00% 32.13% 49.73% 1.00%May-2010 3,436,973,537 0.00% 30.64% 49.73% 1.00%Apr-2010 3,389,179,744 0.00% 31.22% 49.73% 1.00%Mar-2010 3,263,074,041 0.00% 54.48% 49.73% 1.00%
Month Series 2010-1Sep-2010 1,700,000,000Aug-2010 1,700,000,000Jul-2010 1,700,000,000Jun-2010 1,700,000,000May-2010 1,700,000,000Apr-2010 1,700,000,000Mar-2010 1,700,000,000
BMO Capital MarketsTD Securities Inc.CIBC World Markets Inc.RBC Capital Markets Inc.Scotia Capital Inc.
Payment rate is Principal Payment Rate.Additional credit enhancement is also available in the form of excess spread.The August 2010 Pool Balance was revised.
Note:
21
Floorplan Financing
September 2010
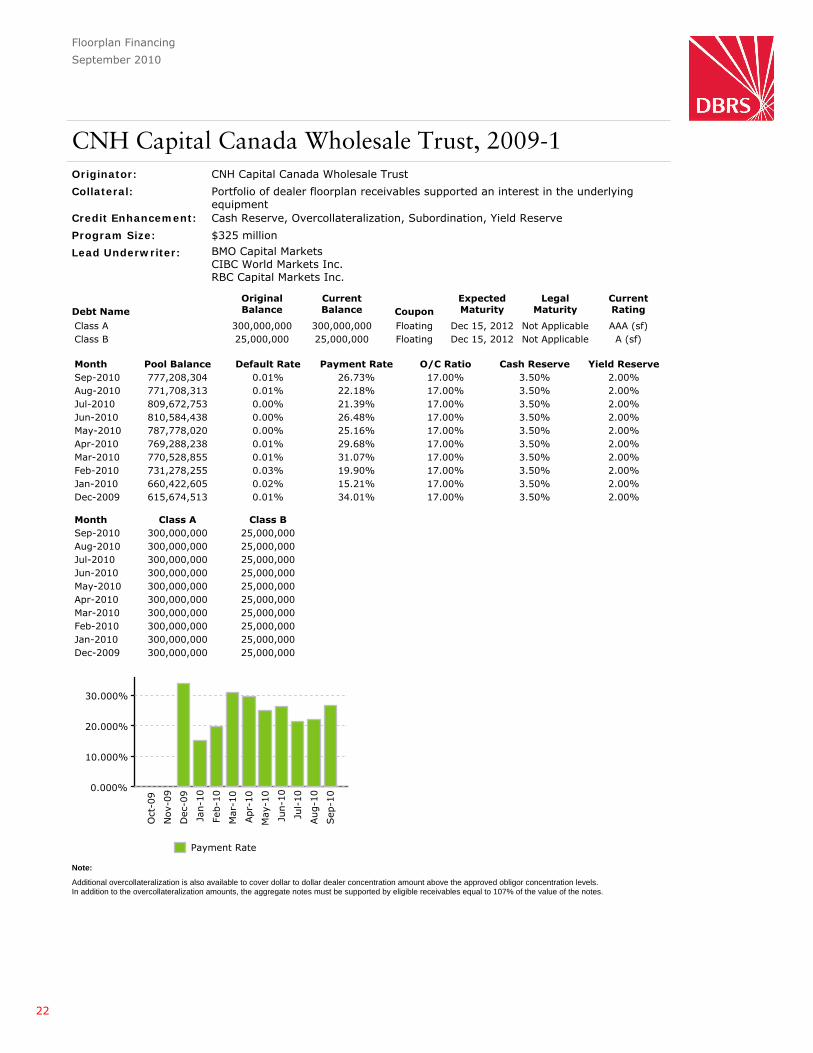
CNH Capital Canada Wholesale Trust, 2009-1Originator: CNH Capital Canada Wholesale Trust
Collateral: Portfolio of dealer floorplan receivables supported an interest in the underlyingequipment
Credit Enhancement: Cash Reserve, Overcollateralization, Subordination, Yield Reserve
Program Size: $325 million
Lead Underwriter:
Debt NameOriginalBalance
CurrentBalance Coupon
ExpectedMaturity
LegalMaturity
CurrentRating
Class A 300,000,000 300,000,000 Floating Dec 15, 2012 Not Applicable AAA (sf)Class B 25,000,000 25,000,000 Floating Dec 15, 2012 Not Applicable A (sf)
Month Pool Balance Default Rate Payment Rate O/C Ratio Cash Reserve Yield ReserveSep-2010 777,208,304 0.01% 26.73% 17.00% 3.50% 2.00%Aug-2010 771,708,313 0.01% 22.18% 17.00% 3.50% 2.00%Jul-2010 809,672,753 0.00% 21.39% 17.00% 3.50% 2.00%Jun-2010 810,584,438 0.00% 26.48% 17.00% 3.50% 2.00%May-2010 787,778,020 0.00% 25.16% 17.00% 3.50% 2.00%Apr-2010 769,288,238 0.01% 29.68% 17.00% 3.50% 2.00%Mar-2010 770,528,855 0.01% 31.07% 17.00% 3.50% 2.00%Feb-2010 731,278,255 0.03% 19.90% 17.00% 3.50% 2.00%Jan-2010 660,422,605 0.02% 15.21% 17.00% 3.50% 2.00%Dec-2009 615,674,513 0.01% 34.01% 17.00% 3.50% 2.00%
Month Class A Class BSep-2010 300,000,000 25,000,000Aug-2010 300,000,000 25,000,000Jul-2010 300,000,000 25,000,000Jun-2010 300,000,000 25,000,000May-2010 300,000,000 25,000,000Apr-2010 300,000,000 25,000,000Mar-2010 300,000,000 25,000,000Feb-2010 300,000,000 25,000,000Jan-2010 300,000,000 25,000,000Dec-2009 300,000,000 25,000,000
BMO Capital MarketsCIBC World Markets Inc.RBC Capital Markets Inc.
Additional overcollateralization is also available to cover dollar to dollar dealer concentration amount above the approved obligor concentration levels.In addition to the overcollateralization amounts, the aggregate notes must be supported by eligible receivables equal to 107% of the value of the notes.
Note:
22
Floorplan Financing
September 2010
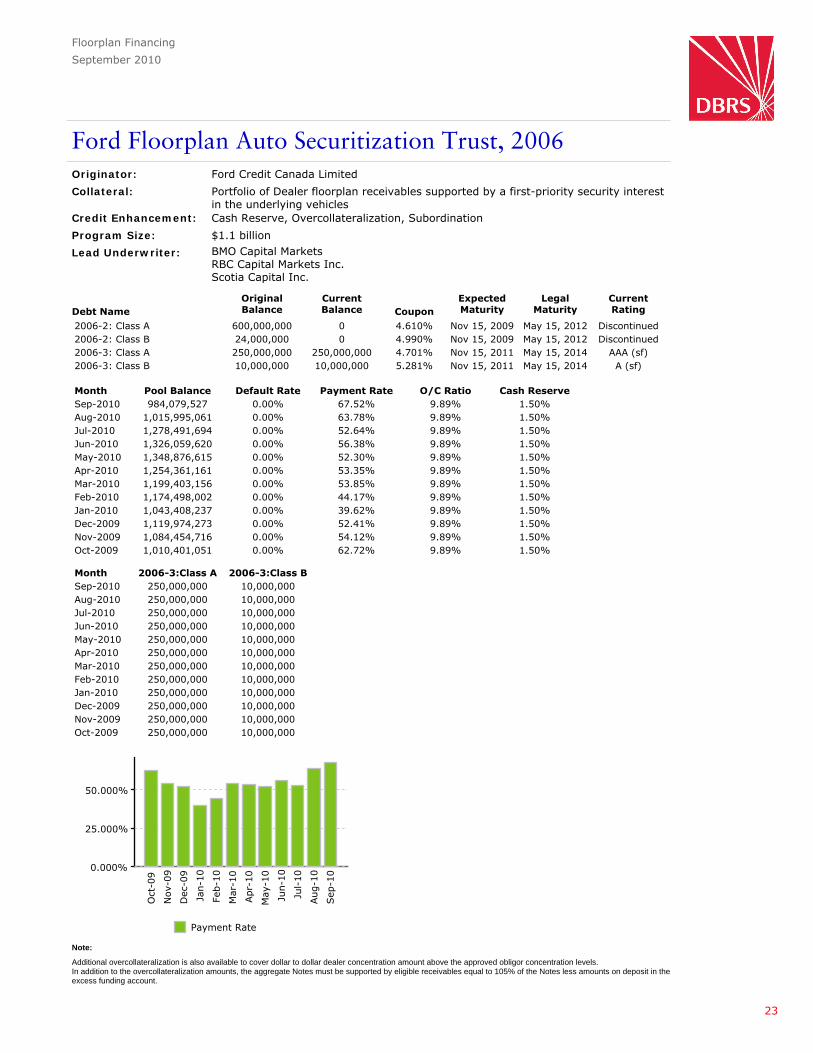
Ford Floorplan Auto Securitization Trust, 2006Originator: Ford Credit Canada Limited
Collateral: Portfolio of Dealer floorplan receivables supported by a first-priority security interestin the underlying vehicles
Credit Enhancement: Cash Reserve, Overcollateralization, Subordination
Program Size: $1.1 billion
Lead Underwriter:
Debt NameOriginalBalance
CurrentBalance Coupon
ExpectedMaturity
LegalMaturity
CurrentRating
2006-2: Class A 600,000,000 0 4.610% Nov 15, 2009 May 15, 2012 Discontinued2006-2: Class B 24,000,000 0 4.990% Nov 15, 2009 May 15, 2012 Discontinued2006-3: Class A 250,000,000 250,000,000 4.701% Nov 15, 2011 May 15, 2014 AAA (sf)2006-3: Class B 10,000,000 10,000,000 5.281% Nov 15, 2011 May 15, 2014 A (sf)
Month Pool Balance Default Rate Payment Rate O/C Ratio Cash ReserveSep-2010 984,079,527 0.00% 67.52% 9.89% 1.50%Aug-2010 1,015,995,061 0.00% 63.78% 9.89% 1.50%Jul-2010 1,278,491,694 0.00% 52.64% 9.89% 1.50%Jun-2010 1,326,059,620 0.00% 56.38% 9.89% 1.50%May-2010 1,348,876,615 0.00% 52.30% 9.89% 1.50%Apr-2010 1,254,361,161 0.00% 53.35% 9.89% 1.50%Mar-2010 1,199,403,156 0.00% 53.85% 9.89% 1.50%Feb-2010 1,174,498,002 0.00% 44.17% 9.89% 1.50%Jan-2010 1,043,408,237 0.00% 39.62% 9.89% 1.50%Dec-2009 1,119,974,273 0.00% 52.41% 9.89% 1.50%Nov-2009 1,084,454,716 0.00% 54.12% 9.89% 1.50%Oct-2009 1,010,401,051 0.00% 62.72% 9.89% 1.50%
Month 2006-3:Class A 2006-3:Class BSep-2010 250,000,000 10,000,000Aug-2010 250,000,000 10,000,000Jul-2010 250,000,000 10,000,000Jun-2010 250,000,000 10,000,000May-2010 250,000,000 10,000,000Apr-2010 250,000,000 10,000,000Mar-2010 250,000,000 10,000,000Feb-2010 250,000,000 10,000,000Jan-2010 250,000,000 10,000,000Dec-2009 250,000,000 10,000,000Nov-2009 250,000,000 10,000,000Oct-2009 250,000,000 10,000,000
BMO Capital MarketsRBC Capital Markets Inc.Scotia Capital Inc.
Additional overcollateralization is also available to cover dollar to dollar dealer concentration amount above the approved obligor concentration levels.In addition to the overcollateralization amounts, the aggregate Notes must be supported by eligible receivables equal to 105% of the Notes less amounts on deposit in theexcess funding account.
Note:
23

Floorplan Financing
September 2010
Ford Floorplan Auto Securitization Trust, 2010-F1Originator: Ford Credit Canada Limited
Collateral: A portfolio of dealer floorplan receivables supported by a first-priority securityinterest in the underlying pool of new and used vehicle receivables originated byFCCL
Credit Enhancement: Cash Reserve, Excess Spread, Overcollateralization, Subordination
Program Size: $237 million
Lead Underwriter:
Debt NameOriginalBalance
CurrentBalance Coupon
ExpectedMaturity
LegalMaturity
CurrentRating
Class A 200,000,000 200,000,000 4.168% Jun 15, 2013 Jun 15, 2015 AAA (sf)Class B 5,479,000 5,479,000 4.318% Jun 15, 2013 Jun 15, 2015 AA (sf)Class C 20,548,000 20,548,000 4.468% Jun 15, 2013 Jun 15, 2015 A (sf)Class D 10,959,000 10,959,000 4.617% Jun 15, 2013 Jun 15, 2015 BBB (sf)
Month Pool Balance Default Rate Payment Rate O/C Ratio Cash ReserveSep-2010 984,079,527 0.00% 67.52% 15.61% 1.00%Aug-2010 1,015,995,061 0.00% 63.78% 15.61% 1.00%Jul-2010 1,278,491,694 0.00% 52.64% 15.61% 1.00%Jun-2010 1,326,059,620 0.00% 56.38% 15.61% 1.00%May-2010 1,348,876,615 0.00% 52.30% 15.61% 1.00%
Month Class A Class B Class C Class DSep-2010 200,000,000 5,479,000 20,548,000 10,959,000Aug-2010 200,000,000 5,479,000 20,548,000 10,959,000Jul-2010 200,000,000 5,479,000 20,548,000 10,959,000Jun-2010 200,000,000 5,479,000 20,548,000 10,959,000May-2010 200,000,000 5,479,000 20,548,000 10,959,000
RBC Capital Markets Inc.Scotia Capital Inc.
In addition to the overcollateralization amounts, the aggregate Notes must be supported by eligible receivables equal to 105% of the Notes less amounts on deposit in theexcess funding account.
Note:
24
Floorplan Financing
September 2010
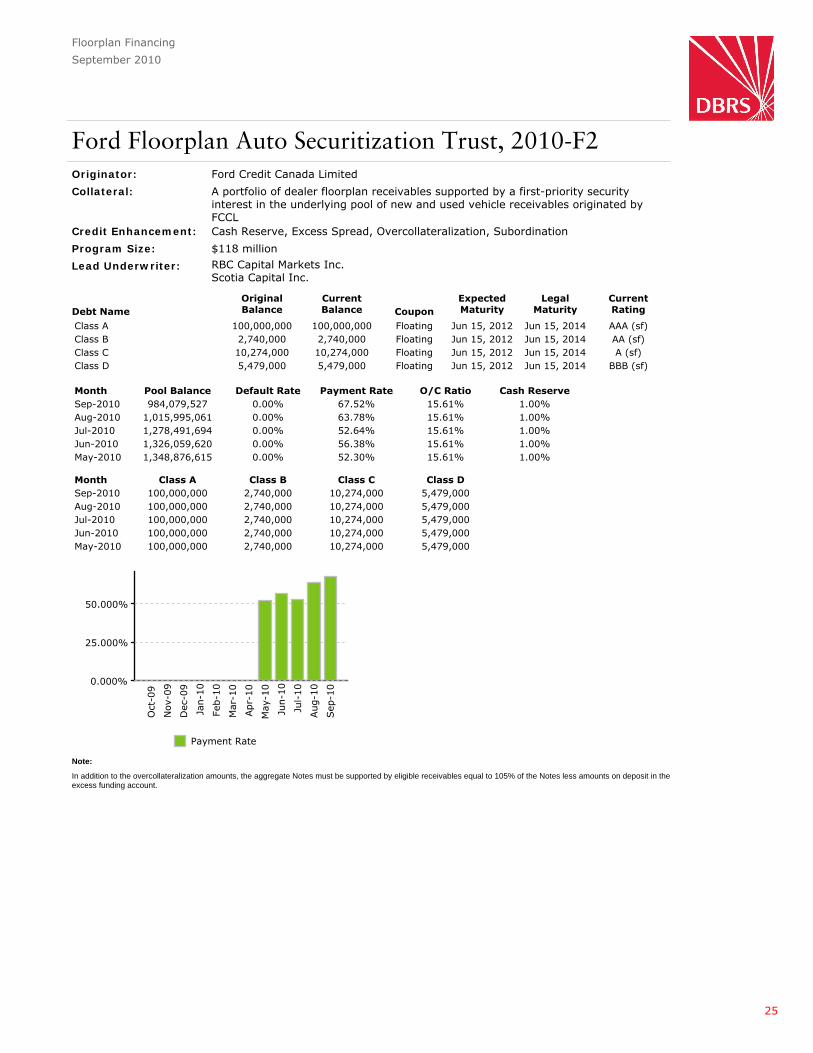
Ford Floorplan Auto Securitization Trust, 2010-F2Originator: Ford Credit Canada Limited
Collateral: A portfolio of dealer floorplan receivables supported by a first-priority securityinterest in the underlying pool of new and used vehicle receivables originated byFCCL
Credit Enhancement: Cash Reserve, Excess Spread, Overcollateralization, Subordination
Program Size: $118 million
Lead Underwriter:
Debt NameOriginalBalance
CurrentBalance Coupon
ExpectedMaturity
LegalMaturity
CurrentRating
Class A 100,000,000 100,000,000 Floating Jun 15, 2012 Jun 15, 2014 AAA (sf)Class B 2,740,000 2,740,000 Floating Jun 15, 2012 Jun 15, 2014 AA (sf)Class C 10,274,000 10,274,000 Floating Jun 15, 2012 Jun 15, 2014 A (sf)Class D 5,479,000 5,479,000 Floating Jun 15, 2012 Jun 15, 2014 BBB (sf)
Month Pool Balance Default Rate Payment Rate O/C Ratio Cash ReserveSep-2010 984,079,527 0.00% 67.52% 15.61% 1.00%Aug-2010 1,015,995,061 0.00% 63.78% 15.61% 1.00%Jul-2010 1,278,491,694 0.00% 52.64% 15.61% 1.00%Jun-2010 1,326,059,620 0.00% 56.38% 15.61% 1.00%May-2010 1,348,876,615 0.00% 52.30% 15.61% 1.00%
Month Class A Class B Class C Class DSep-2010 100,000,000 2,740,000 10,274,000 5,479,000Aug-2010 100,000,000 2,740,000 10,274,000 5,479,000Jul-2010 100,000,000 2,740,000 10,274,000 5,479,000Jun-2010 100,000,000 2,740,000 10,274,000 5,479,000May-2010 100,000,000 2,740,000 10,274,000 5,479,000
RBC Capital Markets Inc.Scotia Capital Inc.
In addition to the overcollateralization amounts, the aggregate Notes must be supported by eligible receivables equal to 105% of the Notes less amounts on deposit in theexcess funding account.
Note:
25
Credit Cards
September 2010
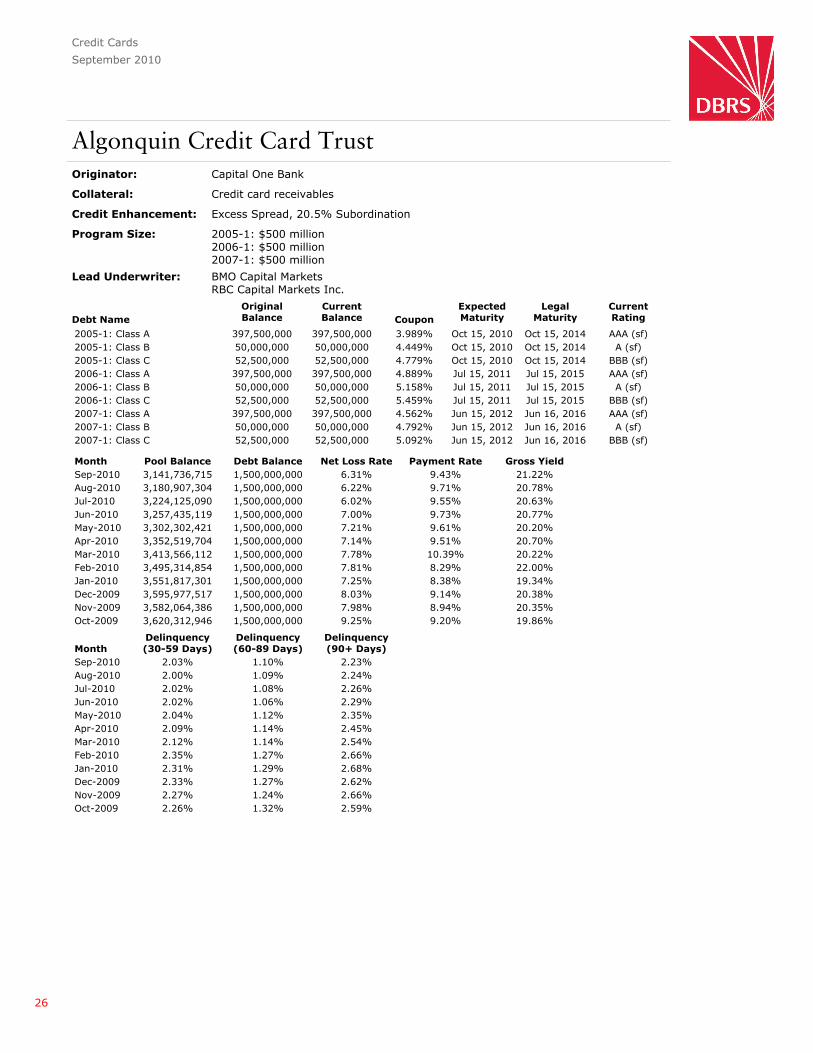
Algonquin Credit Card TrustOriginator: Capital One Bank
Collateral: Credit card receivables
Credit Enhancement: Excess Spread, 20.5% Subordination
Program Size: 2005-1: $500 million2006-1: $500 million2007-1: $500 million
Lead Underwriter: BMO Capital MarketsRBC Capital Markets Inc.
Debt NameOriginalBalance
CurrentBalance Coupon
ExpectedMaturity
LegalMaturity
CurrentRating
2005-1: Class A 397,500,000 397,500,000 3.989% Oct 15, 2010 Oct 15, 2014 AAA (sf)2005-1: Class B 50,000,000 50,000,000 4.449% Oct 15, 2010 Oct 15, 2014 A (sf)2005-1: Class C 52,500,000 52,500,000 4.779% Oct 15, 2010 Oct 15, 2014 BBB (sf)2006-1: Class A 397,500,000 397,500,000 4.889% Jul 15, 2011 Jul 15, 2015 AAA (sf)2006-1: Class B 50,000,000 50,000,000 5.158% Jul 15, 2011 Jul 15, 2015 A (sf)2006-1: Class C 52,500,000 52,500,000 5.459% Jul 15, 2011 Jul 15, 2015 BBB (sf)2007-1: Class A 397,500,000 397,500,000 4.562% Jun 15, 2012 Jun 16, 2016 AAA (sf)2007-1: Class B 50,000,000 50,000,000 4.792% Jun 15, 2012 Jun 16, 2016 A (sf)2007-1: Class C 52,500,000 52,500,000 5.092% Jun 15, 2012 Jun 16, 2016 BBB (sf)
Month Pool Balance Debt Balance Net Loss Rate Payment Rate Gross YieldSep-2010 3,141,736,715 1,500,000,000 6.31% 9.43% 21.22%Aug-2010 3,180,907,304 1,500,000,000 6.22% 9.71% 20.78%Jul-2010 3,224,125,090 1,500,000,000 6.02% 9.55% 20.63%Jun-2010 3,257,435,119 1,500,000,000 7.00% 9.73% 20.77%May-2010 3,302,302,421 1,500,000,000 7.21% 9.61% 20.20%Apr-2010 3,352,519,704 1,500,000,000 7.14% 9.51% 20.70%Mar-2010 3,413,566,112 1,500,000,000 7.78% 10.39% 20.22%Feb-2010 3,495,314,854 1,500,000,000 7.81% 8.29% 22.00%Jan-2010 3,551,817,301 1,500,000,000 7.25% 8.38% 19.34%Dec-2009 3,595,977,517 1,500,000,000 8.03% 9.14% 20.38%Nov-2009 3,582,064,386 1,500,000,000 7.98% 8.94% 20.35%Oct-2009 3,620,312,946 1,500,000,000 9.25% 9.20% 19.86%
MonthDelinquency(30-59 Days)
Delinquency(60-89 Days)
Delinquency(90+ Days)
Sep-2010 2.03% 1.10% 2.23%Aug-2010 2.00% 1.09% 2.24%Jul-2010 2.02% 1.08% 2.26%Jun-2010 2.02% 1.06% 2.29%May-2010 2.04% 1.12% 2.35%Apr-2010 2.09% 1.14% 2.45%Mar-2010 2.12% 1.14% 2.54%Feb-2010 2.35% 1.27% 2.66%Jan-2010 2.31% 1.29% 2.68%Dec-2009 2.33% 1.27% 2.62%Nov-2009 2.27% 1.24% 2.66%Oct-2009 2.26% 1.32% 2.59%
26
Credit Cards
September 2010
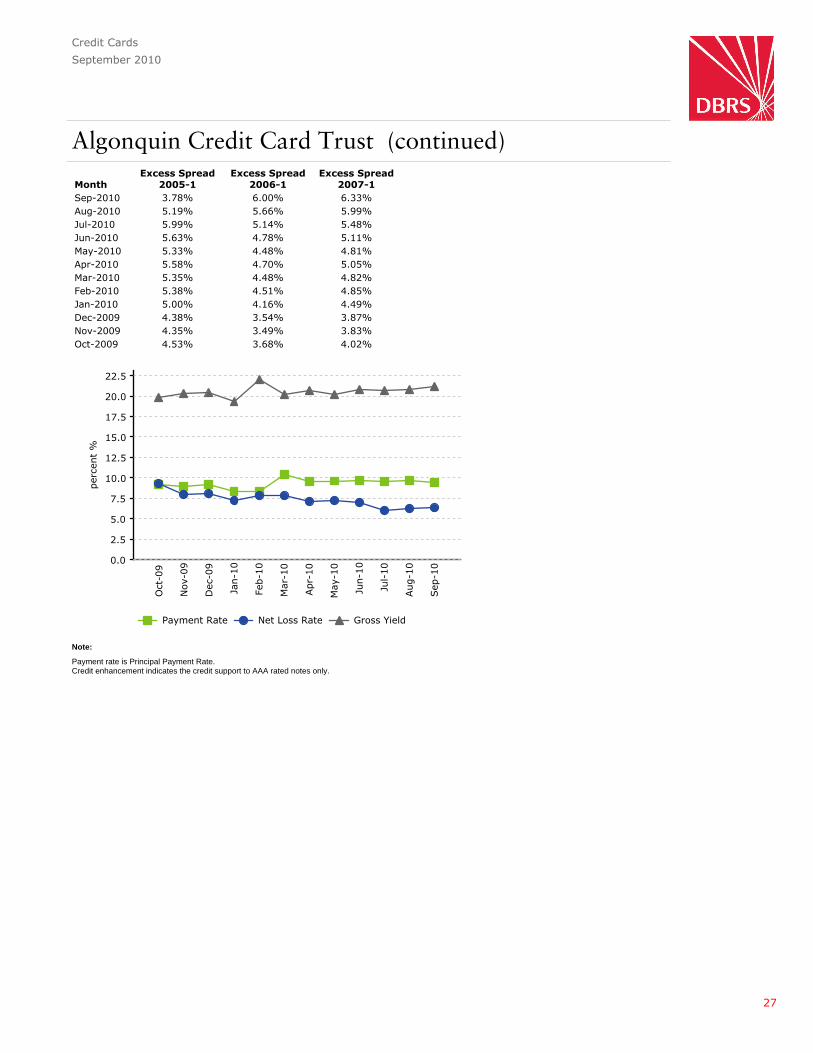
Algonquin Credit Card Trust (continued)
Payment rate is Principal Payment Rate.Credit enhancement indicates the credit support to AAA rated notes only.
Note:
MonthExcess Spread
2005-1Excess Spread
2006-1Excess Spread
2007-1Sep-2010 3.78% 6.00% 6.33%Aug-2010 5.19% 5.66% 5.99%Jul-2010 5.99% 5.14% 5.48%Jun-2010 5.63% 4.78% 5.11%May-2010 5.33% 4.48% 4.81%Apr-2010 5.58% 4.70% 5.05%Mar-2010 5.35% 4.48% 4.82%Feb-2010 5.38% 4.51% 4.85%Jan-2010 5.00% 4.16% 4.49%Dec-2009 4.38% 3.54% 3.87%Nov-2009 4.35% 3.49% 3.83%Oct-2009 4.53% 3.68% 4.02%
27

Credit Cards
September 2010
Broadway Credit Card TrustOriginator: Citi Cards Canada Inc.
Collateral: Credit card receivables
Credit Enhancement: 1.5% Cash Reserve, Excess Spread, 14% / 17% Subordination
Program Size: 2004-2: $398 million2008-1: $583 million2008-2: $278 million
Lead Underwriter: TD Securities Inc.Merrill Lynch Canada Inc.
Debt NameOriginalBalance
CurrentBalance Coupon
ExpectedMaturity
LegalMaturity
CurrentRating
2004-2: Class A 350,000,000 350,000,000 4.804% Mar 17, 2014 Mar 17, 2017 AAA (sf)2004-2: Class B 31,818,182 31,818,182 5.434% Mar 17, 2014 Mar 17, 2017 A (sf)2004-2: Class C 15,909,091 15,909,091 5.884% Mar 17, 2014 Mar 17, 2017 BBB (sf)2004-2: Enhancement Notes 23,942,150 23,942,150 Not Available Mar 17, 2017 Mar 17, 2017 Not Rated2008-1: Class A 525,000,000 525,000,000 5.234% Jun 17, 2011 Jun 17, 2014 AAA (sf)2008-1: Class B 29,167,000 29,167,000 6.084% Jun 17, 2011 Jun 17, 2014 A (sf)2008-1: Class C 29,167,000 29,167,000 7.143% Jun 17, 2011 Jun 17, 2014 BBB (sf)2008-1: Enhancement Notes 27,123,928 27,123,928 Not Available Mar 17, 2017 Mar 17, 2017 Not Rated2008-2: Class A 250,000,000 250,000,000 5.449% Jun 17, 2013 Jun 17, 2016 AAA (sf)2008-2: Class B 13,889,000 13,889,000 6.439% Jun 17, 2013 Jun 17, 2016 A (sf)2008-2: Class C 13,889,000 13,889,000 7.659% Jun 17, 2013 Jun 17, 2016 BBB (sf)2008-2: Enhancement Notes 12,916,251 12,916,251 Not Available Mar 17, 2017 Mar 17, 2017 Not Rated
Month Pool Balance Debt Balance Net Loss Rate Payment Rate Gross YieldSep-2010 1,759,016,543 1,322,821,602 -0.04% 14.33% 21.06%Aug-2010 2,027,317,854 1,322,821,602 11.02% 18.56% 22.81%Jul-2010 2,061,894,249 1,925,194,869 10.45% 17.53% 22.43%Jun-2010 2,099,724,162 1,925,194,869 11.38% 17.25% 22.67%May-2010 2,143,563,637 1,925,194,869 9.55% 15.95% 20.67%Apr-2010 2,178,612,746 1,925,194,869 10.93% 16.33% 22.37%Mar-2010 2,206,907,417 1,925,194,869 12.01% 16.19% 22.82%Feb-2010 2,245,250,591 1,925,194,869 10.57% 15.19% 19.50%Jan-2010 2,308,542,006 1,925,194,869 11.52% 16.26% 22.32%Dec-2009 2,357,028,914 1,925,194,869 9.89% 15.40% 20.46%Nov-2009 2,352,575,359 1,925,194,869 11.22% 15.04% 21.25%Oct-2009 2,374,933,967 1,925,194,869 9.62% 16.76% 21.58%
MonthDelinquency(30-59 Days)
Delinquency(60-89 Days)
Delinquency(90+ Days)
Sep-2010 1.13% 0.00% 0.00%Aug-2010 2.25% 1.44% 2.85%Jul-2010 2.21% 1.41% 2.80%Jun-2010 2.27% 1.35% 2.80%May-2010 2.07% 1.32% 2.79%Apr-2010 2.09% 1.44% 2.77%Mar-2010 2.35% 1.42% 2.84%Feb-2010 2.20% 1.43% 2.76%Jan-2010 2.06% 1.34% 2.71%Dec-2009 2.04% 1.33% 2.65%Nov-2009 2.10% 1.32% 2.73%Oct-2009 2.04% 1.36% 2.73%
28
Credit Cards
September 2010
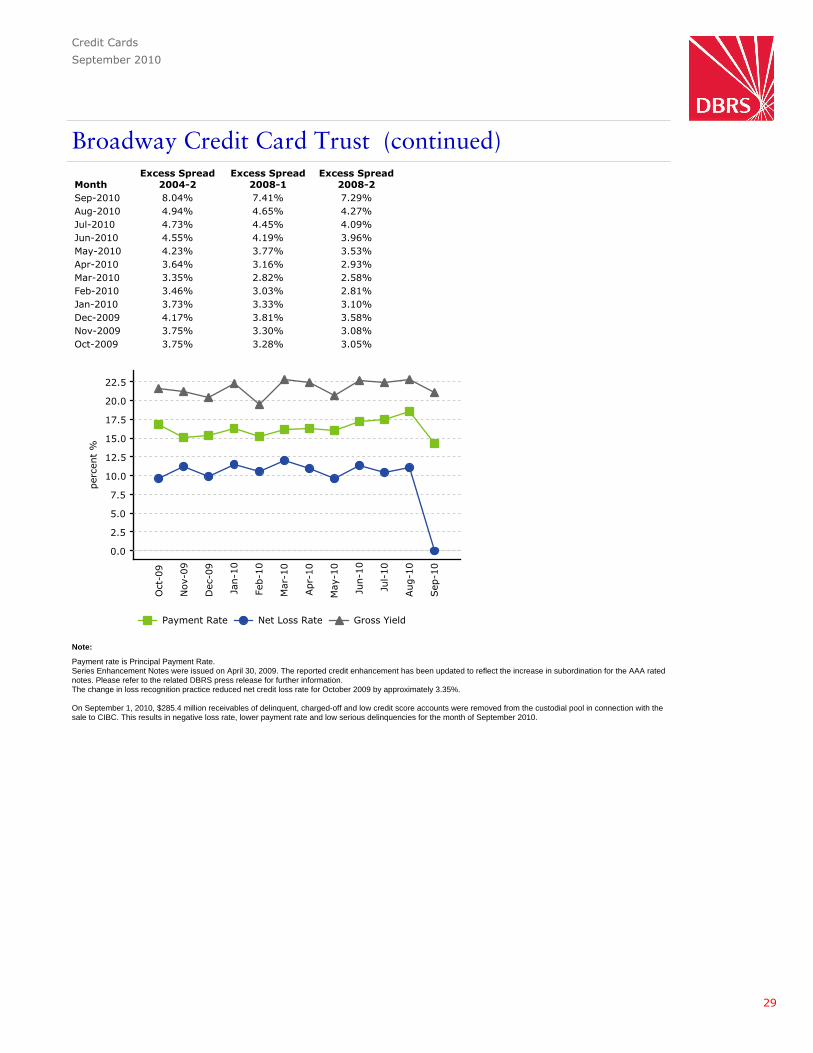
Broadway Credit Card Trust (continued)
Payment rate is Principal Payment Rate.Series Enhancement Notes were issued on April 30, 2009. The reported credit enhancement has been updated to reflect the increase in subordination for the AAA ratednotes. Please refer to the related DBRS press release for further information.The change in loss recognition practice reduced net credit loss rate for October 2009 by approximately 3.35%.
On September 1, 2010, $285.4 million receivables of delinquent, charged-off and low credit score accounts were removed from the custodial pool in connection with thesale to CIBC. This results in negative loss rate, lower payment rate and low serious delinquencies for the month of September 2010.
Note:
MonthExcess Spread
2004-2Excess Spread
2008-1Excess Spread
2008-2Sep-2010 8.04% 7.41% 7.29%Aug-2010 4.94% 4.65% 4.27%Jul-2010 4.73% 4.45% 4.09%Jun-2010 4.55% 4.19% 3.96%May-2010 4.23% 3.77% 3.53%Apr-2010 3.64% 3.16% 2.93%Mar-2010 3.35% 2.82% 2.58%Feb-2010 3.46% 3.03% 2.81%Jan-2010 3.73% 3.33% 3.10%Dec-2009 4.17% 3.81% 3.58%Nov-2009 3.75% 3.30% 3.08%Oct-2009 3.75% 3.28% 3.05%
29
Credit Cards
September 2010
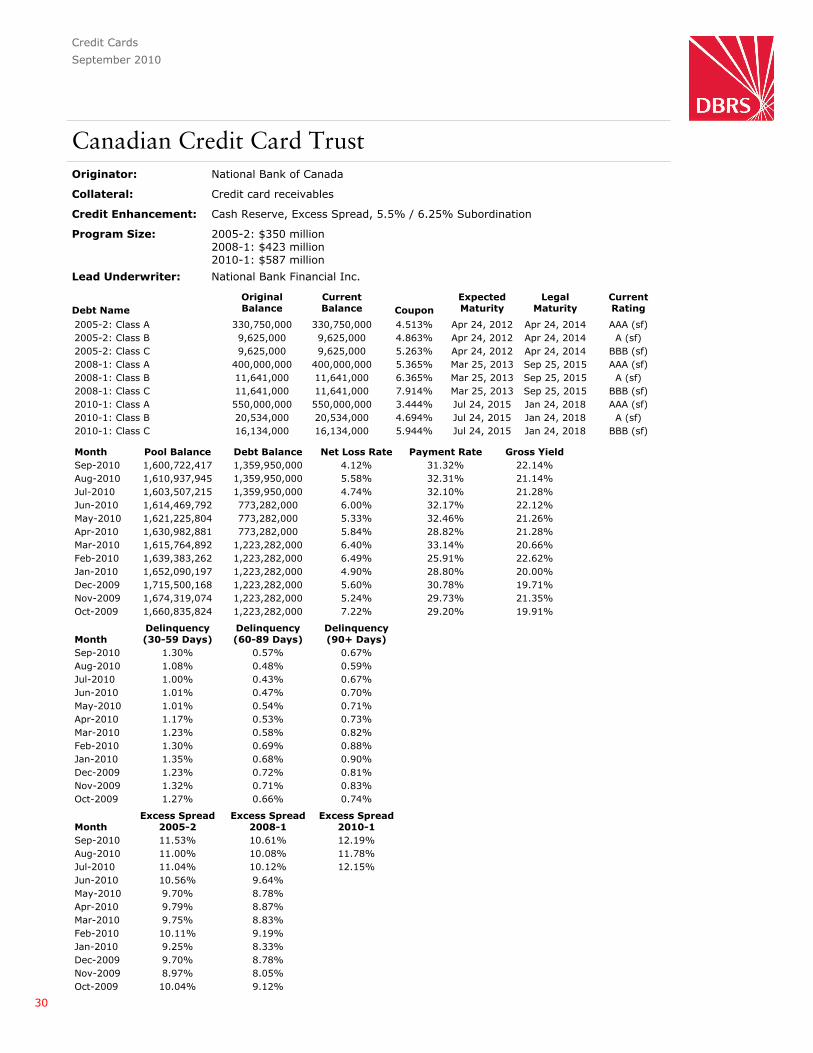
Canadian Credit Card TrustOriginator: National Bank of Canada
Collateral: Credit card receivables
Credit Enhancement: Cash Reserve, Excess Spread, 5.5% / 6.25% Subordination
Program Size: 2005-2: $350 million2008-1: $423 million2010-1: $587 million
Lead Underwriter: National Bank Financial Inc.
Debt NameOriginalBalance
CurrentBalance Coupon
ExpectedMaturity
LegalMaturity
CurrentRating
2005-2: Class A 330,750,000 330,750,000 4.513% Apr 24, 2012 Apr 24, 2014 AAA (sf)2005-2: Class B 9,625,000 9,625,000 4.863% Apr 24, 2012 Apr 24, 2014 A (sf)2005-2: Class C 9,625,000 9,625,000 5.263% Apr 24, 2012 Apr 24, 2014 BBB (sf)2008-1: Class A 400,000,000 400,000,000 5.365% Mar 25, 2013 Sep 25, 2015 AAA (sf)2008-1: Class B 11,641,000 11,641,000 6.365% Mar 25, 2013 Sep 25, 2015 A (sf)2008-1: Class C 11,641,000 11,641,000 7.914% Mar 25, 2013 Sep 25, 2015 BBB (sf)2010-1: Class A 550,000,000 550,000,000 3.444% Jul 24, 2015 Jan 24, 2018 AAA (sf)2010-1: Class B 20,534,000 20,534,000 4.694% Jul 24, 2015 Jan 24, 2018 A (sf)2010-1: Class C 16,134,000 16,134,000 5.944% Jul 24, 2015 Jan 24, 2018 BBB (sf)
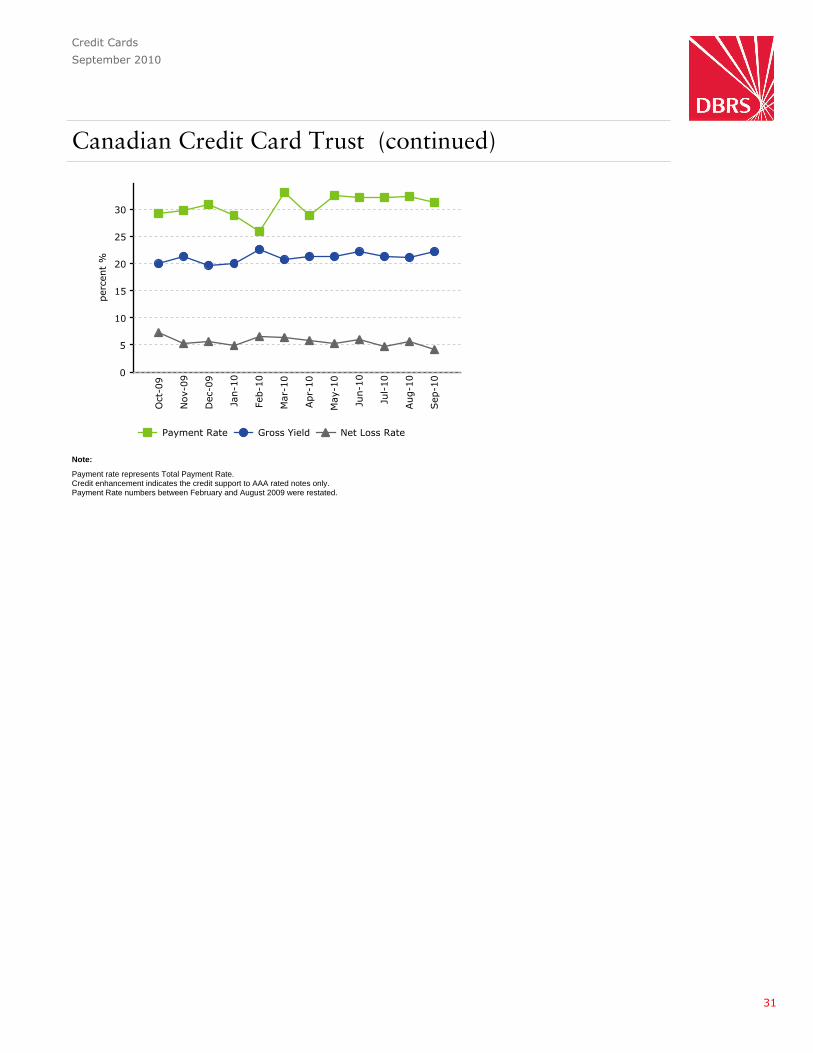
Month Pool Balance Debt Balance Net Loss Rate Payment Rate Gross YieldSep-2010 1,600,722,417 1,359,950,000 4.12% 31.32% 22.14%Aug-2010 1,610,937,945 1,359,950,000 5.58% 32.31% 21.14%Jul-2010 1,603,507,215 1,359,950,000 4.74% 32.10% 21.28%Jun-2010 1,614,469,792 773,282,000 6.00% 32.17% 22.12%May-2010 1,621,225,804 773,282,000 5.33% 32.46% 21.26%Apr-2010 1,630,982,881 773,282,000 5.84% 28.82% 21.28%Mar-2010 1,615,764,892 1,223,282,000 6.40% 33.14% 20.66%Feb-2010 1,639,383,262 1,223,282,000 6.49% 25.91% 22.62%Jan-2010 1,652,090,197 1,223,282,000 4.90% 28.80% 20.00%Dec-2009 1,715,500,168 1,223,282,000 5.60% 30.78% 19.71%Nov-2009 1,674,319,074 1,223,282,000 5.24% 29.73% 21.35%Oct-2009 1,660,835,824 1,223,282,000 7.22% 29.20% 19.91%
MonthDelinquency(30-59 Days)
Delinquency(60-89 Days)
Delinquency(90+ Days)
Sep-2010 1.30% 0.57% 0.67%Aug-2010 1.08% 0.48% 0.59%Jul-2010 1.00% 0.43% 0.67%Jun-2010 1.01% 0.47% 0.70%May-2010 1.01% 0.54% 0.71%Apr-2010 1.17% 0.53% 0.73%Mar-2010 1.23% 0.58% 0.82%Feb-2010 1.30% 0.69% 0.88%Jan-2010 1.35% 0.68% 0.90%Dec-2009 1.23% 0.72% 0.81%Nov-2009 1.32% 0.71% 0.83%Oct-2009 1.27% 0.66% 0.74%
MonthExcess Spread
2005-2Excess Spread
2008-1Excess Spread
2010-1Sep-2010 11.53% 10.61% 12.19%Aug-2010 11.00% 10.08% 11.78%Jul-2010 11.04% 10.12% 12.15%Jun-2010 10.56% 9.64%May-2010 9.70% 8.78%Apr-2010 9.79% 8.87%Mar-2010 9.75% 8.83%Feb-2010 10.11% 9.19%Jan-2010 9.25% 8.33%Dec-2009 9.70% 8.78%Nov-2009 8.97% 8.05%Oct-2009 10.04% 9.12%
30
Credit Cards
September 2010
Canadian Credit Card Trust (continued)
Payment rate represents Total Payment Rate.Credit enhancement indicates the credit support to AAA rated notes only.Payment Rate numbers between February and August 2009 were restated.
Note:
31
Credit Cards
September 2010
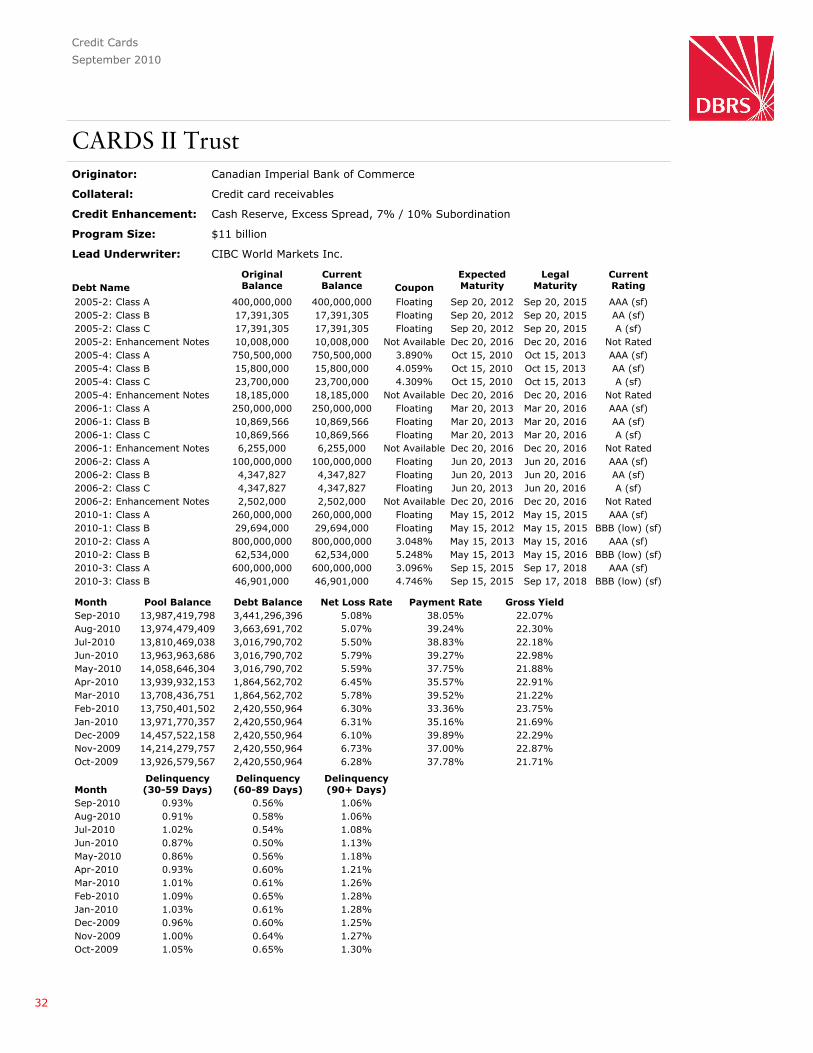
CARDS II TrustOriginator: Canadian Imperial Bank of Commerce
Collateral: Credit card receivables
Credit Enhancement: Cash Reserve, Excess Spread, 7% / 10% Subordination
Program Size: $11 billion
Lead Underwriter: CIBC World Markets Inc.
Debt NameOriginalBalance
CurrentBalance Coupon
ExpectedMaturity
LegalMaturity
CurrentRating
2005-2: Class A 400,000,000 400,000,000 Floating Sep 20, 2012 Sep 20, 2015 AAA (sf)2005-2: Class B 17,391,305 17,391,305 Floating Sep 20, 2012 Sep 20, 2015 AA (sf)2005-2: Class C 17,391,305 17,391,305 Floating Sep 20, 2012 Sep 20, 2015 A (sf)2005-2: Enhancement Notes 10,008,000 10,008,000 Not Available Dec 20, 2016 Dec 20, 2016 Not Rated2005-4: Class A 750,500,000 750,500,000 3.890% Oct 15, 2010 Oct 15, 2013 AAA (sf)2005-4: Class B 15,800,000 15,800,000 4.059% Oct 15, 2010 Oct 15, 2013 AA (sf)2005-4: Class C 23,700,000 23,700,000 4.309% Oct 15, 2010 Oct 15, 2013 A (sf)2005-4: Enhancement Notes 18,185,000 18,185,000 Not Available Dec 20, 2016 Dec 20, 2016 Not Rated2006-1: Class A 250,000,000 250,000,000 Floating Mar 20, 2013 Mar 20, 2016 AAA (sf)2006-1: Class B 10,869,566 10,869,566 Floating Mar 20, 2013 Mar 20, 2016 AA (sf)2006-1: Class C 10,869,566 10,869,566 Floating Mar 20, 2013 Mar 20, 2016 A (sf)2006-1: Enhancement Notes 6,255,000 6,255,000 Not Available Dec 20, 2016 Dec 20, 2016 Not Rated2006-2: Class A 100,000,000 100,000,000 Floating Jun 20, 2013 Jun 20, 2016 AAA (sf)2006-2: Class B 4,347,827 4,347,827 Floating Jun 20, 2013 Jun 20, 2016 AA (sf)2006-2: Class C 4,347,827 4,347,827 Floating Jun 20, 2013 Jun 20, 2016 A (sf)2006-2: Enhancement Notes 2,502,000 2,502,000 Not Available Dec 20, 2016 Dec 20, 2016 Not Rated2010-1: Class A 260,000,000 260,000,000 Floating May 15, 2012 May 15, 2015 AAA (sf)2010-1: Class B 29,694,000 29,694,000 Floating May 15, 2012 May 15, 2015 BBB (low) (sf)2010-2: Class A 800,000,000 800,000,000 3.048% May 15, 2013 May 15, 2016 AAA (sf)2010-2: Class B 62,534,000 62,534,000 5.248% May 15, 2013 May 15, 2016 BBB (low) (sf)2010-3: Class A 600,000,000 600,000,000 3.096% Sep 15, 2015 Sep 17, 2018 AAA (sf)2010-3: Class B 46,901,000 46,901,000 4.746% Sep 15, 2015 Sep 17, 2018 BBB (low) (sf)
Month Pool Balance Debt Balance Net Loss Rate Payment Rate Gross YieldSep-2010 13,987,419,798 3,441,296,396 5.08% 38.05% 22.07%Aug-2010 13,974,479,409 3,663,691,702 5.07% 39.24% 22.30%Jul-2010 13,810,469,038 3,016,790,702 5.50% 38.83% 22.18%Jun-2010 13,963,963,686 3,016,790,702 5.79% 39.27% 22.98%May-2010 14,058,646,304 3,016,790,702 5.59% 37.75% 21.88%Apr-2010 13,939,932,153 1,864,562,702 6.45% 35.57% 22.91%Mar-2010 13,708,436,751 1,864,562,702 5.78% 39.52% 21.22%Feb-2010 13,750,401,502 2,420,550,964 6.30% 33.36% 23.75%Jan-2010 13,971,770,357 2,420,550,964 6.31% 35.16% 21.69%Dec-2009 14,457,522,158 2,420,550,964 6.10% 39.89% 22.29%Nov-2009 14,214,279,757 2,420,550,964 6.73% 37.00% 22.87%Oct-2009 13,926,579,567 2,420,550,964 6.28% 37.78% 21.71%
MonthDelinquency(30-59 Days)
Delinquency(60-89 Days)
Delinquency(90+ Days)
Sep-2010 0.93% 0.56% 1.06%Aug-2010 0.91% 0.58% 1.06%Jul-2010 1.02% 0.54% 1.08%Jun-2010 0.87% 0.50% 1.13%May-2010 0.86% 0.56% 1.18%Apr-2010 0.93% 0.60% 1.21%Mar-2010 1.01% 0.61% 1.26%Feb-2010 1.09% 0.65% 1.28%Jan-2010 1.03% 0.61% 1.28%Dec-2009 0.96% 0.60% 1.25%Nov-2009 1.00% 0.64% 1.27%Oct-2009 1.05% 0.65% 1.30%
32

Credit Cards
September 2010
CARDS II Trust (continued)
Payment rate represents Total Payment Rate.Delinquency Rate buckets are 31-60 days, 61-90 days and 91+ days.Series Enhancement Notes were issued on July 21, 2009. The reported credit enhancement has been updated to reflect the increase in subordination for the AAA ratednotes. Please refer to the related DBRS press release for further information.As of June 25, 2009, Pool Interchange Amount, a component of Gross Yield, includes all interchange generated by the receivables, compared to a previously cappedpercentage.
Note:
MonthExcess Spread
2005-2Excess Spread
2005-4Excess Spread
2006-1Excess Spread
2006-2Excess Spread
2010-1Excess Spread
2010-2Sep-2010 14.00% 0.99% 14.01% 14.04% 13.45% 11.80%Aug-2010 14.21% 3.14% 14.21% 14.24% 13.62% 11.85%Jul-2010 14.02% 5.34% 14.03% 14.06% 13.81% 12.38%Jun-2010 13.80% 6.90% 13.81% 13.84% 13.90% 12.67%May-2010 13.45% 8.20% 13.46% 13.49% 14.29% 13.63%Apr-2010 13.40% 9.35% 13.40% 13.43%Mar-2010 13.32% 10.01% 13.33% 13.36%Feb-2010 13.52% 10.20% 13.53% 13.56%Jan-2010 13.34% 9.95% 13.35% 13.38%Dec-2009 13.31% 9.92% 13.32% 13.35%Nov-2009 13.26% 9.91% 13.27% 13.30%Oct-2009 13.26% 9.88% 13.27% 13.30%
MonthExcess Spread
2010-3Sep-2010 13.10%Aug-2010 14.64%Jul-2010Jun-2010May-2010Apr-2010Mar-2010Feb-2010Jan-2010Dec-2009Nov-2009Oct-2009
33
Credit Cards
September 2010
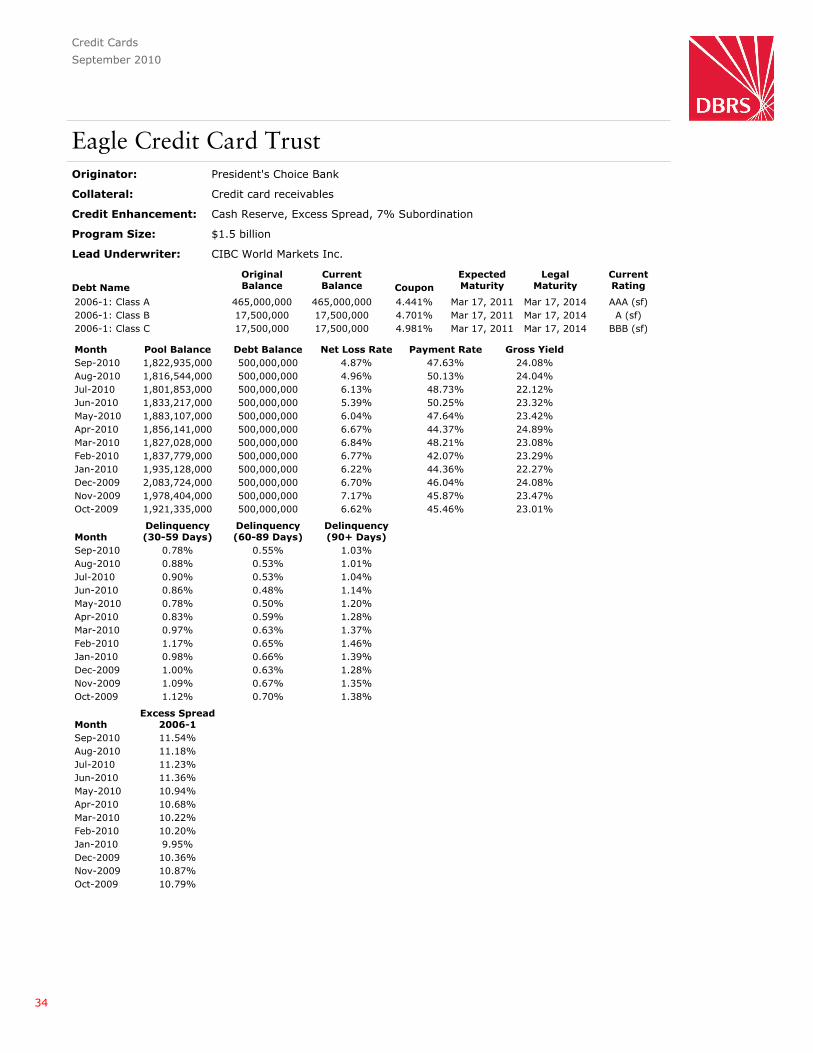
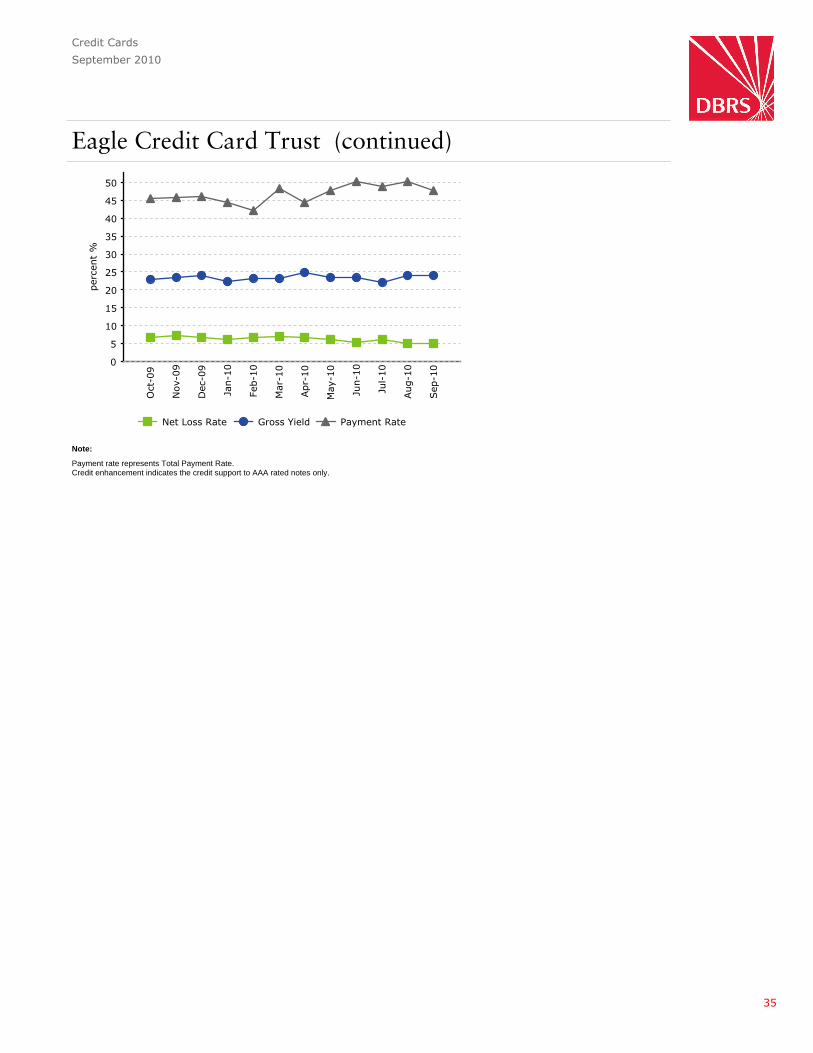
Eagle Credit Card TrustOriginator: President's Choice Bank
Collateral: Credit card receivables
Credit Enhancement: Cash Reserve, Excess Spread, 7% Subordination
Program Size: $1.5 billion
Lead Underwriter: CIBC World Markets Inc.
Debt NameOriginalBalance
CurrentBalance Coupon
ExpectedMaturity
LegalMaturity
CurrentRating
2006-1: Class A 465,000,000 465,000,000 4.441% Mar 17, 2011 Mar 17, 2014 AAA (sf)2006-1: Class B 17,500,000 17,500,000 4.701% Mar 17, 2011 Mar 17, 2014 A (sf)2006-1: Class C 17,500,000 17,500,000 4.981% Mar 17, 2011 Mar 17, 2014 BBB (sf)
Month Pool Balance Debt Balance Net Loss Rate Payment Rate Gross YieldSep-2010 1,822,935,000 500,000,000 4.87% 47.63% 24.08%Aug-2010 1,816,544,000 500,000,000 4.96% 50.13% 24.04%Jul-2010 1,801,853,000 500,000,000 6.13% 48.73% 22.12%Jun-2010 1,833,217,000 500,000,000 5.39% 50.25% 23.32%May-2010 1,883,107,000 500,000,000 6.04% 47.64% 23.42%Apr-2010 1,856,141,000 500,000,000 6.67% 44.37% 24.89%Mar-2010 1,827,028,000 500,000,000 6.84% 48.21% 23.08%Feb-2010 1,837,779,000 500,000,000 6.77% 42.07% 23.29%Jan-2010 1,935,128,000 500,000,000 6.22% 44.36% 22.27%Dec-2009 2,083,724,000 500,000,000 6.70% 46.04% 24.08%Nov-2009 1,978,404,000 500,000,000 7.17% 45.87% 23.47%Oct-2009 1,921,335,000 500,000,000 6.62% 45.46% 23.01%
MonthDelinquency(30-59 Days)
Delinquency(60-89 Days)
Delinquency(90+ Days)
Sep-2010 0.78% 0.55% 1.03%Aug-2010 0.88% 0.53% 1.01%Jul-2010 0.90% 0.53% 1.04%Jun-2010 0.86% 0.48% 1.14%May-2010 0.78% 0.50% 1.20%Apr-2010 0.83% 0.59% 1.28%Mar-2010 0.97% 0.63% 1.37%Feb-2010 1.17% 0.65% 1.46%Jan-2010 0.98% 0.66% 1.39%Dec-2009 1.00% 0.63% 1.28%Nov-2009 1.09% 0.67% 1.35%Oct-2009 1.12% 0.70% 1.38%
MonthExcess Spread
2006-1Sep-2010 11.54%Aug-2010 11.18%Jul-2010 11.23%Jun-2010 11.36%May-2010 10.94%Apr-2010 10.68%Mar-2010 10.22%Feb-2010 10.20%Jan-2010 9.95%Dec-2009 10.36%Nov-2009 10.87%Oct-2009 10.79%
34
Credit Cards
September 2010
Eagle Credit Card Trust (continued)
Payment rate represents Total Payment Rate.Credit enhancement indicates the credit support to AAA rated notes only.
Note:
35
Credit Cards
September 2010
Glacier Credit Card TrustOriginator: Canadian Tire Bank
Collateral: Credit card receivables
Credit Enhancement: Excess Spread, 5.5% Overcollateralization, 5.5% Subordination
Program Size: $3 billion
Lead Underwriter: TD Securities Inc.BMO Capital MarketsCIBC World Markets Inc.RBC Capital Markets Inc.Scotia Capital Inc.
Debt NameOriginalBalance
CurrentBalance Coupon
ExpectedMaturity
LegalMaturity
CurrentRating
2005-1: Senior 344,925,000 344,925,000 4.187% Nov 19, 2010 Nov 19, 2016 AAA (sf)2005-1: Subordinated 20,075,000 20,075,000 4.507% Nov 19, 2010 Nov 19, 2016 A (sf)2006-1: Senior 300,000,000 300,000,000 4.271% Nov 18, 2011 Nov 18, 2017 AAA (sf)2006-1: Subordinated 17,460,000 17,460,000 4.571% Nov 18, 2011 Nov 18, 2017 A (sf)2006-2: Senior 238,650,000 238,650,000 4.405% May 20, 2014 May 20, 2020 AAA (sf)2006-2: Subordinated 13,890,000 13,890,000 4.765% May 20, 2014 May 20, 2020 A (sf)2008-1: Senior 600,000,000 600,000,000 5.027% Feb 20, 2013 Feb 20, 2019 AAA (sf)2008-1: Subordinated 34,930,000 34,930,000 6.027% Feb 20, 2013 Feb 20, 2019 A (sf)
Month Pool Balance Debt Balance Net Loss Rate Payment Rate Gross YieldSep-2010 3,899,697,562 1,569,930,000 7.21% 24.94% 20.50%Aug-2010 3,929,148,675 1,569,930,000 6.91% 25.66% 21.36%Jul-2010 3,926,905,904 1,569,930,000 7.50% 25.68% 20.36%Jun-2010 3,960,391,398 1,569,930,000 8.15% 26.05% 20.81%May-2010 3,975,537,280 1,569,930,000 7.82% 25.53% 20.28%Apr-2010 3,964,533,038 1,569,930,000 7.66% 23.62% 20.68%Mar-2010 3,923,809,265 1,569,930,000 7.98% 26.00% 19.63%Feb-2010 3,934,165,014 1,569,930,000 7.52% 21.79% 20.48%Jan-2010 3,930,632,318 1,569,930,000 7.60% 24.88% 20.55%Dec-2009 4,029,441,797 1,569,930,000 7.67% 26.46% 21.02%Nov-2009 3,944,673,727 1,569,930,000 8.10% 24.71% 21.16%Oct-2009 3,895,772,662 2,194,930,000 8.28% 25.70% 20.41%
MonthDelinquency(30-59 Days)
Delinquency(60-89 Days)
Delinquency(90+ Days)
Sep-2010 1.44% 0.89% 1.54%Aug-2010 1.51% 0.80% 1.53%Jul-2010 1.39% 0.80% 1.51%Jun-2010 1.33% 0.75% 1.58%May-2010 1.28% 0.77% 1.67%Apr-2010 1.34% 0.82% 1.72%Mar-2010 1.45% 0.87% 1.77%Feb-2010 1.60% 0.95% 1.81%Jan-2010 1.54% 0.89% 1.82%Dec-2009 1.37% 0.86% 1.78%Nov-2009 1.37% 0.90% 1.82%Oct-2009 1.48% 0.92% 1.86%
36

Credit Cards
September 2010
Glacier Credit Card Trust (continued)
Series 1997-1 (ABCP) is reported in the Monthly Canadian ABCP Report. Series 1997-1 is not entitled to interchange.Payment rate represents Total Payment Rate.Delinquency Rate buckets are 31-60 days, 61-90 days and 91+ daysCredit enhancement indicates the credit support to AAA rated notes only.
Note:
MonthExcess Spread
2005-1Excess Spread
2006-1Excess Spread
2006-2Excess Spread
2008-1Sep-2010 11.59% 9.21% 9.08% 8.42%Aug-2010 9.08% 9.01% 8.87% 8.22%Jul-2010 8.44% 8.35% 8.21% 7.56%Jun-2010 8.54% 8.44% 8.31% 7.65%May-2010 8.20% 8.10% 7.97% 7.31%Apr-2010 8.35% 8.26% 8.13% 7.46%Mar-2010 8.25% 8.16% 8.03% 7.37%Feb-2010 8.87% 8.79% 8.65% 7.99%Jan-2010 8.93% 8.85% 8.71% 8.06%Dec-2009 8.77% 8.69% 8.55% 7.90%Nov-2009 8.43% 8.34% 8.21% 7.55%Oct-2009 8.37% 8.28% 8.15% 7.49%
37
Credit Cards
September 2010
Gloucester Credit Card TrustOriginator: MBNA Canada Bank
Collateral: Credit card receivables
Credit Enhancement: Excess Spread, 15.5% / 14% / 11.5% Subordination
Program Size: 2004-1: $300 million2006-1: $500 million2006-2: $349 million2008-1: $452 million
Lead Underwriter: BMO Capital MarketsTD Securities Inc.CIBC World Markets Inc.RBC Capital Markets Inc.Scotia Capital Inc.
Debt NameOriginalBalance
CurrentBalance Coupon
ExpectedMaturity
LegalMaturity
CurrentRating
2004-1: Class A 253,500,000 253,500,000 5.376% May 15, 2014 Dec 15, 2017 AAA (sf)2004-1: Collateral 46,500,000 46,500,000 6.486% May 15, 2014 Dec 15, 2017 BBB (sf)2006-1: Class A 422,500,000 422,500,000 4.445% Mar 15, 2011 Oct 15, 2014 AAA (sf)2006-1: Collateral 77,500,000 77,500,000 4.994% Mar 15, 2011 Oct 15, 2014 BBB (sf)2006-2: Class A 300,000,000 300,000,000 Floating Nov 15, 2013 Jun 15, 2017 AAA (sf)2006-2: Collateral 49,000,000 49,000,000 4.909% Nov 15, 2013 Jun 15, 2017 BBB (sf)2008-1: Class A 400,000,000 400,000,000 5.34% May 15, 2013 Dec 15, 2016 AA (sf)2008-1: Collateral 52,000,000 52,000,000 7.33% May 15, 2013 Dec 15, 2016 BBB (sf)
Month Pool Balance Debt Balance Gross Loss Rate Payment Rate Gross YieldSep-2010 4,211,443,090 1,601,000,000 5.48% 13.70% 16.23%Aug-2010 4,247,018,950 1,601,000,000 5.95% 14.71% 18.51%Jul-2010 4,287,687,517 1,601,000,000 6.04% 13.69% 16.65%Jun-2010 4,270,954,702 1,601,000,000 6.16% 14.52% 17.26%May-2010 4,295,755,476 2,201,000,000 6.39% 13.03% 16.89%Apr-2010 4,723,350,957 2,201,000,000 7.00% 12.77% 16.75%Mar-2010 4,769,045,970 2,201,000,000 6.14% 13.43% 18.11%Feb-2010 4,848,652,901 2,201,000,000 6.67% 11.89% 16.24%Jan-2010 4,937,455,235 2,201,000,000 6.68% 12.65% 16.16%Dec-2009 5,062,813,080 2,201,000,000 7.01% 12.30% 16.17%Nov-2009 5,123,412,470 2,201,000,000 5.79% 12.05% 16.90%Oct-2009 5,219,024,814 2,201,000,000 6.29% 11.72% 16.27%
MonthDelinquency(30-59 Days)
Delinquency(60-89 Days)
Delinquency(90+ Days)
Sep-2010 1.58% 0.54% 2.04%Aug-2010 1.50% 0.82% 1.75%Jul-2010 1.50% 0.84% 1.76%Jun-2010 1.55% 0.84% 1.79%May-2010 1.45% 0.83% 1.86%Apr-2010 1.56% 1.04% 2.10%Mar-2010 1.78% 1.03% 2.08%Feb-2010 1.92% 1.09% 1.90%Jan-2010 1.78% 1.06% 1.72%Dec-2009 1.76% 0.94% 1.57%Nov-2009 1.61% 0.80% 1.59%Oct-2009 1.35% 0.78% 1.50%
38
Credit Cards
September 2010
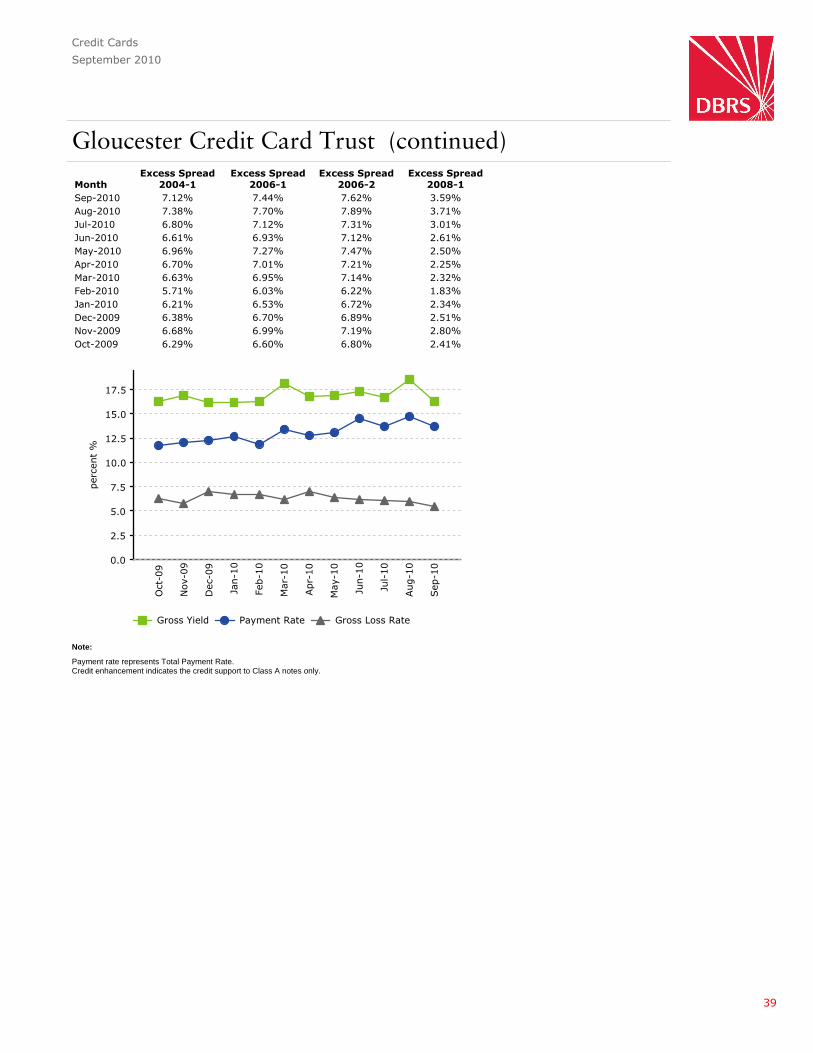
Gloucester Credit Card Trust (continued)
Payment rate represents Total Payment Rate.Credit enhancement indicates the credit support to Class A notes only.
Note:
MonthExcess Spread
2004-1Excess Spread
2006-1Excess Spread
2006-2Excess Spread
2008-1Sep-2010 7.12% 7.44% 7.62% 3.59%Aug-2010 7.38% 7.70% 7.89% 3.71%Jul-2010 6.80% 7.12% 7.31% 3.01%Jun-2010 6.61% 6.93% 7.12% 2.61%May-2010 6.96% 7.27% 7.47% 2.50%Apr-2010 6.70% 7.01% 7.21% 2.25%Mar-2010 6.63% 6.95% 7.14% 2.32%Feb-2010 5.71% 6.03% 6.22% 1.83%Jan-2010 6.21% 6.53% 6.72% 2.34%Dec-2009 6.38% 6.70% 6.89% 2.51%Nov-2009 6.68% 6.99% 7.19% 2.80%Oct-2009 6.29% 6.60% 6.80% 2.41%
39
Credit Cards
September 2010
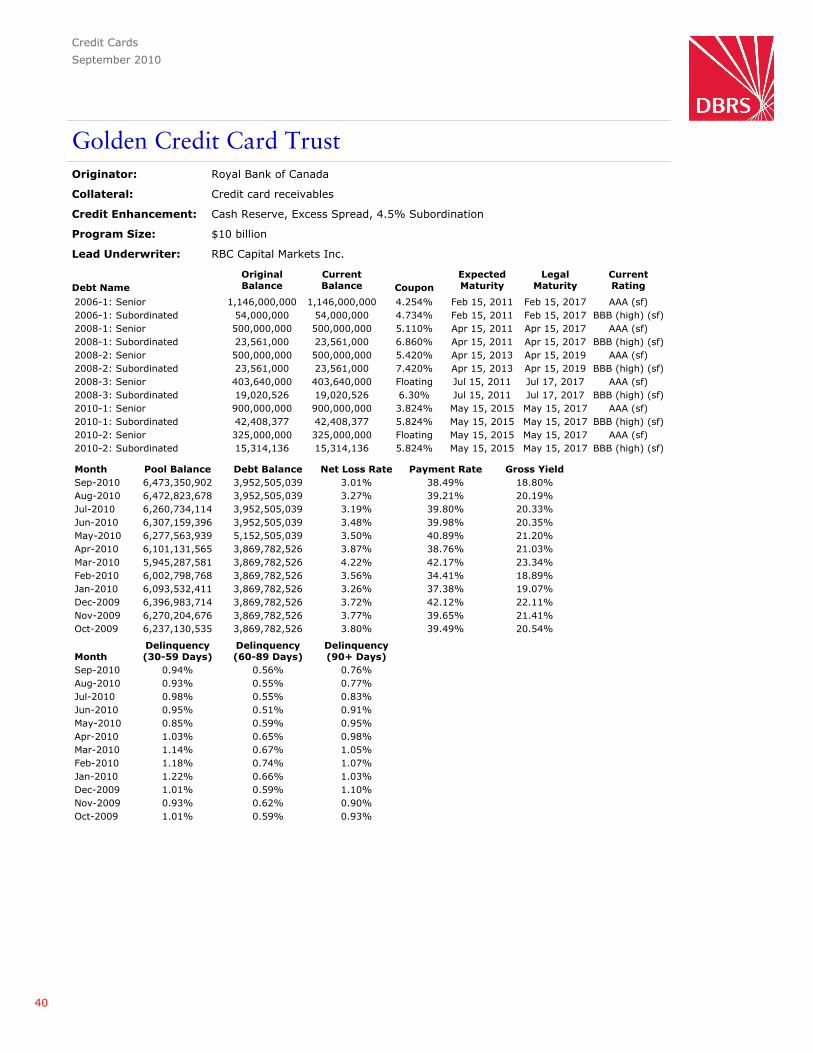
Golden Credit Card TrustOriginator: Royal Bank of Canada
Collateral: Credit card receivables
Credit Enhancement: Cash Reserve, Excess Spread, 4.5% Subordination
Program Size: $10 billion
Lead Underwriter: RBC Capital Markets Inc.
Debt NameOriginalBalance
CurrentBalance Coupon
ExpectedMaturity
LegalMaturity
CurrentRating
2006-1: Senior 1,146,000,000 1,146,000,000 4.254% Feb 15, 2011 Feb 15, 2017 AAA (sf)2006-1: Subordinated 54,000,000 54,000,000 4.734% Feb 15, 2011 Feb 15, 2017 BBB (high) (sf)2008-1: Senior 500,000,000 500,000,000 5.110% Apr 15, 2011 Apr 15, 2017 AAA (sf)2008-1: Subordinated 23,561,000 23,561,000 6.860% Apr 15, 2011 Apr 15, 2017 BBB (high) (sf)2008-2: Senior 500,000,000 500,000,000 5.420% Apr 15, 2013 Apr 15, 2019 AAA (sf)2008-2: Subordinated 23,561,000 23,561,000 7.420% Apr 15, 2013 Apr 15, 2019 BBB (high) (sf)2008-3: Senior 403,640,000 403,640,000 Floating Jul 15, 2011 Jul 17, 2017 AAA (sf)2008-3: Subordinated 19,020,526 19,020,526 6.30% Jul 15, 2011 Jul 17, 2017 BBB (high) (sf)2010-1: Senior 900,000,000 900,000,000 3.824% May 15, 2015 May 15, 2017 AAA (sf)2010-1: Subordinated 42,408,377 42,408,377 5.824% May 15, 2015 May 15, 2017 BBB (high) (sf)2010-2: Senior 325,000,000 325,000,000 Floating May 15, 2015 May 15, 2017 AAA (sf)2010-2: Subordinated 15,314,136 15,314,136 5.824% May 15, 2015 May 15, 2017 BBB (high) (sf)
Month Pool Balance Debt Balance Net Loss Rate Payment Rate Gross YieldSep-2010 6,473,350,902 3,952,505,039 3.01% 38.49% 18.80%Aug-2010 6,472,823,678 3,952,505,039 3.27% 39.21% 20.19%Jul-2010 6,260,734,114 3,952,505,039 3.19% 39.80% 20.33%Jun-2010 6,307,159,396 3,952,505,039 3.48% 39.98% 20.35%May-2010 6,277,563,939 5,152,505,039 3.50% 40.89% 21.20%Apr-2010 6,101,131,565 3,869,782,526 3.87% 38.76% 21.03%Mar-2010 5,945,287,581 3,869,782,526 4.22% 42.17% 23.34%Feb-2010 6,002,798,768 3,869,782,526 3.56% 34.41% 18.89%Jan-2010 6,093,532,411 3,869,782,526 3.26% 37.38% 19.07%Dec-2009 6,396,983,714 3,869,782,526 3.72% 42.12% 22.11%Nov-2009 6,270,204,676 3,869,782,526 3.77% 39.65% 21.41%Oct-2009 6,237,130,535 3,869,782,526 3.80% 39.49% 20.54%
MonthDelinquency(30-59 Days)
Delinquency(60-89 Days)
Delinquency(90+ Days)
Sep-2010 0.94% 0.56% 0.76%Aug-2010 0.93% 0.55% 0.77%Jul-2010 0.98% 0.55% 0.83%Jun-2010 0.95% 0.51% 0.91%May-2010 0.85% 0.59% 0.95%Apr-2010 1.03% 0.65% 0.98%Mar-2010 1.14% 0.67% 1.05%Feb-2010 1.18% 0.74% 1.07%Jan-2010 1.22% 0.66% 1.03%Dec-2009 1.01% 0.59% 1.10%Nov-2009 0.93% 0.62% 0.90%Oct-2009 1.01% 0.59% 0.93%
40
Credit Cards
September 2010
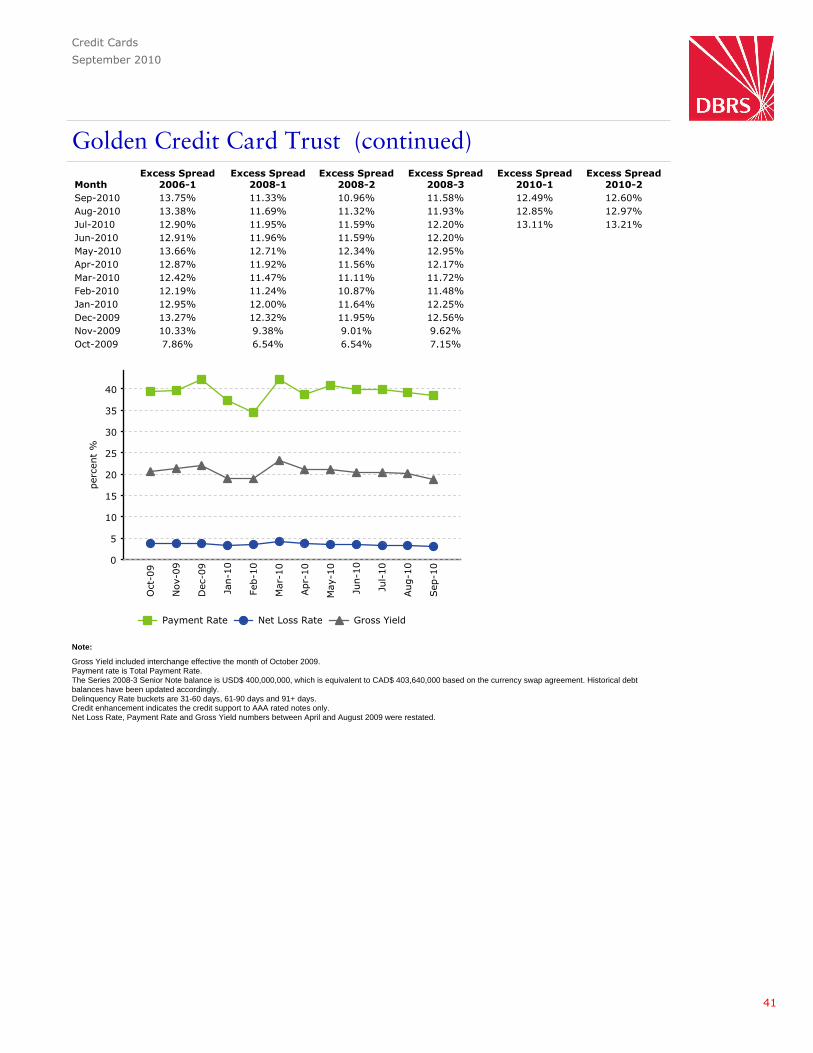
Golden Credit Card Trust (continued)
Gross Yield included interchange effective the month of October 2009.Payment rate is Total Payment Rate.The Series 2008-3 Senior Note balance is USD$ 400,000,000, which is equivalent to CAD$ 403,640,000 based on the currency swap agreement. Historical debtbalances have been updated accordingly.Delinquency Rate buckets are 31-60 days, 61-90 days and 91+ days.Credit enhancement indicates the credit support to AAA rated notes only.Net Loss Rate, Payment Rate and Gross Yield numbers between April and August 2009 were restated.
Note:
MonthExcess Spread
2006-1Excess Spread
2008-1Excess Spread
2008-2Excess Spread
2008-3Excess Spread
2010-1Excess Spread
2010-2Sep-2010 13.75% 11.33% 10.96% 11.58% 12.49% 12.60%Aug-2010 13.38% 11.69% 11.32% 11.93% 12.85% 12.97%Jul-2010 12.90% 11.95% 11.59% 12.20% 13.11% 13.21%Jun-2010 12.91% 11.96% 11.59% 12.20%May-2010 13.66% 12.71% 12.34% 12.95%Apr-2010 12.87% 11.92% 11.56% 12.17%Mar-2010 12.42% 11.47% 11.11% 11.72%Feb-2010 12.19% 11.24% 10.87% 11.48%Jan-2010 12.95% 12.00% 11.64% 12.25%Dec-2009 13.27% 12.32% 11.95% 12.56%Nov-2009 10.33% 9.38% 9.01% 9.62%Oct-2009 7.86% 6.54% 6.54% 7.15%
41

Credit Cards
September 2010
Master Credit Card TrustOriginator: Bank of Montreal
Collateral: Credit card receivables
Credit Enhancement: Cash Reserve, Excess Spread, 4.5% Subordination
Program Size: $3 billion
Lead Underwriter: BMO Capital Markets
Debt NameOriginalBalance
CurrentBalance Coupon
ExpectedMaturity
LegalMaturity
CurrentRating
2006-2: Class A 955,000,000 955,000,000 4.444% Nov 21, 2011 May 21, 2013 AAA (sf)2006-2: Class B 22,500,000 22,500,000 4.594% Nov 21, 2011 May 21, 2013 A (sf)2006-2: Class C 22,500,000 22,500,000 4.744% Nov 21, 2011 May 21, 2013 BBB (sf)2006-3: Class A 231,250,000 231,250,000 Floating Nov 21, 2011 May 21, 2013 AAA (sf)2006-3: Class B 9,375,000 9,375,000 Floating Nov 21, 2011 May 21, 2013 A (sf)2006-3: Class C 9,375,000 9,375,000 Floating Nov 21, 2011 May 21, 2013 BBB (sf)2008-1: Class A 525,000,000 525,000,000 5.237% May 21, 2013 Nov 21, 2014 AAA (sf)2008-1: Class B 12,370,000 12,370,000 6.237% May 21, 2013 Nov 21, 2014 A (sf)2008-1: Class C 12,370,000 12,370,000 7.237% May 21, 2013 Nov 21, 2014 BBB (sf)2008-2: Class A 1,000,000,000 1,000,000,000 5.297% Aug 21, 2012 Feb 21, 2014 AAA (sf)2008-2: Class B 23,565,000 23,565,000 6.297% Aug 21, 2012 Feb 21, 2014 A (sf)2008-2: Class C 23,565,000 23,565,000 7.297% Aug 21, 2012 Feb 21, 2014 BBB (sf)2008-3: Class A 1,000,000,000 1,000,000,000 Floating Nov 21, 2012 May 21, 2014 AAA (sf)2008-3: Class B 40,550,000 40,550,000 Floating Nov 21, 2012 May 21, 2014 A (sf)2008-3: Class C 40,550,000 40,550,000 Floating Nov 21, 2012 May 21, 2014 BBB (sf)2008-4: Class A 500,000,000 500,000,000 Floating Nov 21, 2013 May 21, 2015 AAA (sf)2008-4: Class B 20,275,000 20,275,000 Floating Nov 21, 2013 May 21, 2015 A (sf)2008-4: Class C 20,275,000 20,275,000 Floating Nov 21, 2013 May 21, 2015 BBB (sf)
Month Pool Balance Debt Balance Net Loss Rate Payment Rate Gross YieldSep-2010 7,273,809,909 4,468,520,000 3.54% 36.23% 19.98%Aug-2010 7,251,572,952 4,468,520,000 4.37% 36.87% 22.12%Jul-2010 7,271,774,326 4,468,520,000 4.01% 36.47% 21.55%Jun-2010 7,191,165,452 4,468,520,000 4.40% 37.31% 21.73%May-2010 7,193,157,292 4,468,520,000 4.58% 35.76% 21.27%Apr-2010 7,244,208,155 4,468,520,000 4.38% 33.47% 21.15%Mar-2010 6,976,661,857 4,468,520,000 4.58% 37.46% 21.86%Feb-2010 7,137,189,317 4,468,520,000 5.61% 30.35% 20.97%Jan-2010 7,222,046,901 4,468,520,000 4.95% 33.60% 20.59%Dec-2009 7,505,184,487 4,468,520,000 4.40% 37.99% 21.49%Nov-2009 7,212,474,054 4,468,520,000 5.10% 34.62% 21.42%Oct-2009 7,139,109,673 4,718,520,000 4.36% 36.79% 21.26%
MonthDelinquency(30-59 Days)
Delinquency(60-89 Days)
Delinquency(90+ Days)
Sep-2010 1.31% 0.72% 1.13%Aug-2010 1.27% 0.63% 1.13%Jul-2010 1.17% 0.62% 1.13%Jun-2010 1.11% 0.60% 1.15%May-2010 1.12% 0.67% 1.17%Apr-2010 1.19% 0.62% 1.18%Mar-2010 1.24% 0.69% 1.26%Feb-2010 1.39% 0.75% 1.27%Jan-2010 1.38% 0.69% 1.24%Dec-2009 1.19% 0.63% 1.19%Nov-2009 1.16% 0.66% 1.25%Oct-2009 1.24% 0.70% 1.28%
42
Credit Cards
September 2010
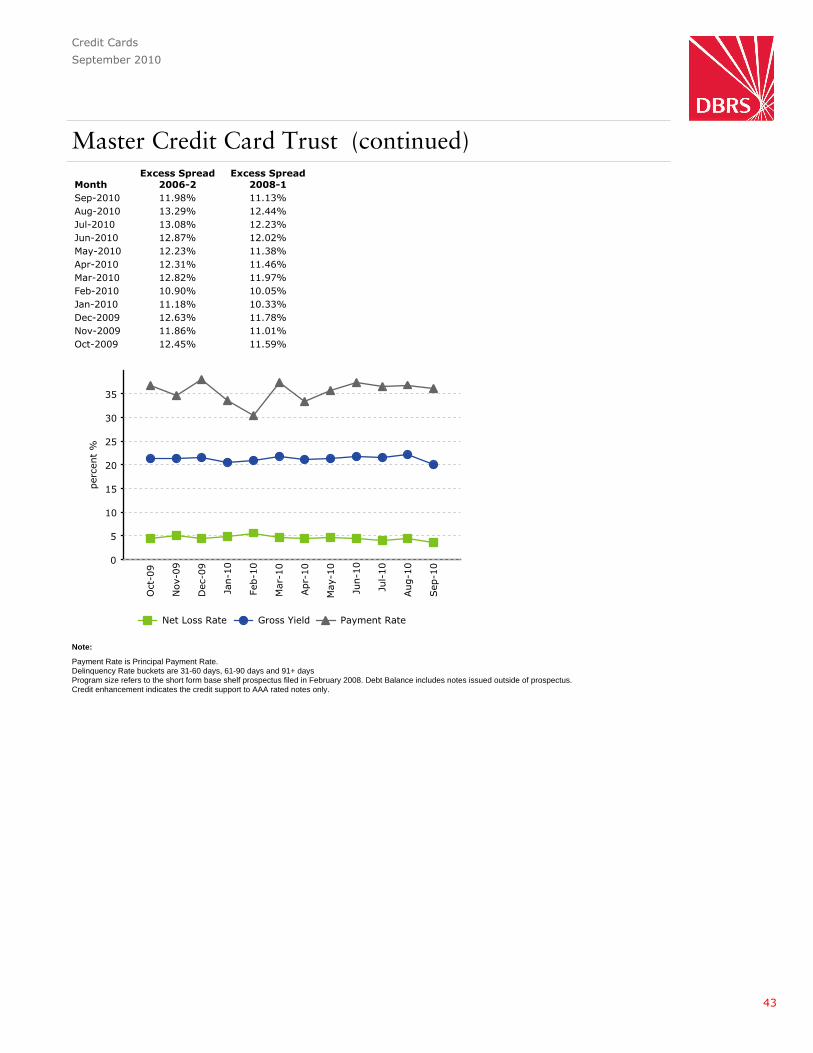
Master Credit Card Trust (continued)
Payment Rate is Principal Payment Rate.Delinquency Rate buckets are 31-60 days, 61-90 days and 91+ daysProgram size refers to the short form base shelf prospectus filed in February 2008. Debt Balance includes notes issued outside of prospectus.Credit enhancement indicates the credit support to AAA rated notes only.
Note:
MonthExcess Spread
2006-2Excess Spread
2008-1Sep-2010 11.98% 11.13%Aug-2010 13.29% 12.44%Jul-2010 13.08% 12.23%Jun-2010 12.87% 12.02%May-2010 12.23% 11.38%Apr-2010 12.31% 11.46%Mar-2010 12.82% 11.97%Feb-2010 10.90% 10.05%Jan-2010 11.18% 10.33%Dec-2009 12.63% 11.78%Nov-2009 11.86% 11.01%Oct-2009 12.45% 11.59%
43
Credit Cards
September 2010
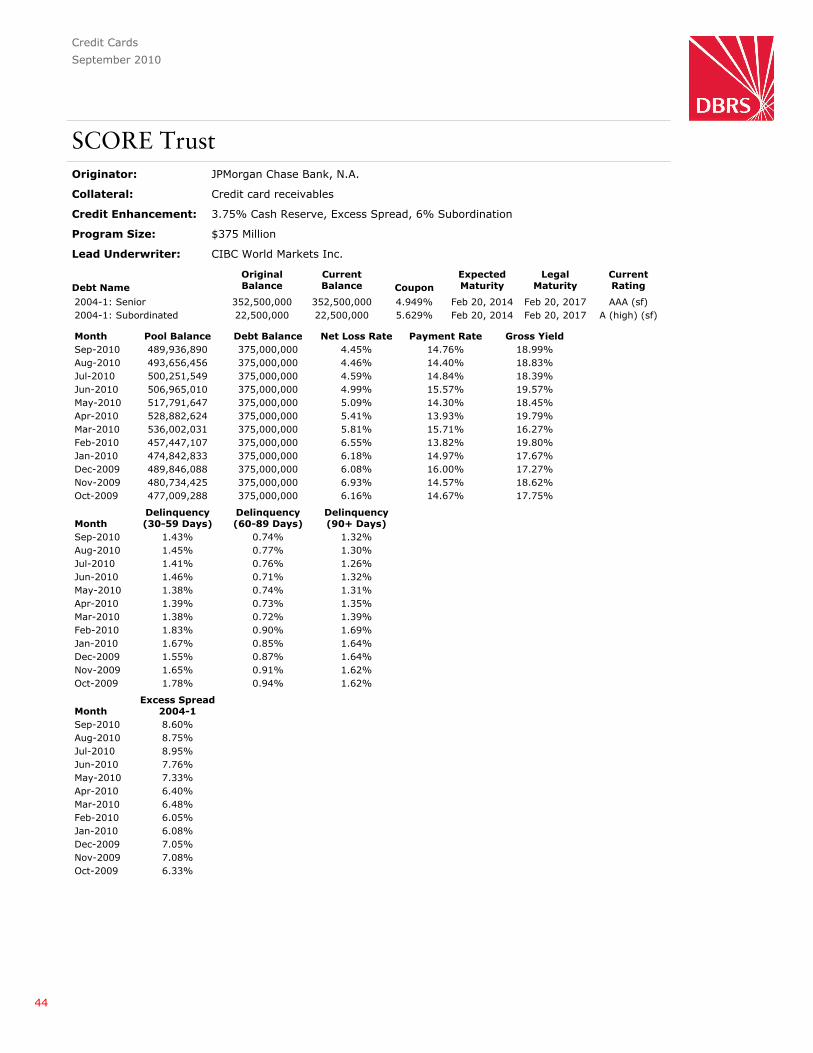
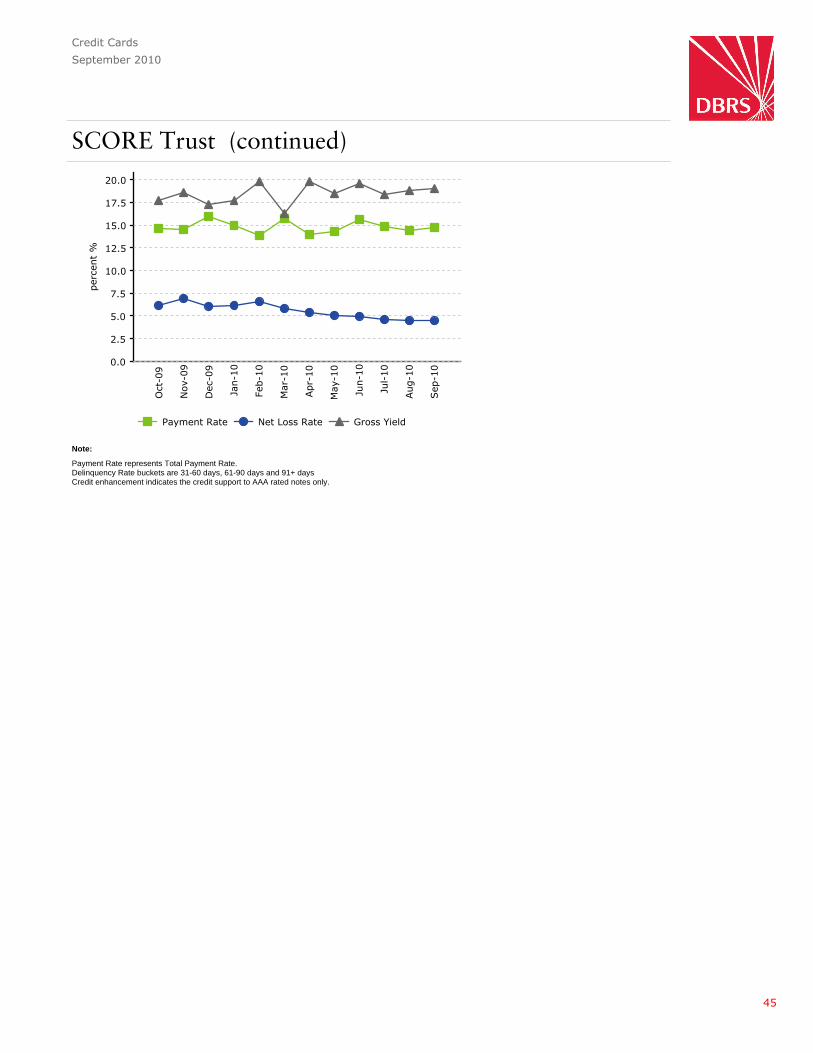
SCORE TrustOriginator: JPMorgan Chase Bank, N.A.
Collateral: Credit card receivables
Credit Enhancement: 3.75% Cash Reserve, Excess Spread, 6% Subordination
Program Size: $375 Million
Lead Underwriter: CIBC World Markets Inc.
Debt NameOriginalBalance
CurrentBalance Coupon
ExpectedMaturity
LegalMaturity
CurrentRating
2004-1: Senior 352,500,000 352,500,000 4.949% Feb 20, 2014 Feb 20, 2017 AAA (sf)2004-1: Subordinated 22,500,000 22,500,000 5.629% Feb 20, 2014 Feb 20, 2017 A (high) (sf)
Month Pool Balance Debt Balance Net Loss Rate Payment Rate Gross YieldSep-2010 489,936,890 375,000,000 4.45% 14.76% 18.99%Aug-2010 493,656,456 375,000,000 4.46% 14.40% 18.83%Jul-2010 500,251,549 375,000,000 4.59% 14.84% 18.39%Jun-2010 506,965,010 375,000,000 4.99% 15.57% 19.57%May-2010 517,791,647 375,000,000 5.09% 14.30% 18.45%Apr-2010 528,882,624 375,000,000 5.41% 13.93% 19.79%Mar-2010 536,002,031 375,000,000 5.81% 15.71% 16.27%Feb-2010 457,447,107 375,000,000 6.55% 13.82% 19.80%Jan-2010 474,842,833 375,000,000 6.18% 14.97% 17.67%Dec-2009 489,846,088 375,000,000 6.08% 16.00% 17.27%Nov-2009 480,734,425 375,000,000 6.93% 14.57% 18.62%Oct-2009 477,009,288 375,000,000 6.16% 14.67% 17.75%
MonthDelinquency(30-59 Days)
Delinquency(60-89 Days)
Delinquency(90+ Days)
Sep-2010 1.43% 0.74% 1.32%Aug-2010 1.45% 0.77% 1.30%Jul-2010 1.41% 0.76% 1.26%Jun-2010 1.46% 0.71% 1.32%May-2010 1.38% 0.74% 1.31%Apr-2010 1.39% 0.73% 1.35%Mar-2010 1.38% 0.72% 1.39%Feb-2010 1.83% 0.90% 1.69%Jan-2010 1.67% 0.85% 1.64%Dec-2009 1.55% 0.87% 1.64%Nov-2009 1.65% 0.91% 1.62%Oct-2009 1.78% 0.94% 1.62%
MonthExcess Spread
2004-1Sep-2010 8.60%Aug-2010 8.75%Jul-2010 8.95%Jun-2010 7.76%May-2010 7.33%Apr-2010 6.40%Mar-2010 6.48%Feb-2010 6.05%Jan-2010 6.08%Dec-2009 7.05%Nov-2009 7.08%Oct-2009 6.33%
44
Credit Cards
September 2010
SCORE Trust (continued)
Payment Rate represents Total Payment Rate.Delinquency Rate buckets are 31-60 days, 61-90 days and 91+ daysCredit enhancement indicates the credit support to AAA rated notes only.
Note:
45
Lines of Credit
September 2010
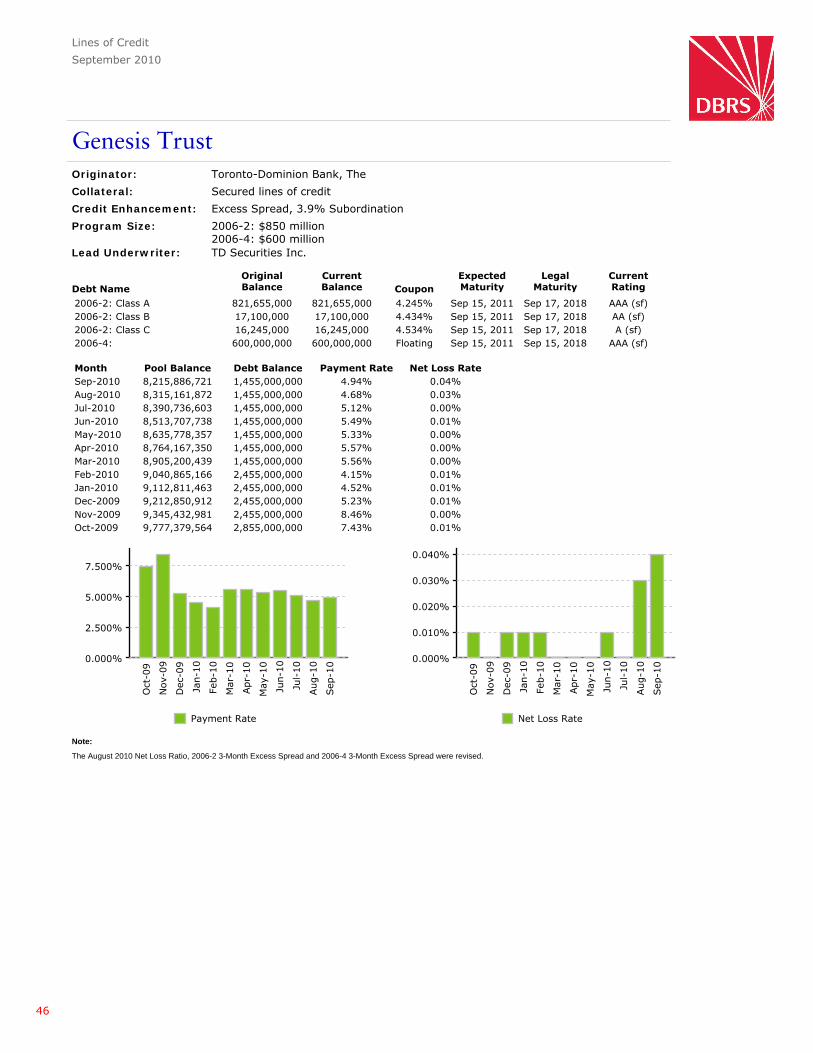
Genesis TrustOriginator: Toronto-Dominion Bank, The
Collateral: Secured lines of credit
Credit Enhancement: Excess Spread, 3.9% Subordination
Program Size: 2006-2: $850 million2006-4: $600 million
Lead Underwriter: TD Securities Inc.
Debt NameOriginalBalance
CurrentBalance Coupon
ExpectedMaturity
LegalMaturity
CurrentRating
2006-2: Class A 821,655,000 821,655,000 4.245% Sep 15, 2011 Sep 17, 2018 AAA (sf)2006-2: Class B 17,100,000 17,100,000 4.434% Sep 15, 2011 Sep 17, 2018 AA (sf)2006-2: Class C 16,245,000 16,245,000 4.534% Sep 15, 2011 Sep 17, 2018 A (sf)2006-4: 600,000,000 600,000,000 Floating Sep 15, 2011 Sep 15, 2018 AAA (sf)
Month Pool Balance Debt Balance Payment Rate Net Loss RateSep-2010 8,215,886,721 1,455,000,000 4.94% 0.04%Aug-2010 8,315,161,872 1,455,000,000 4.68% 0.03%Jul-2010 8,390,736,603 1,455,000,000 5.12% 0.00%Jun-2010 8,513,707,738 1,455,000,000 5.49% 0.01%May-2010 8,635,778,357 1,455,000,000 5.33% 0.00%Apr-2010 8,764,167,350 1,455,000,000 5.57% 0.00%Mar-2010 8,905,200,439 1,455,000,000 5.56% 0.00%Feb-2010 9,040,865,166 2,455,000,000 4.15% 0.01%Jan-2010 9,112,811,463 2,455,000,000 4.52% 0.01%Dec-2009 9,212,850,912 2,455,000,000 5.23% 0.01%Nov-2009 9,345,432,981 2,455,000,000 8.46% 0.00%Oct-2009 9,777,379,564 2,855,000,000 7.43% 0.01%
The August 2010 Net Loss Ratio, 2006-2 3-Month Excess Spread and 2006-4 3-Month Excess Spread were revised.
Note:
46
Residential Mortgages
September 2010
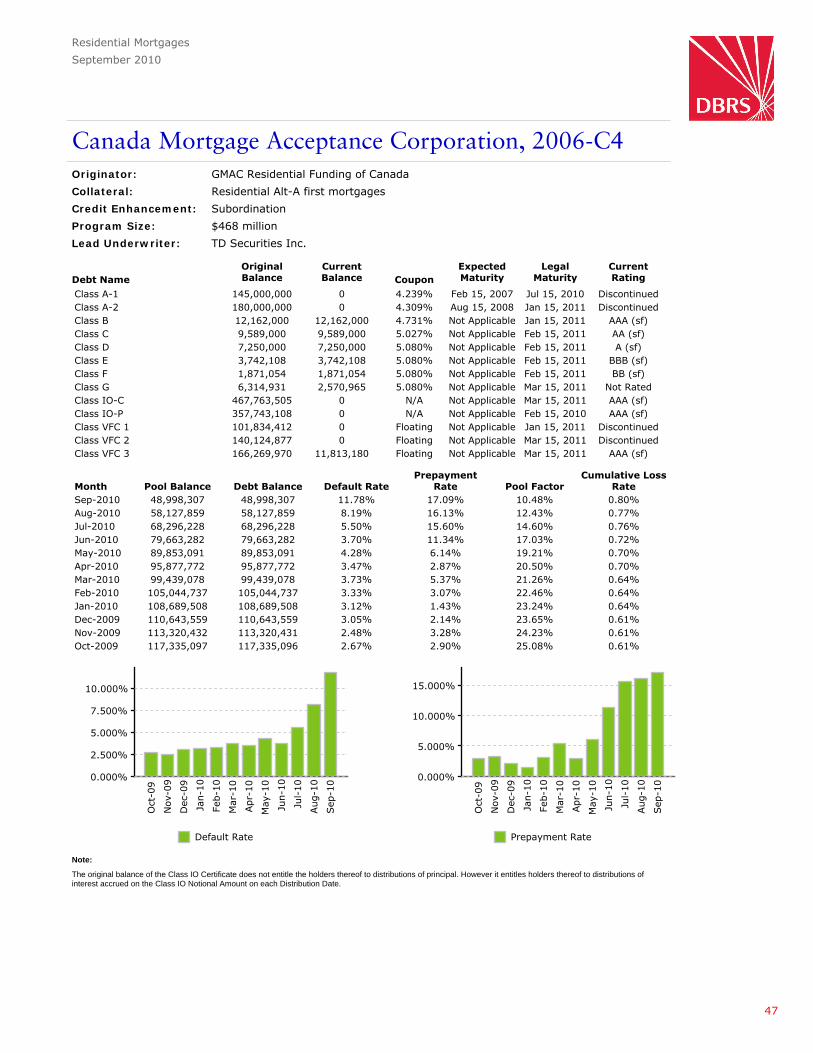
Canada Mortgage Acceptance Corporation, 2006-C4Originator: GMAC Residential Funding of Canada
Collateral: Residential Alt-A first mortgages
Credit Enhancement: Subordination
Program Size: $468 million
Lead Underwriter: TD Securities Inc.
Debt NameOriginalBalance
CurrentBalance Coupon
ExpectedMaturity
LegalMaturity
CurrentRating
Class A-1 145,000,000 0 4.239% Feb 15, 2007 Jul 15, 2010 DiscontinuedClass A-2 180,000,000 0 4.309% Aug 15, 2008 Jan 15, 2011 DiscontinuedClass B 12,162,000 12,162,000 4.731% Not Applicable Jan 15, 2011 AAA (sf)Class C 9,589,000 9,589,000 5.027% Not Applicable Feb 15, 2011 AA (sf)Class D 7,250,000 7,250,000 5.080% Not Applicable Feb 15, 2011 A (sf)Class E 3,742,108 3,742,108 5.080% Not Applicable Feb 15, 2011 BBB (sf)Class F 1,871,054 1,871,054 5.080% Not Applicable Feb 15, 2011 BB (sf)Class G 6,314,931 2,570,965 5.080% Not Applicable Mar 15, 2011 Not RatedClass IO-C 467,763,505 0 N/A Not Applicable Mar 15, 2011 AAA (sf)Class IO-P 357,743,108 0 N/A Not Applicable Feb 15, 2010 AAA (sf)Class VFC 1 101,834,412 0 Floating Not Applicable Jan 15, 2011 DiscontinuedClass VFC 2 140,124,877 0 Floating Not Applicable Mar 15, 2011 DiscontinuedClass VFC 3 166,269,970 11,813,180 Floating Not Applicable Mar 15, 2011 AAA (sf)
Month Pool Balance Debt Balance Default RatePrepayment
Rate Pool FactorCumulative Loss
RateSep-2010 48,998,307 48,998,307 11.78% 17.09% 10.48% 0.80%Aug-2010 58,127,859 58,127,859 8.19% 16.13% 12.43% 0.77%Jul-2010 68,296,228 68,296,228 5.50% 15.60% 14.60% 0.76%Jun-2010 79,663,282 79,663,282 3.70% 11.34% 17.03% 0.72%May-2010 89,853,091 89,853,091 4.28% 6.14% 19.21% 0.70%Apr-2010 95,877,772 95,877,772 3.47% 2.87% 20.50% 0.70%Mar-2010 99,439,078 99,439,078 3.73% 5.37% 21.26% 0.64%Feb-2010 105,044,737 105,044,737 3.33% 3.07% 22.46% 0.64%Jan-2010 108,689,508 108,689,508 3.12% 1.43% 23.24% 0.64%Dec-2009 110,643,559 110,643,559 3.05% 2.14% 23.65% 0.61%Nov-2009 113,320,432 113,320,431 2.48% 3.28% 24.23% 0.61%Oct-2009 117,335,097 117,335,096 2.67% 2.90% 25.08% 0.61%
The original balance of the Class IO Certificate does not entitle the holders thereof to distributions of principal. However it entitles holders thereof to distributions ofinterest accrued on the Class IO Notional Amount on each Distribution Date.
Note:
47
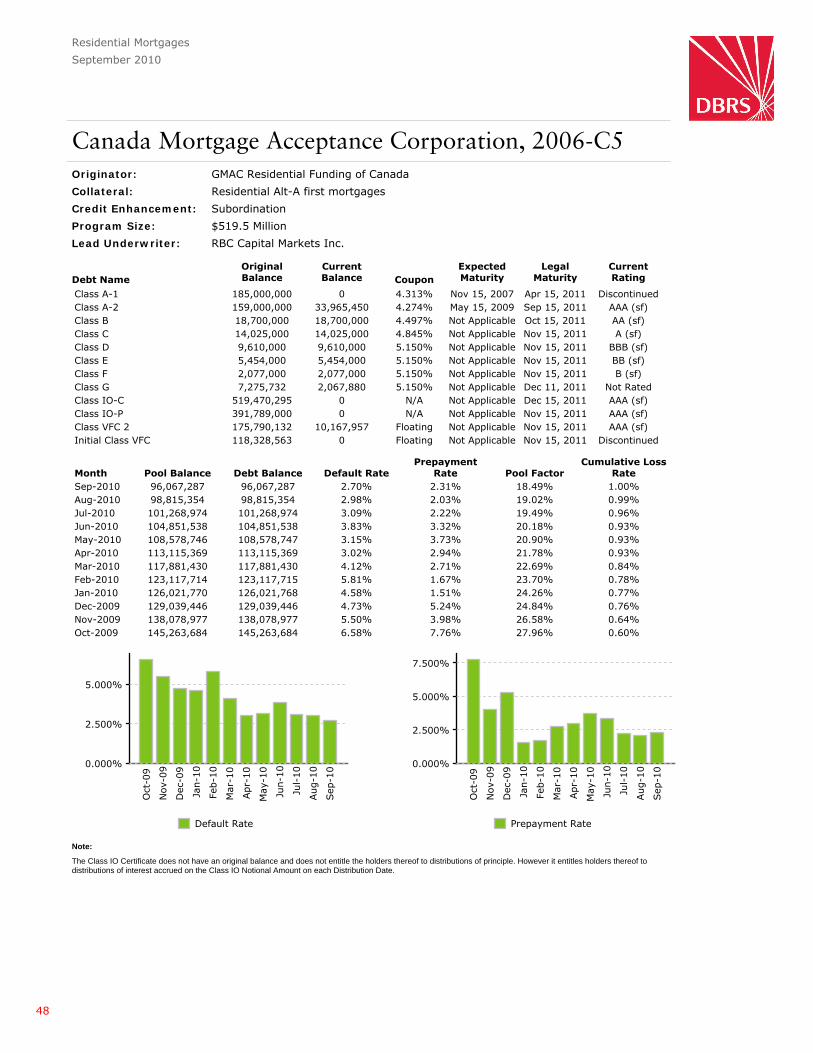
Residential Mortgages
September 2010
Canada Mortgage Acceptance Corporation, 2006-C5Originator: GMAC Residential Funding of Canada
Collateral: Residential Alt-A first mortgages
Credit Enhancement: Subordination
Program Size: $519.5 Million
Lead Underwriter: RBC Capital Markets Inc.
Debt NameOriginalBalance
CurrentBalance Coupon
ExpectedMaturity
LegalMaturity
CurrentRating
Class A-1 185,000,000 0 4.313% Nov 15, 2007 Apr 15, 2011 DiscontinuedClass A-2 159,000,000 33,965,450 4.274% May 15, 2009 Sep 15, 2011 AAA (sf)Class B 18,700,000 18,700,000 4.497% Not Applicable Oct 15, 2011 AA (sf)Class C 14,025,000 14,025,000 4.845% Not Applicable Nov 15, 2011 A (sf)Class D 9,610,000 9,610,000 5.150% Not Applicable Nov 15, 2011 BBB (sf)Class E 5,454,000 5,454,000 5.150% Not Applicable Nov 15, 2011 BB (sf)Class F 2,077,000 2,077,000 5.150% Not Applicable Nov 15, 2011 B (sf)Class G 7,275,732 2,067,880 5.150% Not Applicable Dec 11, 2011 Not RatedClass IO-C 519,470,295 0 N/A Not Applicable Dec 15, 2011 AAA (sf)Class IO-P 391,789,000 0 N/A Not Applicable Nov 15, 2011 AAA (sf)Class VFC 2 175,790,132 10,167,957 Floating Not Applicable Nov 15, 2011 AAA (sf)Initial Class VFC 118,328,563 0 Floating Not Applicable Nov 15, 2011 Discontinued
Month Pool Balance Debt Balance Default RatePrepayment
Rate Pool FactorCumulative Loss
RateSep-2010 96,067,287 96,067,287 2.70% 2.31% 18.49% 1.00%Aug-2010 98,815,354 98,815,354 2.98% 2.03% 19.02% 0.99%Jul-2010 101,268,974 101,268,974 3.09% 2.22% 19.49% 0.96%Jun-2010 104,851,538 104,851,538 3.83% 3.32% 20.18% 0.93%May-2010 108,578,746 108,578,747 3.15% 3.73% 20.90% 0.93%Apr-2010 113,115,369 113,115,369 3.02% 2.94% 21.78% 0.93%Mar-2010 117,881,430 117,881,430 4.12% 2.71% 22.69% 0.84%Feb-2010 123,117,714 123,117,715 5.81% 1.67% 23.70% 0.78%Jan-2010 126,021,770 126,021,768 4.58% 1.51% 24.26% 0.77%Dec-2009 129,039,446 129,039,446 4.73% 5.24% 24.84% 0.76%Nov-2009 138,078,977 138,078,977 5.50% 3.98% 26.58% 0.64%Oct-2009 145,263,684 145,263,684 6.58% 7.76% 27.96% 0.60%
The Class IO Certificate does not have an original balance and does not entitle the holders thereof to distributions of principle. However it entitles holders thereof todistributions of interest accrued on the Class IO Notional Amount on each Distribution Date.
Note:
48
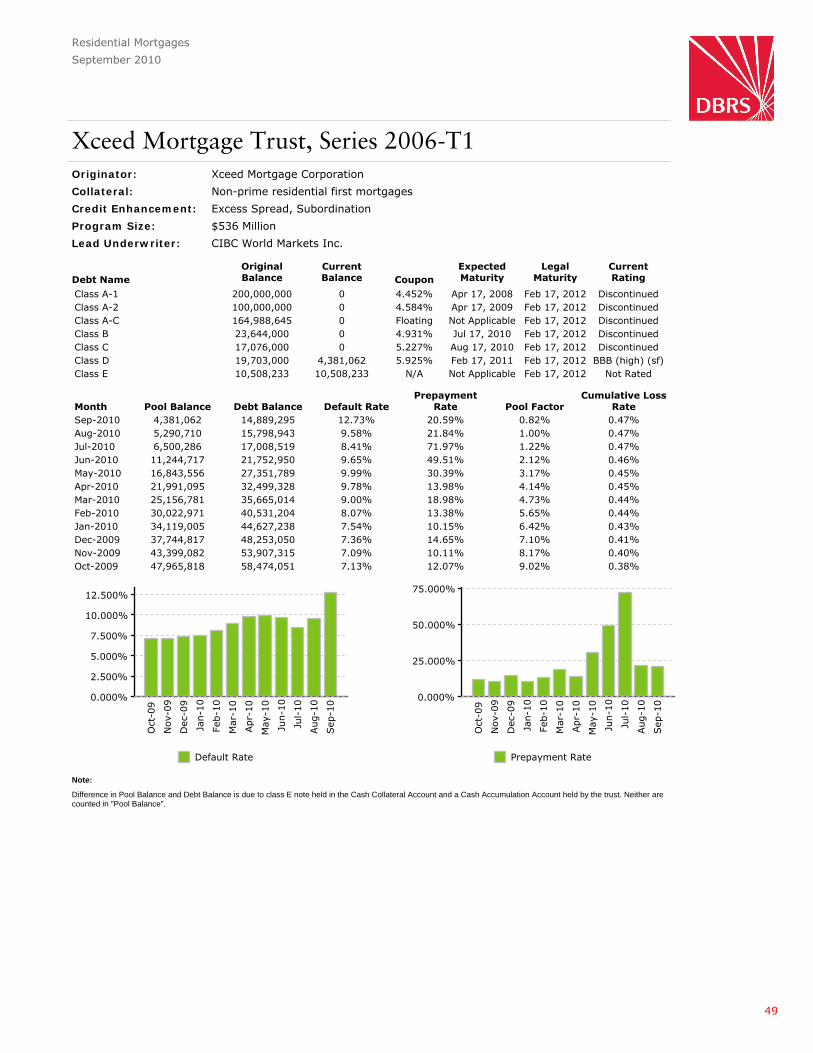
Residential Mortgages
September 2010
Xceed Mortgage Trust, Series 2006-T1Originator: Xceed Mortgage Corporation
Collateral: Non-prime residential first mortgages
Credit Enhancement: Excess Spread, Subordination
Program Size: $536 Million
Lead Underwriter: CIBC World Markets Inc.
Debt NameOriginalBalance
CurrentBalance Coupon
ExpectedMaturity
LegalMaturity
CurrentRating
Class A-1 200,000,000 0 4.452% Apr 17, 2008 Feb 17, 2012 DiscontinuedClass A-2 100,000,000 0 4.584% Apr 17, 2009 Feb 17, 2012 DiscontinuedClass A-C 164,988,645 0 Floating Not Applicable Feb 17, 2012 DiscontinuedClass B 23,644,000 0 4.931% Jul 17, 2010 Feb 17, 2012 DiscontinuedClass C 17,076,000 0 5.227% Aug 17, 2010 Feb 17, 2012 DiscontinuedClass D 19,703,000 4,381,062 5.925% Feb 17, 2011 Feb 17, 2012 BBB (high) (sf)Class E 10,508,233 10,508,233 N/A Not Applicable Feb 17, 2012 Not Rated
Month Pool Balance Debt Balance Default RatePrepayment
Rate Pool FactorCumulative Loss
RateSep-2010 4,381,062 14,889,295 12.73% 20.59% 0.82% 0.47%Aug-2010 5,290,710 15,798,943 9.58% 21.84% 1.00% 0.47%Jul-2010 6,500,286 17,008,519 8.41% 71.97% 1.22% 0.47%Jun-2010 11,244,717 21,752,950 9.65% 49.51% 2.12% 0.46%May-2010 16,843,556 27,351,789 9.99% 30.39% 3.17% 0.45%Apr-2010 21,991,095 32,499,328 9.78% 13.98% 4.14% 0.45%Mar-2010 25,156,781 35,665,014 9.00% 18.98% 4.73% 0.44%Feb-2010 30,022,971 40,531,204 8.07% 13.38% 5.65% 0.44%Jan-2010 34,119,005 44,627,238 7.54% 10.15% 6.42% 0.43%Dec-2009 37,744,817 48,253,050 7.36% 14.65% 7.10% 0.41%Nov-2009 43,399,082 53,907,315 7.09% 10.11% 8.17% 0.40%Oct-2009 47,965,818 58,474,051 7.13% 12.07% 9.02% 0.38%
Difference in Pool Balance and Debt Balance is due to class E note held in the Cash Collateral Account and a Cash Accumulation Account held by the trust. Neither arecounted in "Pool Balance".
Note:
49
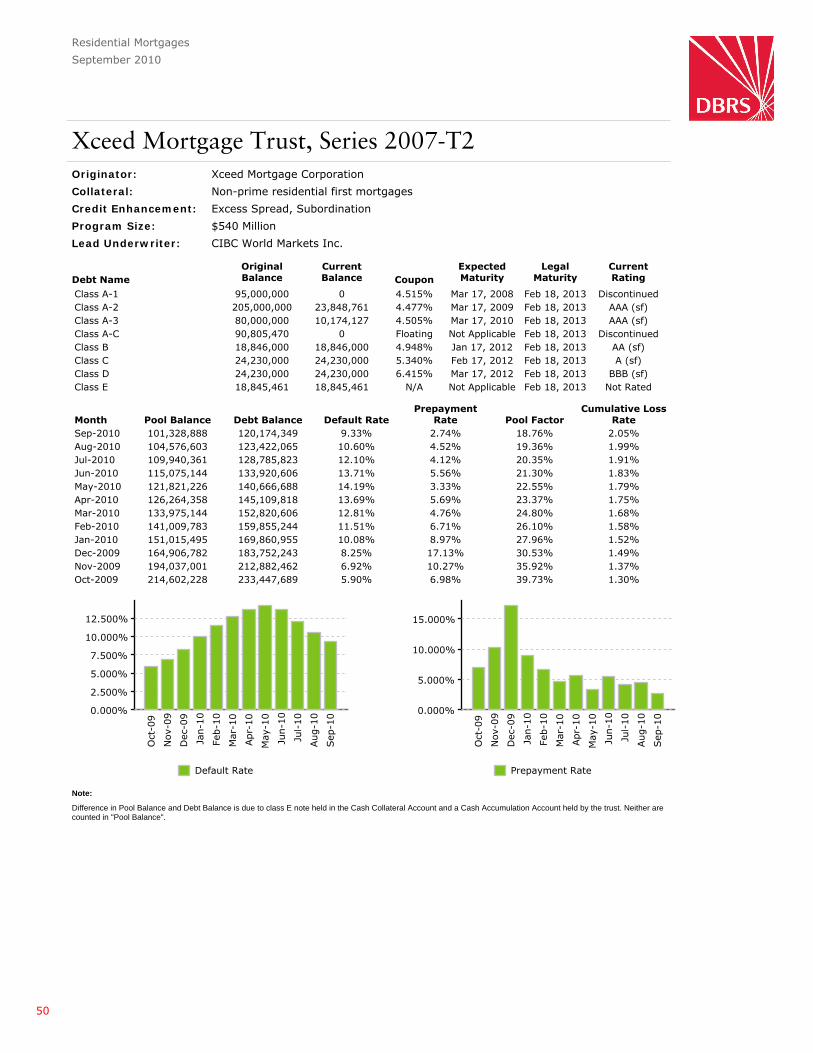
Residential Mortgages
September 2010
Xceed Mortgage Trust, Series 2007-T2Originator: Xceed Mortgage Corporation
Collateral: Non-prime residential first mortgages
Credit Enhancement: Excess Spread, Subordination
Program Size: $540 Million
Lead Underwriter: CIBC World Markets Inc.
Debt NameOriginalBalance
CurrentBalance Coupon
ExpectedMaturity
LegalMaturity
CurrentRating
Class A-1 95,000,000 0 4.515% Mar 17, 2008 Feb 18, 2013 DiscontinuedClass A-2 205,000,000 23,848,761 4.477% Mar 17, 2009 Feb 18, 2013 AAA (sf)Class A-3 80,000,000 10,174,127 4.505% Mar 17, 2010 Feb 18, 2013 AAA (sf)Class A-C 90,805,470 0 Floating Not Applicable Feb 18, 2013 DiscontinuedClass B 18,846,000 18,846,000 4.948% Jan 17, 2012 Feb 18, 2013 AA (sf)Class C 24,230,000 24,230,000 5.340% Feb 17, 2012 Feb 18, 2013 A (sf)Class D 24,230,000 24,230,000 6.415% Mar 17, 2012 Feb 18, 2013 BBB (sf)Class E 18,845,461 18,845,461 N/A Not Applicable Feb 18, 2013 Not Rated
Month Pool Balance Debt Balance Default RatePrepayment
Rate Pool FactorCumulative Loss
RateSep-2010 101,328,888 120,174,349 9.33% 2.74% 18.76% 2.05%Aug-2010 104,576,603 123,422,065 10.60% 4.52% 19.36% 1.99%Jul-2010 109,940,361 128,785,823 12.10% 4.12% 20.35% 1.91%Jun-2010 115,075,144 133,920,606 13.71% 5.56% 21.30% 1.83%May-2010 121,821,226 140,666,688 14.19% 3.33% 22.55% 1.79%Apr-2010 126,264,358 145,109,818 13.69% 5.69% 23.37% 1.75%Mar-2010 133,975,144 152,820,606 12.81% 4.76% 24.80% 1.68%Feb-2010 141,009,783 159,855,244 11.51% 6.71% 26.10% 1.58%Jan-2010 151,015,495 169,860,955 10.08% 8.97% 27.96% 1.52%Dec-2009 164,906,782 183,752,243 8.25% 17.13% 30.53% 1.49%Nov-2009 194,037,001 212,882,462 6.92% 10.27% 35.92% 1.37%Oct-2009 214,602,228 233,447,689 5.90% 6.98% 39.73% 1.30%
Difference in Pool Balance and Debt Balance is due to class E note held in the Cash Collateral Account and a Cash Accumulation Account held by the trust. Neither arecounted in "Pool Balance".
Note:
50
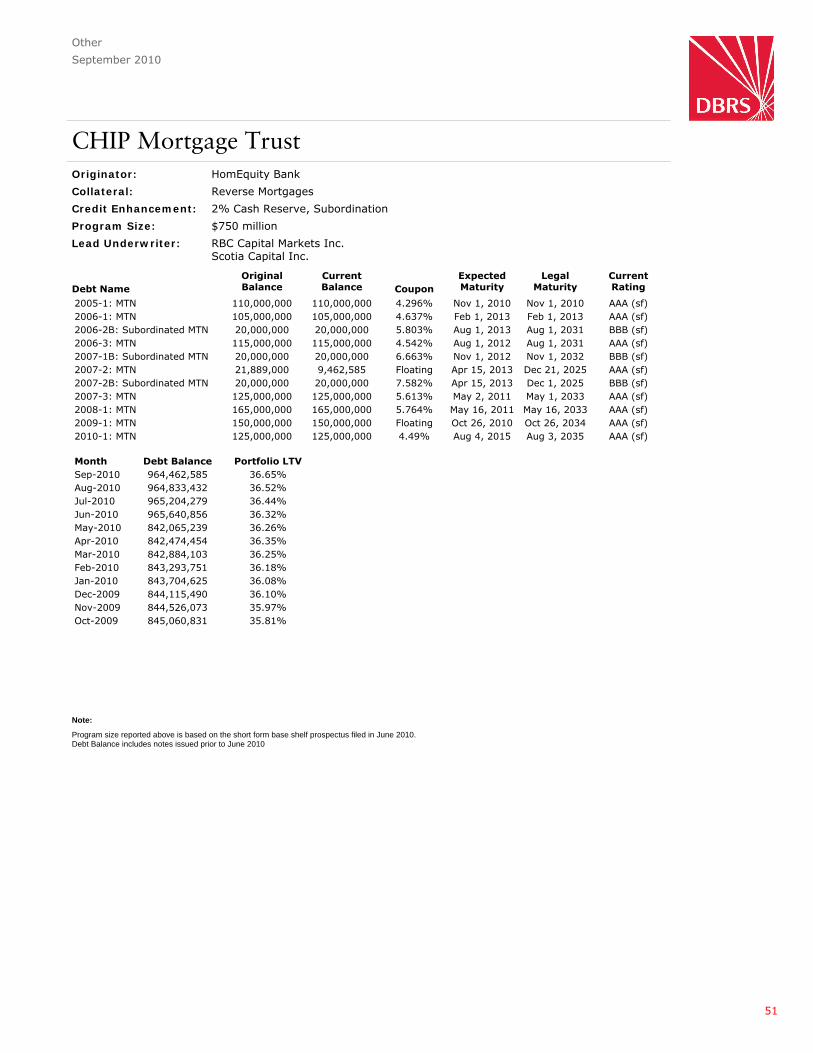
Other
September 2010
CHIP Mortgage TrustOriginator: HomEquity Bank
Collateral: Reverse Mortgages
Credit Enhancement: 2% Cash Reserve, Subordination
Program Size: $750 million
Lead Underwriter: RBC Capital Markets Inc.Scotia Capital Inc.
Debt NameOriginalBalance
CurrentBalance Coupon
ExpectedMaturity
LegalMaturity
CurrentRating
2005-1: MTN 110,000,000 110,000,000 4.296% Nov 1, 2010 Nov 1, 2010 AAA (sf)2006-1: MTN 105,000,000 105,000,000 4.637% Feb 1, 2013 Feb 1, 2013 AAA (sf)2006-2B: Subordinated MTN 20,000,000 20,000,000 5.803% Aug 1, 2013 Aug 1, 2031 BBB (sf)2006-3: MTN 115,000,000 115,000,000 4.542% Aug 1, 2012 Aug 1, 2031 AAA (sf)2007-1B: Subordinated MTN 20,000,000 20,000,000 6.663% Nov 1, 2012 Nov 1, 2032 BBB (sf)2007-2: MTN 21,889,000 9,462,585 Floating Apr 15, 2013 Dec 21, 2025 AAA (sf)2007-2B: Subordinated MTN 20,000,000 20,000,000 7.582% Apr 15, 2013 Dec 1, 2025 BBB (sf)2007-3: MTN 125,000,000 125,000,000 5.613% May 2, 2011 May 1, 2033 AAA (sf)2008-1: MTN 165,000,000 165,000,000 5.764% May 16, 2011 May 16, 2033 AAA (sf)2009-1: MTN 150,000,000 150,000,000 Floating Oct 26, 2010 Oct 26, 2034 AAA (sf)2010-1: MTN 125,000,000 125,000,000 4.49% Aug 4, 2015 Aug 3, 2035 AAA (sf)
Month Debt Balance Portfolio LTVSep-2010 964,462,585 36.65%Aug-2010 964,833,432 36.52%Jul-2010 965,204,279 36.44%Jun-2010 965,640,856 36.32%May-2010 842,065,239 36.26%Apr-2010 842,474,454 36.35%Mar-2010 842,884,103 36.25%Feb-2010 843,293,751 36.18%Jan-2010 843,704,625 36.08%Dec-2009 844,115,490 36.10%Nov-2009 844,526,073 35.97%Oct-2009 845,060,831 35.81%
Program size reported above is based on the short form base shelf prospectus filed in June 2010.Debt Balance includes notes issued prior to June 2010
Note:
51

Other
September 2010
ASG Trust
TD Securities Inc.
Rated FacilitiesFacility Current RatingCurrent BalanceAsset Class
11 NotRated
11,971,525Comm. Mtg.
12 AAA (sf)72,727,546Auto Leases13 A (sf)4,117,405Auto Loans29 AAA (sf)7,027,190Auto Loans43 AAA (sf)8,780,162Auto Leases46 AAA (sf)75,600,754Auto Loans47 AAA (sf)114,661,025Eqpt. Finance51 AAA (sf)155,931,270Auto Loans52 AAA (sf)64,142,986Auto Leases53 AAA (sf)34,922,931Eqpt. Finance56 AAA (sf)54,564,672Auto Loans57 AAA (sf)83,965,999Auto Loans
Total 688,413,465
Financial Services Agent:
Originators:
Collateral:
Credit Enhancement:
Various
Various
Transaction dependent form and amounts
Previous reports had reported data one month ahead. This has been changed as of February 2010 to report the current month's data.
Note:
52

Other
September 2010
CBC Monetization Trust NotesOriginator: Canadian Broadcasting Corporation
Collateral: Promissory Notes, the Concurrent Lease, the Support Agreement, the Trust Account,Eligible Investments, the CBC Guarantee and all other assets of the Trust
Credit Enhancement: Excess Spread, Overcollateralization, CBC Guarantee
Program Size:
Lead Underwriter: RBC Capital Markets Inc.
Debt NameOriginalBalance
CurrentBalance Coupon
ExpectedMaturity
LegalMaturity
CurrentRating
Notes 135,700,000 130,802,661 4.688% May 15, 2027 Not Applicable AAA (sf)
Month
Phase IIIPromissory
Note
Phase IIPromissory
Note
Front StreetTower Parcel
LeasePhase I RetailParcel Lease
Total MonthlyPaymentReceived
Sep-2010 43,486 420,463 466,652 37,499 968,100Aug-2010 43,486 420,463 466,652 37,499 968,100Jul-2010 43,486 420,463 466,652 37,499 968,100Jun-2010 43,486 420,463 466,652 37,499 968,100May-2010 43,486 420,463 466,652 37,499 968,100Apr-2010 43,486 420,463 466,652 37,499 968,100Mar-2010 43,486 420,463 466,652 37,499 968,100Feb-2010 43,486 420,463 466,652 37,499 968,100Jan-2010 43,486 420,463 466,652 37,499 968,100
MonthDistribution
DateInterestAmount
PrincipalAmount
ExpectedPrincipalBalance Payment Status
May-2010 2010-05-15 2,492,359 2,288,038 $133,411,962 PaidNov-2010 2010-11-15 3,127,176 2,609,300 $130,802,661 In AccumulationMay-2011 2011-05-15 3,066,014 2,670,462 $128,132,199Nov-2011 2011-11-15 3,003,419 2,733,058 $125,399,141May-2012 2012-05-15 2,939,356 2,797,121 $122,602,020Nov-2012 2012-11-15 2,873,791 2,862,686 $119,739,334May-2013 2013-05-15 2,806,690 2,929,787 $116,809,547Nov-2013 2013-11-15 2,738,016 2,998,461 $113,811,086May-2014 2014-05-15 2,667,732 3,068,745 $110,742,341Nov-2014 2014-11-15 2,595,800 3,140,676 $107,601,665May-2015 2015-05-15 2,522,183 3,214,294 $104,387,371Nov-2015 2015-11-15 2,446,840 3,289,637 $101,097,734May-2016 2016-05-15 2,369,731 3,366,746 $97,730,988Nov-2016 2016-11-15 2,290,814 3,445,662 $94,285,326May-2017 2017-05-15 2,210,048 3,526,429 $90,758,897Nov-2017 2017-11-15 2,127,389 3,609,088 $87,149,809May-2018 2018-05-15 2,042,792 3,693,685 $83,456,123Nov-2018 2018-11-15 1,956,212 3,780,265 $79,675,858May-2019 2019-05-15 1,867,602 3,868,875 $75,806,983Nov-2019 2019-11-15 1,776,916 3,959,561 $71,847,422May-2020 2020-05-15 1,684,104 4,052,373 $67,795,049Nov-2020 2020-11-15 1,589,116 4,147,361 $63,647,688May-2021 2021-05-15 1,491,902 4,244,575 $59,403,113Nov-2021 2021-11-15 1,392,409 4,344,068 $55,059,045May-2022 2022-05-15 1,290,584 4,445,893 $50,613,152Nov-2022 2022-11-15 1,186,372 4,550,105 $46,063,048May-2023 2023-05-15 1,079,718 4,656,759 $41,406,289Nov-2023 2023-11-15 970,563 4,765,913 $36,640,375May-2024 2024-05-15 858,850 4,877,626 $31,762,749Nov-2024 2024-11-15 744,519 4,991,958 $26,770,791May-2025 2025-05-15 627,507 5,108,970 $21,661,821Nov-2025 2025-11-15 507,753 5,228,724 $16,433,098May-2026 2026-05-15 385,192 5,351,285 $11,081,813Nov-2026 2026-11-15 259,758 5,476,719 $5,605,093May-2027 2027-05-15 131,383 5,605,093 $0
53
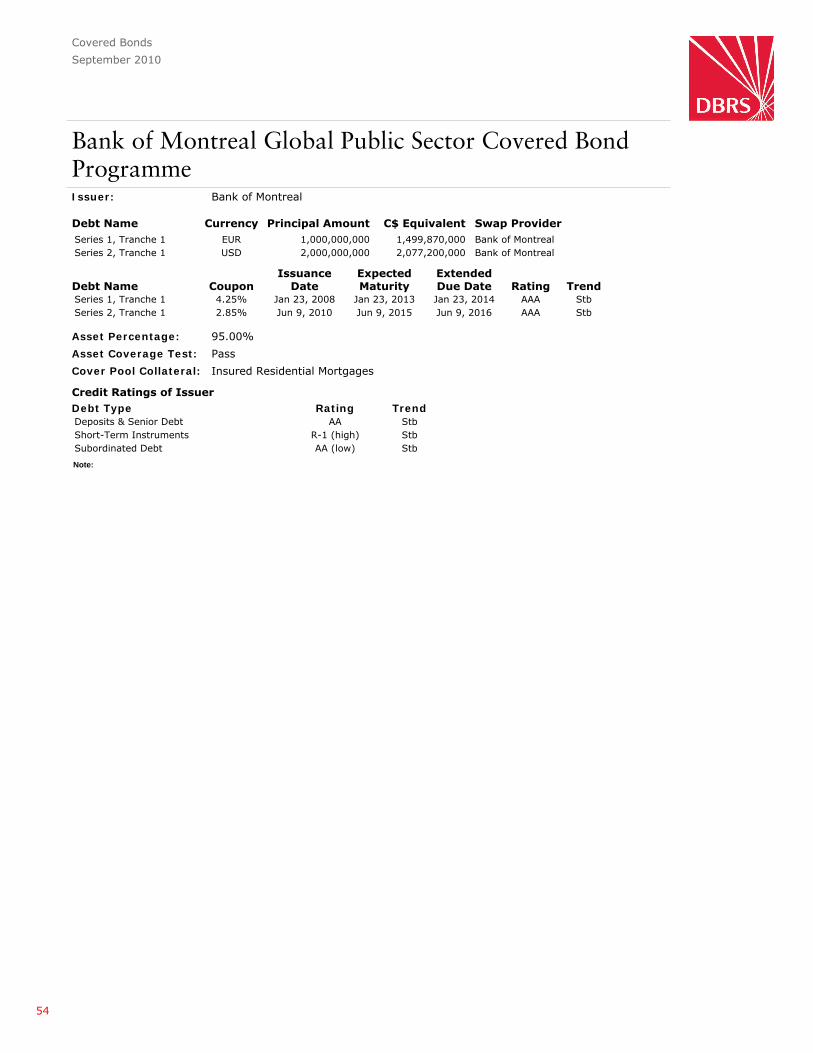
Covered Bonds
September 2010
Bank of Montreal Global Public Sector Covered BondProgrammeIssuer: Bank of Montreal
Asset Percentage:
Asset Coverage Test: Pass
Debt Name C$ Equivalent Swap ProviderPrincipal AmountCurrencySeries 1, Tranche 1 1,000,000,000 1,499,870,000 Bank of MontrealEURSeries 2, Tranche 1 2,000,000,000 2,077,200,000 Bank of MontrealUSD
95.00%
Debt Type Rating TrendDeposits & Senior Debt AA StbShort-Term Instruments R-1 (high) StbSubordinated Debt AA (low) Stb
Credit Ratings of Issuer
Debt NameExpectedMaturity Rating Trend
ExtendedDue DateCoupon
IssuanceDate
Series 1, Tranche 1 Jan 23, 2013 AAA StbJan 23, 20144.25% Jan 23, 2008Series 2, Tranche 1 Jun 9, 2015 AAA StbJun 9, 20162.85% Jun 9, 2010
Cover Pool Collateral: Insured Residential Mortgages
Note:
54
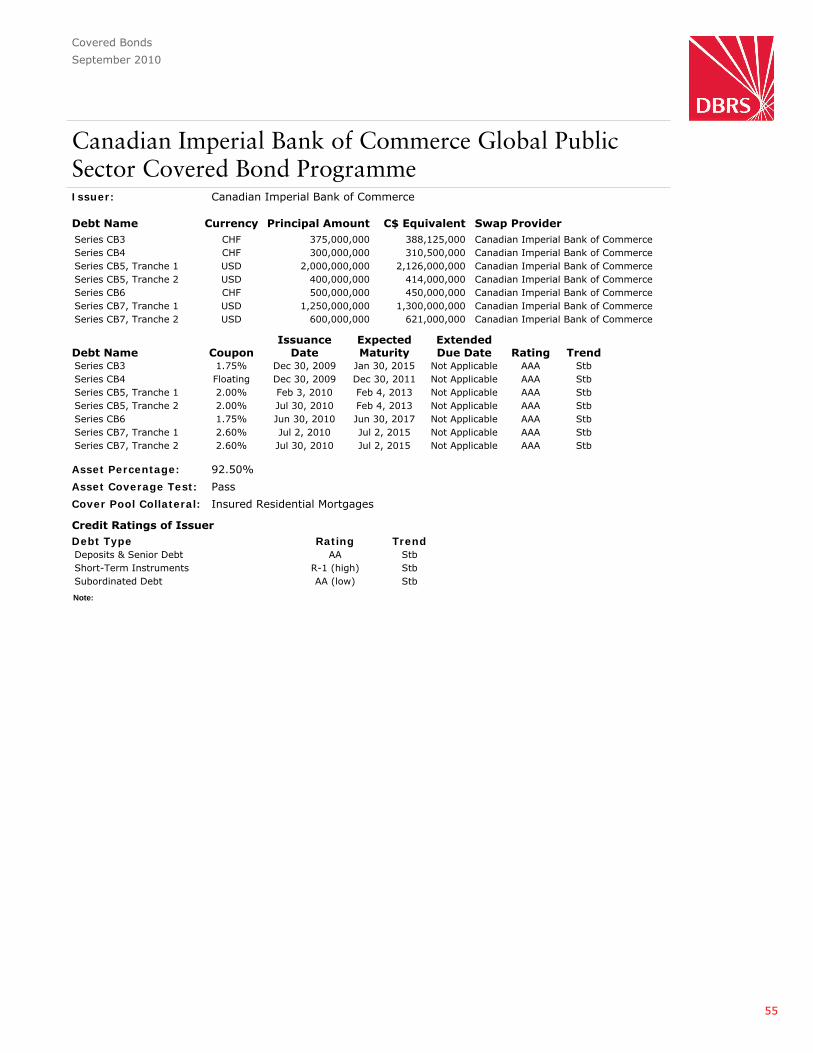
Covered Bonds
September 2010
Canadian Imperial Bank of Commerce Global PublicSector Covered Bond ProgrammeIssuer: Canadian Imperial Bank of Commerce
Asset Percentage:
Asset Coverage Test: Pass
Debt Name C$ Equivalent Swap ProviderPrincipal AmountCurrencySeries CB3 375,000,000 388,125,000 Canadian Imperial Bank of CommerceCHFSeries CB4 300,000,000 310,500,000 Canadian Imperial Bank of CommerceCHFSeries CB5, Tranche 1 2,000,000,000 2,126,000,000 Canadian Imperial Bank of CommerceUSDSeries CB5, Tranche 2 400,000,000 414,000,000 Canadian Imperial Bank of CommerceUSDSeries CB6 500,000,000 450,000,000 Canadian Imperial Bank of CommerceCHFSeries CB7, Tranche 1 1,250,000,000 1,300,000,000 Canadian Imperial Bank of CommerceUSDSeries CB7, Tranche 2 600,000,000 621,000,000 Canadian Imperial Bank of CommerceUSD
92.50%
Debt Type Rating TrendDeposits & Senior Debt AA StbShort-Term Instruments R-1 (high) StbSubordinated Debt AA (low) Stb
Credit Ratings of Issuer
Debt NameExpectedMaturity Rating Trend
ExtendedDue DateCoupon
IssuanceDate
Series CB3 Jan 30, 2015 AAA StbNot Applicable1.75% Dec 30, 2009Series CB4 Dec 30, 2011 AAA StbNot ApplicableFloating Dec 30, 2009Series CB5, Tranche 1 Feb 4, 2013 AAA StbNot Applicable2.00% Feb 3, 2010Series CB5, Tranche 2 Feb 4, 2013 AAA StbNot Applicable2.00% Jul 30, 2010Series CB6 Jun 30, 2017 AAA StbNot Applicable1.75% Jun 30, 2010Series CB7, Tranche 1 Jul 2, 2015 AAA StbNot Applicable2.60% Jul 2, 2010Series CB7, Tranche 2 Jul 2, 2015 AAA StbNot Applicable2.60% Jul 30, 2010
Cover Pool Collateral: Insured Residential Mortgages
Note:
55
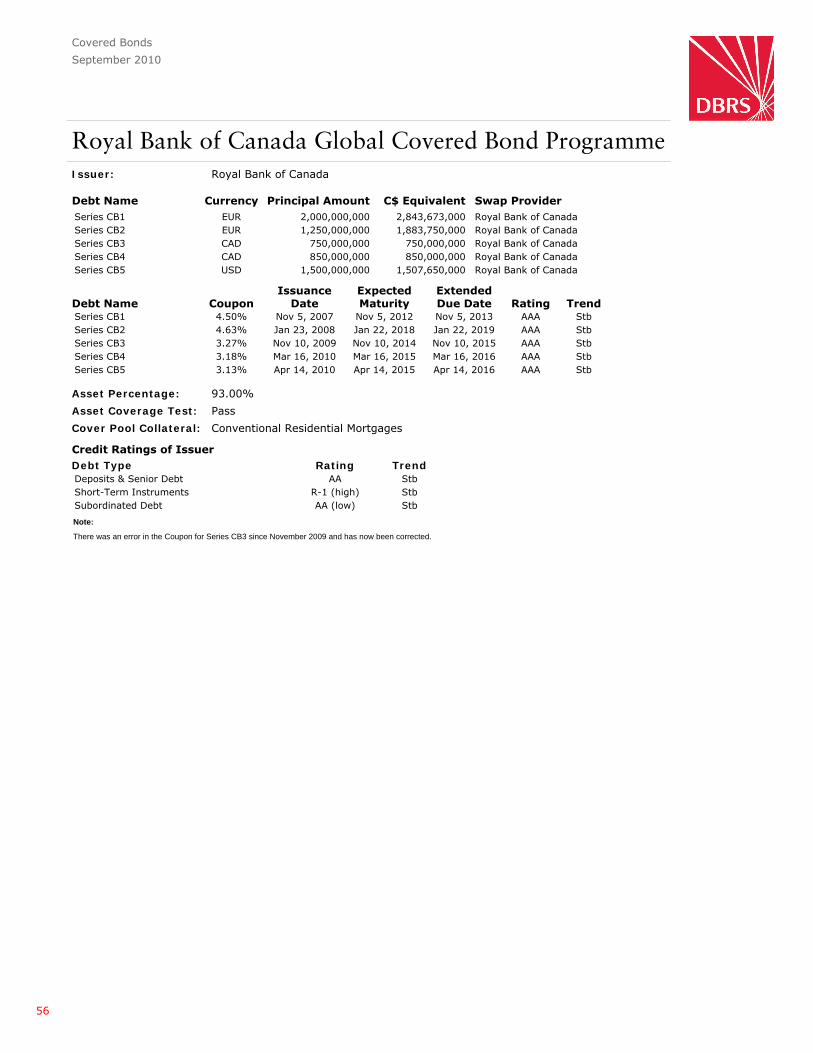
Covered Bonds
September 2010
Royal Bank of Canada Global Covered Bond ProgrammeIssuer: Royal Bank of Canada
Asset Percentage:
Asset Coverage Test: Pass
Debt Name C$ Equivalent Swap ProviderPrincipal AmountCurrencySeries CB1 2,000,000,000 2,843,673,000 Royal Bank of CanadaEURSeries CB2 1,250,000,000 1,883,750,000 Royal Bank of CanadaEURSeries CB3 750,000,000 750,000,000 Royal Bank of CanadaCADSeries CB4 850,000,000 850,000,000 Royal Bank of CanadaCADSeries CB5 1,500,000,000 1,507,650,000 Royal Bank of CanadaUSD
93.00%
Debt Type Rating TrendDeposits & Senior Debt AA StbShort-Term Instruments R-1 (high) StbSubordinated Debt AA (low) Stb
Credit Ratings of Issuer
Debt NameExpectedMaturity Rating Trend
ExtendedDue DateCoupon
IssuanceDate
Series CB1 Nov 5, 2012 AAA StbNov 5, 20134.50% Nov 5, 2007Series CB2 Jan 22, 2018 AAA StbJan 22, 20194.63% Jan 23, 2008Series CB3 Nov 10, 2014 AAA StbNov 10, 20153.27% Nov 10, 2009Series CB4 Mar 16, 2015 AAA StbMar 16, 20163.18% Mar 16, 2010Series CB5 Apr 14, 2015 AAA StbApr 14, 20163.13% Apr 14, 2010
Cover Pool Collateral: Conventional Residential Mortgages
There was an error in the Coupon for Series CB3 since November 2009 and has now been corrected.
Note:
56
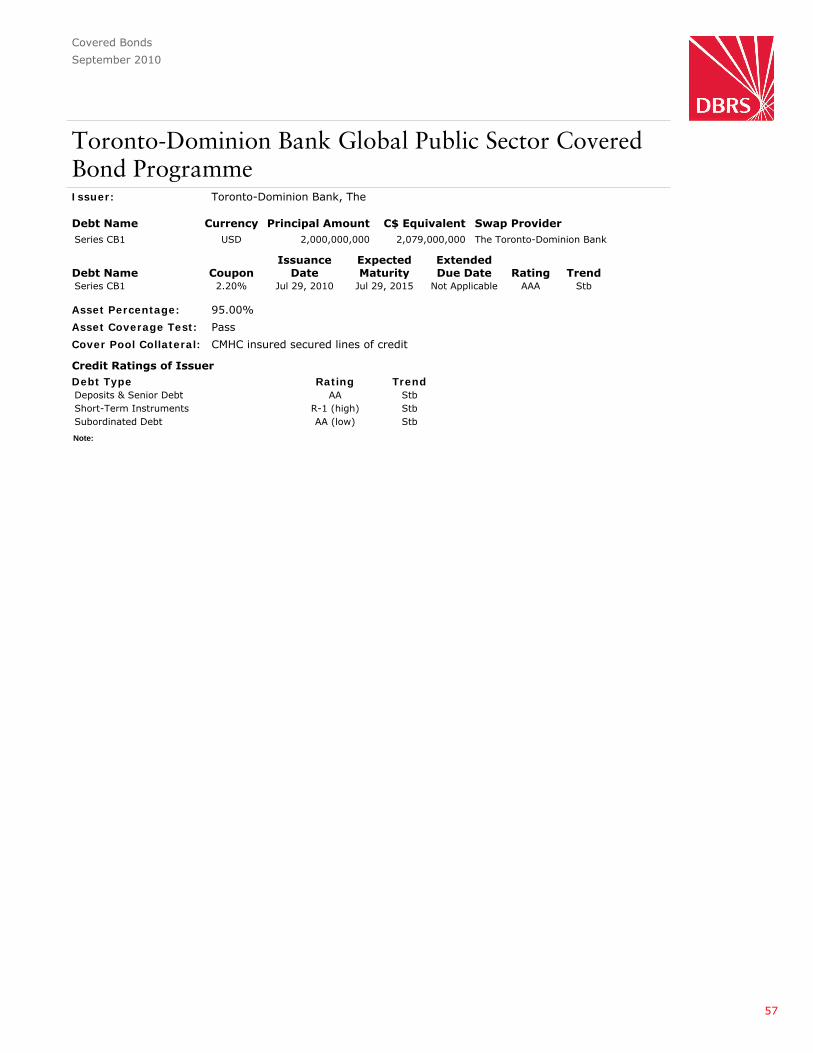
Covered Bonds
September 2010
Toronto-Dominion Bank Global Public Sector CoveredBond ProgrammeIssuer: Toronto-Dominion Bank, The
Asset Percentage:
Asset Coverage Test: Pass
Debt Name C$ Equivalent Swap ProviderPrincipal AmountCurrencySeries CB1 2,000,000,000 2,079,000,000 The Toronto-Dominion BankUSD
95.00%
Debt Type Rating TrendDeposits & Senior Debt AA StbShort-Term Instruments R-1 (high) StbSubordinated Debt AA (low) Stb
Credit Ratings of Issuer
Debt NameExpectedMaturity Rating Trend
ExtendedDue DateCoupon
IssuanceDate
Series CB1 Jul 29, 2015 AAA StbNot Applicable2.20% Jul 29, 2010
Cover Pool Collateral: CMHC insured secured lines of credit
Note:
57
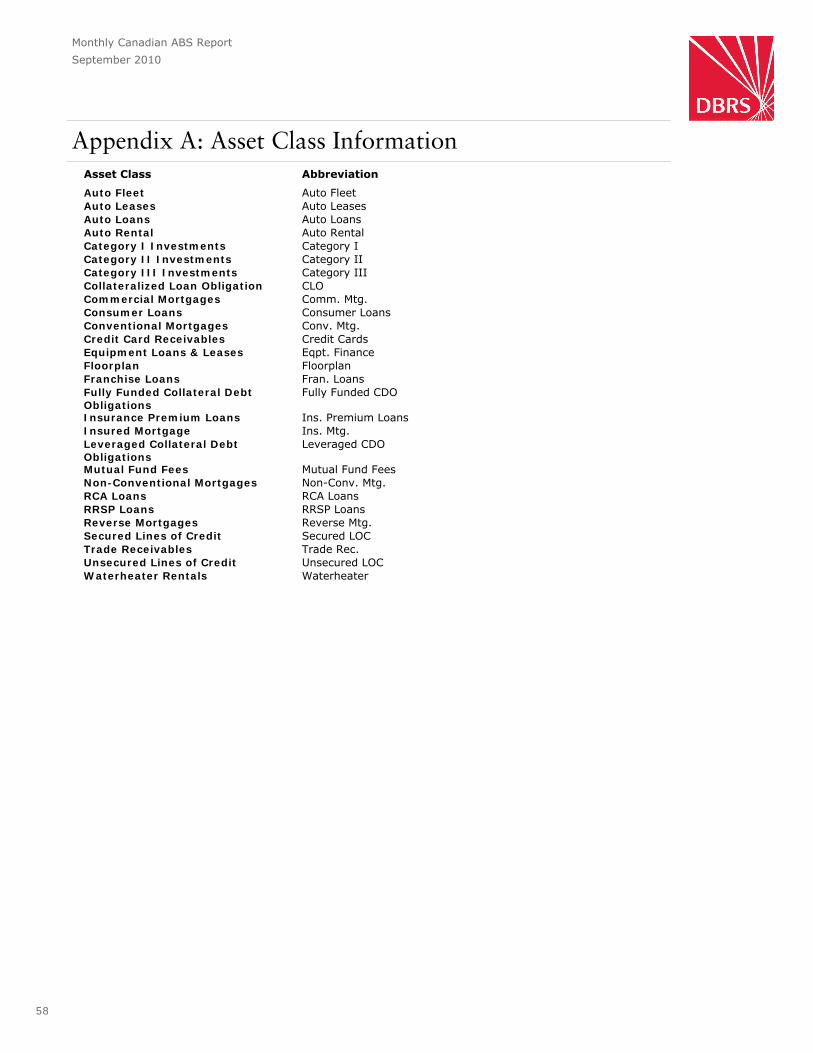
Appendix A: Asset Class Information
Monthly Canadian ABS Report
September 2010
Asset Class Abbreviation
Auto Fleet Auto FleetAuto Leases Auto LeasesAuto Loans Auto LoansAuto Rental Auto RentalCategory I Investments Category ICategory II Investments Category IICategory III Investments Category IIICollateralized Loan Obligation CLOCommercial Mortgages Comm. Mtg.Consumer Loans Consumer LoansConventional Mortgages Conv. Mtg.Credit Card Receivables Credit CardsEquipment Loans & Leases Eqpt. FinanceFloorplan FloorplanFranchise Loans Fran. LoansFully Funded Collateral DebtObligations
Fully Funded CDO
Insurance Premium Loans Ins. Premium LoansInsured Mortgage Ins. Mtg.Leveraged Collateral DebtObligations
Leveraged CDO
Mutual Fund Fees Mutual Fund FeesNon-Conventional Mortgages Non-Conv. Mtg.RCA Loans RCA LoansRRSP Loans RRSP LoansReverse Mortgages Reverse Mtg.Secured Lines of Credit Secured LOCTrade Receivables Trade Rec.Unsecured Lines of Credit Unsecured LOCWaterheater Rentals Waterheater
58
Glossary
Monthly Canadian ABS Report
September 2010
Asset Backed SecuritiesA Note or other rated financial instrument issued by a third party securitization vehicle. In thisreport, ABS refers to the notes with a term to maturity at issurance greater than 364 days.
Auto LeasesAuto Lease Securitizations represent the contractual obligations of customers who have financedtheir vehicles via leases. The majority of these obligations are arranged through the captive financecompanies of automotive manufacturers and include cars, light trucks and SUV's retailed to adiverse pool of unrelated obligors throughout Canada. A typical lease contract in Canada isa closed-end lease whereby the obligor has the option to purchase the car at the end of the term (ata predetermined price usually referred to as residual value), extend the lease, or return the vehicleto the financing entity. It is important to note that ownership of the vehicles is maintained by thefinancing entity and as a result residual value risk is a major concern in a lease securitization.
Auto LoansAuto Loan Securitizations represent the contractual obligations of customers who have financedthe purchase of their vehicles. The majority of these obligations are arranged through the captivefinance companies of automotive manufacturers and include cars, light trucks and SUV's retailedto a diverse pool of unrelated obligors throughout Canada. It is important to note here that thevehicles are owned by the individual obligors and cannot be returned to the dealer unless re-possessed by the financing entity. The major risk in auto loan securitizations is the credit riskassociated with the monthly payments receivable from the obligors.
Conventional MortgagesAn uninsured residential mortgage with a LTV equal to or less than 80% (increased from 75% inApril 2007) at origination and underwritten by financial institutions to a prime credit borrower forproperty purchase, with full documentation, scheduled monthly amortizing payments and generallymaximum GDS (gross debt service ratio) of 32% and TDS (total debt service ratio) of 40%.
Credit CardsA receivable generated from a revolving unsecured credit facility established between a borrowerand a lender that allows the borrower to make general purchases or cash advances on credit. Thecredit facility is restricted to certain limits based on creditworthiness and requires a minimummonthly payment. Interest accrues from the time of transaction on any balances not paid in fullprior to the payment due date. There is generally no finite term for the facility and the receivable ispayable on demand.
Equipment Leases/LoansEquipment lease and loan contracts, originated by investment grade and non-investment gradesellers, represent the contractual obligations of customers who have either financed the purchase oftheir equipment or have arranged to lease their equipment. The underpinning equipment iscomposed of small, mid, and large ticket items related to various industries includingmanufacturing, transportation, agriculture and construction.
Floorplan FinancingsFloorplan financings are loans provided to affiliated dealers to finance the acquisition of inventory(usually vehicle or equipment dealers) which in turn are sold to the retail and commercialconsumers. These floorplan financing loans are originated by both captive financing companiesand third party financing companies. The Trust would be granted an assignment on thecontractual loans and a perfected security interest in the underpinning inventory and is entitled tothe collections remitted by the dealers upon the sale of the vehicle or equipment.
59
Glossary
Monthly Canadian ABS Report
September 2010
Insured MortgagesResidential mortgage insured by mortgage insurers with insurance premiums either paid by theborrower or the lender. The insurers must be rated at least AA (low) by DBRS to be eligible assecuritization counterparty.
Non-Conventional MortgagesAn uninsured residential mortgage with a LTV greater than 80% (increased from 75% in April2007), limited underwriting documentation, lower than monthly amortizing payments and/or toless credit worthy borrowers. This category also includes RMBS notes supported by thesemortgages.
Reverse MortgagesA reverse mortgage is a loan available to seniors, and is used to release the home equity in theproperty. Unlike a typical mortgage which requires regular payments to the lender, the homeowner with a reverse mortgage makes no payments and all interest is accrued and added to theloan amount. The homeowner's obligation to repay the loan is deferred until the property is vacantsuch as the decease of the owner, the sale of the property, or the move-out of the owner.
Secured Lines of CreditA receivable generated from a revolving credit facility established between a borrower and a lenderwhich allows the borrower to draw, repay and redraw sums of money up to the committed limitwith interest accruing on any amounts outstanding. This credit facility is usually secured by realestate or readily realizable securities, has no finite term and is payable on demand.
Unsecured Lines of CreditA receivable generated from a non-revolving facility with an amortizing repayment schedule for afinite term and without any assets used as collateral for the facility.
Waterheater RentalsMonetization of future monthly obligations due from home owners for their waterheaters.
60

Copyright © 2010, DBRS Limited and DBRS, Inc. (collectively, DBRS). All rights reserved. The information upon which DBRS ratings and reports are based is obtained by DBRSfrom sources believed by DBRS to be accurate and reliable. DBRS does not perform any audit and does not independently verify the accuracy of the information provided to it.DBRS ratings, reports and any other information provided by DBRS are provided as is and without representation or warranty of any kind. DBRS hereby disclaims anyrepresentation or warranty, express or implied, as to the accuracy, timeliness, completeness, merchantability, fitness for any particular purpose or non-infringement of any ofsuch information. In no event shall DBRS or its directors, officers, employees, independent contractors, agents and representatives (collectively, DBRS Representatives) be liable(1) for any inaccuracy, delay, loss of data, interruption in service, error or omission or for any damages resulting therefrom, or (2) for any direct, indirect, incidental, special,compensatory or consequential damages arising from any use of ratings and rating reports or arising from any error (negligent or otherwise) or other circumstance orcontingency within or outside the control of DBRS or any DBRS Representative, in connection with or related to obtaining, collecting, compiling, analyzing, interpreting,communicating, publishing or delivering any such information. Ratings and other opinions issued by DBRS are, and must be construed solely as, statements of opinion and notstatements of fact as to credit worthiness or recommendations to purchase, sell or hold any securities. A report providing a DBRS rating is neither a prospectus nor a substitutefor the information assembled, verified and presented to investors by the issuer and its agents in connection with the sale of the securities. DBRS receives compensation for itsrating activities from issuers, insurers, guarantors and/or underwriters of debt securities for assigning ratings and from subscribers to its website. DBRS is not responsible for thecontent or operation of third party websites accessed through hypertext or other computer links and DBRS shall have no liability to any person or entity for the use of such thirdparty websites. This publication may not be reproduced, retransmitted or distributed in any form without the prior written consent of DBRS.

Corporate HeadquartersDBRS Tower181 University AvenueSuite 700Toronto, ON M5H 3M7TEL +1 416 593 5577
www.dbrs.com