Embed Size (px)
Citation preview
Security Analytics: Risk Analysis for an Organisation's Incident Management
Process Marco Casassa Mont, Richard Brown, Simon Arnell, Neil Passingham
HP Laboratories
HPL-2012-206
Keyword(s): Security Analytics; Risk Analysis; What-if Analysis; Incident Management Processes; SOC
Abstract: This document is an example of the type of report an organisation would receive at the end of a HP Security
Analytics engagement. The focus is on the analysis of the security risks and performance of the organisation's
Security Incident Management Processes and related Security Operation Centre (SOC)'s activities. HP Labs carried
out the underlying R&D work in collaboration with HP Enterprise Security Services (HP ESS) and involved
analysis of processes, probabilistic modeling, simulation and "what-if" analysis for some of HP's key customers. The
outcome of this was a set of case studies from which we have been able to create this more general anonymised
report illustrating the richness of the risk assessment and "what-if" analysis that has been carried out. The lifecycle
management of security is critical for organisations to protect their key assets, ensure a correct security posture and
deal with emerging risks and threats. It involves various steps, usually carried out on an ongoing, regular basis,
including: risk assessment; policy definition; deployment of controls within the IT infrastructure; monitoring and
governance. In this context, Security Information & Events Management (SIEM) solutions play a key role. Even the
best information security practices and investments in security controls cannot guarantee that intrusions – accidental
and criminal activities – and/or other malicious acts will not happen. Controls can fail, be bypassed or become
inadequate over time; new threats emerge. Managing such incidents requires detective and corrective controls to
minimise adverse impacts, gather evidence, and learn from previous situations in order to improve over time. These
incident management processes are usually run in the context of a SOC and/or as part of specialised Computer
Security Incident Response Teams (CSIRTS), built on top of SOCs. Even with SIEM solutions in place, a potential
major risk for the organisation arises due to delays introduced in assessing and handling known incidents: this may
postpone the successful resolution of critical security incidents (e.g. devices exposed on the Internet, exploitation of
privileged accounts, deployed malware, etc.) and allow for further exploitation. Another related risk can be
introduced by sudden and/or progressive changes of the threat landscape, due to changing economic and social
scenarios, new business activities or process failings within the existing IT services. This might create unexpected
volumes of new events and alerts to be processed by the security team and as such, introduce additional delays.
Hence, it is important for an organisation to understand the risk exposure due to their Incident Management
processes, explore potential future scenarios (e.g. changes in available resources or threats landscapes or adoption of
Cloud solutions) and identify suitable ways to address related issues, e.g. by introducing process changes and/or
making investments in security controls.
External Posting Date: September 6, 2012 [Fulltext] Approved for External Publication
Internal Posting Date: September 6, 2012 [Fulltext]
Copyright 2012 Hewlett-Packard Development Company, L.P.
Security Analytics: Risk Analysis for an Organisation’s Incident
Management Processes
(1) Marco Casassa Mont, (1) Richard Brown, (2) Simon Arnell, (2) Neil Passingham
(1) Cloud & Security Lab, HP Labs, Bristol, UK (2) HP Enterprise Security Services
marco.casassa‐[email protected], [email protected], [email protected], [email protected]
Abstract
This document is an example of the type of report an organisation would receive at the end of a HP Security
Analytics engagement. The focus is on the analysis of the security risks and performance of the organisation’s
Security Incident Management Processes and related Security Operation Centre (SOC)’s activities. HP Labs carried
out the underlying R&D work in collaboration with HP Enterprise Security Services (HP ESS) and involved analysis of
processes, probabilistic modeling, simulation and “what‐if” analysis for some of HP’s key customers. The outcome
of this was a set of case studies from which we have been able to create this more general anonymised report
illustrating the richness of the risk assessment and “what‐if” analysis that has been carried out.
The lifecycle management of security is critical for organisations to protect their key assets, ensure a correct
security posture and deal with emerging risks and threats. It involves various steps, usually carried out on an
ongoing, regular basis, including: risk assessment; policy definition; deployment of controls within the IT
infrastructure; monitoring and governance. In this context, Security Information & Events Management (SIEM)
solutions play a key role. Even the best information security practices and investments in security controls cannot
guarantee that intrusions – accidental and criminal activities – and/or other malicious acts will not happen.
Controls can fail, be bypassed or become inadequate over time; new threats emerge. Managing such incidents
requires detective and corrective controls to minimise adverse impacts, gather evidence, and learn from previous
situations in order to improve over time. These incident management processes are usually run in the context of a
SOC and/or as part of specialised Computer Security Incident Response Teams (CSIRTS), built on top of SOCs.
Even with SIEM solutions in place, a potential major risk for the organisation arises due to delays introduced in
assessing and handling known incidents: this may postpone the successful resolution of critical security incidents
(e.g. devices exposed on the Internet, exploitation of privileged accounts, deployed malware, etc.) and allow for
further exploitation. Another related risk can be introduced by sudden and/or progressive changes of the threat
landscape, due to changing economic and social scenarios, new business activities or process failings within the
existing IT services. This might create unexpected volumes of new events and alerts to be processed by the
security team and as such, introduce additional delays. Hence, it is important for an organisation to understand the
risk exposure due to their Incident Management processes, explore potential future scenarios (e.g. changes in
available resources or threats landscapes or adoption of Cloud solutions) and identify suitable ways to address
related issues, e.g. by introducing process changes and/or making investments in security controls.
HP Security Analytics is uniquely positioned to provide the analysis of the involved risks, explore what‐if scenarios
and provide decision support for decision makers. This type of Security Analytics assessments is now available as a
service, provided by HP ESS.

Security Analytics ReportRisk Analysis: Security Event & Incident
Management ProcessesFor Illustrative Purposes Only

HP Security Analytics Final Report
Page 1 of 80
Disclaimer
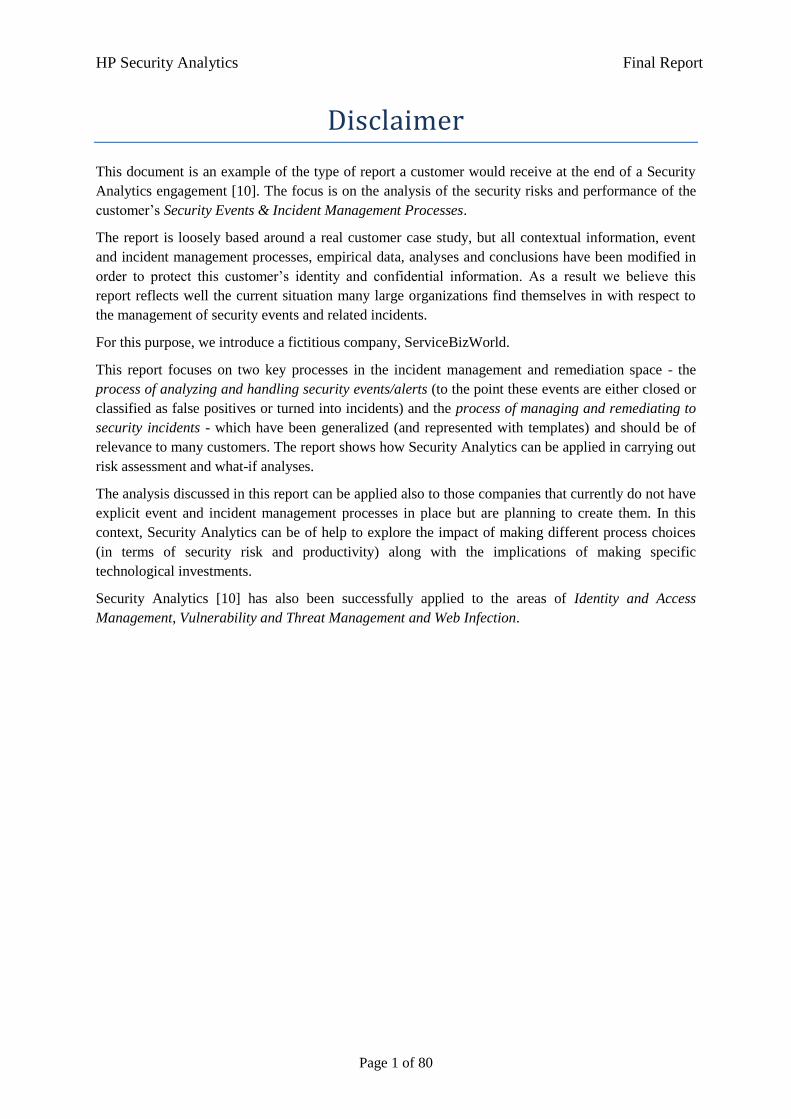
This document is an example of the type of report a customer would receive at the end of a Security
Analytics engagement [10]. The focus is on the analysis of the security risks and performance of the
customer’s Security Events & Incident Management Processes.
The report is loosely based around a real customer case study, but all contextual information, event
and incident management processes, empirical data, analyses and conclusions have been modified in
order to protect this customer’s identity and confidential information. As a result we believe this
report reflects well the current situation many large organizations find themselves in with respect to
the management of security events and related incidents.
For this purpose, we introduce a fictitious company, ServiceBizWorld.
This report focuses on two key processes in the incident management and remediation space - the
process of analyzing and handling security events/alerts (to the point these events are either closed or
classified as false positives or turned into incidents) and the process of managing and remediating to
security incidents - which have been generalized (and represented with templates) and should be of
relevance to many customers. The report shows how Security Analytics can be applied in carrying out
risk assessment and what-if analyses.
The analysis discussed in this report can be applied also to those companies that currently do not have
explicit event and incident management processes in place but are planning to create them. In this
context, Security Analytics can be of help to explore the impact of making different process choices
(in terms of security risk and productivity) along with the implications of making specific
technological investments.
Security Analytics [10] has also been successfully applied to the areas of Identity and Access
Management, Vulnerability and Threat Management and Web Infection.
HP Security Analytics Final Report
Page 2 of 80
HP Security Analytics Final Report
Page 3 of 80
Security Analytics Risk Analysis: Security Event & Incident Management Processes
Executive Summary
HP Labs conducted a detailed analysis of the current ServiceBizWorld’s Security Events and Incident
Management Processes. It was undertaken using HP’s Security Analytics modelling methodology.
The analysis focused on the Event/Alert Processing & Remediation Process and the Incident Management
Process. The latter is triggered when Major (IT) Security Incidents are identified by the SOC team. The analysis
included the examination of the risk exposure arising from current practice and process steps measured as the
time to identify and remediate security incidents. Models have been developed to simulate the arrival of
events/alerts and the execution of the involved processing steps. These models took into account the complexity
of events/alerts and their rate, the interactions with Third Parties (TPs), TP behaviours and non compliance
issues, various SOC team’s management steps. They measured, among other things, the time required to:
process events/alerts; identify minor and major security incidents and remediate them; identify false positives.
A first outcome of the analysis highlighted the complexity of the current processes; the models provide an
explicit representation of the involved steps.
Experimental results confirmed that interactions with TPs constitute a major bottleneck. Specifically they
account for 60-70% of the time required to process events/alerts (i.e. between 15-50 days). This is a critical
issue, as it negatively affects the processing of Major Security Incidents. Two key aspects have been identified
as root causes: the lack of specific SLAs with TPs about how information should be provided to the SOC Team;
the lack of information availability for TPs.
In this context, three what-if scenarios were explored using the model of the Event/Alert Processing &
Remediation Process (the most critical of the two analysed processes) to assess the impact on risk exposure and
performance, in case of: (1) improving SLAs with TPs; (2) changing threat environments; (3) improving
information availability for TPs. The main findings show that:
The definition of SLAs for TPs (e.g. about response time and number of iterations with the SOC Team) can
dramatically improve the overall performance and reduce the risk exposure by at least an order of
magnitude;
The current process might expose ServiceBizWorld to additional risks - in terms of delays to identify
security incidents and saturation of TP resources/personnel - if the daily number of new events to be
processed increases by about 30%;
Investments in new controls not only can improve the overall TP information availability and performance
(estimated to be an order of magnitude) but also help to cope with worsening threat landscapes.
Specifically, the adoption of information request templates and manual scripts can ensure process resilience
to a 60% increase of the daily number of new events/alerts to be processed. The introduction of automation
of scripts and/or workflows enables process resilience to an increase of 90% of events/alerts.
A what-if scenario for the Incident Management Process showed similar outcomes and improvements when
templates and automation are introduced to deal with incident response & remediation tasks.
These findings depend on the assumptions made and the information available at the time of the analysis. They
provide a starting point for conversations between ServiceBizWorld, TPs and the SOC Team, on expectations,
policy & SLA changes, as well as on potential new investments, to improve the current process performances,
reduce risk exposure and deal with contingency planning for worsening threat environments.
HP Security Analytics Final Report
Page 4 of 80
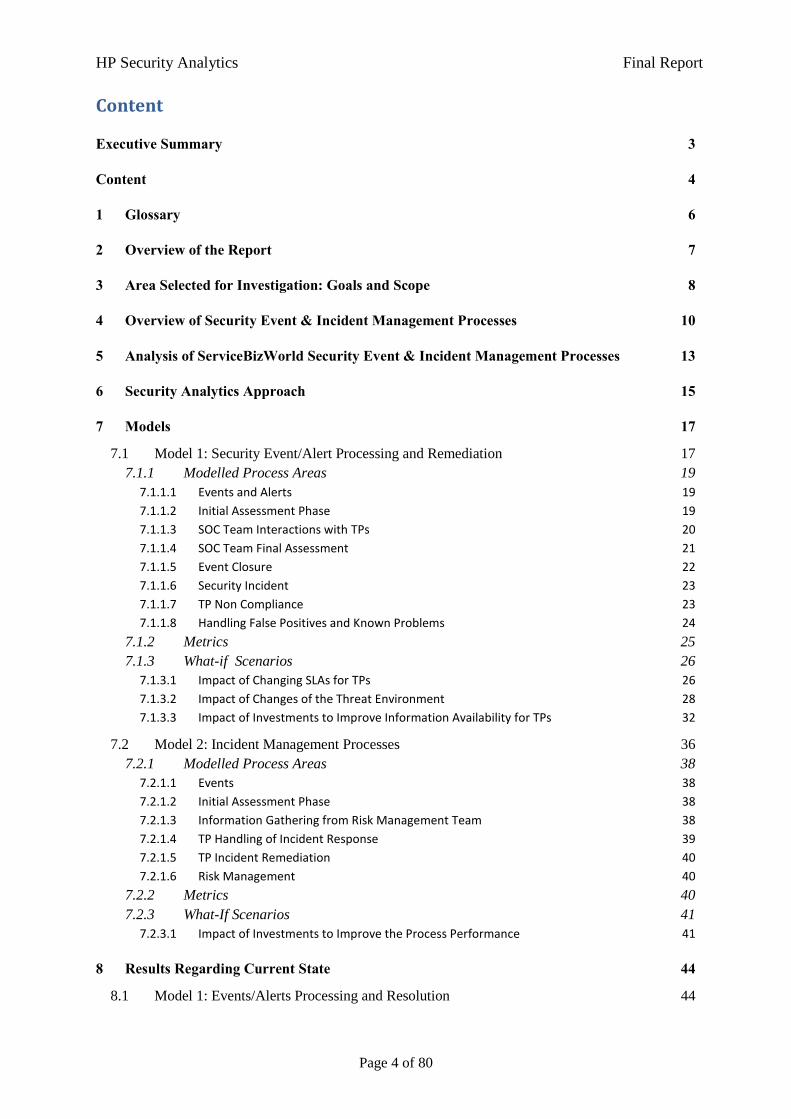
Content
Executive Summary 3
Content 4
1 Glossary 6
2 Overview of the Report 7
3 Area Selected for Investigation: Goals and Scope 8
4 Overview of Security Event & Incident Management Processes 10
5 Analysis of ServiceBizWorld Security Event & Incident Management Processes 13
6 Security Analytics Approach 15
7 Models 17
7.1 Model 1: Security Event/Alert Processing and Remediation 17
7.1.1 Modelled Process Areas 19
7.1.1.1 Events and Alerts 19
7.1.1.2 Initial Assessment Phase 19
7.1.1.3 SOC Team Interactions with TPs 20
7.1.1.4 SOC Team Final Assessment 21
7.1.1.5 Event Closure 22
7.1.1.6 Security Incident 23
7.1.1.7 TP Non Compliance 23
7.1.1.8 Handling False Positives and Known Problems 24
7.1.2 Metrics 25
7.1.3 What-if Scenarios 26
7.1.3.1 Impact of Changing SLAs for TPs 26
7.1.3.2 Impact of Changes of the Threat Environment 28
7.1.3.3 Impact of Investments to Improve Information Availability for TPs 32
7.2 Model 2: Incident Management Processes 36
7.2.1 Modelled Process Areas 38
7.2.1.1 Events 38
7.2.1.2 Initial Assessment Phase 38
7.2.1.3 Information Gathering from Risk Management Team 38
7.2.1.4 TP Handling of Incident Response 39
7.2.1.5 TP Incident Remediation 40
7.2.1.6 Risk Management 40
7.2.2 Metrics 40
7.2.3 What-If Scenarios 41
7.2.3.1 Impact of Investments to Improve the Process Performance 41
8 Results Regarding Current State 44
8.1 Model 1: Events/Alerts Processing and Resolution 44
HP Security Analytics Final Report
Page 5 of 80
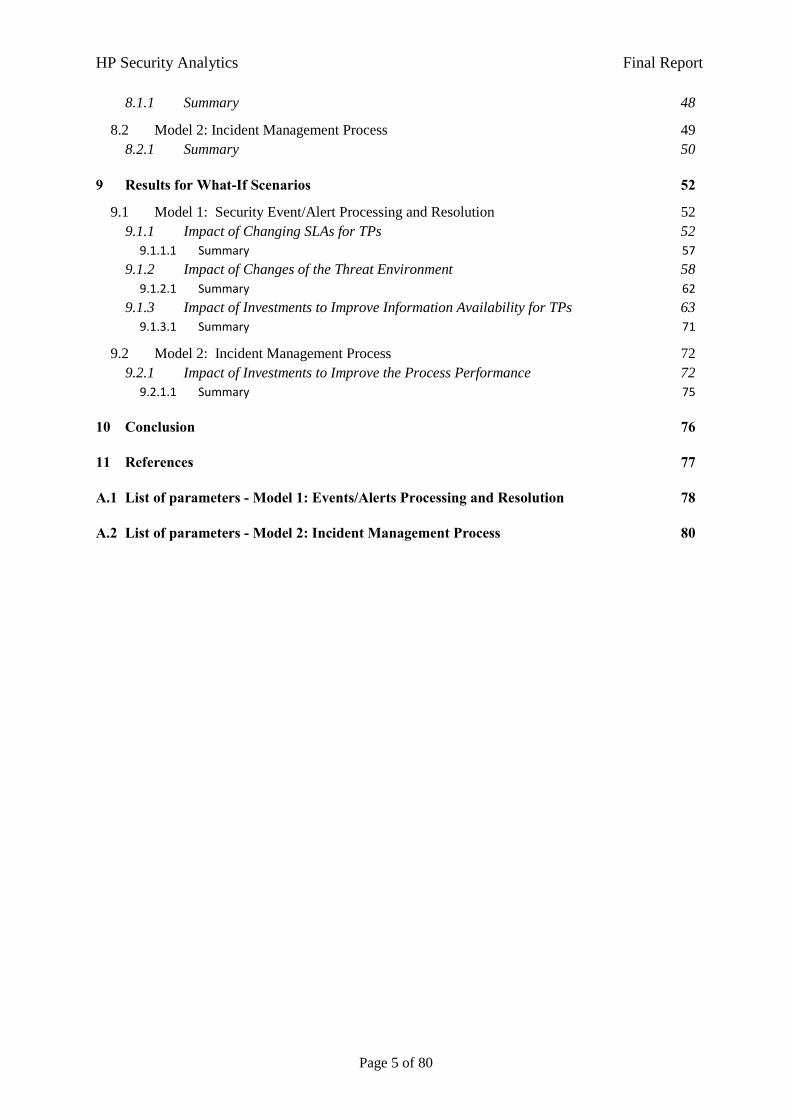
8.1.1 Summary 48
8.2 Model 2: Incident Management Process 49
8.2.1 Summary 50
9 Results for What-If Scenarios 52
9.1 Model 1: Security Event/Alert Processing and Resolution 52
9.1.1 Impact of Changing SLAs for TPs 52
9.1.1.1 Summary 57
9.1.2 Impact of Changes of the Threat Environment 58
9.1.2.1 Summary 62
9.1.3 Impact of Investments to Improve Information Availability for TPs 63
9.1.3.1 Summary 71
9.2 Model 2: Incident Management Process 72
9.2.1 Impact of Investments to Improve the Process Performance 72
9.2.1.1 Summary 75
10 Conclusion 76
11 References 77
A.1 List of parameters - Model 1: Events/Alerts Processing and Resolution 78
A.2 List of parameters - Model 2: Incident Management Process 80
HP Security Analytics Final Report
Page 6 of 80
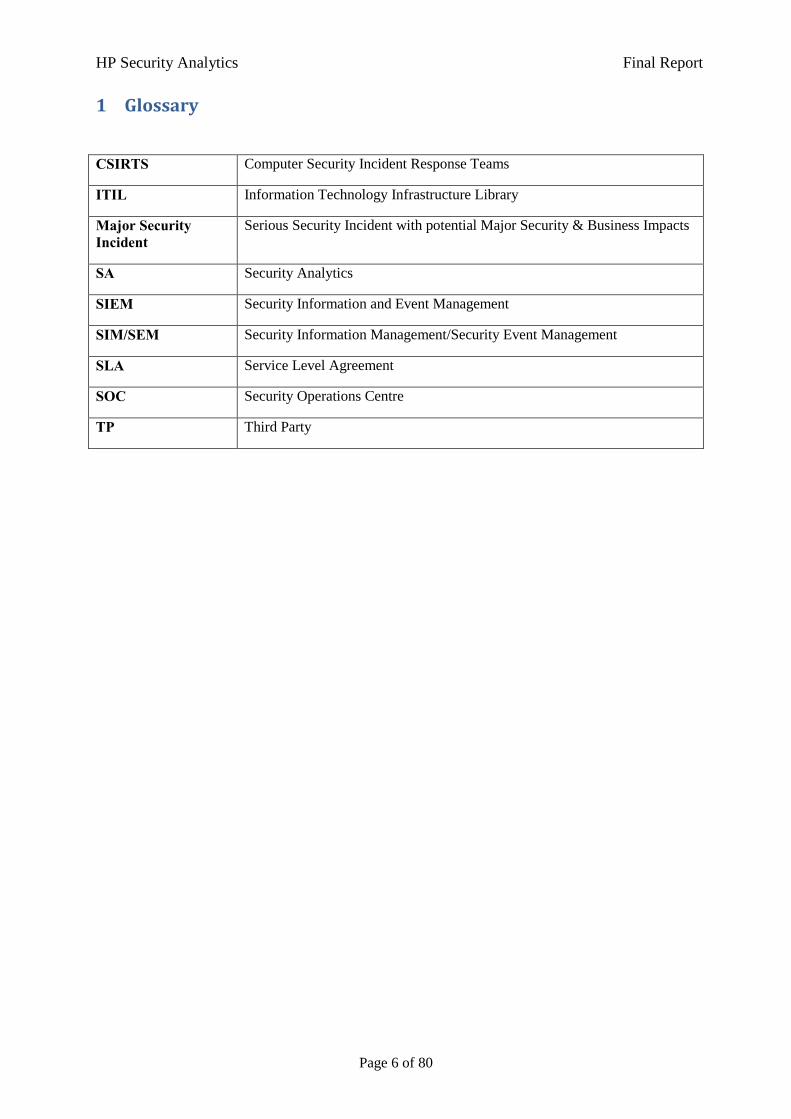
1 Glossary
CSIRTS Computer Security Incident Response Teams
ITIL Information Technology Infrastructure Library
Major Security Incident
Serious Security Incident with potential Major Security & Business Impacts
SA Security Analytics
SIEM Security Information and Event Management
SIM/SEM Security Information Management/Security Event Management
SLA Service Level Agreement
SOC Security Operations Centre
TP Third Party
HP Security Analytics Final Report
Page 7 of 80
2 Overview of the Report
This final report presents the findings of the security risk analysis for the ServiceBizWorld’s Event &
Incident Management Processes, based on the Security Analytics methodology [10] developed by HP
Labs.
Section 3 describes the problem space, the scope and the goals of this risk analysis.
Section 4 provides a general overview of the Security Event and Incident Management area.
Section 5 specifically analyses the current security event and incident management processes in place
at ServiceBizWorld.
Section 6 provides an overview of the HP Security Analytics approach and how it has been applied to
this area, to explore the problems investigated in this report.
Section 7 describes the two Security Analytics models developed by HP Labs, in collaboration with
ServiceBizWorld, related to: (1) their Events/Alerts Processing & Remediation Process; (2) their
Incident Management Process. This section also describes the agreed metrics and the what-if
scenarios that have been investigated.
Section 8 provides a detailed discussion of the risk assessment results obtained from the current
Security Analytics models.
Section 9 presents and discusses the outcomes of the analysis of various, related what-if scenarios.
Section 10 draws the final conclusions.
HP Security Analytics Final Report
Page 8 of 80
3 Area Selected for Investigation: Goals and Scope
The focus of the HP Labs security risk analysis is on the event & incident management processes that
are currently deployed and run by ServiceBizWorld. These processes are critical for the organisation
to identify potential security issues, analyse and mitigate them. They are complex and involve various
stakeholders: the SOC Centre/Security Team; the Risk Management Team; various Third Parties
(TPs). Specifically, these TPs include ServiceBizWorld’s IT department, ServiceBizWorld’s business
groups and the IT departments of external companies, which provide (business and IT) services to
ServiceBizWorld in the Cloud and/or in outsourcing.
The issues arising in this area, explored with the HP Security Analytics methodology, are captured in
the following statements:
– How to ensure that the right incident management processes are in place to handle both
current security threats and potential future critical ones?
– What is the risk exposure for ServiceBizWorld? What is the impact of changing threat
environments?
The area of Security Incident Management is wide as it covers various types of incidents, including
the ones related to: IT infrastructure; people behaviours; system failures; fraud; etc.
The security risk analysis discussed in this report focuses on IT security events and incidents. The
following priorities have been identified by ServiceBizWorld:
the need to be confident that ServiceBizWorld is ready to handle current and future security
threats;
the need to be able to justify investments and process changes.
The goals for the security risk analysis are:
Analyse the risk exposure of ServiceBizWorld due to the current security incident
management processes;
Analyse the impact of introducing new SLAs for the involved stakeholders and/or deploying
new controls within the incident management processes;
Analyse the impact on current processes (in terms of risk exposure) of changes of the threat
landscape (e.g. increase of number of new events/alerts to be processed);
Analyse the impact of deploying new controls within the current processes to mitigate
changes of the threat landscape.
A secondary goal of this analysis is to identify potential productivity issues related to current Incident
Management Processes and explore suitable ways for improvement.
The security analytics methodology adopted for this investigation has been specifically designed to
answer these types of questions. The methodology is based on system environment modelling and
predictive simulations, which allow the experimental exploration of risk and productivity across the
set of outcomes for the current incident management and remediation processes. It also provides the
ability to examine the impact of deploying different types of controls and/or process changes along
with exploring the impact of a changing threat landscape.
Changes to the event & incident management processes need to have the support of the various
involved stakeholders and potentially continued investments in a platform that can facilitate the
HP Security Analytics Final Report
Page 9 of 80
overall processes. This requires strategic alignment with ServiceBizWorld’s overall business
objectives and risk posture.
The final aim of the analysis discussed in this report is to provide evidence to ServiceBizWorld and its
Security & Risk Management teams to support their decision making process, specifically in
identifying suitable policies and SLAs changes and/or justify future investments in process changes
and controls.
HP Security Analytics Final Report
Page 10 of 80
4 Overview of Security Event & Incident Management Processes
The lifecycle management of security is critical for organisations, to protect their key assets, ensure a
correct security posture and deal with emerging risks and threats. It involves various steps, usually
carried out on an ongoing, cyclic basis, including: risk assessment; policy definition; deployment of
controls within the IT infrastructure; monitoring and governance.
In this context, Security Event Monitoring and Incident Management play a key role. Even the best
information security practice and security control investments cannot guarantee that intrusions,
accidental and criminal activities and/or other malicious acts will not happen. Controls can fail, be
bypassed or become inadequate over time. New threats could emerge.
ITIL [1] defines an incident as "any event which is not part of the standard operation of a service and
which causes, or may cause, an interruption to, or a reduction in, the quality of service". A similar
definition could apply in the context of security incidents, which might not only cause a reduction in
the quality of service but also expose the organisation to additional risks.
This document specifically focuses on IT security incidents and the processes that organisations put in
place for their management and remediation.
Various types of security incidents are of concerns to organisations, including: deployment of
malicious software and malware within critical IT systems; misuse of systems and services by users;
unauthorised access to resources; computer sabotage and damages; intrusion of critical
systems/services; information theft and espionage.
Managing incidents involves detective and corrective controls to minimise adverse impacts, gather
evidence, learn from previous situations and improve over time. When security incidents occur, it is
important for an organization to effectively manage and respond to them. The speed with which an
organization can recognize, analyze, and respond to a security incident will limit the impact of the
damage and potentially lower the cost of recovery [2]. This process carried out by organisations to
collect, identify, analyze, and determine an organizational response to security incidents is called
incident management. Processes are usually put in place to deal with incident management. The staff,
resources, and infrastructure used to perform this function makeup the incident management
capability.
Various controls are currently available for organisations, including Security Information and Event
Management (SIEM) solutions and Security Operations Centres (SOCs) [5].
SIEM solutions, including HP ArcSight [3], RSA enVision [4], etc. provide real-time analysis of IT
and security events generated from the IT infrastructure including network hardware, systems,
applications and services. Various degrees of correlations and analysis are offered by these solutions
to focus on the root causes of events, identify potential critical alerts, store logs for forensic purposes
and generate reports for compliance management.
However, the events and alerts generated by these systems often require analysis and further
processing by security specialists to fully understand their nature and implications, identify critical
incidents and apply the right strategy to mitigate them.
In this context, Security Event & Incident Management Processes need to be put in place, along with
security teams, to execute on the management of events and alerts and the resolution of related
incidents.
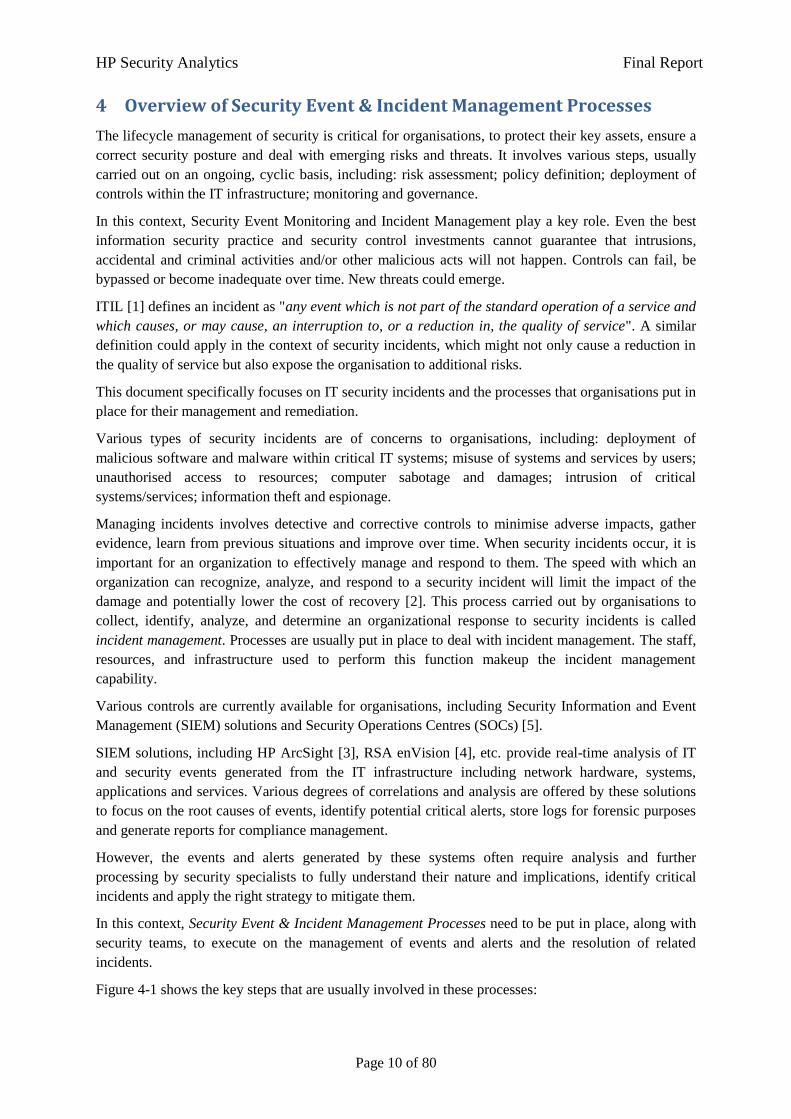
Figure 4-1 shows the key steps that are usually involved in these processes:
HP Security Analytics Final Report
Page 11 of 80
Figure 4-1. Security Event & Incident Management Processes
They include:
Collection of events and alerts: the initial phase, where filtered/correlated events and alerts
are provided by SIEM solutions to the security team;
Triage and initial analysis: it involves an initial analysis and assessment of the events and
alerts, to identify potential known problems and false positives. The output of this step is
either a decision to close the event/alert (in case of known issue or false positive) or to
proceed with a deeper analysis;
Collection of additional information from the involved stakeholders: it usually involves the
collection of additional information about events/alerts, potentially from the involved
stakeholders, i.e. the IT department, business areas, etc. This information is necessary to
gather further evidence and data to assess the seriousness of the event/alert, identify the root
causes, assess the involved risks and support informed decision making;
Final Assessment: it involves making a final decision about the nature of the events and alerts.
The collected evidence might still indicate that it is a false positive or it should be closed as
not critical for the organisations. Alternatively, a security incident might be raised and/or
escalated for remediation;
Identification of Remediation steps for the Incident: it involves the identification of
remediation steps to deal with the incident. This activity is usually carried out jointly with the
involved parties within the organisation;
Incident Remediation: it involves the actual resolution and remediation of the security
incident by the involved entity, along with handling any residual risks due to failures to
mitigate the security incident.
HP Security Analytics Final Report
Page 12 of 80
It is important to notice that the management of false positives and known problems usually consume
“resources” that could be used for the investigation of real security incidents. Ideally, it is desirable to
minimise the number of false positives. This usually requires fine tuning activities between the SIEM
solutions (raising events/alerts) and the initial assessment phase.
The incident management processes are usually run in the context of Security Operation Centres
(SOC) [5] and/or as part of specialised Computer Security Incident Response Teams (CSIRTS) [6],
built on top of SOC centres.
The work of the involved security team(s) can be supported by a variety of technical controls and
solutions including workflow systems, incident tracking and support solutions, knowledge bases and
collaborative tools, etc. However, quite often the involved processes are driven by human activities
and the investigative skills of the security team members. As such, these processes might be subject to
a variety of issues and potential failures, including:
Delays due to lack of resources (personnel) to handle large volumes of events/alerts;
Delays due to complex process steps and failures in human interactions and communications;
Bottlenecks generated by some of the stakeholders to retrieve relevant information, e.g. by IT
departments or business groups;
Failures in assessing the severity of events/alerts and their correct categorization as
incidents;
Lack of tools, expertise and capabilities to remediate security incidents.
These issues and failures can expose the organisation to additional risks.
A potential major risk for the organisation is due to delays introduced in assessing and handling
known incidents: this might postpone the successful resolution of critical security incidents (e.g.
devices exposed on the Internet, exploitation of privileged accounts, deployed malware, etc.) and
allow for further exploitation.
Another related risk can be introduced by sudden or progressive changes of the threat landscape, due
to changing economical and social scenarios and/or new business activities. This might create
unexpected volumes of new events and alerts to be processed by the security team and as such,
introduce additional delays.
To summarise, the space of Security Event & Incident Management is complicated and with many
uncertainty points: it is subject to changing threat environments; it is defined by a variety of processes
and process steps relying on people, human interactions, controls and information flows; it is subject
to technical issues and failures.
It is important for an organisation to understand their risk exposure due to the Incident Management
processes and identify suitable ways to address related issues, e.g. by introducing process changes
and/or making investments in security controls.
HP Security Analytics is uniquely positioned to provide the analysis of the involved risks, explore
what-if scenarios and provide decision support for decision makers.
This report discusses the findings of the risk analysis carried out by HP Labs for ServiceBizWorld
event & incident management processes, along with the exploration of what-if scenarios aiming at
providing specific decision support and enabling further discussions between the involved
stakeholders.
HP Security Analytics Final Report
Page 13 of 80
5 Analysis of ServiceBizWorld Security Event & Incident
Management Processes
The Security Operations Centre (SOC) team currently runs the core ServiceBizWorld processes for
(IT) security event & incident management processes.
ServiceBizWorld has a complex IT and business infrastructure. Part of its IT and service
infrastructure is run by third parties, either in the context of outsourcing contracts and/or by using
services in the Cloud.
In order to assess the specific security event & incident management processes, identify potential risk
exposures for ServiceBizWorld and explore relevant what-if scenarios, HP Labs requested
information from key SOC and ServiceBizWorld personnel. Information and data have been provided
to support this analysis along with detailed explanations of the various process steps and interactions.
Various stakeholders are involved in these processes:
The SOC team: it provides the key coordination, supervision and assessment capabilities for
the management of events/alerts and the processing of related incidents;
The Security Risk Management team: it is the ServiceBizWorld team that provides further
guidance on priorities and decisions about incident management. It has a longer term,
strategic view on security aspects and related policies driven not only by security
requirements but also by business needs;
Various third parties, including ServiceBizWorld’s IT department, ServiceBizWorld’s
business groups and the IT departments of external companies, which provide (business and
IT) services to ServiceBizWorld in the Cloud and/or in outsourcing.
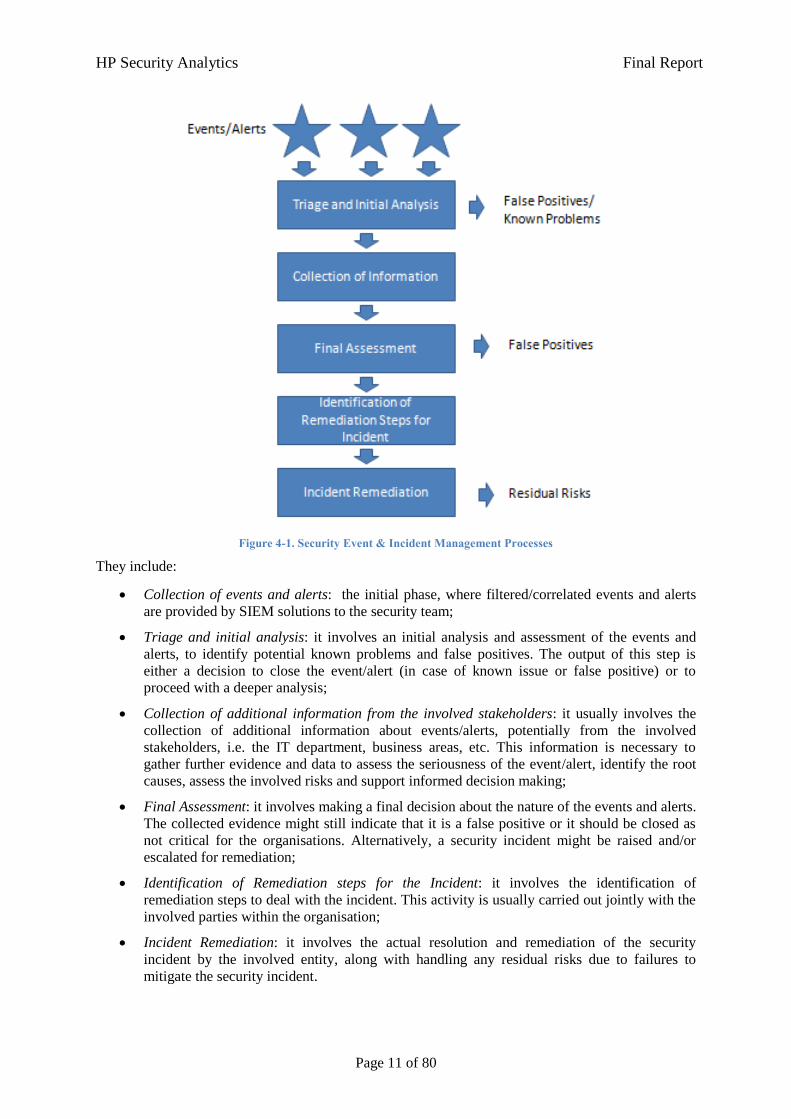
The relevant SOC Event & Security Incident Management activities can be classified in two types of
processes, shown in Figure 5-1:
Events/Alerts Processing and Resolution Process
Security Incident Management Process
Events/Alerts
- Known Problems- False Positives- Event Closure- Minor Security
Incidents
Major Security Incidents
- Remediated Security Incidents- Risk Management
Figure 5-1. ServiceBizWorld’s Security Event & Incident Management Processes
HP Security Analytics Final Report
Page 14 of 80
The first process, referred in this report as “Events/Alerts Processing and Resolution Process”,
primarily aims at: providing the initial assessment of events/alerts; gathering of relevant information
from the involved TPs to further analyse the events/alerts; dealing with the final assessment of
events/alerts and their classification as false positives, known problems, events to be closed, minor
security incidents and major security incidents.
This process is fed by a variety of events/alerts, originated by notifications sent to the SOC team by
various SIEM tools and TPs. The SIEM tools include, among others, the HP ArcSight [3] and RSA
enVision solutions [4].
Specifically, the events/alerts collected from the SIEM system could relate to:
Managed internal firewalls;
Managed network devices;
Domain authentication events;
Malware security events;
Authentication events.
Based on information provided by the SOC team, on average 35-40 events/alerts are processed on
daily basis, i.e. about 12000-15000 per year.
Among all these events/alerts, a small part of them involve Major Security Incidents. These are
critical security incidents for which a full report has to be provided to the Risk Management team and
that trigger the second process. These are also referred to as “Managed Security Incident” as the SOC
team is directly involved in the incident resolution process. On average, 800-900 major security
incidents are raised on yearly basis.
The category of Major (IT) Security Incidents include: discovery of exposure of ServiceWorldBiz’s
devices and systems to the Internet; unauthorised privilege escalation; malware security incidents;
security log cleaning; misuse of authentication tokens; incidents raised from internal firewalls.
The second process, referred in this report as “Security Incident Management Process” is triggered
when Major Security Incidents are raised by the SOC team.
This process involves the steps of: identifying and agreeing remediation requirements for major
security incidents, related to TPs (task usually carried out jointly by the SOC team and the Risk
Management team); the actual phase involving TPs remediation to the incident.
Next sections provide further detail of how the information about these two processes has been
interpreted and captured in Security Analytics models to carry out the investigations described in
Section 3.
These models will primarily focus on the interactions between the SOC team and Third Parties (TPs).
The key interactions with the Risk Management team have also been modelled.
HP Security Analytics Final Report
Page 15 of 80
6 Security Analytics Approach
Two Security Analytics models have been built, one for each process mentioned in Section 5, in order
to carry out the analysis of ServiceBizWorld’s risk exposure to the Security Event & Incident
Management Processes:
1. Model #1: Events/Alerts Processing and Resolution Process;
2. Model #2: Security Incident Management Process.
Each model represents the involved process steps, interactions with TPs, information flows and
decision points.
These models measure the time to carry out various activities and determine the potential process
outcomes: false positives, known problems, events to be closed, minor security incidents and major
security incidents. Additional metrics have been used to count the occurrence of such outcomes.
These metrics, discussed in detail in Section 7, have been used to provide the required estimates of
risk exposure and productivity.
We anticipate that the interactions with TPs introduce a major bottleneck with a negative impact on
risk exposure and productivity. As such, the related parts of the processes have been subject of
specific analysis and risk assessment (as well as what-if analysis), as discussed in the next Sections.
The Security Analytics models have been used to carry out the investigations presented in Section 3,
i.e. to identify:
The level of risk exposure for ServiceBizWorld, to manage and mitigate IT security incidents
with current processes, based on the overall time required to handle these incidents;
The impact of bottlenecks introduced by TPs, in the current processes;
The predicted improvements of changing SLAs with TPs and/or introducing new controls within
current processes (what-if scenario);
The level of risk exposure to manage and mitigate IT security incidents, in case of changing threat
landscapes, based on the overall time required to handle these incidents (what-if scenario);
The predicted improvements, in case of a changing threat landscape, by introducing new controls
within current processes (what-if scenarios).
Specifically, the two models have been built by using a flow chart-based graphical representation.
To validate them, they have initially been used to provide an estimate of the risk exposure to and
productivity for current processes. This phase was iterated over a few times with the SOC and Risk
Management teams to ensure that the right process steps and the correct empirical data were captured
by the. After their validation, the two models have been used to explore “what-if scenarios”, as
requested by ServiceBizWorld.
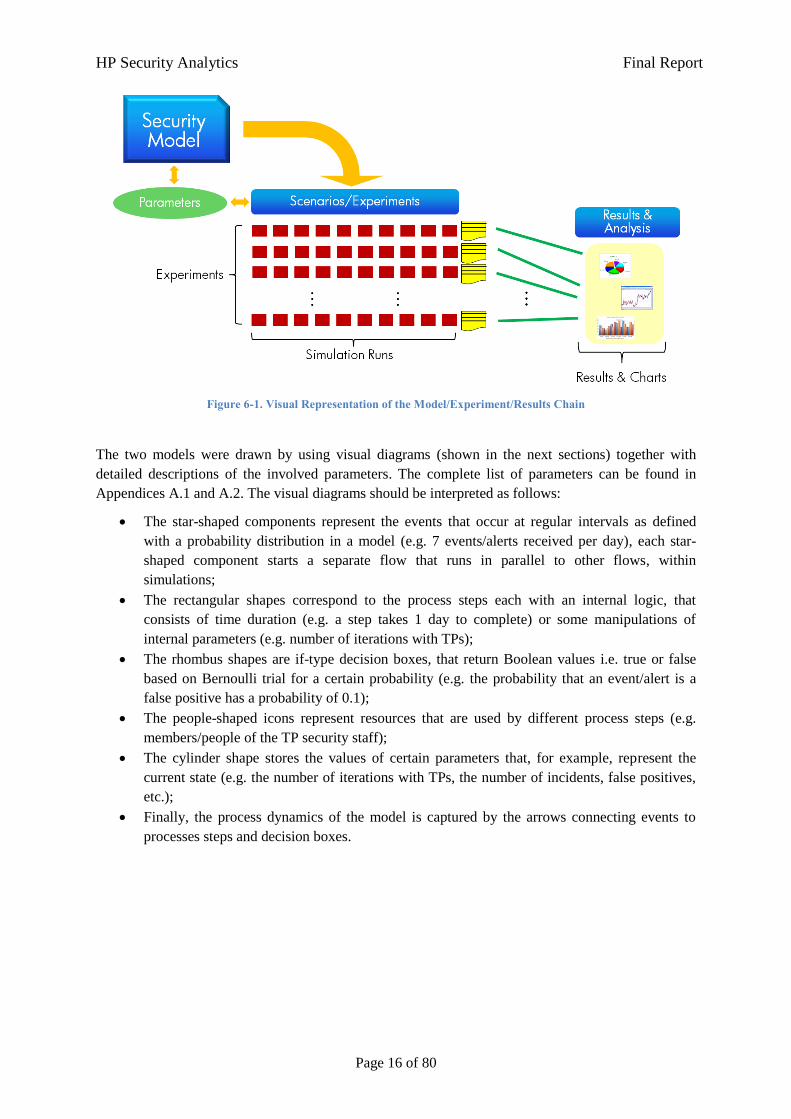
The visual representations of the models were created by using the HP proprietary Gnosis modelling
toolset, with the various shapes in the model instantiated with a set of parameters. The models were
then transformed by the toolset into executable code, which was used to run Monte Carlo simulations.
This whole analytic chain is shown in Figure 6-1.
HP Security Analytics Final Report
Page 16 of 80
Figure 6-1. Visual Representation of the Model/Experiment/Results Chain
The two models were drawn by using visual diagrams (shown in the next sections) together with
detailed descriptions of the involved parameters. The complete list of parameters can be found in
Appendices A.1 and A.2. The visual diagrams should be interpreted as follows:
The star-shaped components represent the events that occur at regular intervals as defined
with a probability distribution in a model (e.g. 7 events/alerts received per day), each star-
shaped component starts a separate flow that runs in parallel to other flows, within
simulations;
The rectangular shapes correspond to the process steps each with an internal logic, that
consists of time duration (e.g. a step takes 1 day to complete) or some manipulations of
internal parameters (e.g. number of iterations with TPs);
The rhombus shapes are if-type decision boxes, that return Boolean values i.e. true or false
based on Bernoulli trial for a certain probability (e.g. the probability that an event/alert is a
false positive has a probability of 0.1);
The people-shaped icons represent resources that are used by different process steps (e.g.
members/people of the TP security staff);
The cylinder shape stores the values of certain parameters that, for example, represent the
current state (e.g. the number of iterations with TPs, the number of incidents, false positives,
etc.);
Finally, the process dynamics of the model is captured by the arrows connecting events to
processes steps and decision boxes.
HP Security Analytics Final Report
Page 17 of 80
7 Models
This section presents the two models built by HP Labs to carry out the risk and performance analysis
for the ServiceBizWorld’s Event & Incident Management processes. It also describes the set of
metrics used to convey analytic results and the what-if scenarios that have been explored with the
models.
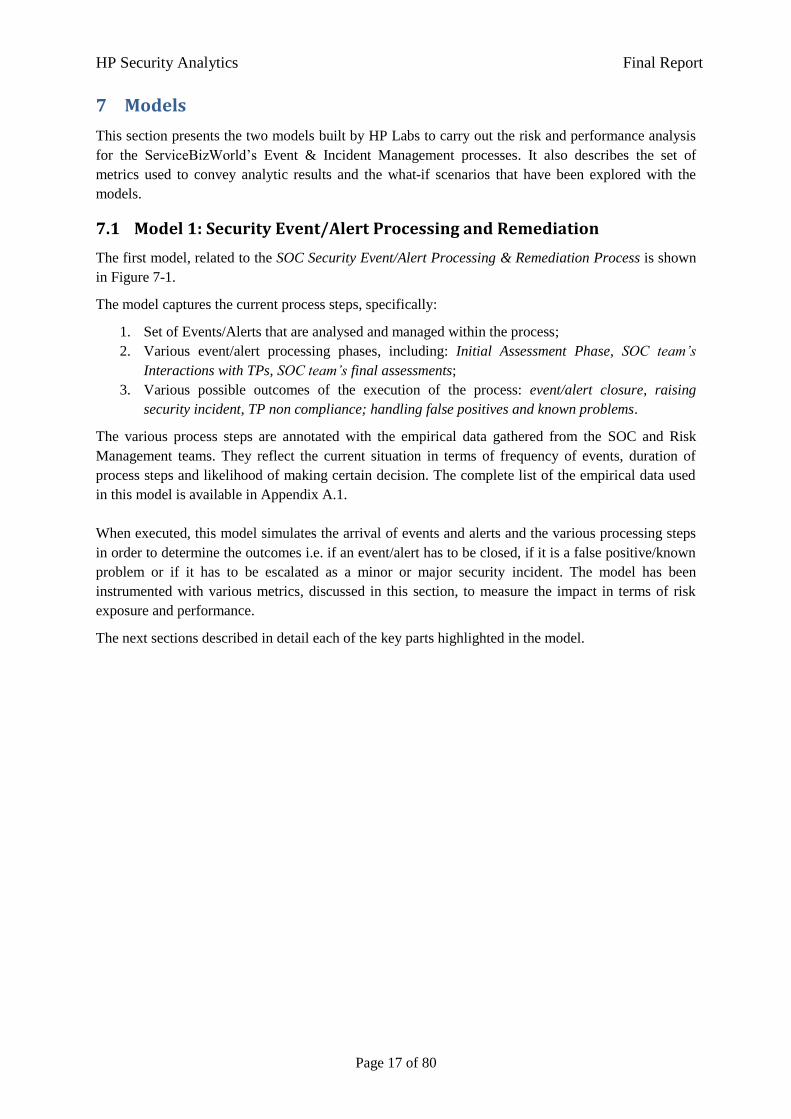
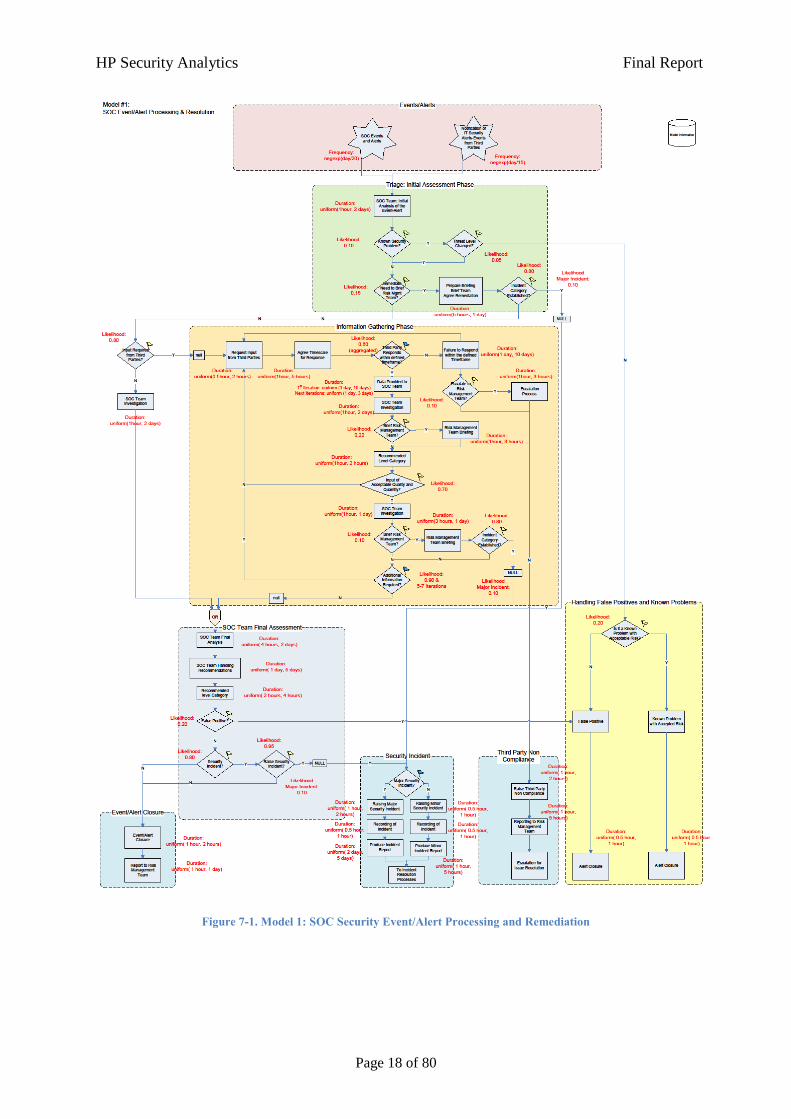
7.1 Model 1: Security Event/Alert Processing and Remediation
The first model, related to the SOC Security Event/Alert Processing & Remediation Process is shown
in Figure 7-1.
The model captures the current process steps, specifically:
1. Set of Events/Alerts that are analysed and managed within the process;
2. Various event/alert processing phases, including: Initial Assessment Phase, SOC team’s
Interactions with TPs, SOC team’s final assessments;
3. Various possible outcomes of the execution of the process: event/alert closure, raising
security incident, TP non compliance; handling false positives and known problems.
The various process steps are annotated with the empirical data gathered from the SOC and Risk
Management teams. They reflect the current situation in terms of frequency of events, duration of
process steps and likelihood of making certain decision. The complete list of the empirical data used
in this model is available in Appendix A.1.
When executed, this model simulates the arrival of events and alerts and the various processing steps
in order to determine the outcomes i.e. if an event/alert has to be closed, if it is a false positive/known
problem or if it has to be escalated as a minor or major security incident. The model has been
instrumented with various metrics, discussed in this section, to measure the impact in terms of risk
exposure and performance.
The next sections described in detail each of the key parts highlighted in the model.
HP Security Analytics Final Report
Page 18 of 80
Figure 7-1. Model 1: SOC Security Event/Alert Processing and Remediation
HP Security Analytics Final Report
Page 19 of 80
7.1.1 Modelled Process Areas
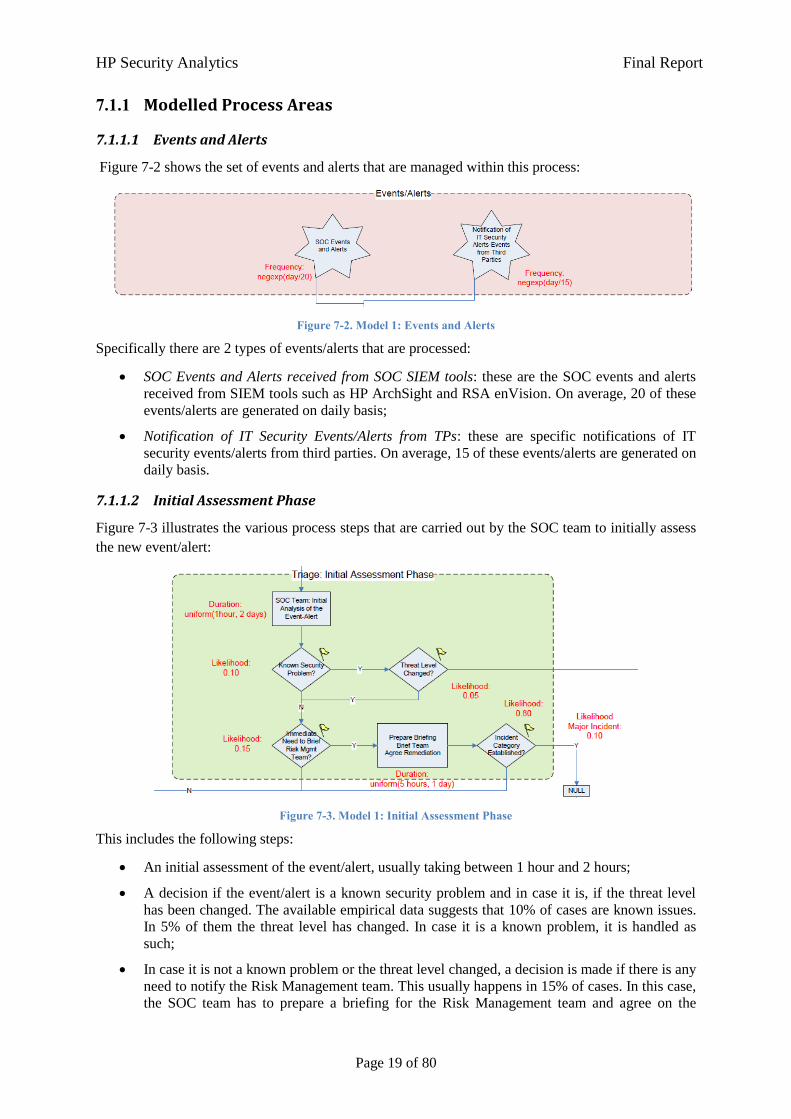
7.1.1.1 Events and Alerts
Figure 7-2 shows the set of events and alerts that are managed within this process:
Figure 7-2. Model 1: Events and Alerts
Specifically there are 2 types of events/alerts that are processed:
SOC Events and Alerts received from SOC SIEM tools: these are the SOC events and alerts
received from SIEM tools such as HP ArchSight and RSA enVision. On average, 20 of these
events/alerts are generated on daily basis;
Notification of IT Security Events/Alerts from TPs: these are specific notifications of IT
security events/alerts from third parties. On average, 15 of these events/alerts are generated on
daily basis.
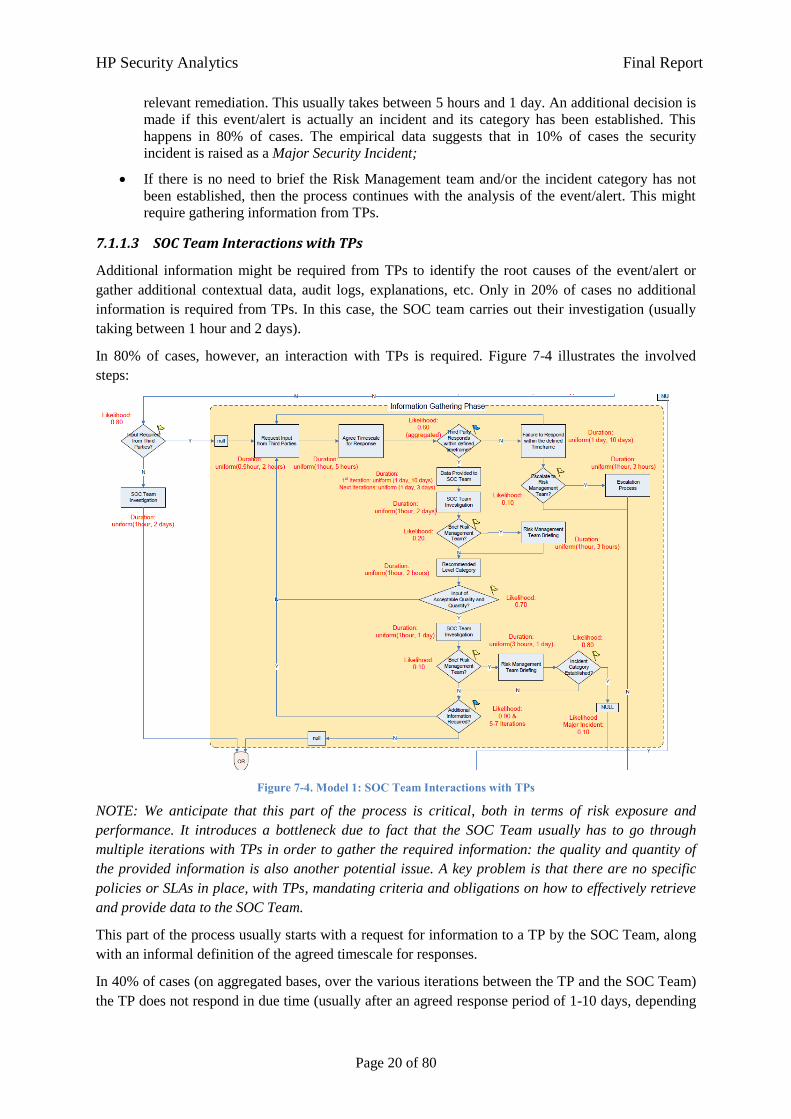
7.1.1.2 Initial Assessment Phase
Figure 7-3 illustrates the various process steps that are carried out by the SOC team to initially assess
the new event/alert:
Figure 7-3. Model 1: Initial Assessment Phase
This includes the following steps:
An initial assessment of the event/alert, usually taking between 1 hour and 2 hours;
A decision if the event/alert is a known security problem and in case it is, if the threat level
has been changed. The available empirical data suggests that 10% of cases are known issues.
In 5% of them the threat level has changed. In case it is a known problem, it is handled as
such;
In case it is not a known problem or the threat level changed, a decision is made if there is any
need to notify the Risk Management team. This usually happens in 15% of cases. In this case,
the SOC team has to prepare a briefing for the Risk Management team and agree on the
HP Security Analytics Final Report
Page 20 of 80
relevant remediation. This usually takes between 5 hours and 1 day. An additional decision is
made if this event/alert is actually an incident and its category has been established. This
happens in 80% of cases. The empirical data suggests that in 10% of cases the security
incident is raised as a Major Security Incident;
If there is no need to brief the Risk Management team and/or the incident category has not
been established, then the process continues with the analysis of the event/alert. This might
require gathering information from TPs.
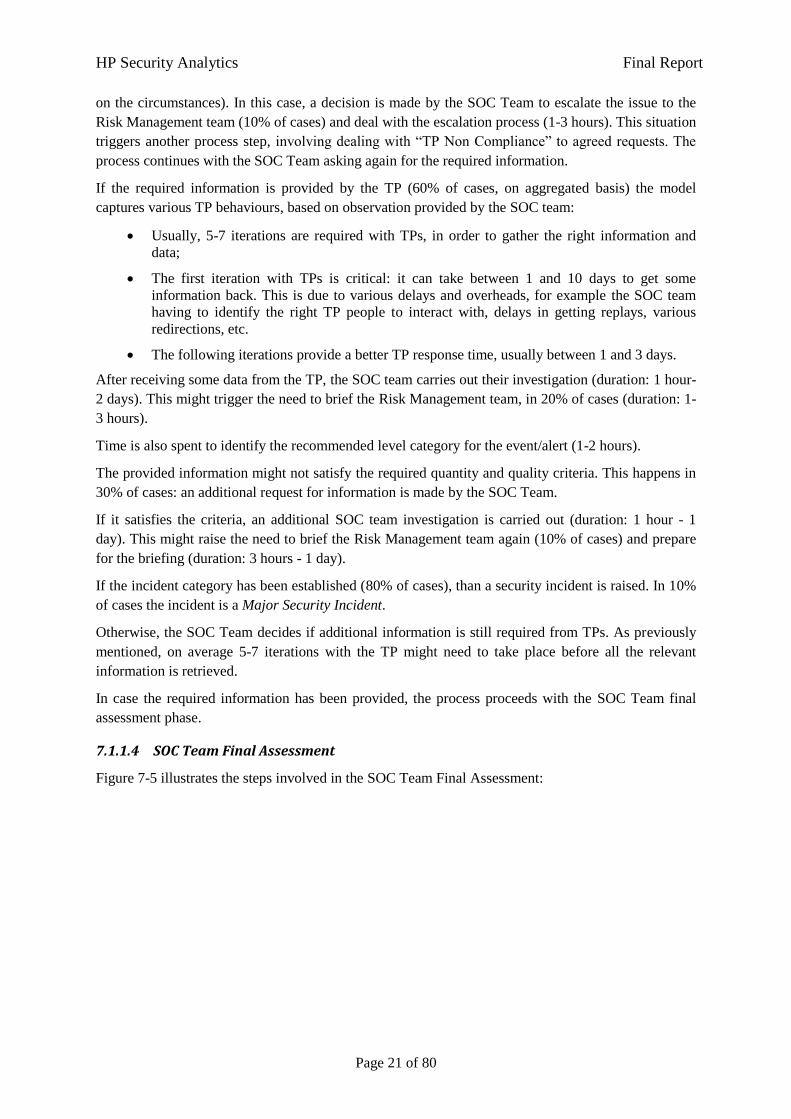
7.1.1.3 SOC Team Interactions with TPs
Additional information might be required from TPs to identify the root causes of the event/alert or
gather additional contextual data, audit logs, explanations, etc. Only in 20% of cases no additional
information is required from TPs. In this case, the SOC team carries out their investigation (usually
taking between 1 hour and 2 days).
In 80% of cases, however, an interaction with TPs is required. Figure 7-4 illustrates the involved
steps:
Figure 7-4. Model 1: SOC Team Interactions with TPs
NOTE: We anticipate that this part of the process is critical, both in terms of risk exposure and
performance. It introduces a bottleneck due to fact that the SOC Team usually has to go through
multiple iterations with TPs in order to gather the required information: the quality and quantity of
the provided information is also another potential issue. A key problem is that there are no specific
policies or SLAs in place, with TPs, mandating criteria and obligations on how to effectively retrieve
and provide data to the SOC Team.
This part of the process usually starts with a request for information to a TP by the SOC Team, along
with an informal definition of the agreed timescale for responses.
In 40% of cases (on aggregated bases, over the various iterations between the TP and the SOC Team)
the TP does not respond in due time (usually after an agreed response period of 1-10 days, depending
HP Security Analytics Final Report
Page 21 of 80
on the circumstances). In this case, a decision is made by the SOC Team to escalate the issue to the
Risk Management team (10% of cases) and deal with the escalation process (1-3 hours). This situation
triggers another process step, involving dealing with “TP Non Compliance” to agreed requests. The
process continues with the SOC Team asking again for the required information.
If the required information is provided by the TP (60% of cases, on aggregated basis) the model
captures various TP behaviours, based on observation provided by the SOC team:
Usually, 5-7 iterations are required with TPs, in order to gather the right information and
data;
The first iteration with TPs is critical: it can take between 1 and 10 days to get some
information back. This is due to various delays and overheads, for example the SOC team
having to identify the right TP people to interact with, delays in getting replays, various
redirections, etc.
The following iterations provide a better TP response time, usually between 1 and 3 days.
After receiving some data from the TP, the SOC team carries out their investigation (duration: 1 hour-
2 days). This might trigger the need to brief the Risk Management team, in 20% of cases (duration: 1-
3 hours).
Time is also spent to identify the recommended level category for the event/alert (1-2 hours).
The provided information might not satisfy the required quantity and quality criteria. This happens in
30% of cases: an additional request for information is made by the SOC Team.
If it satisfies the criteria, an additional SOC team investigation is carried out (duration: 1 hour - 1
day). This might raise the need to brief the Risk Management team again (10% of cases) and prepare
for the briefing (duration: 3 hours - 1 day).
If the incident category has been established (80% of cases), than a security incident is raised. In 10%
of cases the incident is a Major Security Incident.
Otherwise, the SOC Team decides if additional information is still required from TPs. As previously
mentioned, on average 5-7 iterations with the TP might need to take place before all the relevant
information is retrieved.
In case the required information has been provided, the process proceeds with the SOC Team final
assessment phase.
7.1.1.4 SOC Team Final Assessment
Figure 7-5 illustrates the steps involved in the SOC Team Final Assessment:
HP Security Analytics Final Report
Page 22 of 80
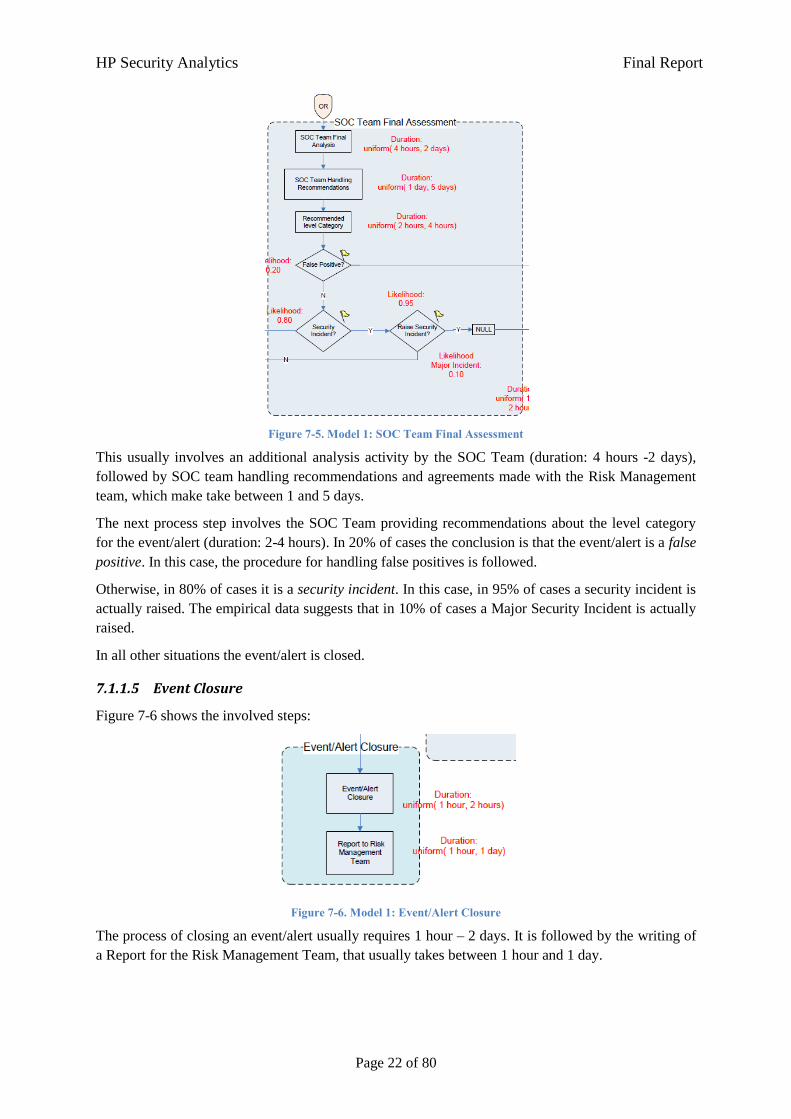
Figure 7-5. Model 1: SOC Team Final Assessment
This usually involves an additional analysis activity by the SOC Team (duration: 4 hours -2 days),
followed by SOC team handling recommendations and agreements made with the Risk Management
team, which make take between 1 and 5 days.
The next process step involves the SOC Team providing recommendations about the level category
for the event/alert (duration: 2-4 hours). In 20% of cases the conclusion is that the event/alert is a false
positive. In this case, the procedure for handling false positives is followed.
Otherwise, in 80% of cases it is a security incident. In this case, in 95% of cases a security incident is
actually raised. The empirical data suggests that in 10% of cases a Major Security Incident is actually
raised.
In all other situations the event/alert is closed.
7.1.1.5 Event Closure
Figure 7-6 shows the involved steps:
Figure 7-6. Model 1: Event/Alert Closure
The process of closing an event/alert usually requires 1 hour – 2 days. It is followed by the writing of
a Report for the Risk Management Team, that usually takes between 1 hour and 1 day.
HP Security Analytics Final Report
Page 23 of 80
7.1.1.6 Security Incident
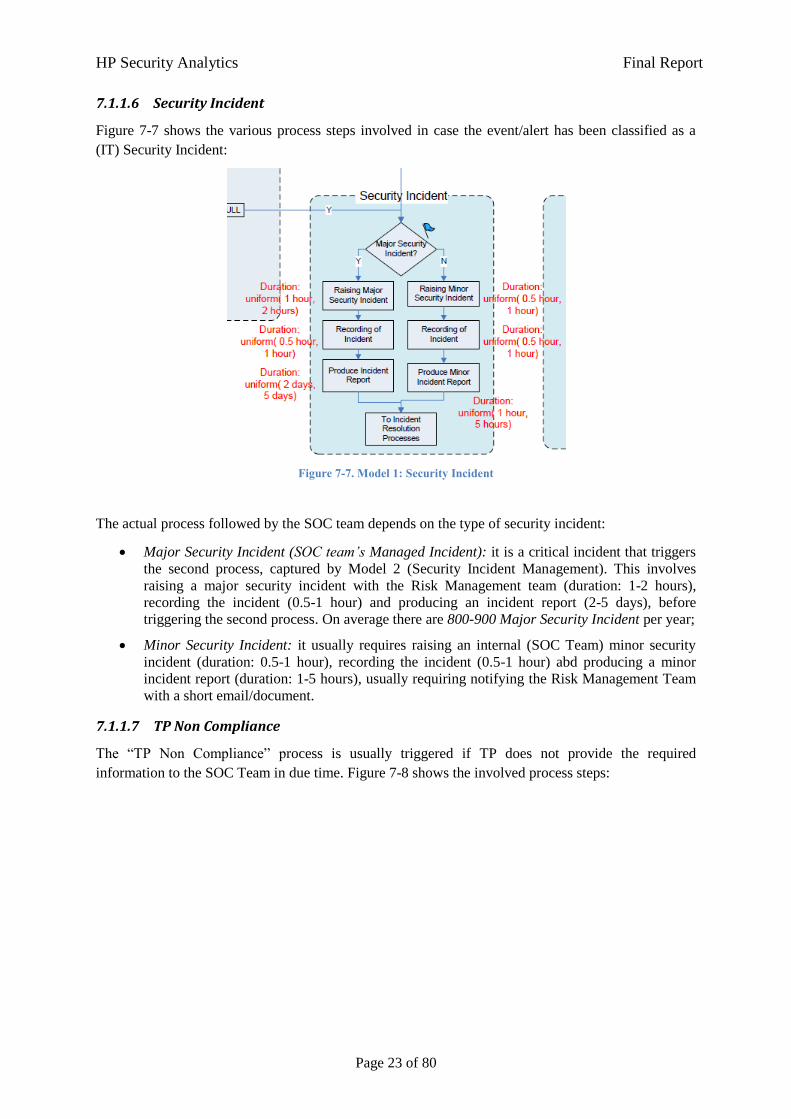
Figure 7-7 shows the various process steps involved in case the event/alert has been classified as a
(IT) Security Incident:
Figure 7-7. Model 1: Security Incident
The actual process followed by the SOC team depends on the type of security incident:
Major Security Incident (SOC team’s Managed Incident): it is a critical incident that triggers
the second process, captured by Model 2 (Security Incident Management). This involves
raising a major security incident with the Risk Management team (duration: 1-2 hours),
recording the incident (0.5-1 hour) and producing an incident report (2-5 days), before
triggering the second process. On average there are 800-900 Major Security Incident per year;
Minor Security Incident: it usually requires raising an internal (SOC Team) minor security
incident (duration: 0.5-1 hour), recording the incident (0.5-1 hour) abd producing a minor
incident report (duration: 1-5 hours), usually requiring notifying the Risk Management Team
with a short email/document.
7.1.1.7 TP Non Compliance
The “TP Non Compliance” process is usually triggered if TP does not provide the required
information to the SOC Team in due time. Figure 7-8 shows the involved process steps:
HP Security Analytics Final Report
Page 24 of 80
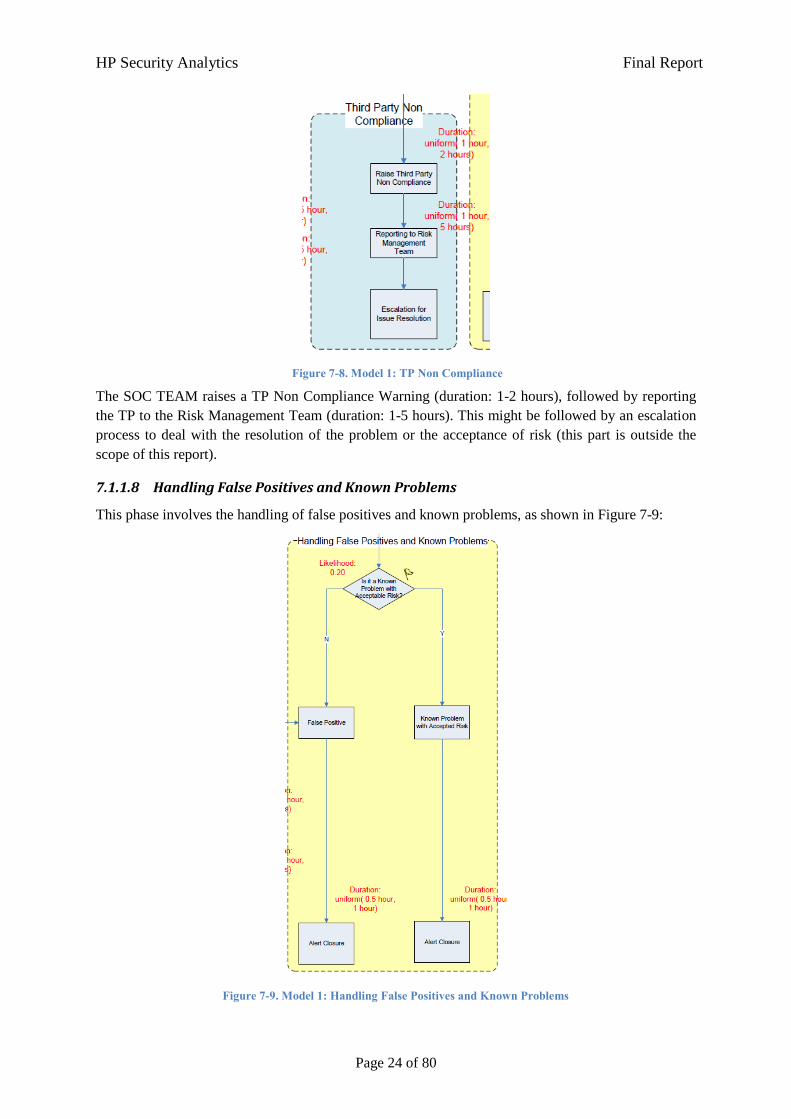
Figure 7-8. Model 1: TP Non Compliance
The SOC TEAM raises a TP Non Compliance Warning (duration: 1-2 hours), followed by reporting
the TP to the Risk Management Team (duration: 1-5 hours). This might be followed by an escalation
process to deal with the resolution of the problem or the acceptance of risk (this part is outside the
scope of this report).
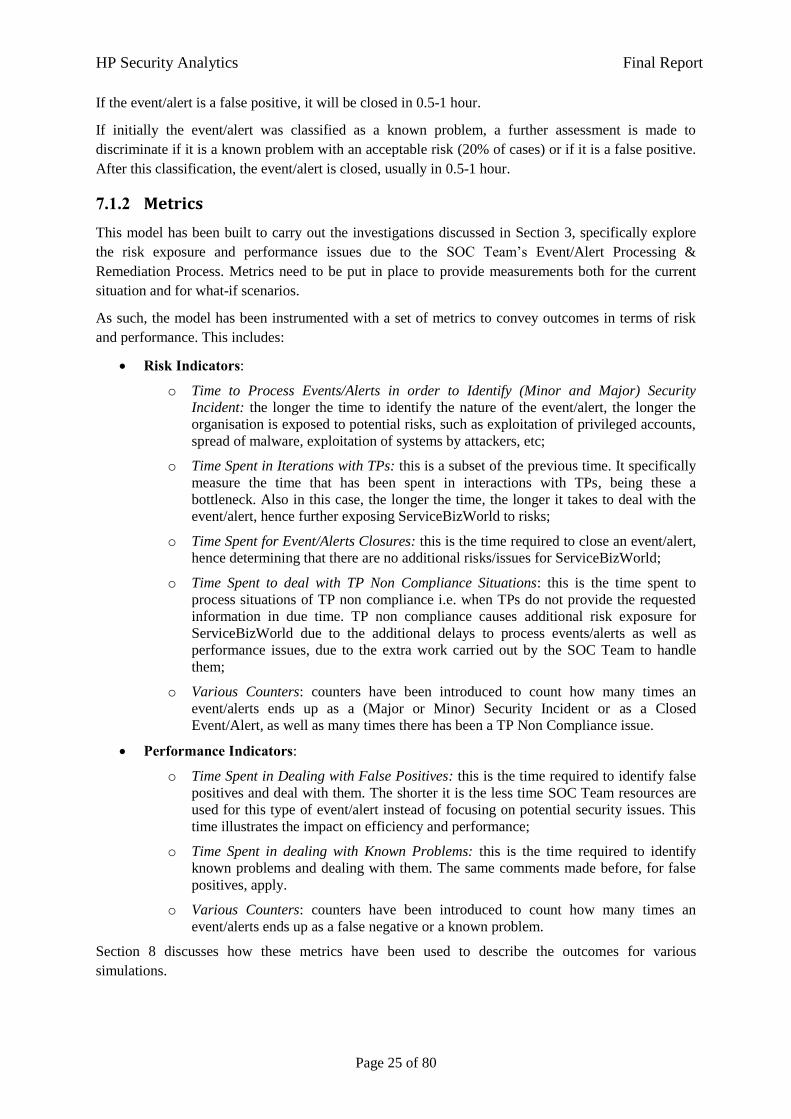
7.1.1.8 Handling False Positives and Known Problems
This phase involves the handling of false positives and known problems, as shown in Figure 7-9:
Figure 7-9. Model 1: Handling False Positives and Known Problems
HP Security Analytics Final Report
Page 25 of 80
If the event/alert is a false positive, it will be closed in 0.5-1 hour.
If initially the event/alert was classified as a known problem, a further assessment is made to
discriminate if it is a known problem with an acceptable risk (20% of cases) or if it is a false positive.
After this classification, the event/alert is closed, usually in 0.5-1 hour.
7.1.2 Metrics
This model has been built to carry out the investigations discussed in Section 3, specifically explore
the risk exposure and performance issues due to the SOC Team’s Event/Alert Processing &
Remediation Process. Metrics need to be put in place to provide measurements both for the current
situation and for what-if scenarios.
As such, the model has been instrumented with a set of metrics to convey outcomes in terms of risk
and performance. This includes:
Risk Indicators:
o Time to Process Events/Alerts in order to Identify (Minor and Major) Security
Incident: the longer the time to identify the nature of the event/alert, the longer the
organisation is exposed to potential risks, such as exploitation of privileged accounts,
spread of malware, exploitation of systems by attackers, etc;
o Time Spent in Iterations with TPs: this is a subset of the previous time. It specifically
measure the time that has been spent in interactions with TPs, being these a
bottleneck. Also in this case, the longer the time, the longer it takes to deal with the
event/alert, hence further exposing ServiceBizWorld to risks;
o Time Spent for Event/Alerts Closures: this is the time required to close an event/alert,
hence determining that there are no additional risks/issues for ServiceBizWorld;
o Time Spent to deal with TP Non Compliance Situations: this is the time spent to
process situations of TP non compliance i.e. when TPs do not provide the requested
information in due time. TP non compliance causes additional risk exposure for
ServiceBizWorld due to the additional delays to process events/alerts as well as
performance issues, due to the extra work carried out by the SOC Team to handle
them;
o Various Counters: counters have been introduced to count how many times an
event/alerts ends up as a (Major or Minor) Security Incident or as a Closed
Event/Alert, as well as many times there has been a TP Non Compliance issue.
Performance Indicators:
o Time Spent in Dealing with False Positives: this is the time required to identify false
positives and deal with them. The shorter it is the less time SOC Team resources are
used for this type of event/alert instead of focusing on potential security issues. This
time illustrates the impact on efficiency and performance;
o Time Spent in dealing with Known Problems: this is the time required to identify
known problems and dealing with them. The same comments made before, for false
positives, apply.
o Various Counters: counters have been introduced to count how many times an
event/alerts ends up as a false negative or a known problem.
Section 8 discusses how these metrics have been used to describe the outcomes for various
simulations.
HP Security Analytics Final Report
Page 26 of 80
7.1.3 What-if Scenarios
This model, instantiated with the current empirical data, has been used to run simulations. The results
have been used to show the current state of risk exposure and performance. Section 8 presents these
outcomes.
A number of what-if scenarios have also been explored, based on ServiceBizWorld’s requests, aiming
to investigate the impact of making potential policy changes and/or additional investments in controls
as well the impact of changing threat landscapes:
1. Implications of making changes to Service Level Agreements (SLAs) with Third Parties (TPs);
2. Impact on risk exposure due to changes of the Threat Environment;
3. Impact of making (control) investments to improve Information Availability for TPs.
The next section provides more details about these what-if scenarios. Section 9 illustrates the results
obtained from simulations.
7.1.3.1 Impact of Changing SLAs for TPs
The experimental results discussed in Section 8 show that the interactions with TPs create a major
bottleneck within the Event/Alert Processing & Remediation process: this introduces delays that have
an overall negative impact on the performance and potentially increase the time required to make
decisions, hence having a negative impact on exposures to risks. This is particularly relevant in case
of Major Security Incident.
This what-if scenario aims at exploring the implications of improving the behaviour of TPs by means
of changing contractual SLAs, in particular about how they interact with the SOC Team to provide
information. Two main aspects have been investigated:
The impact of changing SLAs/Policies regulating interactions with TPs
What the best possible outcome is, if the TP interactions are streamlined and optimised
Ultimately, the desired outcome of this what-if analysis is to enable discussions with TPs to improve
the current situation and explore trade-offs involving Performance vs. Costs vs. Security Risks.
Various types of SLAs could have been explored and investigated. For the purpose of this scenario,
being the focus on the SOC Team – TP interactions, the following types of SLAs (and related
constraints) have been explored:
1. Provision of requested information to the SOC Team, within the agreed timeframe;
2. Maximum number of allowed TP iterations, for each event/alert, to collect the requested
information;
3. Quality and quantity of the information provided in TP responses;
4. Time to provide information to the SOC Team, for each iteration.
It is important to notice that, in this analysis, we only considered the case where the same class of
SLAs/Policies apply to all involved TPs. This might not necessarily be the case in other
contexts/scenarios. Security Analytics and related models can help to capture multiple classes of SLAs
and explore their implications.
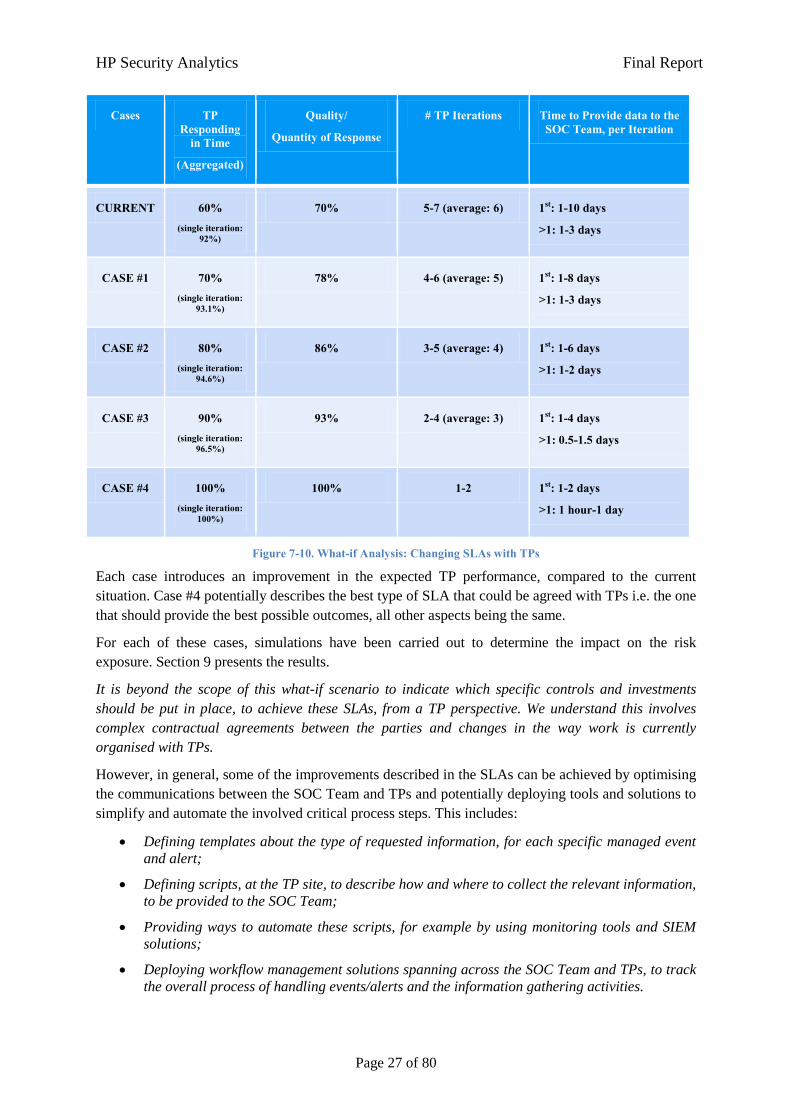
Figure 7-10 illustrates four cases of potential SLAs, along with the related parameters for the Security
Analytics model, compared against the current situation:
HP Security Analytics Final Report
Page 27 of 80
Cases TP Responding
in Time
(Aggregated)
Quality/
Quantity of Response
# TP Iterations Time to Provide data to the SOC Team, per Iteration
CURRENT 60% (single iteration:
92%)
70% 5-7 (average: 6) 1st: 1-10 days
>1: 1-3 days
CASE #1 70% (single iteration:
93.1%)
78% 4-6 (average: 5) 1st: 1-8 days
>1: 1-3 days
CASE #2 80% (single iteration:
94.6%)
86% 3-5 (average: 4) 1st: 1-6 days
>1: 1-2 days
CASE #3 90% (single iteration:
96.5%)
93% 2-4 (average: 3) 1st: 1-4 days
>1: 0.5-1.5 days
CASE #4 100% (single iteration:
100%)
100% 1-2 1st: 1-2 days
>1: 1 hour-1 day
Figure 7-10. What-if Analysis: Changing SLAs with TPs
Each case introduces an improvement in the expected TP performance, compared to the current
situation. Case #4 potentially describes the best type of SLA that could be agreed with TPs i.e. the one
that should provide the best possible outcomes, all other aspects being the same.
For each of these cases, simulations have been carried out to determine the impact on the risk
exposure. Section 9 presents the results.
It is beyond the scope of this what-if scenario to indicate which specific controls and investments
should be put in place, to achieve these SLAs, from a TP perspective. We understand this involves
complex contractual agreements between the parties and changes in the way work is currently
organised with TPs.
However, in general, some of the improvements described in the SLAs can be achieved by optimising
the communications between the SOC Team and TPs and potentially deploying tools and solutions to
simplify and automate the involved critical process steps. This includes:
Defining templates about the type of requested information, for each specific managed event
and alert;
Defining scripts, at the TP site, to describe how and where to collect the relevant information,
to be provided to the SOC Team;
Providing ways to automate these scripts, for example by using monitoring tools and SIEM
solutions;
Deploying workflow management solutions spanning across the SOC Team and TPs, to track
the overall process of handling events/alerts and the information gathering activities.
HP Security Analytics Final Report
Page 28 of 80
7.1.3.2 Impact of Changes of the Threat Environment
This what-if scenario aims at analysing the risk exposure implications in case of the worsening of the
threat landscape. What if, the threat environment gets worst and worst? What would be the impact, in
terms of risk exposure, if the number of new events/alerts to be handled by the process increases of
10%? Or 30%? Or 50%?
Various situations and scenarios might introduce sudden changes of the threat landscape:
Major social and economical events: this might include events such as the Olympic Games in
London 2012, major economical and financial crisis, etc. that could create a surge of social
engineering attacks and malware to exploit vulnerabilities and gather confidential information
from ServiceBizWorld’s employees;
Major changes in the ServiceBizWorld’s business model: this might include increasing the
number of services offered online and/or in the Cloud, hence potentially increasing the attack
surface and introducing new attack/exploitation opportunities for hackers.
In this scenario we consider the current event/alert processing situation as the baseline.
Simulations are carried out with the model to explore the implications, in terms of risk exposure, of
increasing the number of new events/alerts. Specifically the focus is on exploring the impact on the
time required to identify security incidents, including Major Security Incidents.
A desired outcome of this analysis is to enable discussion with TPs for Contingency Planning as well
as exploring suitable investment trade-offs between Costs (due to resources/personnel) vs. Security
Risks.
In this context it is important to identify critical thresholds, after which event/alert processing delays
start accumulating, hence exposing ServiceBizWorld to additional security risks.
The current bottleneck introduced by TP interactions has been the specific focus of this analysis.
Whilst ServiceBizWorld has direct control of the SOC Team and its incident management processes
and can flexibly adapt them to changes, this is not necessarily the case for TPs, especially for the
external service providers.
In this context, to effectively carry out the analysis, it has been necessary to introduce the concept of
Resources/Personnel into our model, related to the interactions between the SOC team and TPs. The
number of TP people (potentially part of local security teams) involved in each interaction to address
the SOC Team requests is limited: an increase in the workload might inevitably introduce delays.
It has been proven difficult to gather the specific information about the number of involved resources
(dealing with the event/alert processing activities) from the various TPs. This information is often
business confidential.
However, we can leverage Security Analytics and the model to make assumptions. The current model
for the Event/Alert Processing & Resolution process has been validated by the SOC Team and teh
Risk Management Team: it reflects the current solution.
It is possible to use it, make assumptions and derive the required information about resources
indirectly. Specifically, this involves:
Modelling the collective impact of the various TPs;
Modelling the TP allocation of resources/personnel in the context of their interactions with
the SOC Team;
HP Security Analytics Final Report
Page 29 of 80
Doing a “reverse engineering” with the model, to indirectly determine a reasonable number
of TP resources/personnel that, once added to a new version of our model, produces the same
kind of outcomes – i.e. as in the current situation - in terms of risk exposure and
performance;
Allow for some “slack” in the usage of the current TP resources.
As previously mentioned, in the current modelled process, we focus on the interactions between TPs
and SOC Team, see Section 7.1.1.3, to obtain the data requested by the SOC Team.
The empirical data currently available suggests that the time required to get data from TPs is variable,
depending if it is the first iteration with a TP or a follow-up iteration:
1st Iteration: 1-10 days;
Follow-up Iterations: 1-3 days.
However, not all this time is spent by the involved TP resources in actively doing the work. A major
overhead is introduced to understand who to interact with, which information to retrieve and from
where, miscommunications, etc.
As such, the overall time required to provide a response by the TPs has been modelled in a more
accurate way, by splitting it in two parts:
Overhead time: this time does not really need resource allocations. It involves delays and
waiting time;
Actual work: this is the time spent to carry out the information gathering work, requiring the
utilisation of resources/people.
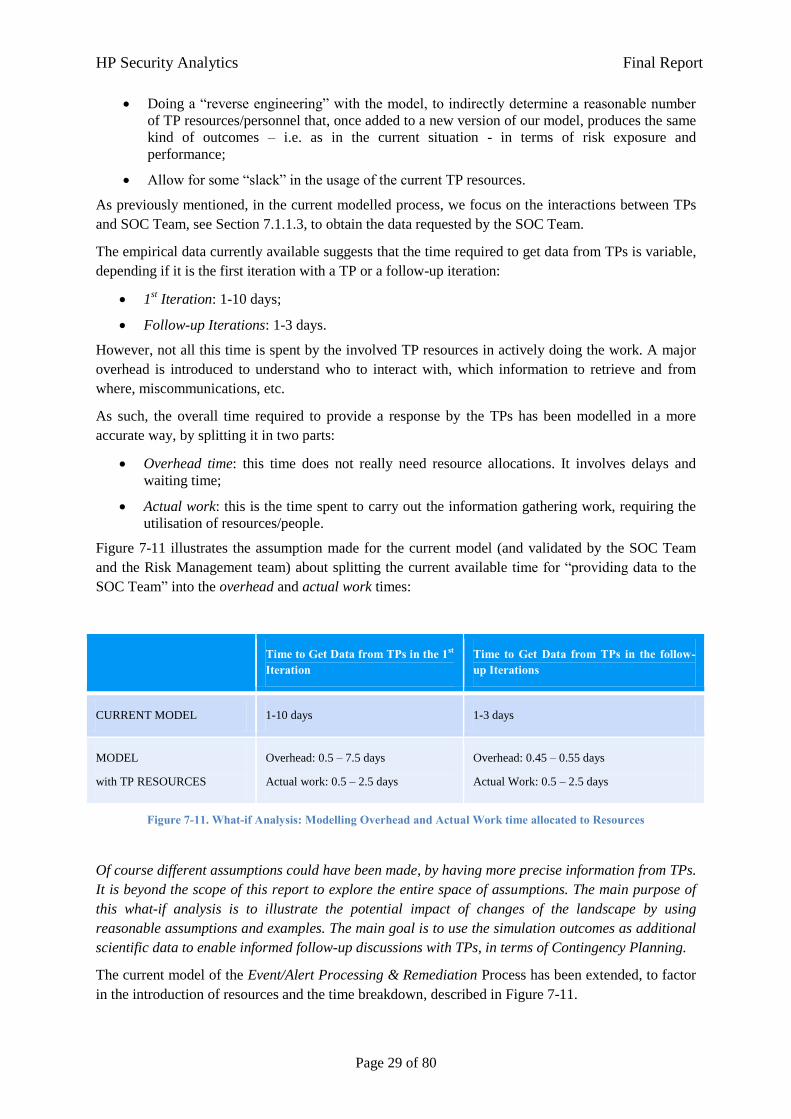
Figure 7-11 illustrates the assumption made for the current model (and validated by the SOC Team
and the Risk Management team) about splitting the current available time for “providing data to the
SOC Team” into the overhead and actual work times:
Time to Get Data from TPs in the 1st Iteration
Time to Get Data from TPs in the follow-up Iterations
CURRENT MODEL 1-10 days 1-3 days
MODEL
with TP RESOURCES
Overhead: 0.5 – 7.5 days
Actual work: 0.5 – 2.5 days
Overhead: 0.45 – 0.55 days
Actual Work: 0.5 – 2.5 days
Figure 7-11. What-if Analysis: Modelling Overhead and Actual Work time allocated to Resources
Of course different assumptions could have been made, by having more precise information from TPs.
It is beyond the scope of this report to explore the entire space of assumptions. The main purpose of
this what-if analysis is to illustrate the potential impact of changes of the landscape by using
reasonable assumptions and examples. The main goal is to use the simulation outcomes as additional
scientific data to enable informed follow-up discussions with TPs, in terms of Contingency Planning.
The current model of the Event/Alert Processing & Remediation Process has been extended, to factor
in the introduction of resources and the time breakdown, described in Figure 7-11.
HP Security Analytics Final Report
Page 30 of 80
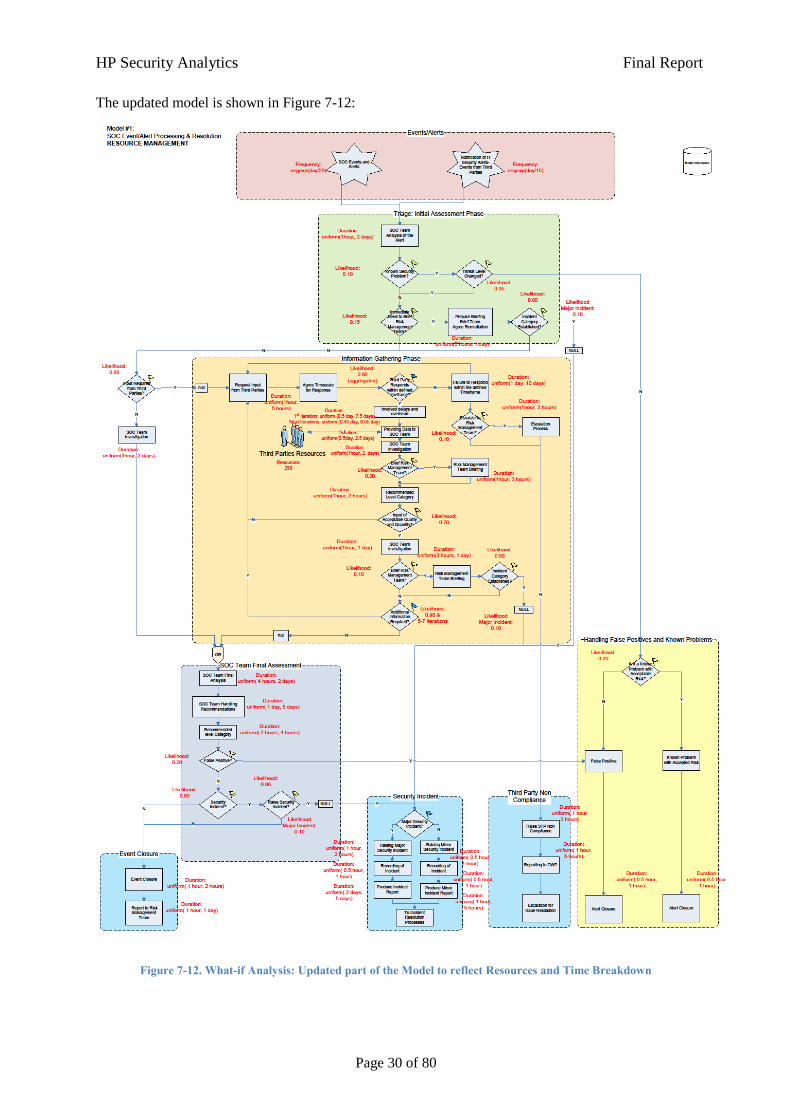
The updated model is shown in Figure 7-12:
Figure 7-12. What-if Analysis: Updated part of the Model to reflect Resources and Time Breakdown
HP Security Analytics Final Report
Page 31 of 80
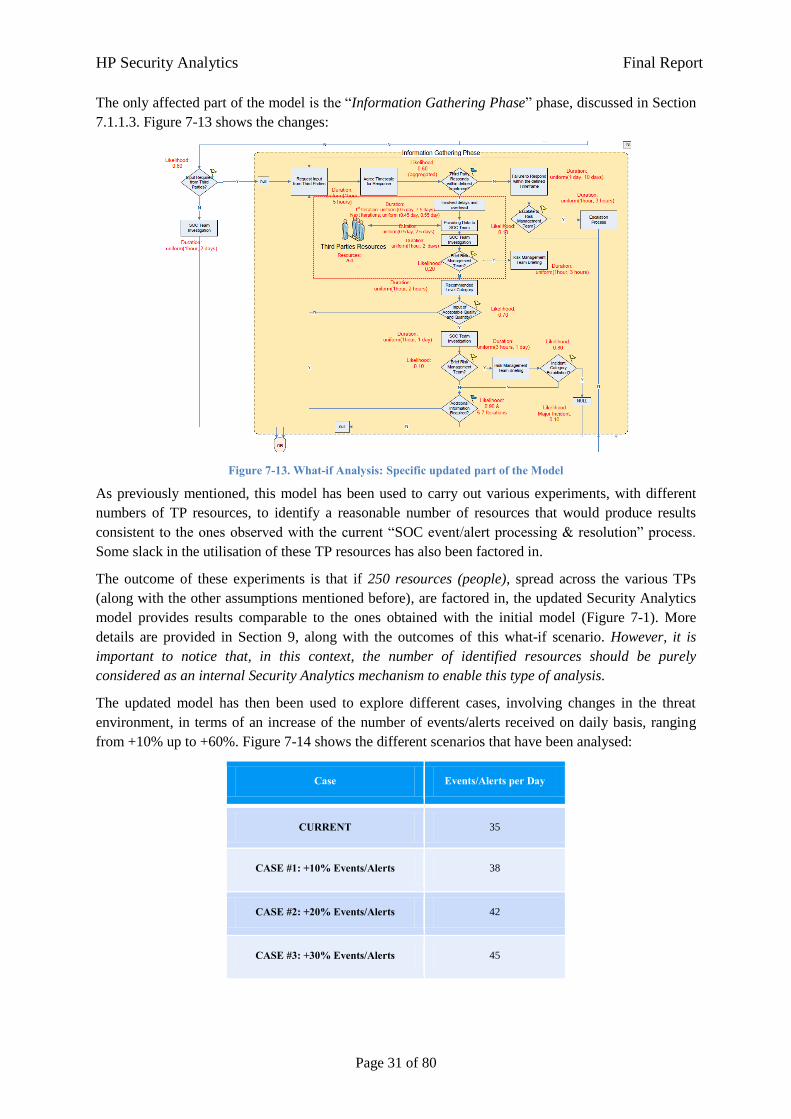
The only affected part of the model is the “Information Gathering Phase” phase, discussed in Section
7.1.1.3. Figure 7-13 shows the changes:
Figure 7-13. What-if Analysis: Specific updated part of the Model
As previously mentioned, this model has been used to carry out various experiments, with different
numbers of TP resources, to identify a reasonable number of resources that would produce results
consistent to the ones observed with the current “SOC event/alert processing & resolution” process.
Some slack in the utilisation of these TP resources has also been factored in.
The outcome of these experiments is that if 250 resources (people), spread across the various TPs
(along with the other assumptions mentioned before), are factored in, the updated Security Analytics
model provides results comparable to the ones obtained with the initial model (Figure 7-1). More
details are provided in Section 9, along with the outcomes of this what-if scenario. However, it is
important to notice that, in this context, the number of identified resources should be purely
considered as an internal Security Analytics mechanism to enable this type of analysis.
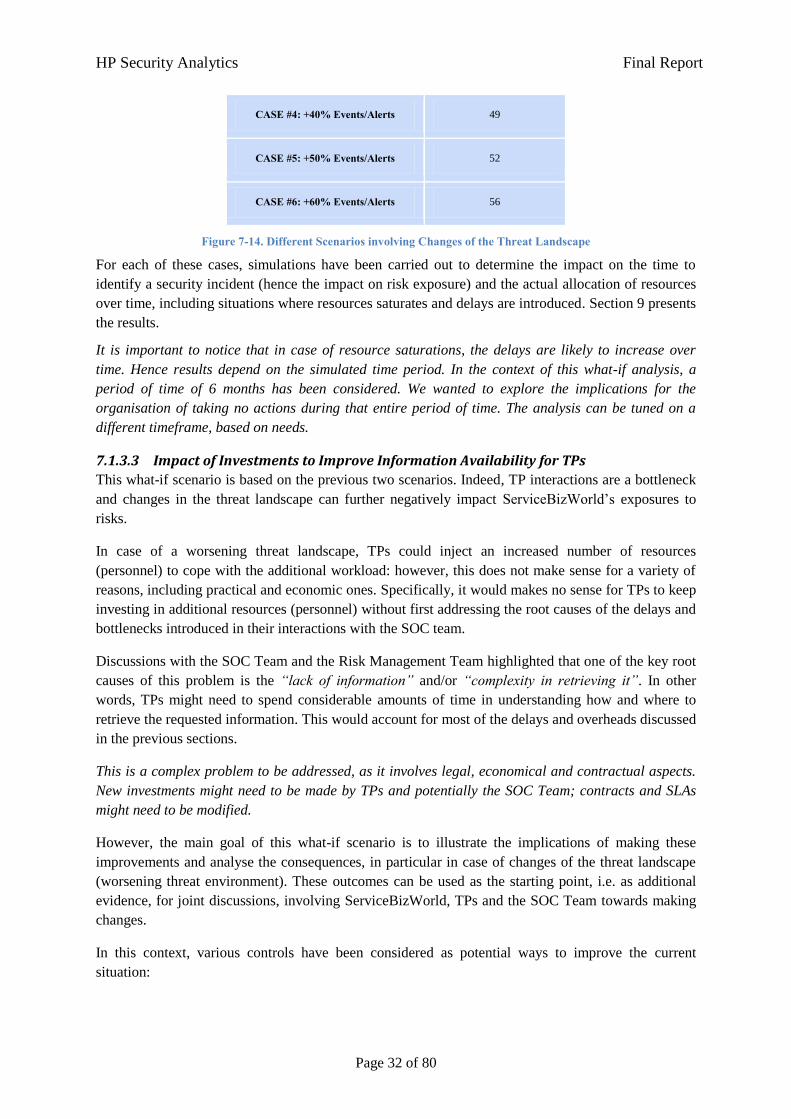
The updated model has then been used to explore different cases, involving changes in the threat
environment, in terms of an increase of the number of events/alerts received on daily basis, ranging
from +10% up to +60%. Figure 7-14 shows the different scenarios that have been analysed:
Case Events/Alerts per Day
CURRENT 35
CASE #1: +10% Events/Alerts 38
CASE #2: +20% Events/Alerts 42
CASE #3: +30% Events/Alerts 45
HP Security Analytics Final Report
Page 32 of 80
CASE #4: +40% Events/Alerts 49
CASE #5: +50% Events/Alerts 52
CASE #6: +60% Events/Alerts 56
Figure 7-14. Different Scenarios involving Changes of the Threat Landscape
For each of these cases, simulations have been carried out to determine the impact on the time to
identify a security incident (hence the impact on risk exposure) and the actual allocation of resources
over time, including situations where resources saturates and delays are introduced. Section 9 presents
the results.
It is important to notice that in case of resource saturations, the delays are likely to increase over
time. Hence results depend on the simulated time period. In the context of this what-if analysis, a
period of time of 6 months has been considered. We wanted to explore the implications for the
organisation of taking no actions during that entire period of time. The analysis can be tuned on a
different timeframe, based on needs.
7.1.3.3 Impact of Investments to Improve Information Availability for TPs
This what-if scenario is based on the previous two scenarios. Indeed, TP interactions are a bottleneck
and changes in the threat landscape can further negatively impact ServiceBizWorld’s exposures to
risks.
In case of a worsening threat landscape, TPs could inject an increased number of resources
(personnel) to cope with the additional workload: however, this does not make sense for a variety of
reasons, including practical and economic ones. Specifically, it would makes no sense for TPs to keep
investing in additional resources (personnel) without first addressing the root causes of the delays and
bottlenecks introduced in their interactions with the SOC team.
Discussions with the SOC Team and the Risk Management Team highlighted that one of the key root
causes of this problem is the “lack of information” and/or “complexity in retrieving it”. In other
words, TPs might need to spend considerable amounts of time in understanding how and where to
retrieve the requested information. This would account for most of the delays and overheads discussed
in the previous sections.
This is a complex problem to be addressed, as it involves legal, economical and contractual aspects.
New investments might need to be made by TPs and potentially the SOC Team; contracts and SLAs
might need to be modified.
However, the main goal of this what-if scenario is to illustrate the implications of making these
improvements and analyse the consequences, in particular in case of changes of the threat landscape
(worsening threat environment). These outcomes can be used as the starting point, i.e. as additional
evidence, for joint discussions, involving ServiceBizWorld, TPs and the SOC Team towards making
changes.
In this context, various controls have been considered as potential ways to improve the current
situation:
HP Security Analytics Final Report
Page 33 of 80
Definition of SOC Team’s templates about the type of requested information, for each specific
managed event and alert. Definition of scripts, at the TP site, to describe how and where to
collect the relevant information, to be provided to the SOC Team;
Script automation coupled with advanced monitoring and correlation tools (e.g. SIEM
solutions [3], [4]);
Deployment of workflow management solutions (e.g. [9]) spanning across the SOC Team and
TPs, to track the overall process of handling events/alerts and the information gathering
activities.
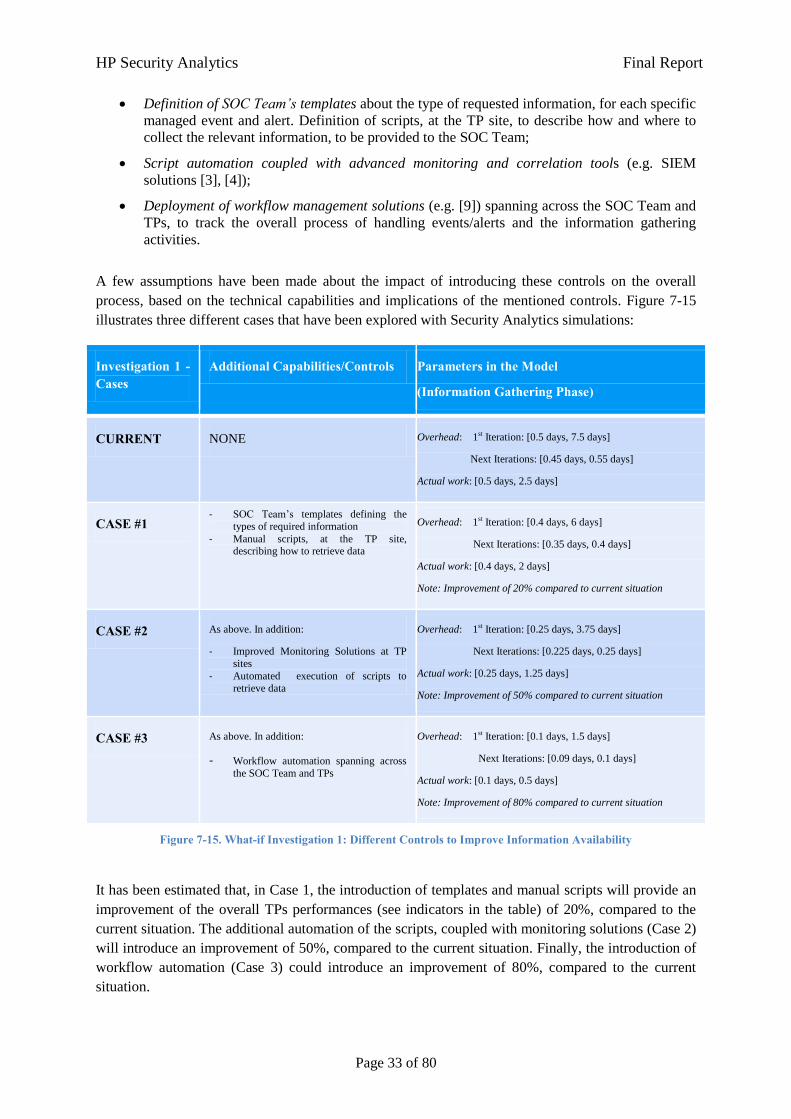
A few assumptions have been made about the impact of introducing these controls on the overall
process, based on the technical capabilities and implications of the mentioned controls. Figure 7-15
illustrates three different cases that have been explored with Security Analytics simulations:
Investigation 1 - Cases
Additional Capabilities/Controls Parameters in the Model
(Information Gathering Phase)
CURRENT NONE Overhead: 1st Iteration: [0.5 days, 7.5 days]
Next Iterations: [0.45 days, 0.55 days]
Actual work: [0.5 days, 2.5 days]
CASE #1 - SOC Team’s templates defining the
types of required information
- Manual scripts, at the TP site, describing how to retrieve data
Overhead: 1st Iteration: [0.4 days, 6 days]
Next Iterations: [0.35 days, 0.4 days]
Actual work: [0.4 days, 2 days]
Note: Improvement of 20% compared to current situation
CASE #2 As above. In addition:
- Improved Monitoring Solutions at TP
sites
- Automated execution of scripts to
retrieve data
Overhead: 1st Iteration: [0.25 days, 3.75 days]
Next Iterations: [0.225 days, 0.25 days]
Actual work: [0.25 days, 1.25 days]
Note: Improvement of 50% compared to current situation
CASE #3 As above. In addition:
- Workflow automation spanning across
the SOC Team and TPs
Overhead: 1st Iteration: [0.1 days, 1.5 days]
Next Iterations: [0.09 days, 0.1 days]
Actual work: [0.1 days, 0.5 days]
Note: Improvement of 80% compared to current situation
Figure 7-15. What-if Investigation 1: Different Controls to Improve Information Availability
It has been estimated that, in Case 1, the introduction of templates and manual scripts will provide an
improvement of the overall TPs performances (see indicators in the table) of 20%, compared to the
current situation. The additional automation of the scripts, coupled with monitoring solutions (Case 2)
will introduce an improvement of 50%, compared to the current situation. Finally, the introduction of
workflow automation (Case 3) could introduce an improvement of 80%, compared to the current
situation.
HP Security Analytics Final Report
Page 34 of 80
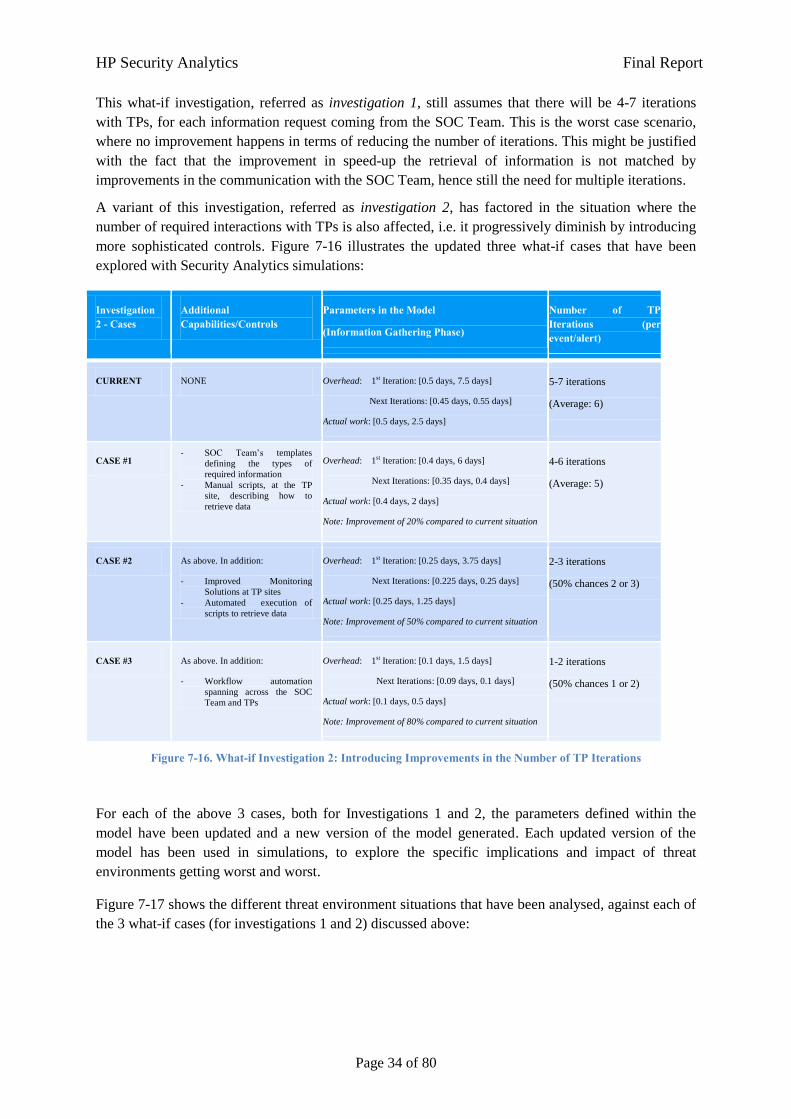
This what-if investigation, referred as investigation 1, still assumes that there will be 4-7 iterations
with TPs, for each information request coming from the SOC Team. This is the worst case scenario,
where no improvement happens in terms of reducing the number of iterations. This might be justified
with the fact that the improvement in speed-up the retrieval of information is not matched by
improvements in the communication with the SOC Team, hence still the need for multiple iterations.
A variant of this investigation, referred as investigation 2, has factored in the situation where the
number of required interactions with TPs is also affected, i.e. it progressively diminish by introducing
more sophisticated controls. Figure 7-16 illustrates the updated three what-if cases that have been
explored with Security Analytics simulations:
Investigation 2 - Cases
Additional Capabilities/Controls
Parameters in the Model
(Information Gathering Phase)
Number of TP Iterations (per event/alert)
CURRENT NONE Overhead: 1st Iteration: [0.5 days, 7.5 days]
Next Iterations: [0.45 days, 0.55 days]
Actual work: [0.5 days, 2.5 days]
5-7 iterations
(Average: 6)
CASE #1 - SOC Team’s templates
defining the types of
required information
- Manual scripts, at the TP
site, describing how to
retrieve data
Overhead: 1st Iteration: [0.4 days, 6 days]
Next Iterations: [0.35 days, 0.4 days]
Actual work: [0.4 days, 2 days]
Note: Improvement of 20% compared to current situation
4-6 iterations
(Average: 5)
CASE #2 As above. In addition:
- Improved Monitoring
Solutions at TP sites
- Automated execution of
scripts to retrieve data
Overhead: 1st Iteration: [0.25 days, 3.75 days]
Next Iterations: [0.225 days, 0.25 days]
Actual work: [0.25 days, 1.25 days]
Note: Improvement of 50% compared to current situation
2-3 iterations
(50% chances 2 or 3)
CASE #3 As above. In addition:
- Workflow automation
spanning across the SOC
Team and TPs
Overhead: 1st Iteration: [0.1 days, 1.5 days]
Next Iterations: [0.09 days, 0.1 days]
Actual work: [0.1 days, 0.5 days]
Note: Improvement of 80% compared to current situation
1-2 iterations
(50% chances 1 or 2)
Figure 7-16. What-if Investigation 2: Introducing Improvements in the Number of TP Iterations
For each of the above 3 cases, both for Investigations 1 and 2, the parameters defined within the
model have been updated and a new version of the model generated. Each updated version of the
model has been used in simulations, to explore the specific implications and impact of threat
environments getting worst and worst.
Figure 7-17 shows the different threat environment situations that have been analysed, against each of
the 3 what-if cases (for investigations 1 and 2) discussed above:
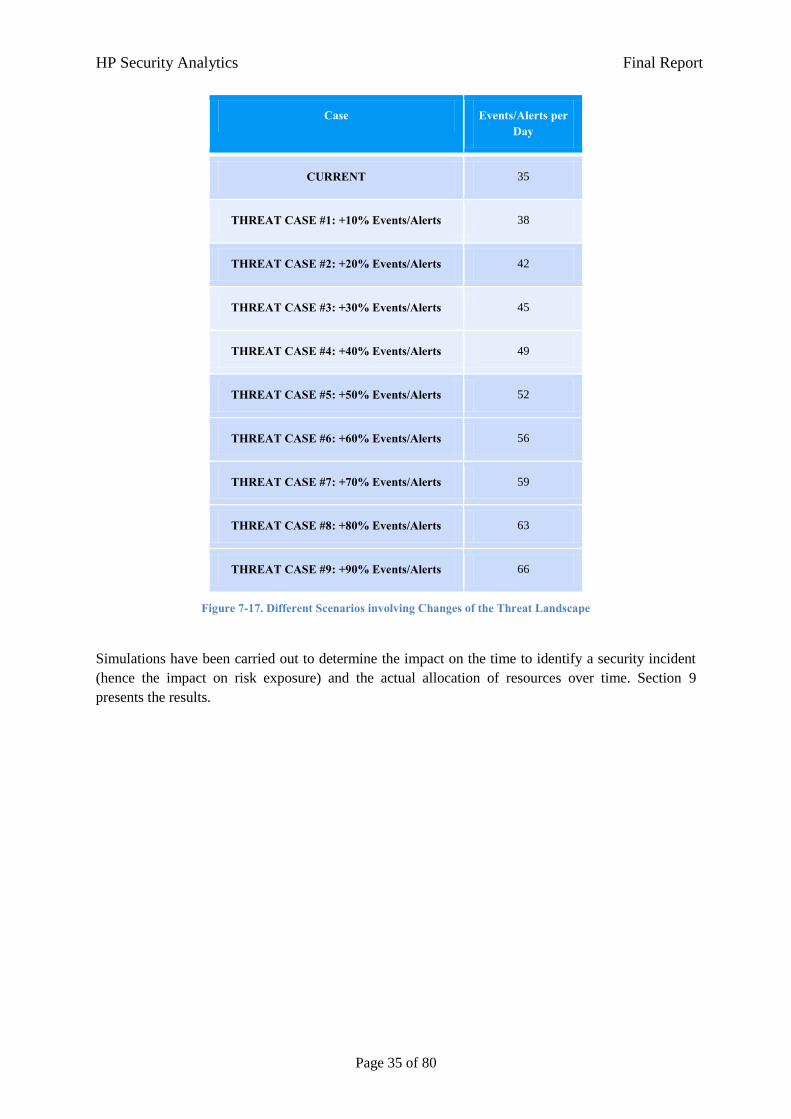
HP Security Analytics Final Report
Page 35 of 80
Case Events/Alerts per Day
CURRENT 35
THREAT CASE #1: +10% Events/Alerts 38
THREAT CASE #2: +20% Events/Alerts 42
THREAT CASE #3: +30% Events/Alerts 45
THREAT CASE #4: +40% Events/Alerts 49
THREAT CASE #5: +50% Events/Alerts 52
THREAT CASE #6: +60% Events/Alerts 56
THREAT CASE #7: +70% Events/Alerts 59
THREAT CASE #8: +80% Events/Alerts 63
THREAT CASE #9: +90% Events/Alerts 66
Figure 7-17. Different Scenarios involving Changes of the Threat Landscape
Simulations have been carried out to determine the impact on the time to identify a security incident
(hence the impact on risk exposure) and the actual allocation of resources over time. Section 9
presents the results.
HP Security Analytics Final Report
Page 36 of 80
7.2 Model 2: Incident Management Processes
The second model, related to the Incident Management Processes is shown in Figure 7-18. This
process is triggered by the process described in the first model, when Major Security Incidents are
identified by the SOC team.
The model captures the current process steps:
1. Notification of Major (IT) Security Incidents;
2. Various incident processing phases, including: Initial Assessment Phase, Information
Gathering from the Risk Assessment Team, TP Handling of the Incident Response;
3. Various possible outcomes of the execution of the process: TP Incident Remediation and Risk
Management.
It is important to notice that this process (and related model) is of secondary importance for the
purpose of the risk assessment analysis. It presents a subset of the issues already investigated in the
first process (e.g. TP interaction bottleneck): furthermore, it is not a critical process as it is only
triggered, on average, 800-900 times a year, i.e. each time a Major Security Incident is identified.
However, we believe that it is worth providing an explicit representation of this process and further
analysing the implications in terms of the additional risk exposure for ServiceBizWorld, when dealing
with the remediation of major security incidents. This analysis is very similar to the one carried out
for the first process.
Also in this case, the various process steps captured by the model are annotated with the empirical
data gathered from the SOC and Risk Management teams. They reflect the current situation in terms
of frequency of events, duration of process steps and likelihood of making certain decision. The
complete list of the empirical data used in this model is available in Appendix A.2.
When executed, this model simulates the arrival of Major (IT) Security Incidents and the various
processing steps, in order to determine the outcomes. The model has been instrumented with various
metrics, discussed in this section, to measure the impact in terms of risk exposure and performance.
The next sections describes in detail each of the key parts highlighted in the model.
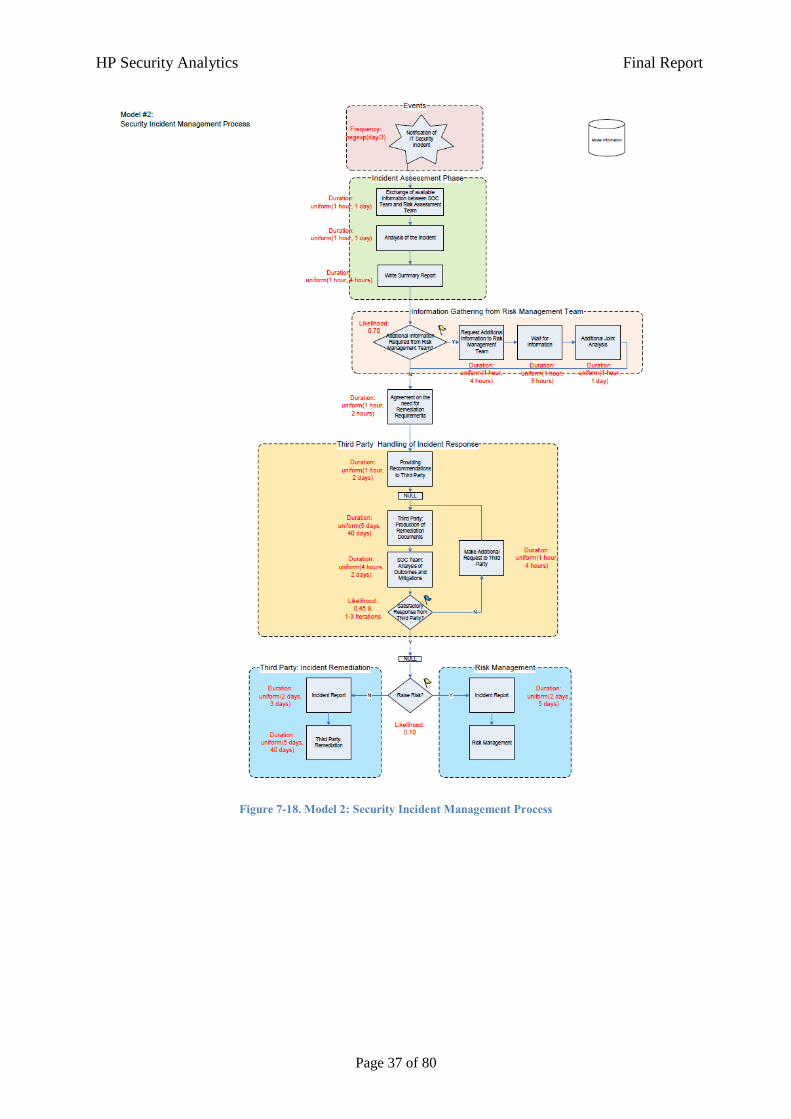
HP Security Analytics Final Report
Page 37 of 80
Figure 7-18. Model 2: Security Incident Management Process
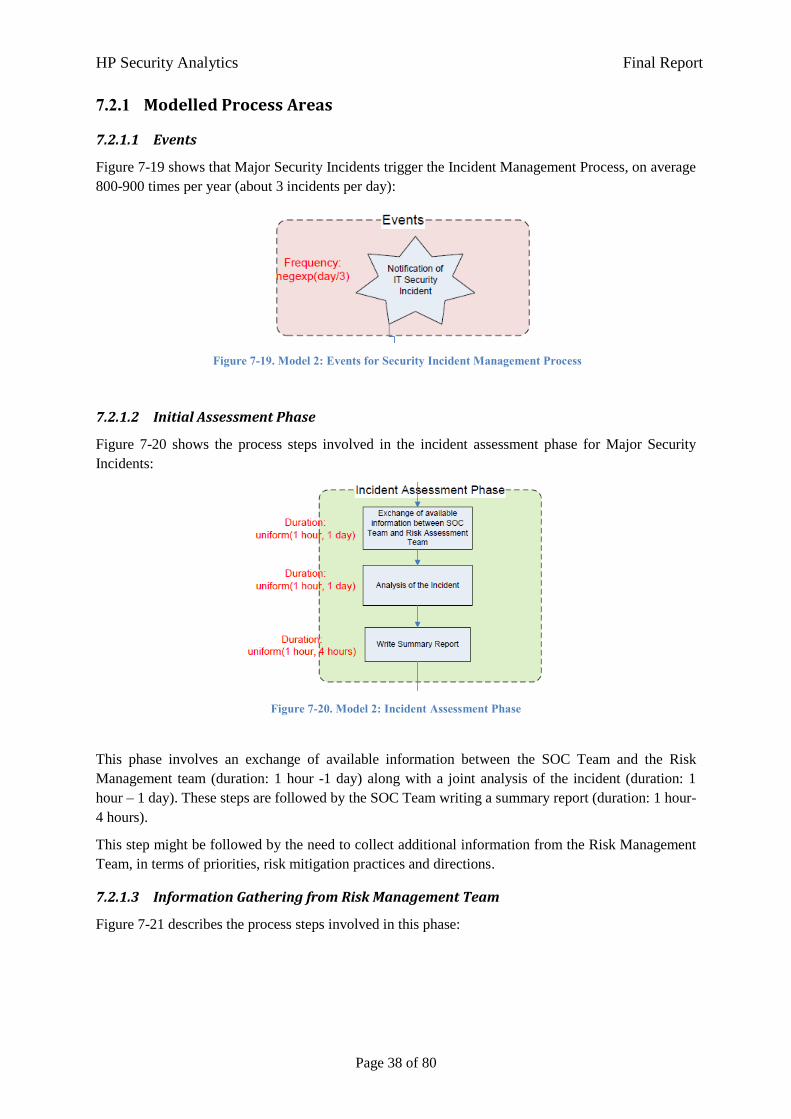
HP Security Analytics Final Report
Page 38 of 80
7.2.1 Modelled Process Areas
7.2.1.1 Events
Figure 7-19 shows that Major Security Incidents trigger the Incident Management Process, on average
800-900 times per year (about 3 incidents per day):
Figure 7-19. Model 2: Events for Security Incident Management Process
7.2.1.2 Initial Assessment Phase
Figure 7-20 shows the process steps involved in the incident assessment phase for Major Security
Incidents:
Figure 7-20. Model 2: Incident Assessment Phase
This phase involves an exchange of available information between the SOC Team and the Risk
Management team (duration: 1 hour -1 day) along with a joint analysis of the incident (duration: 1
hour – 1 day). These steps are followed by the SOC Team writing a summary report (duration: 1 hour-
4 hours).
This step might be followed by the need to collect additional information from the Risk Management
Team, in terms of priorities, risk mitigation practices and directions.
7.2.1.3 Information Gathering from Risk Management Team
Figure 7-21 describes the process steps involved in this phase:
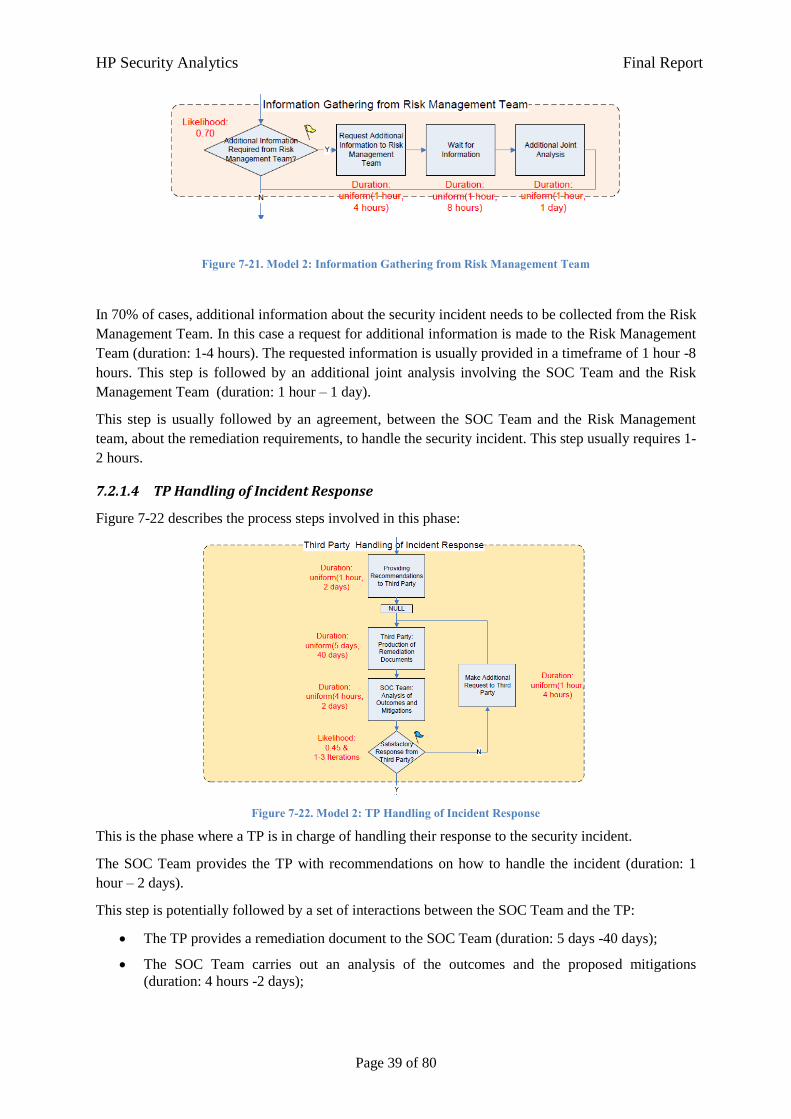
HP Security Analytics Final Report
Page 39 of 80
Figure 7-21. Model 2: Information Gathering from Risk Management Team
In 70% of cases, additional information about the security incident needs to be collected from the Risk
Management Team. In this case a request for additional information is made to the Risk Management
Team (duration: 1-4 hours). The requested information is usually provided in a timeframe of 1 hour -8
hours. This step is followed by an additional joint analysis involving the SOC Team and the Risk
Management Team (duration: 1 hour – 1 day).
This step is usually followed by an agreement, between the SOC Team and the Risk Management
team, about the remediation requirements, to handle the security incident. This step usually requires 1-
2 hours.
7.2.1.4 TP Handling of Incident Response
Figure 7-22 describes the process steps involved in this phase:
Figure 7-22. Model 2: TP Handling of Incident Response
This is the phase where a TP is in charge of handling their response to the security incident.
The SOC Team provides the TP with recommendations on how to handle the incident (duration: 1
hour – 2 days).
This step is potentially followed by a set of interactions between the SOC Team and the TP:
The TP provides a remediation document to the SOC Team (duration: 5 days -40 days);
The SOC Team carries out an analysis of the outcomes and the proposed mitigations
(duration: 4 hours -2 days);
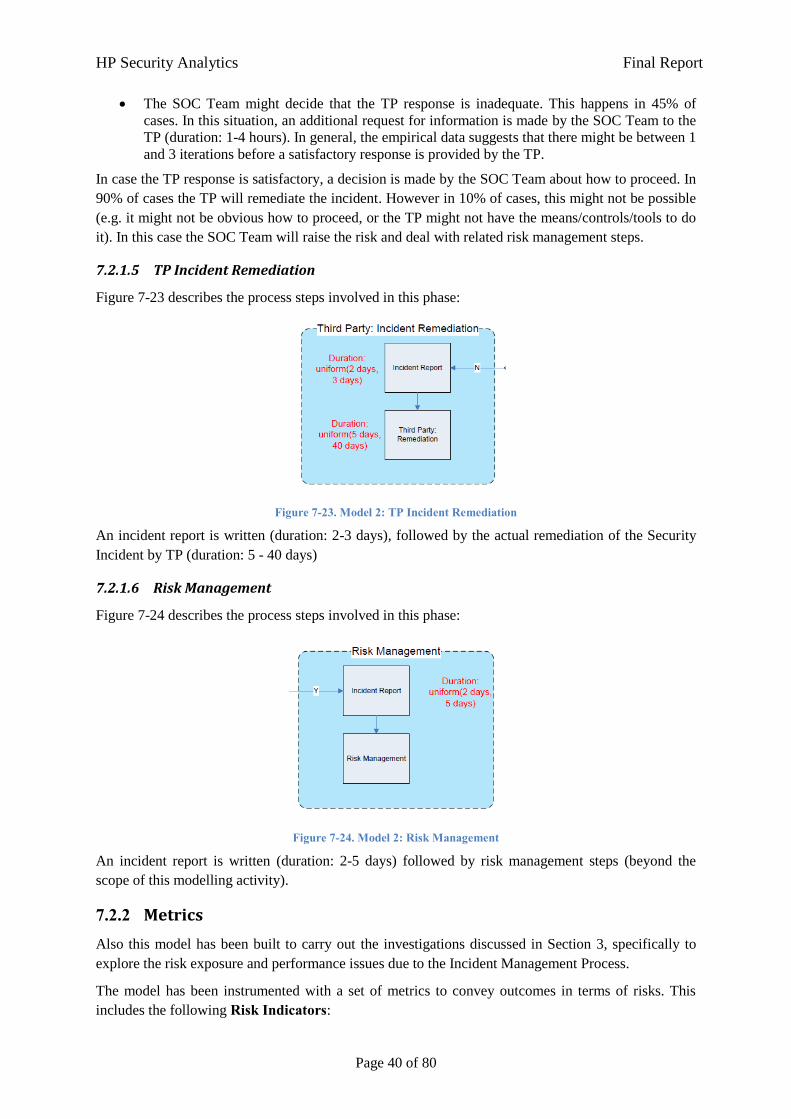
HP Security Analytics Final Report
Page 40 of 80
The SOC Team might decide that the TP response is inadequate. This happens in 45% of
cases. In this situation, an additional request for information is made by the SOC Team to the
TP (duration: 1-4 hours). In general, the empirical data suggests that there might be between 1
and 3 iterations before a satisfactory response is provided by the TP.
In case the TP response is satisfactory, a decision is made by the SOC Team about how to proceed. In
90% of cases the TP will remediate the incident. However in 10% of cases, this might not be possible
(e.g. it might not be obvious how to proceed, or the TP might not have the means/controls/tools to do
it). In this case the SOC Team will raise the risk and deal with related risk management steps.
7.2.1.5 TP Incident Remediation
Figure 7-23 describes the process steps involved in this phase:
Figure 7-23. Model 2: TP Incident Remediation
An incident report is written (duration: 2-3 days), followed by the actual remediation of the Security
Incident by TP (duration: 5 - 40 days)
7.2.1.6 Risk Management
Figure 7-24 describes the process steps involved in this phase:
Figure 7-24. Model 2: Risk Management
An incident report is written (duration: 2-5 days) followed by risk management steps (beyond the
scope of this modelling activity).
7.2.2 Metrics
Also this model has been built to carry out the investigations discussed in Section 3, specifically to
explore the risk exposure and performance issues due to the Incident Management Process.
The model has been instrumented with a set of metrics to convey outcomes in terms of risks. This
includes the following Risk Indicators:
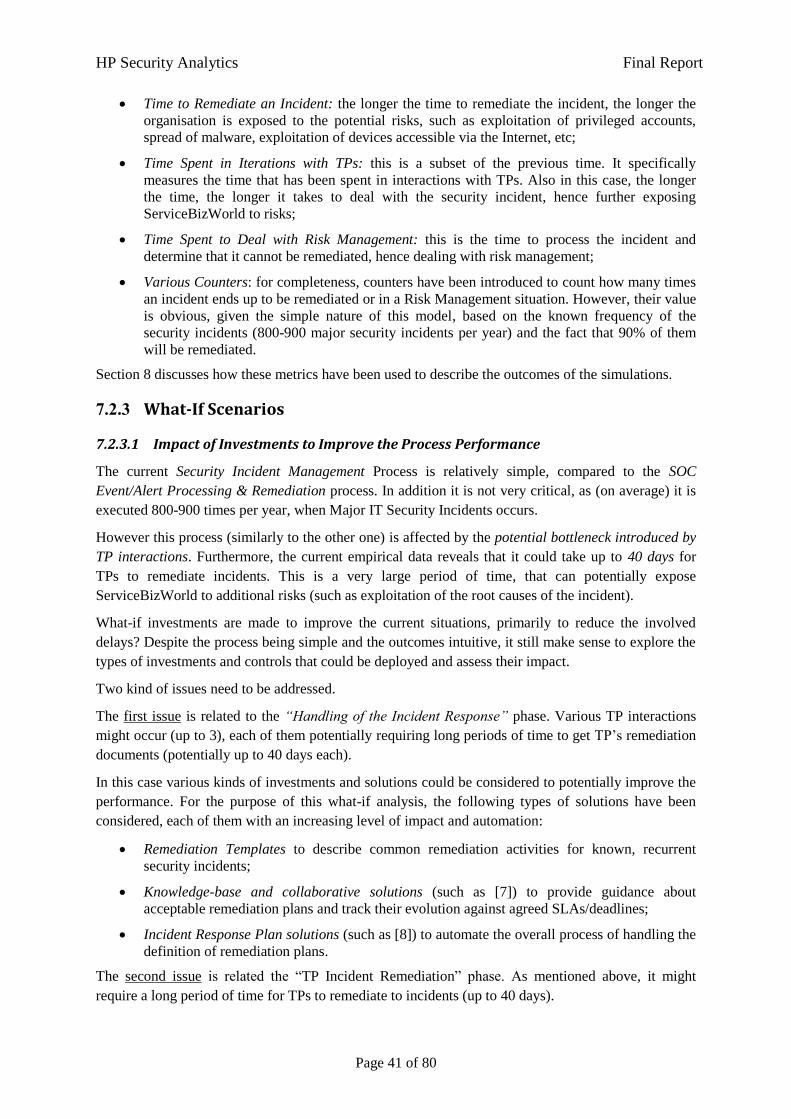
HP Security Analytics Final Report
Page 41 of 80
Time to Remediate an Incident: the longer the time to remediate the incident, the longer the
organisation is exposed to the potential risks, such as exploitation of privileged accounts,
spread of malware, exploitation of devices accessible via the Internet, etc;
Time Spent in Iterations with TPs: this is a subset of the previous time. It specifically
measures the time that has been spent in interactions with TPs. Also in this case, the longer
the time, the longer it takes to deal with the security incident, hence further exposing
ServiceBizWorld to risks;
Time Spent to Deal with Risk Management: this is the time to process the incident and
determine that it cannot be remediated, hence dealing with risk management;
Various Counters: for completeness, counters have been introduced to count how many times
an incident ends up to be remediated or in a Risk Management situation. However, their value
is obvious, given the simple nature of this model, based on the known frequency of the
security incidents (800-900 major security incidents per year) and the fact that 90% of them
will be remediated.
Section 8 discusses how these metrics have been used to describe the outcomes of the simulations.
7.2.3 What-If Scenarios
7.2.3.1 Impact of Investments to Improve the Process Performance
The current Security Incident Management Process is relatively simple, compared to the SOC
Event/Alert Processing & Remediation process. In addition it is not very critical, as (on average) it is
executed 800-900 times per year, when Major IT Security Incidents occurs.
However this process (similarly to the other one) is affected by the potential bottleneck introduced by
TP interactions. Furthermore, the current empirical data reveals that it could take up to 40 days for
TPs to remediate incidents. This is a very large period of time, that can potentially expose
ServiceBizWorld to additional risks (such as exploitation of the root causes of the incident).
What-if investments are made to improve the current situations, primarily to reduce the involved
delays? Despite the process being simple and the outcomes intuitive, it still make sense to explore the
types of investments and controls that could be deployed and assess their impact.
Two kind of issues need to be addressed.
The first issue is related to the “Handling of the Incident Response” phase. Various TP interactions
might occur (up to 3), each of them potentially requiring long periods of time to get TP’s remediation
documents (potentially up to 40 days each).
In this case various kinds of investments and solutions could be considered to potentially improve the
performance. For the purpose of this what-if analysis, the following types of solutions have been
considered, each of them with an increasing level of impact and automation:
Remediation Templates to describe common remediation activities for known, recurrent
security incidents;
Knowledge-base and collaborative solutions (such as [7]) to provide guidance about
acceptable remediation plans and track their evolution against agreed SLAs/deadlines;
Incident Response Plan solutions (such as [8]) to automate the overall process of handling the
definition of remediation plans.
The second issue is related the “TP Incident Remediation” phase. As mentioned above, it might
require a long period of time for TPs to remediate to incidents (up to 40 days).
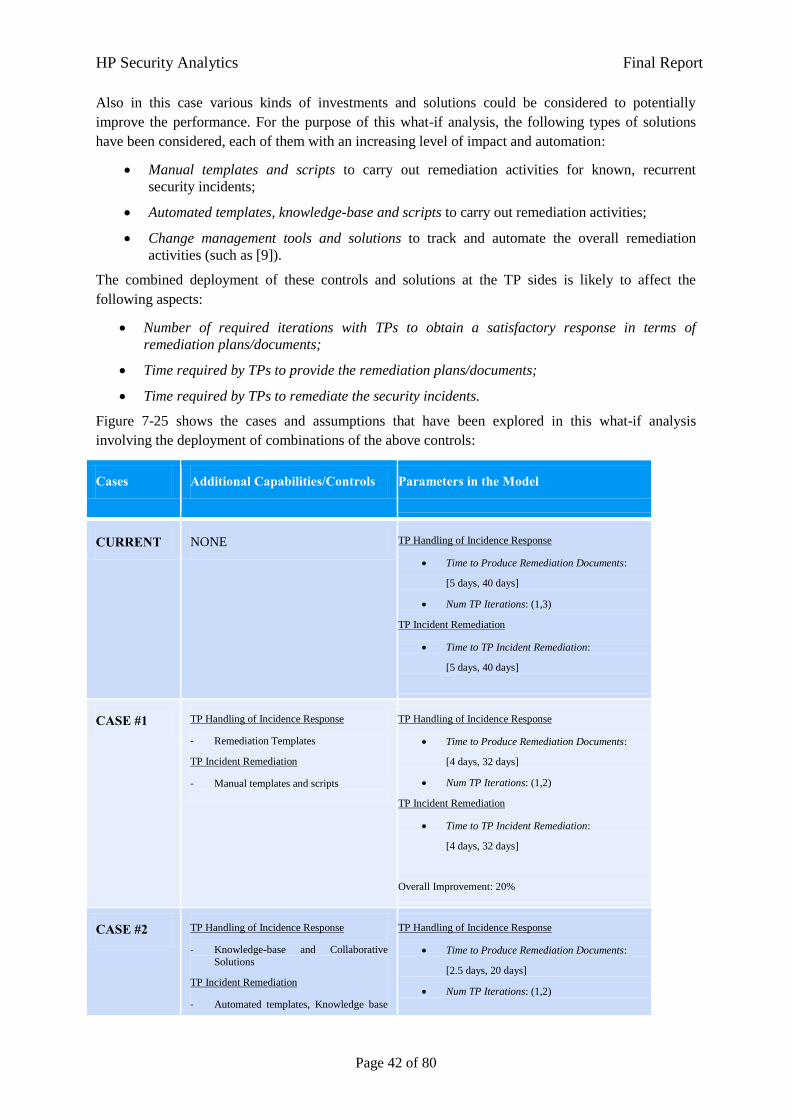
HP Security Analytics Final Report
Page 42 of 80
Also in this case various kinds of investments and solutions could be considered to potentially
improve the performance. For the purpose of this what-if analysis, the following types of solutions
have been considered, each of them with an increasing level of impact and automation:
Manual templates and scripts to carry out remediation activities for known, recurrent
security incidents;
Automated templates, knowledge-base and scripts to carry out remediation activities;
Change management tools and solutions to track and automate the overall remediation
activities (such as [9]).
The combined deployment of these controls and solutions at the TP sides is likely to affect the
following aspects:
Number of required iterations with TPs to obtain a satisfactory response in terms of
remediation plans/documents;
Time required by TPs to provide the remediation plans/documents;
Time required by TPs to remediate the security incidents.
Figure 7-25 shows the cases and assumptions that have been explored in this what-if analysis
involving the deployment of combinations of the above controls:
Cases Additional Capabilities/Controls Parameters in the Model
CURRENT NONE TP Handling of Incidence Response
Time to Produce Remediation Documents:
[5 days, 40 days]
Num TP Iterations: (1,3)
TP Incident Remediation
Time to TP Incident Remediation:
[5 days, 40 days]
CASE #1 TP Handling of Incidence Response
- Remediation Templates
TP Incident Remediation
- Manual templates and scripts
TP Handling of Incidence Response
Time to Produce Remediation Documents:
[4 days, 32 days]
Num TP Iterations: (1,2)
TP Incident Remediation
Time to TP Incident Remediation:
[4 days, 32 days]
Overall Improvement: 20%
CASE #2 TP Handling of Incidence Response
- Knowledge-base and Collaborative
Solutions
TP Incident Remediation
- Automated templates, Knowledge base
TP Handling of Incidence Response
Time to Produce Remediation Documents:
[2.5 days, 20 days]
Num TP Iterations: (1,2)
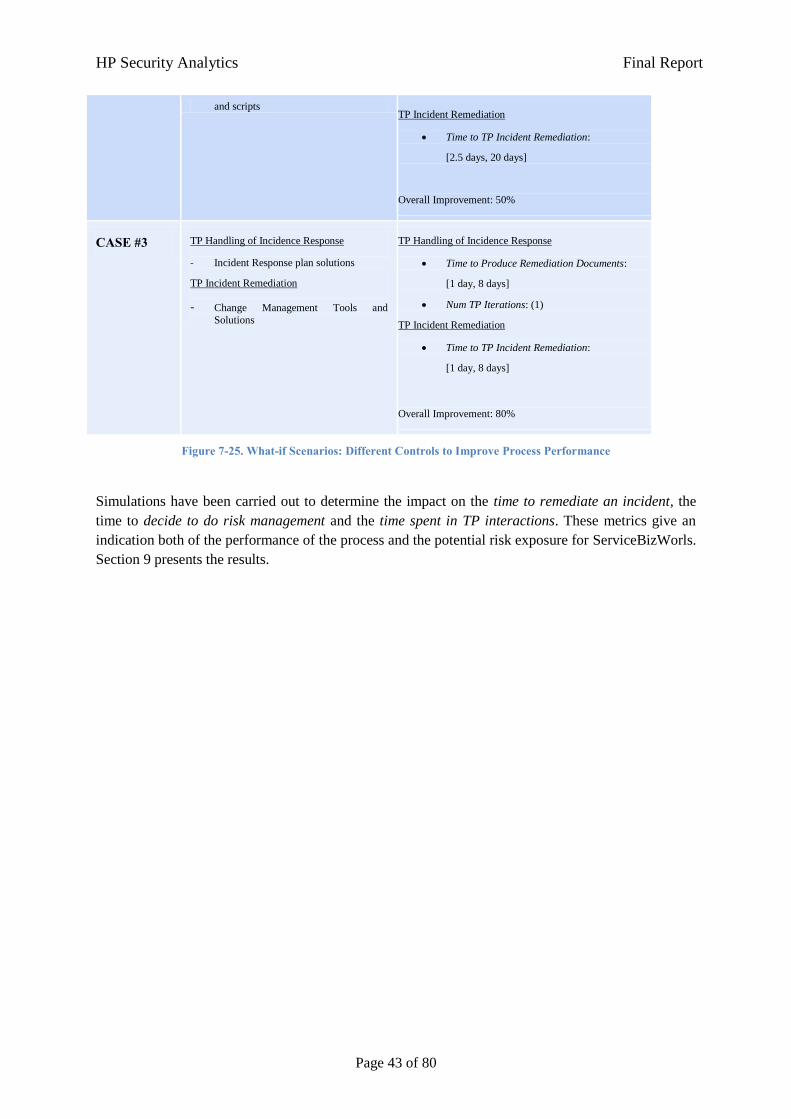
HP Security Analytics Final Report
Page 43 of 80
and scripts TP Incident Remediation
Time to TP Incident Remediation:
[2.5 days, 20 days]
Overall Improvement: 50%
CASE #3 TP Handling of Incidence Response
- Incident Response plan solutions
TP Incident Remediation
- Change Management Tools and
Solutions
TP Handling of Incidence Response
Time to Produce Remediation Documents:
[1 day, 8 days]
Num TP Iterations: (1)
TP Incident Remediation
Time to TP Incident Remediation:
[1 day, 8 days]
Overall Improvement: 80%
Figure 7-25. What-if Scenarios: Different Controls to Improve Process Performance
Simulations have been carried out to determine the impact on the time to remediate an incident, the
time to decide to do risk management and the time spent in TP interactions. These metrics give an
indication both of the performance of the process and the potential risk exposure for ServiceBizWorls.
Section 9 presents the results.
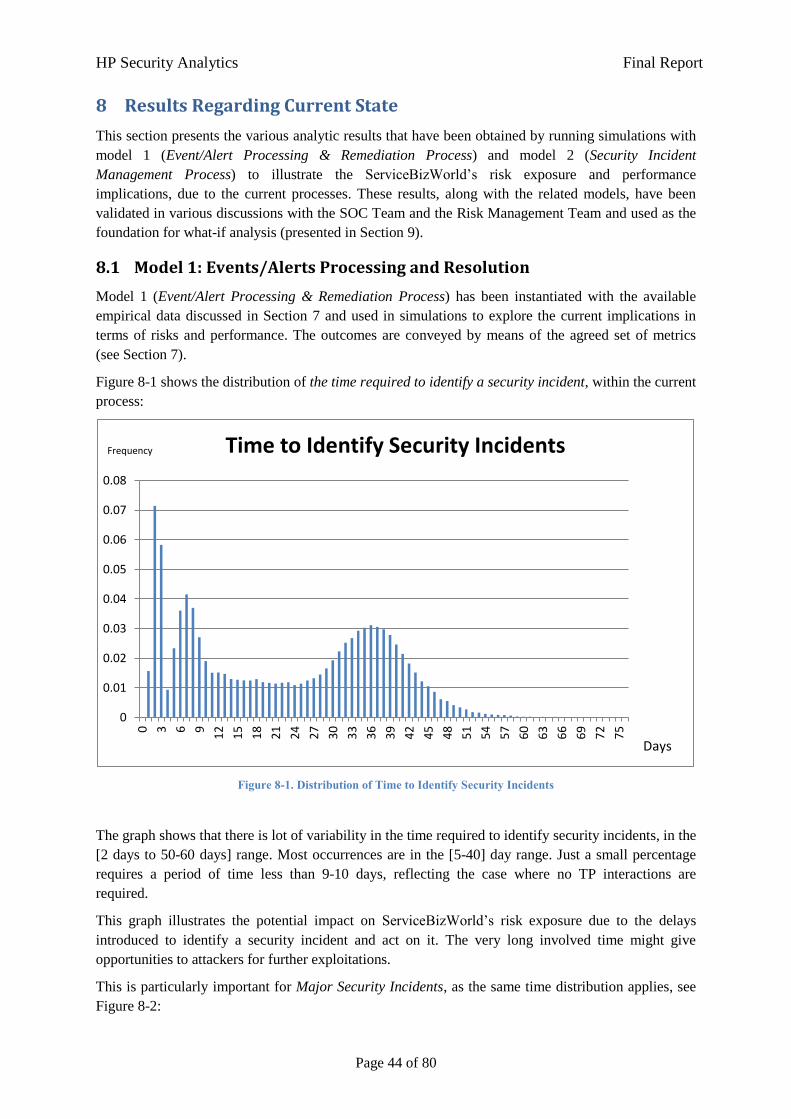
HP Security Analytics Final Report
Page 44 of 80
8 Results Regarding Current State
This section presents the various analytic results that have been obtained by running simulations with
model 1 (Event/Alert Processing & Remediation Process) and model 2 (Security Incident
Management Process) to illustrate the ServiceBizWorld’s risk exposure and performance
implications, due to the current processes. These results, along with the related models, have been
validated in various discussions with the SOC Team and the Risk Management Team and used as the
foundation for what-if analysis (presented in Section 9).
8.1 Model 1: Events/Alerts Processing and Resolution
Model 1 (Event/Alert Processing & Remediation Process) has been instantiated with the available
empirical data discussed in Section 7 and used in simulations to explore the current implications in
terms of risks and performance. The outcomes are conveyed by means of the agreed set of metrics
(see Section 7).
Figure 8-1 shows the distribution of the time required to identify a security incident, within the current
process:
Figure 8-1. Distribution of Time to Identify Security Incidents
The graph shows that there is lot of variability in the time required to identify security incidents, in the
[2 days to 50-60 days] range. Most occurrences are in the [5-40] day range. Just a small percentage
requires a period of time less than 9-10 days, reflecting the case where no TP interactions are
required.
This graph illustrates the potential impact on ServiceBizWorld’s risk exposure due to the delays
introduced to identify a security incident and act on it. The very long involved time might give
opportunities to attackers for further exploitations.
This is particularly important for Major Security Incidents, as the same time distribution applies, see
Figure 8-2:
0
0.01
0.02
0.03
0.04
0.05
0.06
0.07
0.08
0
3
6
9
12
15
18
21
24
27
30
33
36
39
42
45
48
51
54
57
60
63
66
69
72
75
Time to Identify Security Incidents
Days
Frequency
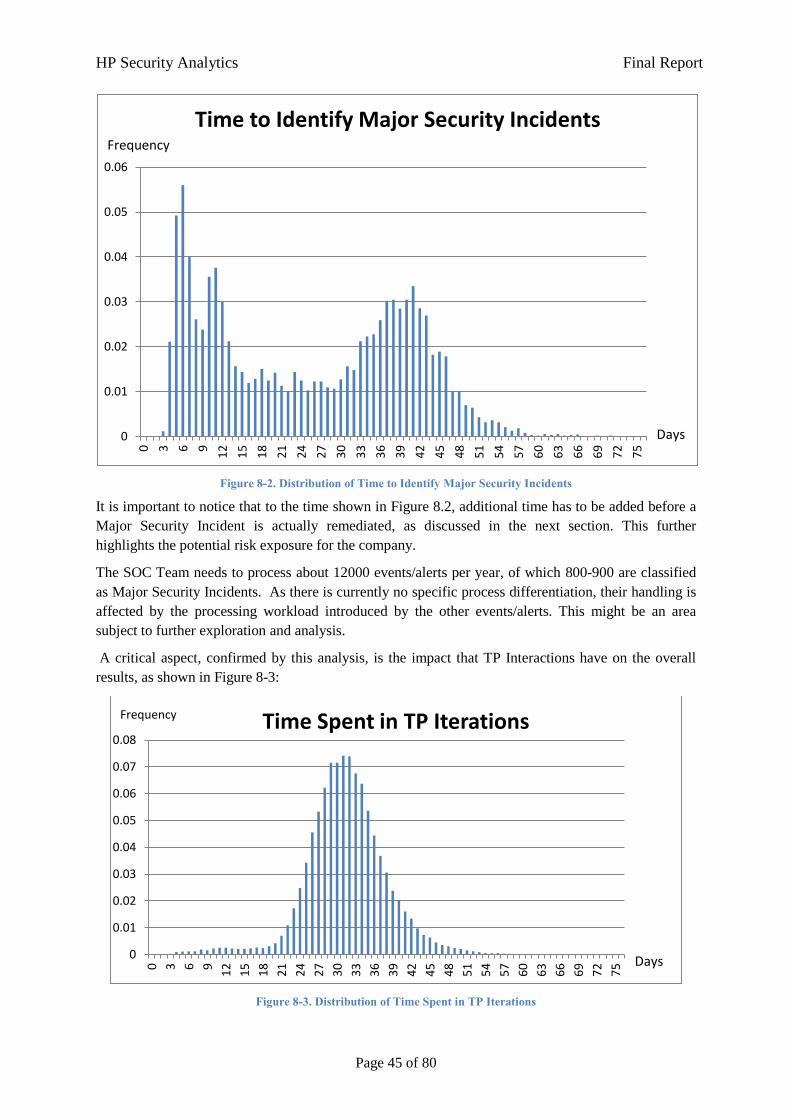
HP Security Analytics Final Report
Page 45 of 80
Figure 8-2. Distribution of Time to Identify Major Security Incidents
It is important to notice that to the time shown in Figure 8.2, additional time has to be added before a
Major Security Incident is actually remediated, as discussed in the next section. This further
highlights the potential risk exposure for the company.
The SOC Team needs to process about 12000 events/alerts per year, of which 800-900 are classified
as Major Security Incidents. As there is currently no specific process differentiation, their handling is
affected by the processing workload introduced by the other events/alerts. This might be an area
subject to further exploration and analysis.
A critical aspect, confirmed by this analysis, is the impact that TP Interactions have on the overall
results, as shown in Figure 8-3:
Figure 8-3. Distribution of Time Spent in TP Iterations
0
0.01
0.02
0.03
0.04
0.05
0.06
0
3
6
9
12
15
18
21
24
27
30
33
36
39
42
45
48
51
54
57
60
63
66
69
72
75
Time to Identify Major Security Incidents
Days
Frequency
0
0.01
0.02
0.03
0.04
0.05
0.06
0.07
0.08
0
3
6
9
12
15
18
21
24
27
30
33
36
39
42
45
48
51
54
57
60
63
66
69
72
75
Time Spent in TP Iterations
Days
Frequency
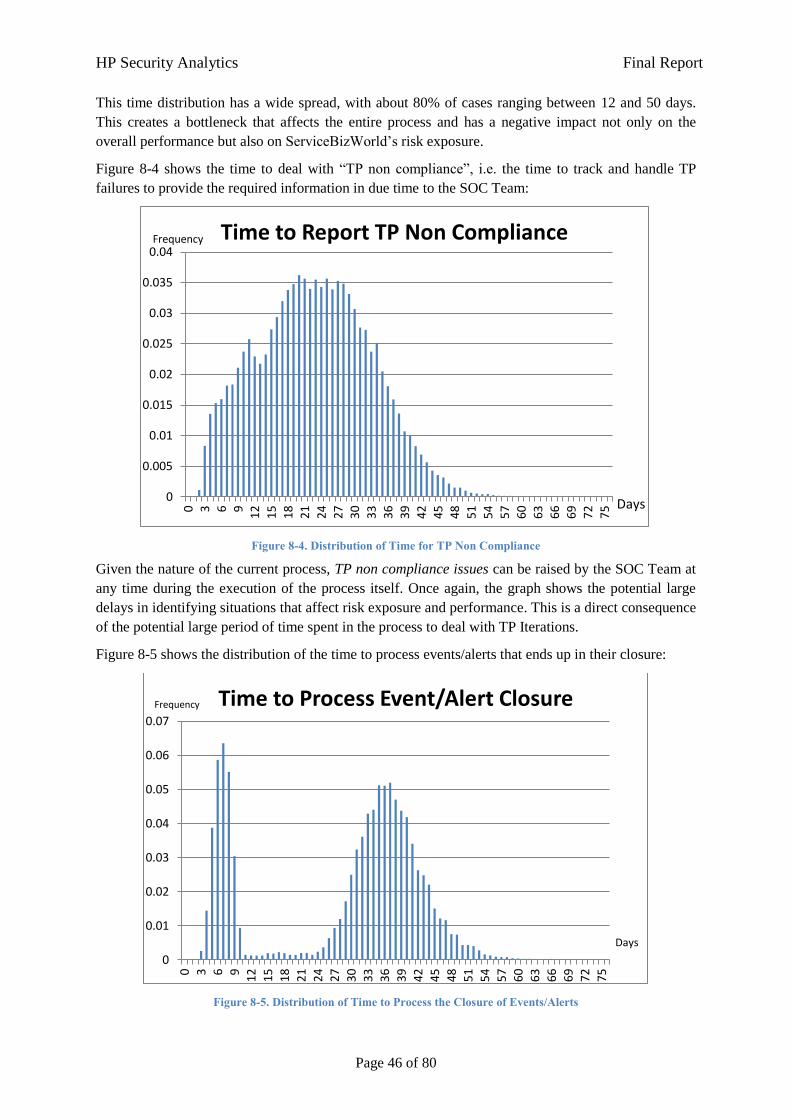
HP Security Analytics Final Report
Page 46 of 80
This time distribution has a wide spread, with about 80% of cases ranging between 12 and 50 days.
This creates a bottleneck that affects the entire process and has a negative impact not only on the
overall performance but also on ServiceBizWorld’s risk exposure.
Figure 8-4 shows the time to deal with “TP non compliance”, i.e. the time to track and handle TP
failures to provide the required information in due time to the SOC Team:
Figure 8-4. Distribution of Time for TP Non Compliance
Given the nature of the current process, TP non compliance issues can be raised by the SOC Team at
any time during the execution of the process itself. Once again, the graph shows the potential large
delays in identifying situations that affect risk exposure and performance. This is a direct consequence
of the potential large period of time spent in the process to deal with TP Iterations.
Figure 8-5 shows the distribution of the time to process events/alerts that ends up in their closure:
Figure 8-5. Distribution of Time to Process the Closure of Events/Alerts
0
0.005
0.01
0.015
0.02
0.025
0.03
0.035
0.04
0
3
6
9
12
15
18
21
24
27
30
33
36
39
42
45
48
51
54
57
60
63
66
69
72
75
Time to Report TP Non Compliance
Days
Frequency
0
0.01
0.02
0.03
0.04
0.05
0.06
0.07
0
3
6
9
12
15
18
21
24
27
30
33
36
39
42
45
48
51
54
57
60
63
66
69
72
75
Time to Process Event/Alert Closure
Days
Frequency
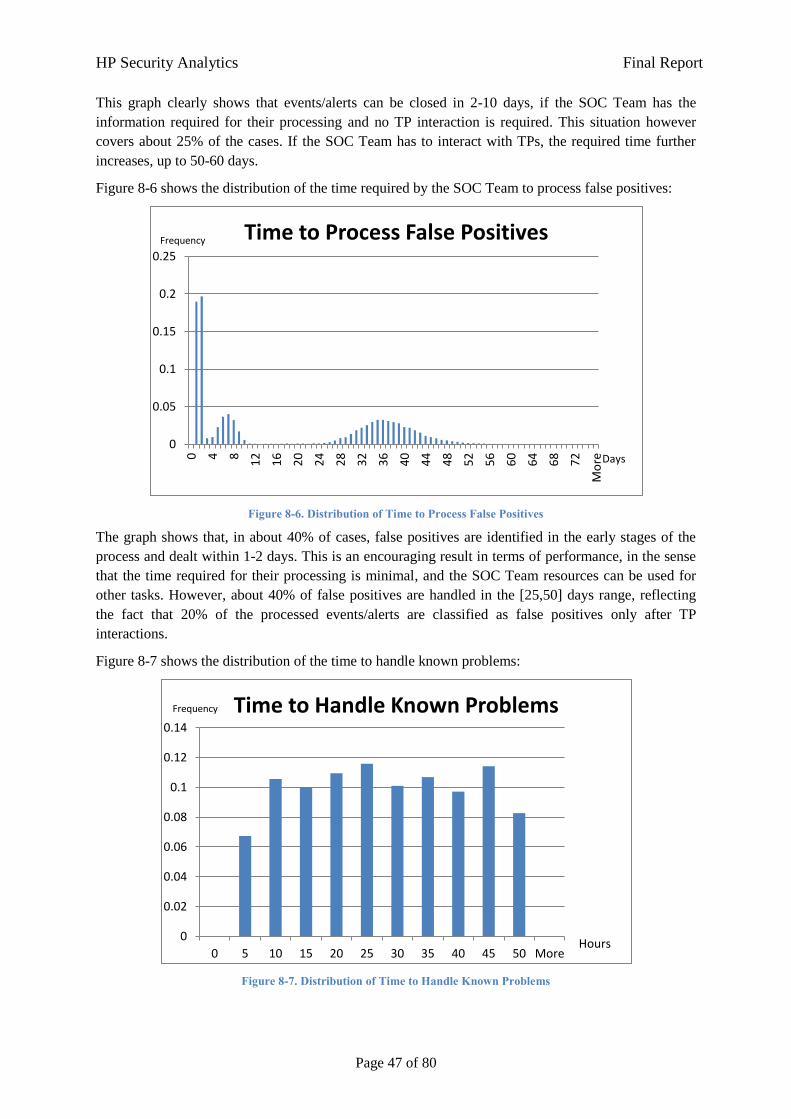
HP Security Analytics Final Report
Page 47 of 80
This graph clearly shows that events/alerts can be closed in 2-10 days, if the SOC Team has the
information required for their processing and no TP interaction is required. This situation however
covers about 25% of the cases. If the SOC Team has to interact with TPs, the required time further
increases, up to 50-60 days.
Figure 8-6 shows the distribution of the time required by the SOC Team to process false positives:
Figure 8-6. Distribution of Time to Process False Positives
The graph shows that, in about 40% of cases, false positives are identified in the early stages of the
process and dealt within 1-2 days. This is an encouraging result in terms of performance, in the sense
that the time required for their processing is minimal, and the SOC Team resources can be used for
other tasks. However, about 40% of false positives are handled in the [25,50] days range, reflecting
the fact that 20% of the processed events/alerts are classified as false positives only after TP
interactions.
Figure 8-7 shows the distribution of the time to handle known problems:
Figure 8-7. Distribution of Time to Handle Known Problems
0
0.05
0.1
0.15
0.2
0.25
0
4
8
12
16
20
24
28
32
36
40
44
48
52
56
60
64
68
72
Mo
re
Time to Process False Positives
Days
Frequency
0
0.02
0.04
0.06
0.08
0.1
0.12
0.14
0 5 10 15 20 25 30 35 40 45 50 More
Time to Handle Known Problems
Hours
Frequency
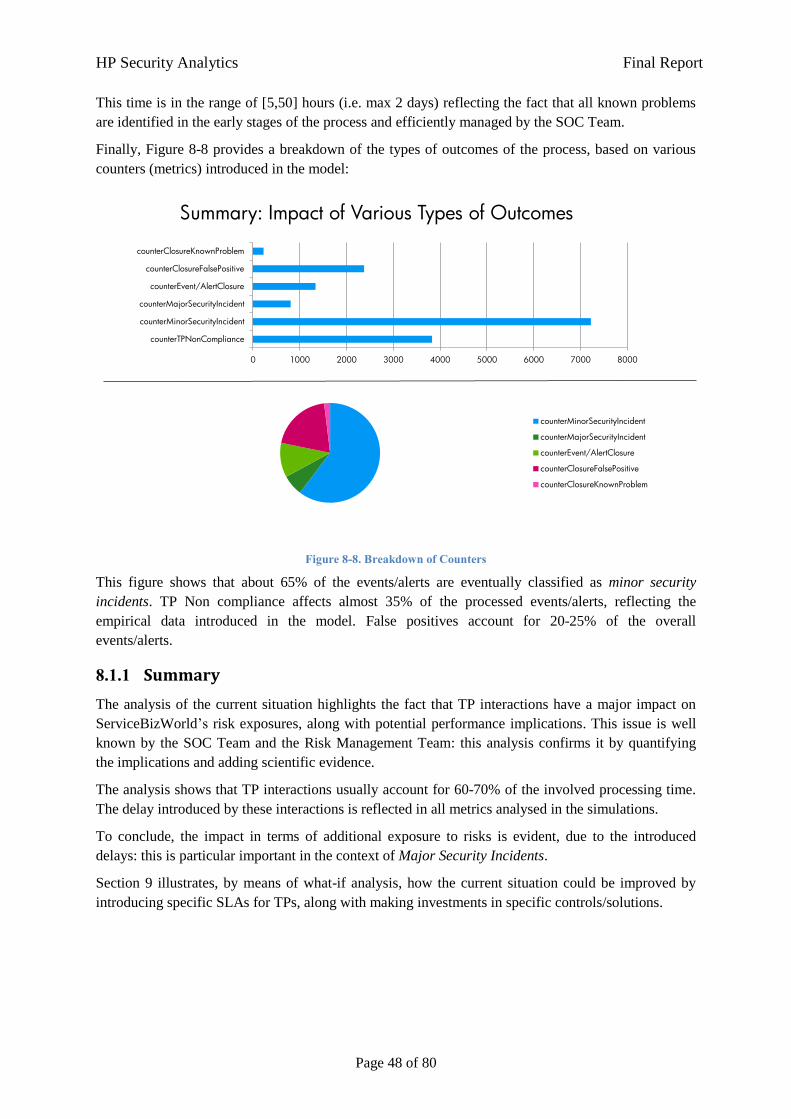
HP Security Analytics Final Report
Page 48 of 80
This time is in the range of [5,50] hours (i.e. max 2 days) reflecting the fact that all known problems
are identified in the early stages of the process and efficiently managed by the SOC Team.
Finally, Figure 8-8 provides a breakdown of the types of outcomes of the process, based on various
counters (metrics) introduced in the model:
Summary: Impact of Various Types of Outcomes
0 1000 2000 3000 4000 5000 6000 7000 8000
counterTPNonCompliance
counterMinorSecurityIncident
counterMajorSecurityIncident
counterEvent/AlertClosure
counterClosureFalsePositive
counterClosureKnownProblem
counterMinorSecurityIncident
counterMajorSecurityIncident
counterEvent/AlertClosure
counterClosureFalsePositive
counterClosureKnownProblem
Figure 8-8. Breakdown of Counters
This figure shows that about 65% of the events/alerts are eventually classified as minor security
incidents. TP Non compliance affects almost 35% of the processed events/alerts, reflecting the
empirical data introduced in the model. False positives account for 20-25% of the overall
events/alerts.
8.1.1 Summary
The analysis of the current situation highlights the fact that TP interactions have a major impact on
ServiceBizWorld’s risk exposures, along with potential performance implications. This issue is well
known by the SOC Team and the Risk Management Team: this analysis confirms it by quantifying
the implications and adding scientific evidence.
The analysis shows that TP interactions usually account for 60-70% of the involved processing time.
The delay introduced by these interactions is reflected in all metrics analysed in the simulations.
To conclude, the impact in terms of additional exposure to risks is evident, due to the introduced
delays: this is particular important in the context of Major Security Incidents.
Section 9 illustrates, by means of what-if analysis, how the current situation could be improved by
introducing specific SLAs for TPs, along with making investments in specific controls/solutions.
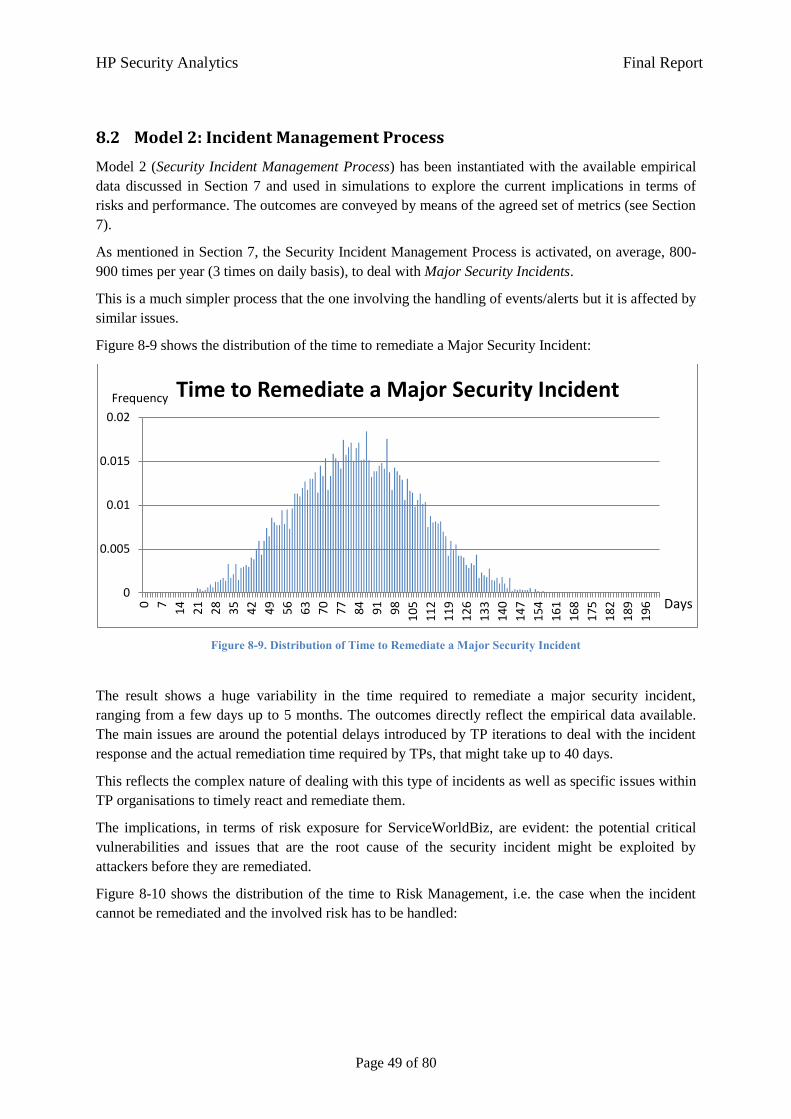
HP Security Analytics Final Report
Page 49 of 80
8.2 Model 2: Incident Management Process
Model 2 (Security Incident Management Process) has been instantiated with the available empirical
data discussed in Section 7 and used in simulations to explore the current implications in terms of
risks and performance. The outcomes are conveyed by means of the agreed set of metrics (see Section
7).
As mentioned in Section 7, the Security Incident Management Process is activated, on average, 800-
900 times per year (3 times on daily basis), to deal with Major Security Incidents.
This is a much simpler process that the one involving the handling of events/alerts but it is affected by
similar issues.
Figure 8-9 shows the distribution of the time to remediate a Major Security Incident:
Figure 8-9. Distribution of Time to Remediate a Major Security Incident
The result shows a huge variability in the time required to remediate a major security incident,
ranging from a few days up to 5 months. The outcomes directly reflect the empirical data available.
The main issues are around the potential delays introduced by TP iterations to deal with the incident
response and the actual remediation time required by TPs, that might take up to 40 days.
This reflects the complex nature of dealing with this type of incidents as well as specific issues within
TP organisations to timely react and remediate them.
The implications, in terms of risk exposure for ServiceWorldBiz, are evident: the potential critical
vulnerabilities and issues that are the root cause of the security incident might be exploited by
attackers before they are remediated.
Figure 8-10 shows the distribution of the time to Risk Management, i.e. the case when the incident
cannot be remediated and the involved risk has to be handled:
0
0.005
0.01
0.015
0.02
0
7
14
21
28
35
42
49
56
63
70
77
84
91
98
10
5
11
2
11
9
12
6
13
3
14
0
14
7
15
4
16
1
16
8
17
5
18
2
18
9
19
6
Time to Remediate a Major Security Incident
Days
Frequency

HP Security Analytics Final Report
Page 50 of 80
Figure 8-10. Distribution of Time to Risk Management
The graph shows that it might take up to 4 months to conclude that the major security incident cannot
be remediated and the risk has to be managed. This is again a reflection of the time spent in TP
iterations.
Finally, Figure 8-11 shows the distribution of time that is actually spent in TP iterations to handle the
incident response:
Figure 8-11. Distribution of Time spent in TP Iterations
The result confirms that it might take up to 4 months to interact with TPs, to handle the incident
response. This influences the other process outcomes.
8.2.1 Summary
The analysis of the current situation confirms the fact that, also in this process, TP interactions have a
major impact on ServiceBizWorld’s risk exposure, along with potential performance implications.
These results reinforce the findings of the analysis carried out in the first process.
Noticeably, it might take up to 7 months to fully remediate a major security incident, if we consider
the time required to identify the security incident and the actual time required to mitigate it.
0
0.005
0.01
0.015
0.02
0.025 0
7
14
21
28
35
42
49
56
63
70
77
84
91
98
10
5
11
2
11
9
12
6
13
3
14
0
14
7
15
4
16
1
16
8
17
5
18
2
18
9
19
6
Time to Risk Management
Days
Frequency
0
0.005
0.01
0.015
0.02
0.025
0
7
14
21
28
35
42
49
56
63
70
77
84
91
98
10
5
11
2
11
9
12
6
13
3
14
0
14
7
15
4
16
1
16
8
17
5
18
2
18
9
19
6
Time Spent in TP Iterations
Days
Frequency
HP Security Analytics Final Report
Page 51 of 80
There are potential margins for improvement involving investments in controls/solutions and
streamlining/optimising the activities carried out by TPs. A few potential options are explored in
Section 9, by means of a what-if analysis.
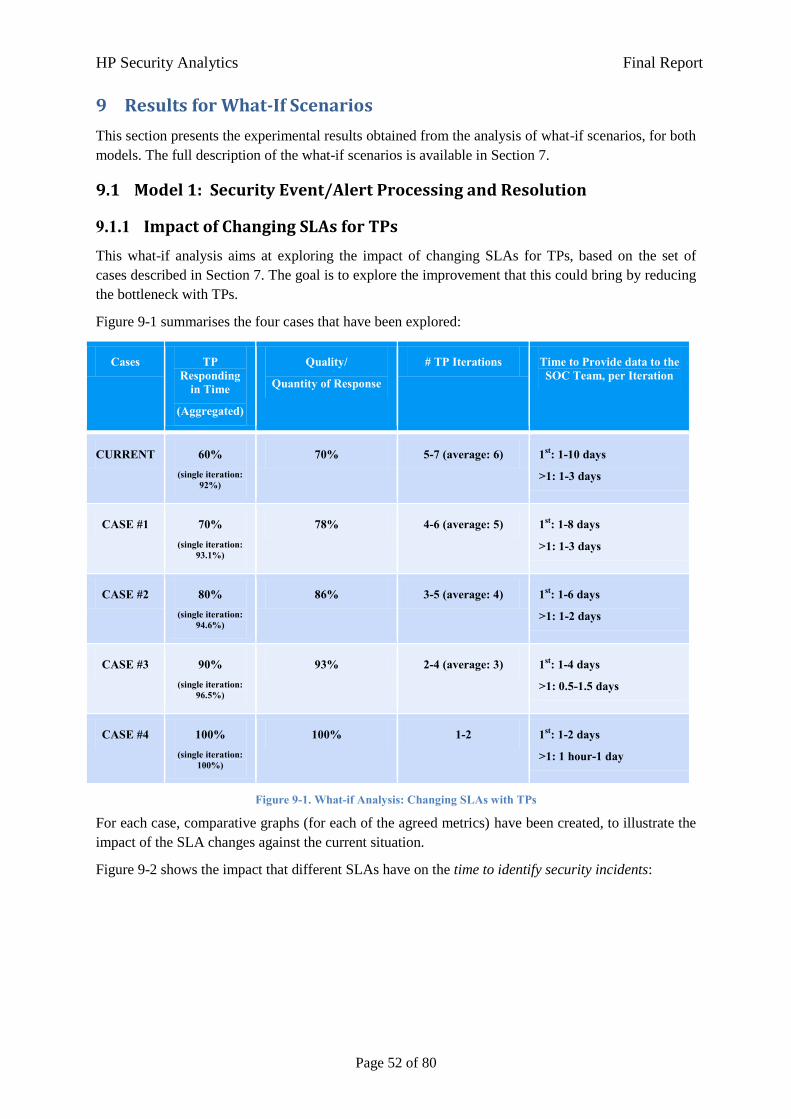
HP Security Analytics Final Report
Page 52 of 80
9 Results for What-If Scenarios
This section presents the experimental results obtained from the analysis of what-if scenarios, for both
models. The full description of the what-if scenarios is available in Section 7.
9.1 Model 1: Security Event/Alert Processing and Resolution
9.1.1 Impact of Changing SLAs for TPs
This what-if analysis aims at exploring the impact of changing SLAs for TPs, based on the set of
cases described in Section 7. The goal is to explore the improvement that this could bring by reducing
the bottleneck with TPs.
Figure 9-1 summarises the four cases that have been explored:
Cases TP Responding
in Time
(Aggregated)
Quality/
Quantity of Response
# TP Iterations Time to Provide data to the SOC Team, per Iteration
CURRENT 60% (single iteration:
92%)
70% 5-7 (average: 6) 1st: 1-10 days
>1: 1-3 days
CASE #1 70% (single iteration:
93.1%)
78% 4-6 (average: 5) 1st: 1-8 days
>1: 1-3 days
CASE #2 80% (single iteration:
94.6%)
86% 3-5 (average: 4) 1st: 1-6 days
>1: 1-2 days
CASE #3 90% (single iteration:
96.5%)
93% 2-4 (average: 3) 1st: 1-4 days
>1: 0.5-1.5 days
CASE #4 100% (single iteration:
100%)
100% 1-2 1st: 1-2 days
>1: 1 hour-1 day
Figure 9-1. What-if Analysis: Changing SLAs with TPs
For each case, comparative graphs (for each of the agreed metrics) have been created, to illustrate the
impact of the SLA changes against the current situation.
Figure 9-2 shows the impact that different SLAs have on the time to identify security incidents:
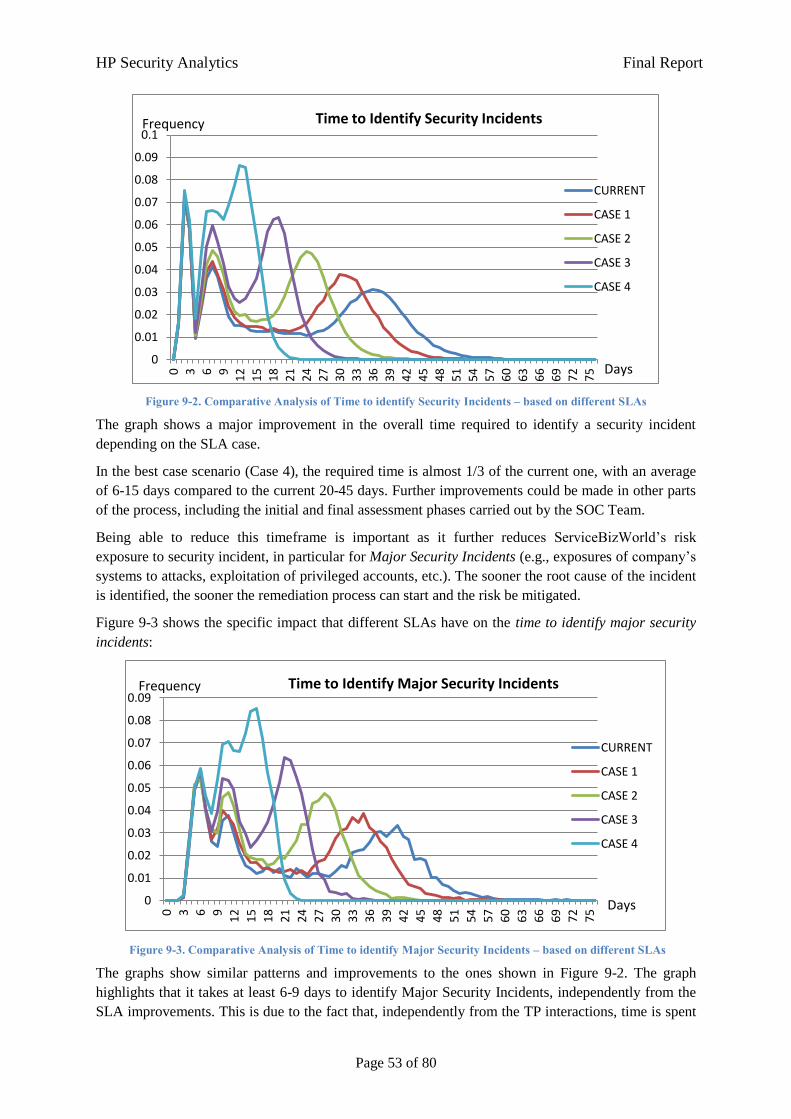
HP Security Analytics Final Report
Page 53 of 80
Figure 9-2. Comparative Analysis of Time to identify Security Incidents – based on different SLAs
The graph shows a major improvement in the overall time required to identify a security incident
depending on the SLA case.
In the best case scenario (Case 4), the required time is almost 1/3 of the current one, with an average
of 6-15 days compared to the current 20-45 days. Further improvements could be made in other parts
of the process, including the initial and final assessment phases carried out by the SOC Team.
Being able to reduce this timeframe is important as it further reduces ServiceBizWorld’s risk
exposure to security incident, in particular for Major Security Incidents (e.g., exposures of company’s
systems to attacks, exploitation of privileged accounts, etc.). The sooner the root cause of the incident
is identified, the sooner the remediation process can start and the risk be mitigated.
Figure 9-3 shows the specific impact that different SLAs have on the time to identify major security
incidents:
Figure 9-3. Comparative Analysis of Time to identify Major Security Incidents – based on different SLAs
The graphs show similar patterns and improvements to the ones shown in Figure 9-2. The graph
highlights that it takes at least 6-9 days to identify Major Security Incidents, independently from the
SLA improvements. This is due to the fact that, independently from the TP interactions, time is spent
0
0.01
0.02
0.03
0.04
0.05
0.06
0.07
0.08
0.09
0.1
0
3
6
9
12
15
18
21
24
27
30
33
36
39
42
45
48
51
54
57
60
63
66
69
72
75
CURRENT
CASE 1
CASE 2
CASE 3
CASE 4
Time to Identify Security Incidents
Days
Frequency
0
0.01
0.02
0.03
0.04
0.05
0.06
0.07
0.08
0.09
0
3
6
9
12
15
18
21
24
27
30
33
36
39
42
45
48
51
54
57
60
63
66
69
72
75
CURRENT
CASE 1
CASE 2
CASE 3
CASE 4
Time to Identify Major Security Incidents Frequency
Days
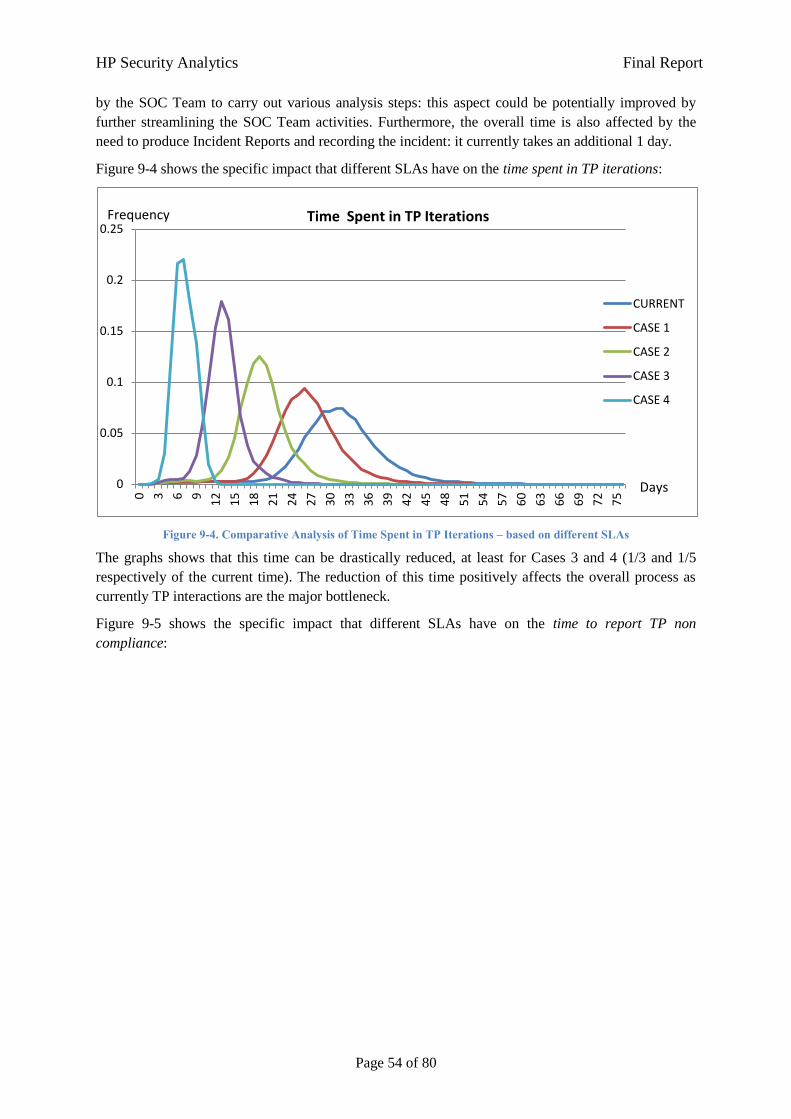
HP Security Analytics Final Report
Page 54 of 80
by the SOC Team to carry out various analysis steps: this aspect could be potentially improved by
further streamlining the SOC Team activities. Furthermore, the overall time is also affected by the
need to produce Incident Reports and recording the incident: it currently takes an additional 1 day.
Figure 9-4 shows the specific impact that different SLAs have on the time spent in TP iterations:
Figure 9-4. Comparative Analysis of Time Spent in TP Iterations – based on different SLAs
The graphs shows that this time can be drastically reduced, at least for Cases 3 and 4 (1/3 and 1/5
respectively of the current time). The reduction of this time positively affects the overall process as
currently TP interactions are the major bottleneck.
Figure 9-5 shows the specific impact that different SLAs have on the time to report TP non
compliance:
0
0.05
0.1
0.15
0.2
0.25
0
3
6
9
12
15
18
21
24
27
30
33
36
39
42
45
48
51
54
57
60
63
66
69
72
75
CURRENT
CASE 1
CASE 2
CASE 3
CASE 4
Time Spent in TP Iterations
Days
Frequency
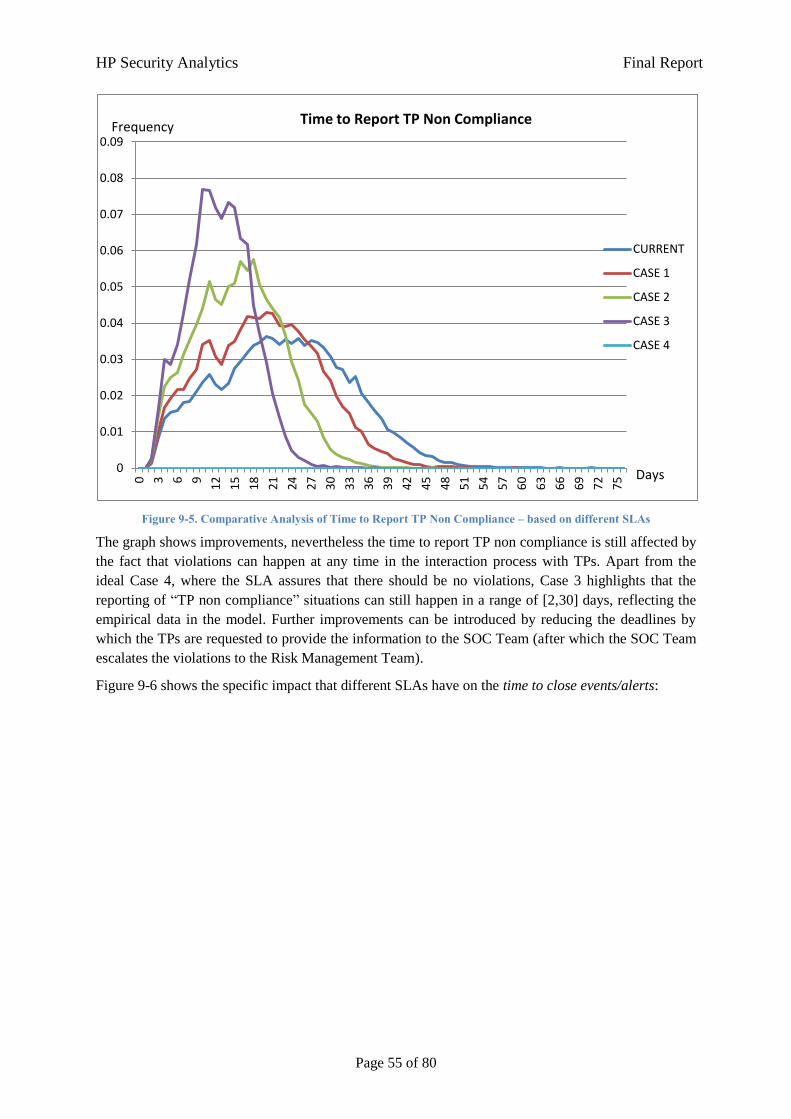
HP Security Analytics Final Report
Page 55 of 80
Figure 9-5. Comparative Analysis of Time to Report TP Non Compliance – based on different SLAs
The graph shows improvements, nevertheless the time to report TP non compliance is still affected by
the fact that violations can happen at any time in the interaction process with TPs. Apart from the
ideal Case 4, where the SLA assures that there should be no violations, Case 3 highlights that the
reporting of “TP non compliance” situations can still happen in a range of [2,30] days, reflecting the
empirical data in the model. Further improvements can be introduced by reducing the deadlines by
which the TPs are requested to provide the information to the SOC Team (after which the SOC Team
escalates the violations to the Risk Management Team).
Figure 9-6 shows the specific impact that different SLAs have on the time to close events/alerts:
0
0.01
0.02
0.03
0.04
0.05
0.06
0.07
0.08
0.09 0
3
6
9
12
15
18
21
24
27
30
33
36
39
42
45
48
51
54
57
60
63
66
69
72
75
CURRENT
CASE 1
CASE 2
CASE 3
CASE 4
Time to Report TP Non Compliance
Days
Frequency
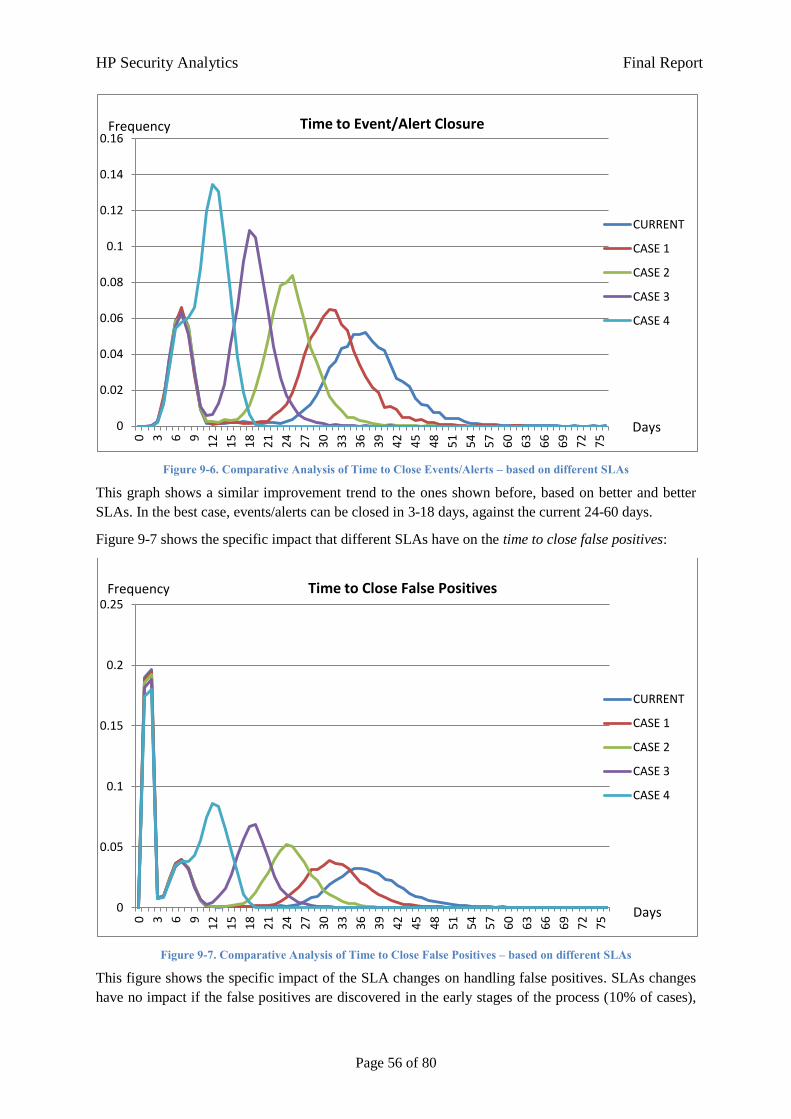
HP Security Analytics Final Report
Page 56 of 80
Figure 9-6. Comparative Analysis of Time to Close Events/Alerts – based on different SLAs
This graph shows a similar improvement trend to the ones shown before, based on better and better
SLAs. In the best case, events/alerts can be closed in 3-18 days, against the current 24-60 days.
Figure 9-7 shows the specific impact that different SLAs have on the time to close false positives:
Figure 9-7. Comparative Analysis of Time to Close False Positives – based on different SLAs
This figure shows the specific impact of the SLA changes on handling false positives. SLAs changes
have no impact if the false positives are discovered in the early stages of the process (10% of cases),
0
0.02
0.04
0.06
0.08
0.1
0.12
0.14
0.16 0
3
6
9
12
15
18
21
24
27
30
33
36
39
42
45
48
51
54
57
60
63
66
69
72
75
CURRENT
CASE 1
CASE 2
CASE 3
CASE 4
Time to Event/Alert Closure
Days
Frequency
0
0.05
0.1
0.15
0.2
0.25
0
3
6
9
12
15
18
21
24
27
30
33
36
39
42
45
48
51
54
57
60
63
66
69
72
75
CURRENT
CASE 1
CASE 2
CASE 3
CASE 4
Time to Close False Positives
Days
Frequency
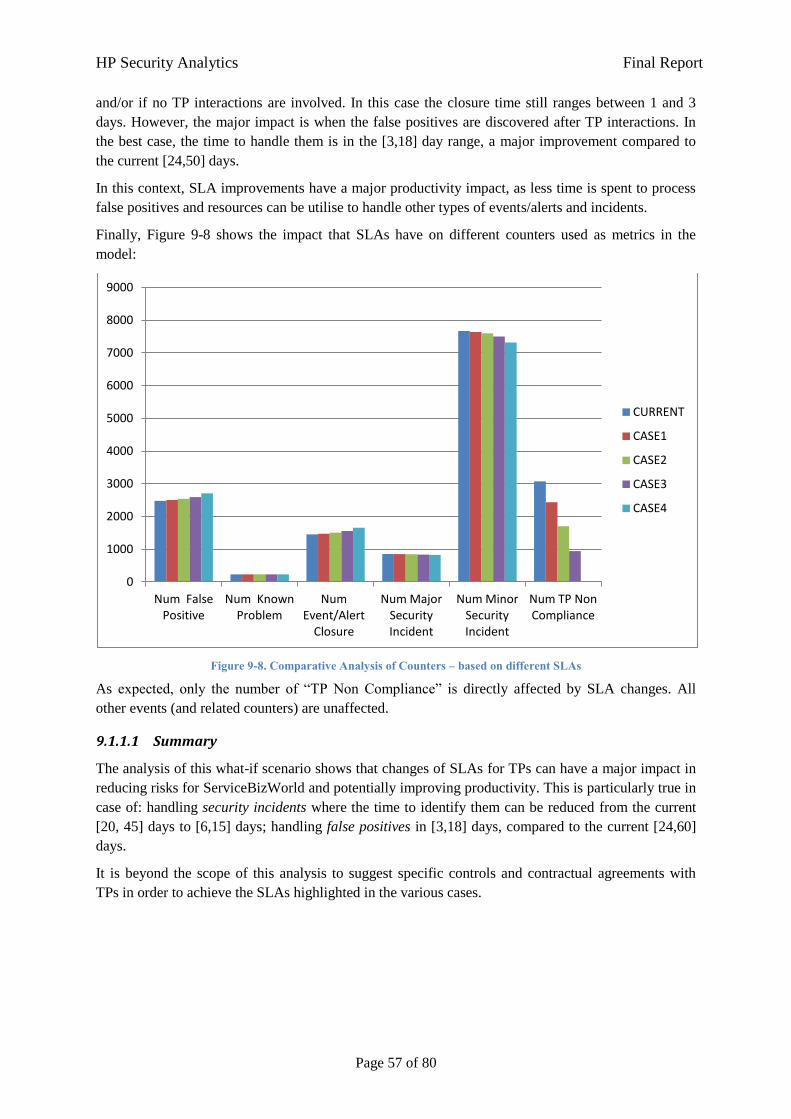
HP Security Analytics Final Report
Page 57 of 80
and/or if no TP interactions are involved. In this case the closure time still ranges between 1 and 3
days. However, the major impact is when the false positives are discovered after TP interactions. In
the best case, the time to handle them is in the [3,18] day range, a major improvement compared to
the current [24,50] days.
In this context, SLA improvements have a major productivity impact, as less time is spent to process
false positives and resources can be utilise to handle other types of events/alerts and incidents.
Finally, Figure 9-8 shows the impact that SLAs have on different counters used as metrics in the
model:
Figure 9-8. Comparative Analysis of Counters – based on different SLAs
As expected, only the number of “TP Non Compliance” is directly affected by SLA changes. All
other events (and related counters) are unaffected.
9.1.1.1 Summary
The analysis of this what-if scenario shows that changes of SLAs for TPs can have a major impact in
reducing risks for ServiceBizWorld and potentially improving productivity. This is particularly true in
case of: handling security incidents where the time to identify them can be reduced from the current
[20, 45] days to [6,15] days; handling false positives in [3,18] days, compared to the current [24,60]
days.
It is beyond the scope of this analysis to suggest specific controls and contractual agreements with
TPs in order to achieve the SLAs highlighted in the various cases.
0
1000
2000
3000
4000
5000
6000
7000
8000
9000
Num False Positive
Num Known Problem
Num Event/Alert
Closure
Num Major Security Incident
Num Minor Security Incident
Num TP Non Compliance
CURRENT
CASE1
CASE2
CASE3
CASE4
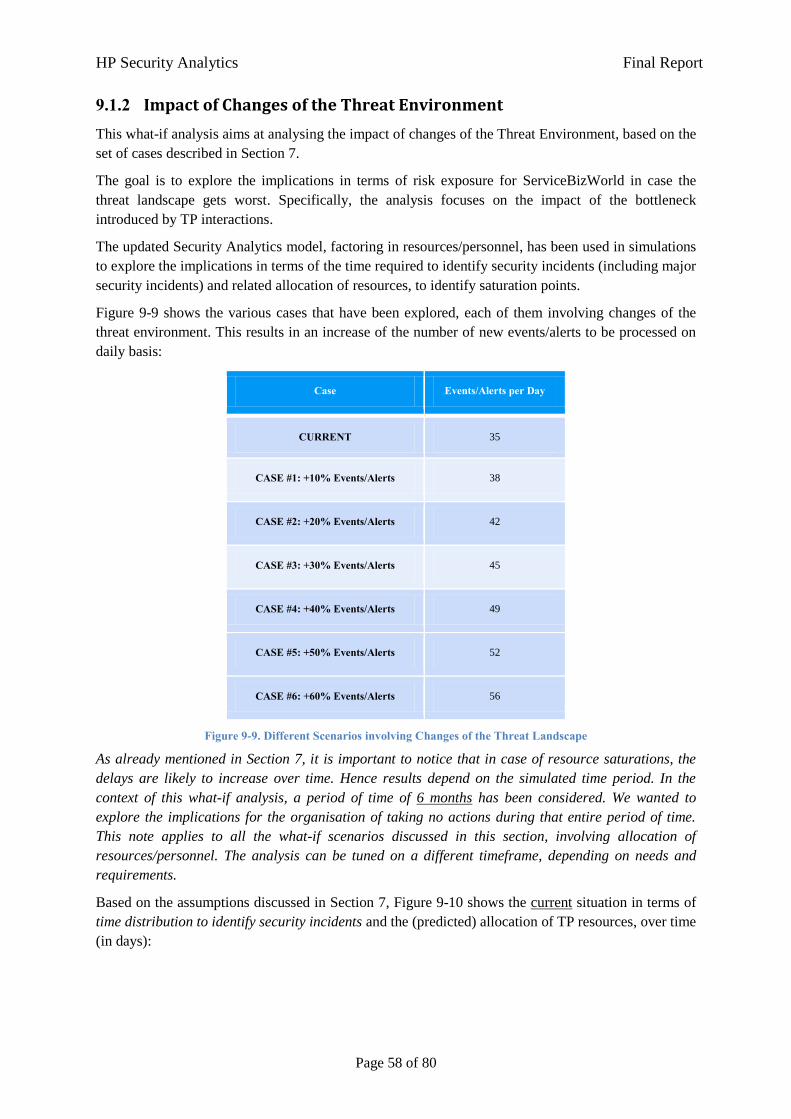
HP Security Analytics Final Report
Page 58 of 80
9.1.2 Impact of Changes of the Threat Environment
This what-if analysis aims at analysing the impact of changes of the Threat Environment, based on the
set of cases described in Section 7.
The goal is to explore the implications in terms of risk exposure for ServiceBizWorld in case the
threat landscape gets worst. Specifically, the analysis focuses on the impact of the bottleneck
introduced by TP interactions.
The updated Security Analytics model, factoring in resources/personnel, has been used in simulations
to explore the implications in terms of the time required to identify security incidents (including major
security incidents) and related allocation of resources, to identify saturation points.
Figure 9-9 shows the various cases that have been explored, each of them involving changes of the
threat environment. This results in an increase of the number of new events/alerts to be processed on
daily basis:
Case Events/Alerts per Day
CURRENT 35
CASE #1: +10% Events/Alerts 38
CASE #2: +20% Events/Alerts 42
CASE #3: +30% Events/Alerts 45
CASE #4: +40% Events/Alerts 49
CASE #5: +50% Events/Alerts 52
CASE #6: +60% Events/Alerts 56
Figure 9-9. Different Scenarios involving Changes of the Threat Landscape
As already mentioned in Section 7, it is important to notice that in case of resource saturations, the
delays are likely to increase over time. Hence results depend on the simulated time period. In the
context of this what-if analysis, a period of time of 6 months has been considered. We wanted to
explore the implications for the organisation of taking no actions during that entire period of time.
This note applies to all the what-if scenarios discussed in this section, involving allocation of
resources/personnel. The analysis can be tuned on a different timeframe, depending on needs and
requirements.
Based on the assumptions discussed in Section 7, Figure 9-10 shows the current situation in terms of
time distribution to identify security incidents and the (predicted) allocation of TP resources, over time
(in days):
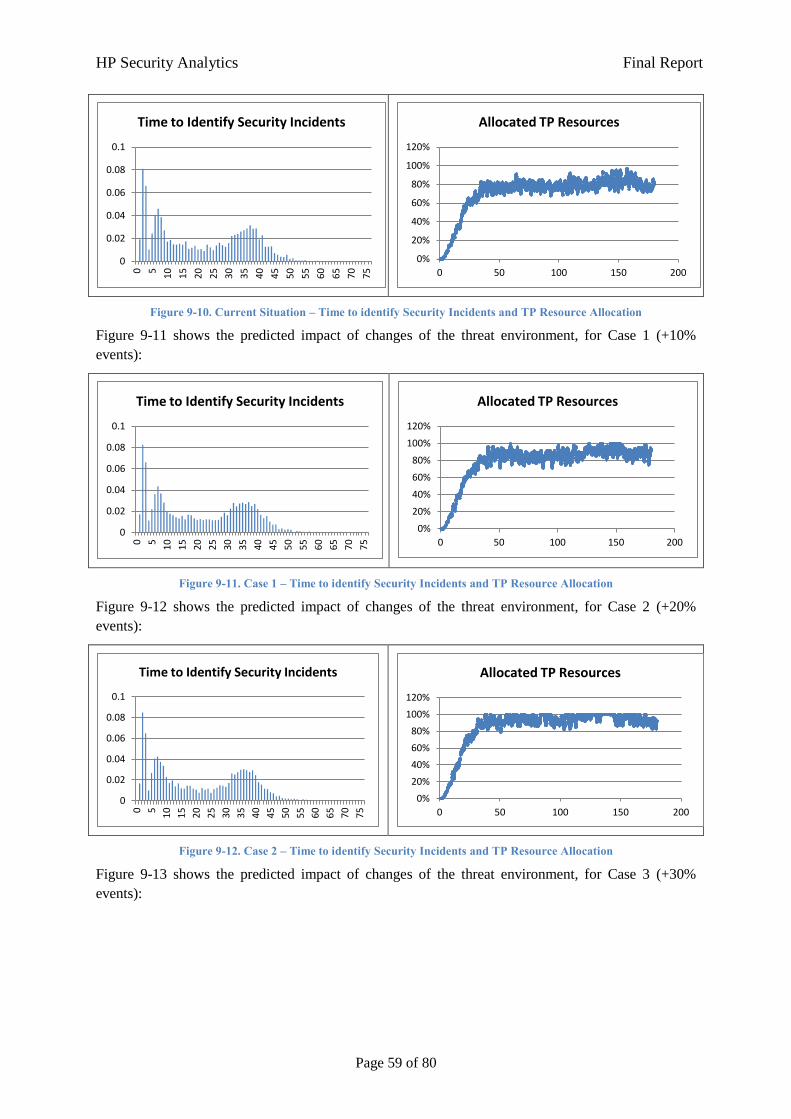
HP Security Analytics Final Report
Page 59 of 80
Figure 9-10. Current Situation – Time to identify Security Incidents and TP Resource Allocation
Figure 9-11 shows the predicted impact of changes of the threat environment, for Case 1 (+10%
events):
Figure 9-11. Case 1 – Time to identify Security Incidents and TP Resource Allocation
Figure 9-12 shows the predicted impact of changes of the threat environment, for Case 2 (+20%
events):
Figure 9-12. Case 2 – Time to identify Security Incidents and TP Resource Allocation
Figure 9-13 shows the predicted impact of changes of the threat environment, for Case 3 (+30%
events):
0
0.02
0.04
0.06
0.08
0.1 0
5
10
15
20
25
30
35
40
45
50
55
60
65
70
75
Time to Identify Security Incidents
0%
20%
40%
60%
80%
100%
120%
0 50 100 150 200
Allocated TP Resources
0
0.02
0.04
0.06
0.08
0.1
0
5
10
15
20
25
30
35
40
45
50
55
60
65
70
75
Time to Identify Security Incidents
0%
20%
40%
60%
80%
100%
120%
0 50 100 150 200
Allocated TP Resources
0
0.02
0.04
0.06
0.08
0.1
0
5
10
15
20
25
30
35
40
45
50
55
60
65
70
75
Time to Identify Security Incidents
0%
20%
40%
60%
80%
100%
120%
0 50 100 150 200
Allocated TP Resources
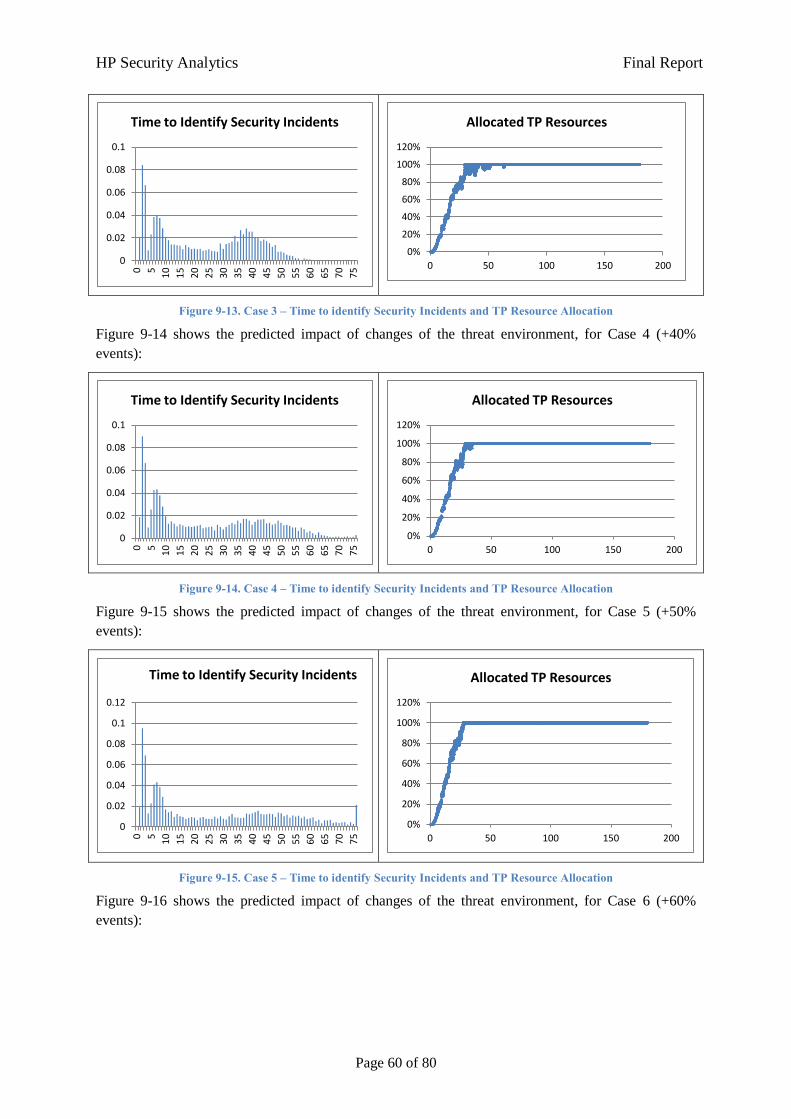
HP Security Analytics Final Report
Page 60 of 80
Figure 9-13. Case 3 – Time to identify Security Incidents and TP Resource Allocation
Figure 9-14 shows the predicted impact of changes of the threat environment, for Case 4 (+40%
events):
Figure 9-14. Case 4 – Time to identify Security Incidents and TP Resource Allocation
Figure 9-15 shows the predicted impact of changes of the threat environment, for Case 5 (+50%
events):
Figure 9-15. Case 5 – Time to identify Security Incidents and TP Resource Allocation
Figure 9-16 shows the predicted impact of changes of the threat environment, for Case 6 (+60%
events):
0
0.02
0.04
0.06
0.08
0.1 0
5
10
15
20
25
30
35
40
45
50
55
60
65
70
75
Time to Identify Security Incidents
0%
20%
40%
60%
80%
100%
120%
0 50 100 150 200
Allocated TP Resources
0
0.02
0.04
0.06
0.08
0.1
0
5
10
15
20
25
30
35
40
45
50
55
60
65
70
75
Time to Identify Security Incidents
0%
20%
40%
60%
80%
100%
120%
0 50 100 150 200
Allocated TP Resources
0
0.02
0.04
0.06
0.08
0.1
0.12
0
5
10
15
20
25
30
35
40
45
50
55
60
65
70
75
Time to Identify Security Incidents
0%
20%
40%
60%
80%
100%
120%
0 50 100 150 200
Allocated TP Resources

HP Security Analytics Final Report
Page 61 of 80
Figure 9-16. Case 6 – Time to identify Security Incidents and TP Resource Allocation
Figures 9-11, 9-16 show the increasing negative impact that the worsening of the threat landscape has
of the overall process, in particular with regards to the “time to identify security incidents”. These
simulations highlight that the process copes well in case of an increase of events/alerts up to 20%: in
the simulated timeframe (6 months) the time to identify incidents is not affected and the allocated TP
resources. These resources can deal with the increased workload without major delays, despite the
fact that they increasingly saturate. Some initial delays are already noticeable with an increase of 30%
of the events/alerts.
To summarise, Figure 9-17 provides a comparative analysis of the time to identify security incidents,
across all Cases explored in this what-if analysis:
Figure 9-17. Comparative Analysis – Time to identify Security Incidents for various Cases
An increase of 30% of alerts/events or more causes the saturation of the allocated TP resources: TPs
will increasingly have problems to cope with the workload. This is reflected in the figure, comparing
the various distributions of time to identify security incidents. More and more time is required to deal
with events/incidents. Case 5 and 6 explicitly show the impact of the accumulation of delays, due to
0
0.02
0.04
0.06
0.08
0.1
0.12 0
5
10
15
20
25
30
35
40
45
50
55
60
65
70
75
Time to Identify Security Incidents
0%
20%
40%
60%
80%
100%
120%
0 50 100 150 200
Allocated TP Resources
0
0.02
0.04
0.06
0.08
0.1
0.12
0
3
6
9
12
15
18
21
24
27
30
33
36
39
42
45
48
51
54
57
60
63
66
69
72
75
Current
"+10%"
"+20%"
"+30%"
"+40%"
"+50%"
"+60%"
Time to Identify Security Incidents
Days
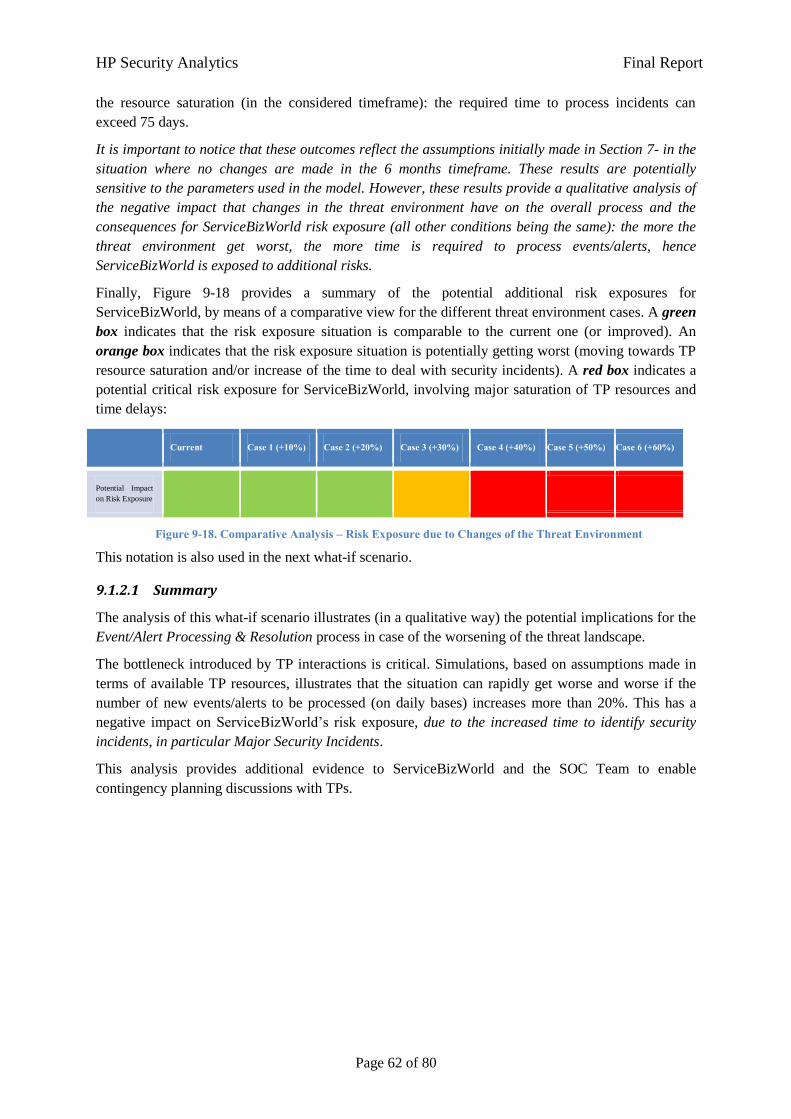
HP Security Analytics Final Report
Page 62 of 80
the resource saturation (in the considered timeframe): the required time to process incidents can
exceed 75 days.
It is important to notice that these outcomes reflect the assumptions initially made in Section 7- in the
situation where no changes are made in the 6 months timeframe. These results are potentially
sensitive to the parameters used in the model. However, these results provide a qualitative analysis of
the negative impact that changes in the threat environment have on the overall process and the
consequences for ServiceBizWorld risk exposure (all other conditions being the same): the more the
threat environment get worst, the more time is required to process events/alerts, hence
ServiceBizWorld is exposed to additional risks.
Finally, Figure 9-18 provides a summary of the potential additional risk exposures for
ServiceBizWorld, by means of a comparative view for the different threat environment cases. A green
box indicates that the risk exposure situation is comparable to the current one (or improved). An
orange box indicates that the risk exposure situation is potentially getting worst (moving towards TP
resource saturation and/or increase of the time to deal with security incidents). A red box indicates a
potential critical risk exposure for ServiceBizWorld, involving major saturation of TP resources and
time delays:
Current Case 1 (+10%) Case 2 (+20%) Case 3 (+30%) Case 4 (+40%) Case 5 (+50%) Case 6 (+60%)
Potential Impact
on Risk Exposure
Figure 9-18. Comparative Analysis – Risk Exposure due to Changes of the Threat Environment
This notation is also used in the next what-if scenario.
9.1.2.1 Summary
The analysis of this what-if scenario illustrates (in a qualitative way) the potential implications for the
Event/Alert Processing & Resolution process in case of the worsening of the threat landscape.
The bottleneck introduced by TP interactions is critical. Simulations, based on assumptions made in
terms of available TP resources, illustrates that the situation can rapidly get worse and worse if the
number of new events/alerts to be processed (on daily bases) increases more than 20%. This has a
negative impact on ServiceBizWorld’s risk exposure, due to the increased time to identify security
incidents, in particular Major Security Incidents.
This analysis provides additional evidence to ServiceBizWorld and the SOC Team to enable
contingency planning discussions with TPs.
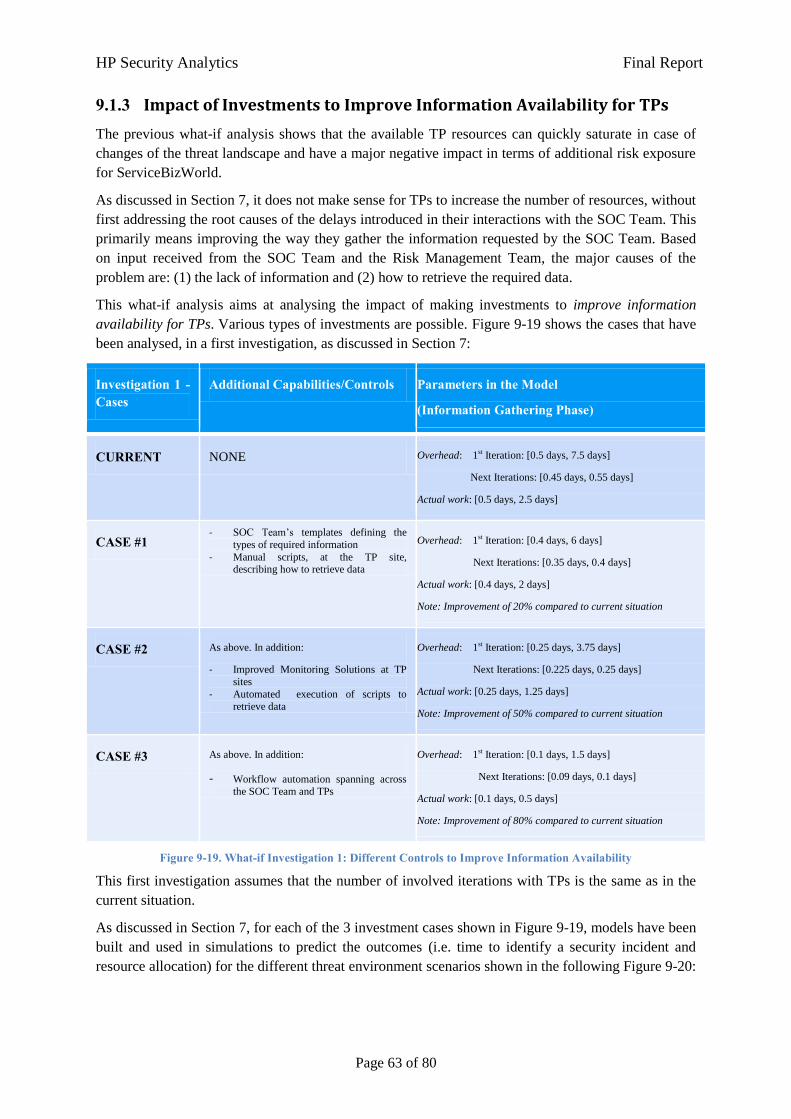
HP Security Analytics Final Report
Page 63 of 80
9.1.3 Impact of Investments to Improve Information Availability for TPs
The previous what-if analysis shows that the available TP resources can quickly saturate in case of
changes of the threat landscape and have a major negative impact in terms of additional risk exposure
for ServiceBizWorld.
As discussed in Section 7, it does not make sense for TPs to increase the number of resources, without
first addressing the root causes of the delays introduced in their interactions with the SOC Team. This
primarily means improving the way they gather the information requested by the SOC Team. Based
on input received from the SOC Team and the Risk Management Team, the major causes of the
problem are: (1) the lack of information and (2) how to retrieve the required data.
This what-if analysis aims at analysing the impact of making investments to improve information
availability for TPs. Various types of investments are possible. Figure 9-19 shows the cases that have
been analysed, in a first investigation, as discussed in Section 7:
Investigation 1 - Cases
Additional Capabilities/Controls Parameters in the Model
(Information Gathering Phase)
CURRENT NONE Overhead: 1st Iteration: [0.5 days, 7.5 days]
Next Iterations: [0.45 days, 0.55 days]
Actual work: [0.5 days, 2.5 days]
CASE #1 - SOC Team’s templates defining the
types of required information
- Manual scripts, at the TP site, describing how to retrieve data
Overhead: 1st Iteration: [0.4 days, 6 days]
Next Iterations: [0.35 days, 0.4 days]
Actual work: [0.4 days, 2 days]
Note: Improvement of 20% compared to current situation
CASE #2 As above. In addition:
- Improved Monitoring Solutions at TP
sites
- Automated execution of scripts to
retrieve data
Overhead: 1st Iteration: [0.25 days, 3.75 days]
Next Iterations: [0.225 days, 0.25 days]
Actual work: [0.25 days, 1.25 days]
Note: Improvement of 50% compared to current situation
CASE #3 As above. In addition:
- Workflow automation spanning across
the SOC Team and TPs
Overhead: 1st Iteration: [0.1 days, 1.5 days]
Next Iterations: [0.09 days, 0.1 days]
Actual work: [0.1 days, 0.5 days]
Note: Improvement of 80% compared to current situation
Figure 9-19. What-if Investigation 1: Different Controls to Improve Information Availability
This first investigation assumes that the number of involved iterations with TPs is the same as in the
current situation.
As discussed in Section 7, for each of the 3 investment cases shown in Figure 9-19, models have been
built and used in simulations to predict the outcomes (i.e. time to identify a security incident and
resource allocation) for the different threat environment scenarios shown in the following Figure 9-20:
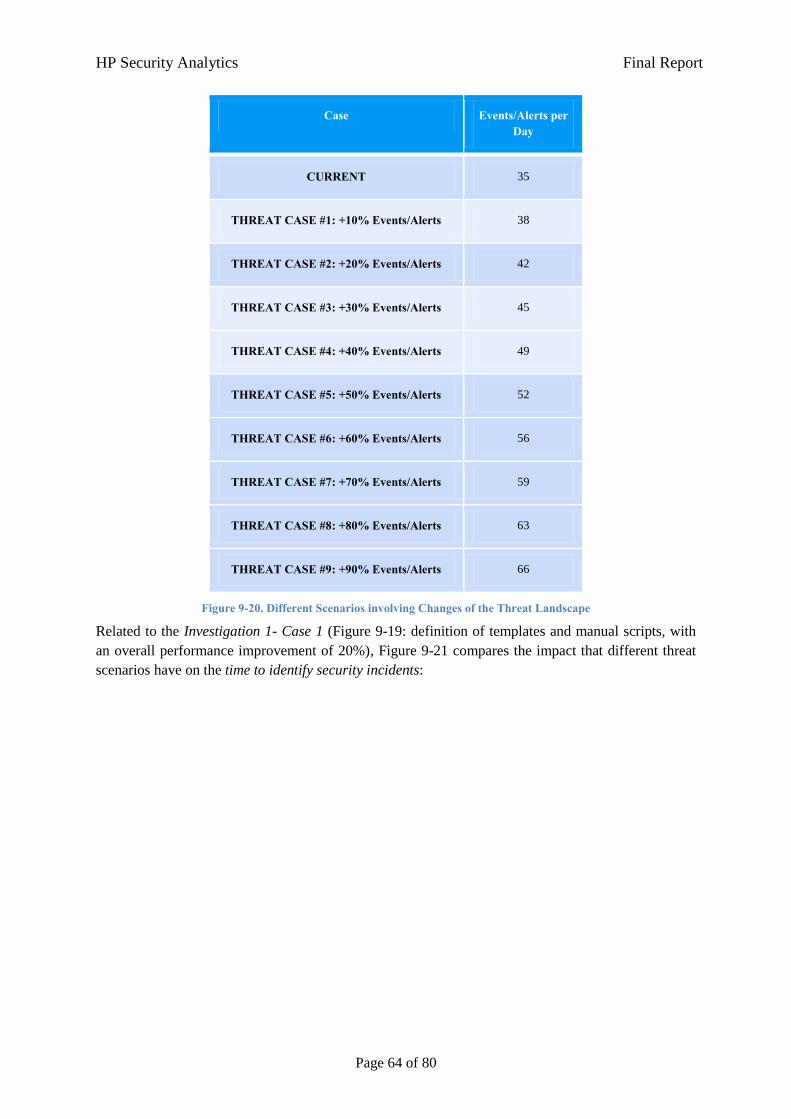
HP Security Analytics Final Report
Page 64 of 80
Case Events/Alerts per Day
CURRENT 35
THREAT CASE #1: +10% Events/Alerts 38
THREAT CASE #2: +20% Events/Alerts 42
THREAT CASE #3: +30% Events/Alerts 45
THREAT CASE #4: +40% Events/Alerts 49
THREAT CASE #5: +50% Events/Alerts 52
THREAT CASE #6: +60% Events/Alerts 56
THREAT CASE #7: +70% Events/Alerts 59
THREAT CASE #8: +80% Events/Alerts 63
THREAT CASE #9: +90% Events/Alerts 66
Figure 9-20. Different Scenarios involving Changes of the Threat Landscape
Related to the Investigation 1- Case 1 (Figure 9-19: definition of templates and manual scripts, with
an overall performance improvement of 20%), Figure 9-21 compares the impact that different threat
scenarios have on the time to identify security incidents:
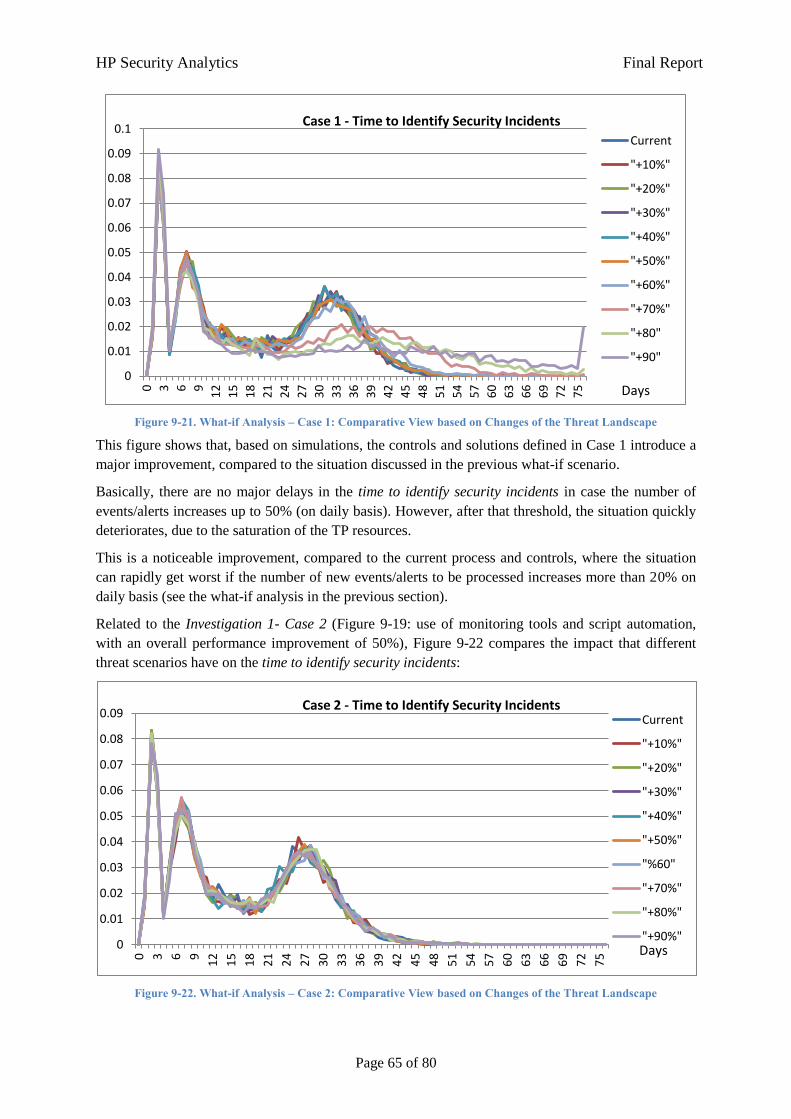
HP Security Analytics Final Report
Page 65 of 80
Figure 9-21. What-if Analysis – Case 1: Comparative View based on Changes of the Threat Landscape
This figure shows that, based on simulations, the controls and solutions defined in Case 1 introduce a
major improvement, compared to the situation discussed in the previous what-if scenario.
Basically, there are no major delays in the time to identify security incidents in case the number of
events/alerts increases up to 50% (on daily basis). However, after that threshold, the situation quickly
deteriorates, due to the saturation of the TP resources.
This is a noticeable improvement, compared to the current process and controls, where the situation
can rapidly get worst if the number of new events/alerts to be processed increases more than 20% on
daily basis (see the what-if analysis in the previous section).
Related to the Investigation 1- Case 2 (Figure 9-19: use of monitoring tools and script automation,
with an overall performance improvement of 50%), Figure 9-22 compares the impact that different
threat scenarios have on the time to identify security incidents:
Figure 9-22. What-if Analysis – Case 2: Comparative View based on Changes of the Threat Landscape
0
0.01
0.02
0.03
0.04
0.05
0.06
0.07
0.08
0.09
0.1 0
3
6
9
12
15
18
21
24
27
30
33
36
39
42
45
48
51
54
57
60
63
66
69
72
75
Current
"+10%"
"+20%"
"+30%"
"+40%"
"+50%"
"+60%"
"+70%"
"+80"
"+90"
Case 1 - Time to Identify Security Incidents
Days
0
0.01
0.02
0.03
0.04
0.05
0.06
0.07
0.08
0.09
0
3
6
9
12
15
18
21
24
27
30
33
36
39
42
45
48
51
54
57
60
63
66
69
72
75
Current
"+10%"
"+20%"
"+30%"
"+40%"
"+50%"
"%60"
"+70%"
"+80%"
"+90%"
Case 2 - Time to Identify Security Incidents
Days
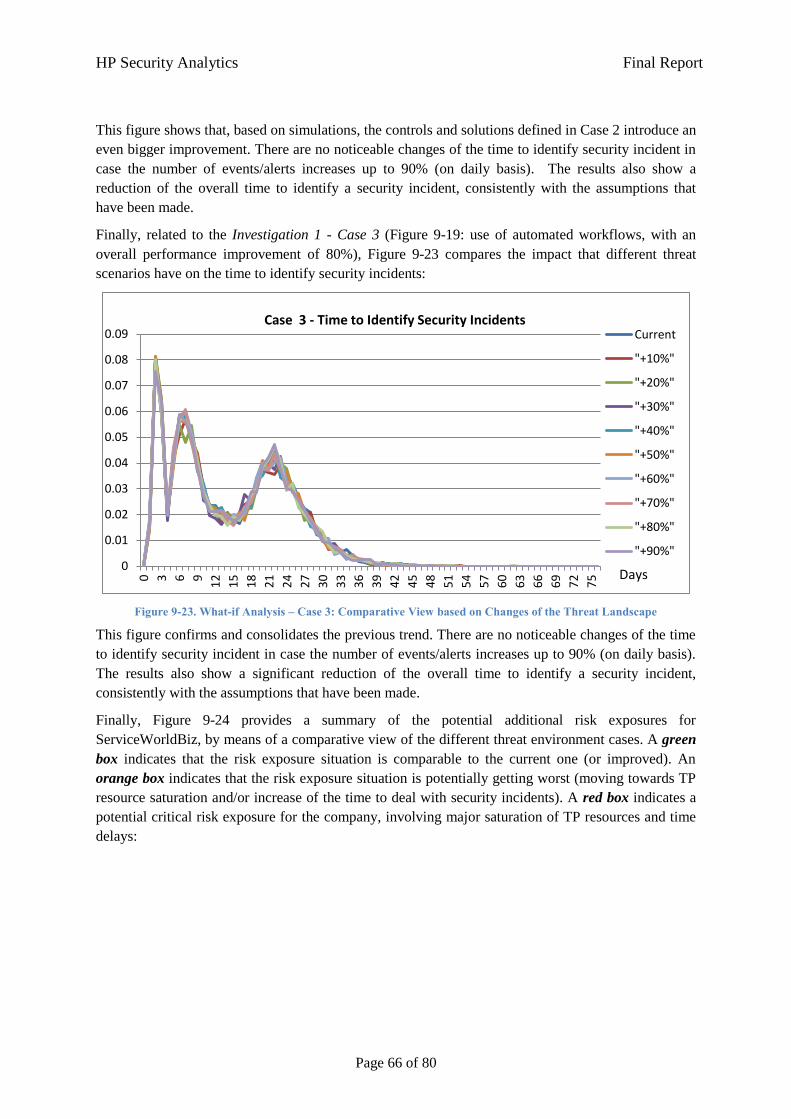
HP Security Analytics Final Report
Page 66 of 80
This figure shows that, based on simulations, the controls and solutions defined in Case 2 introduce an
even bigger improvement. There are no noticeable changes of the time to identify security incident in
case the number of events/alerts increases up to 90% (on daily basis). The results also show a
reduction of the overall time to identify a security incident, consistently with the assumptions that
have been made.
Finally, related to the Investigation 1 - Case 3 (Figure 9-19: use of automated workflows, with an
overall performance improvement of 80%), Figure 9-23 compares the impact that different threat
scenarios have on the time to identify security incidents:
Figure 9-23. What-if Analysis – Case 3: Comparative View based on Changes of the Threat Landscape
This figure confirms and consolidates the previous trend. There are no noticeable changes of the time
to identify security incident in case the number of events/alerts increases up to 90% (on daily basis).
The results also show a significant reduction of the overall time to identify a security incident,
consistently with the assumptions that have been made.
Finally, Figure 9-24 provides a summary of the potential additional risk exposures for
ServiceWorldBiz, by means of a comparative view of the different threat environment cases. A green
box indicates that the risk exposure situation is comparable to the current one (or improved). An
orange box indicates that the risk exposure situation is potentially getting worst (moving towards TP
resource saturation and/or increase of the time to deal with security incidents). A red box indicates a
potential critical risk exposure for the company, involving major saturation of TP resources and time
delays:
0
0.01
0.02
0.03
0.04
0.05
0.06
0.07
0.08
0.09
0
3
6
9
12
15
18
21
24
27
30
33
36
39
42
45
48
51
54
57
60
63
66
69
72
75
Current
"+10%"
"+20%"
"+30%"
"+40%"
"+50%"
"+60%"
"+70%"
"+80%"
"+90%"
Case 3 - Time to Identify Security Incidents
Days
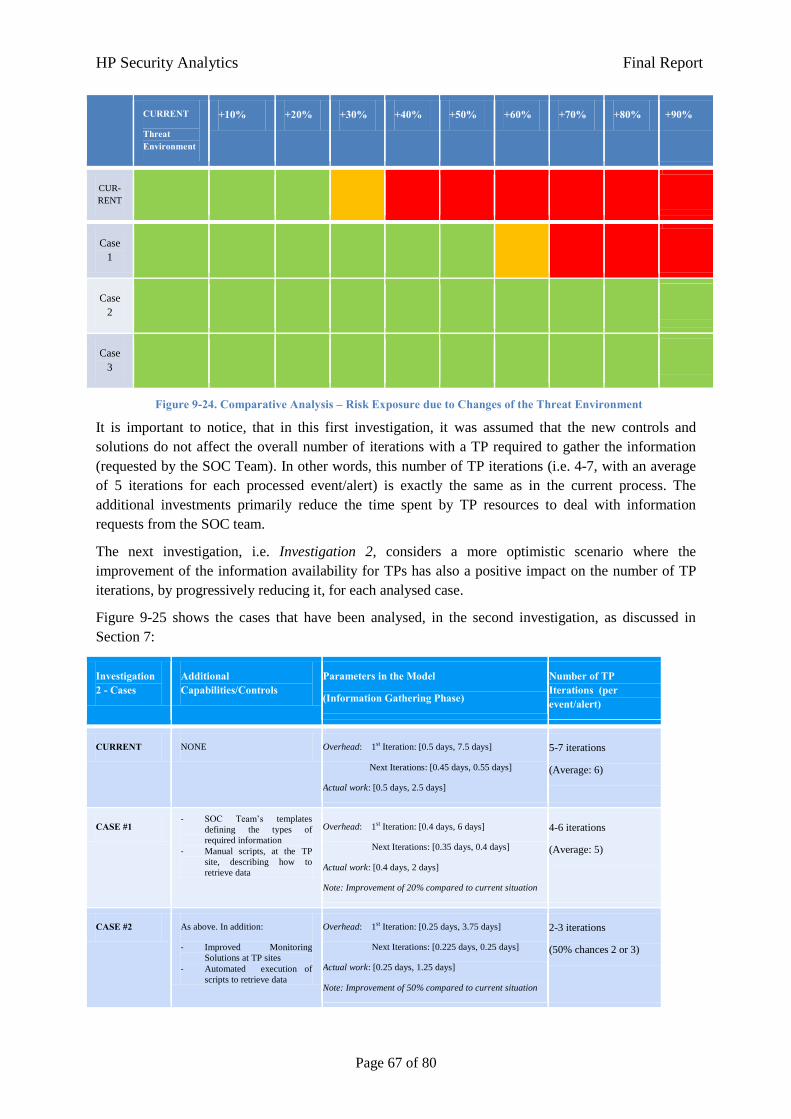
HP Security Analytics Final Report
Page 67 of 80
CURRENT
Threat Environment
+10% +20% +30% +40% +50% +60% +70% +80% +90%
CUR-
RENT
Case
1
Case
2
Case
3
Figure 9-24. Comparative Analysis – Risk Exposure due to Changes of the Threat Environment
It is important to notice, that in this first investigation, it was assumed that the new controls and
solutions do not affect the overall number of iterations with a TP required to gather the information
(requested by the SOC Team). In other words, this number of TP iterations (i.e. 4-7, with an average
of 5 iterations for each processed event/alert) is exactly the same as in the current process. The
additional investments primarily reduce the time spent by TP resources to deal with information
requests from the SOC team.
The next investigation, i.e. Investigation 2, considers a more optimistic scenario where the
improvement of the information availability for TPs has also a positive impact on the number of TP
iterations, by progressively reducing it, for each analysed case.
Figure 9-25 shows the cases that have been analysed, in the second investigation, as discussed in
Section 7:
Investigation 2 - Cases
Additional Capabilities/Controls
Parameters in the Model
(Information Gathering Phase)
Number of TP Iterations (per event/alert)
CURRENT NONE Overhead: 1st Iteration: [0.5 days, 7.5 days]
Next Iterations: [0.45 days, 0.55 days]
Actual work: [0.5 days, 2.5 days]
5-7 iterations
(Average: 6)
CASE #1 - SOC Team’s templates
defining the types of
required information
- Manual scripts, at the TP
site, describing how to
retrieve data
Overhead: 1st Iteration: [0.4 days, 6 days]
Next Iterations: [0.35 days, 0.4 days]
Actual work: [0.4 days, 2 days]
Note: Improvement of 20% compared to current situation
4-6 iterations
(Average: 5)
CASE #2 As above. In addition:
- Improved Monitoring
Solutions at TP sites
- Automated execution of
scripts to retrieve data
Overhead: 1st Iteration: [0.25 days, 3.75 days]
Next Iterations: [0.225 days, 0.25 days]
Actual work: [0.25 days, 1.25 days]
Note: Improvement of 50% compared to current situation
2-3 iterations
(50% chances 2 or 3)
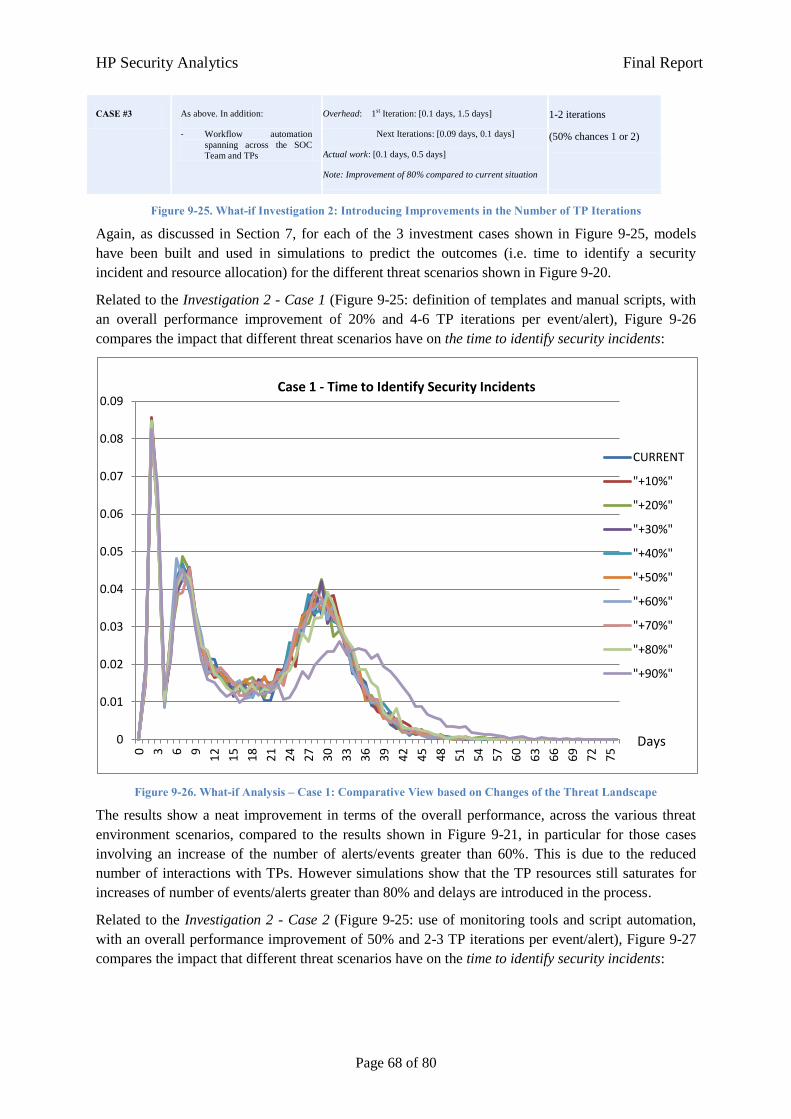
HP Security Analytics Final Report
Page 68 of 80
CASE #3 As above. In addition:
- Workflow automation
spanning across the SOC
Team and TPs
Overhead: 1st Iteration: [0.1 days, 1.5 days]
Next Iterations: [0.09 days, 0.1 days]
Actual work: [0.1 days, 0.5 days]
Note: Improvement of 80% compared to current situation
1-2 iterations
(50% chances 1 or 2)
Figure 9-25. What-if Investigation 2: Introducing Improvements in the Number of TP Iterations
Again, as discussed in Section 7, for each of the 3 investment cases shown in Figure 9-25, models
have been built and used in simulations to predict the outcomes (i.e. time to identify a security
incident and resource allocation) for the different threat scenarios shown in Figure 9-20.
Related to the Investigation 2 - Case 1 (Figure 9-25: definition of templates and manual scripts, with
an overall performance improvement of 20% and 4-6 TP iterations per event/alert), Figure 9-26
compares the impact that different threat scenarios have on the time to identify security incidents:
Figure 9-26. What-if Analysis – Case 1: Comparative View based on Changes of the Threat Landscape
The results show a neat improvement in terms of the overall performance, across the various threat
environment scenarios, compared to the results shown in Figure 9-21, in particular for those cases
involving an increase of the number of alerts/events greater than 60%. This is due to the reduced
number of interactions with TPs. However simulations show that the TP resources still saturates for
increases of number of events/alerts greater than 80% and delays are introduced in the process.
Related to the Investigation 2 - Case 2 (Figure 9-25: use of monitoring tools and script automation,
with an overall performance improvement of 50% and 2-3 TP iterations per event/alert), Figure 9-27
compares the impact that different threat scenarios have on the time to identify security incidents:
0
0.01
0.02
0.03
0.04
0.05
0.06
0.07
0.08
0.09
0
3
6
9
12
15
18
21
24
27
30
33
36
39
42
45
48
51
54
57
60
63
66
69
72
75
CURRENT
"+10%"
"+20%"
"+30%"
"+40%"
"+50%"
"+60%"
"+70%"
"+80%"
"+90%"
Case 1 - Time to Identify Security Incidents
Days
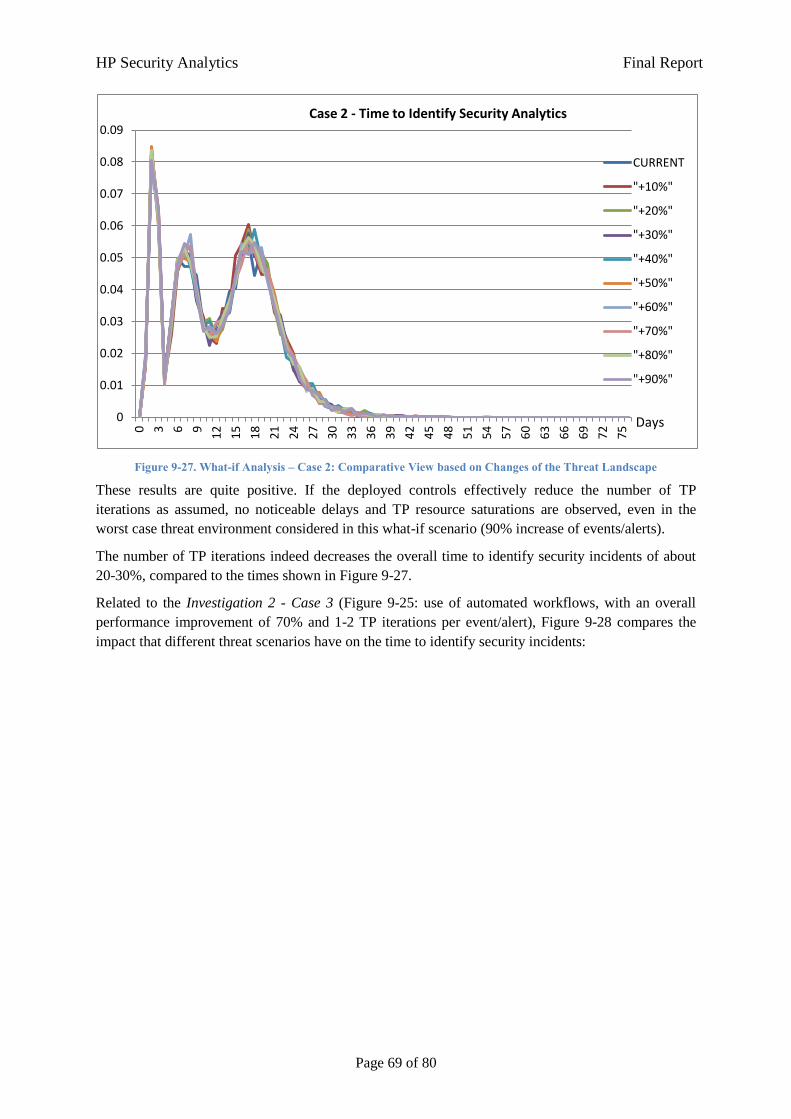
HP Security Analytics Final Report
Page 69 of 80
Figure 9-27. What-if Analysis – Case 2: Comparative View based on Changes of the Threat Landscape
These results are quite positive. If the deployed controls effectively reduce the number of TP
iterations as assumed, no noticeable delays and TP resource saturations are observed, even in the
worst case threat environment considered in this what-if scenario (90% increase of events/alerts).
The number of TP iterations indeed decreases the overall time to identify security incidents of about
20-30%, compared to the times shown in Figure 9-27.
Related to the Investigation 2 - Case 3 (Figure 9-25: use of automated workflows, with an overall
performance improvement of 70% and 1-2 TP iterations per event/alert), Figure 9-28 compares the
impact that different threat scenarios have on the time to identify security incidents:
0
0.01
0.02
0.03
0.04
0.05
0.06
0.07
0.08
0.09 0
3
6
9
12
15
18
21
24
27
30
33
36
39
42
45
48
51
54
57
60
63
66
69
72
75
CURRENT
"+10%"
"+20%"
"+30%"
"+40%"
"+50%"
"+60%"
"+70%"
"+80%"
"+90%"
Case 2 - Time to Identify Security Analytics
Days
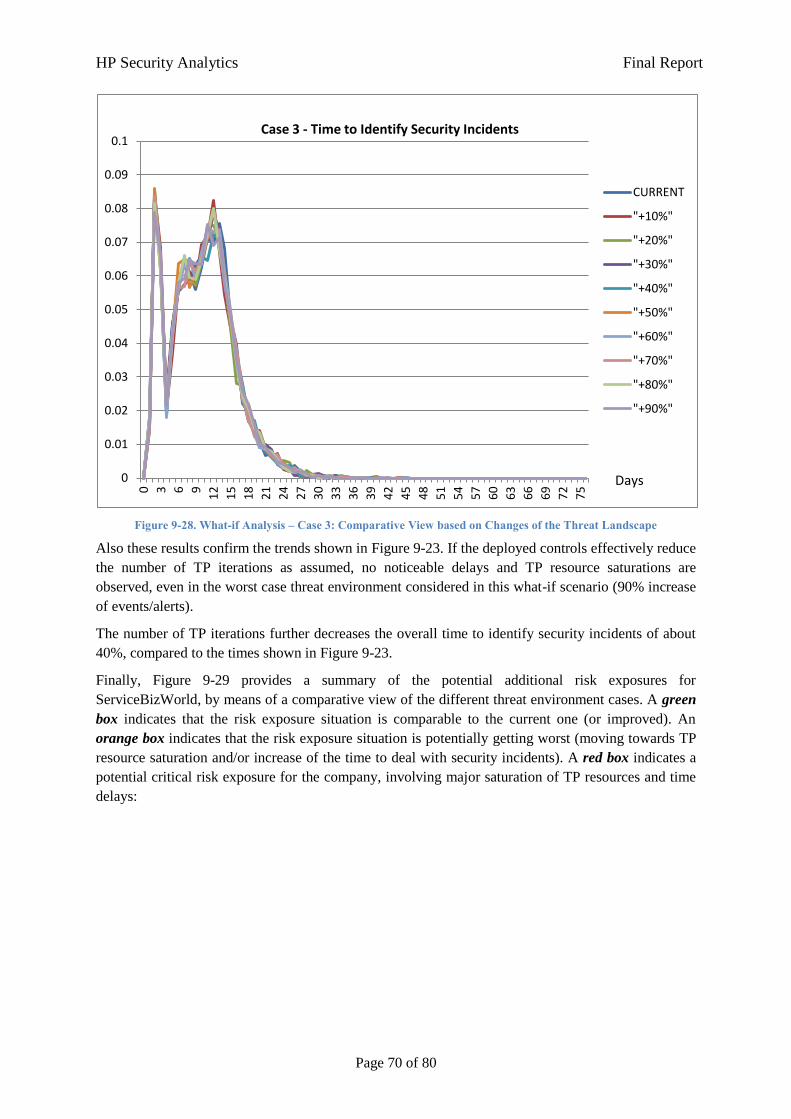
HP Security Analytics Final Report
Page 70 of 80
Figure 9-28. What-if Analysis – Case 3: Comparative View based on Changes of the Threat Landscape
Also these results confirm the trends shown in Figure 9-23. If the deployed controls effectively reduce
the number of TP iterations as assumed, no noticeable delays and TP resource saturations are
observed, even in the worst case threat environment considered in this what-if scenario (90% increase
of events/alerts).
The number of TP iterations further decreases the overall time to identify security incidents of about
40%, compared to the times shown in Figure 9-23.
Finally, Figure 9-29 provides a summary of the potential additional risk exposures for
ServiceBizWorld, by means of a comparative view of the different threat environment cases. A green
box indicates that the risk exposure situation is comparable to the current one (or improved). An
orange box indicates that the risk exposure situation is potentially getting worst (moving towards TP
resource saturation and/or increase of the time to deal with security incidents). A red box indicates a
potential critical risk exposure for the company, involving major saturation of TP resources and time
delays:
0
0.01
0.02
0.03
0.04
0.05
0.06
0.07
0.08
0.09
0.1 0
3
6
9
12
15
18
21
24
27
30
33
36
39
42
45
48
51
54
57
60
63
66
69
72
75
CURRENT
"+10%"
"+20%"
"+30%"
"+40%"
"+50%"
"+60%"
"+70%"
"+80%"
"+90%"
Case 3 - Time to Identify Security Incidents
Days
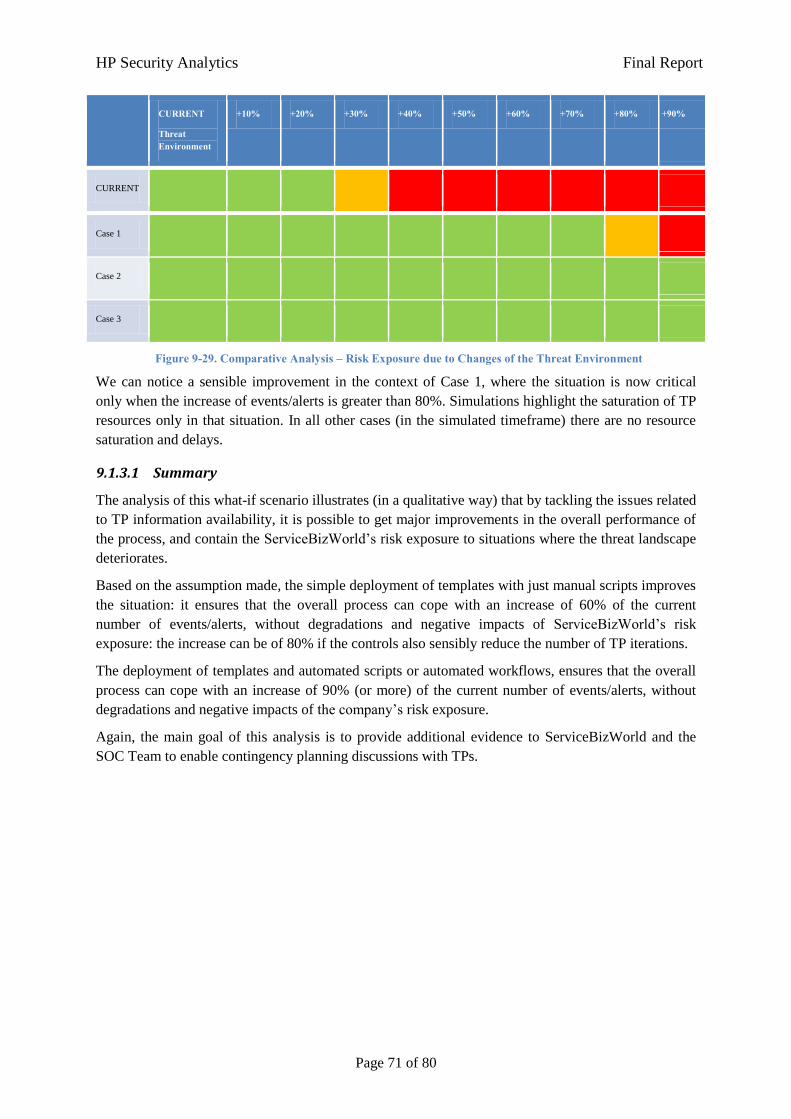
HP Security Analytics Final Report
Page 71 of 80
CURRENT
Threat Environment
+10% +20% +30% +40% +50% +60% +70% +80% +90%
CURRENT
Case 1
Case 2
Case 3
Figure 9-29. Comparative Analysis – Risk Exposure due to Changes of the Threat Environment
We can notice a sensible improvement in the context of Case 1, where the situation is now critical
only when the increase of events/alerts is greater than 80%. Simulations highlight the saturation of TP
resources only in that situation. In all other cases (in the simulated timeframe) there are no resource
saturation and delays.
9.1.3.1 Summary
The analysis of this what-if scenario illustrates (in a qualitative way) that by tackling the issues related
to TP information availability, it is possible to get major improvements in the overall performance of
the process, and contain the ServiceBizWorld’s risk exposure to situations where the threat landscape
deteriorates.
Based on the assumption made, the simple deployment of templates with just manual scripts improves
the situation: it ensures that the overall process can cope with an increase of 60% of the current
number of events/alerts, without degradations and negative impacts of ServiceBizWorld’s risk
exposure: the increase can be of 80% if the controls also sensibly reduce the number of TP iterations.
The deployment of templates and automated scripts or automated workflows, ensures that the overall
process can cope with an increase of 90% (or more) of the current number of events/alerts, without
degradations and negative impacts of the company’s risk exposure.
Again, the main goal of this analysis is to provide additional evidence to ServiceBizWorld and the
SOC Team to enable contingency planning discussions with TPs.
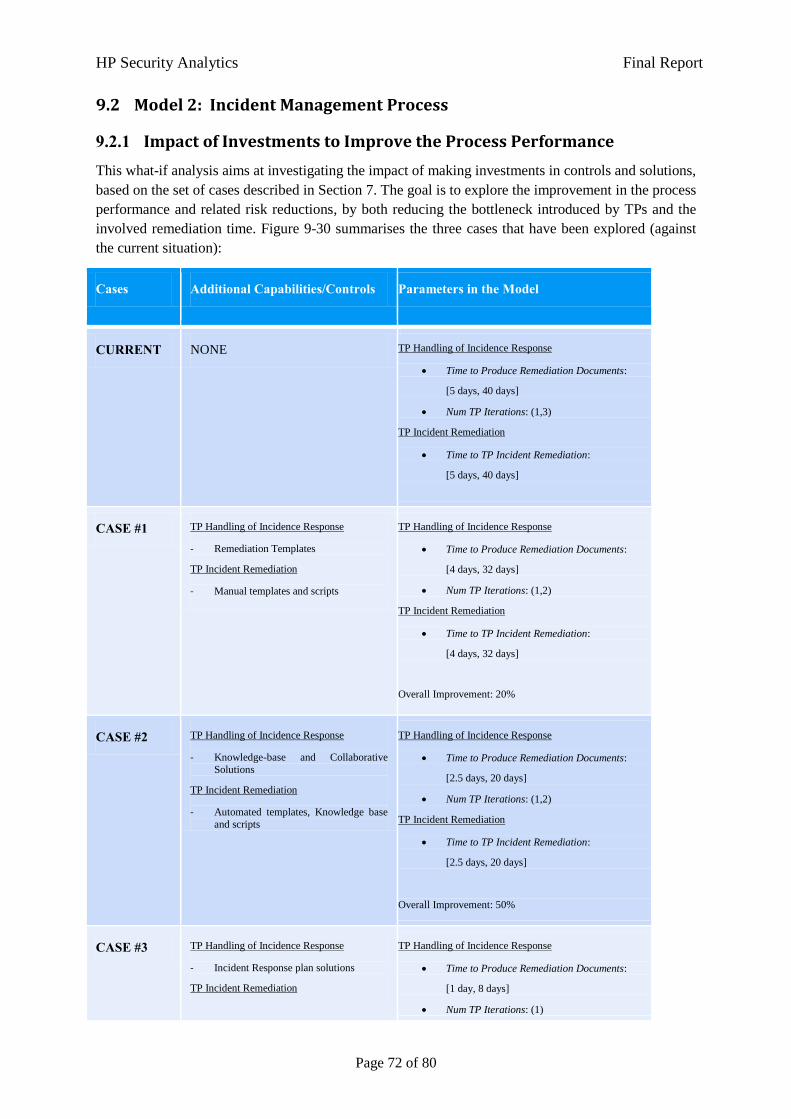
HP Security Analytics Final Report
Page 72 of 80
9.2 Model 2: Incident Management Process
9.2.1 Impact of Investments to Improve the Process Performance
This what-if analysis aims at investigating the impact of making investments in controls and solutions,
based on the set of cases described in Section 7. The goal is to explore the improvement in the process
performance and related risk reductions, by both reducing the bottleneck introduced by TPs and the
involved remediation time. Figure 9-30 summarises the three cases that have been explored (against
the current situation):
Cases Additional Capabilities/Controls Parameters in the Model
CURRENT NONE TP Handling of Incidence Response
Time to Produce Remediation Documents:
[5 days, 40 days]
Num TP Iterations: (1,3)
TP Incident Remediation
Time to TP Incident Remediation:
[5 days, 40 days]
CASE #1 TP Handling of Incidence Response
- Remediation Templates
TP Incident Remediation
- Manual templates and scripts
TP Handling of Incidence Response
Time to Produce Remediation Documents:
[4 days, 32 days]
Num TP Iterations: (1,2)
TP Incident Remediation
Time to TP Incident Remediation:
[4 days, 32 days]
Overall Improvement: 20%
CASE #2 TP Handling of Incidence Response
- Knowledge-base and Collaborative
Solutions
TP Incident Remediation
- Automated templates, Knowledge base
and scripts
TP Handling of Incidence Response
Time to Produce Remediation Documents:
[2.5 days, 20 days]
Num TP Iterations: (1,2)
TP Incident Remediation
Time to TP Incident Remediation:
[2.5 days, 20 days]
Overall Improvement: 50%
CASE #3 TP Handling of Incidence Response
- Incident Response plan solutions
TP Incident Remediation
TP Handling of Incidence Response
Time to Produce Remediation Documents:
[1 day, 8 days]
Num TP Iterations: (1)
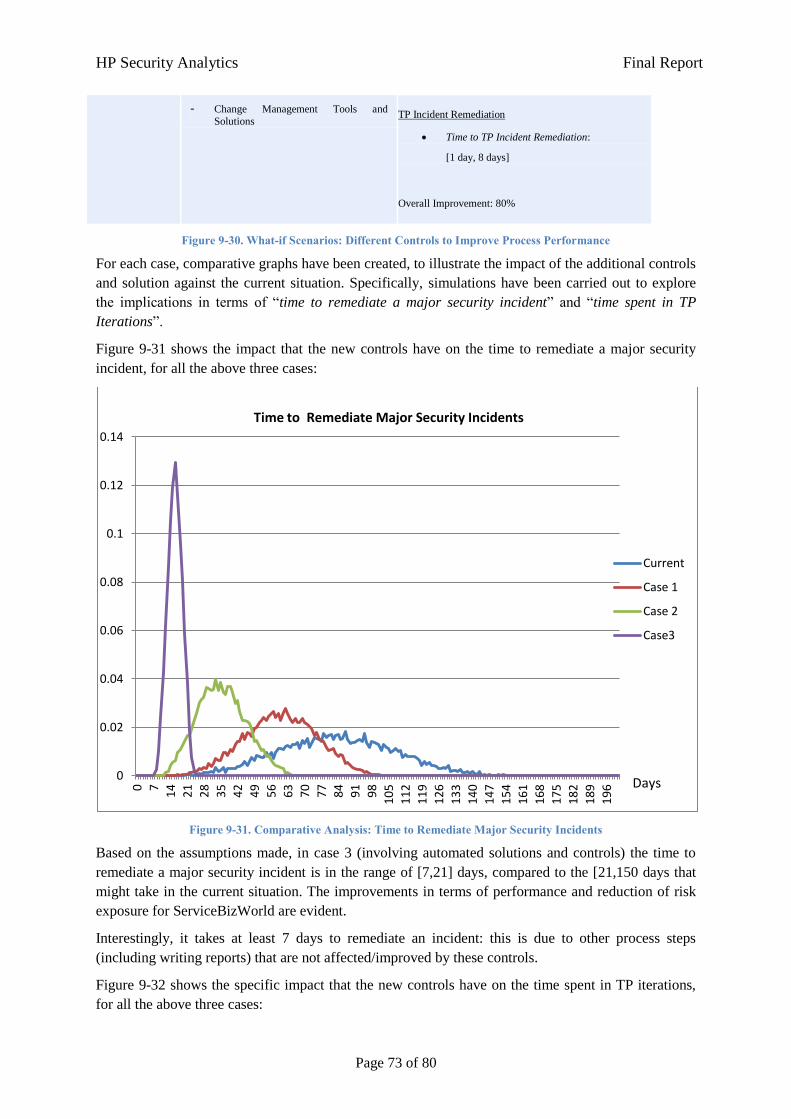
HP Security Analytics Final Report
Page 73 of 80
- Change Management Tools and
Solutions TP Incident Remediation
Time to TP Incident Remediation:
[1 day, 8 days]
Overall Improvement: 80%
Figure 9-30. What-if Scenarios: Different Controls to Improve Process Performance
For each case, comparative graphs have been created, to illustrate the impact of the additional controls
and solution against the current situation. Specifically, simulations have been carried out to explore
the implications in terms of “time to remediate a major security incident” and “time spent in TP
Iterations”.
Figure 9-31 shows the impact that the new controls have on the time to remediate a major security
incident, for all the above three cases:
Figure 9-31. Comparative Analysis: Time to Remediate Major Security Incidents
Based on the assumptions made, in case 3 (involving automated solutions and controls) the time to
remediate a major security incident is in the range of [7,21] days, compared to the [21,150 days that
might take in the current situation. The improvements in terms of performance and reduction of risk
exposure for ServiceBizWorld are evident.
Interestingly, it takes at least 7 days to remediate an incident: this is due to other process steps
(including writing reports) that are not affected/improved by these controls.
Figure 9-32 shows the specific impact that the new controls have on the time spent in TP iterations,
for all the above three cases:
0
0.02
0.04
0.06
0.08
0.1
0.12
0.14
0
7
14
21
28
35
42
49
56
63
70
77
84
91
98
10
5
11
2
11
9
12
6
13
3
14
0
14
7
15
4
16
1
16
8
17
5
18
2
18
9
19
6
Current
Case 1
Case 2
Case3
Time to Remediate Major Security Incidents
Days
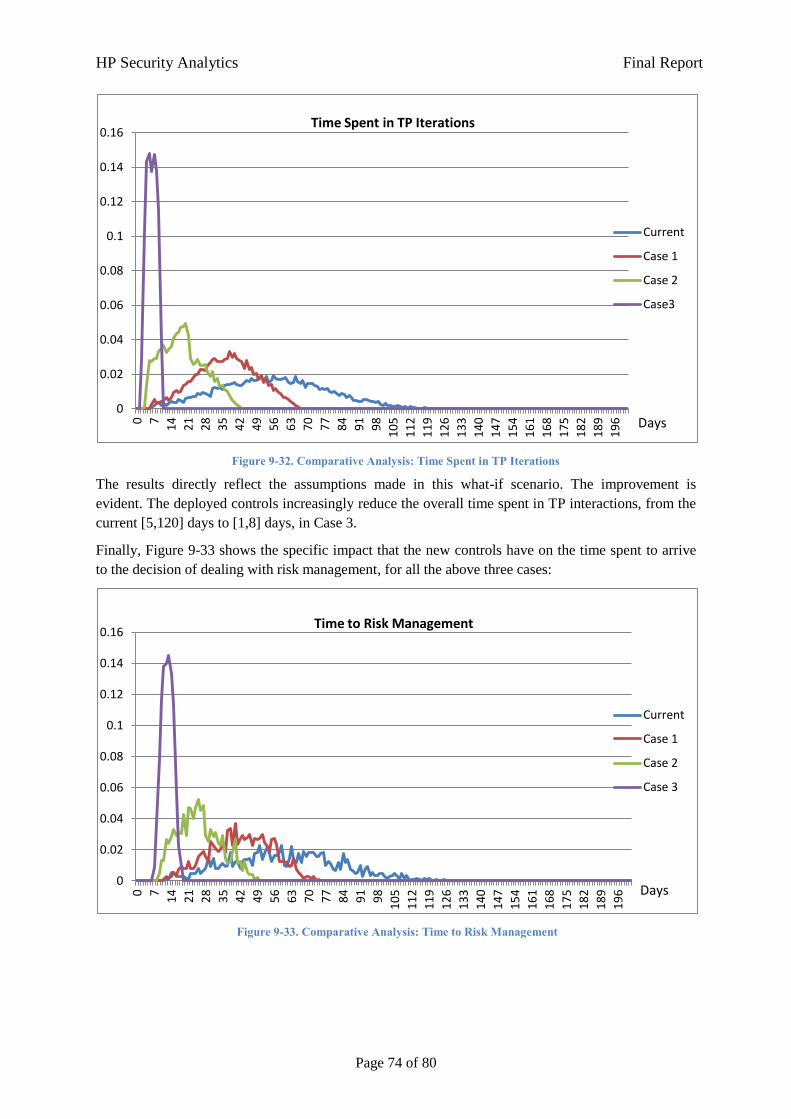
HP Security Analytics Final Report
Page 74 of 80
Figure 9-32. Comparative Analysis: Time Spent in TP Iterations
The results directly reflect the assumptions made in this what-if scenario. The improvement is
evident. The deployed controls increasingly reduce the overall time spent in TP interactions, from the
current [5,120] days to [1,8] days, in Case 3.
Finally, Figure 9-33 shows the specific impact that the new controls have on the time spent to arrive
to the decision of dealing with risk management, for all the above three cases:
Figure 9-33. Comparative Analysis: Time to Risk Management
0
0.02
0.04
0.06
0.08
0.1
0.12
0.14
0.16 0
7
14
21
28
35
42
49
56
63
70
77
84
91
98
10
5
11
2
11
9
12
6
13
3
14
0
14
7
15
4
16
1
16
8
17
5
18
2
18
9
19
6
Current
Case 1
Case 2
Case3
Time Spent in TP Iterations
Days
0
0.02
0.04
0.06
0.08
0.1
0.12
0.14
0.16
0
7
14
21
28
35
42
49
56
63
70
77
84
91
98
10
5
11
2
11
9
12
6
13
3
14
0
14
7
15
4
16
1
16
8
17
5
18
2
18
9
19
6
Current
Case 1
Case 2
Case 3
Time to Risk Management
Days
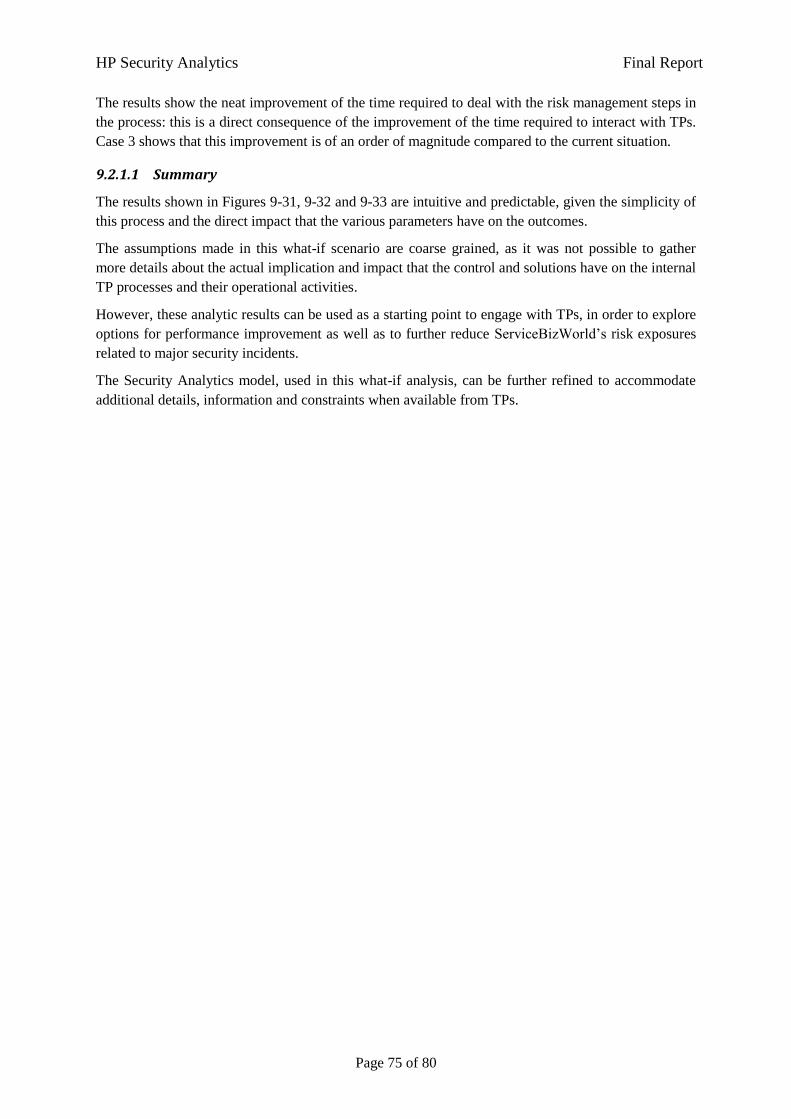
HP Security Analytics Final Report
Page 75 of 80
The results show the neat improvement of the time required to deal with the risk management steps in
the process: this is a direct consequence of the improvement of the time required to interact with TPs.
Case 3 shows that this improvement is of an order of magnitude compared to the current situation.
9.2.1.1 Summary
The results shown in Figures 9-31, 9-32 and 9-33 are intuitive and predictable, given the simplicity of
this process and the direct impact that the various parameters have on the outcomes.
The assumptions made in this what-if scenario are coarse grained, as it was not possible to gather
more details about the actual implication and impact that the control and solutions have on the internal
TP processes and their operational activities.
However, these analytic results can be used as a starting point to engage with TPs, in order to explore
options for performance improvement as well as to further reduce ServiceBizWorld’s risk exposures
related to major security incidents.
The Security Analytics model, used in this what-if analysis, can be further refined to accommodate
additional details, information and constraints when available from TPs.
HP Security Analytics Final Report
Page 76 of 80
10 Conclusion
The findings of the study suggest that there is major room for improvement for risk reduction and
increase of performance for the analysed processes.
The analysis confirms that TP interactions are a major bottleneck both in the Event/Alert Processing
& Resolution Process and for the Security Incident Management Process. Two key aspects have been
identified as root causes: the lack of SLAs with TPs about how information should be provided to teh
SOC Team; the lack of information availability for TPs.
The what-if scenarios explored using the model of the Event/Alert Processing & Remediation Process
show that:
The definition of SLAs for TPs (e.g. about response time and number of iterations with the SOC
team) can dramatically improve the overall performance and reduce the risk exposure by at least
an order of magnitude;
The current process might expose ServiceBizWorld to additional risks - in terms of delays to
identify security incidents and saturation of TP resources/personnel - if the daily number of new
events to be processed increases by about 30%;
Investments in new controls not only can improve the overall TP information availability and
performance (estimated to be an order of magnitude) but also help to cope with worsening threat
landscapes. Specifically, the adoption of information request templates and manual scripts can
ensure process resilience to a 60% increase of the daily number of new events/alerts to be
processed. The introduction of automation of scripts and/or workflows enables process resilience
to an increase of 90% (or more) of events/alerts.
Similarly, what-if scenarios for the Security Incident Management Process shows that major
improvements can be obtained (for the overall time spent in TP interactions and for the time required
by TPs to remediate to incidents) when templates and incident management support tools are
deployed.
These findings depend on the assumptions made and the information available at the analysis time.
However they provide a starting point for conversations between ServiceBizWorld, TPs and the SOC
Team, on expectations, policy & SLA changes, as well as on potential new investments, to improve
the current process performances, reduce risk exposure and deal with contingency planning for
worsening threat environments.
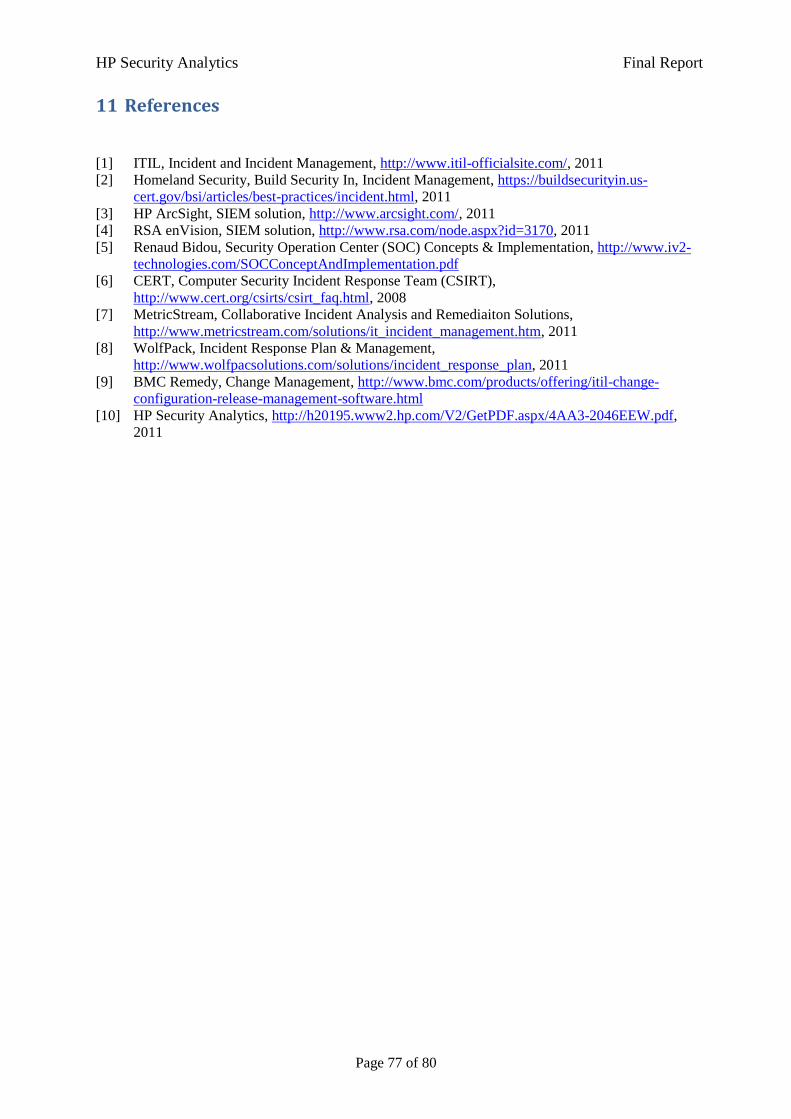
HP Security Analytics Final Report
Page 77 of 80
11 References
[1] ITIL, Incident and Incident Management, http://www.itil-officialsite.com/, 2011
[2] Homeland Security, Build Security In, Incident Management, https://buildsecurityin.us-
cert.gov/bsi/articles/best-practices/incident.html, 2011
[3] HP ArcSight, SIEM solution, http://www.arcsight.com/, 2011
[4] RSA enVision, SIEM solution, http://www.rsa.com/node.aspx?id=3170, 2011
[5] Renaud Bidou, Security Operation Center (SOC) Concepts & Implementation, http://www.iv2-
technologies.com/SOCConceptAndImplementation.pdf
[6] CERT, Computer Security Incident Response Team (CSIRT),
http://www.cert.org/csirts/csirt_faq.html, 2008
[7] MetricStream, Collaborative Incident Analysis and Remediaiton Solutions,
http://www.metricstream.com/solutions/it_incident_management.htm, 2011
[8] WolfPack, Incident Response Plan & Management,
http://www.wolfpacsolutions.com/solutions/incident_response_plan, 2011
[9] BMC Remedy, Change Management, http://www.bmc.com/products/offering/itil-change-
configuration-release-management-software.html
[10] HP Security Analytics, http://h20195.www2.hp.com/V2/GetPDF.aspx/4AA3-2046EEW.pdf,
2011
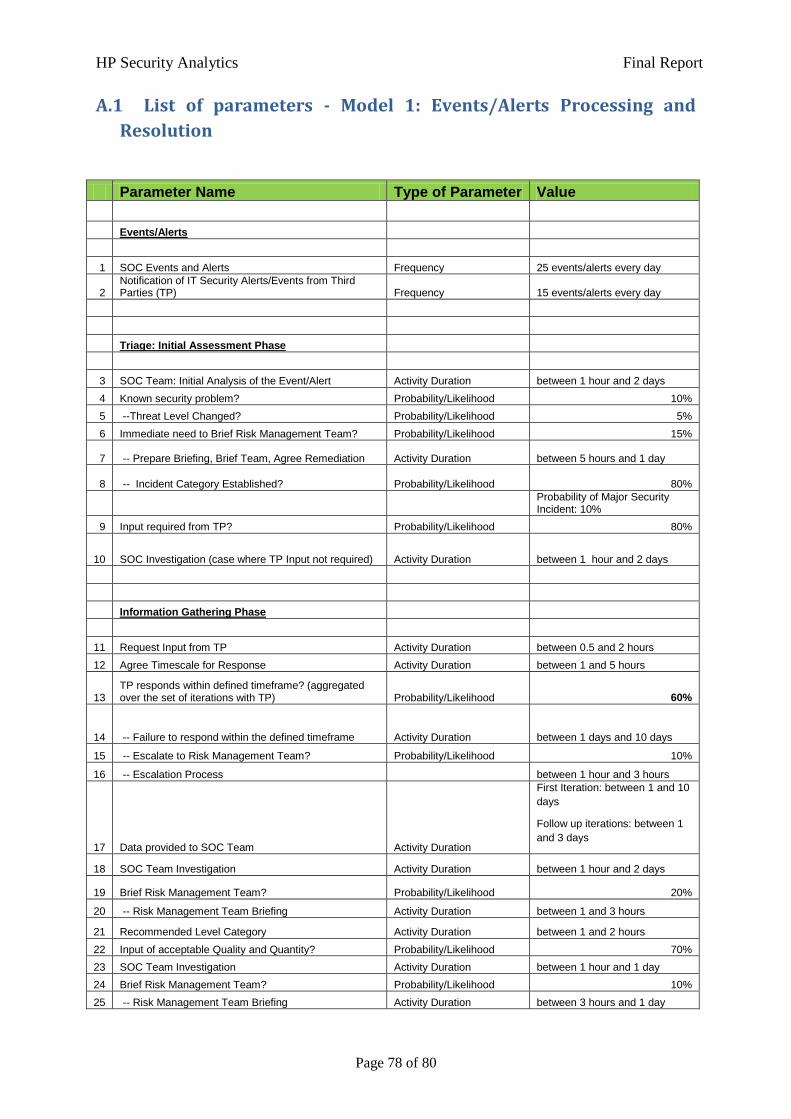
HP Security Analytics Final Report
Page 78 of 80
A.1 List of parameters - Model 1: Events/Alerts Processing and
Resolution
Parameter Name Type of Parameter Value
Events/Alerts
1 SOC Events and Alerts Frequency 25 events/alerts every day
2 Notification of IT Security Alerts/Events from Third Parties (TP) Frequency 15 events/alerts every day
Triage: Initial Assessment Phase
3 SOC Team: Initial Analysis of the Event/Alert Activity Duration between 1 hour and 2 days
4 Known security problem? Probability/Likelihood 10%
5 --Threat Level Changed? Probability/Likelihood 5%
6 Immediate need to Brief Risk Management Team? Probability/Likelihood 15%
7 -- Prepare Briefing, Brief Team, Agree Remediation Activity Duration between 5 hours and 1 day
8 -- Incident Category Established? Probability/Likelihood 80%
Probability of Major Security Incident: 10%
9 Input required from TP? Probability/Likelihood 80%
10 SOC Investigation (case where TP Input not required) Activity Duration between 1 hour and 2 days
Information Gathering Phase
11 Request Input from TP Activity Duration between 0.5 and 2 hours
12 Agree Timescale for Response Activity Duration between 1 and 5 hours
13 TP responds within defined timeframe? (aggregated over the set of iterations with TP) Probability/Likelihood 60%
14 -- Failure to respond within the defined timeframe Activity Duration between 1 days and 10 days
15 -- Escalate to Risk Management Team? Probability/Likelihood 10%
16 -- Escalation Process
between 1 hour and 3 hours
17 Data provided to SOC Team Activity Duration
First Iteration: between 1 and 10
days
Follow up iterations: between 1
and 3 days
18 SOC Team Investigation Activity Duration between 1 hour and 2 days
19 Brief Risk Management Team? Probability/Likelihood 20%
20 -- Risk Management Team Briefing Activity Duration between 1 and 3 hours
21 Recommended Level Category Activity Duration between 1 and 2 hours
22 Input of acceptable Quality and Quantity? Probability/Likelihood 70%
23 SOC Team Investigation Activity Duration between 1 hour and 1 day
24 Brief Risk Management Team? Probability/Likelihood 10%
25 -- Risk Management Team Briefing Activity Duration between 3 hours and 1 day
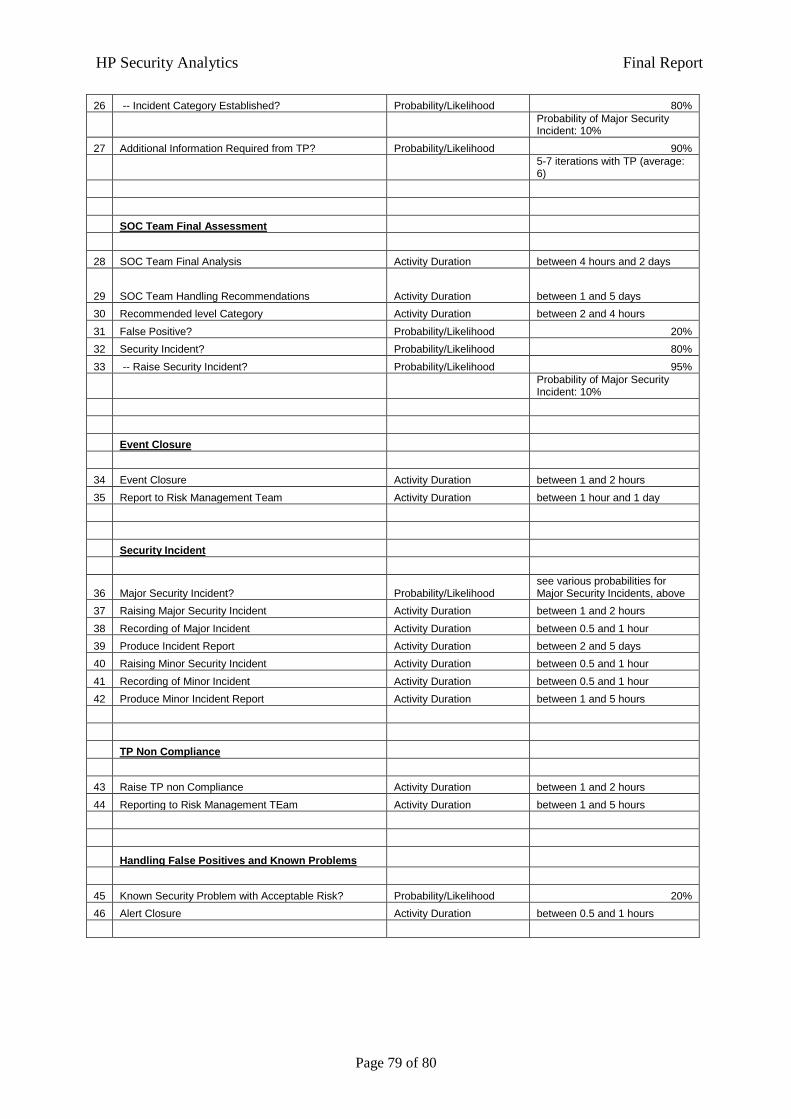
HP Security Analytics Final Report
Page 79 of 80
26 -- Incident Category Established? Probability/Likelihood 80%
Probability of Major Security Incident: 10%
27 Additional Information Required from TP? Probability/Likelihood 90%
5-7 iterations with TP (average: 6)
SOC Team Final Assessment
28 SOC Team Final Analysis Activity Duration between 4 hours and 2 days
29 SOC Team Handling Recommendations Activity Duration between 1 and 5 days
30 Recommended level Category Activity Duration between 2 and 4 hours
31 False Positive? Probability/Likelihood 20%
32 Security Incident? Probability/Likelihood 80%
33 -- Raise Security Incident? Probability/Likelihood 95%
Probability of Major Security Incident: 10%
Event Closure
34 Event Closure Activity Duration between 1 and 2 hours
35 Report to Risk Management Team Activity Duration between 1 hour and 1 day
Security Incident
36 Major Security Incident? Probability/Likelihood see various probabilities for Major Security Incidents, above
37 Raising Major Security Incident Activity Duration between 1 and 2 hours
38 Recording of Major Incident Activity Duration between 0.5 and 1 hour
39 Produce Incident Report Activity Duration between 2 and 5 days
40 Raising Minor Security Incident Activity Duration between 0.5 and 1 hour
41 Recording of Minor Incident Activity Duration between 0.5 and 1 hour
42 Produce Minor Incident Report Activity Duration between 1 and 5 hours
TP Non Compliance
43 Raise TP non Compliance Activity Duration between 1 and 2 hours
44 Reporting to Risk Management TEam Activity Duration between 1 and 5 hours
Handling False Positives and Known Problems
45 Known Security Problem with Acceptable Risk? Probability/Likelihood 20%
46 Alert Closure Activity Duration between 0.5 and 1 hours
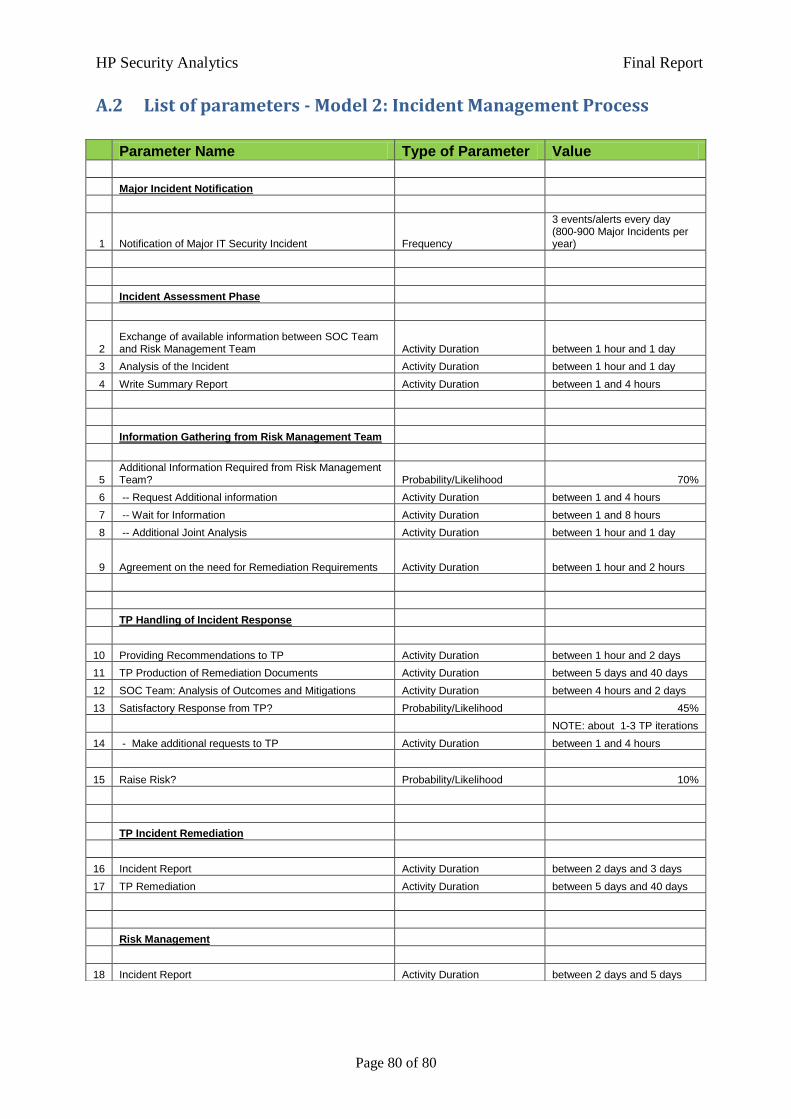
HP Security Analytics Final Report
Page 80 of 80
A.2 List of parameters - Model 2: Incident Management Process
Parameter Name Type of Parameter Value
Major Incident Notification
1 Notification of Major IT Security Incident Frequency
3 events/alerts every day (800-900 Major Incidents per year)
Incident Assessment Phase
2 Exchange of available information between SOC Team and Risk Management Team Activity Duration between 1 hour and 1 day
3 Analysis of the Incident Activity Duration between 1 hour and 1 day
4 Write Summary Report Activity Duration between 1 and 4 hours
Information Gathering from Risk Management Team
5 Additional Information Required from Risk Management Team? Probability/Likelihood 70%
6 -- Request Additional information Activity Duration between 1 and 4 hours
7 -- Wait for Information Activity Duration between 1 and 8 hours
8 -- Additional Joint Analysis Activity Duration between 1 hour and 1 day
9 Agreement on the need for Remediation Requirements Activity Duration between 1 hour and 2 hours
TP Handling of Incident Response
10 Providing Recommendations to TP Activity Duration between 1 hour and 2 days
11 TP Production of Remediation Documents Activity Duration between 5 days and 40 days
12 SOC Team: Analysis of Outcomes and Mitigations Activity Duration between 4 hours and 2 days
13 Satisfactory Response from TP? Probability/Likelihood 45%
NOTE: about 1-3 TP iterations
14 - Make additional requests to TP Activity Duration between 1 and 4 hours
15 Raise Risk? Probability/Likelihood 10%
TP Incident Remediation
16 Incident Report Activity Duration between 2 days and 3 days
17 TP Remediation Activity Duration between 5 days and 40 days
Risk Management
18 Incident Report Activity Duration between 2 days and 5 days


© Copyright 2012 Hewlett-Packard Development Company, L.P. The information contained herein is subject to change without notice. The only warranties for HP products and services are set forth in the express warranty statements accompanying such products and services. Nothing herein should be construed as constituting an additional warranty. HP shall not be liable for technical or editorial errors or omissions contained herein.
A project by HP Labs, in collaboration with HP Enterprise Security Services